Century 21 People’s Choice Realty Inc., Brokerage
120 MATHESON BLVD E #103
MISSISSAUGA, Ontario
L4Z 1X1


Toronto, Roncesvalles, M6R 1H5
$1,975,000$000000
Listed by SAGE REAL ESTATE LIMITED.
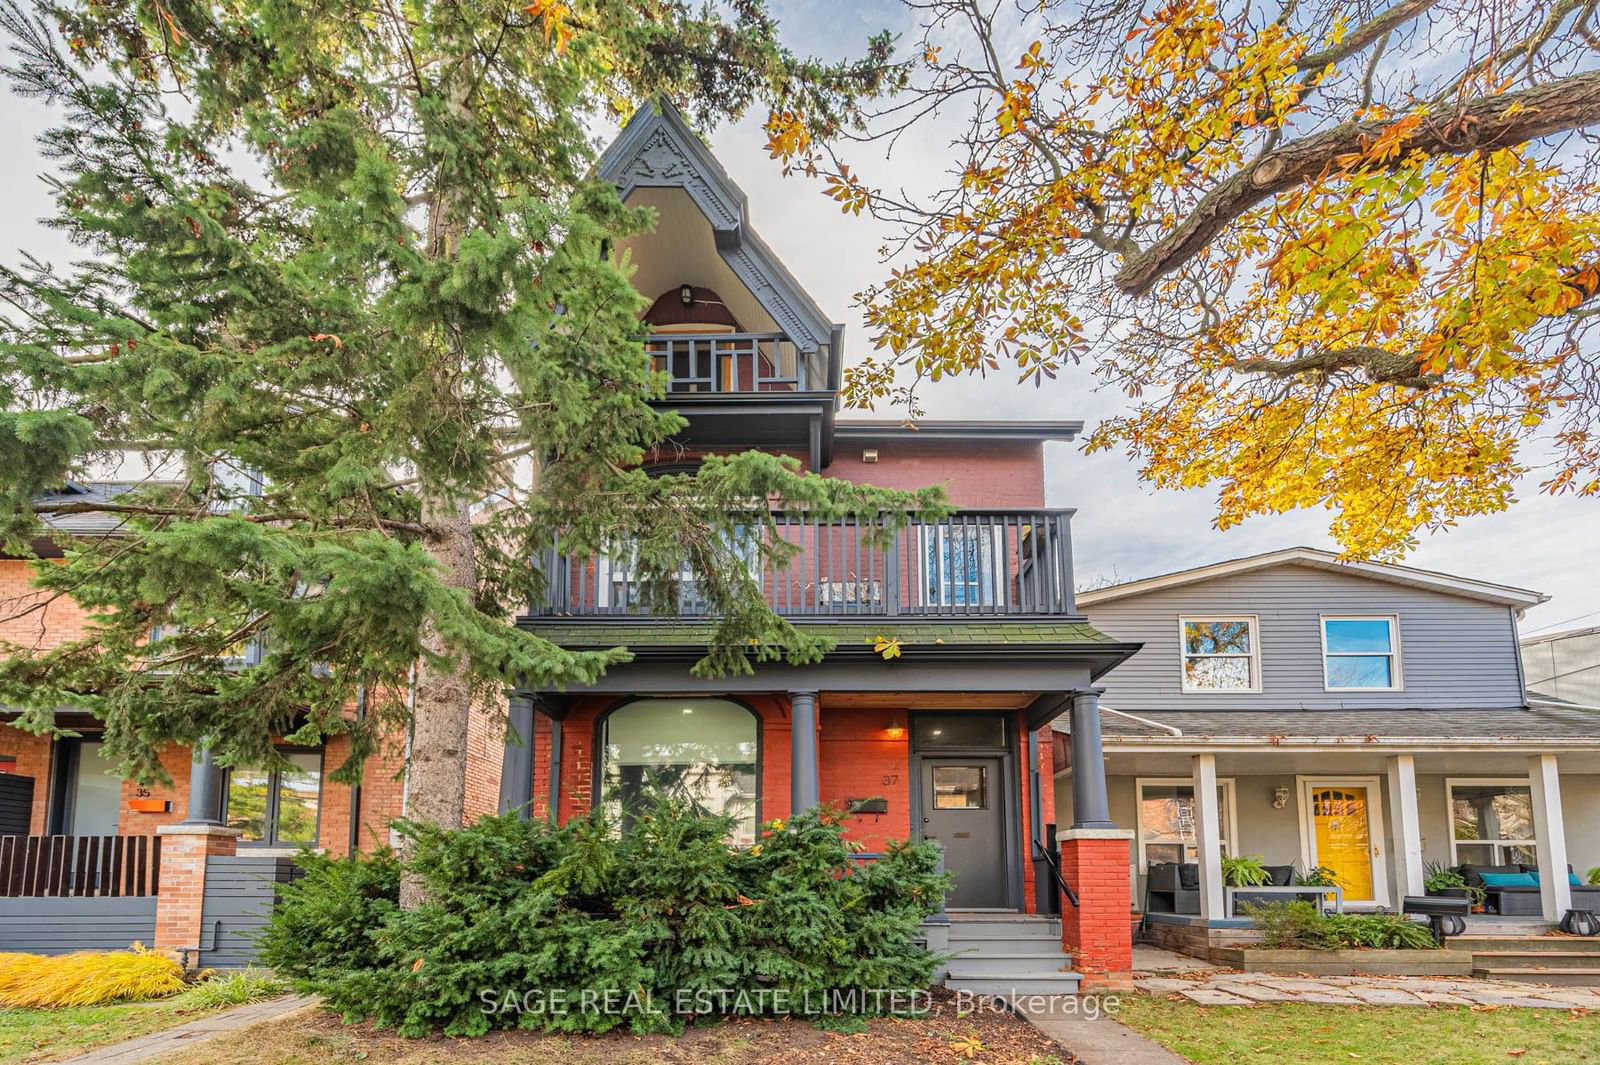
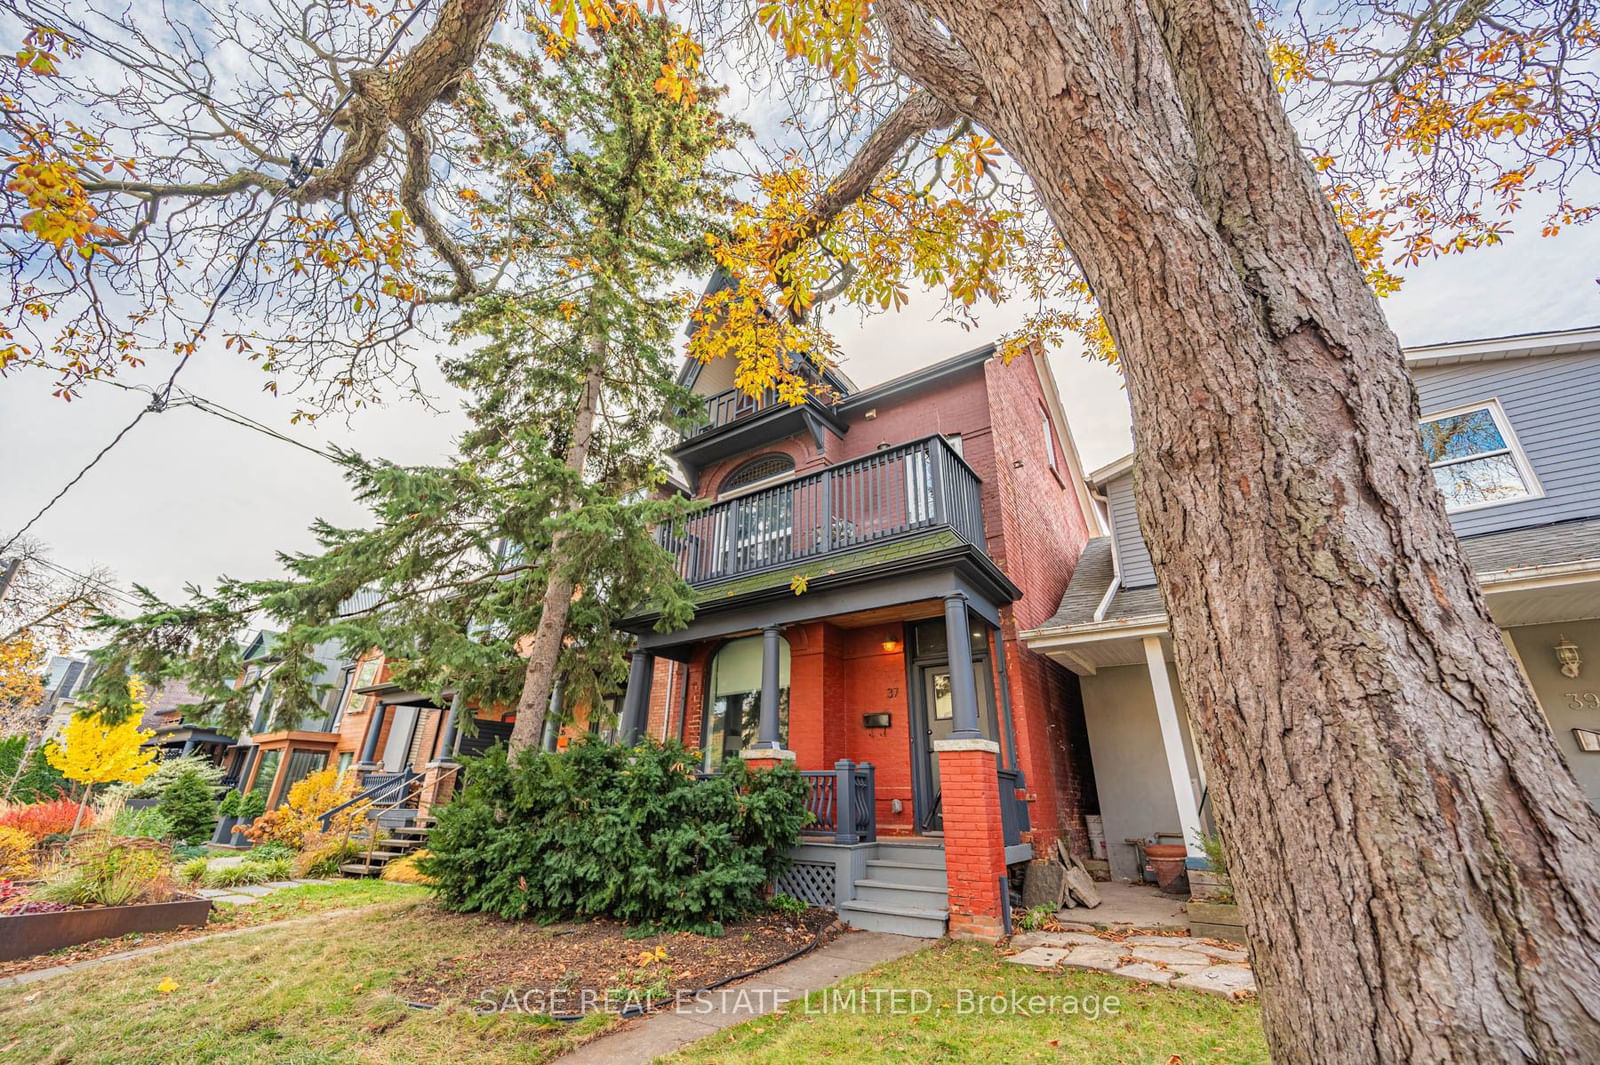
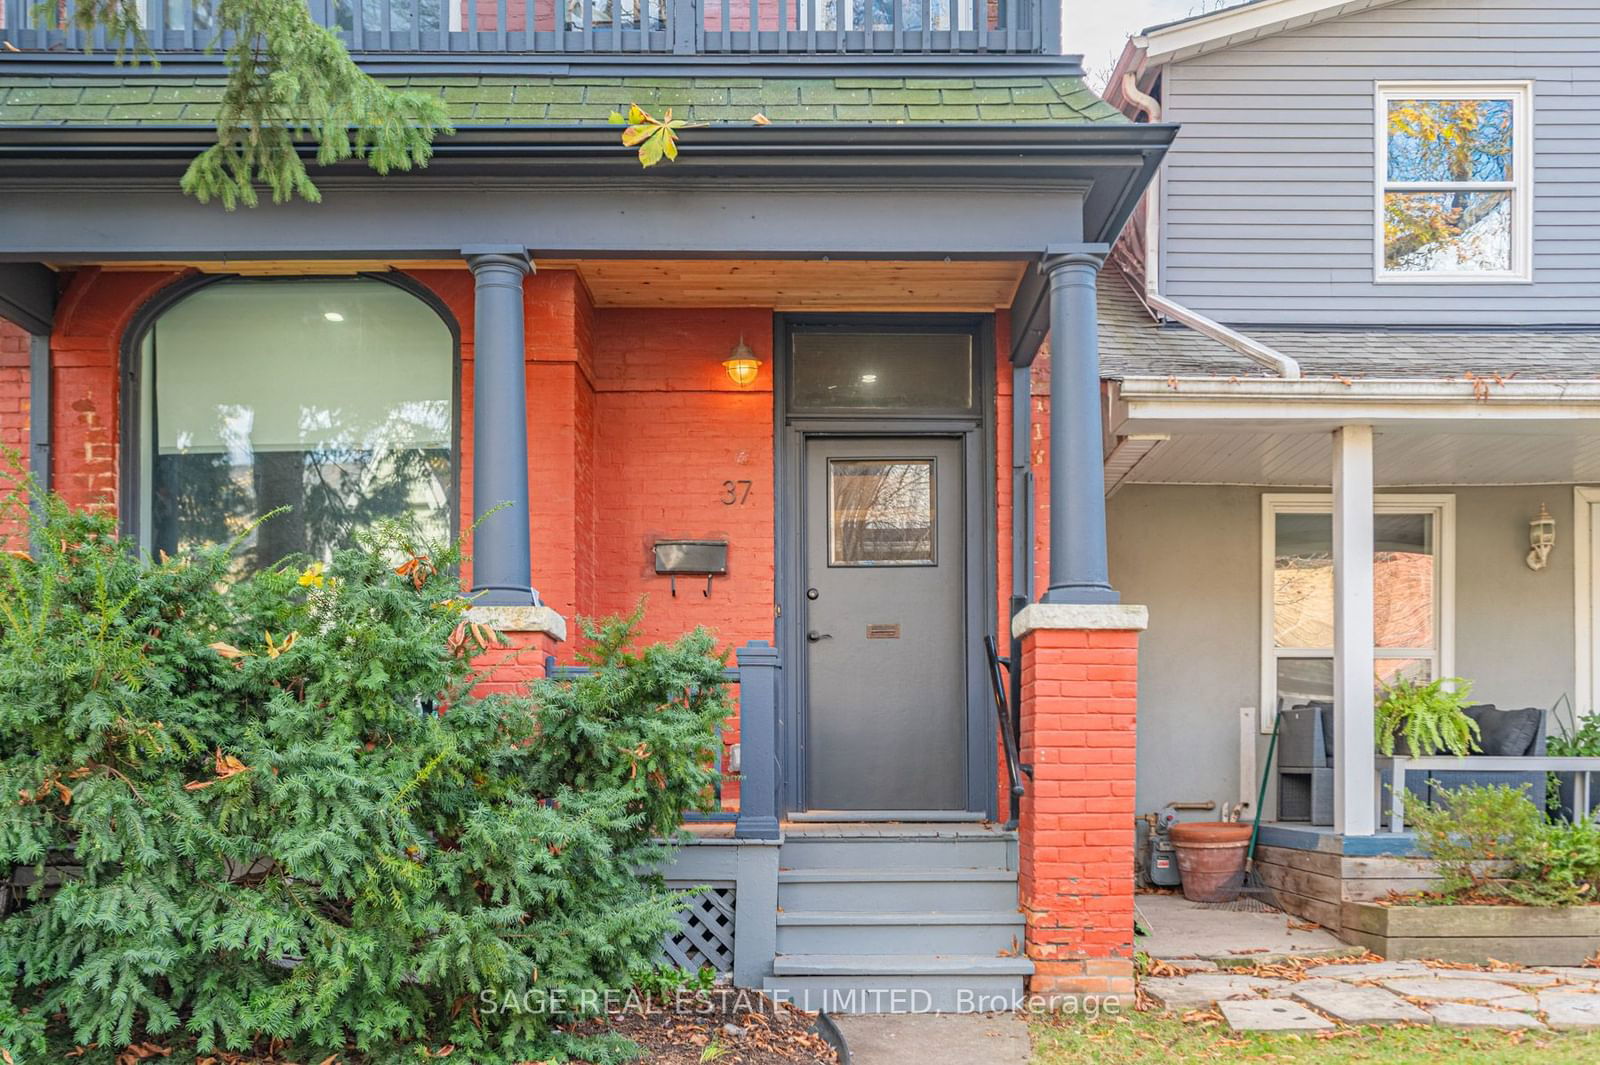
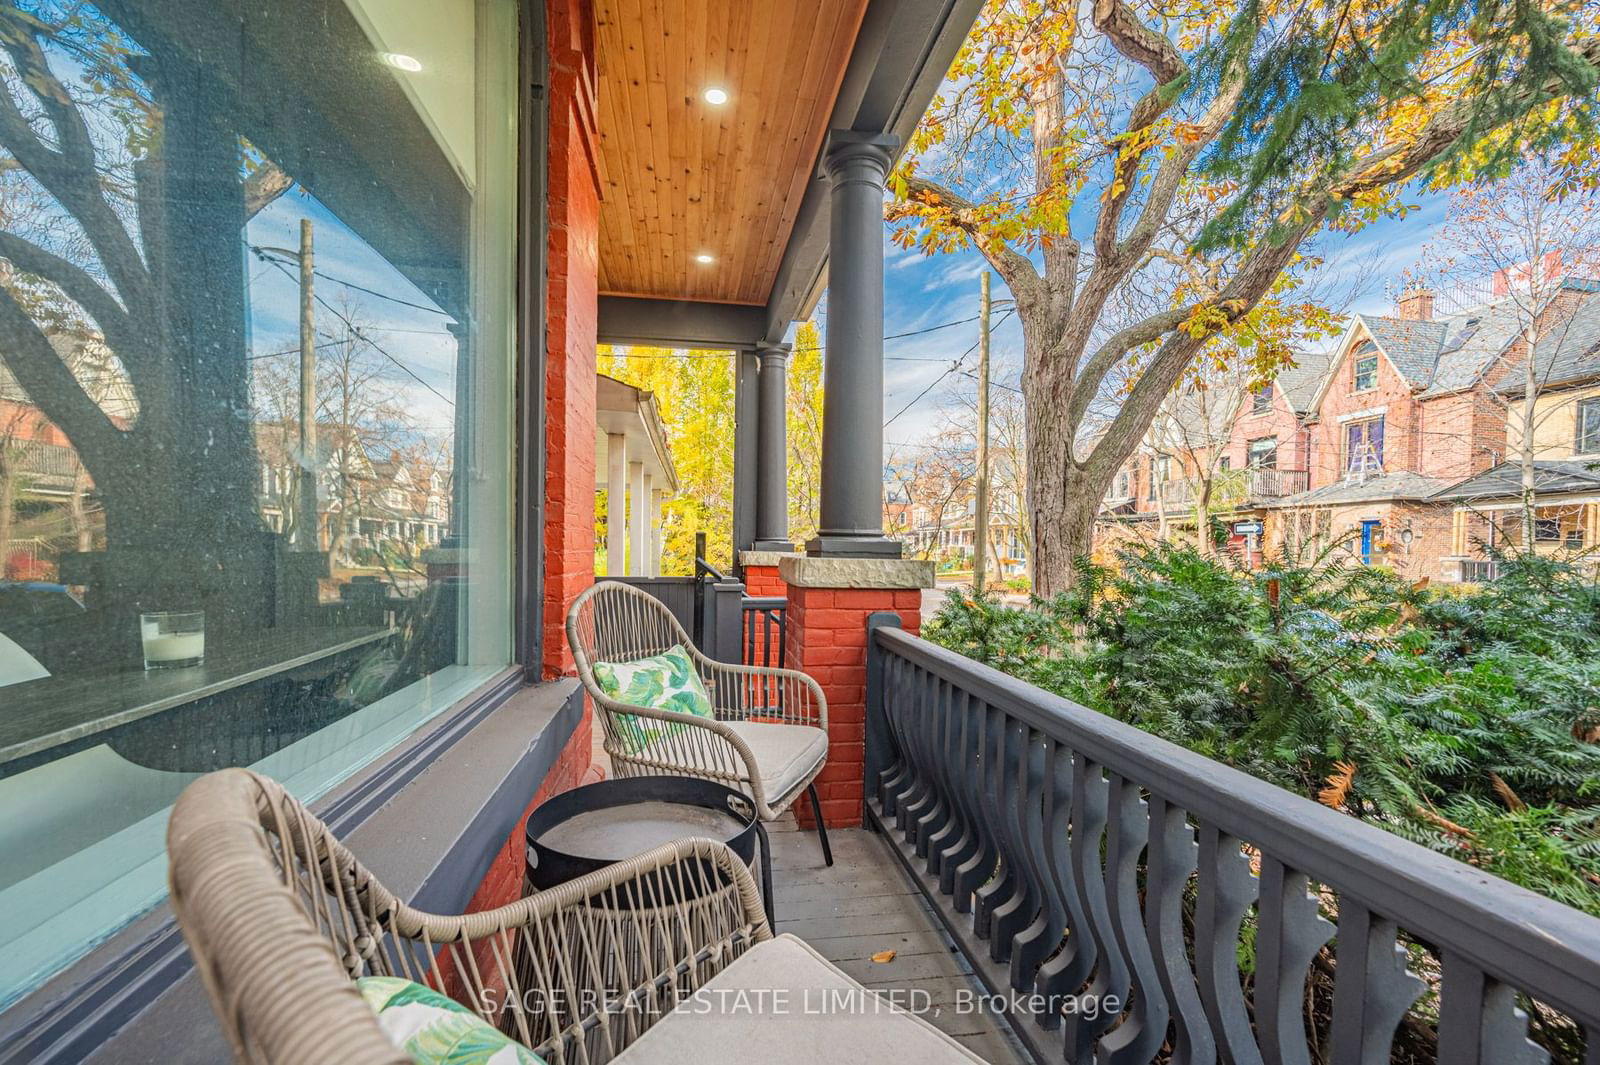
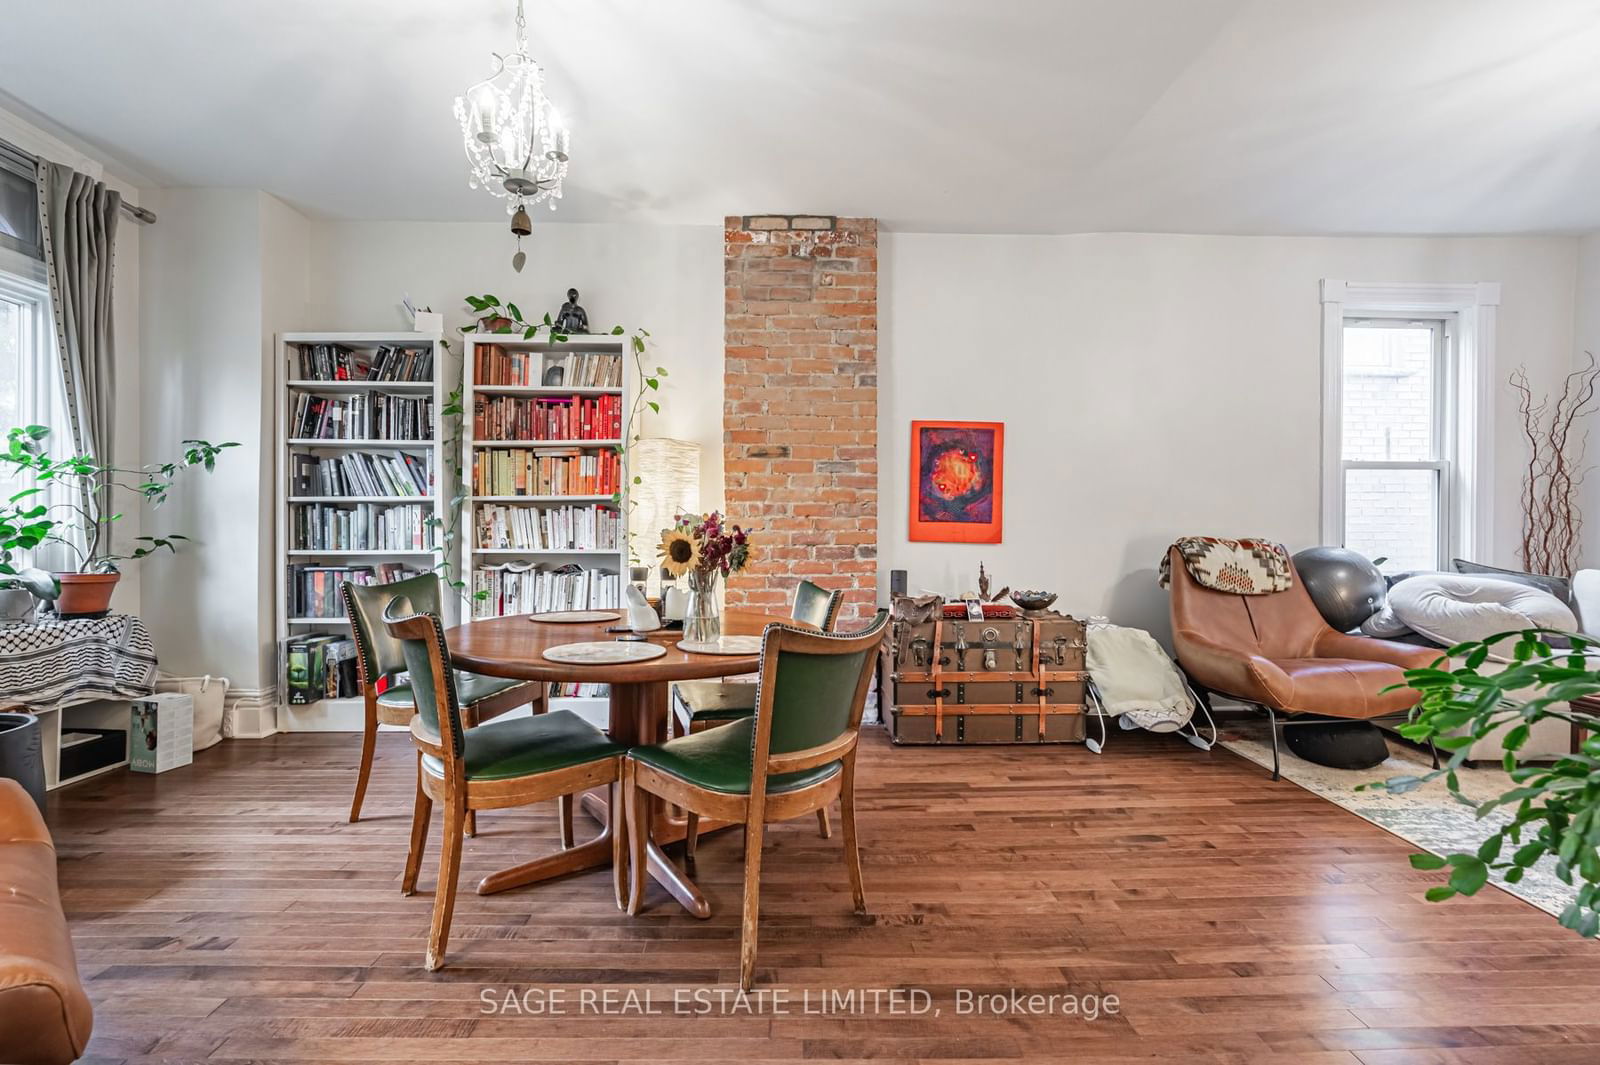
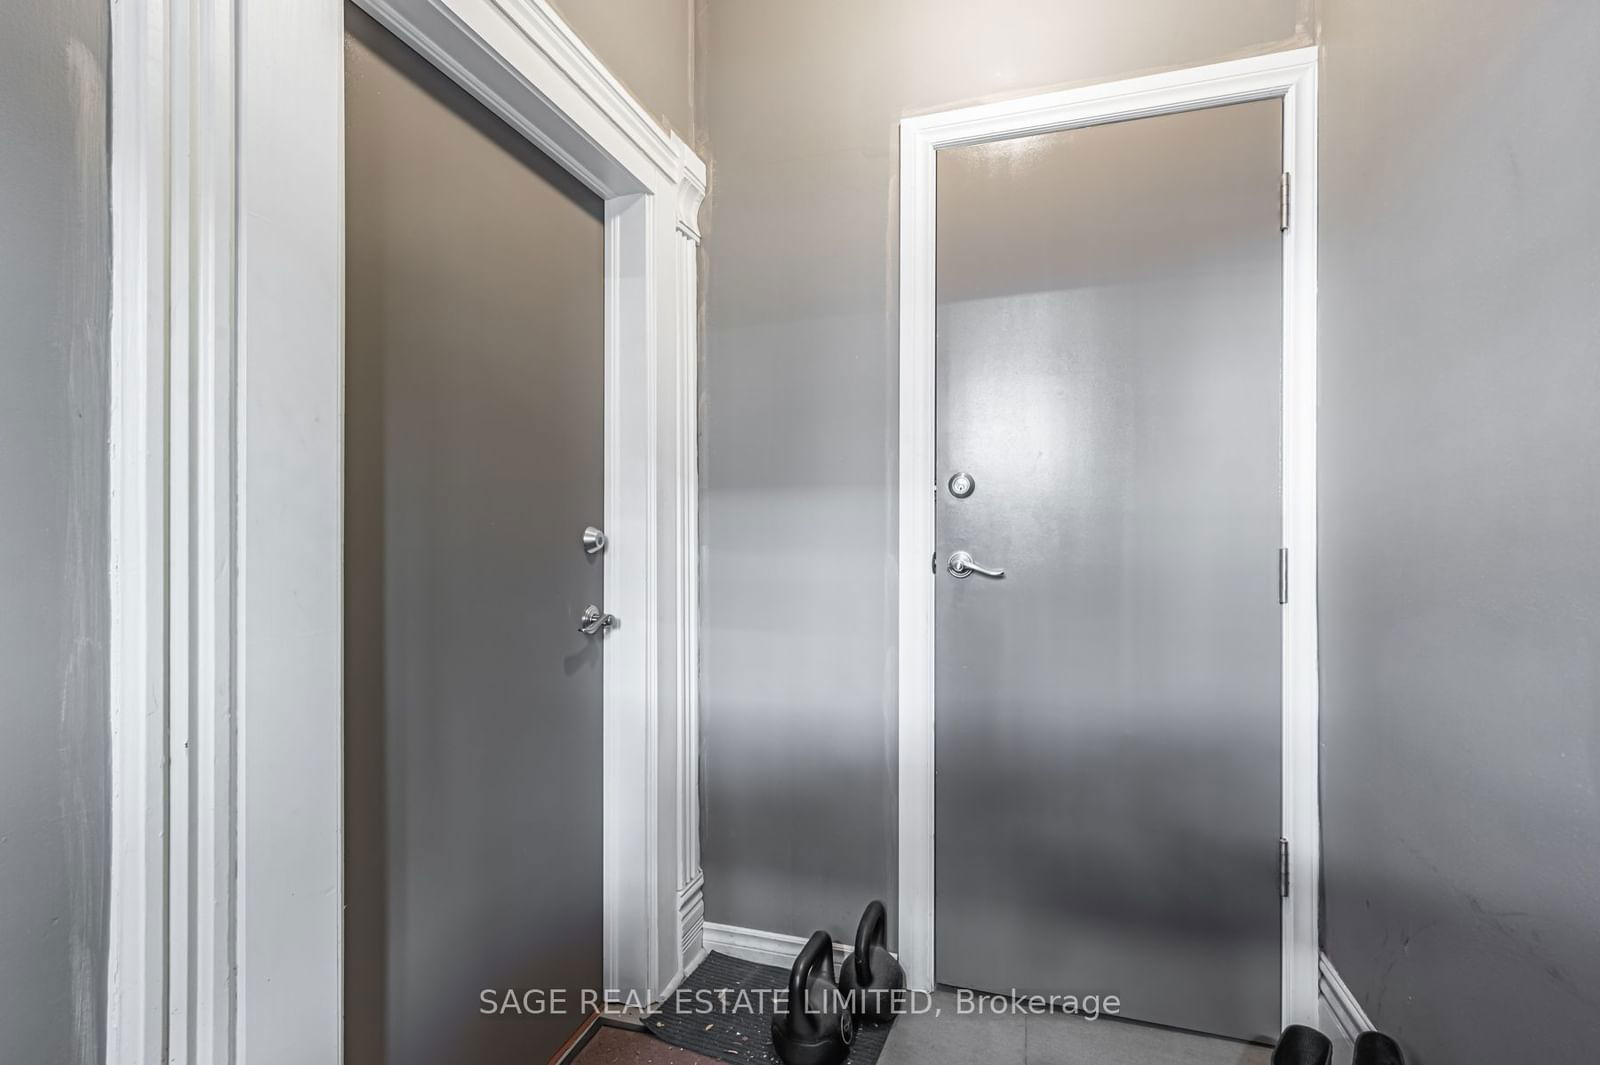
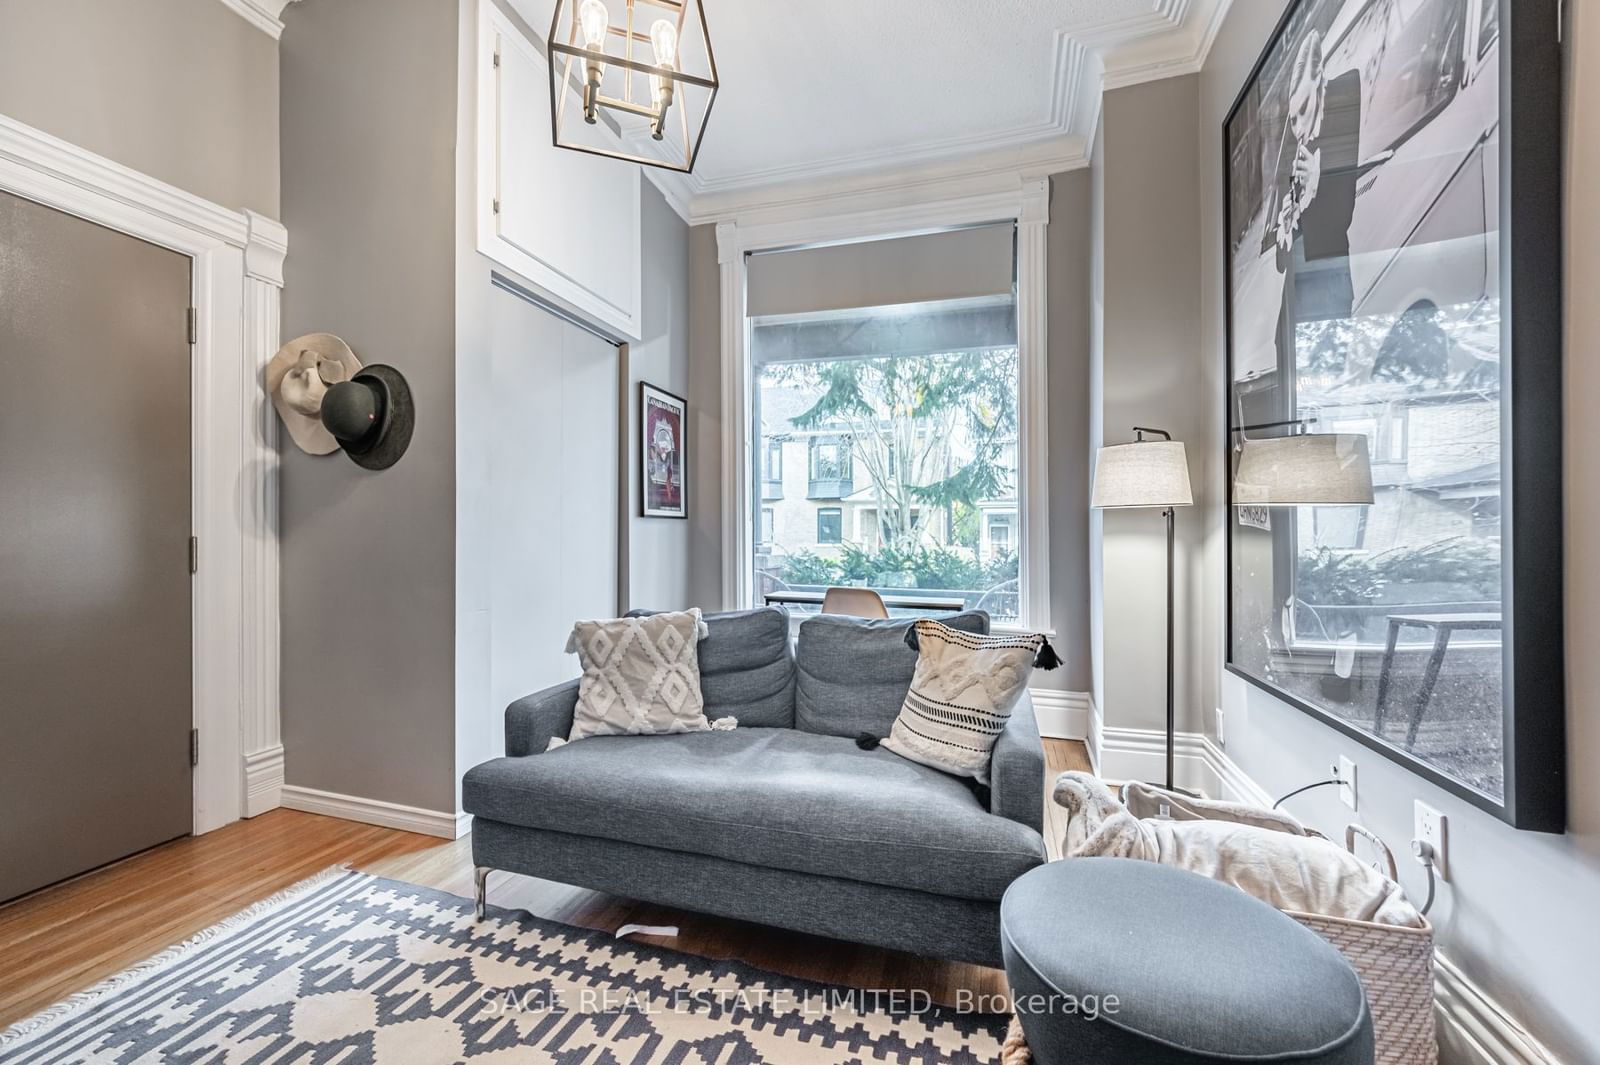
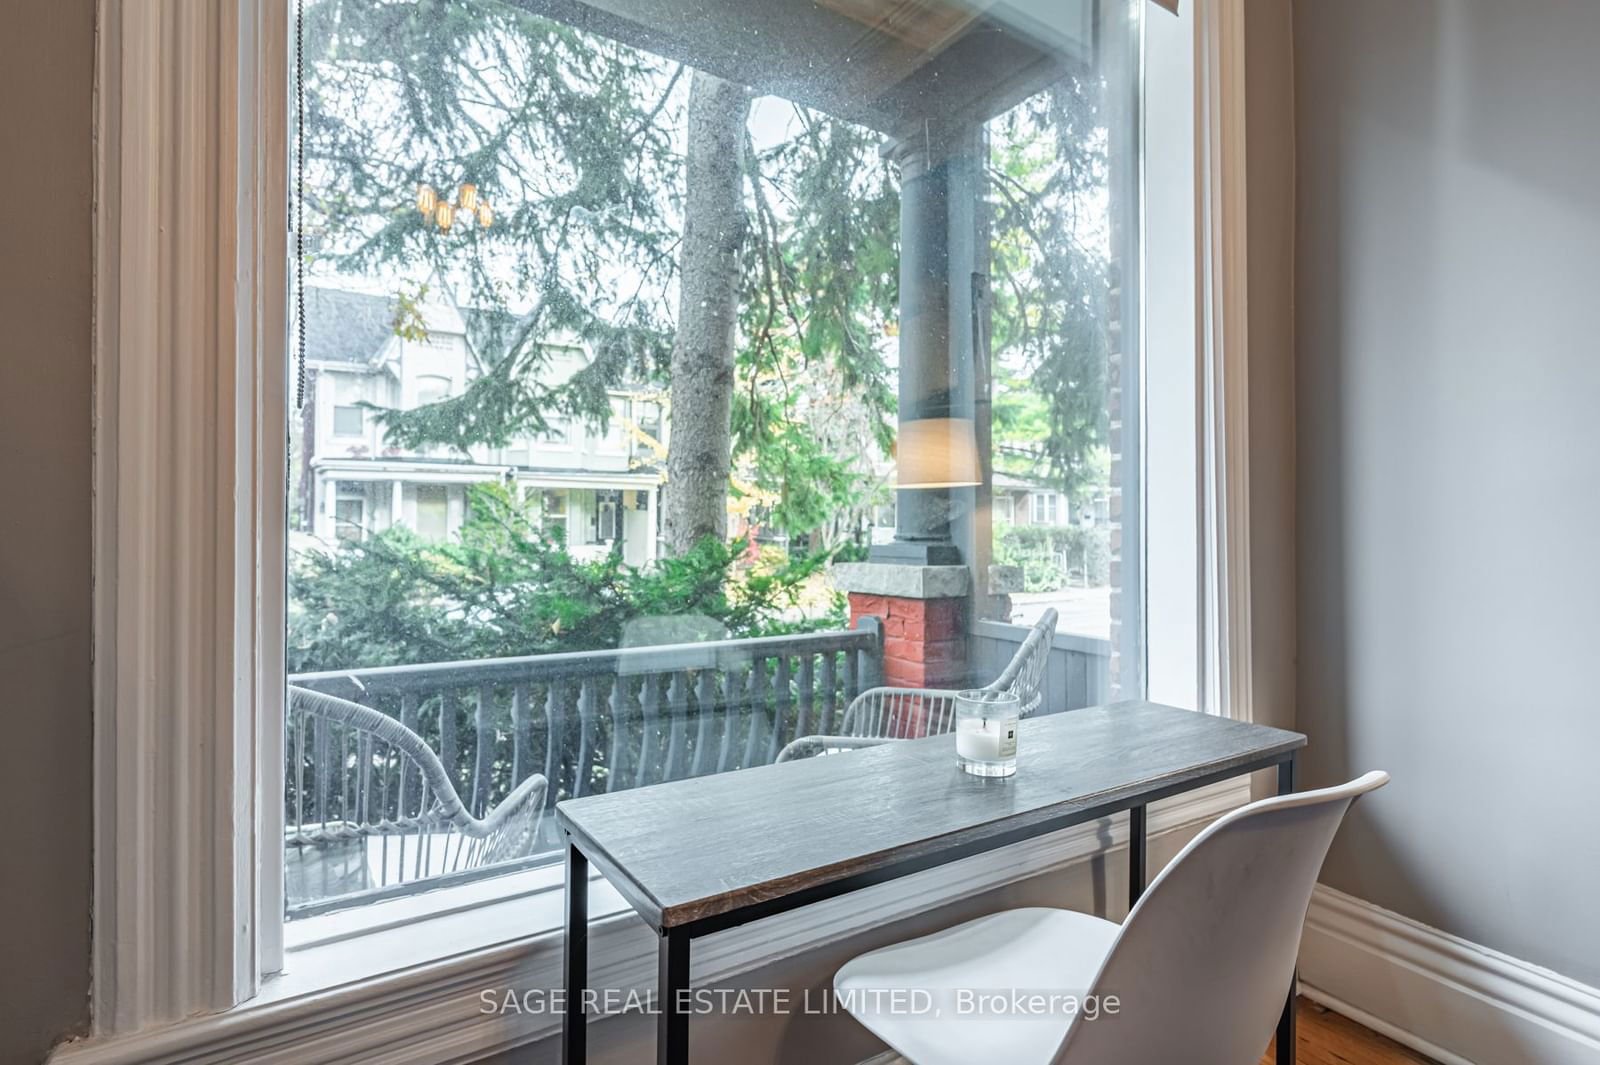
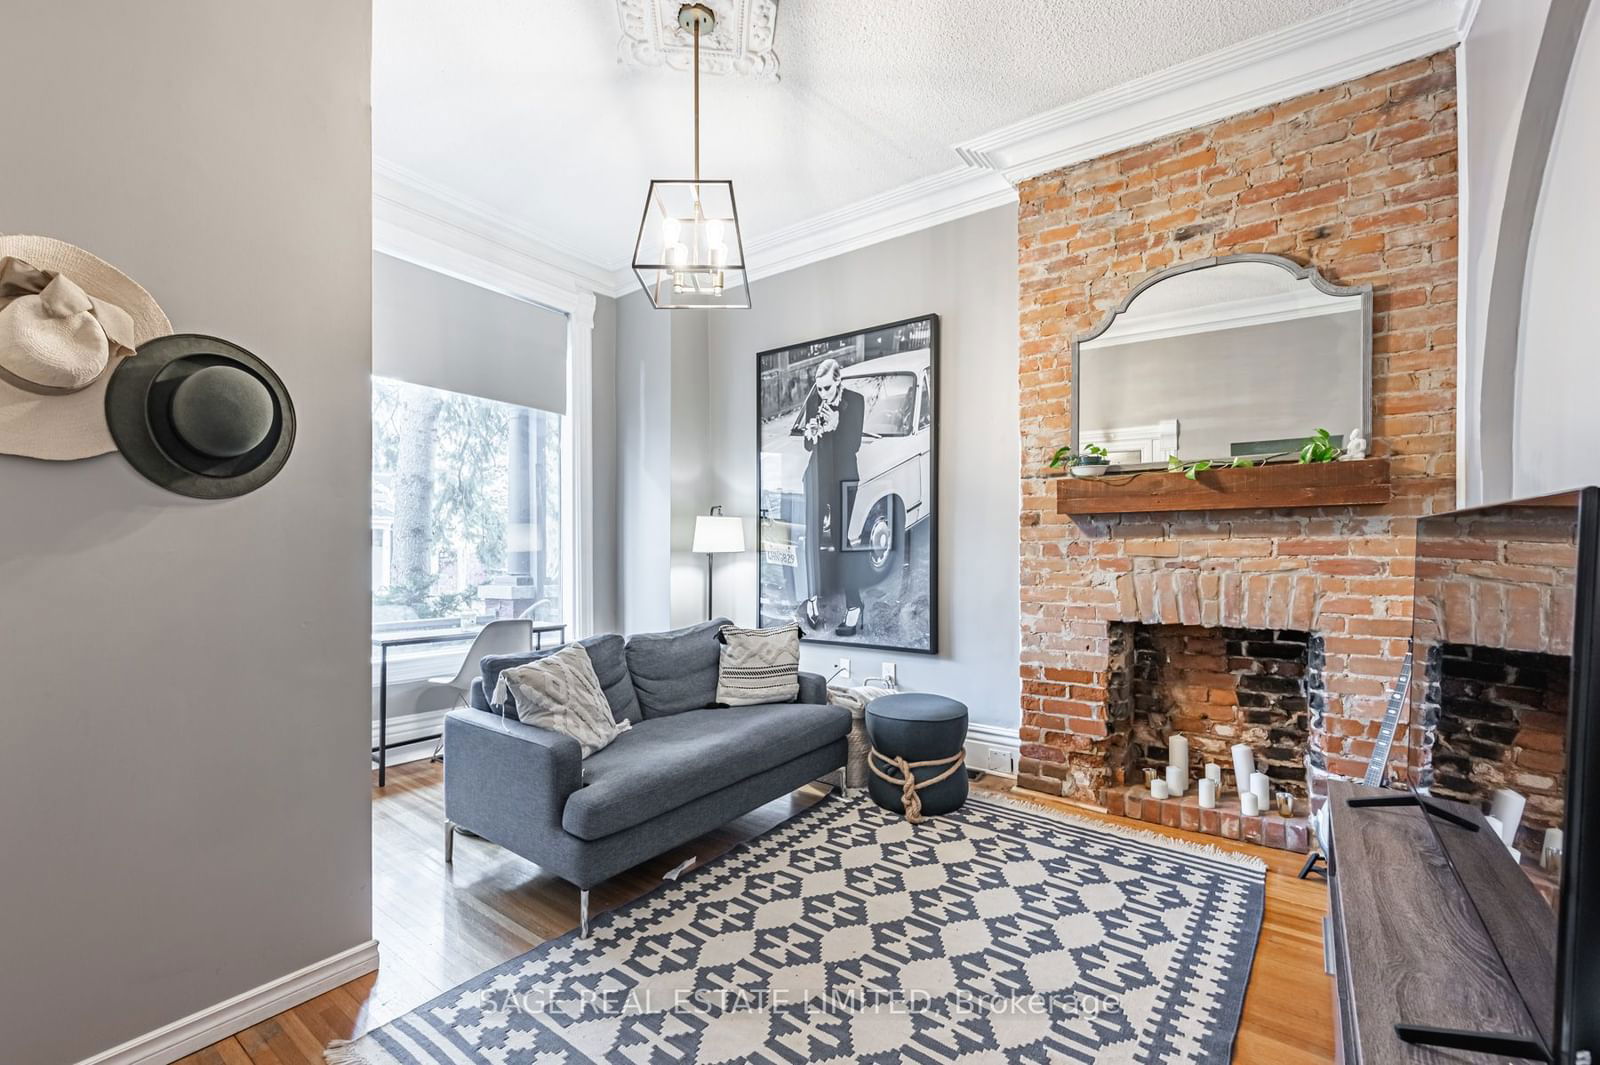
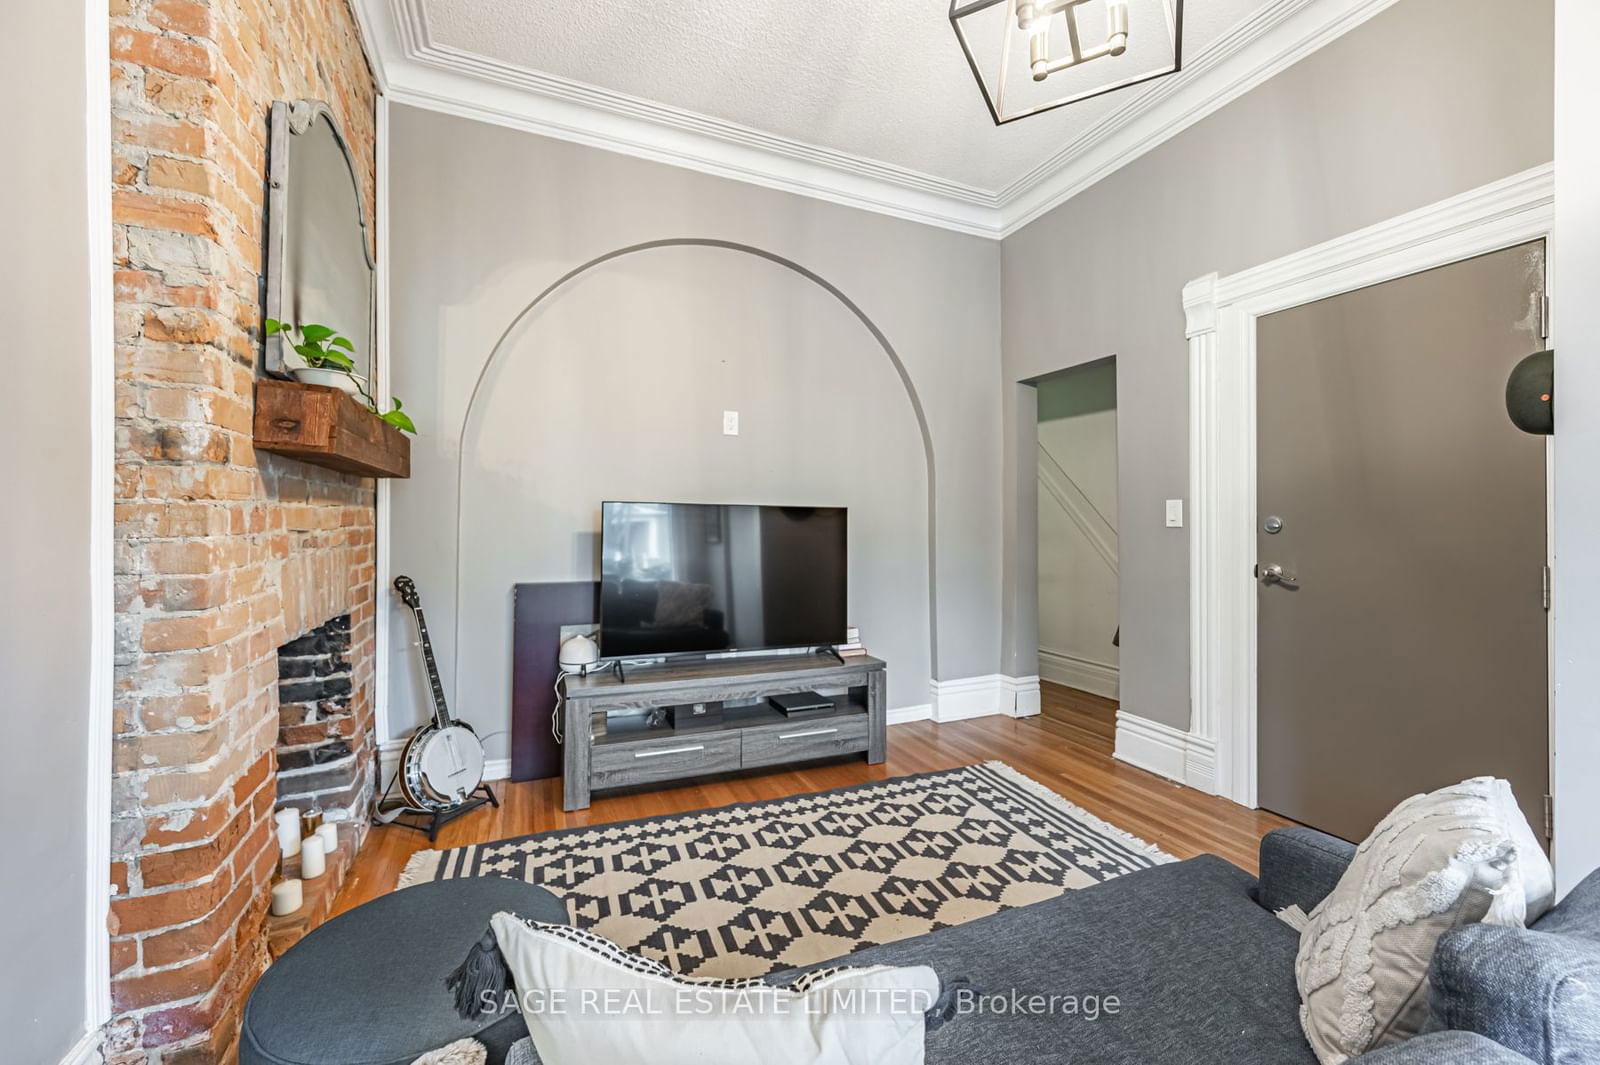
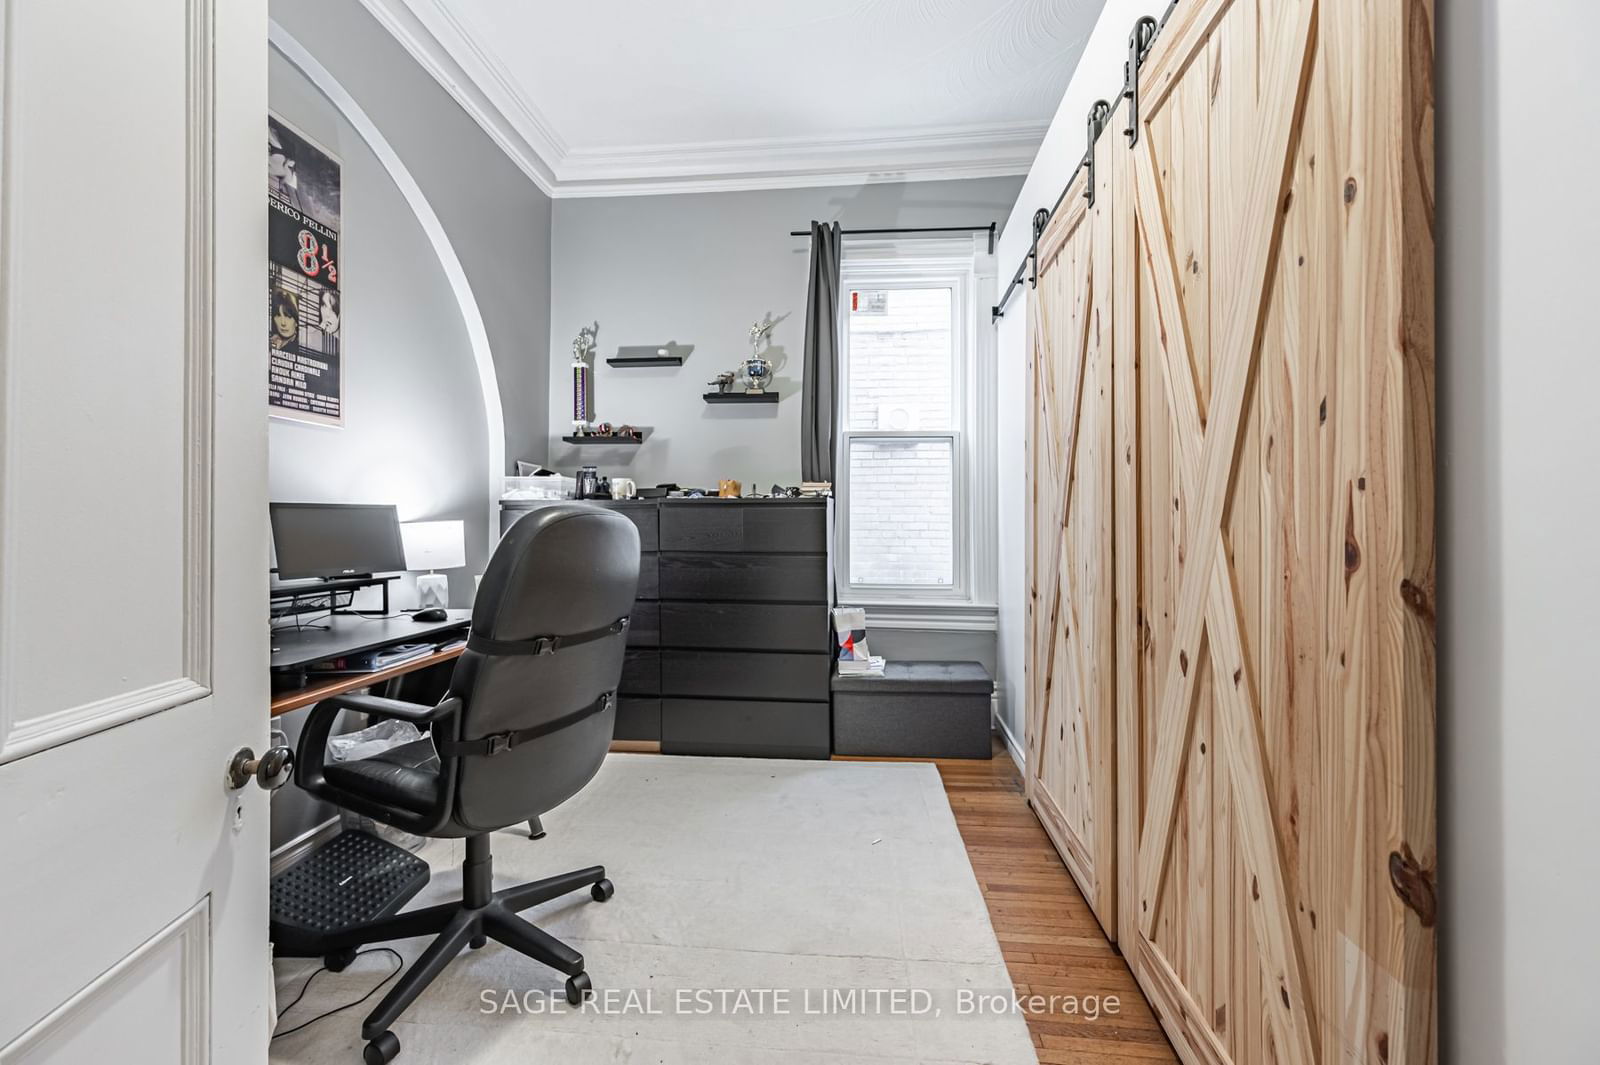
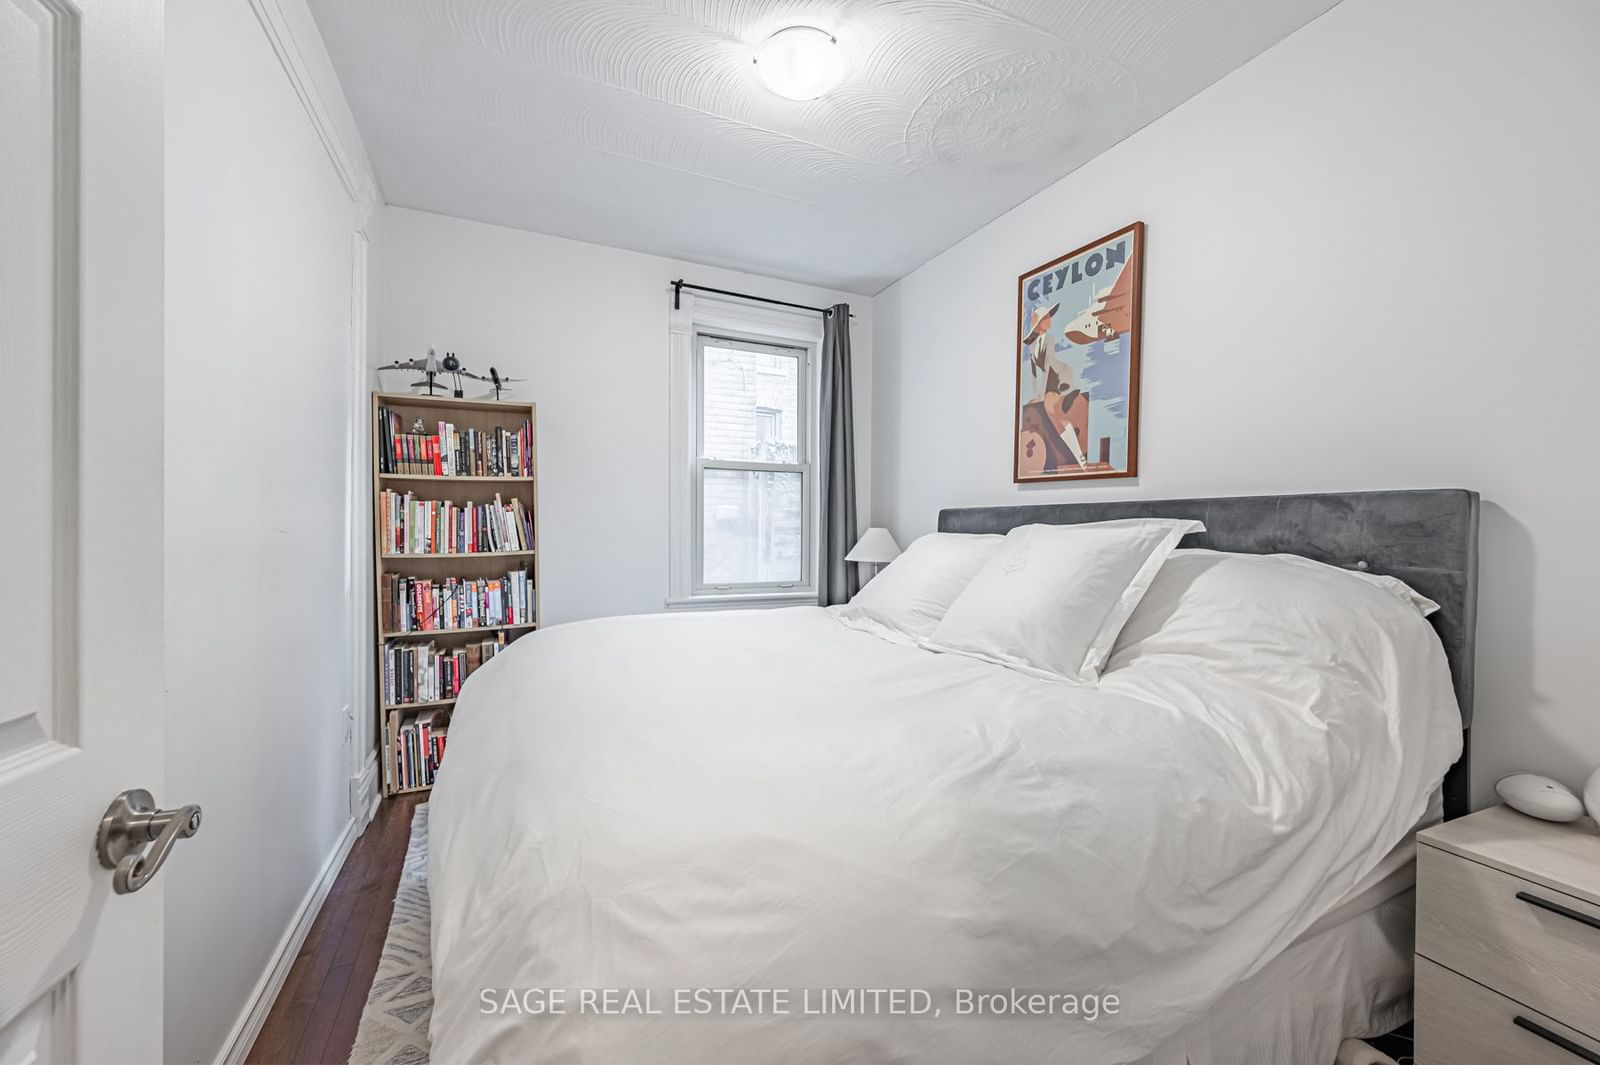
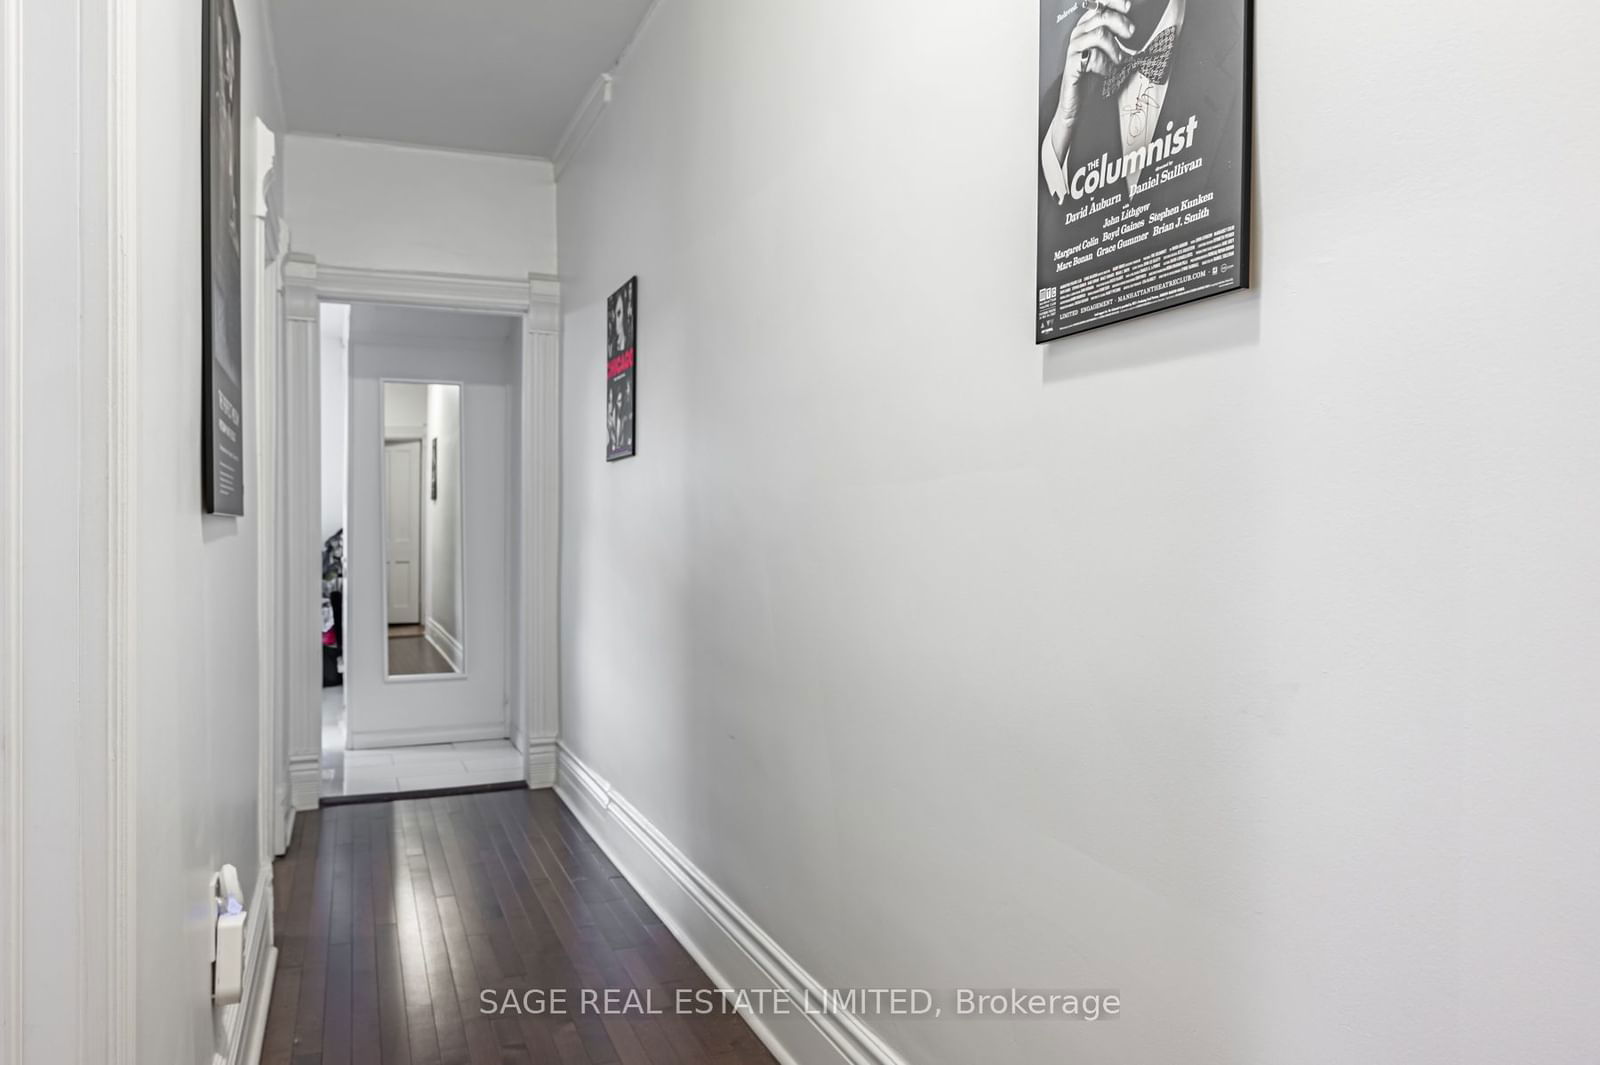
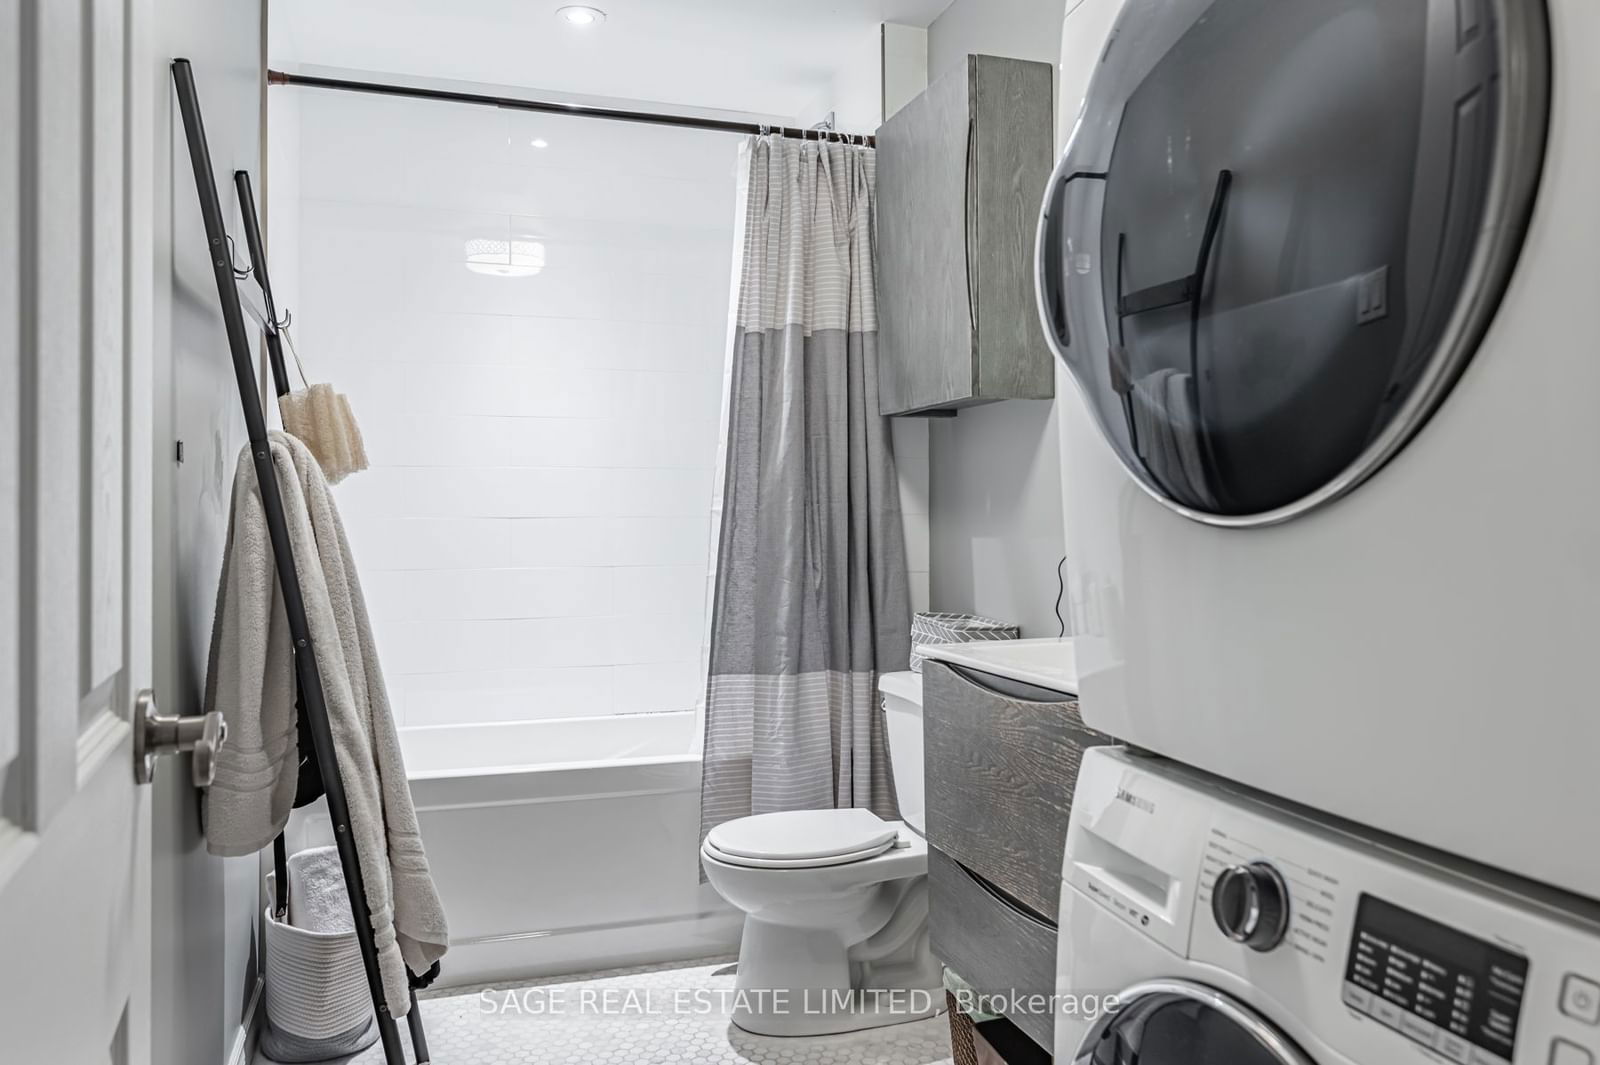
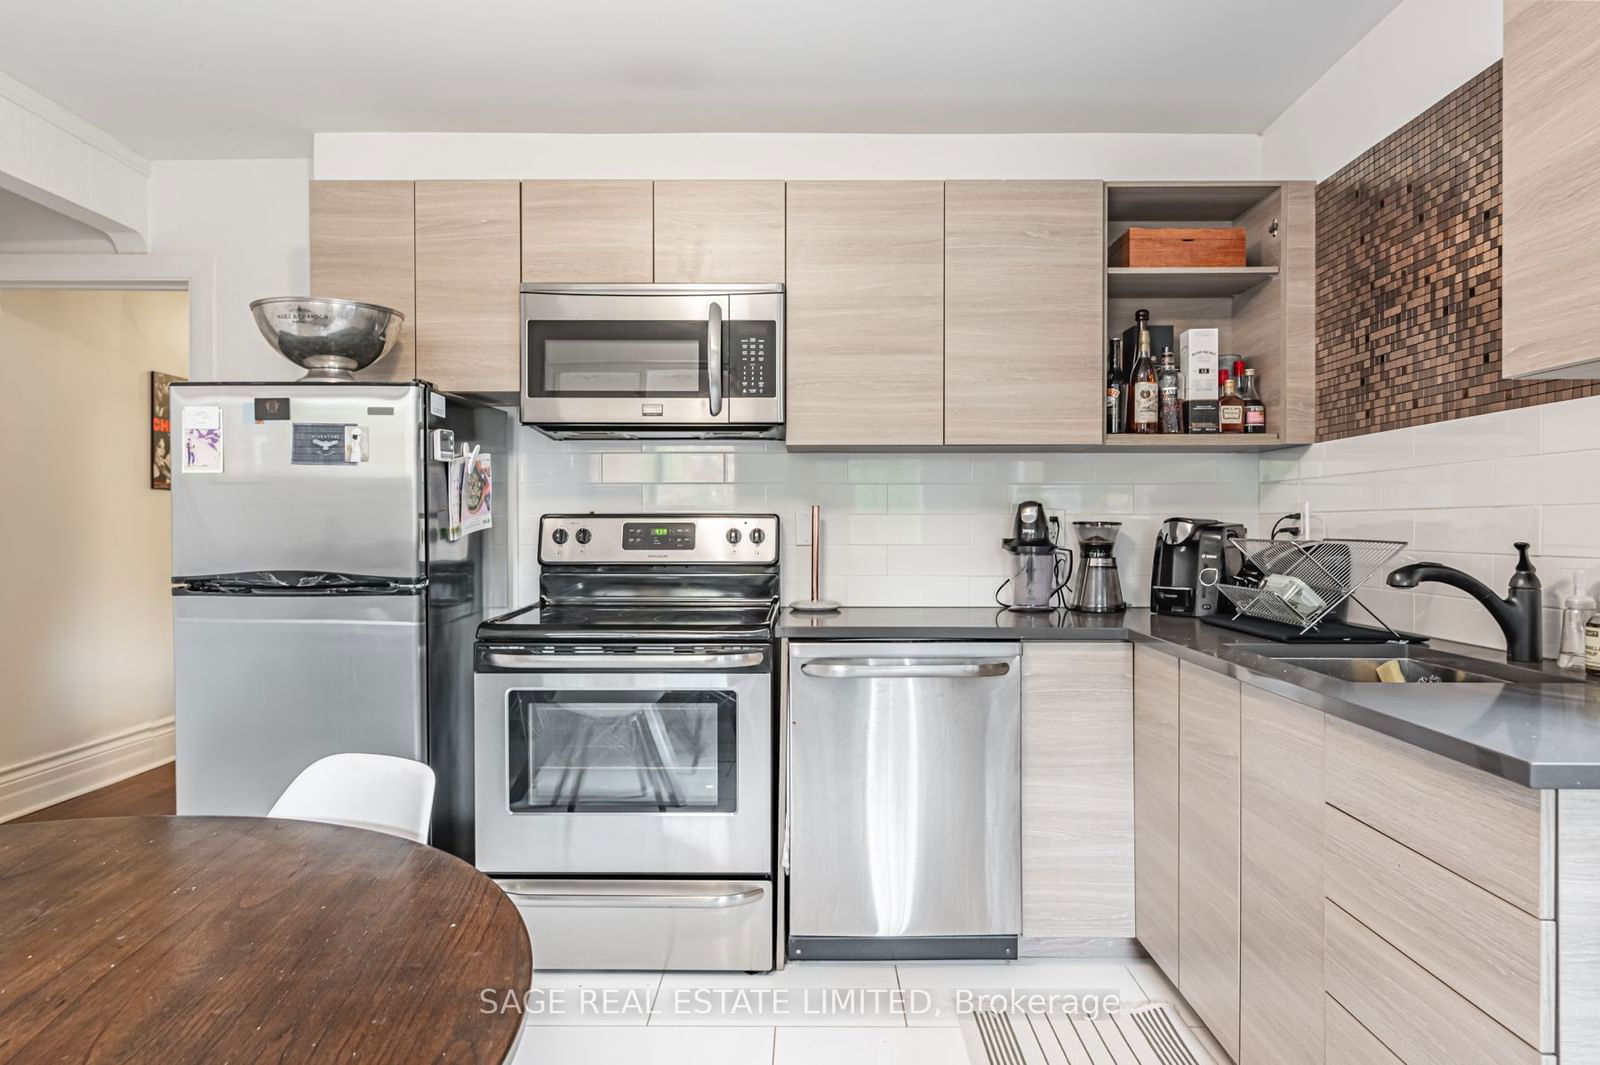
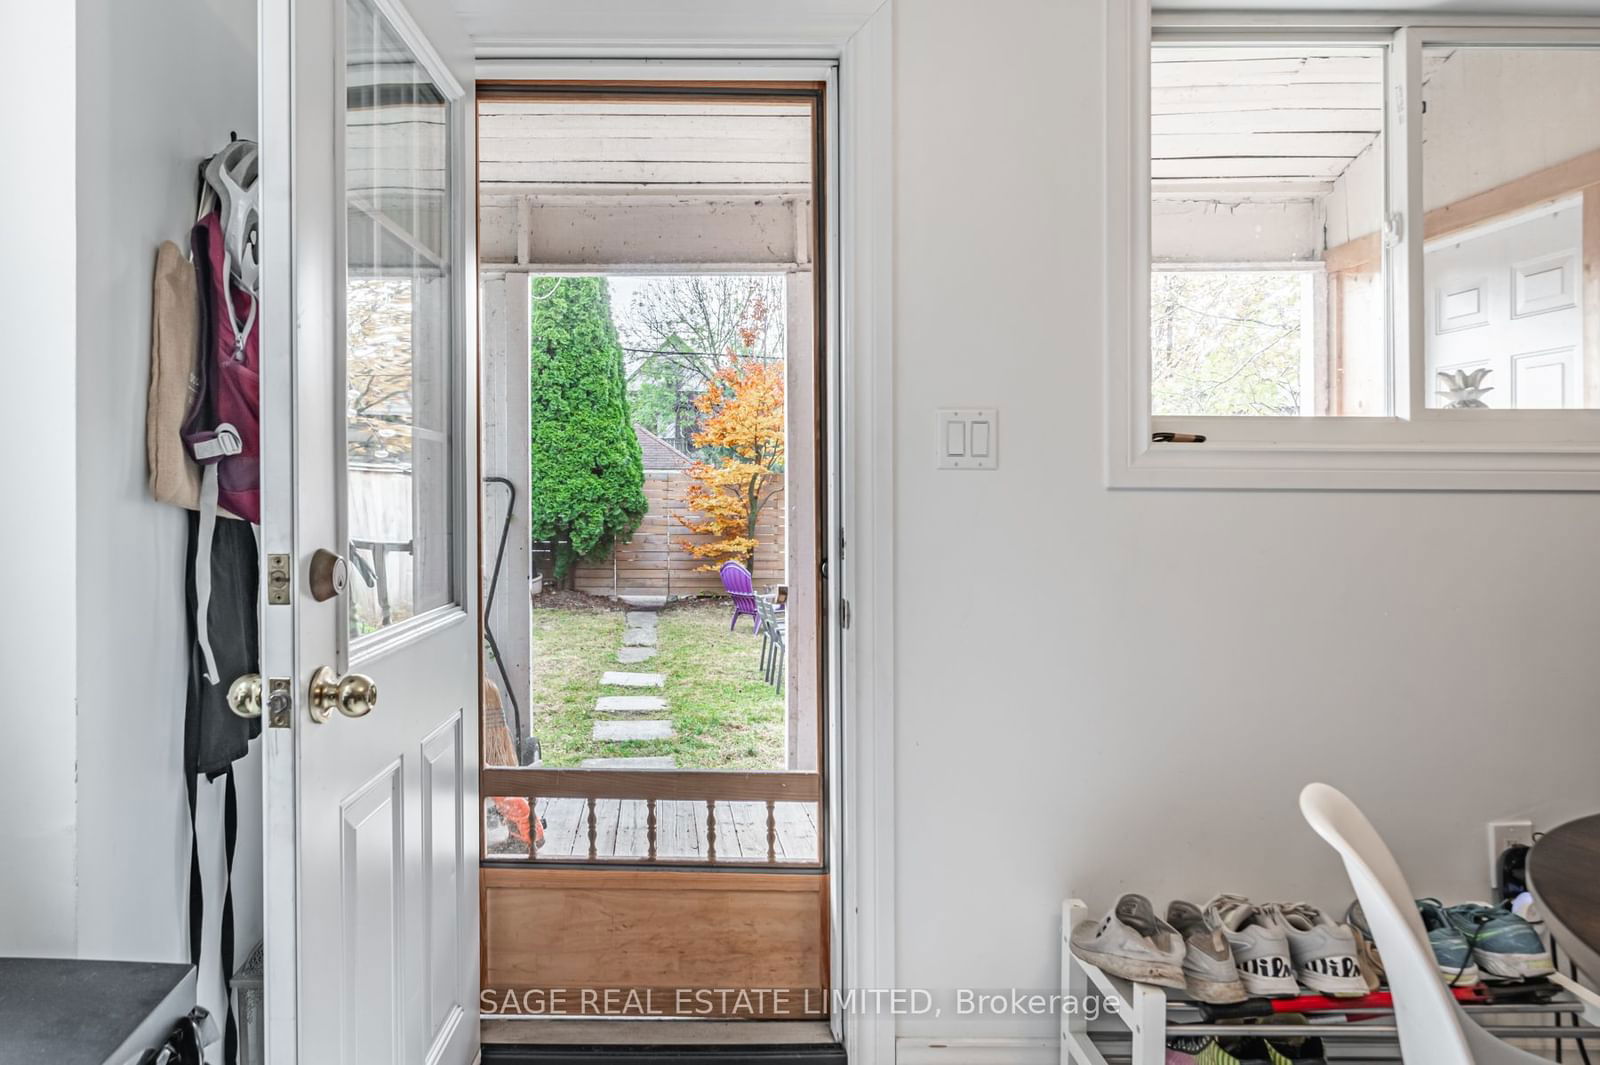
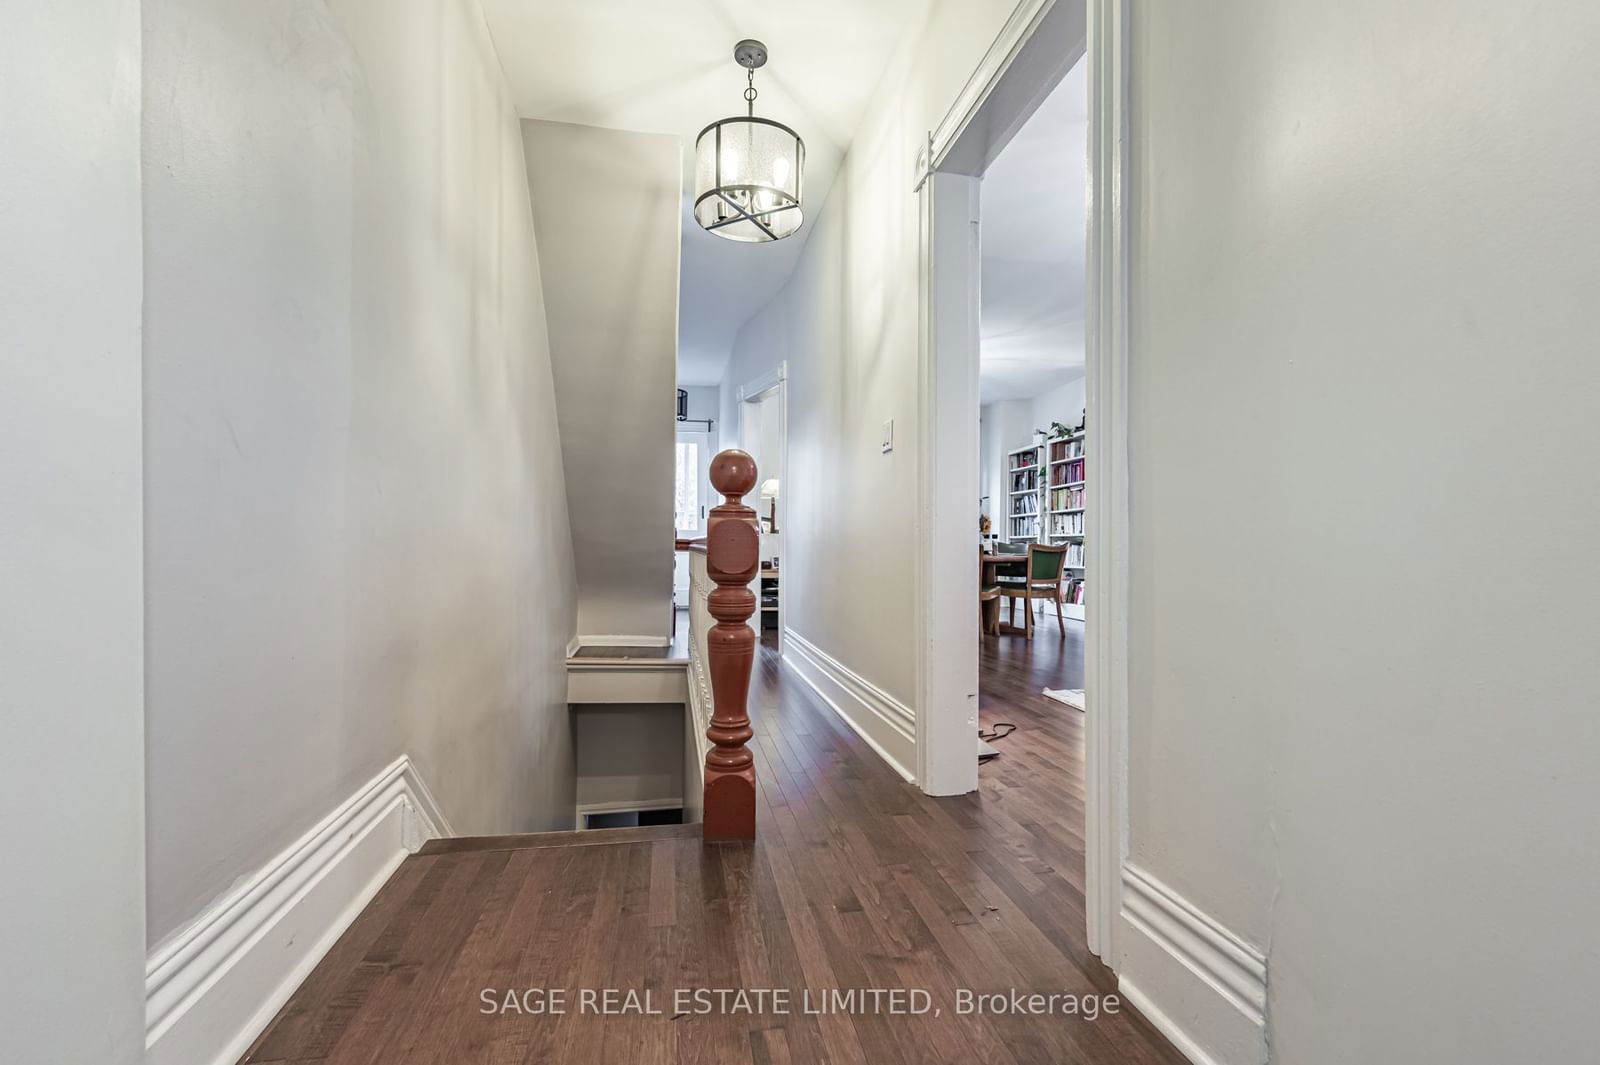
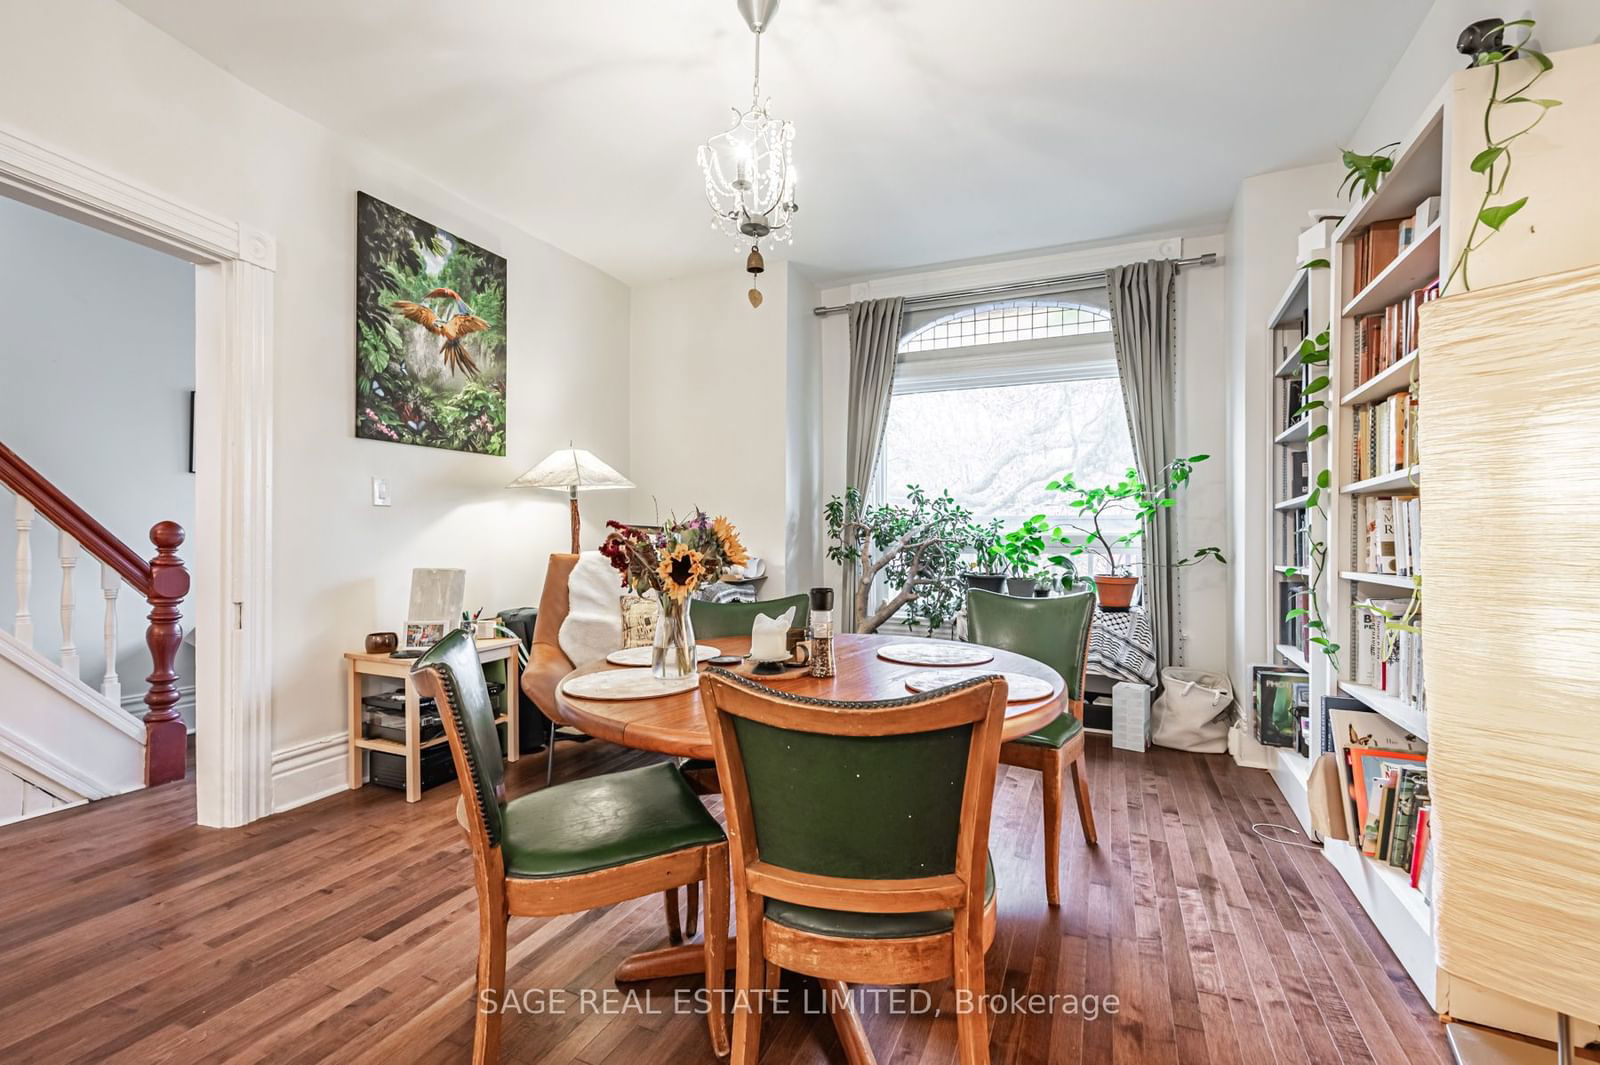
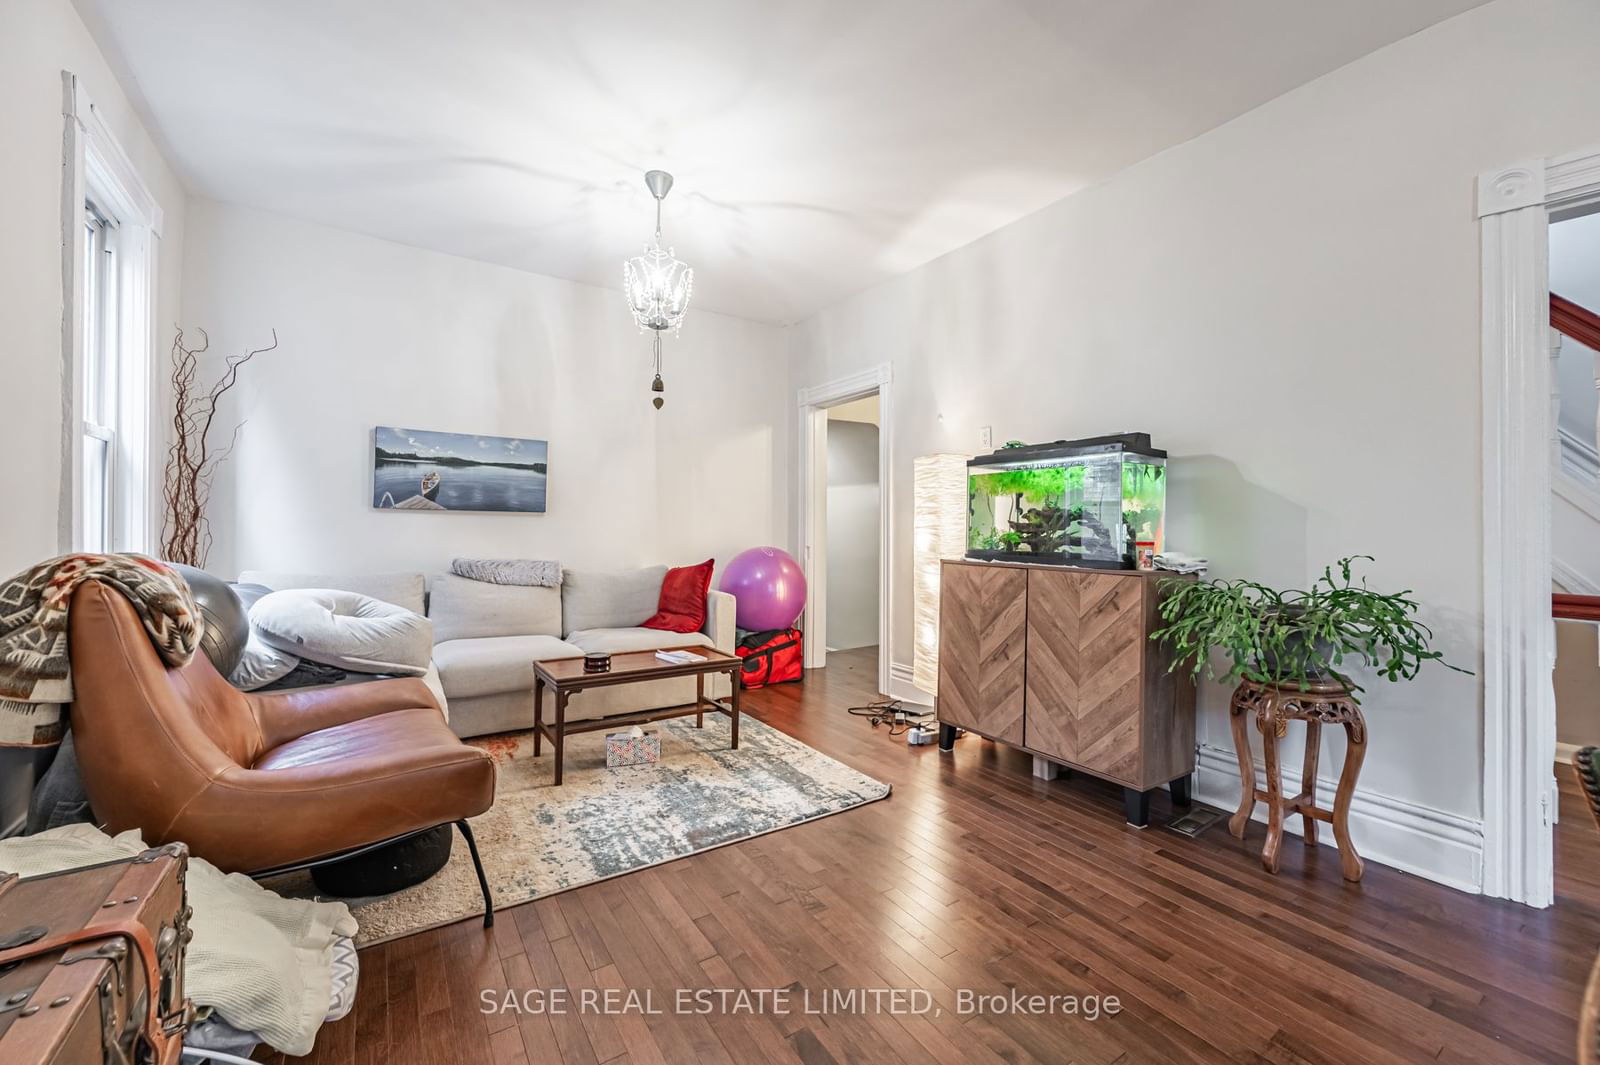
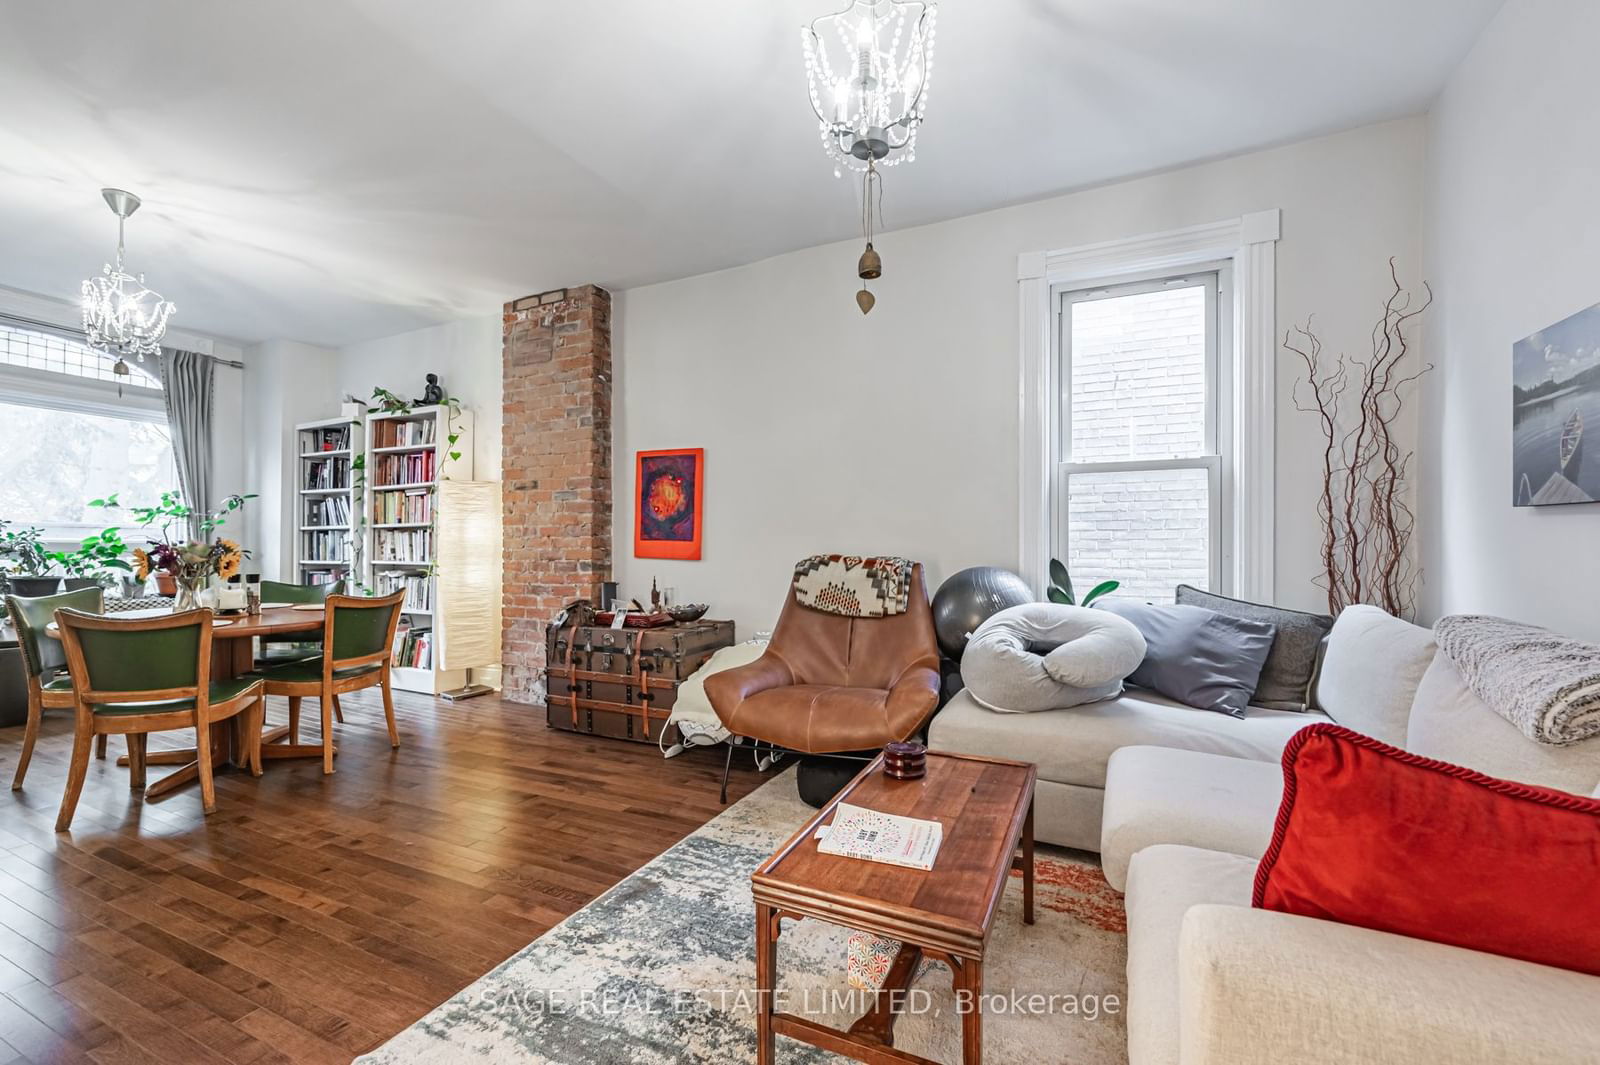
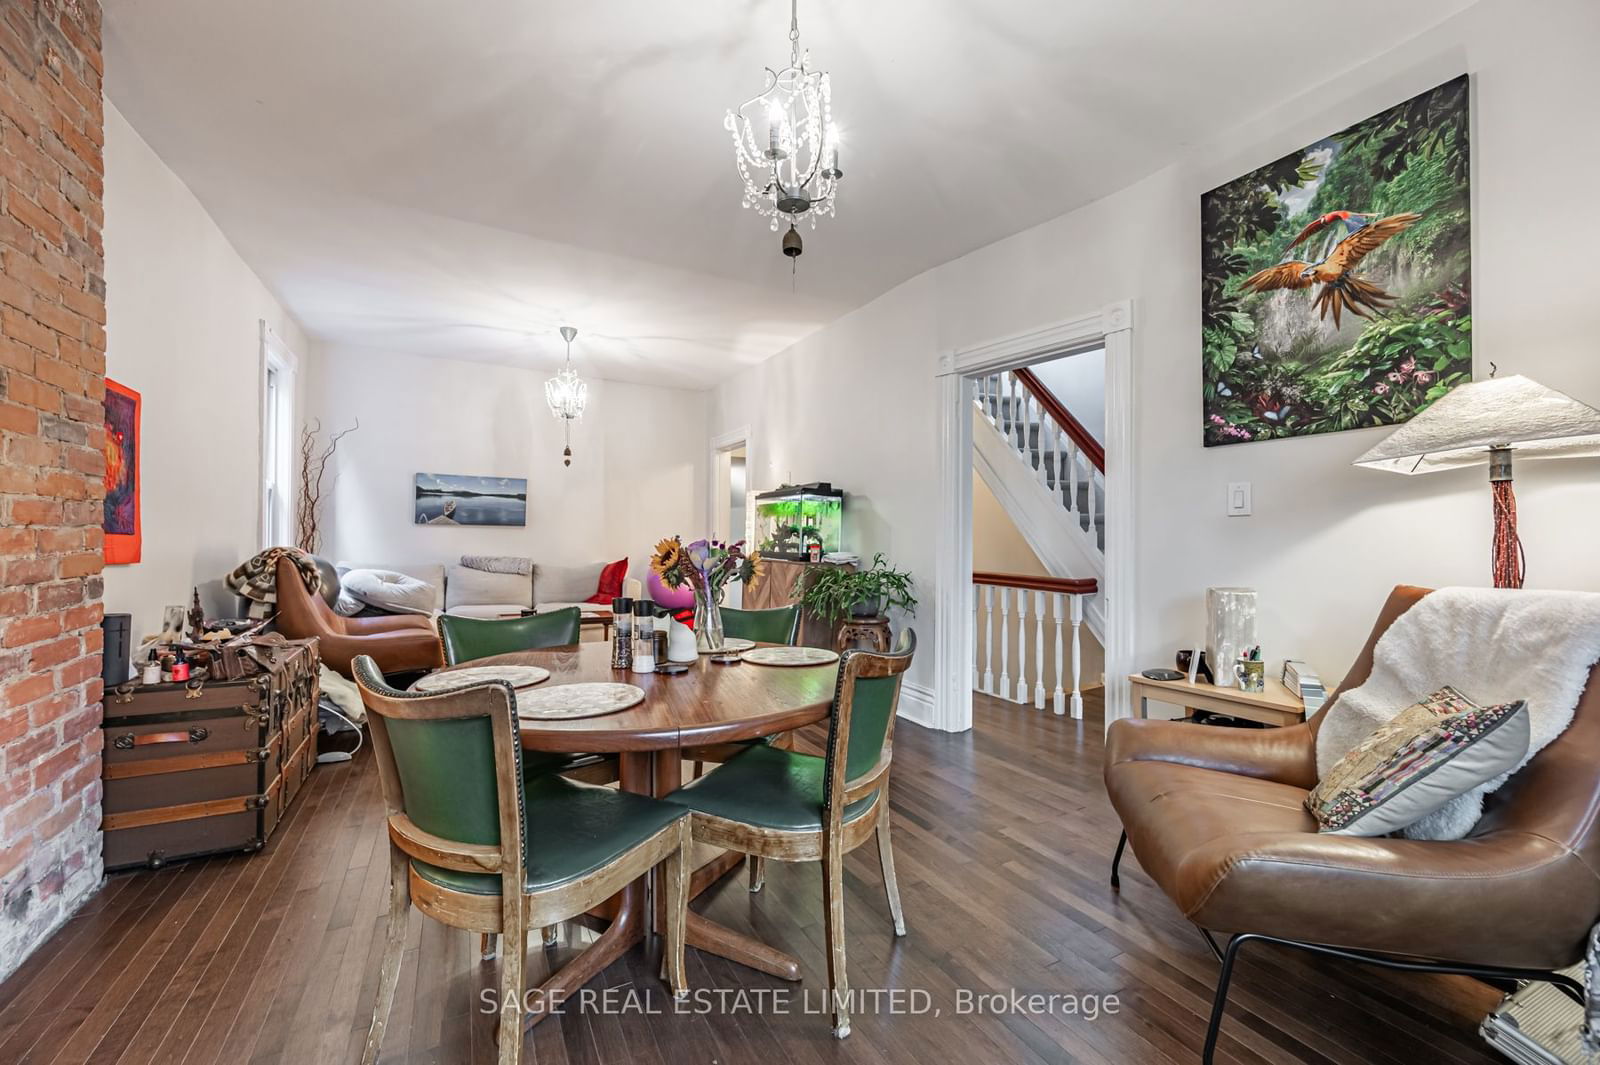
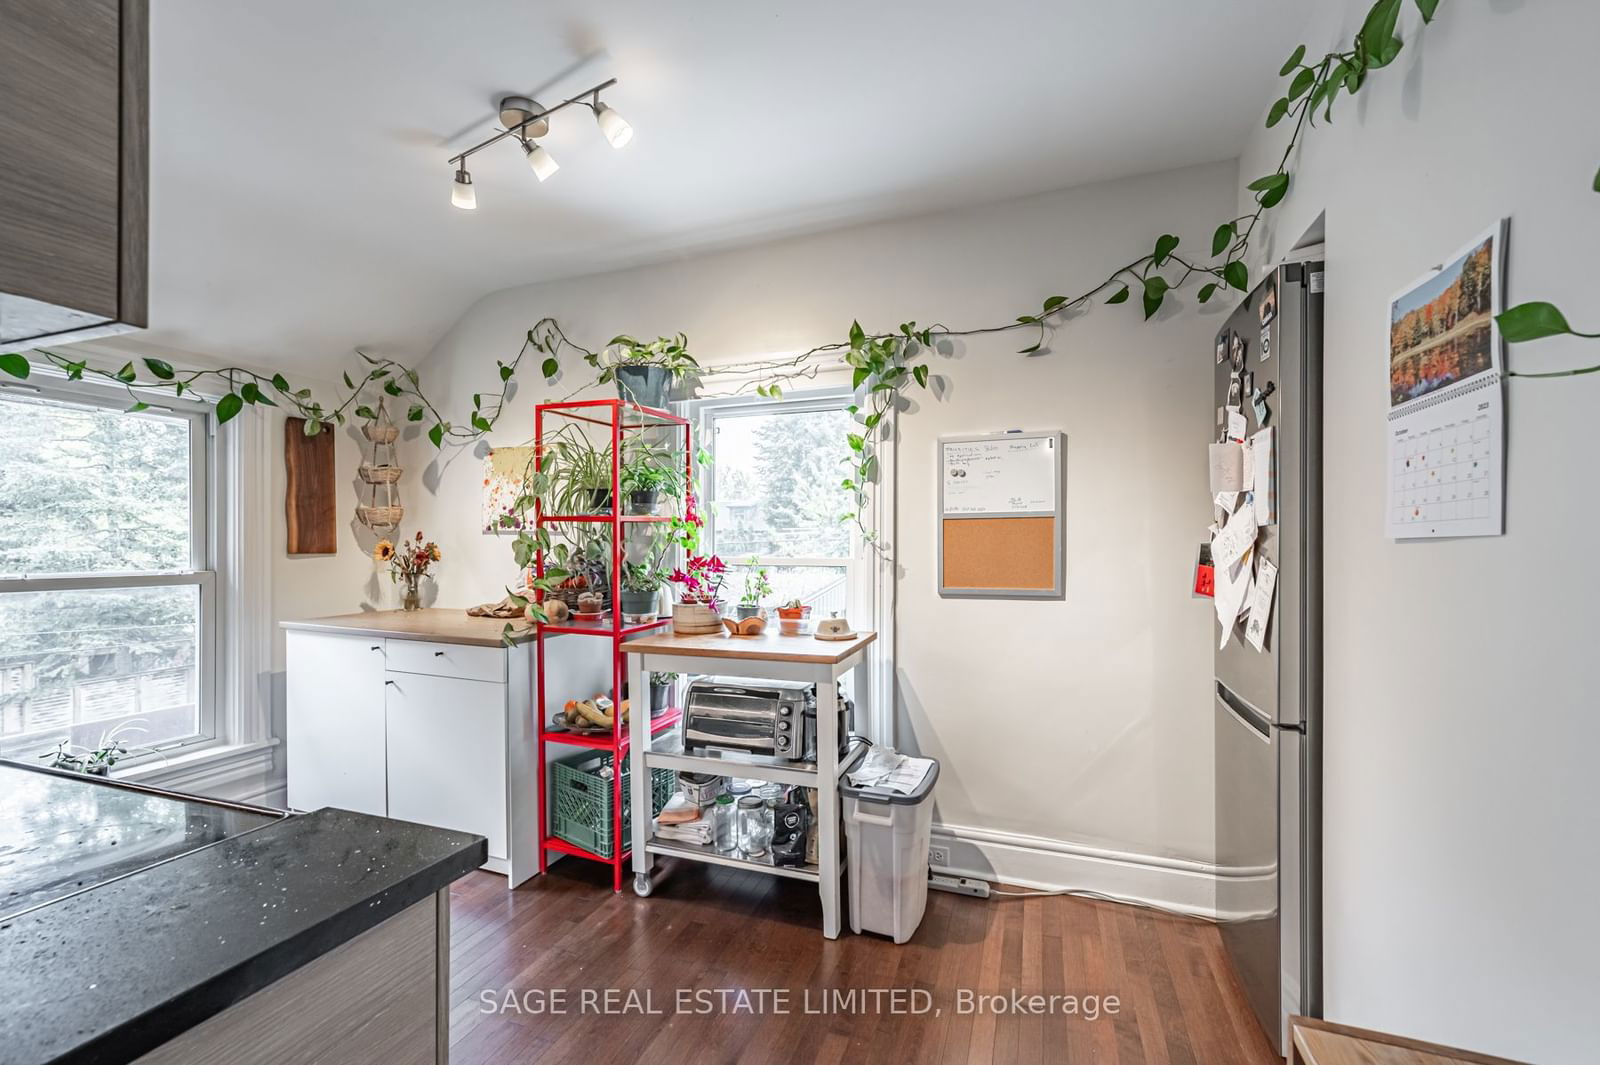
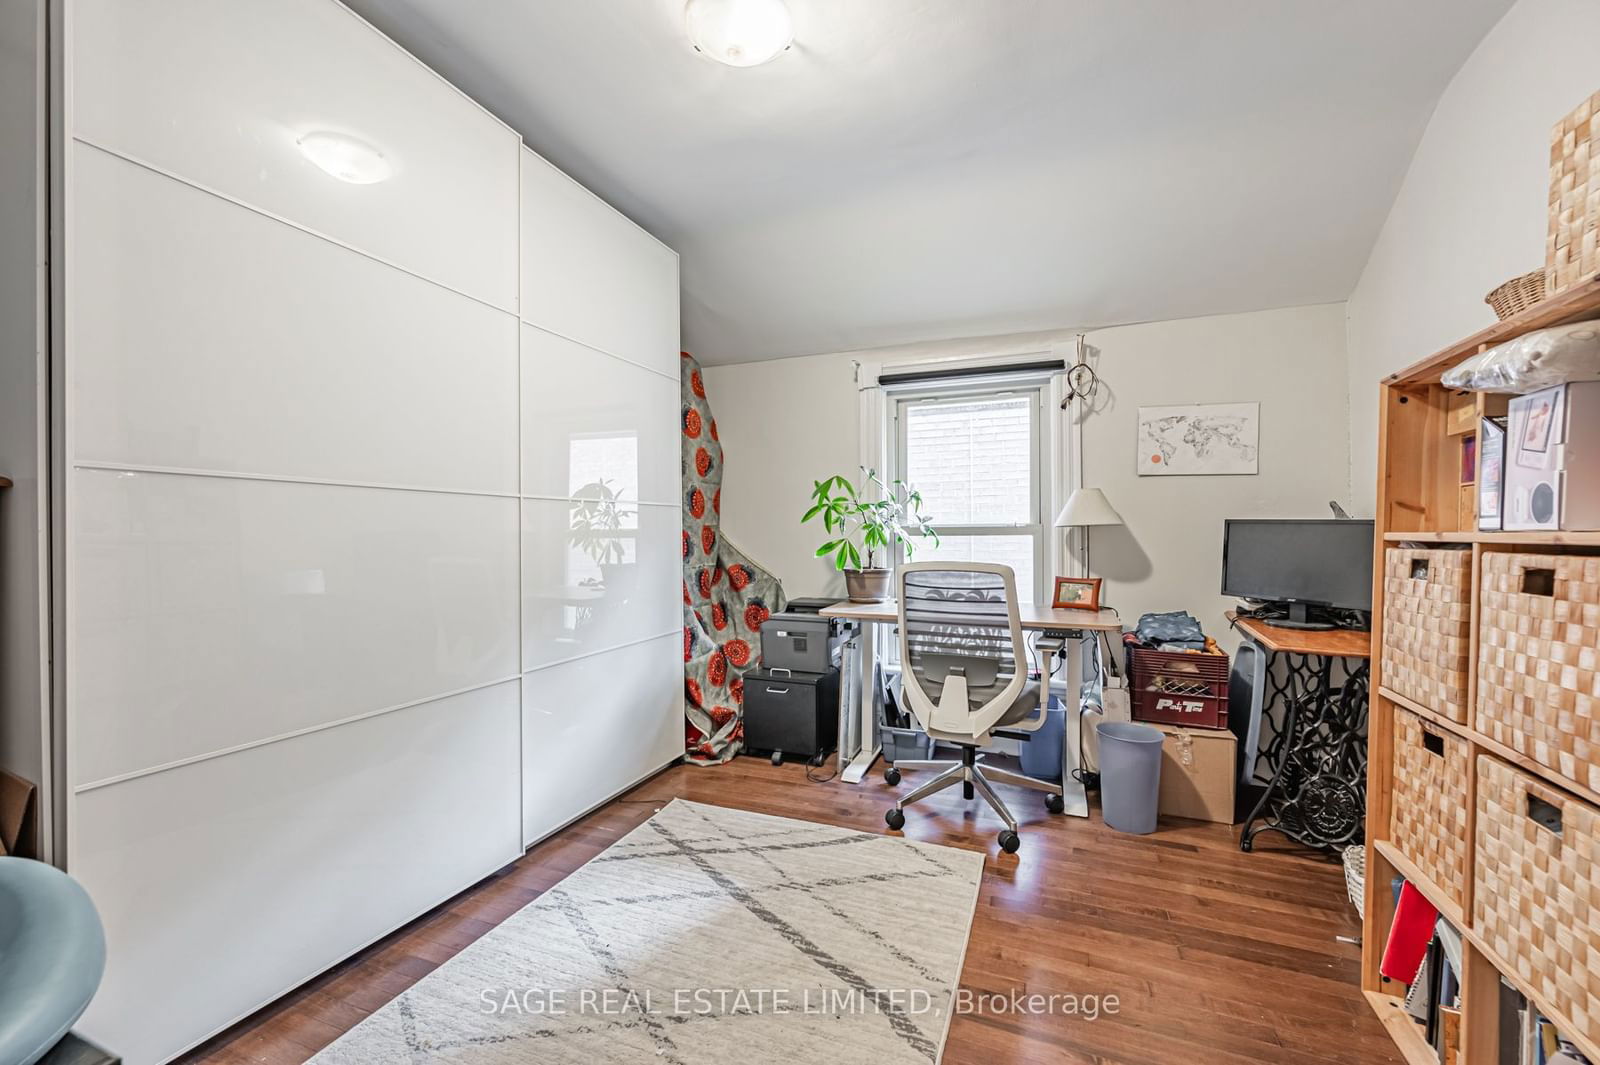
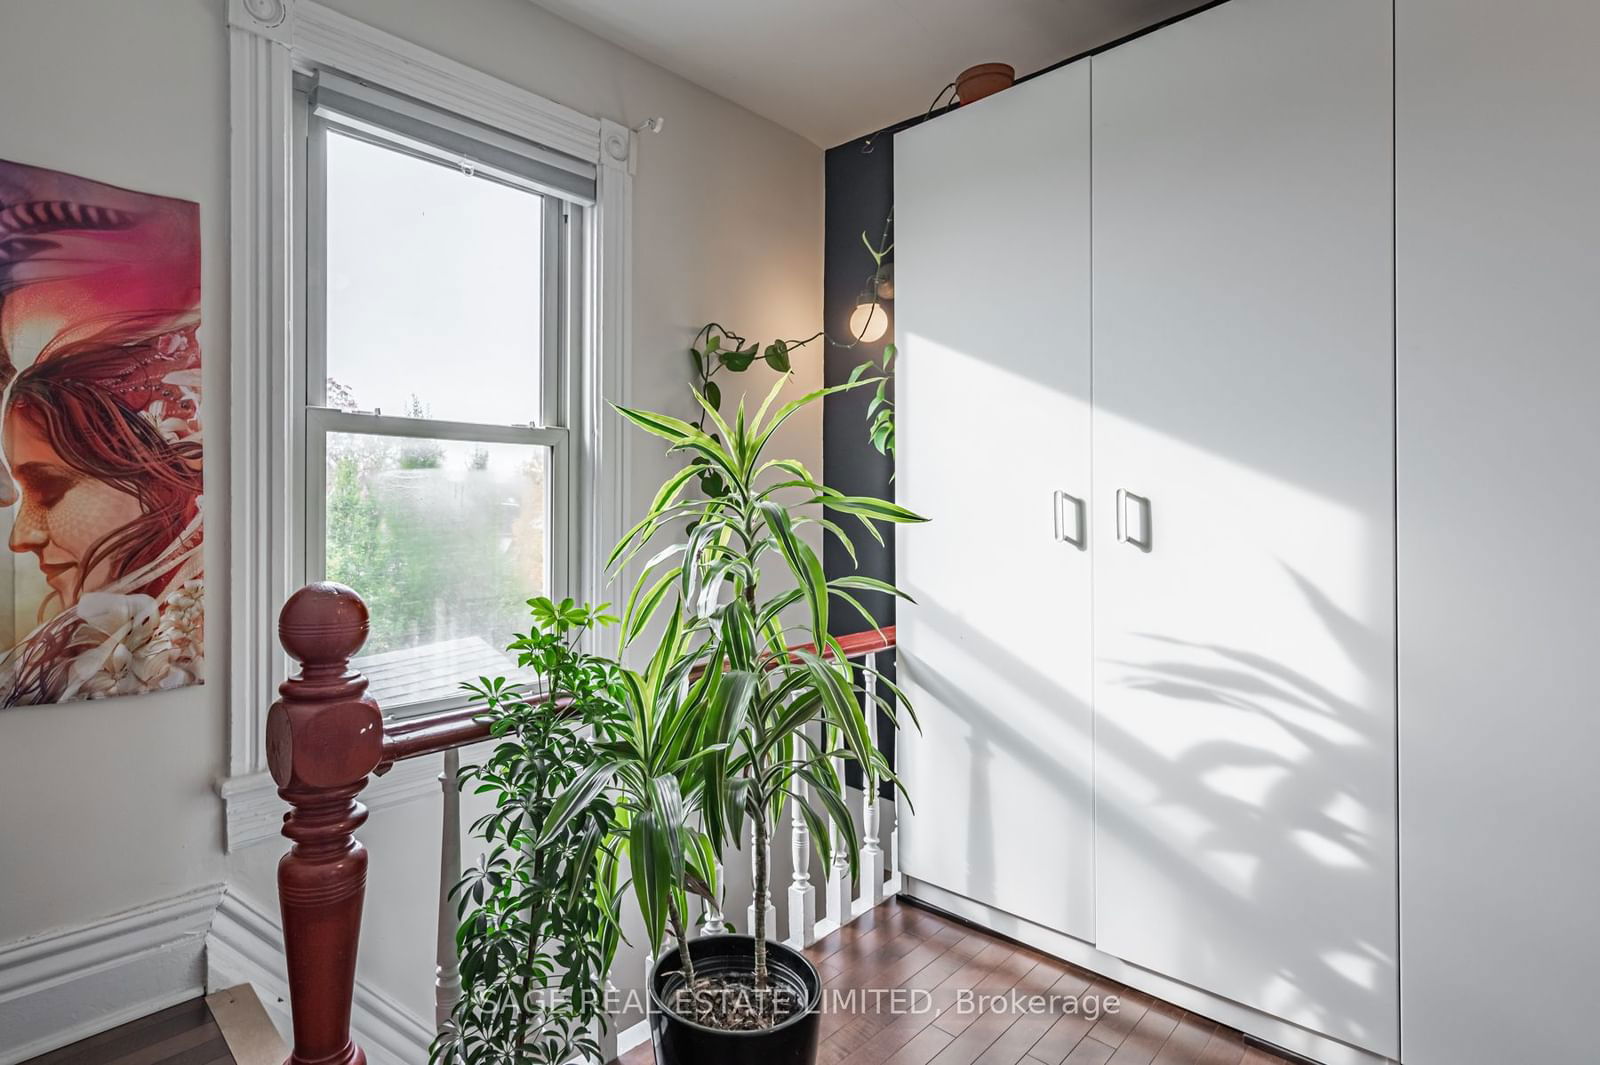
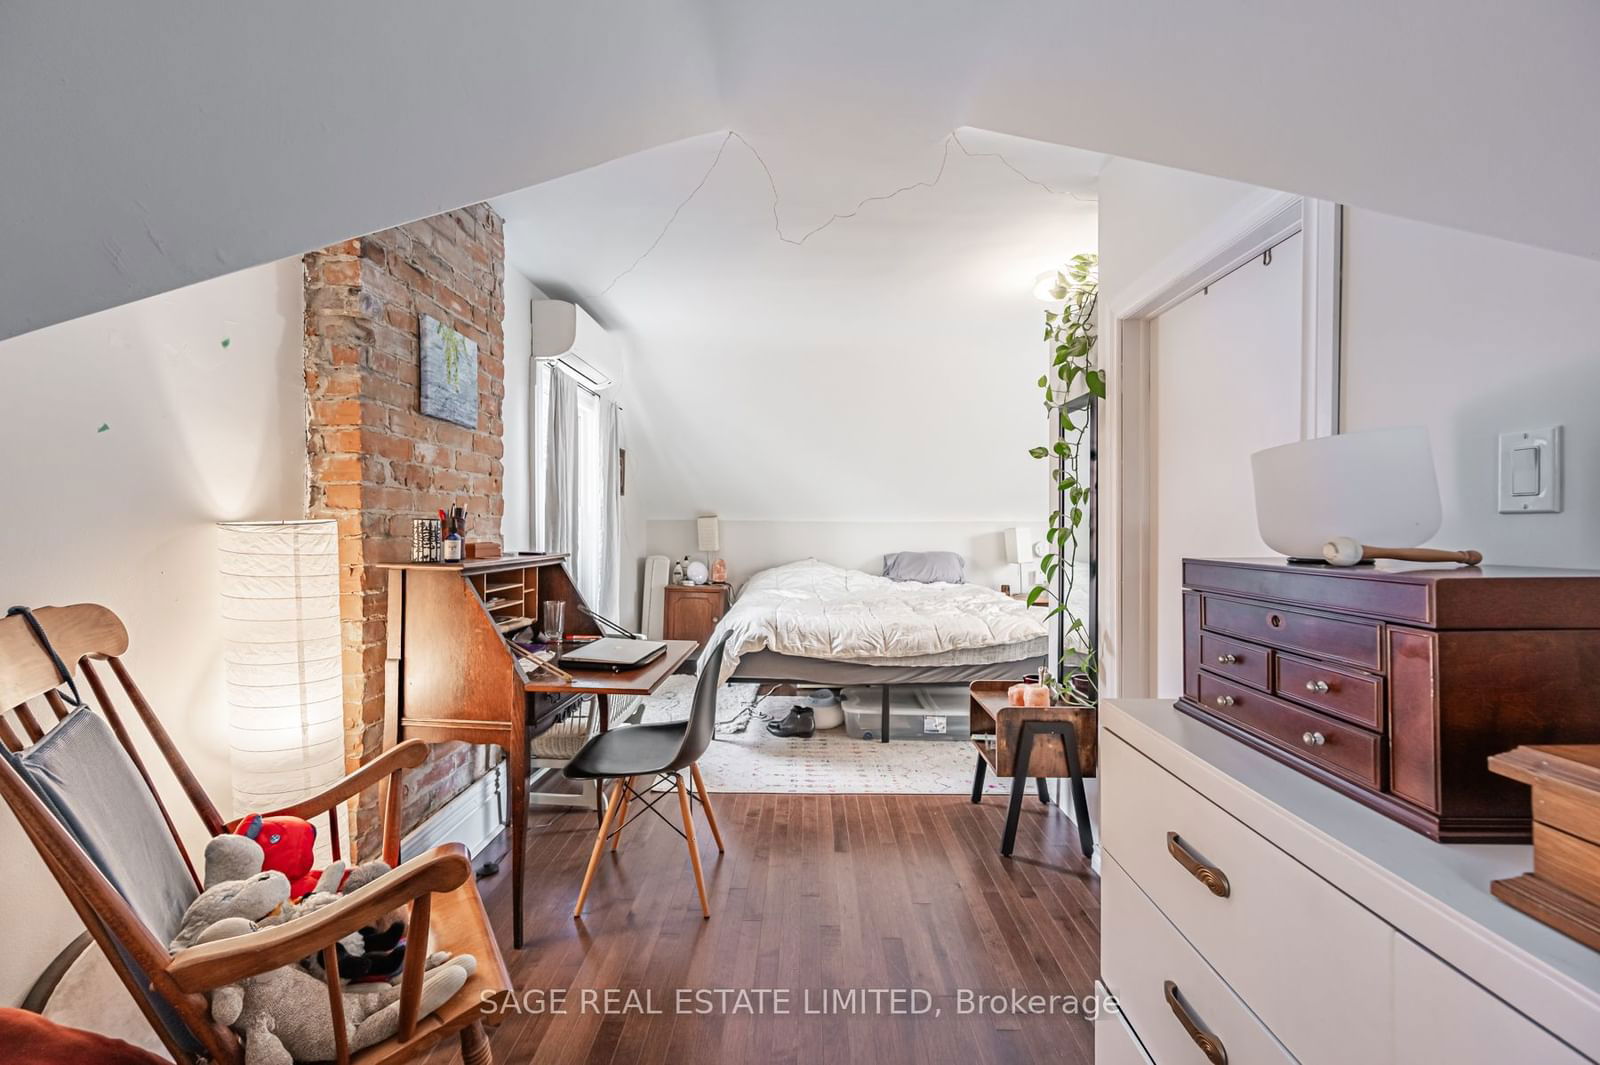
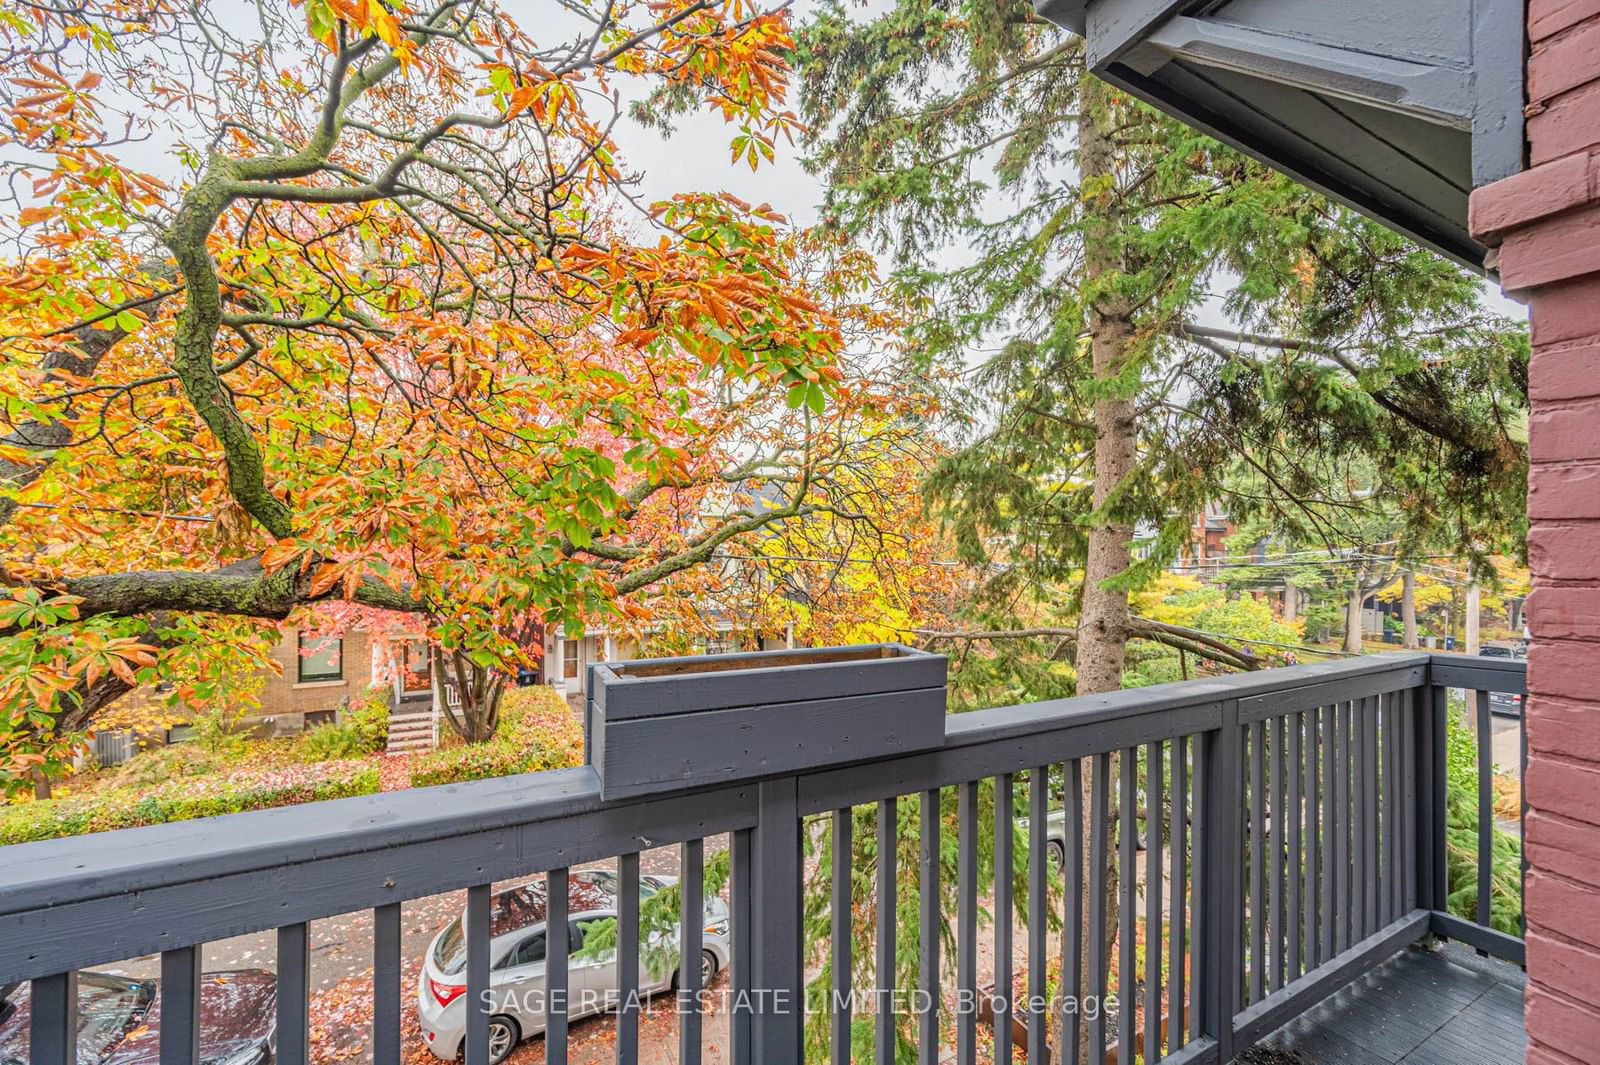
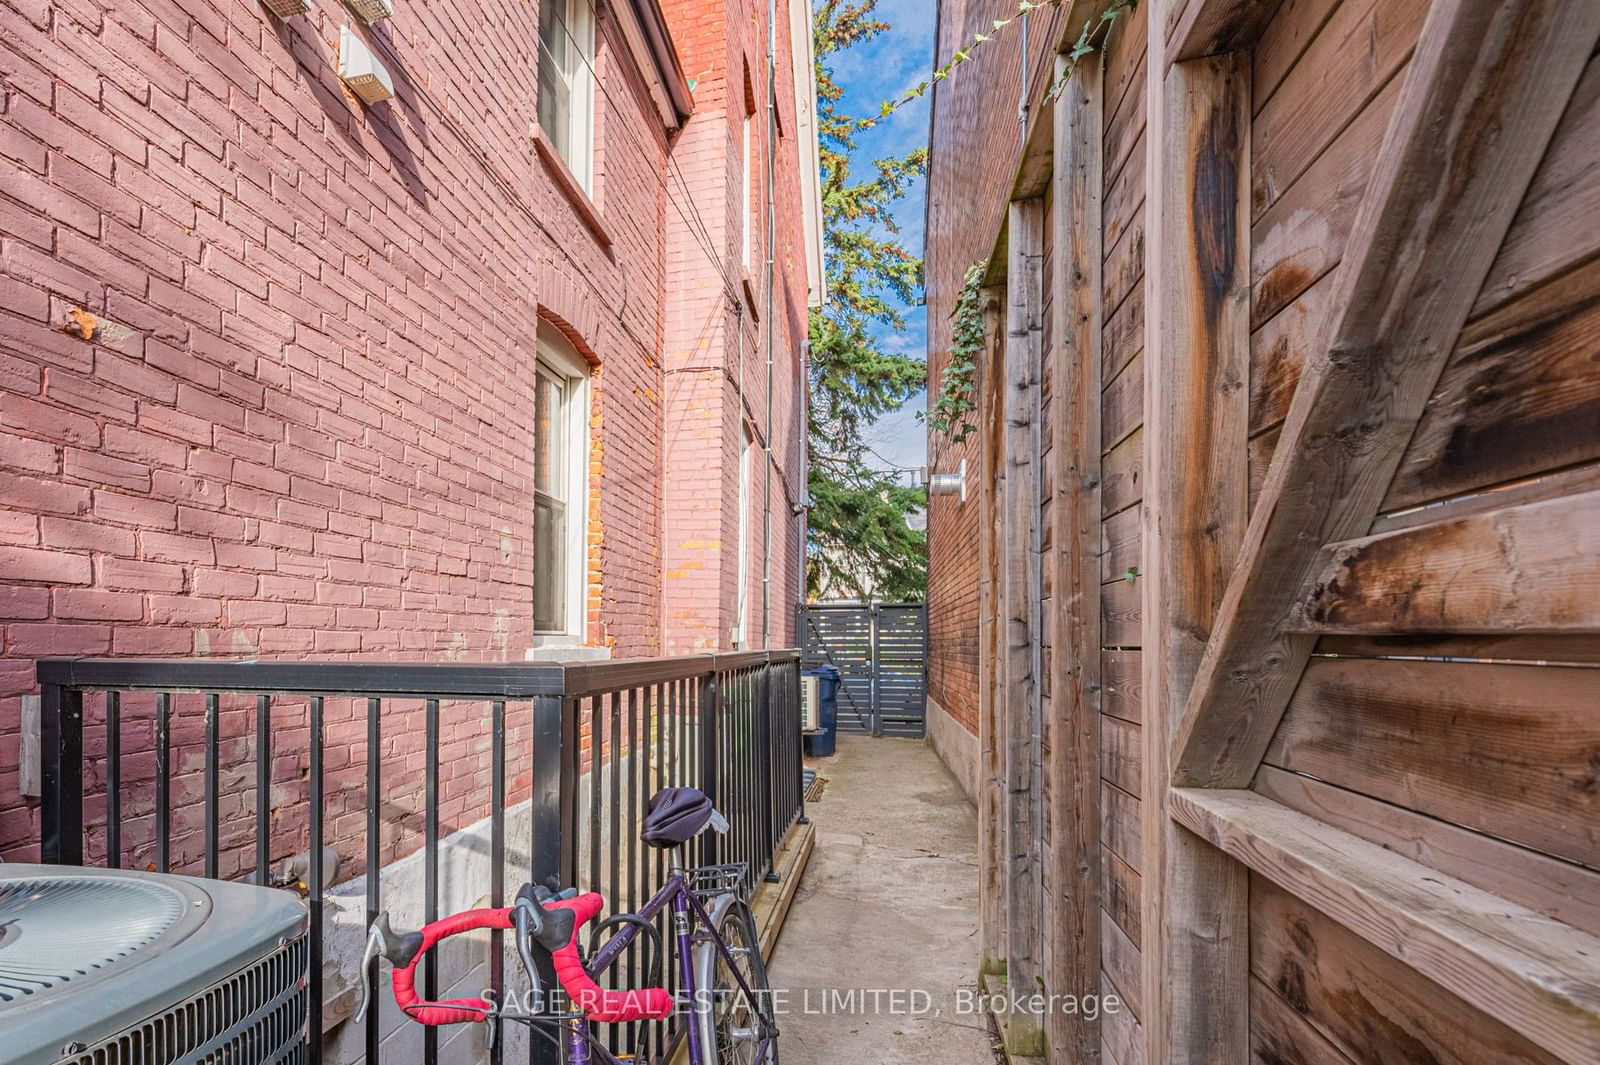
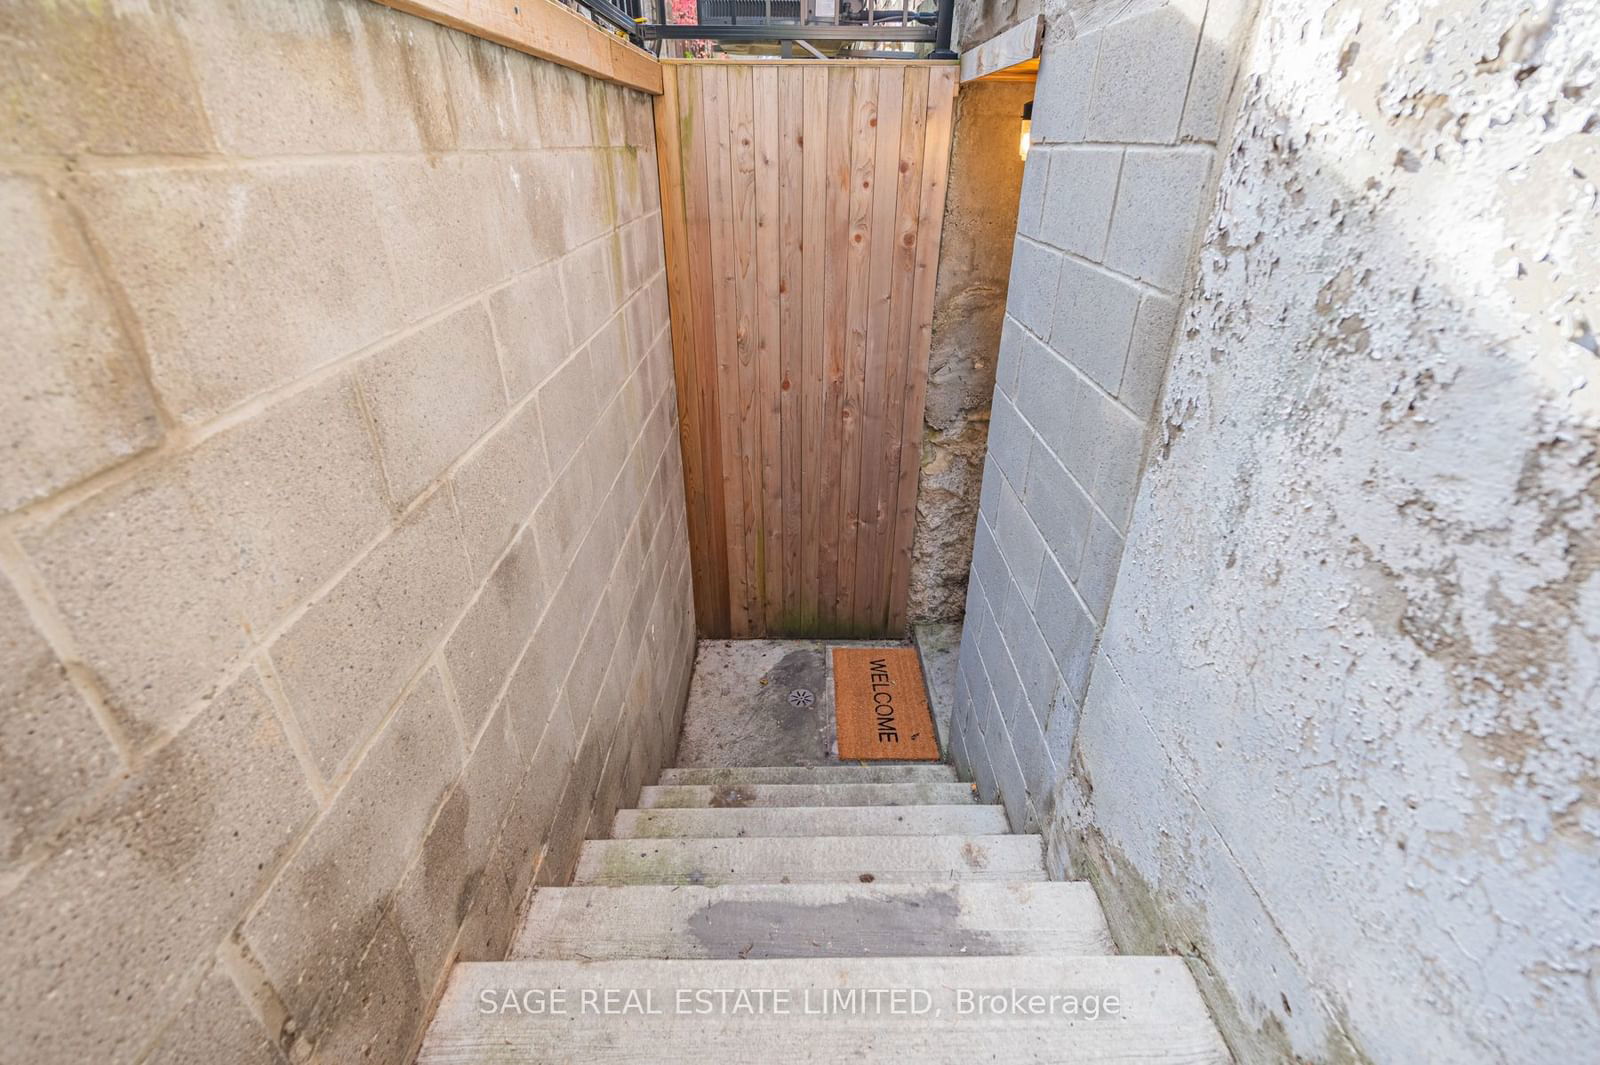
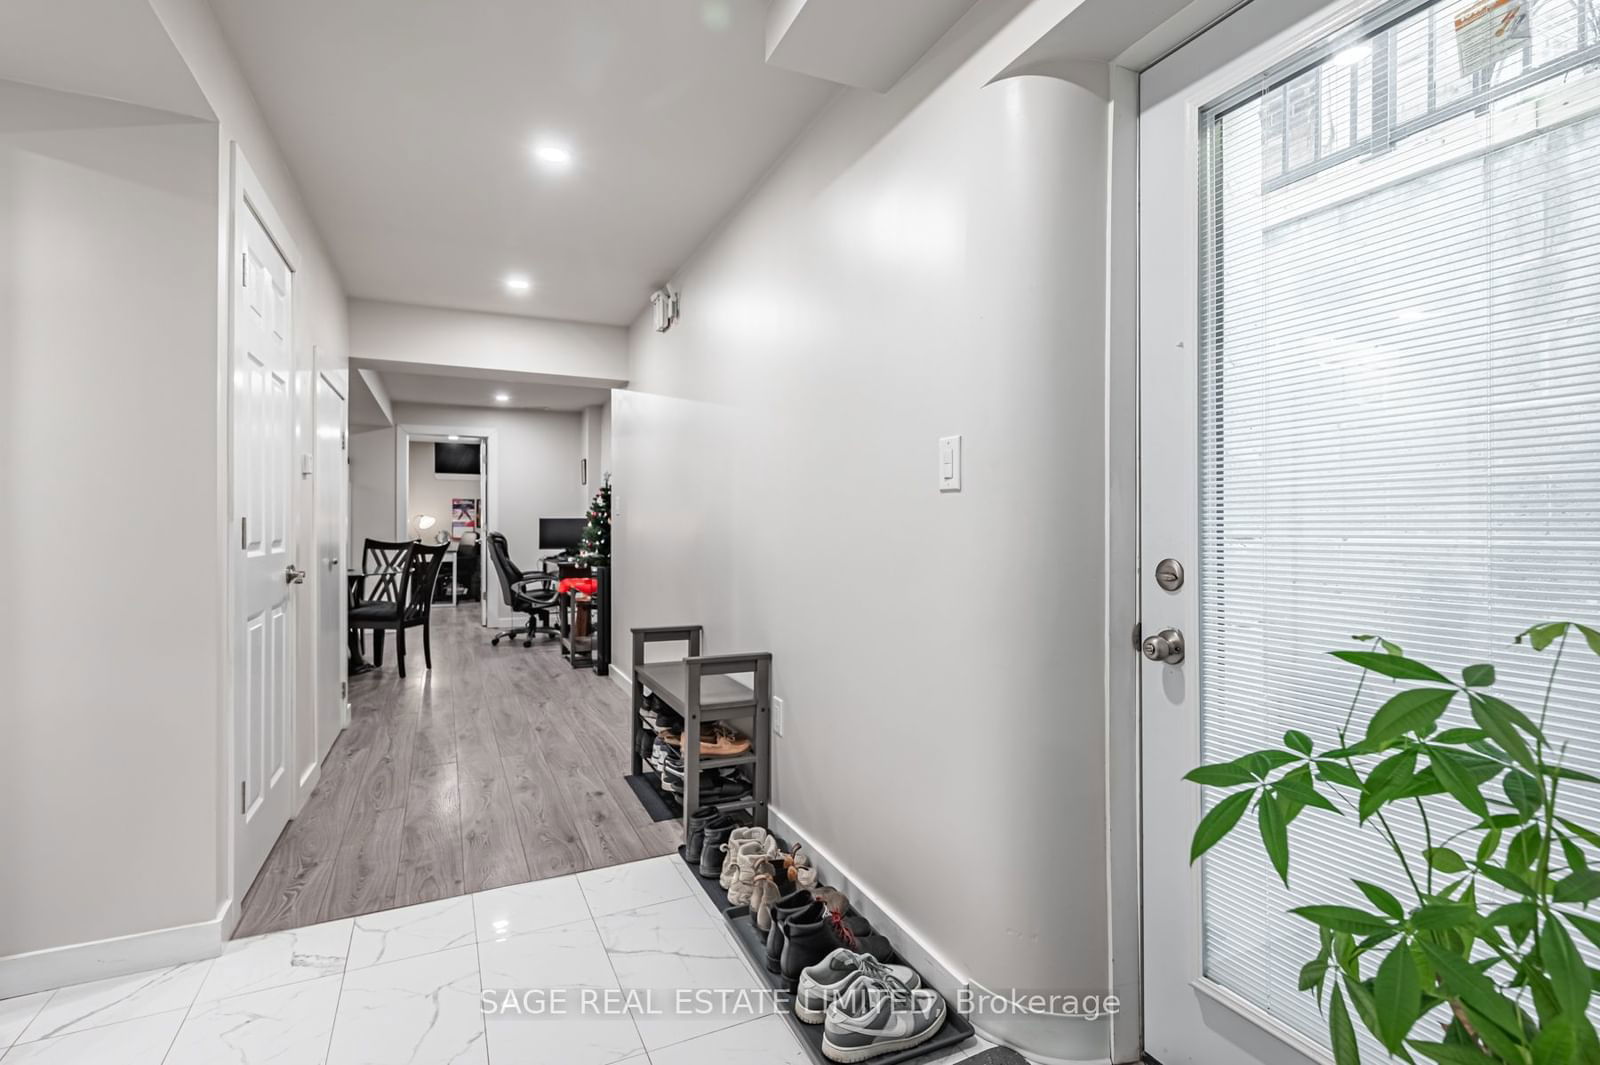
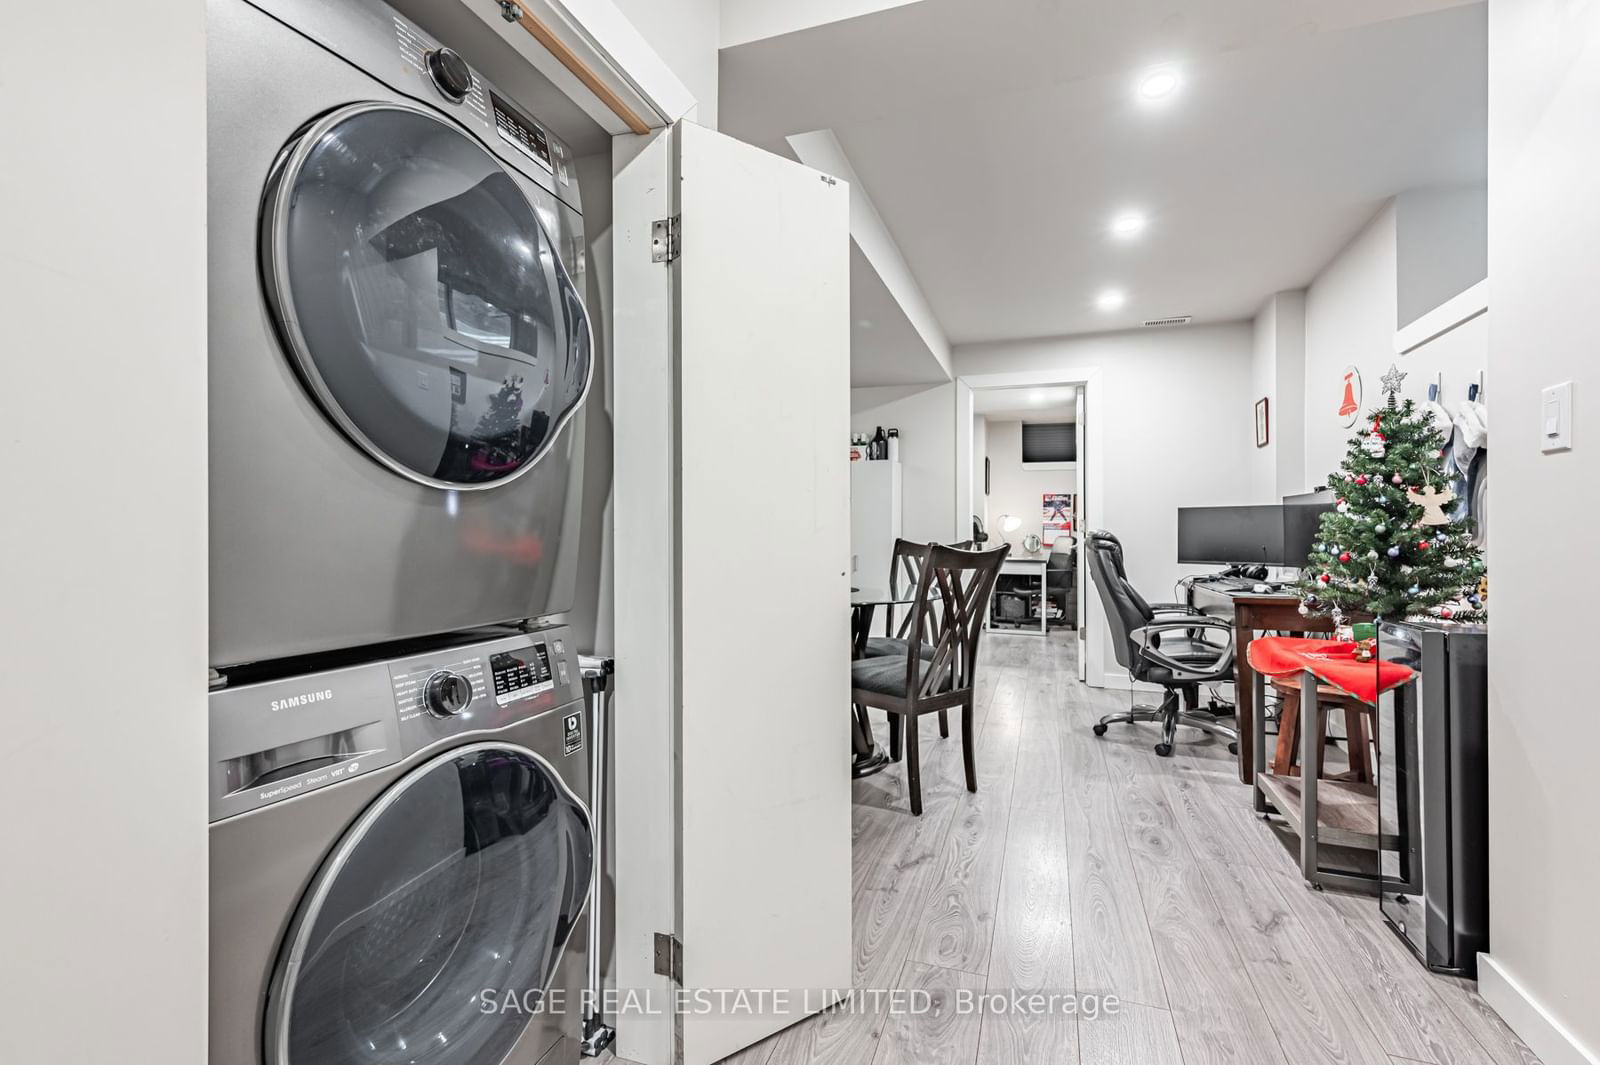
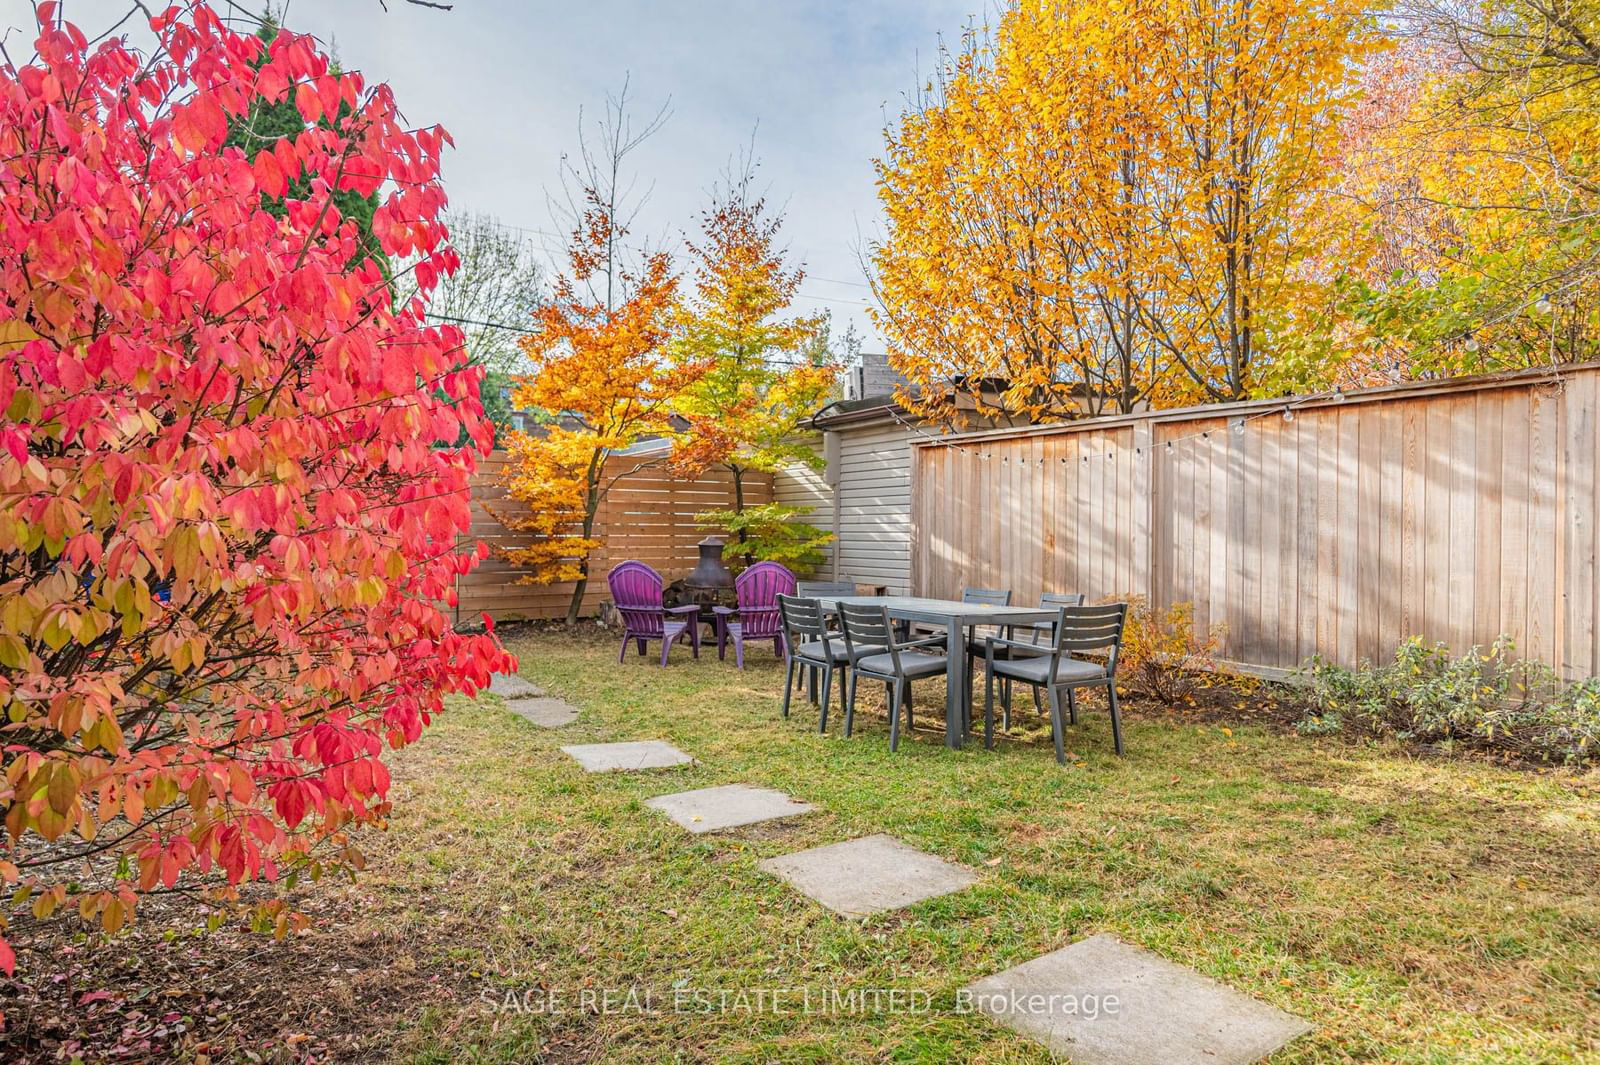
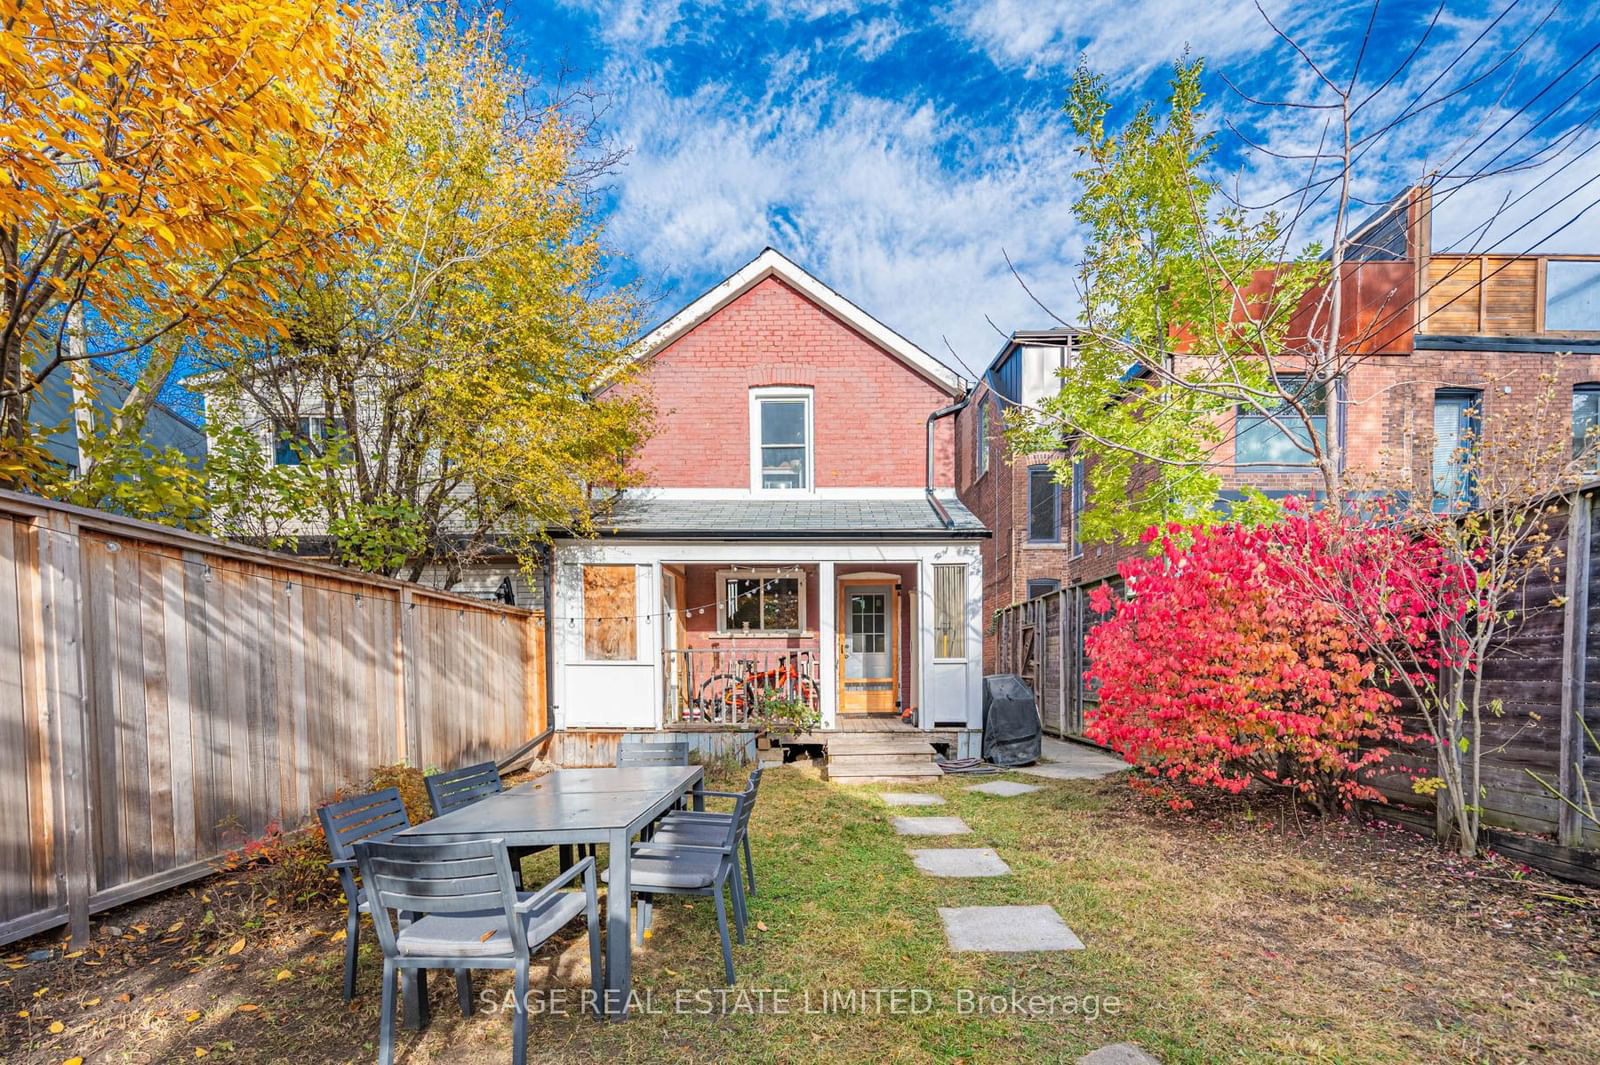
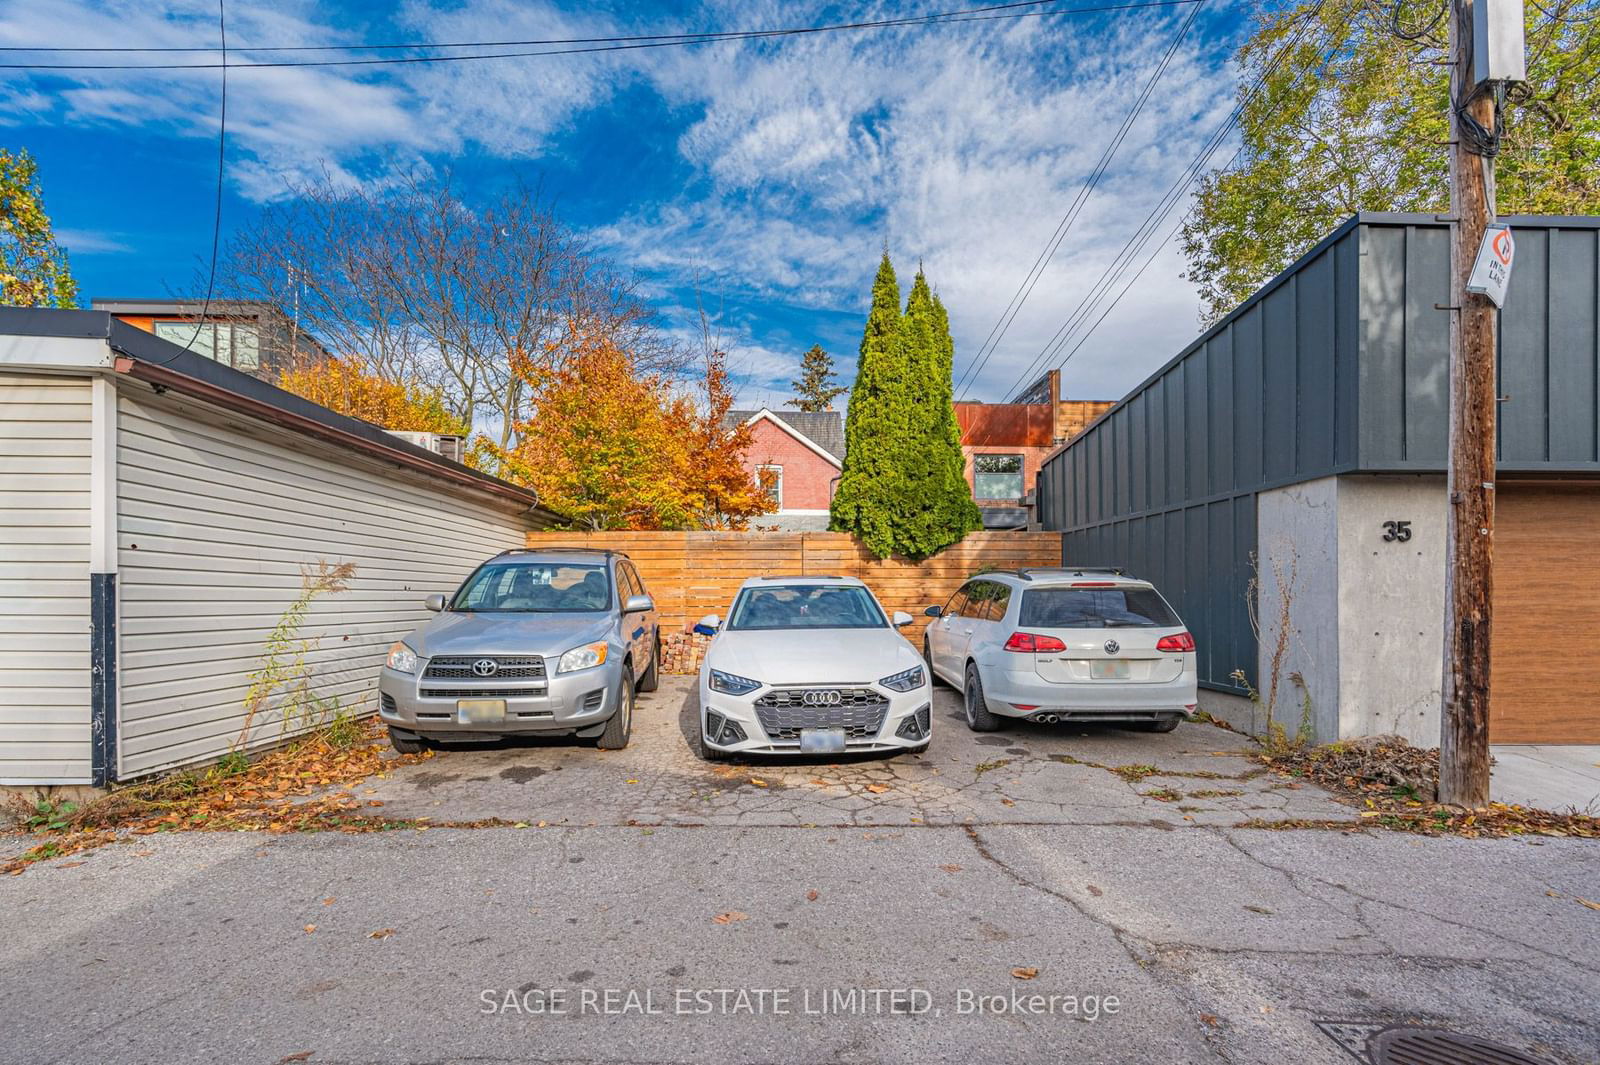
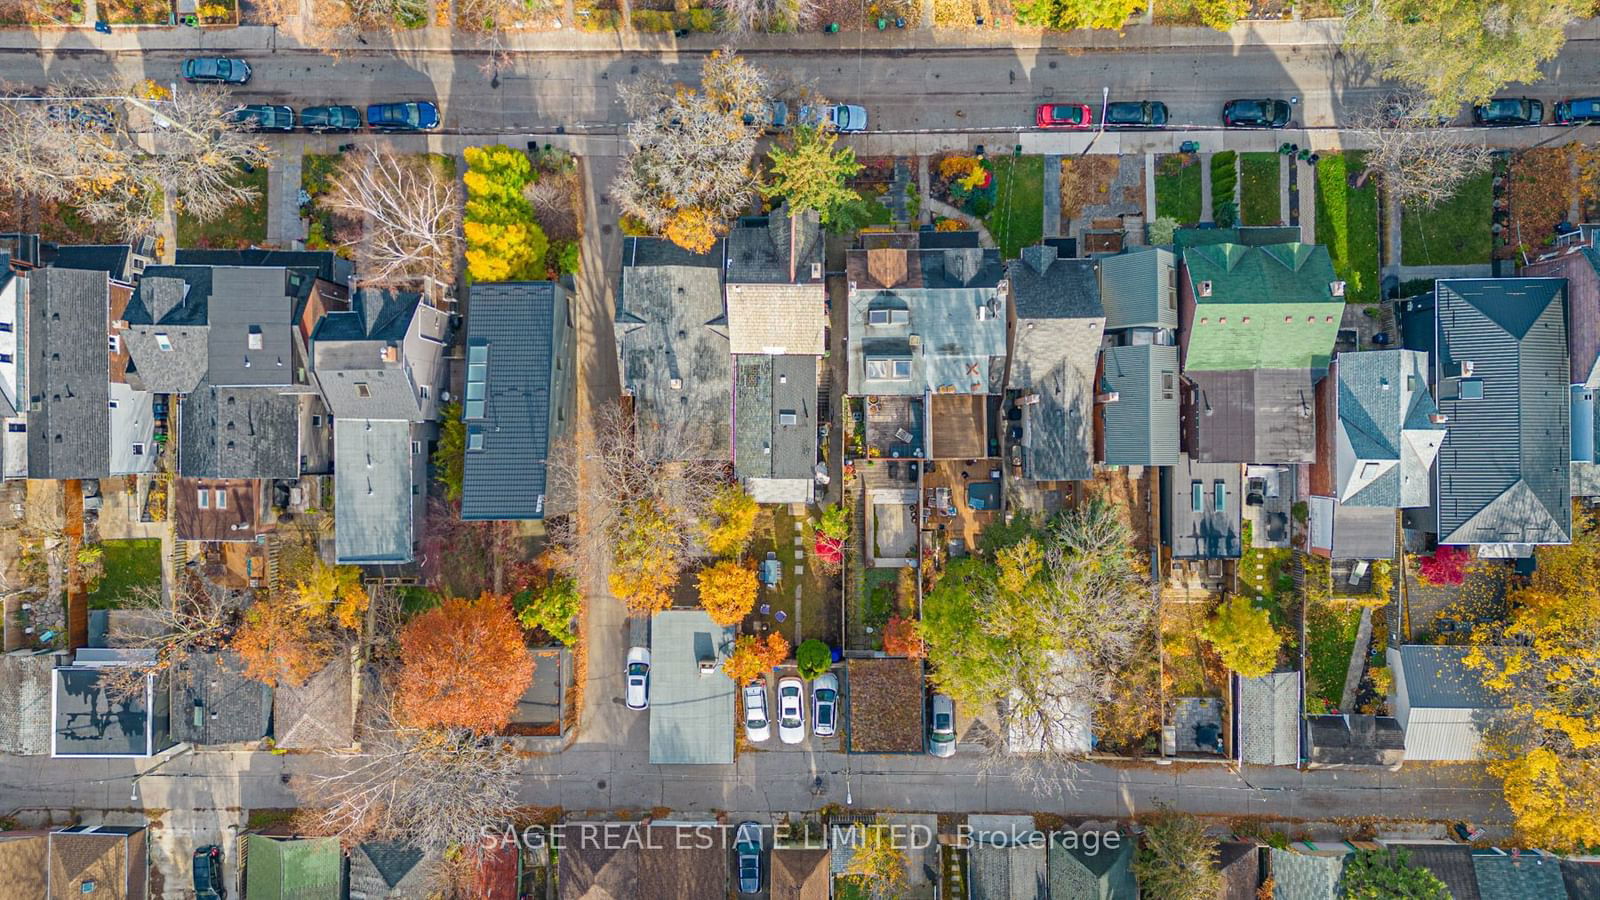
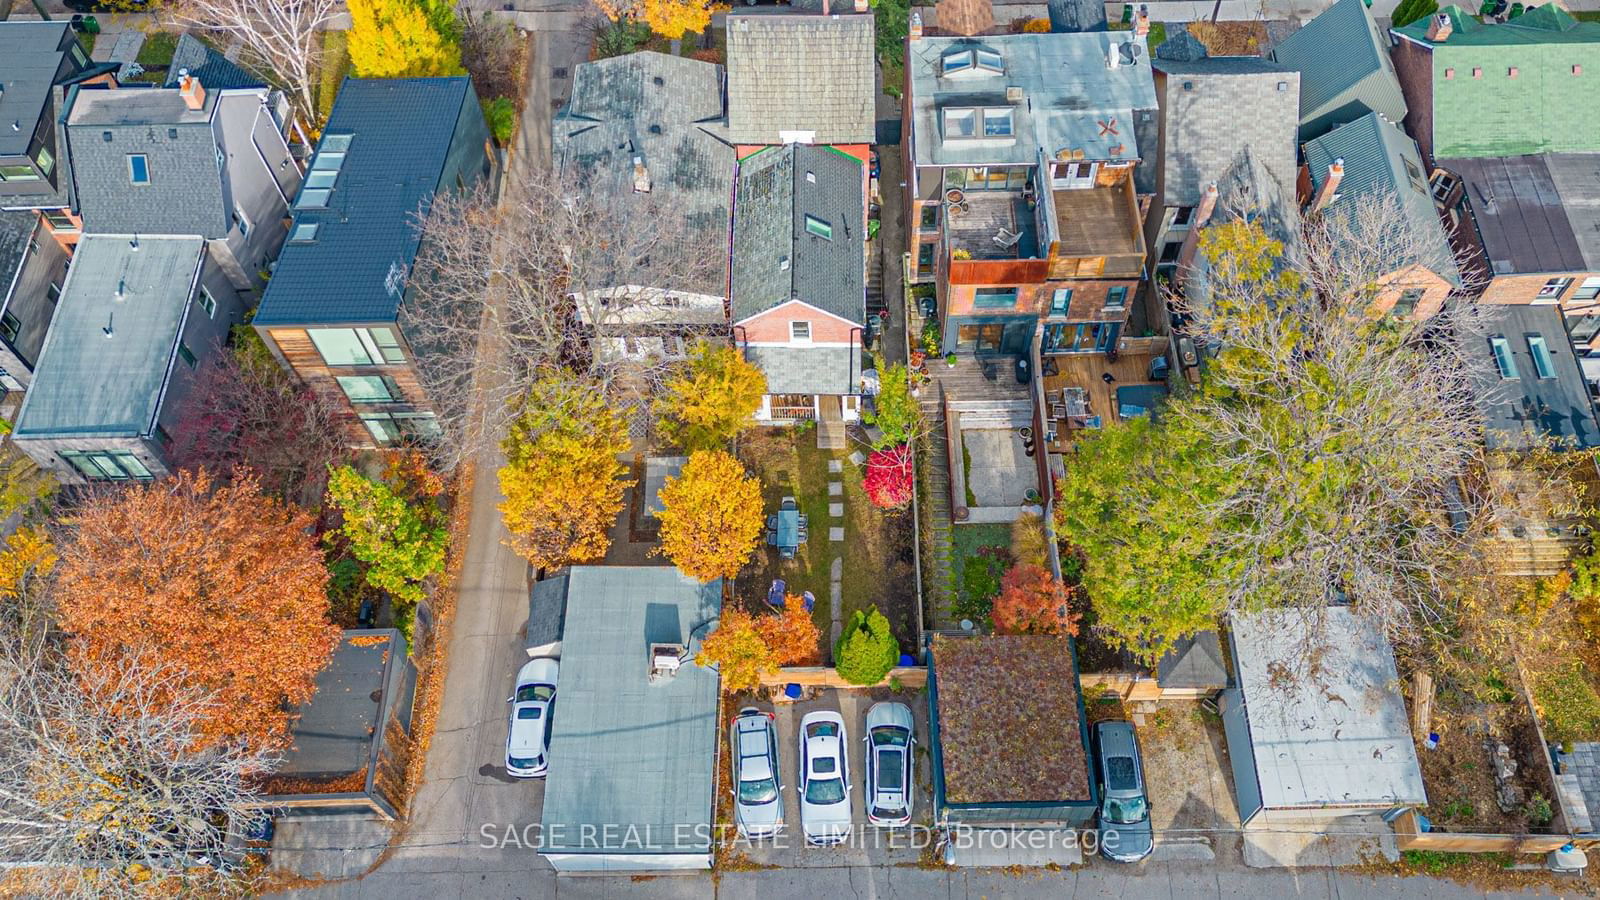
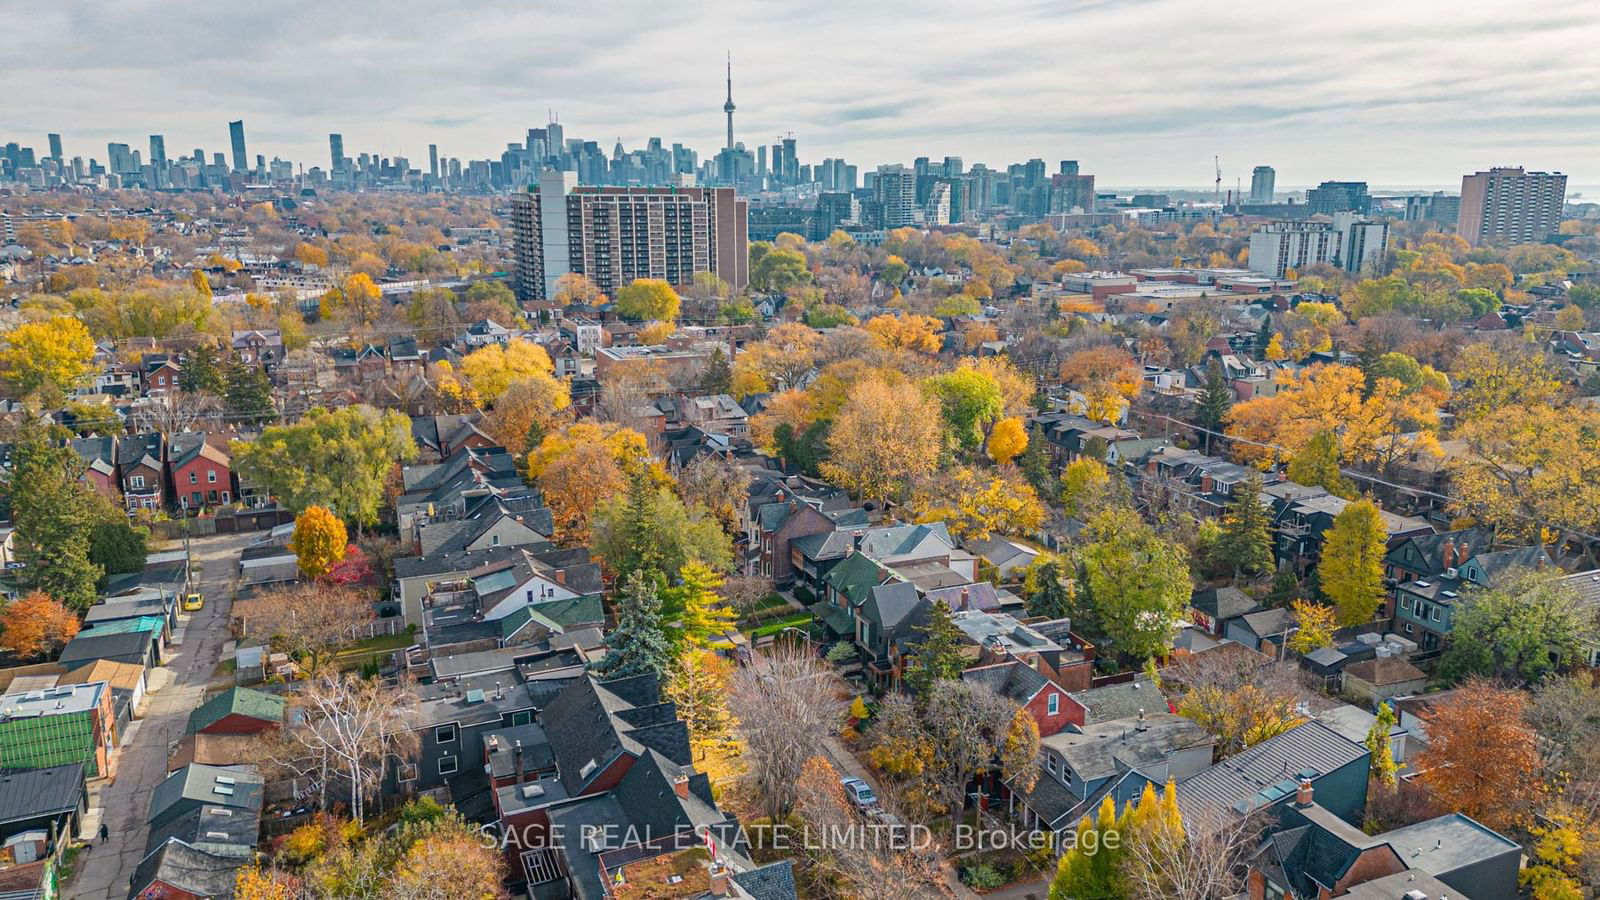
Calling all investors and end-users! This turn-key, detached, W-I-D-E & exceptional south-facing Victorian (c.1885) 2.5 storey home is located in the heart of Roncesvalles Village and boasts a sprawling floorplan with over 3,200 sq.ft. of finished living space spread over four levels. Substantially renovated since 2016, this home presently offers three large, practical, all two-bedroom units (each with rare designated laneway parking) ranging in size from a 1,200 sq.ft. 2nd/3rd floor showstopper to a 960 sq.ft. high, dry & underpinned (8'+) lower-level unit with heated floors, with a third 980 sq.ft. main-floor two-bedroom unit that is vacant and ready for your move-in, new tenants at today's rent or renovation project to create your dream space while collecting rent from the lower-level and upper units. Possibilities abound; Enjoy the property as-is, build a possible 1,600 sq.ft.+ laneway suite (report attached) or build into a huge single-family home in one of the best neighbourhoods in the city, close to excellent schools, transit, restaurants and entertainment. All the heavy lifting has been done here; Hundreds of thousands of dollars in updates since 2016 include deep underpinning, electrical (200 amp), hardwired smoke/CO detectors, plumbing, flooring (basement heated), three complete sets of new appliances, removable partition walls, exterior paint, etc. In brief: wide, detached & renovated Victorian in prime Roncesvalles with 4+2 bedrooms, four washrooms, two stairwells (front & rear), three parking and $100K+ possible (but very achievable) gross income when fully leased. **EXTRAS** Sky-high ceilings and loads of original charm are paired with laneway house, further multi-unit or single family (5+ bed) possibilities.
3x stainless steel fridges, 3x stainless steel stoves, 3x built-in stainless steel rangehood microwave, 3x washers, 3x dryers, furnace, HWT. (All new since 2016).
Living
Kitchen
Br
Br
Living
Dining
Kitchen
Br
Br
Kitchen
Br
Br
The graph below compares the average list price and average sale price of homes in this neighborhood by month for the last 24 months. When average sale price is greater than average list price, this may suggest a buyer's market. When average sale price is lower than the average list price this may suggest a seller's market.
The graph below illustrates the average days on market for homes in this neighborhood. The yellow area may indicate a buyer's market, the green area may indicate a balanced market and the red area may indicate a seller's market.
Sales Representative, Century 21 People’s Choice Realty Inc., Brokerage
(647) 576 - 2100