

Century 21 People’s Choice Realty Inc., Brokerage
120 MATHESON BLVD E #103
MISSISSAUGA, Ontario
L4K 0A4
Oshawa, Pinecrest, L1K 0E2
$949,900$000000
Listed by EXP REALTY.
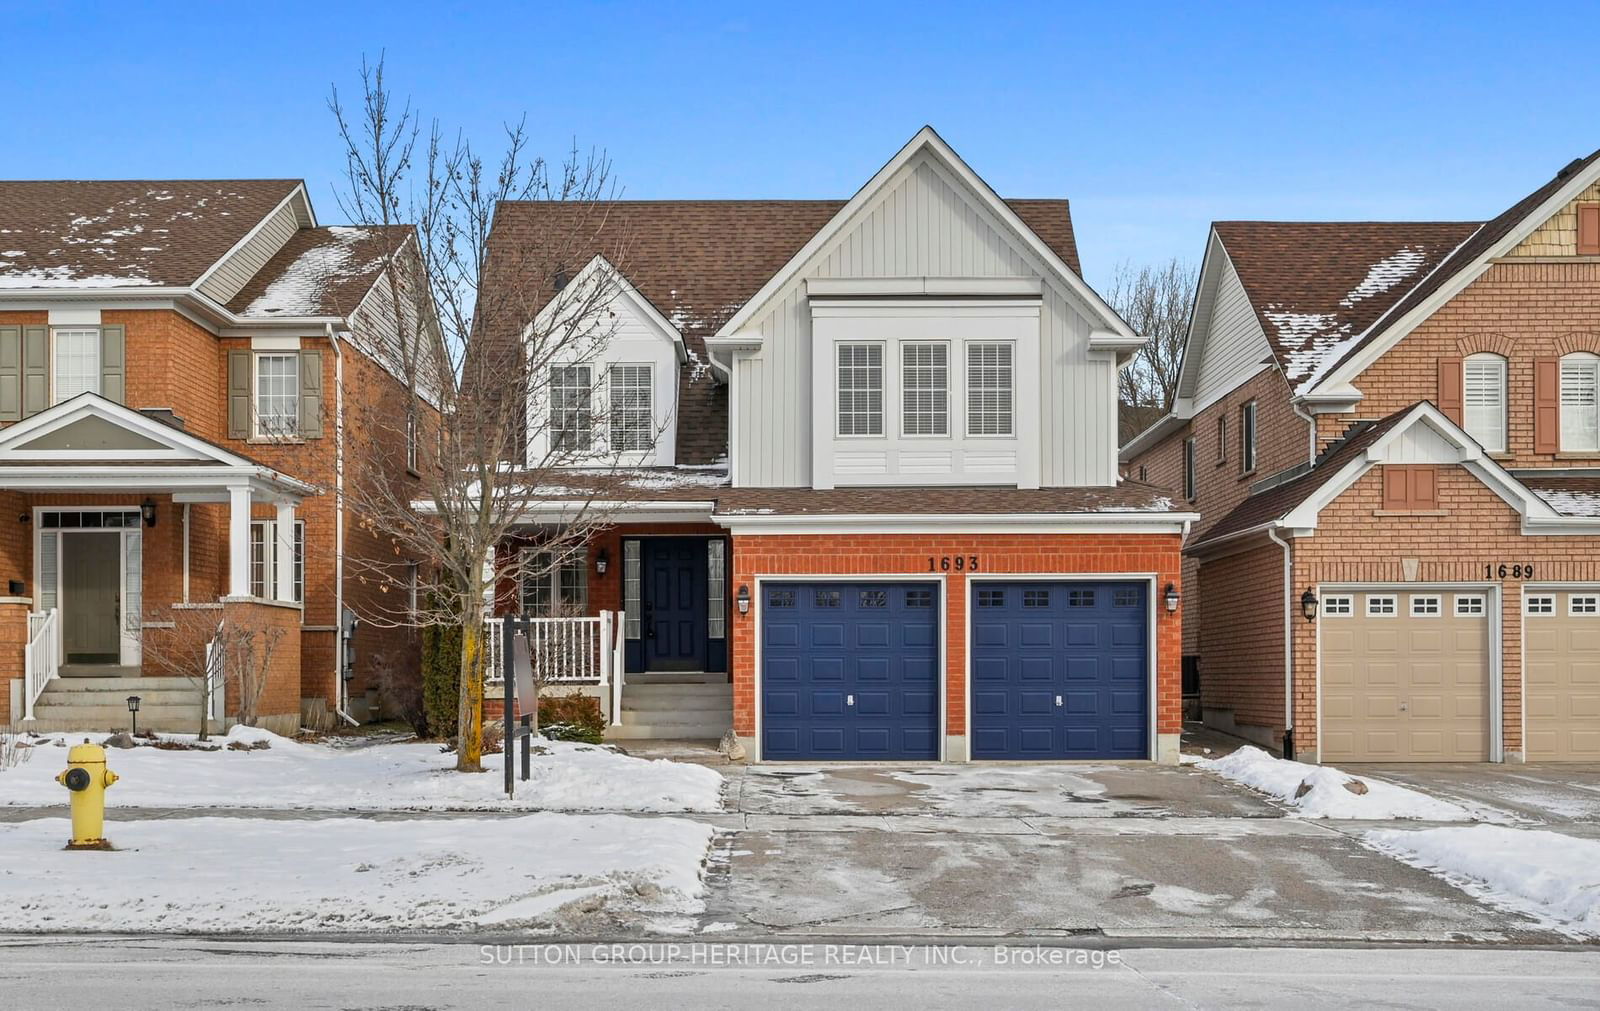
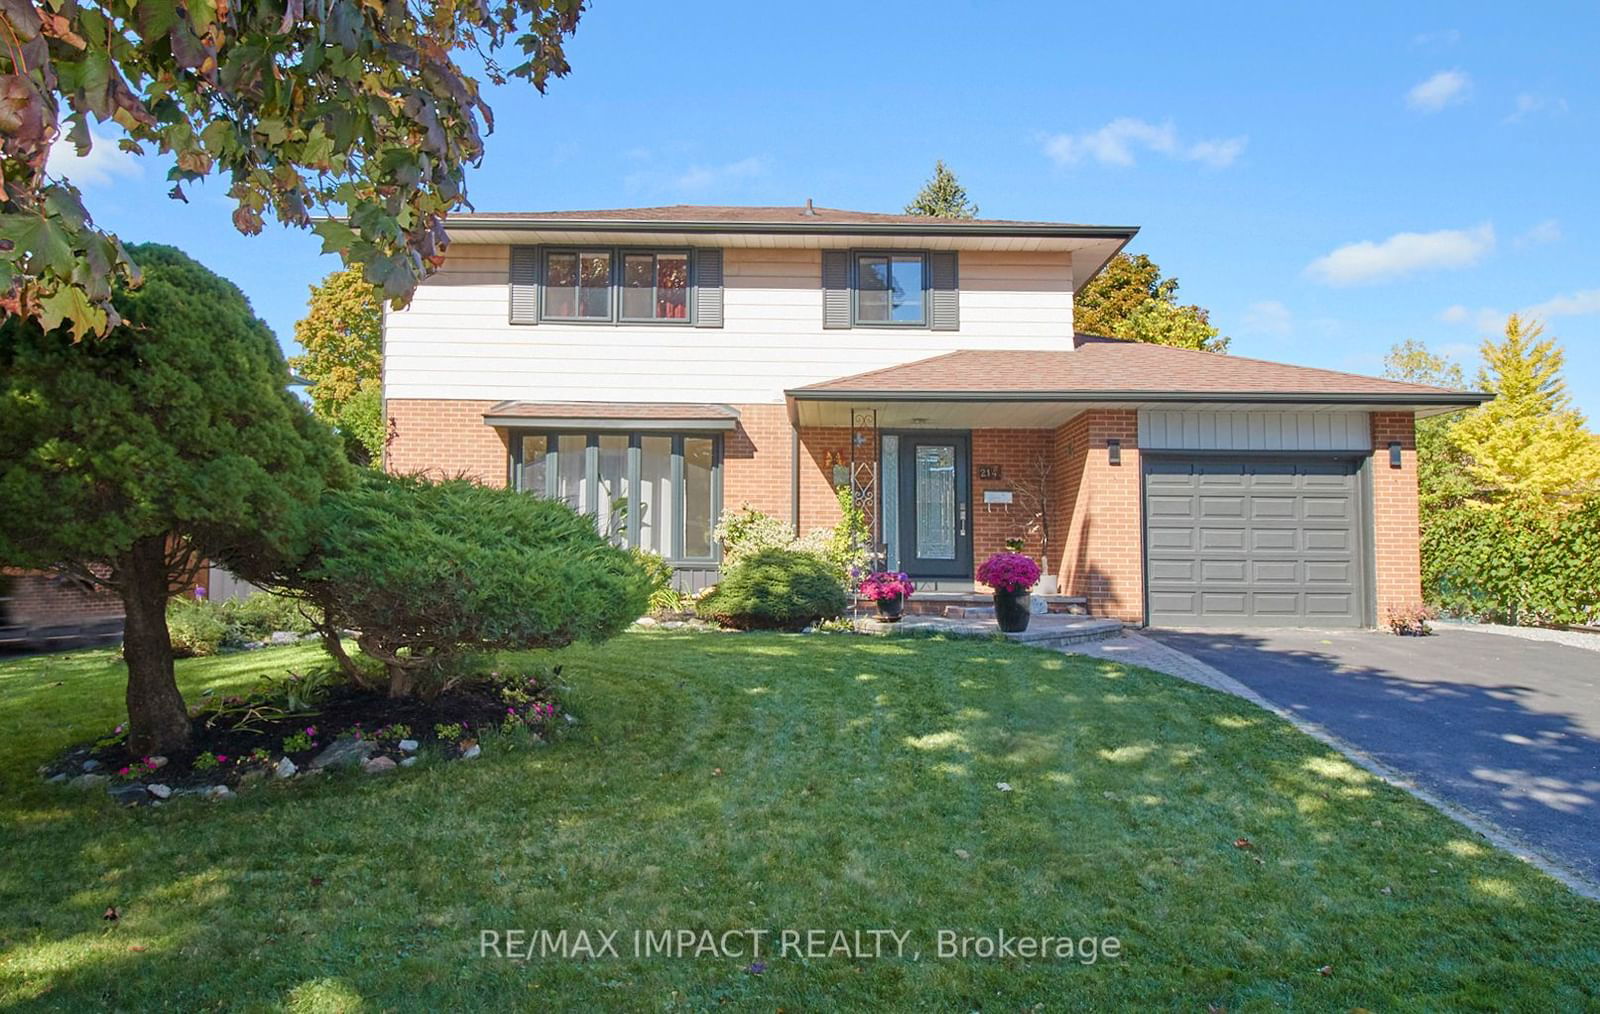
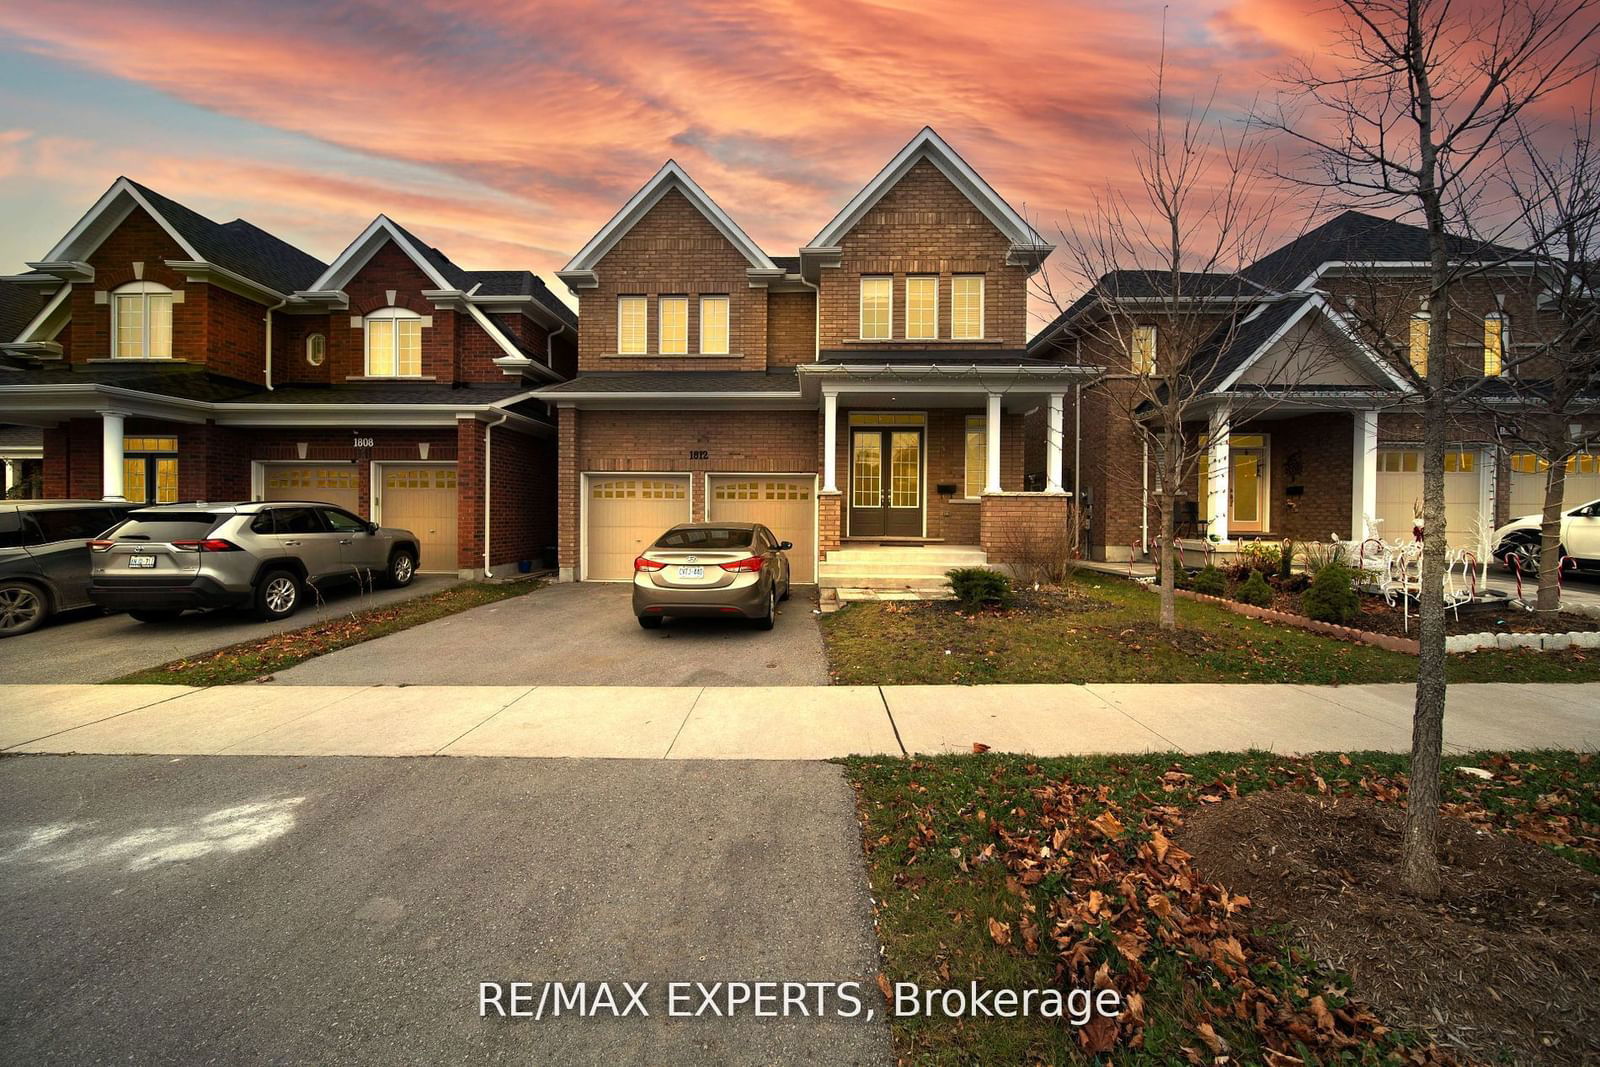
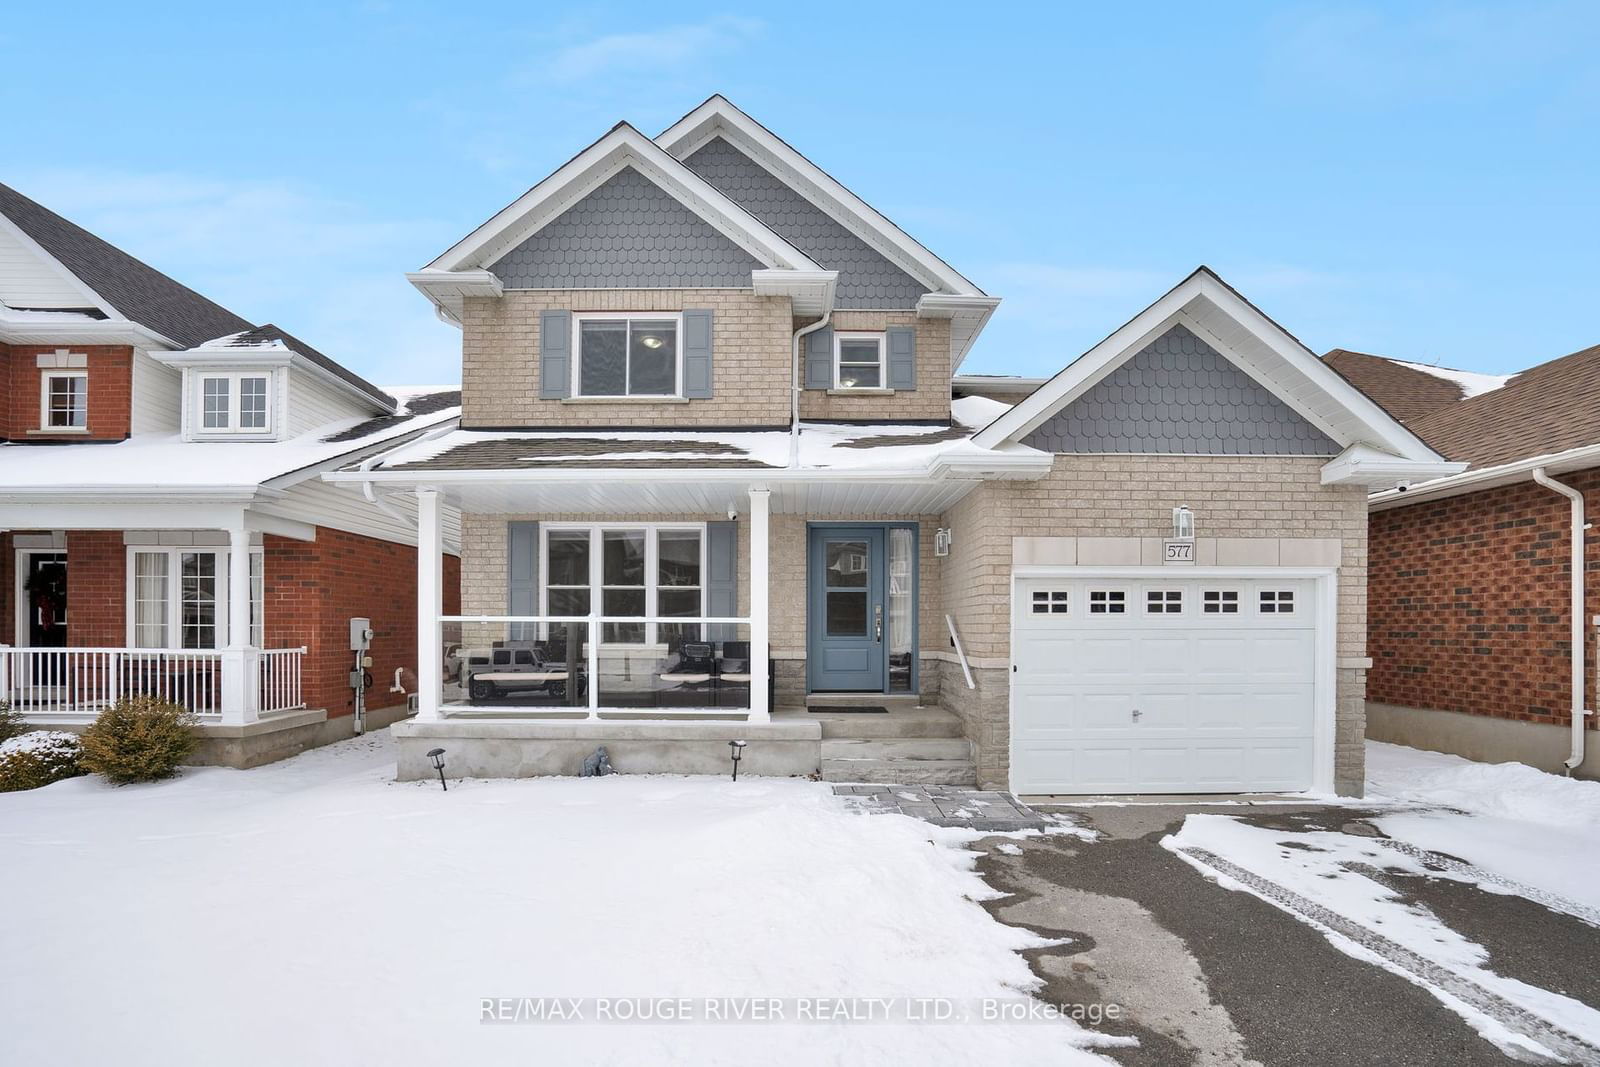
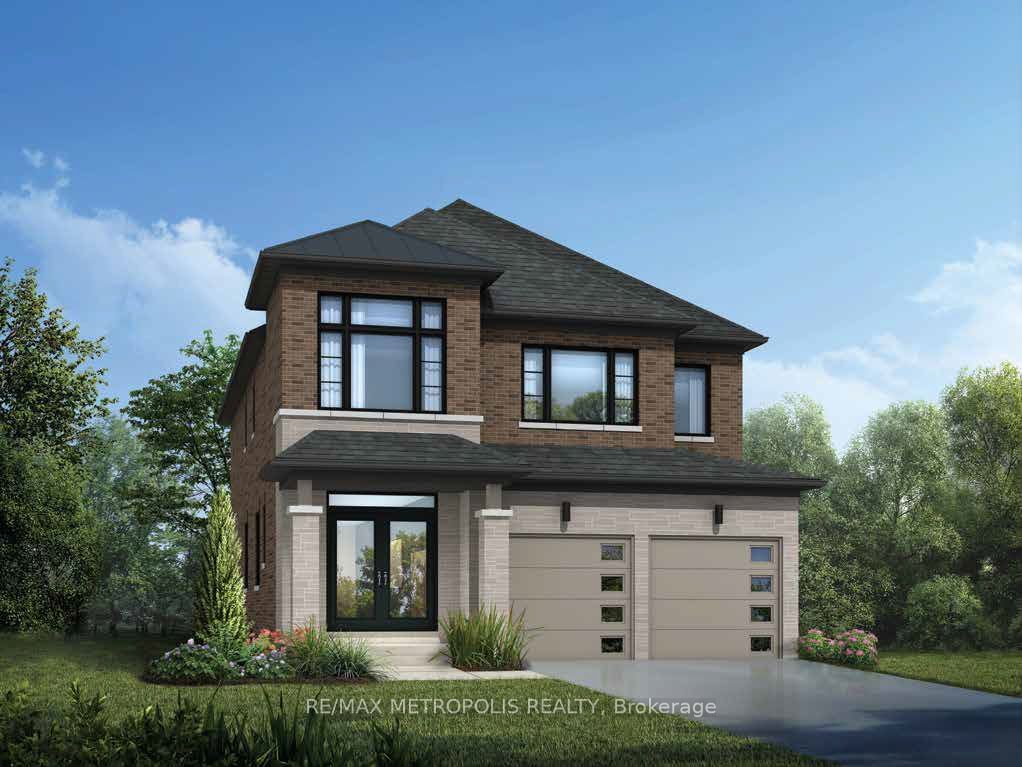
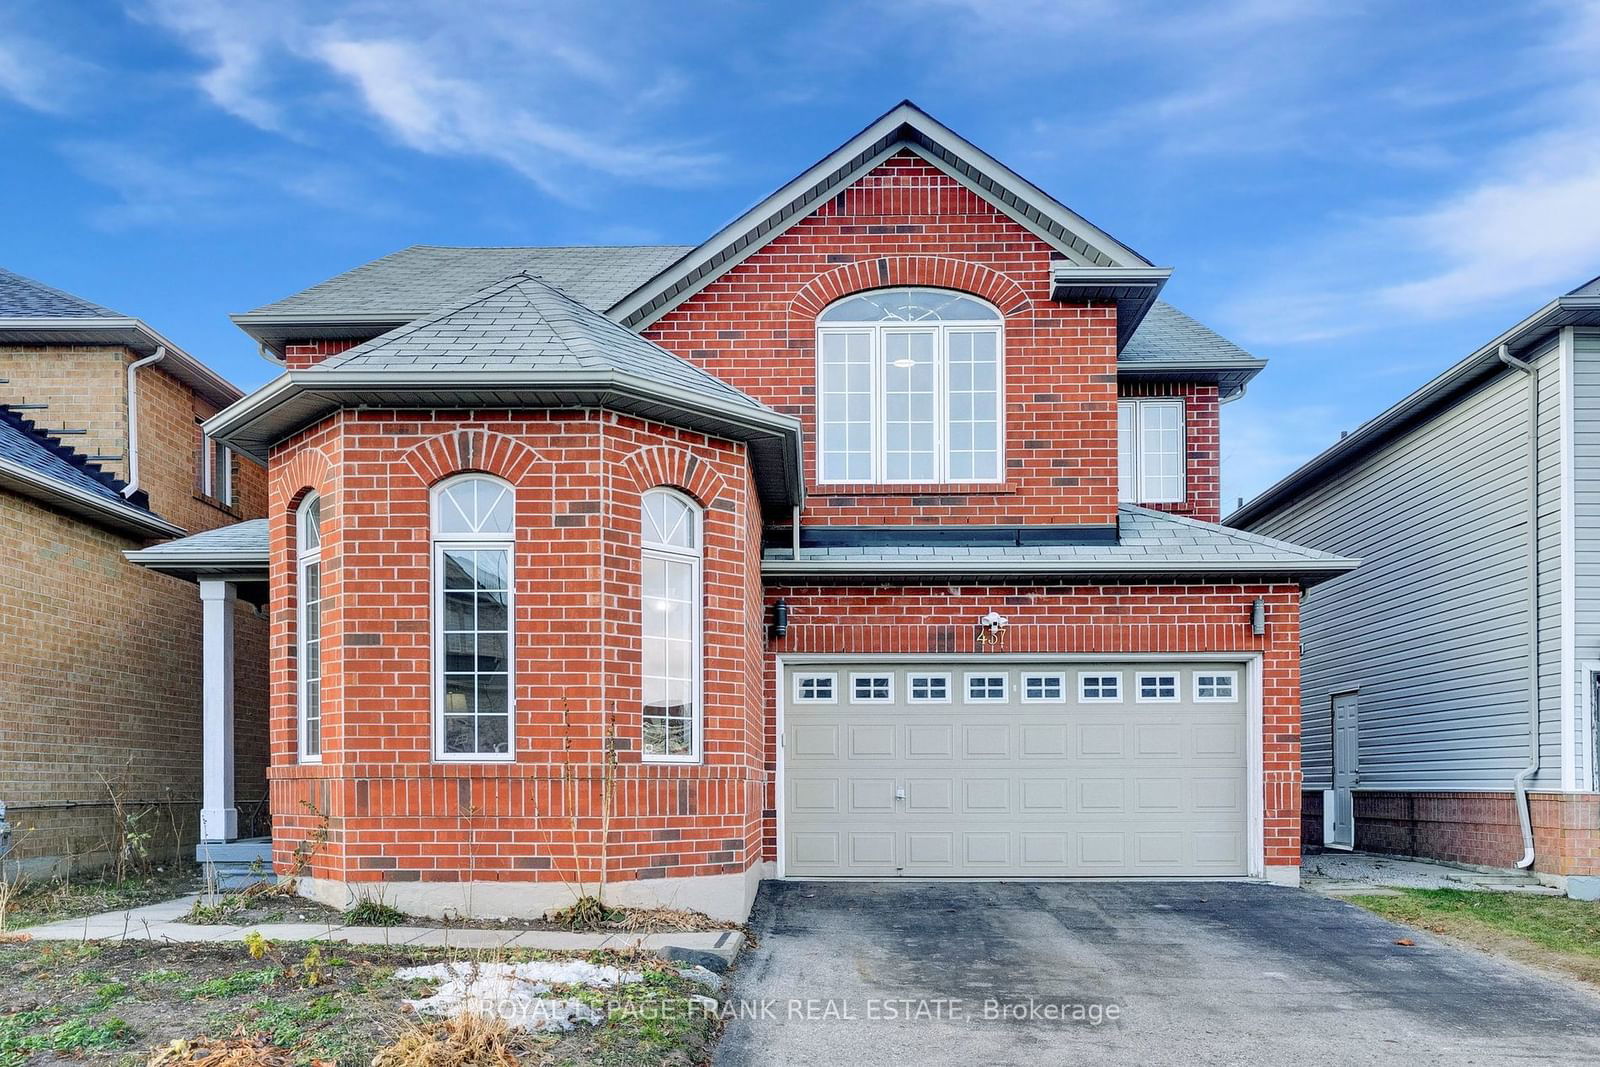
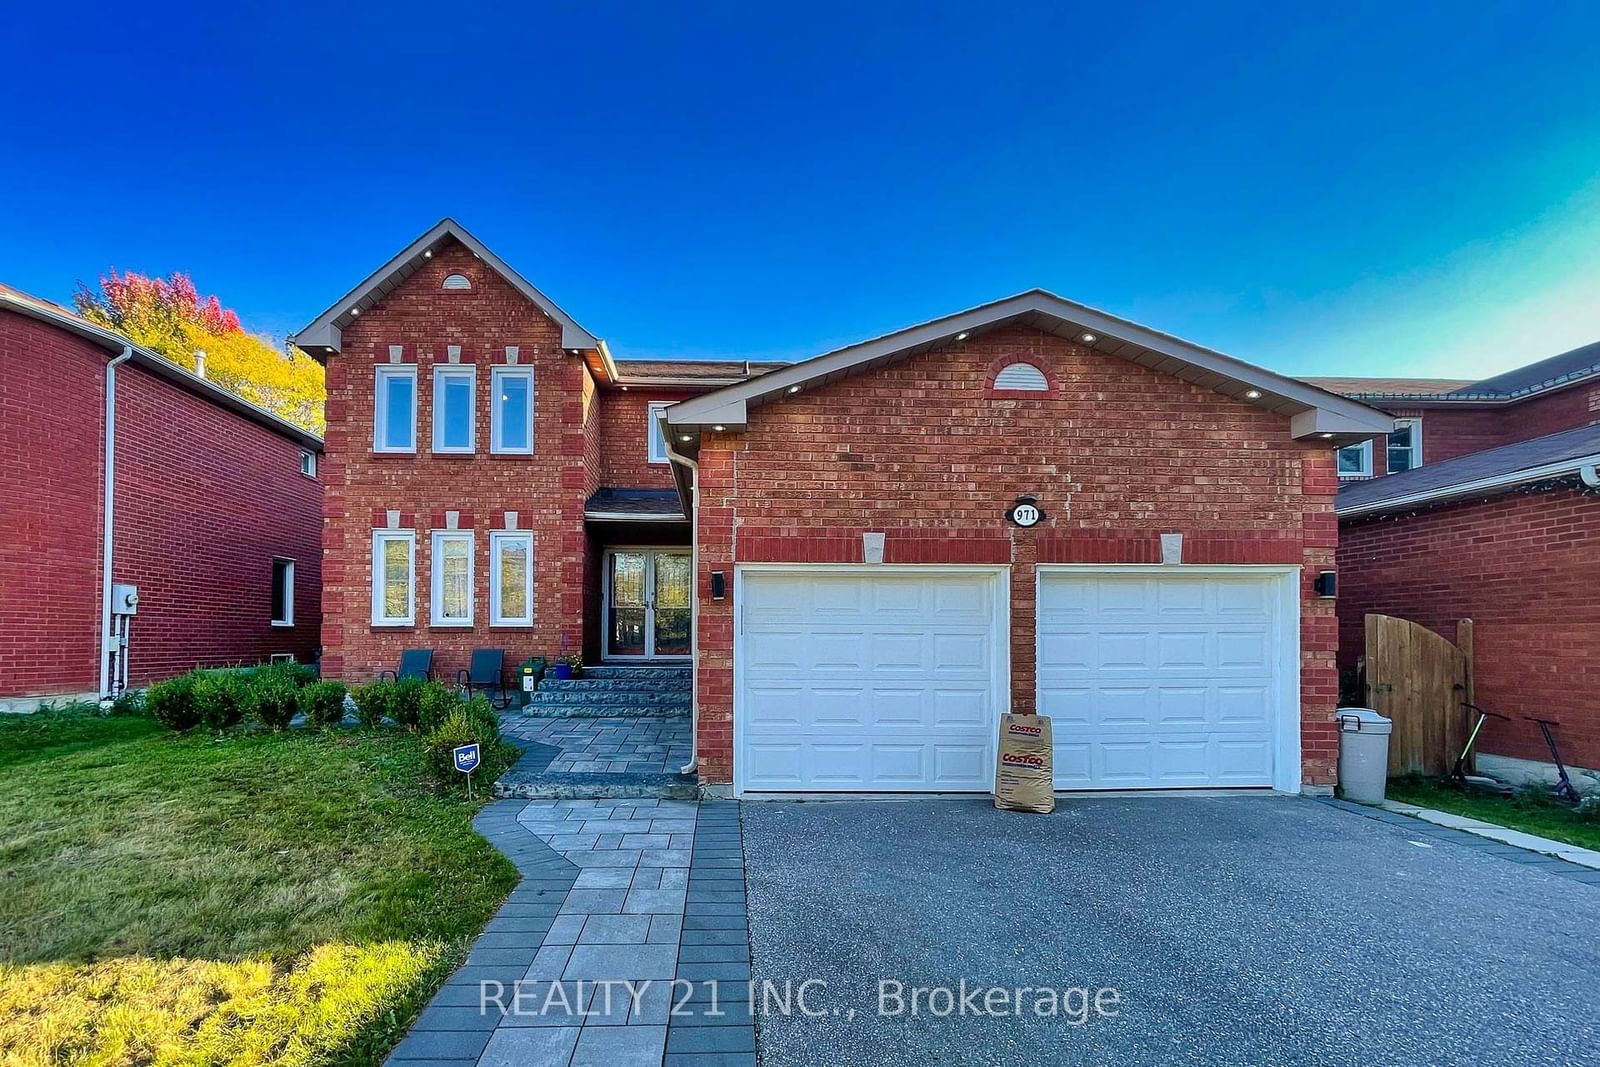
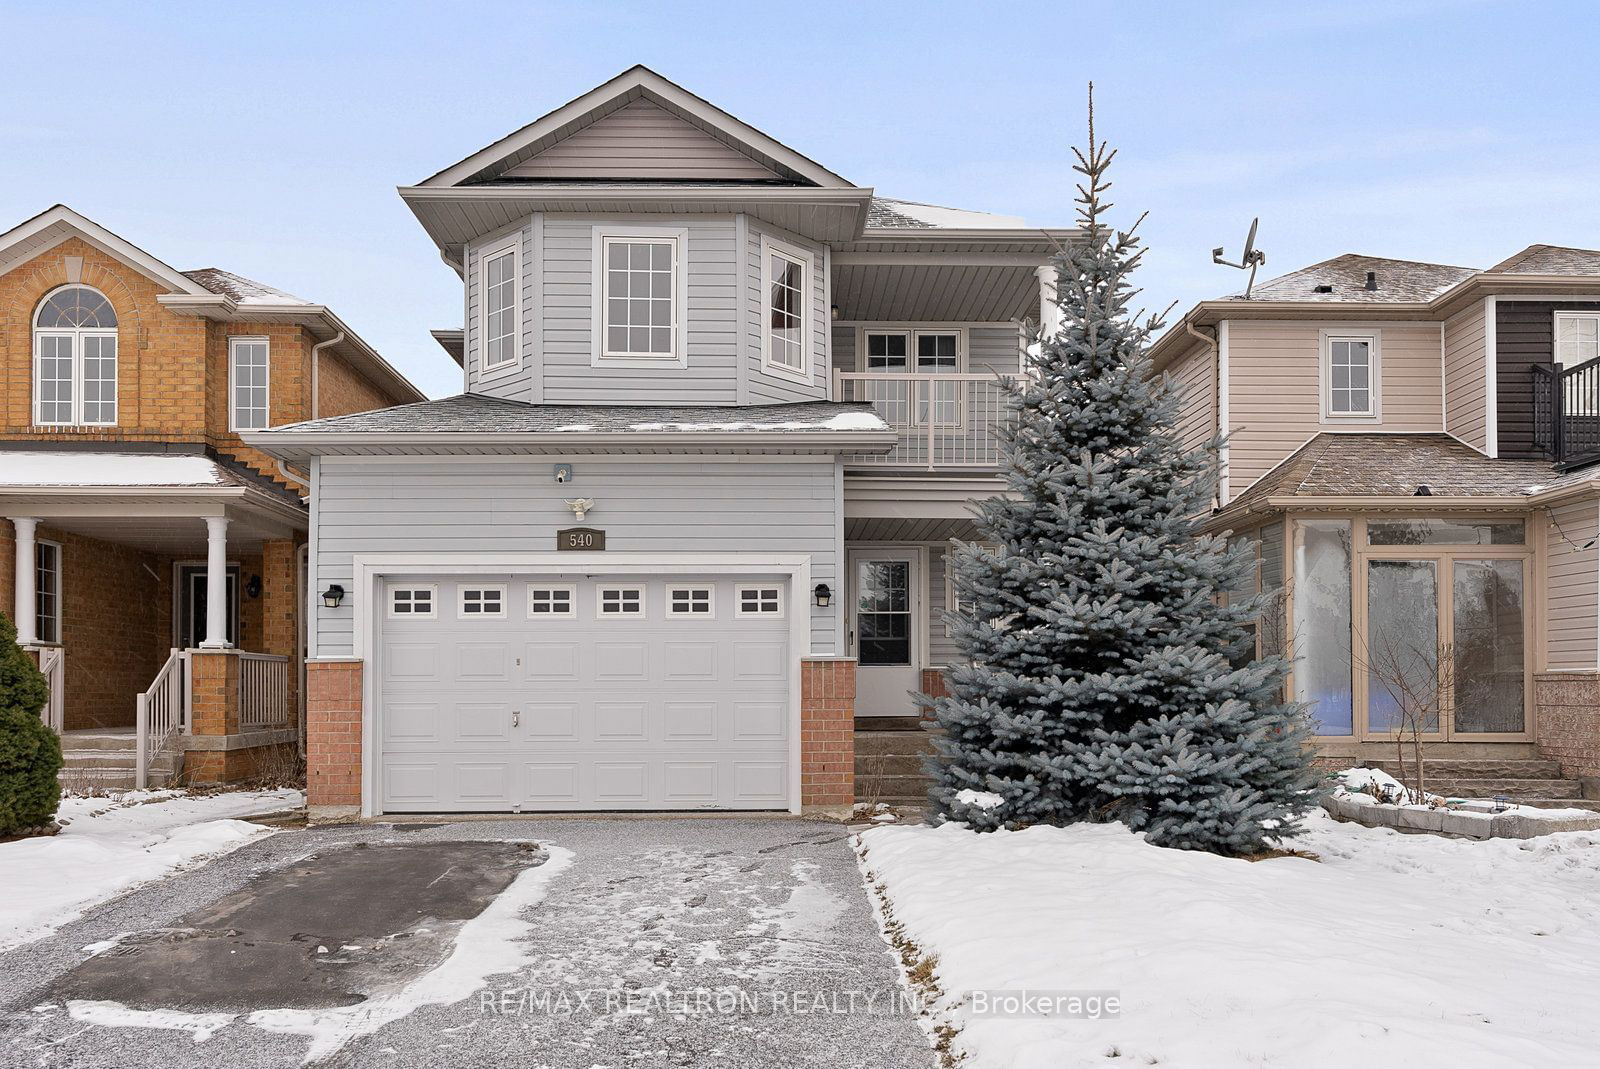
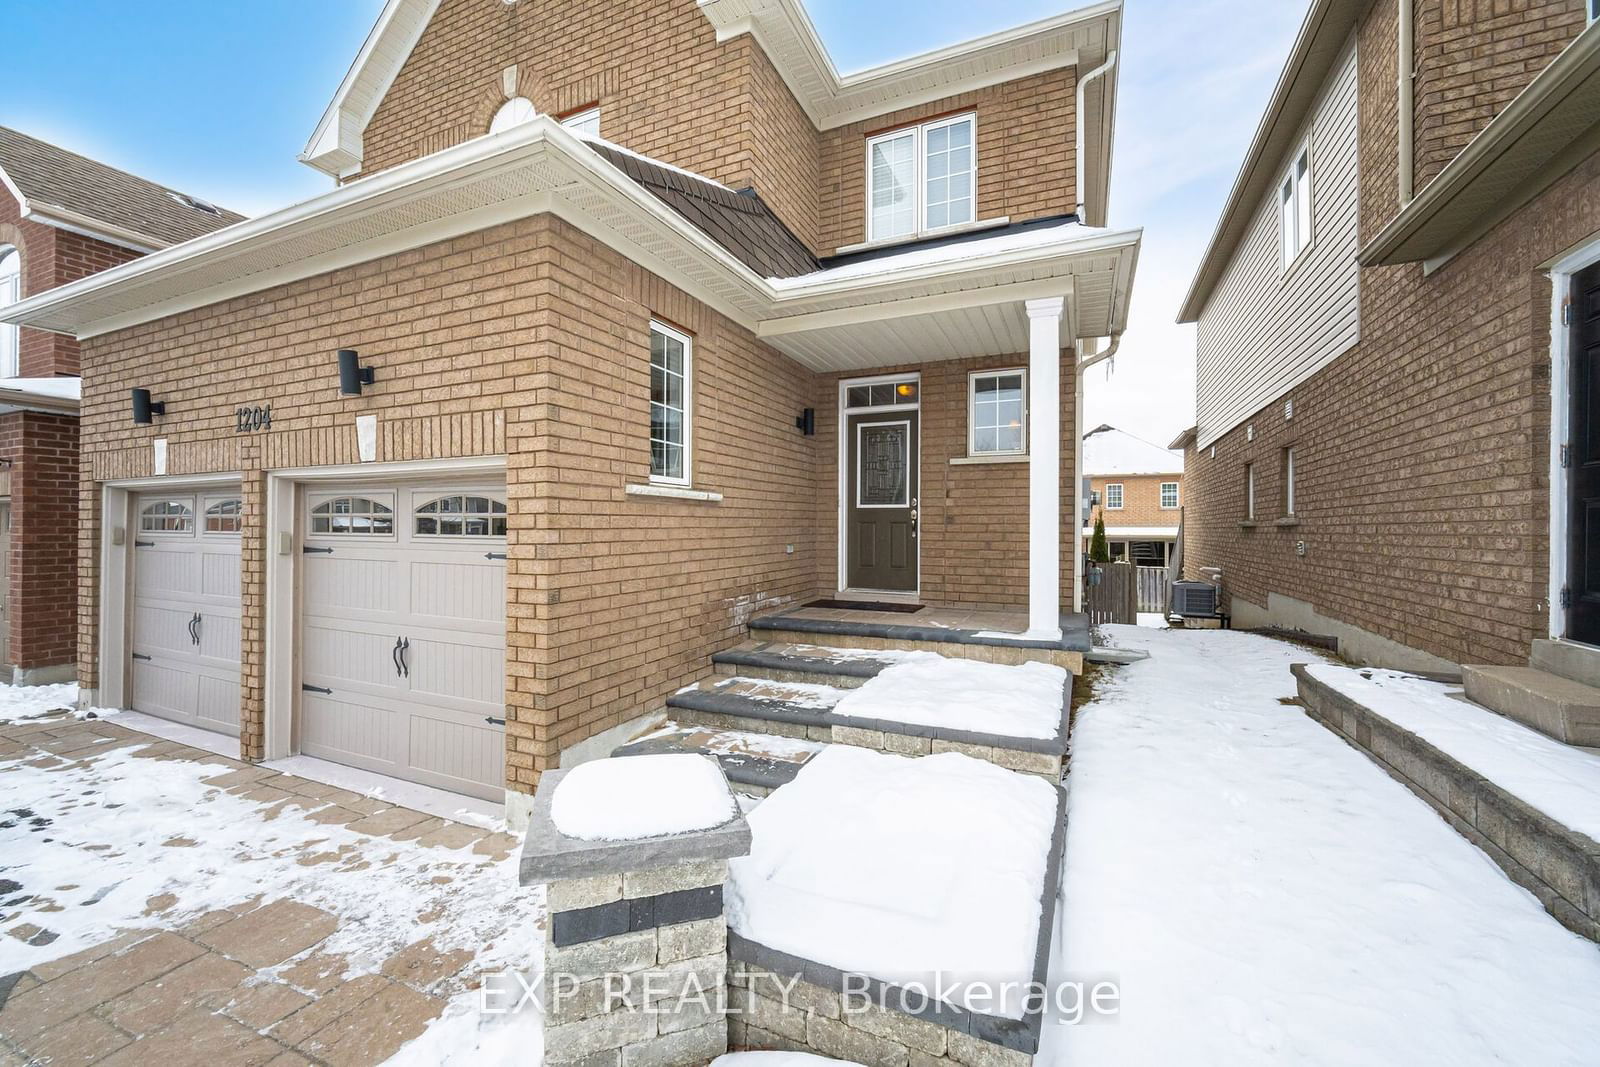
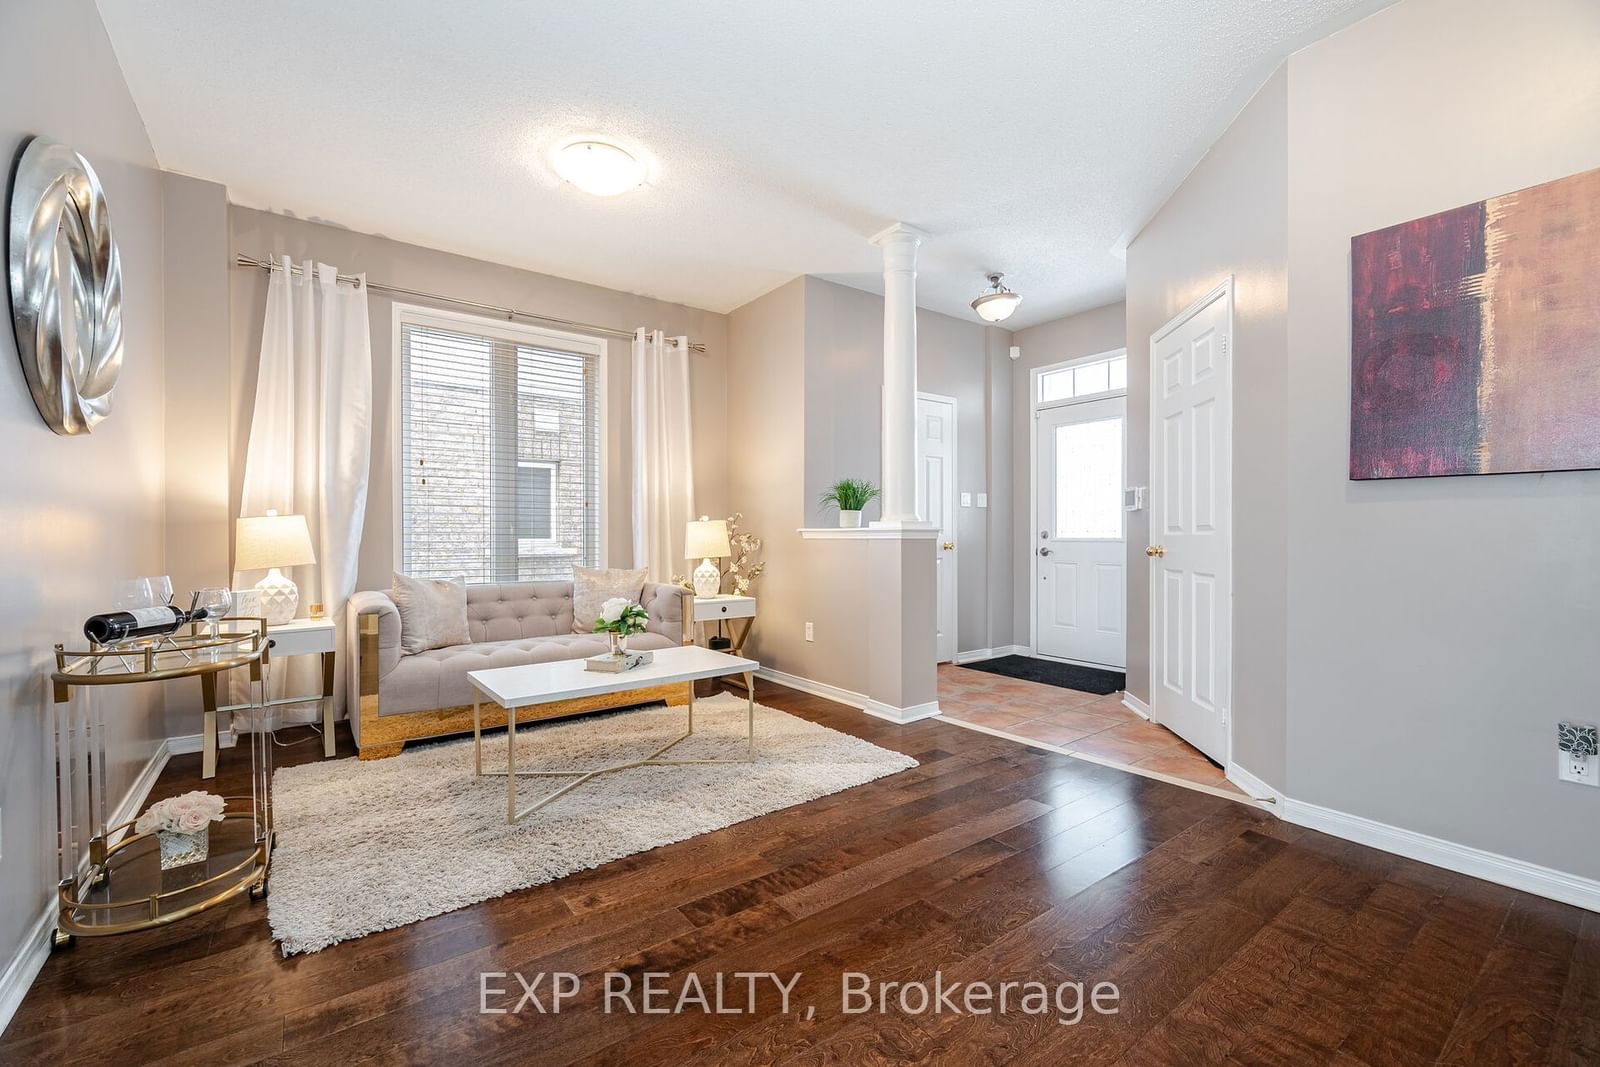
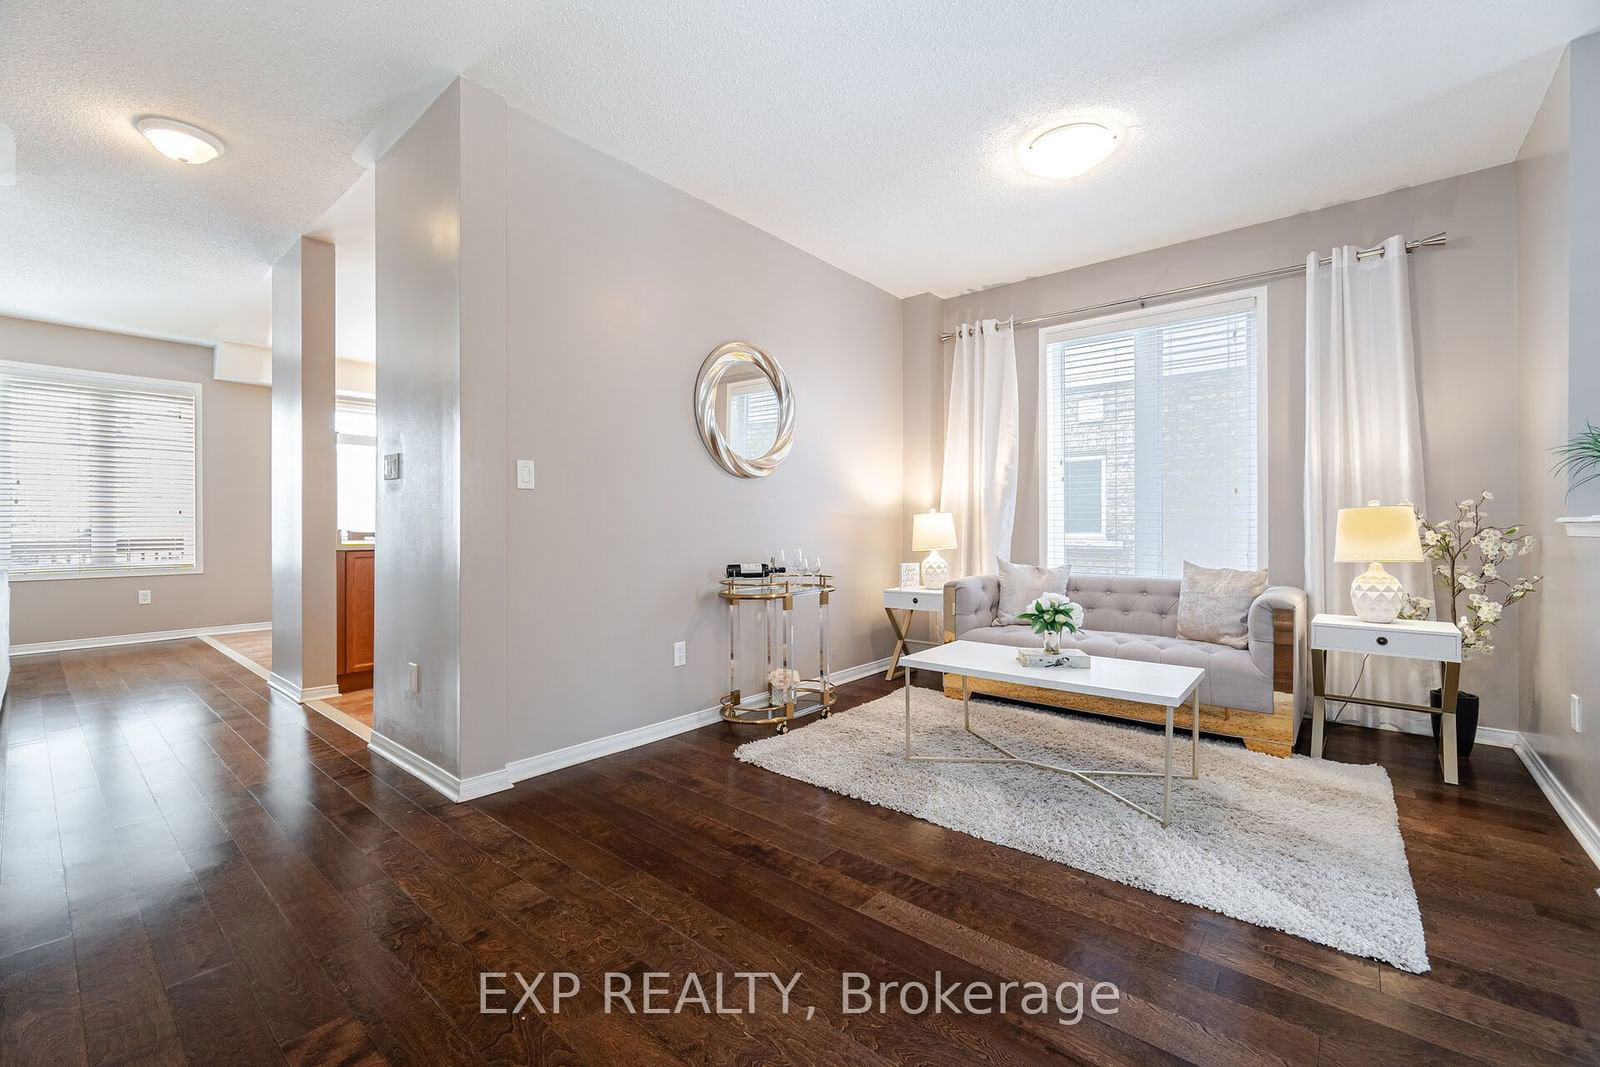
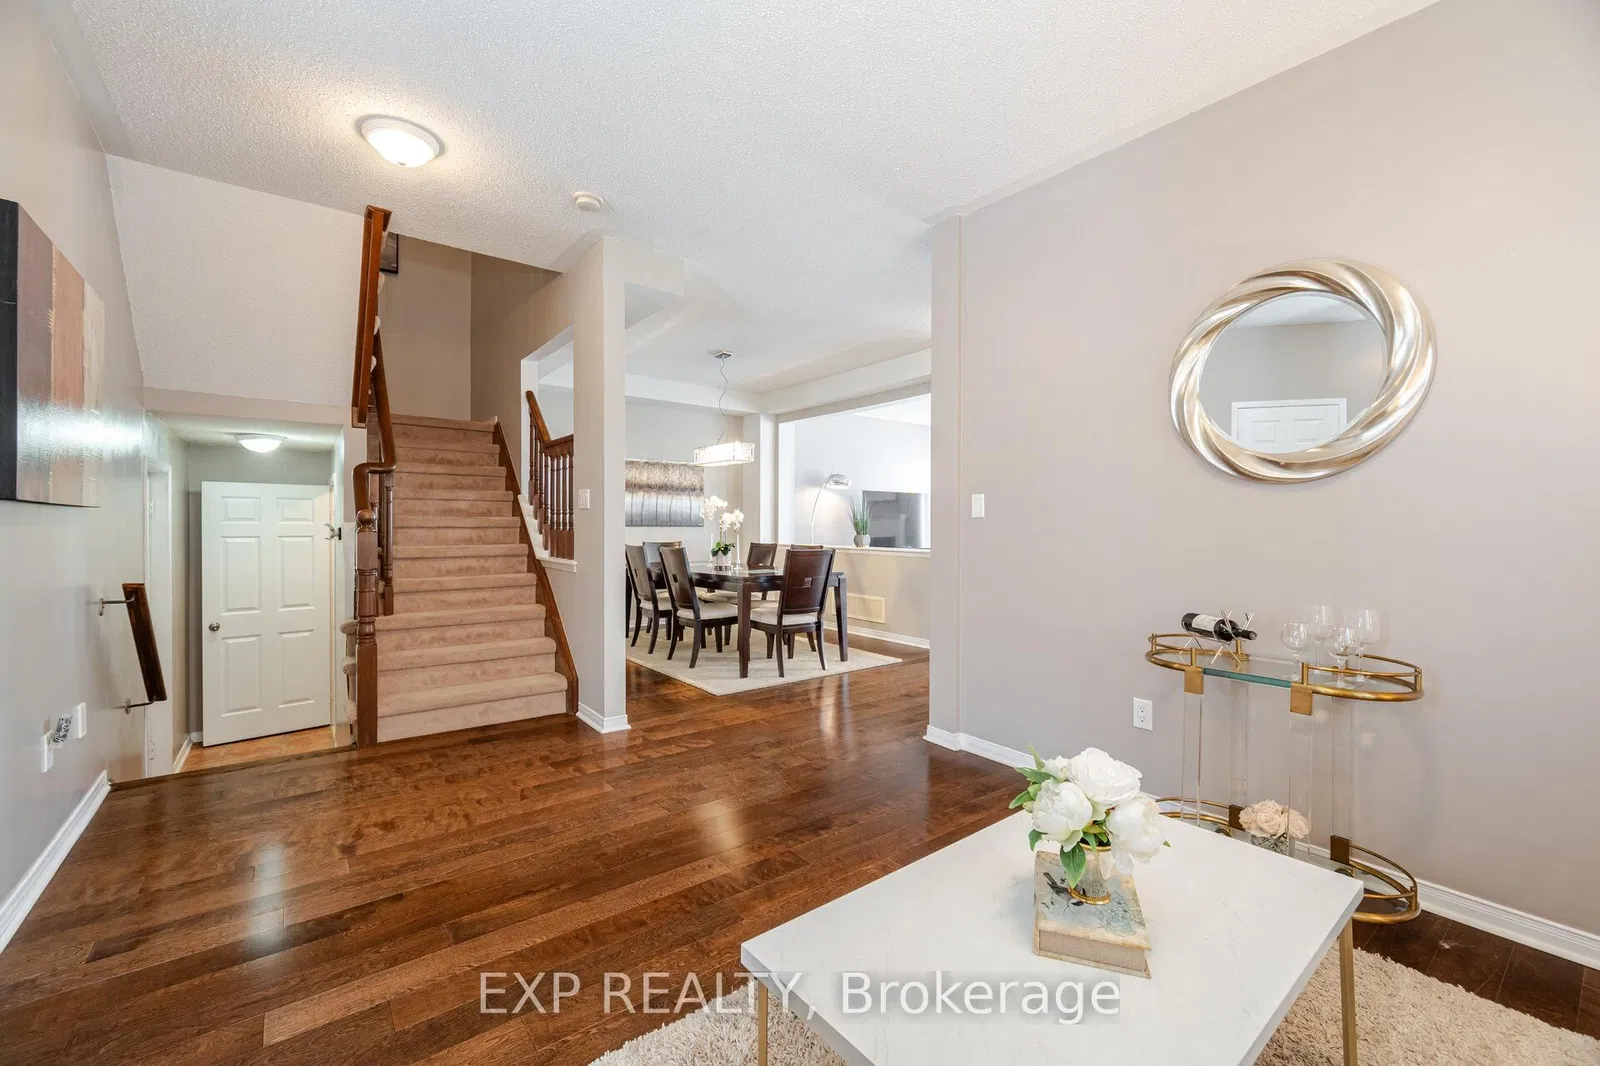
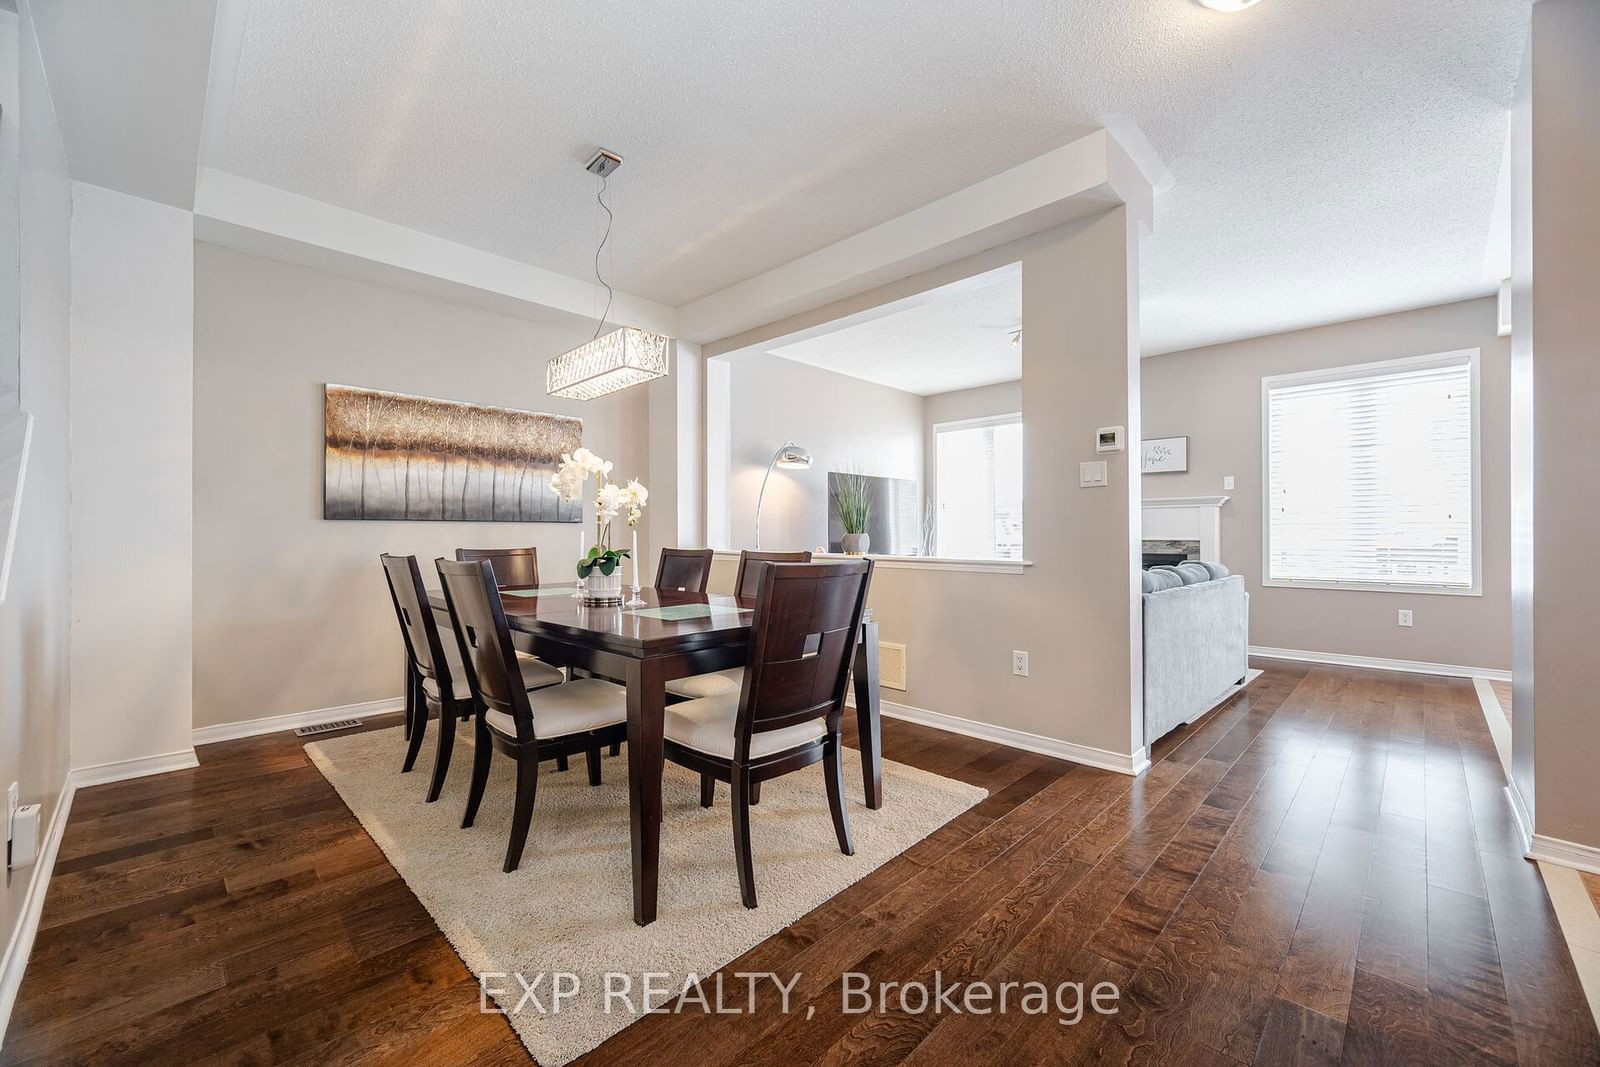
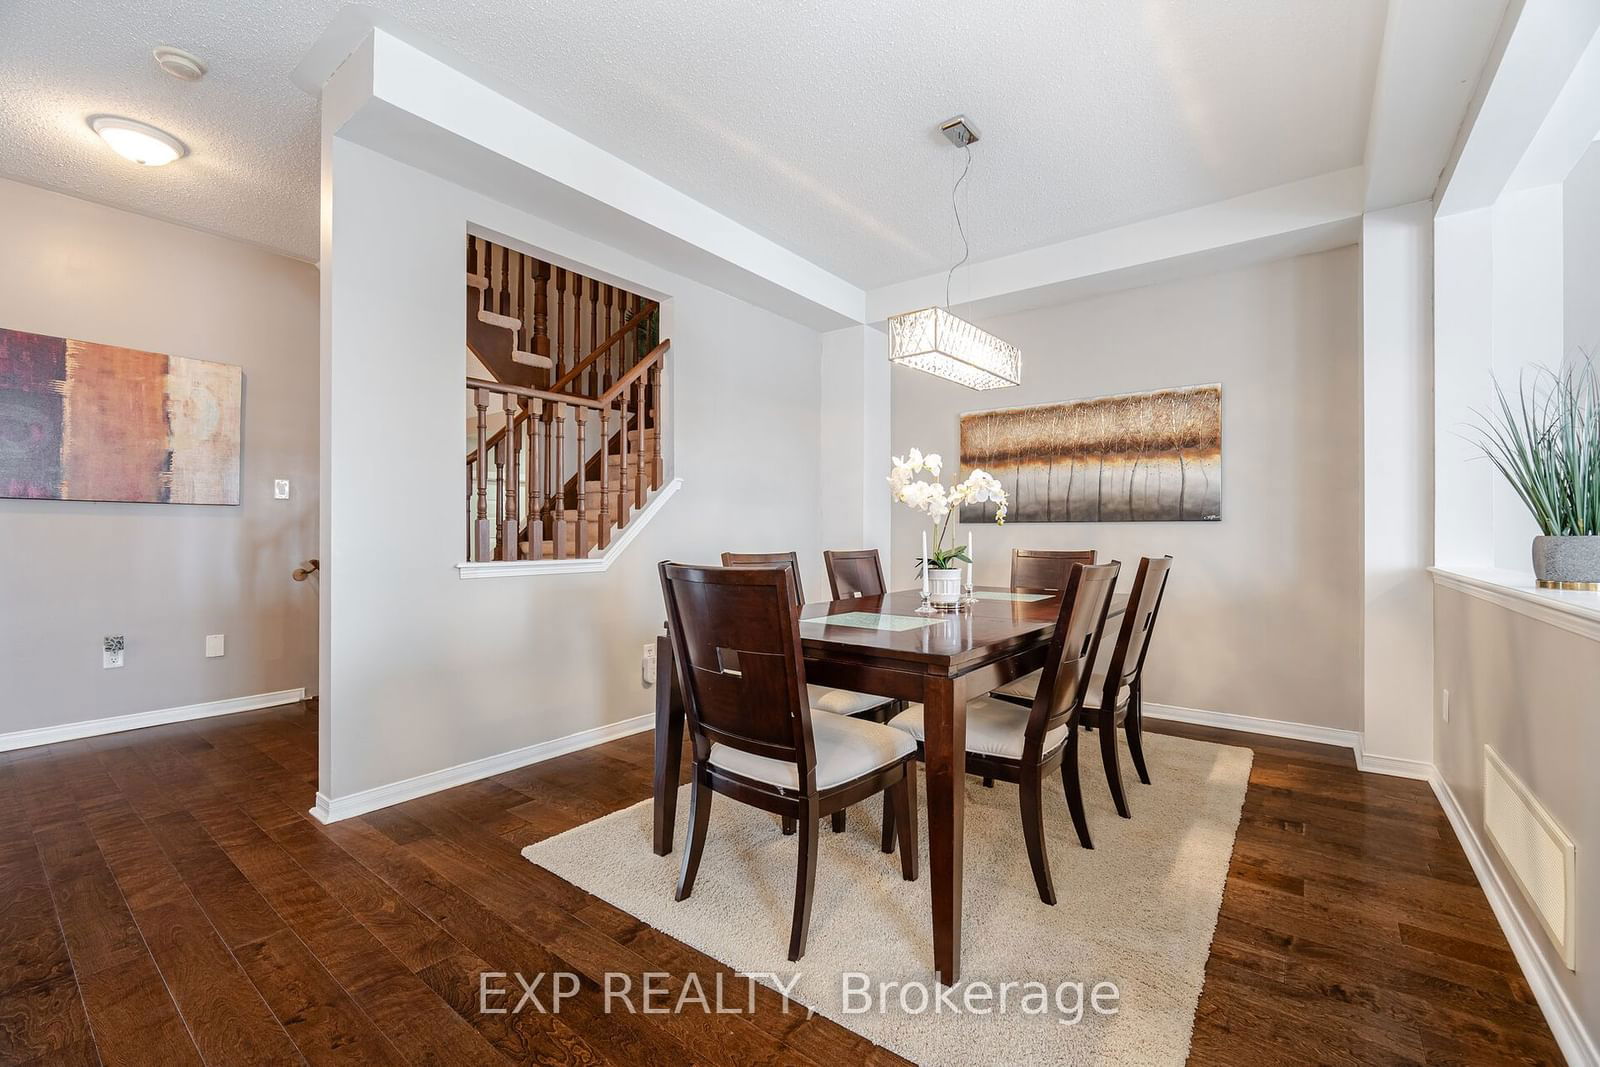
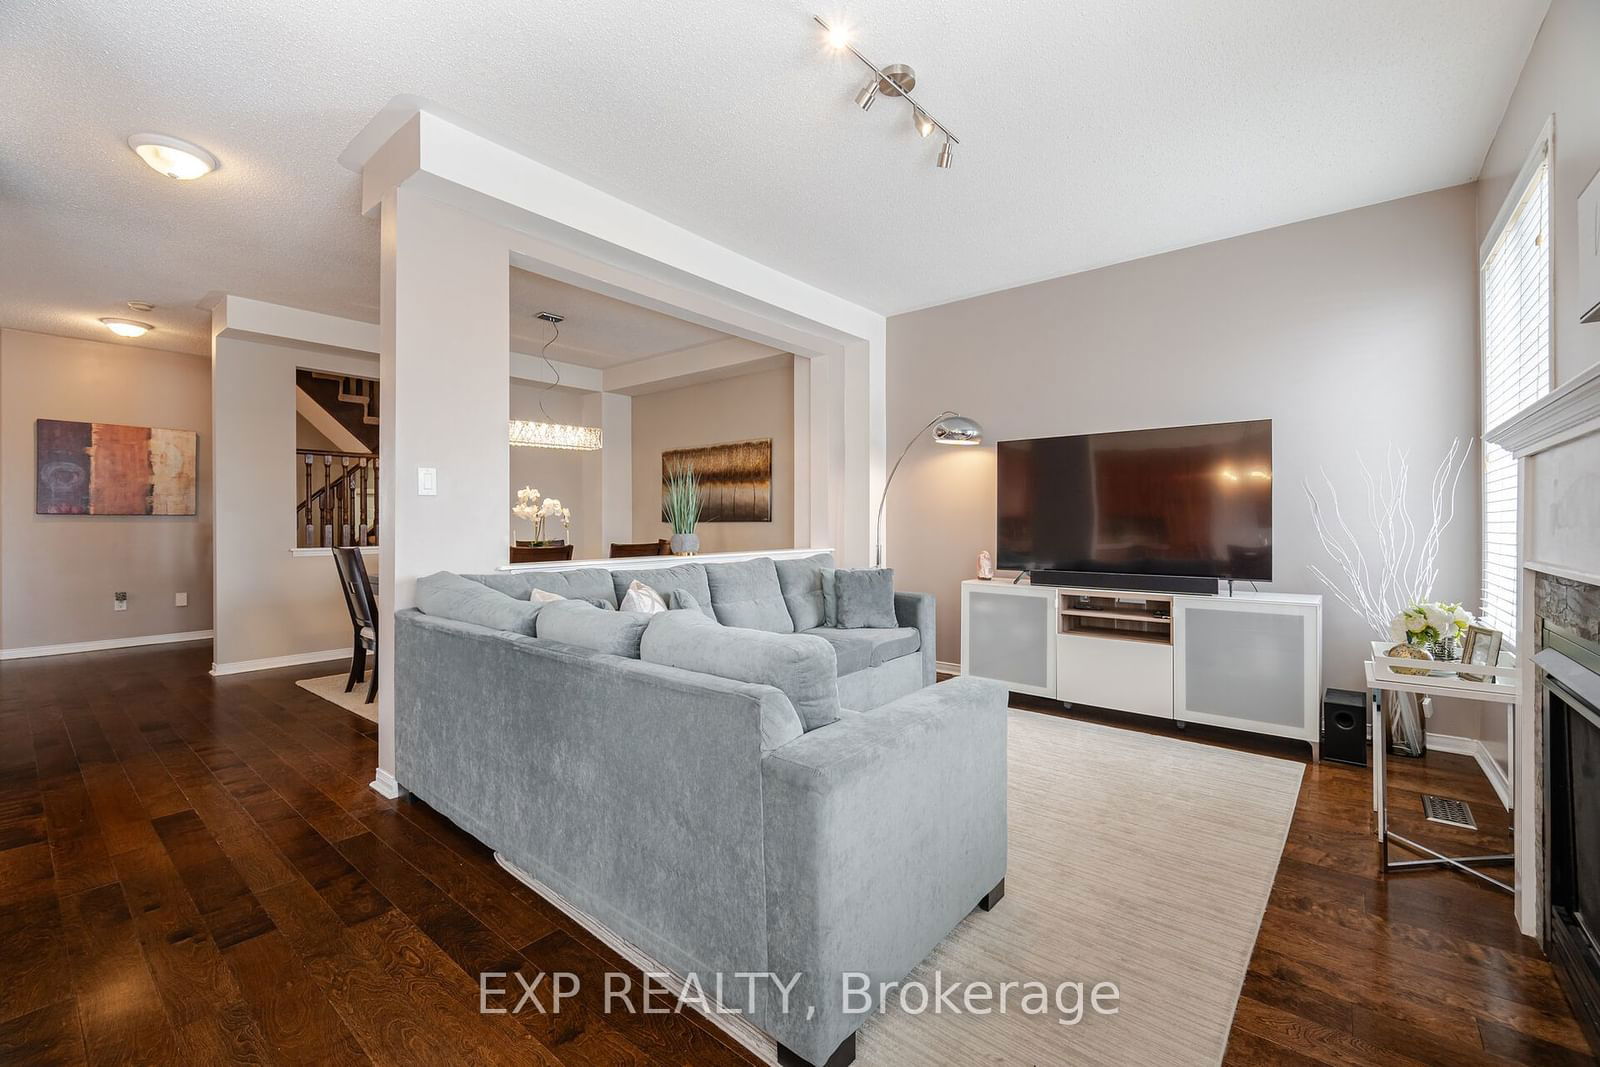
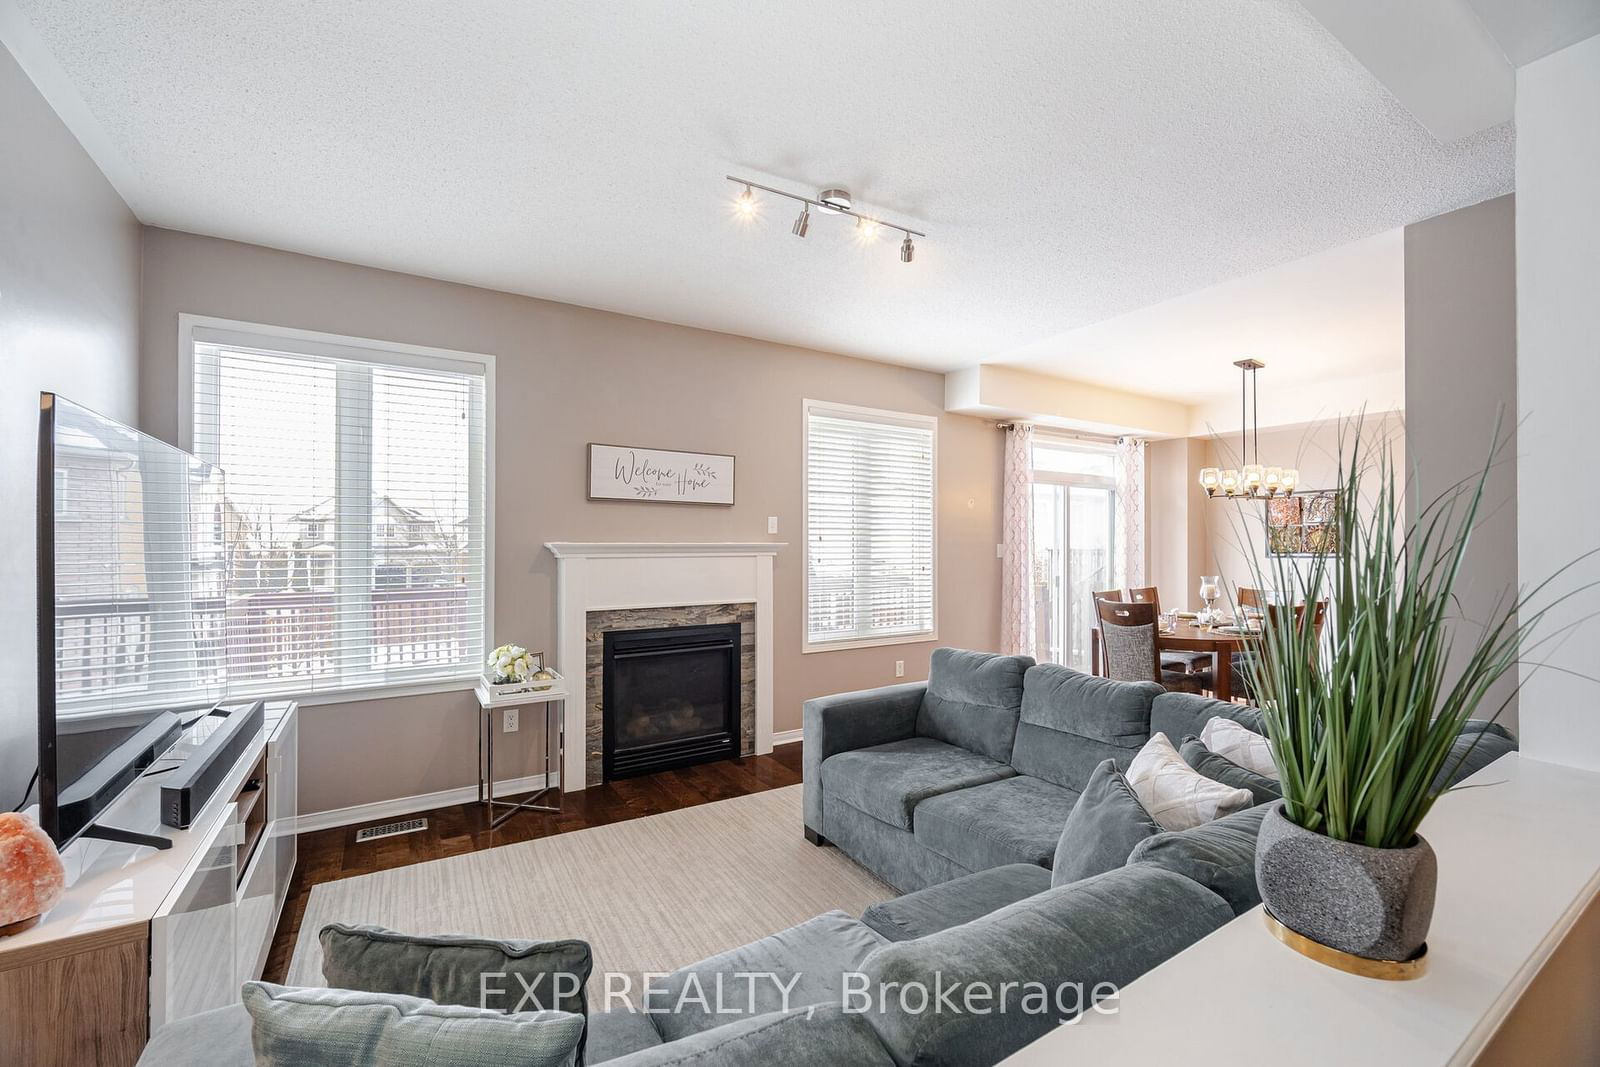
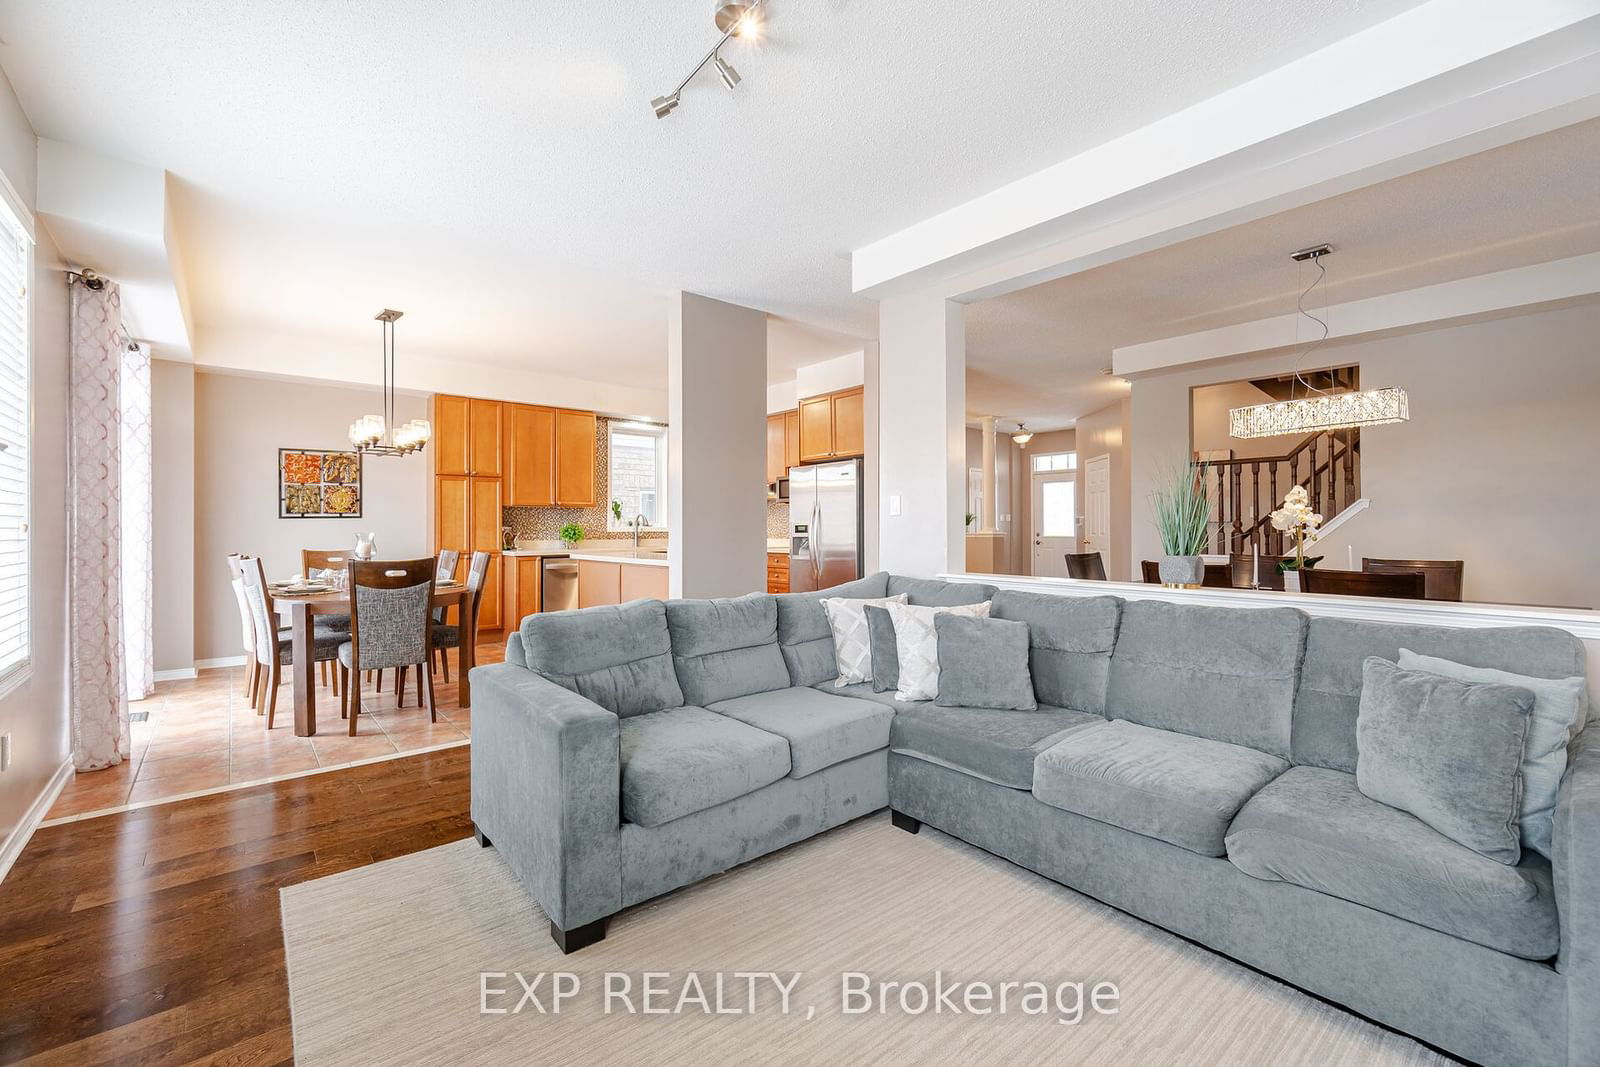
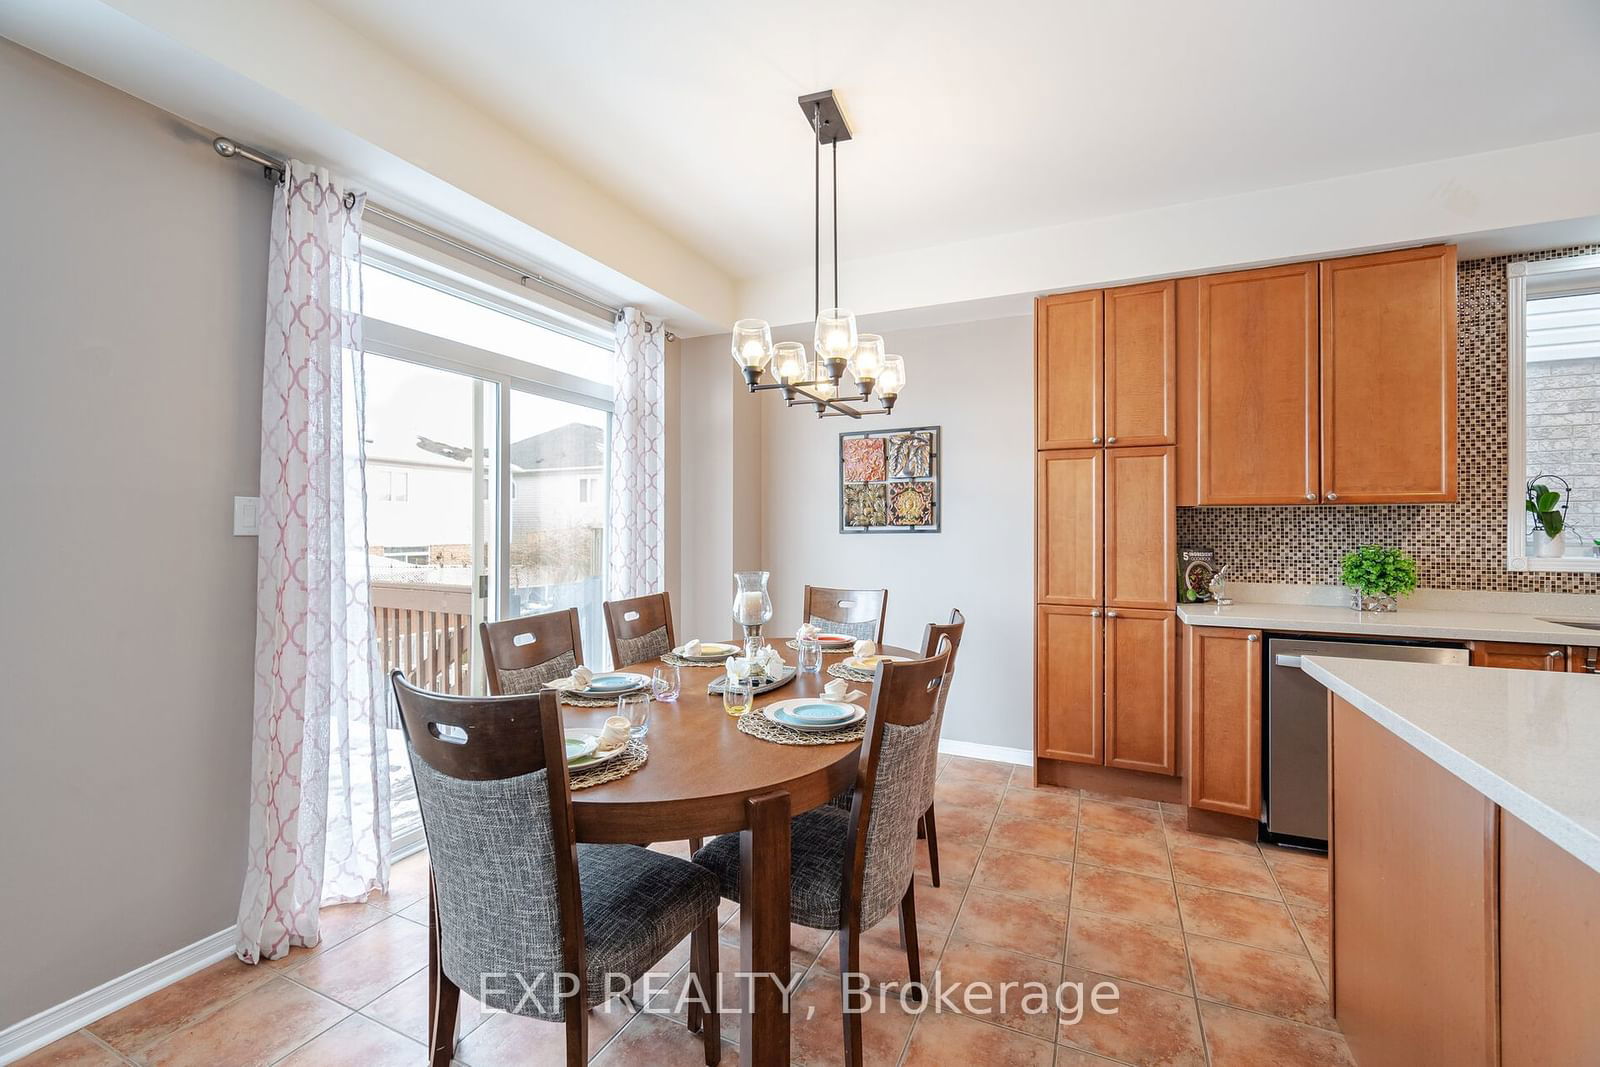
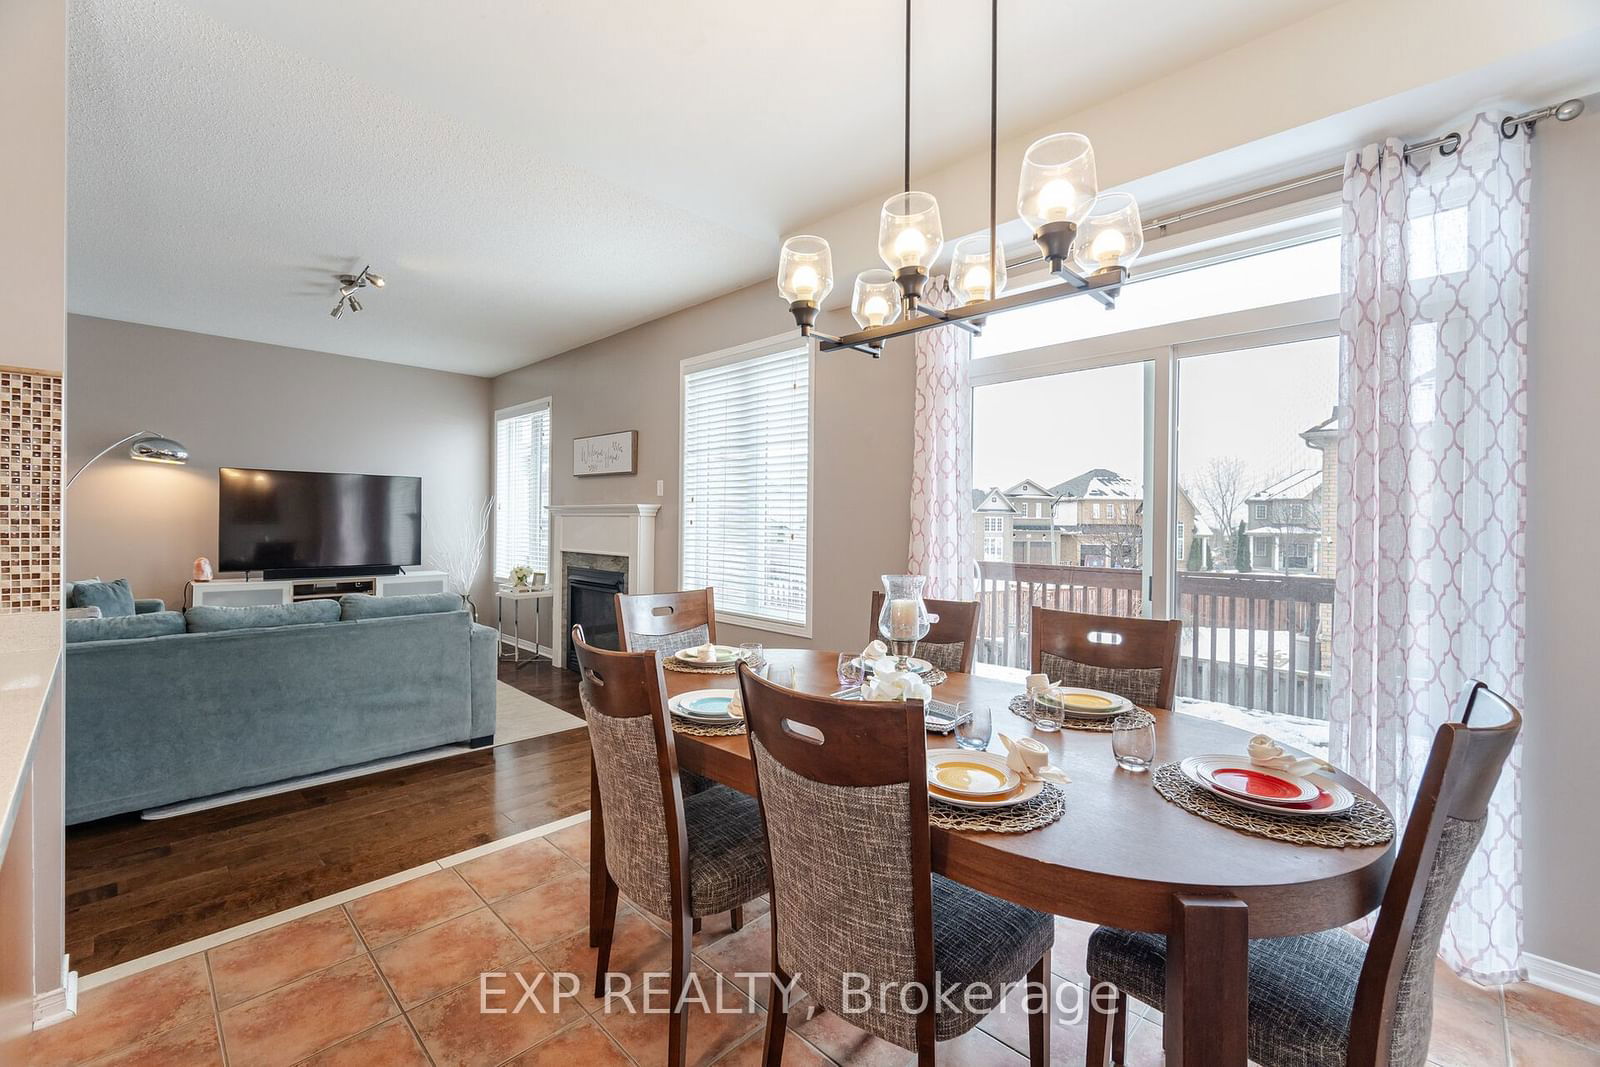
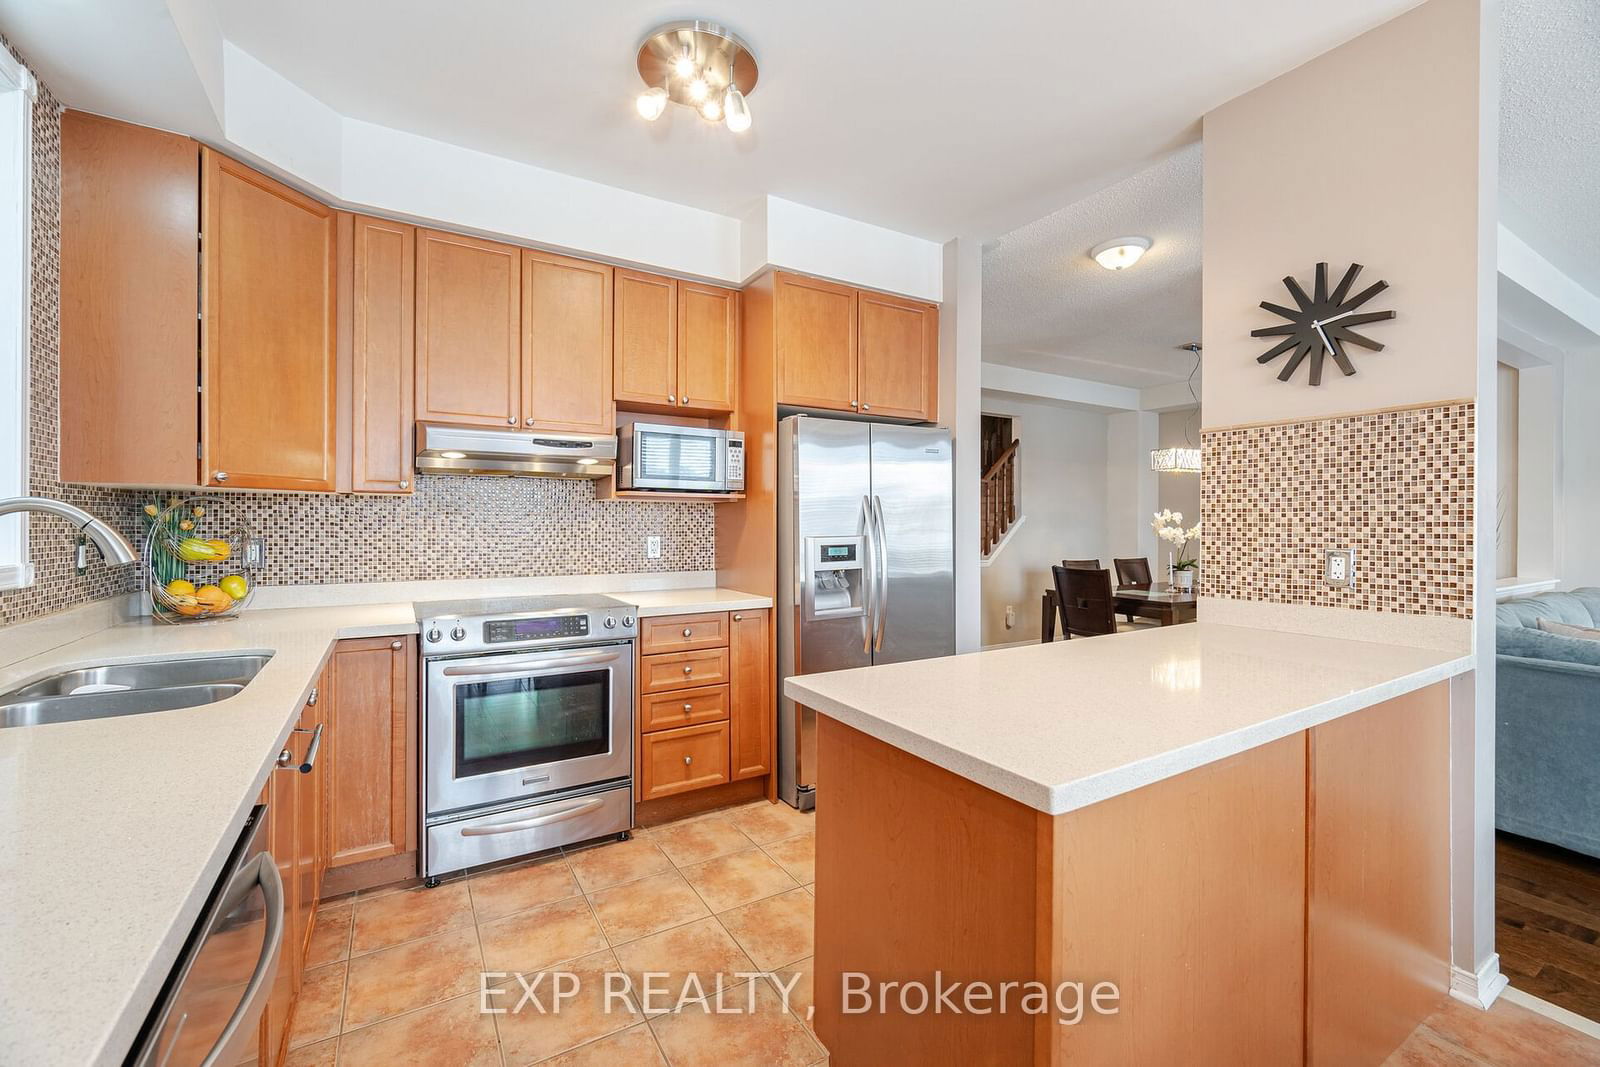
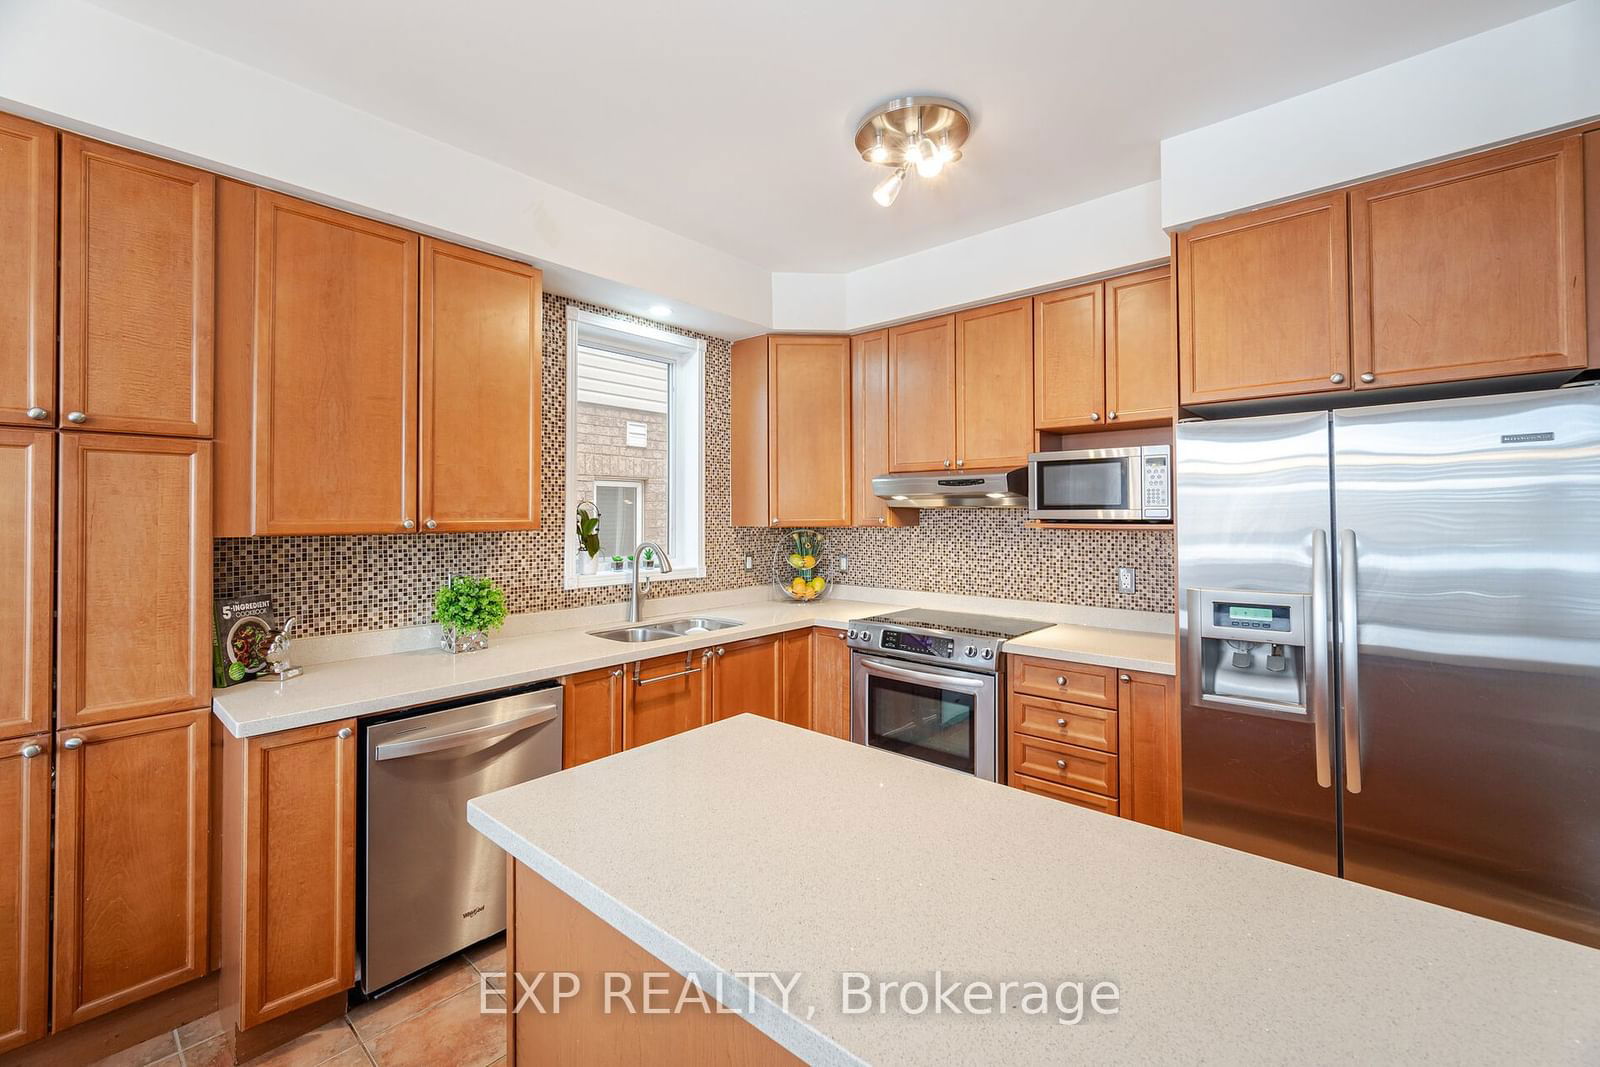
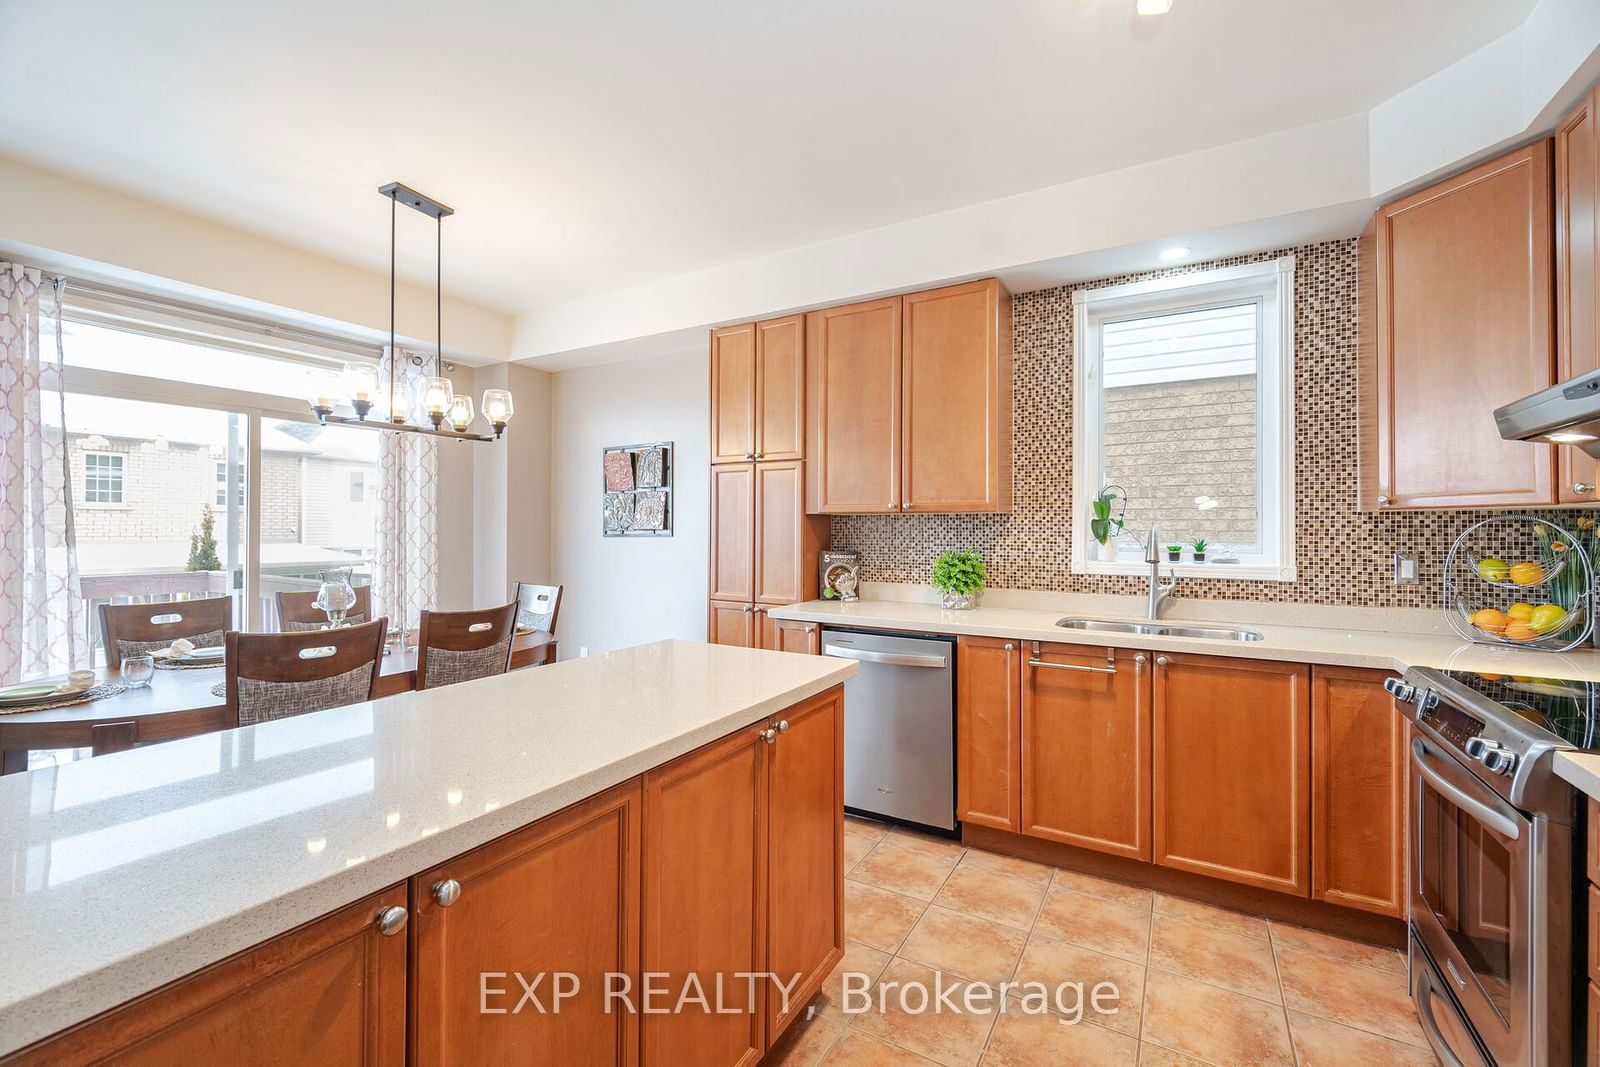
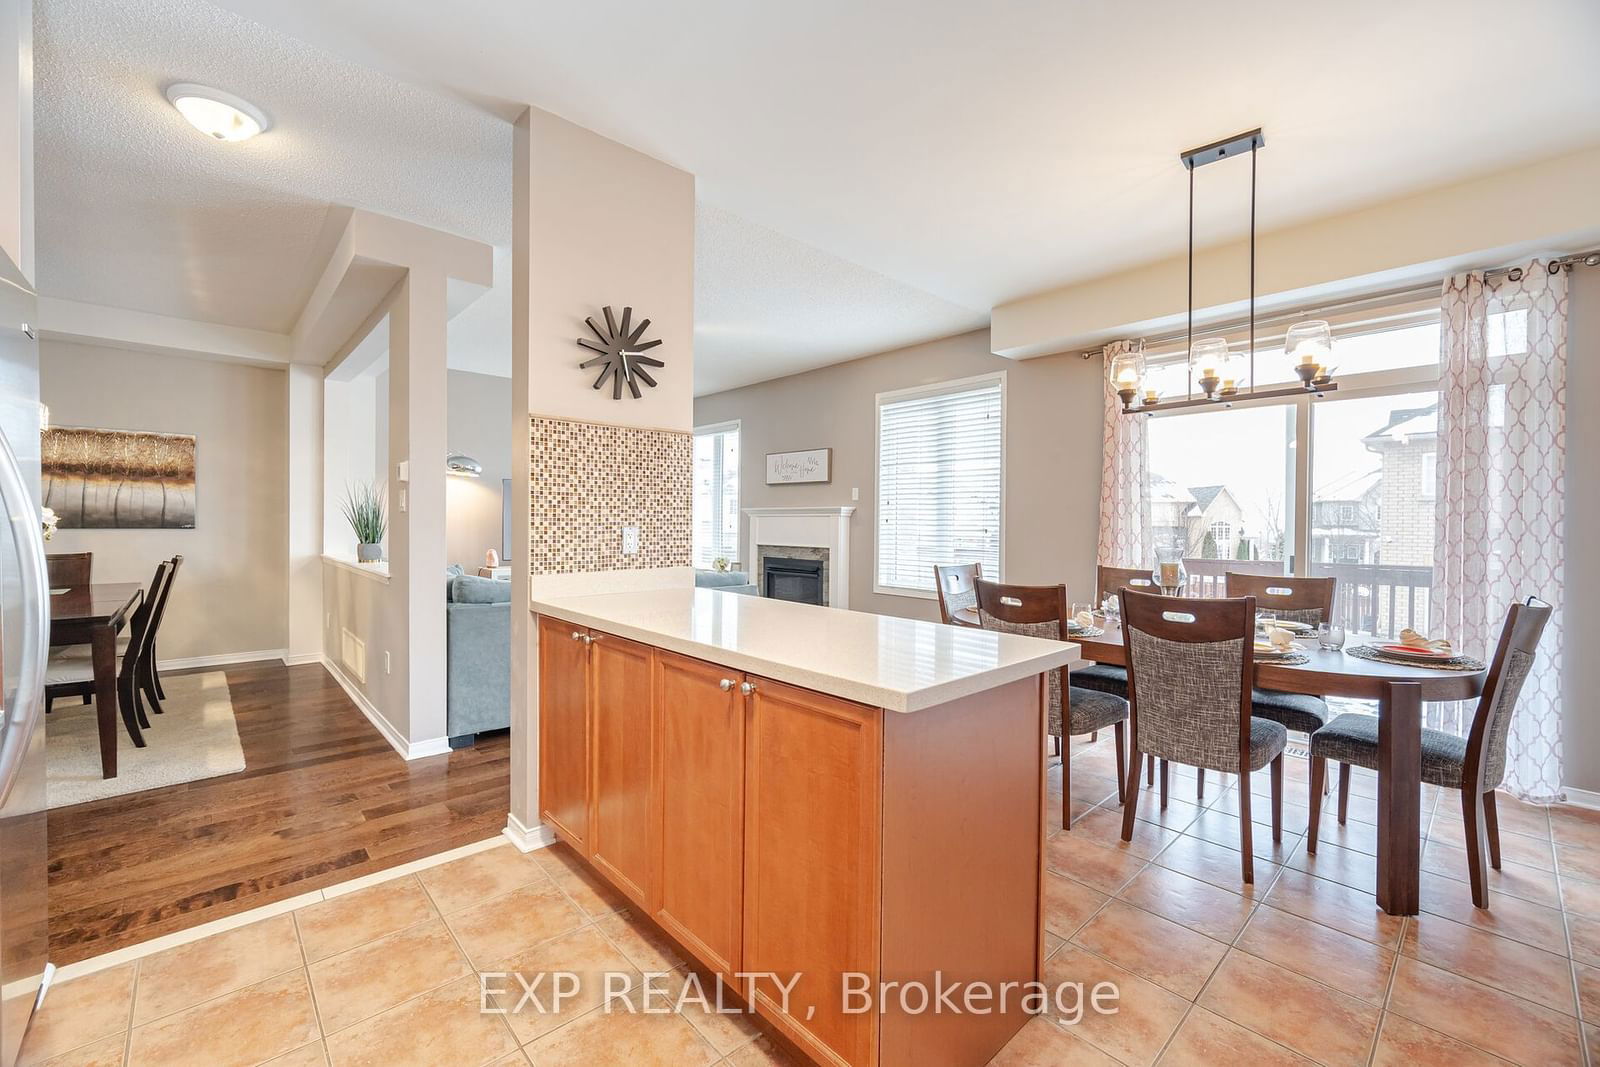
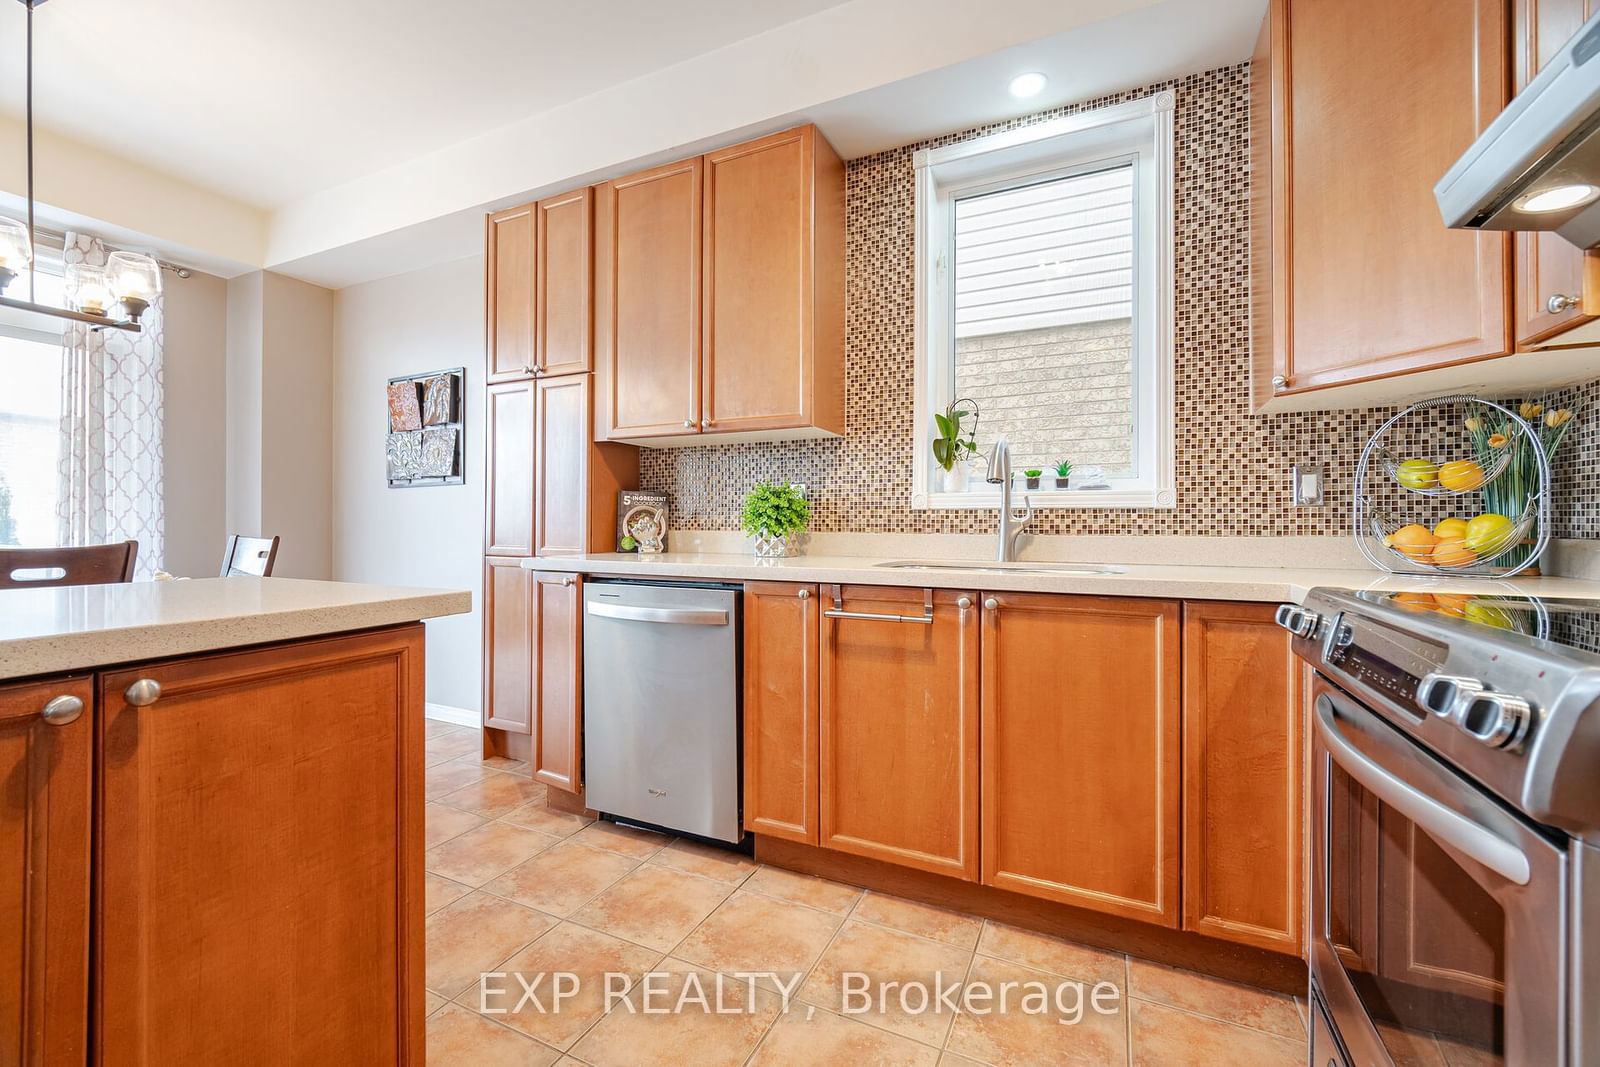
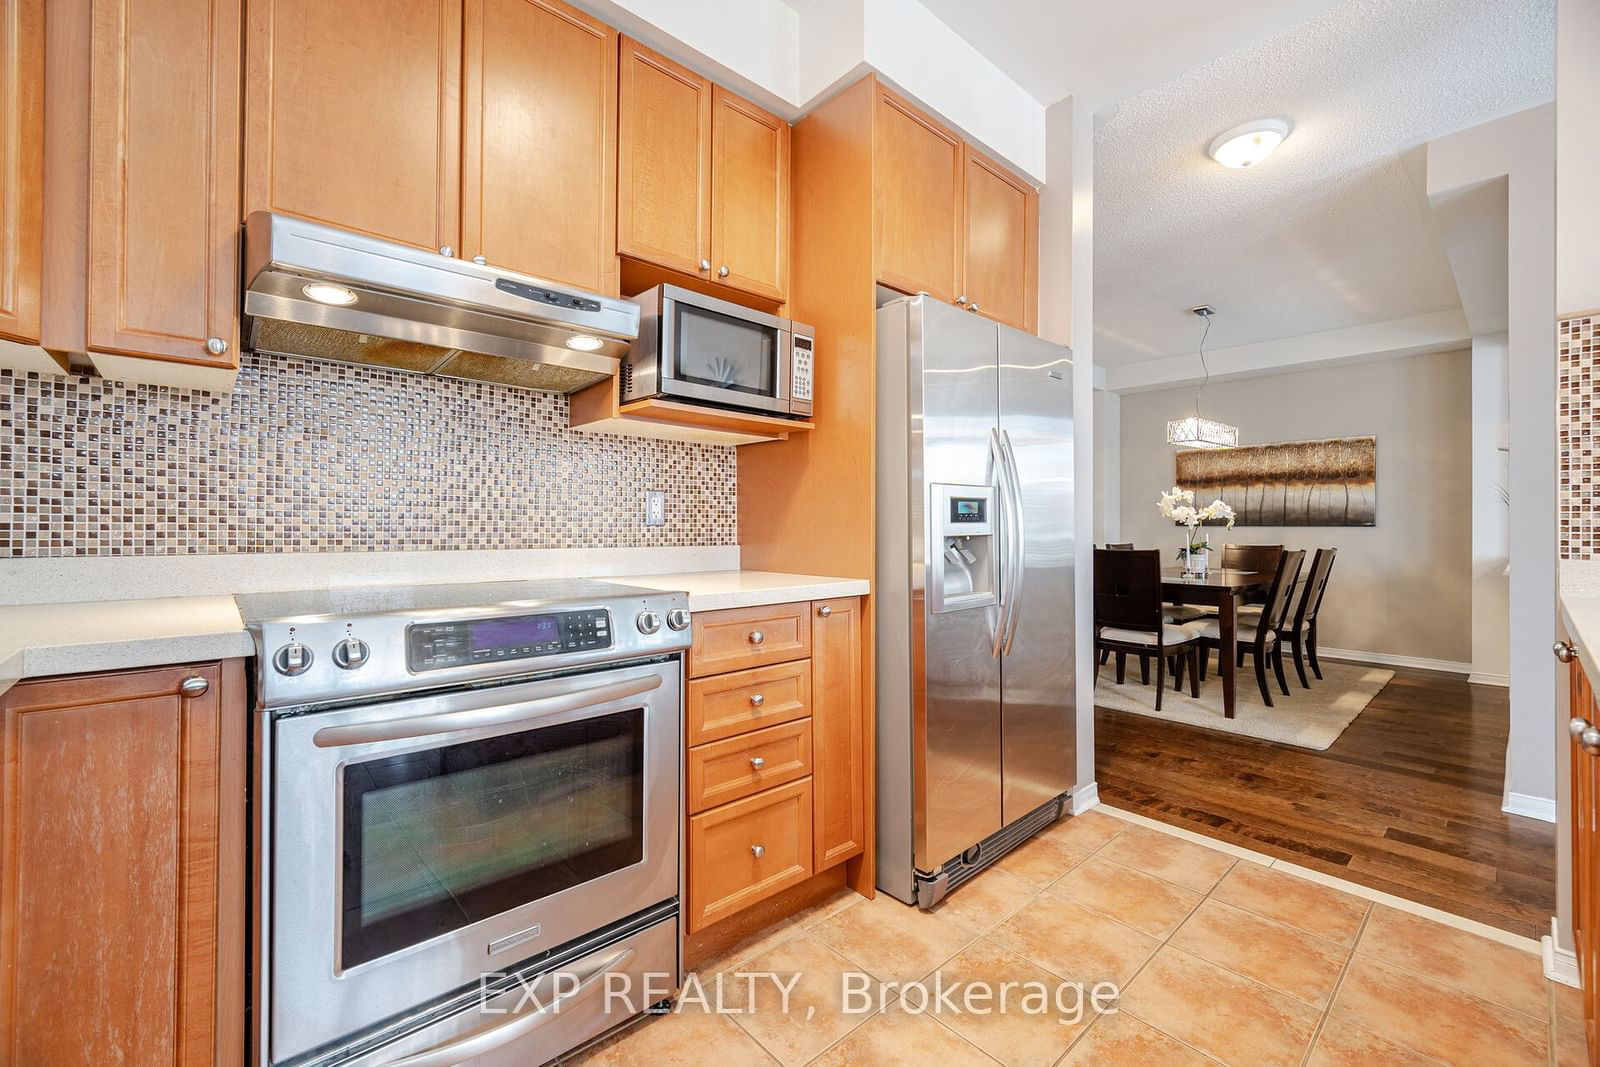
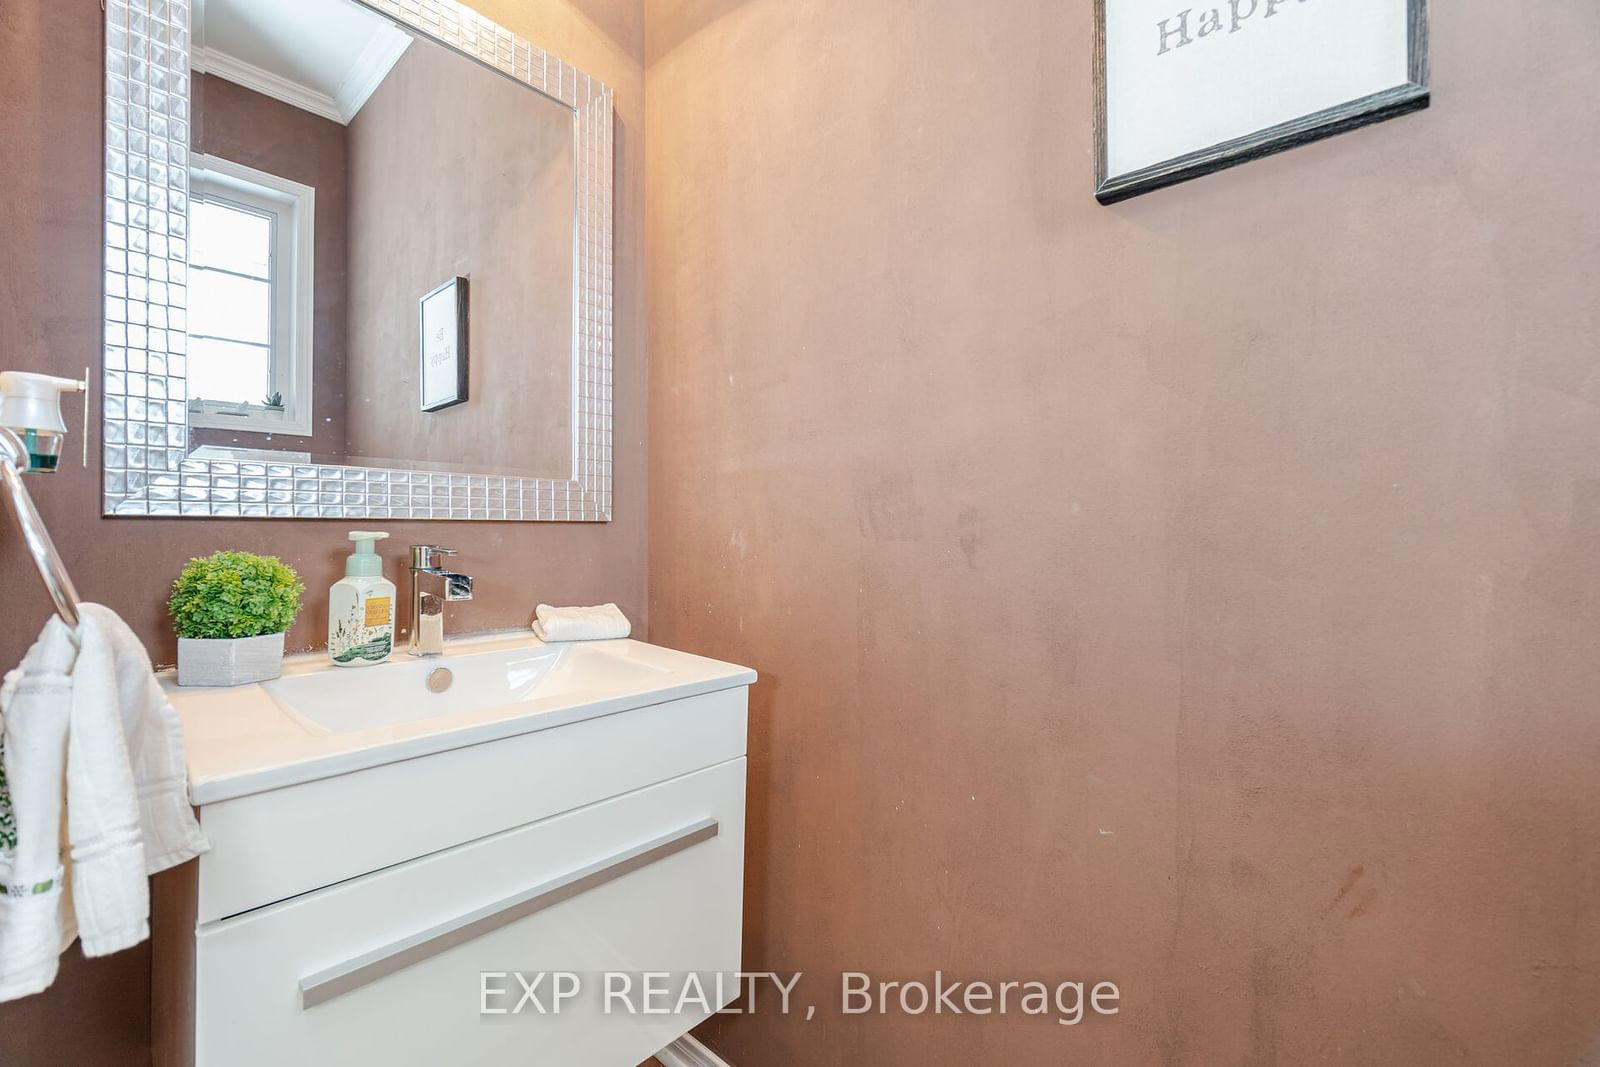
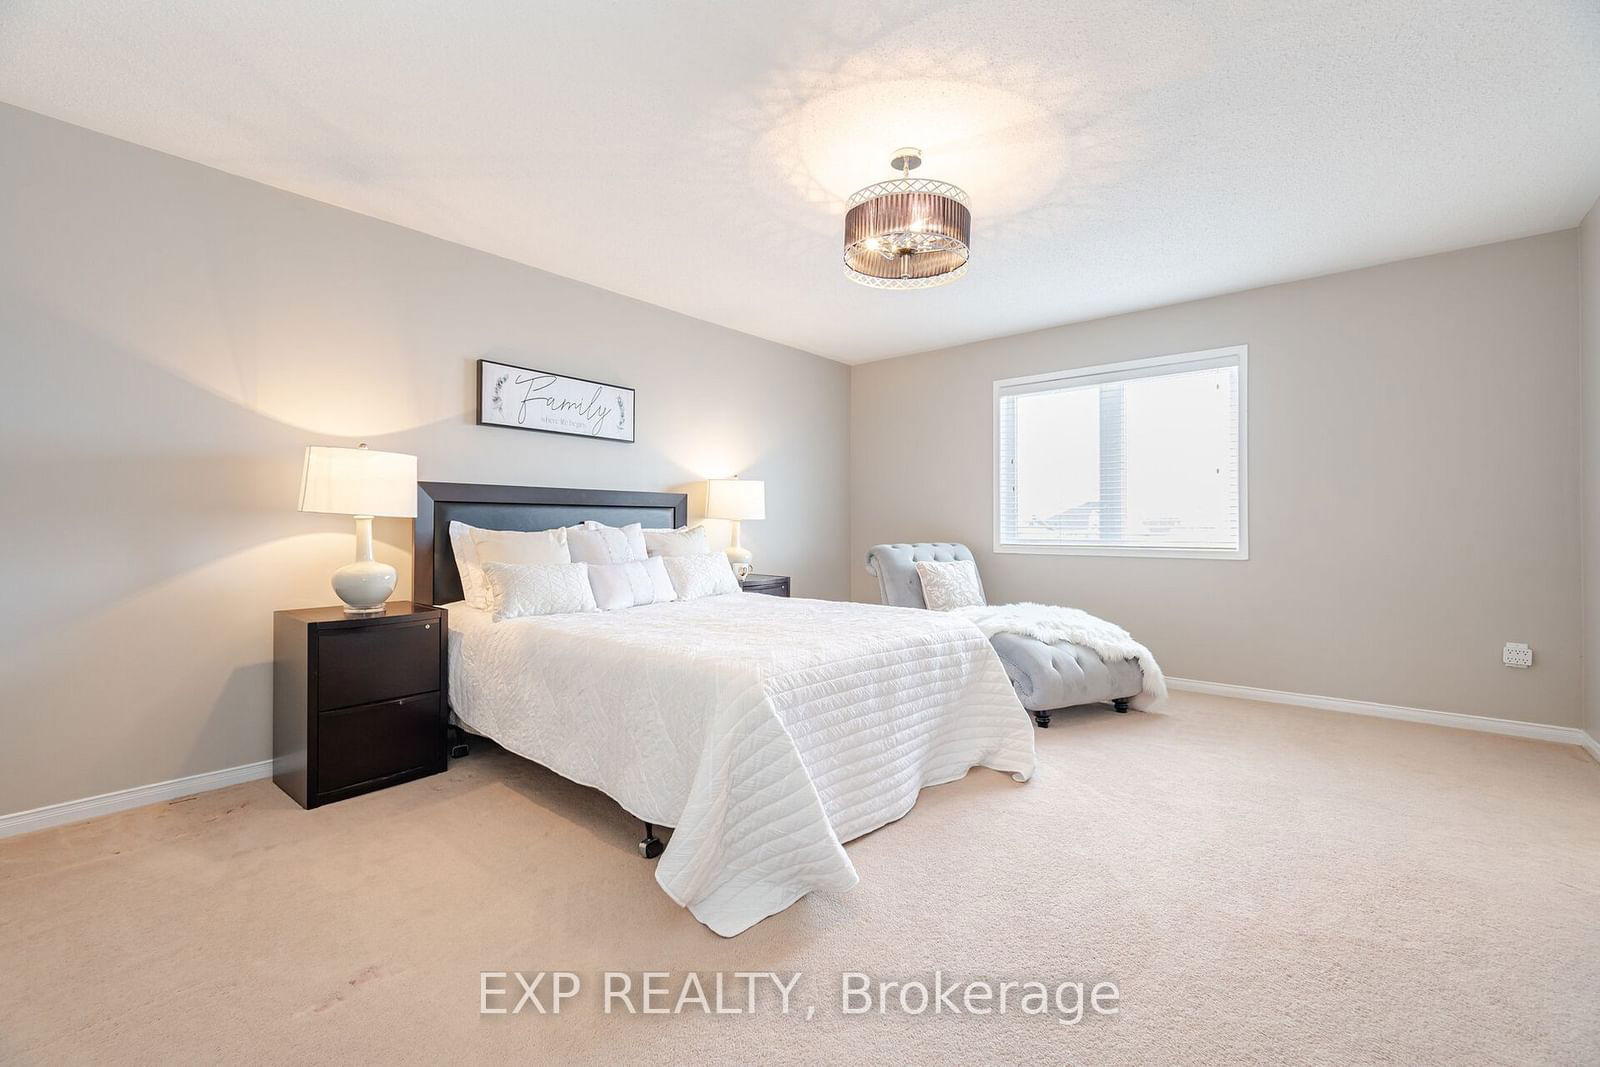
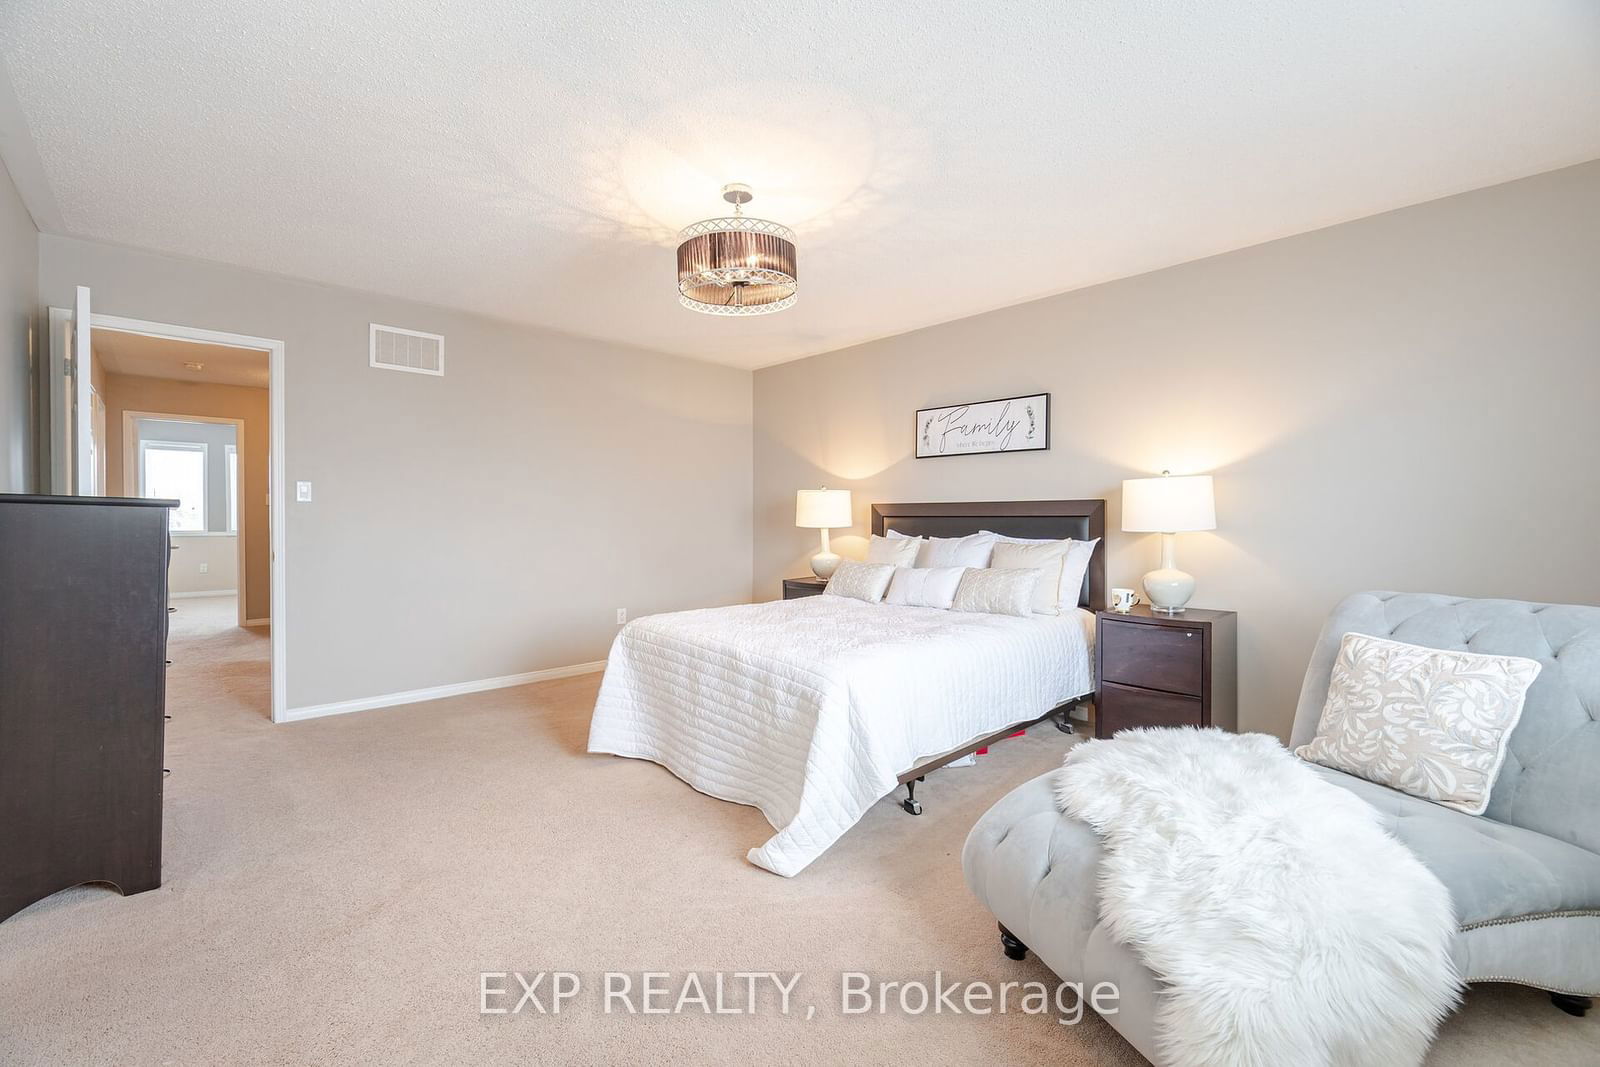
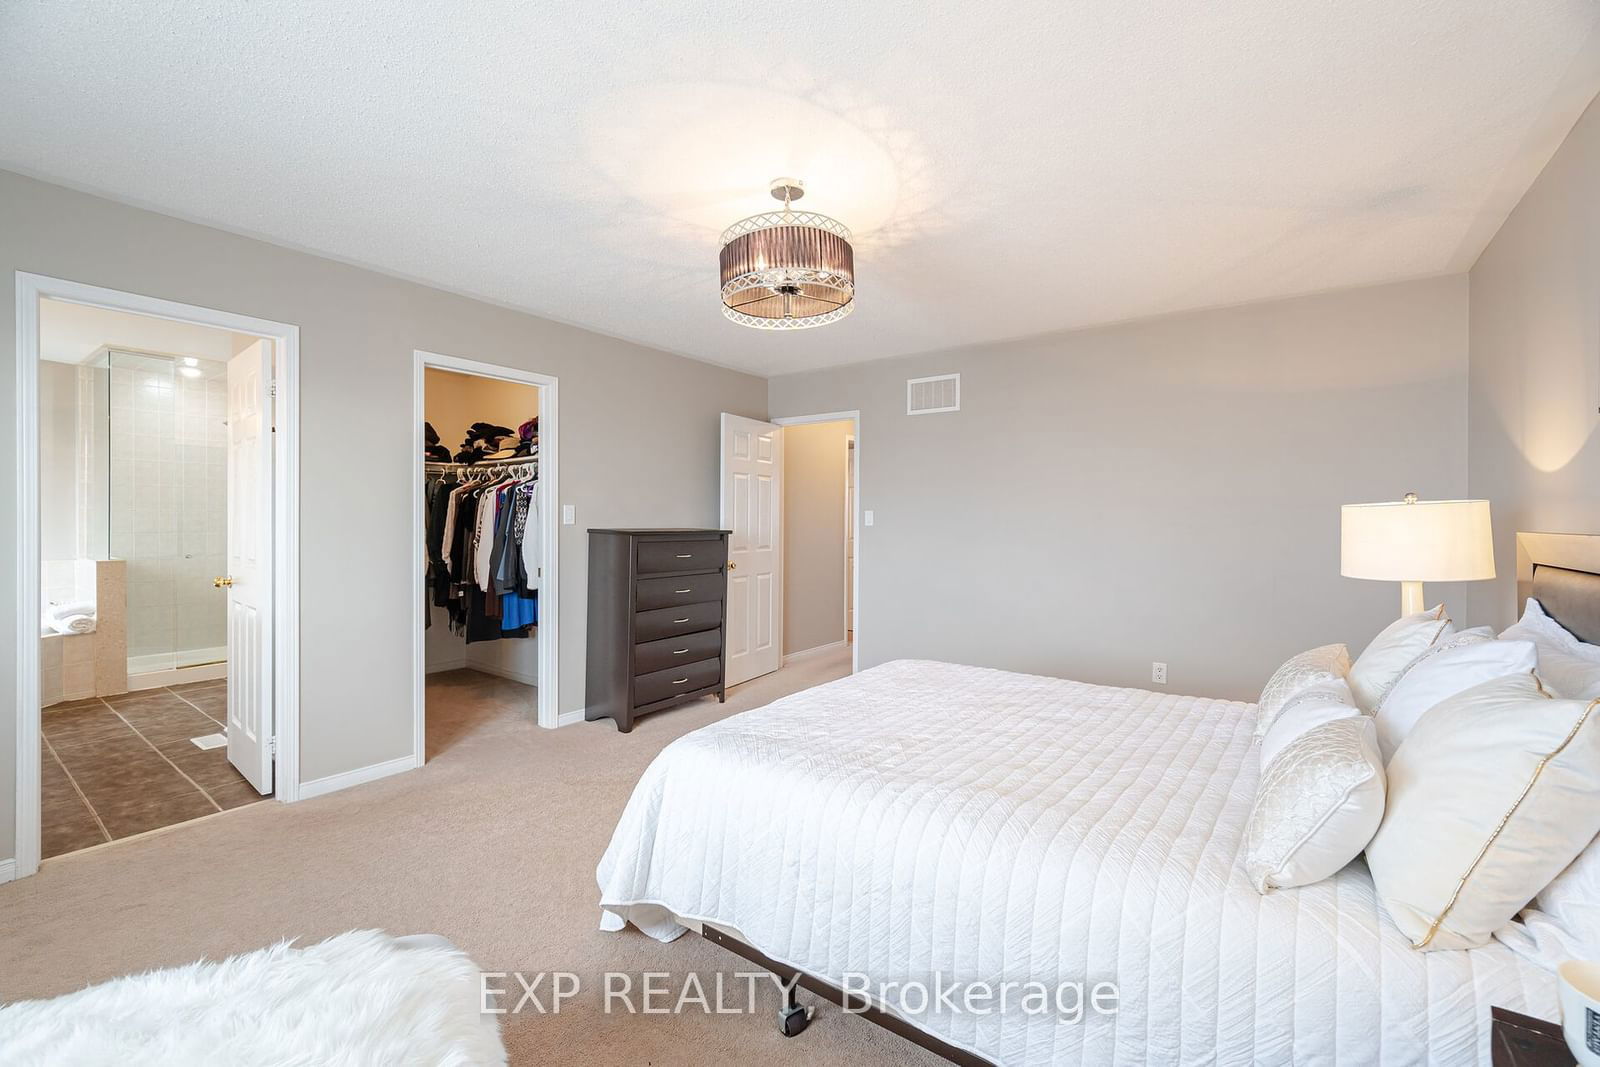
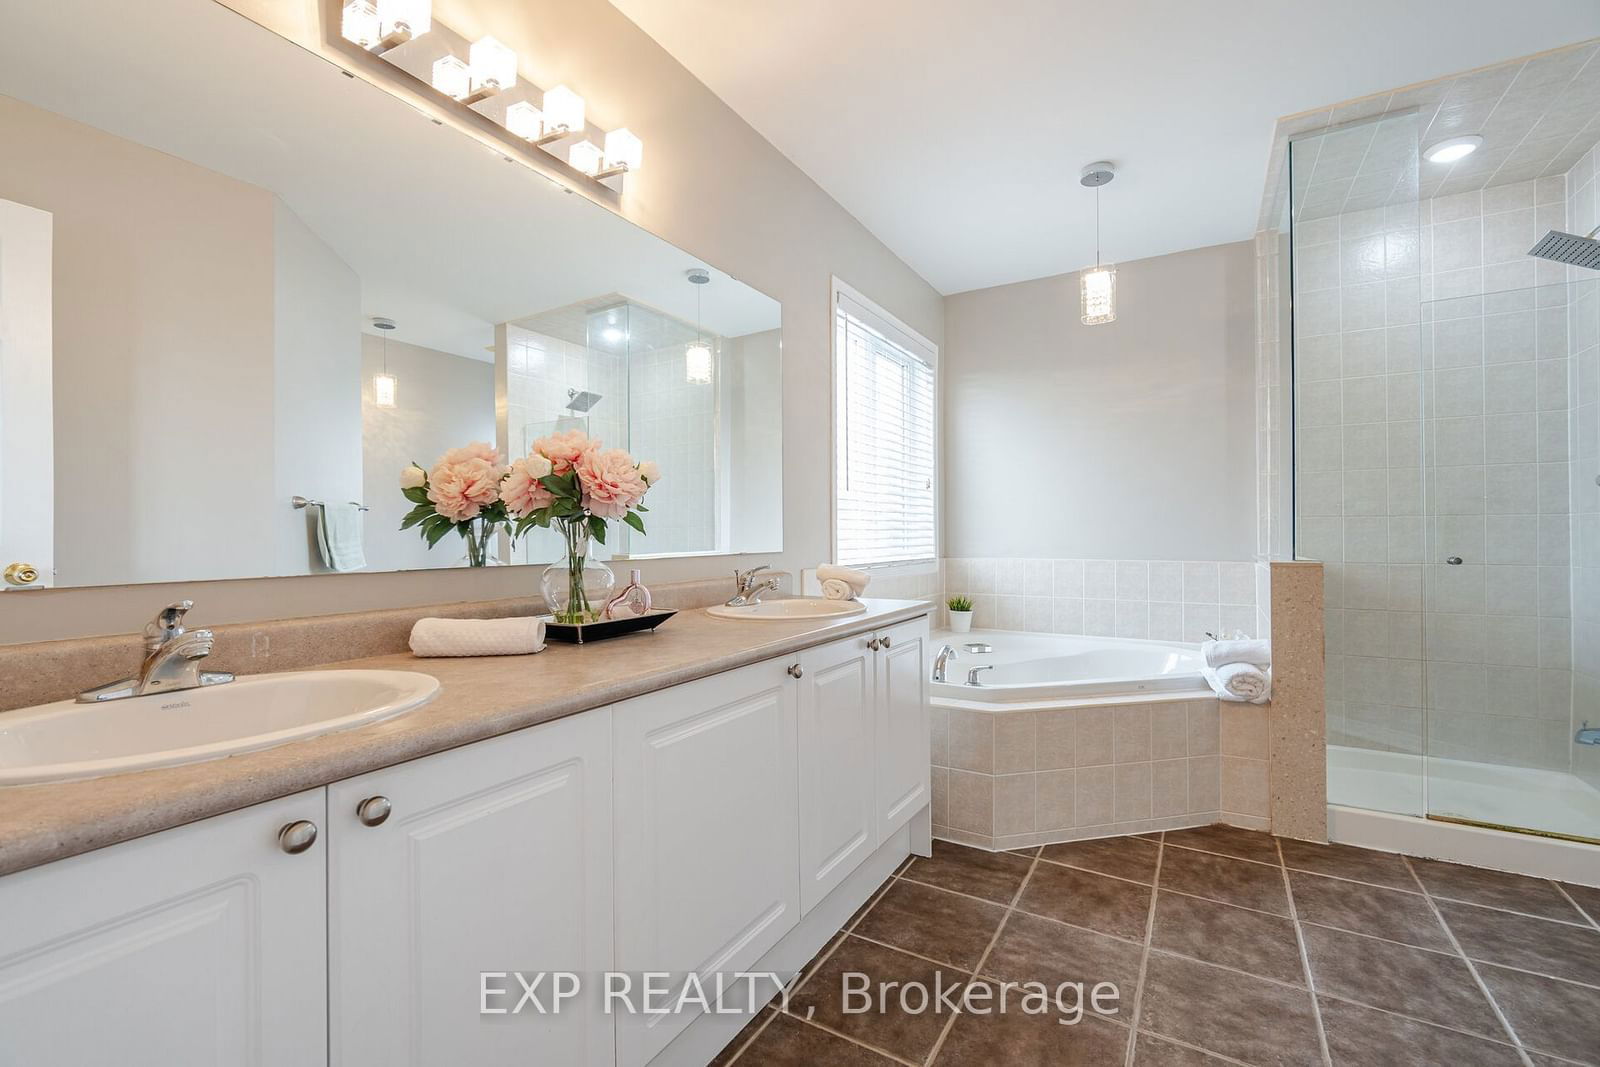
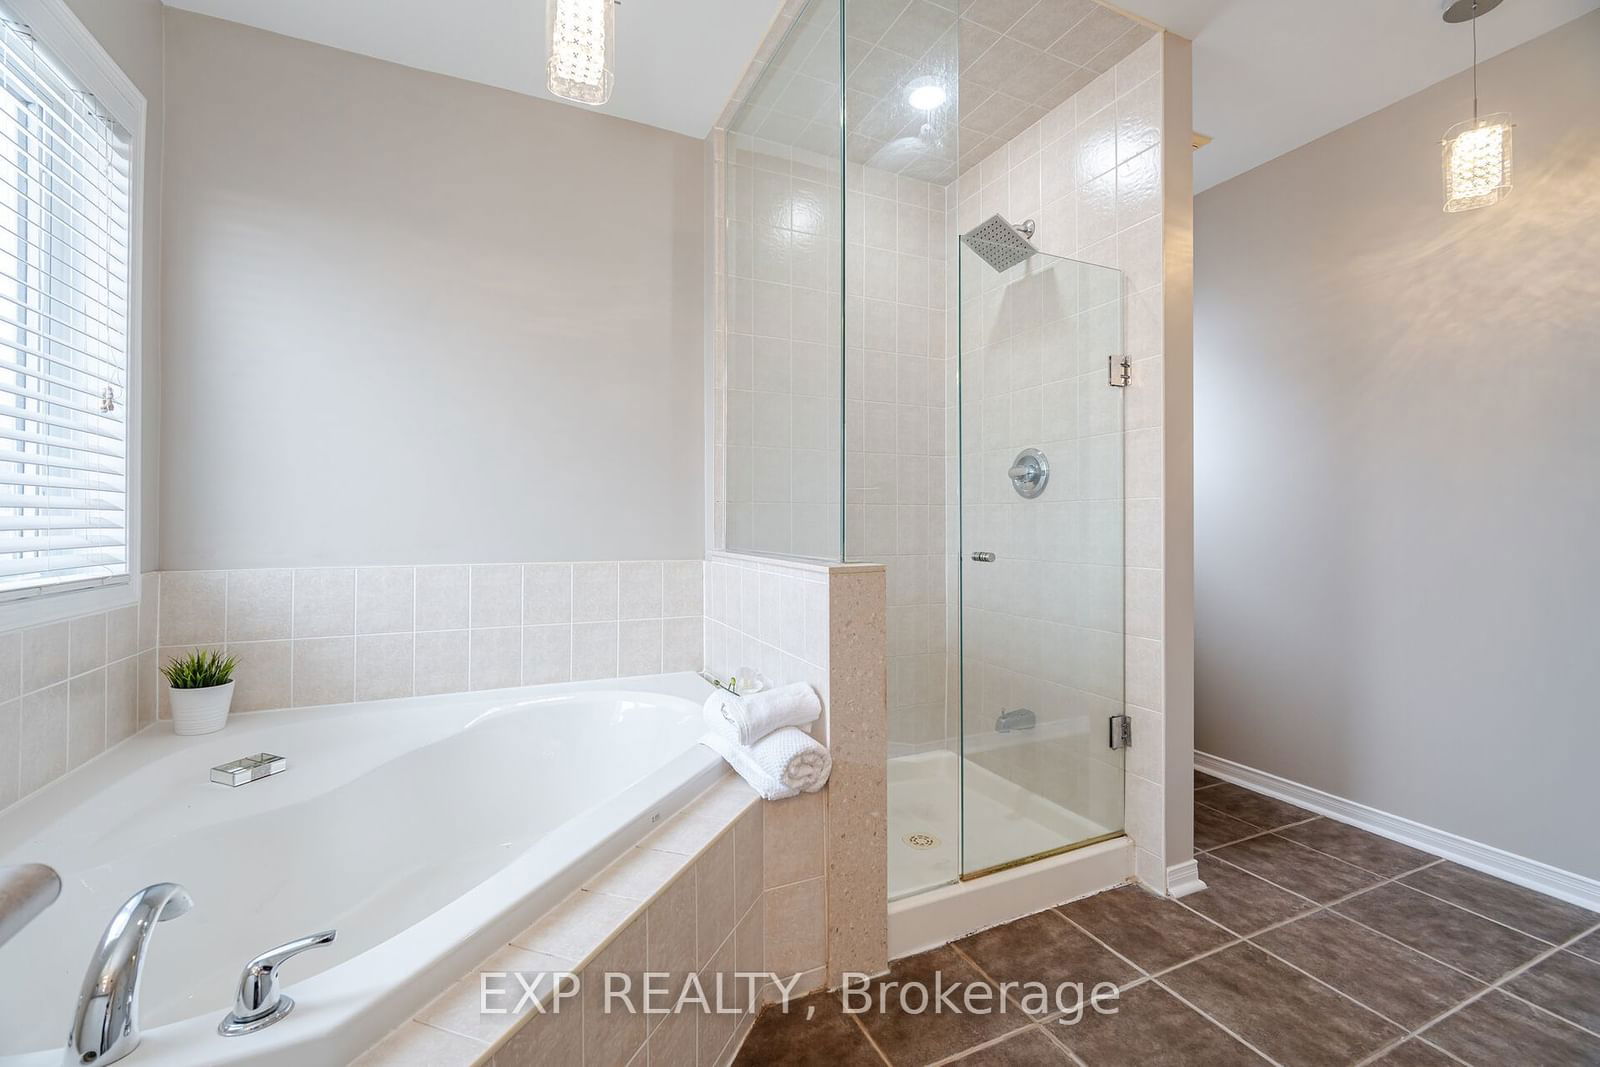
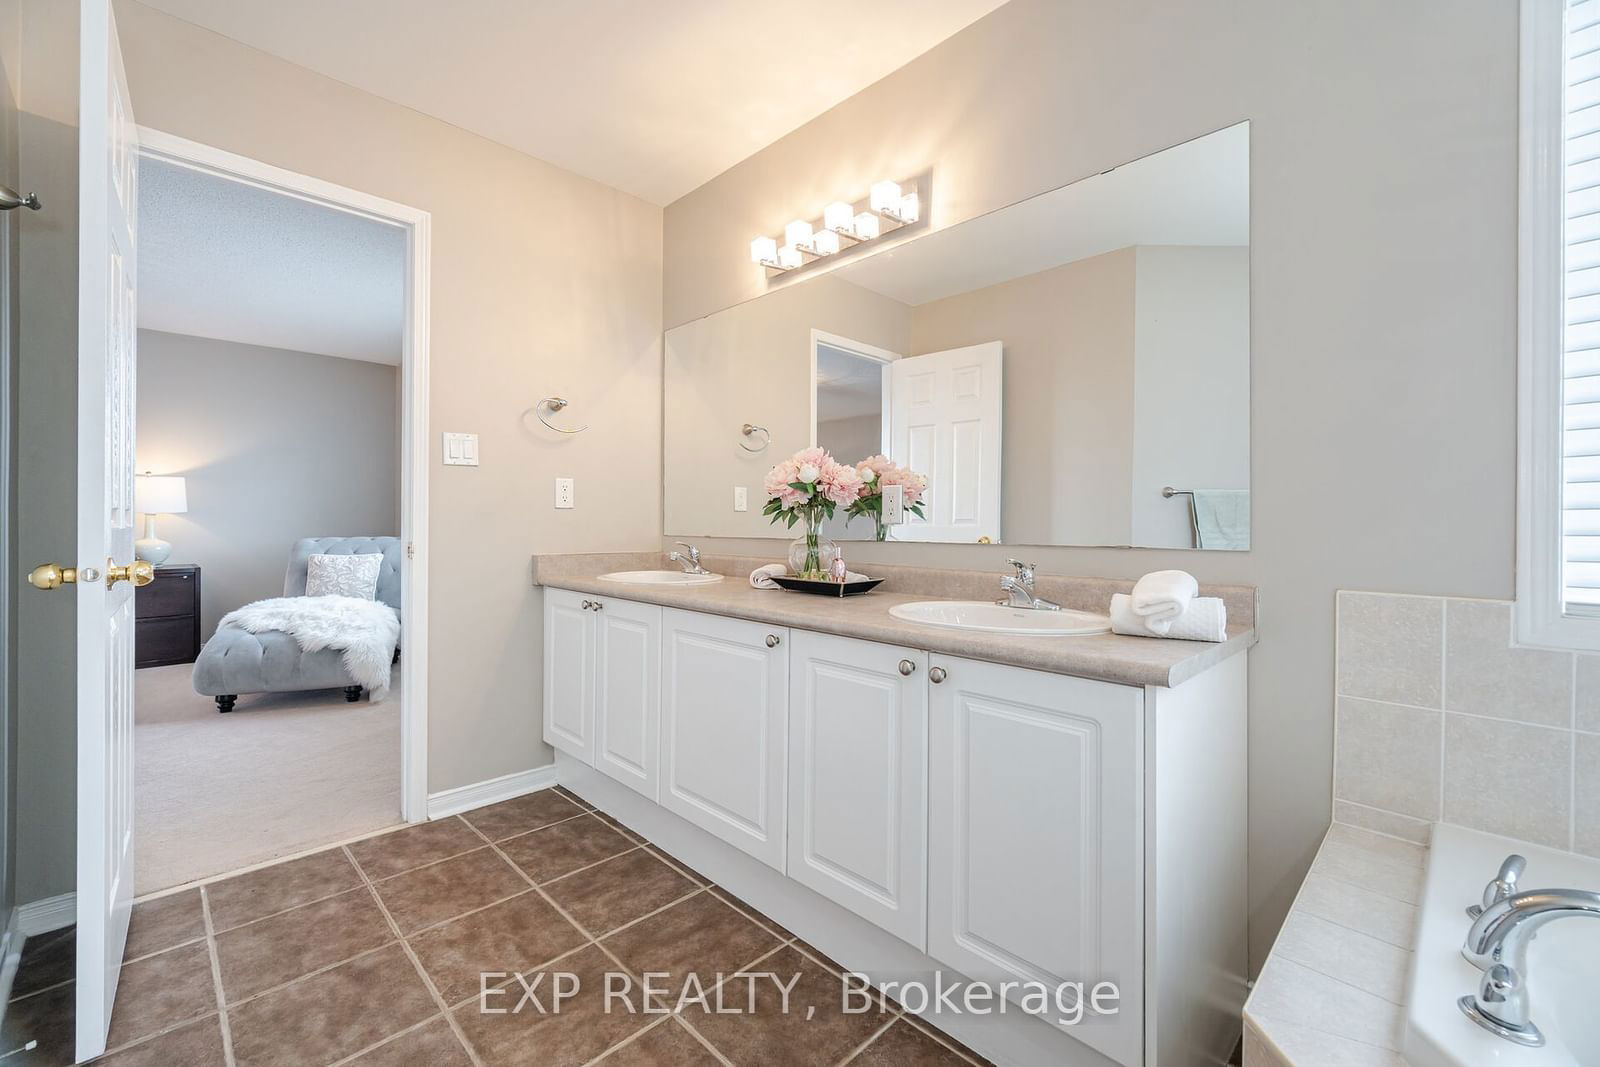
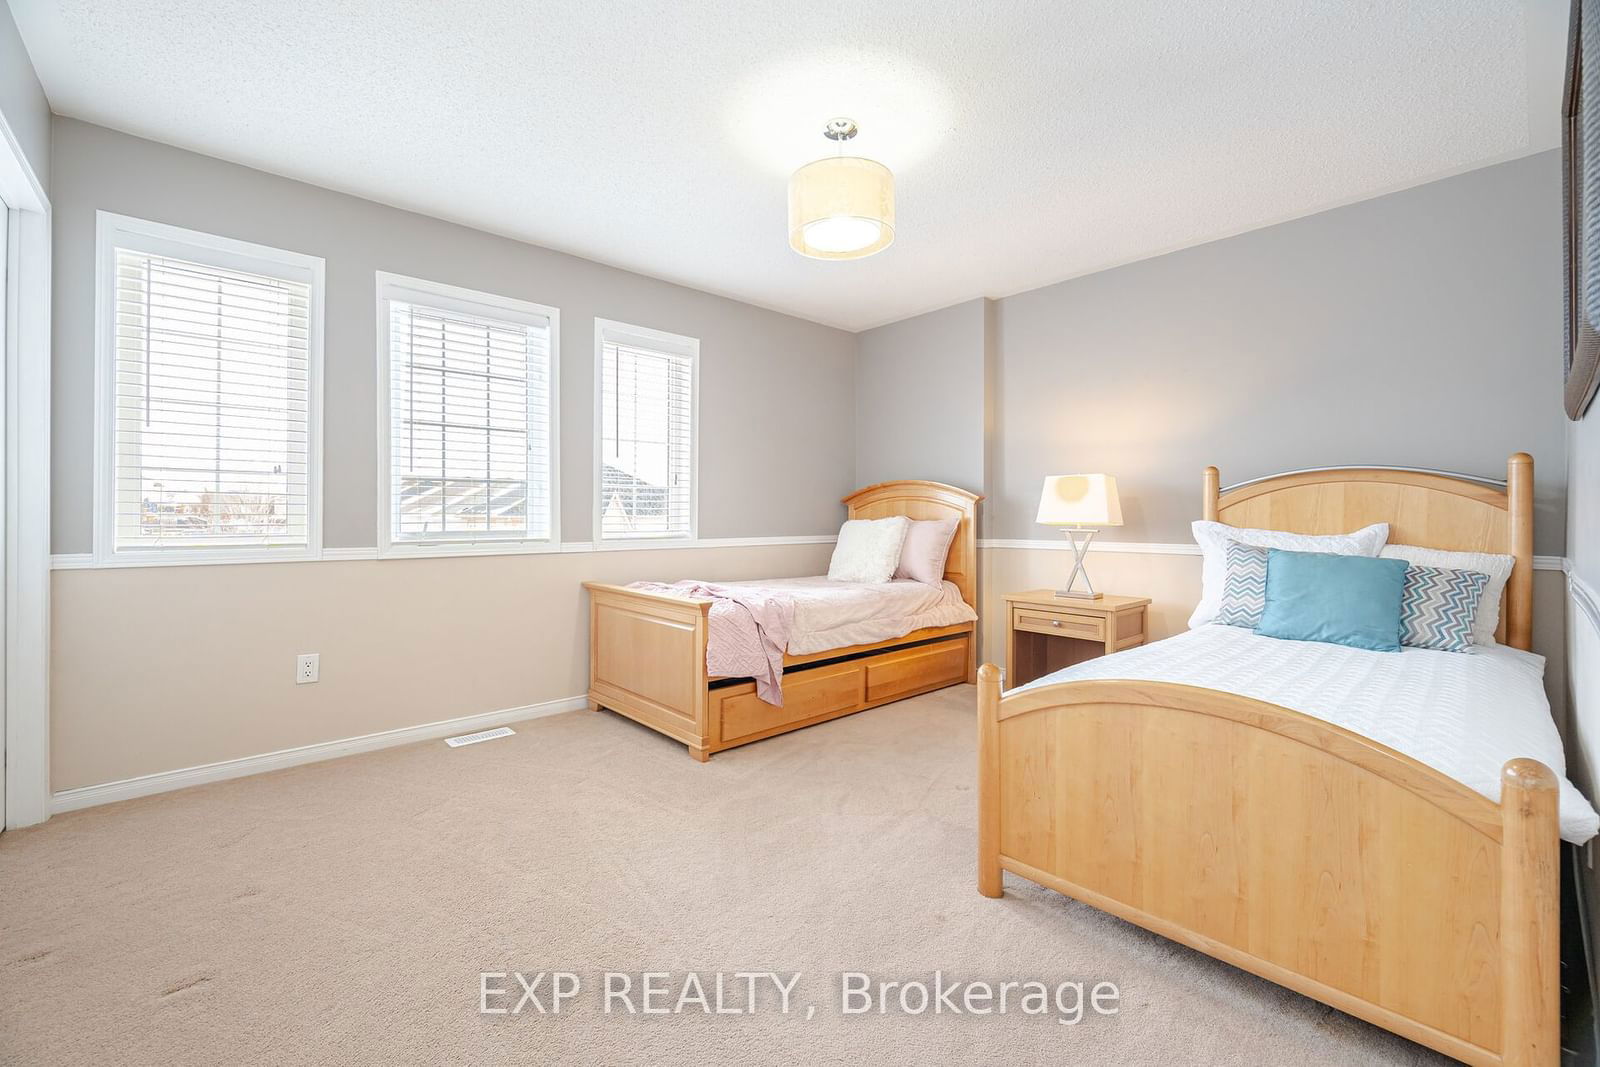
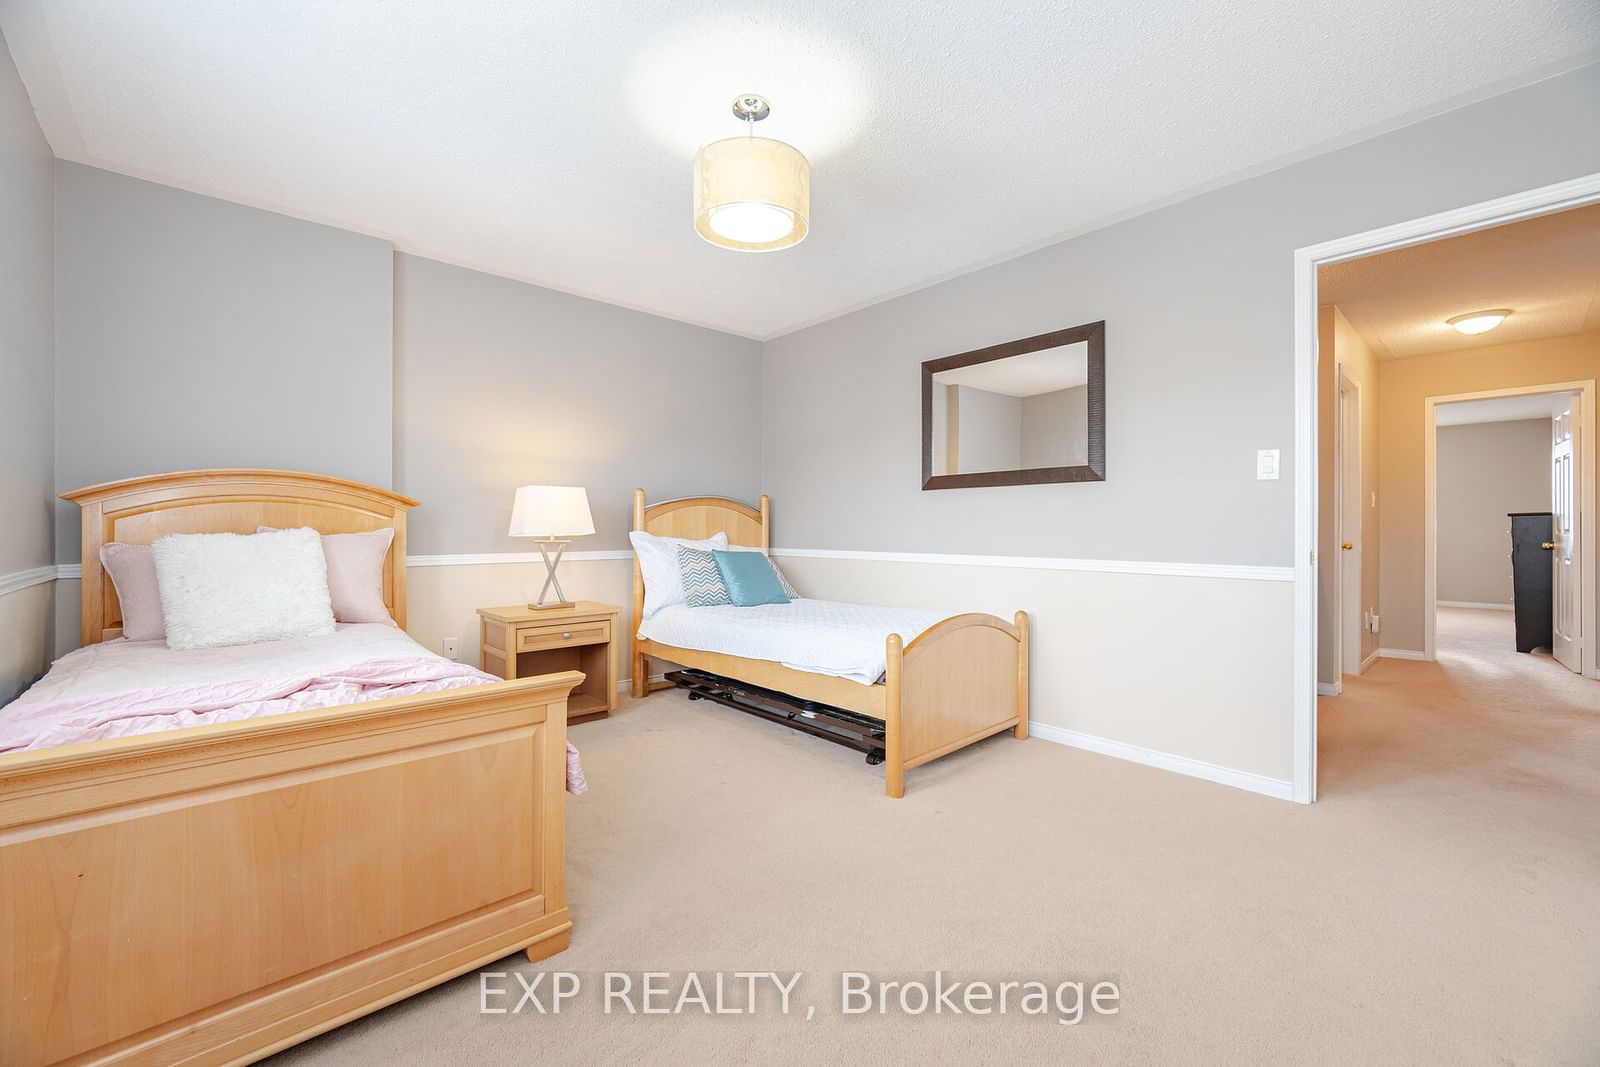
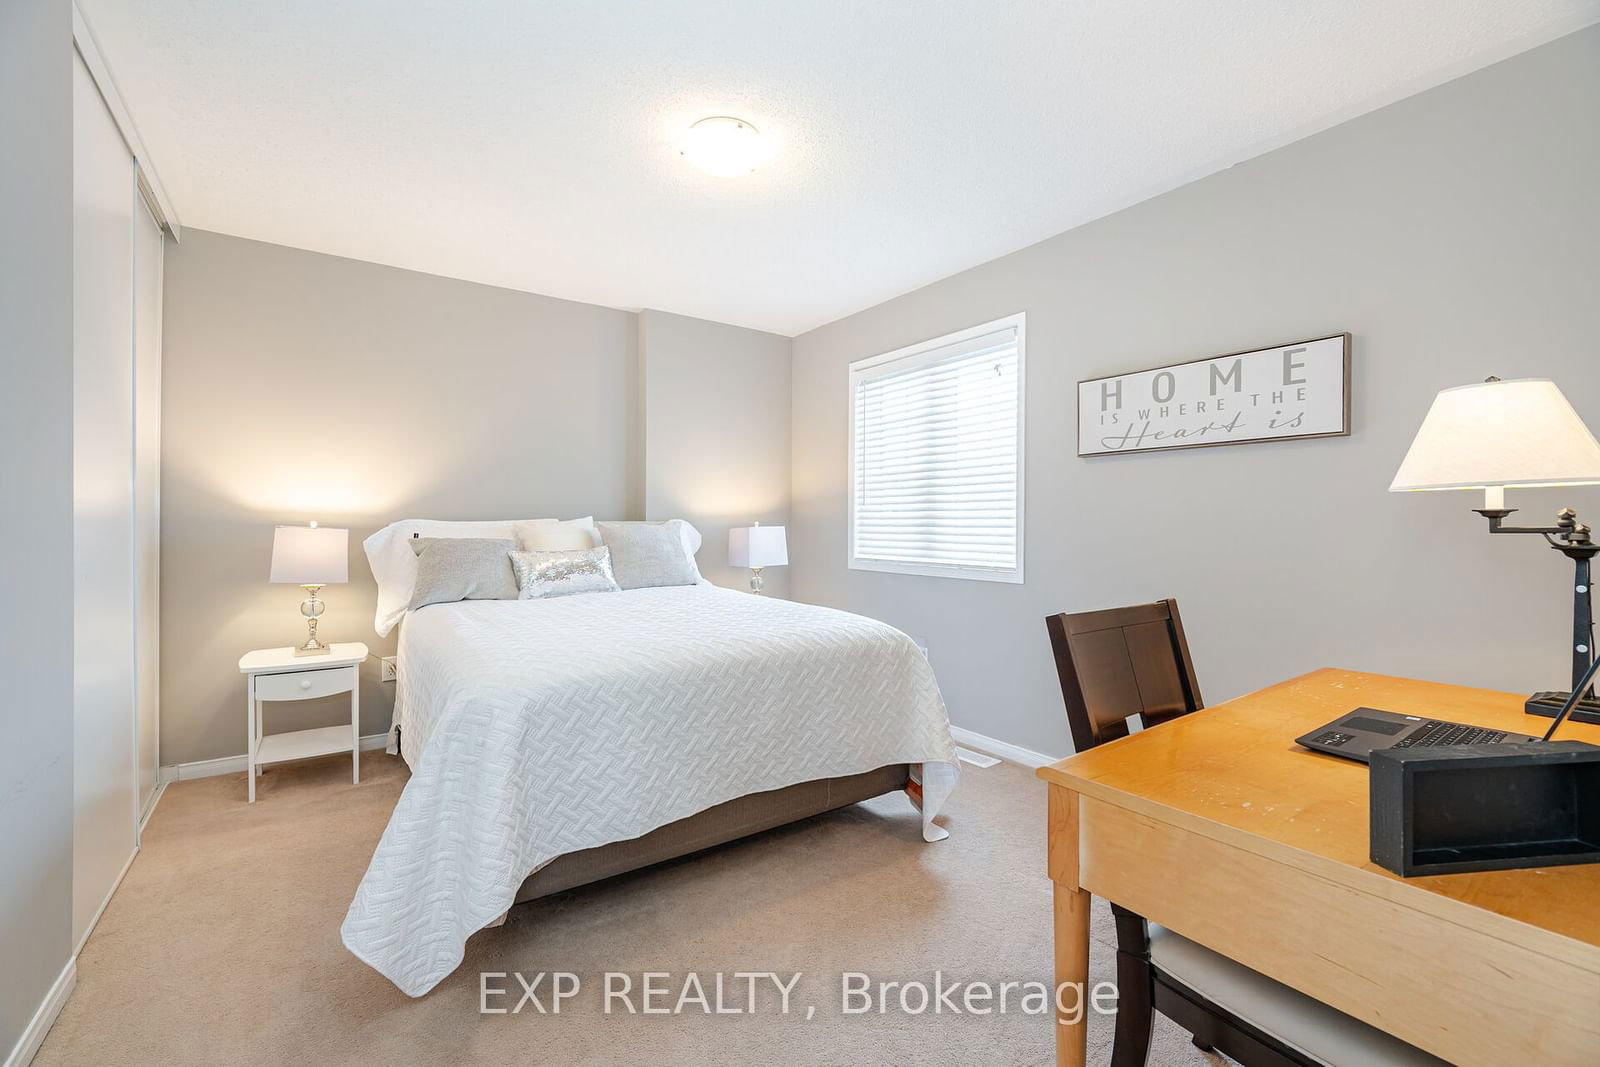
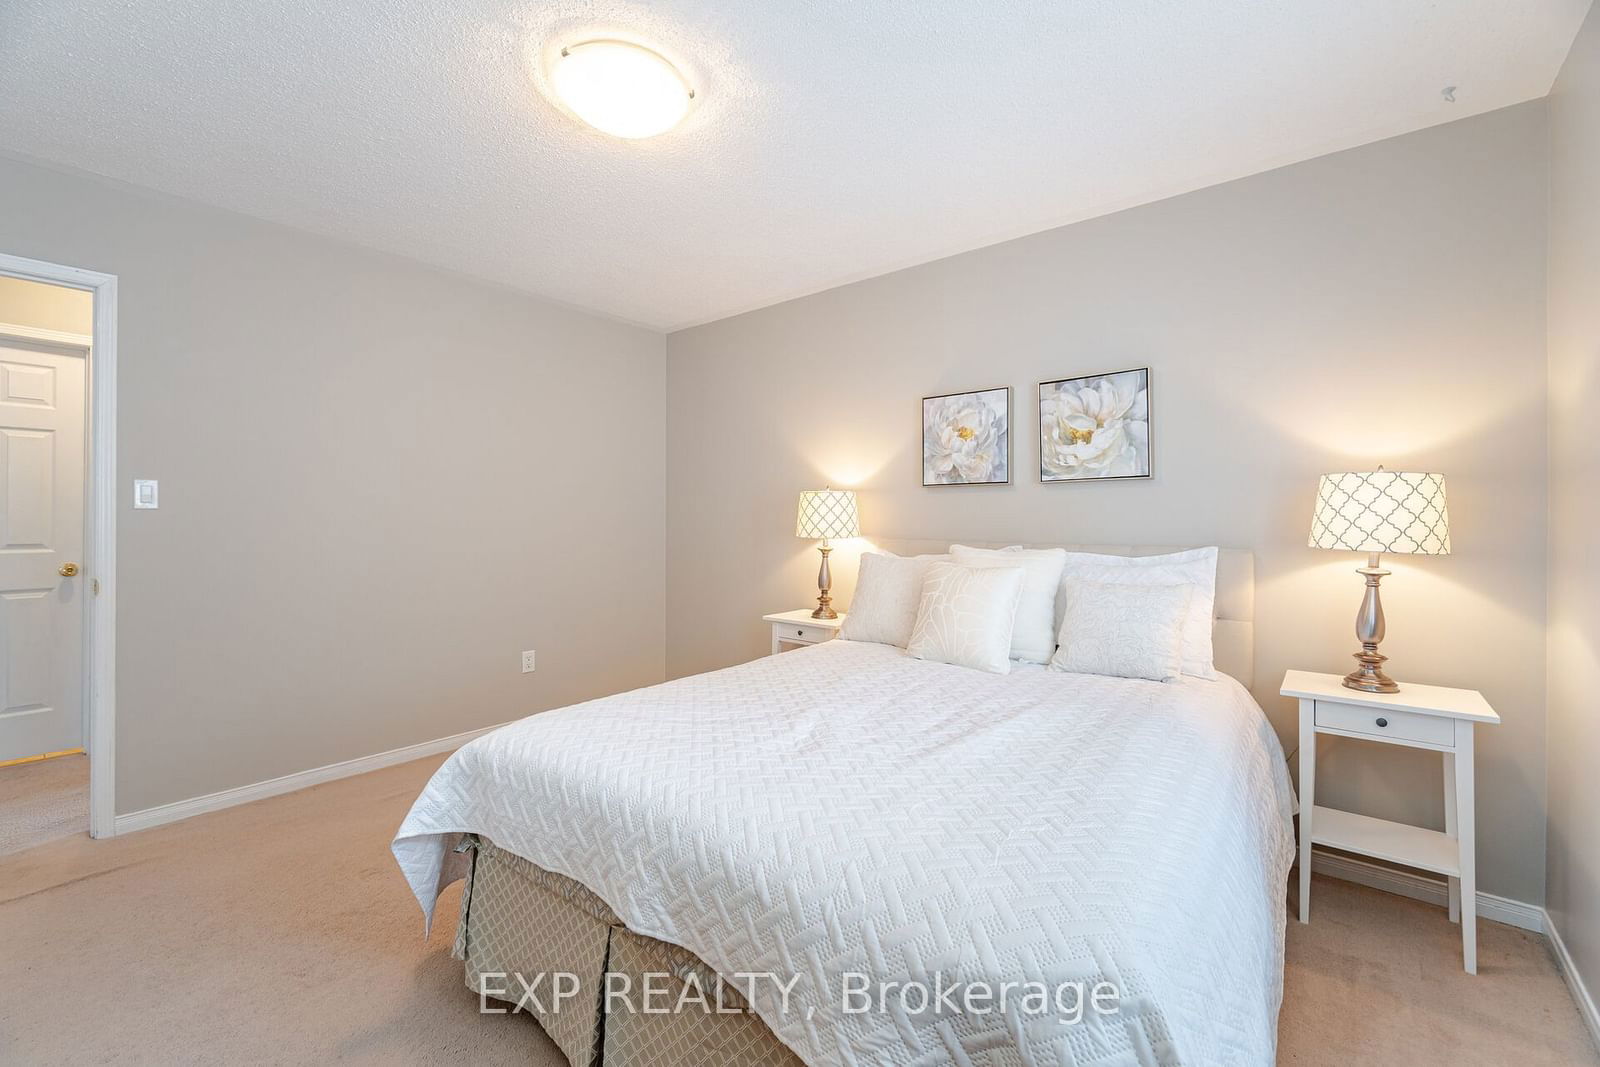
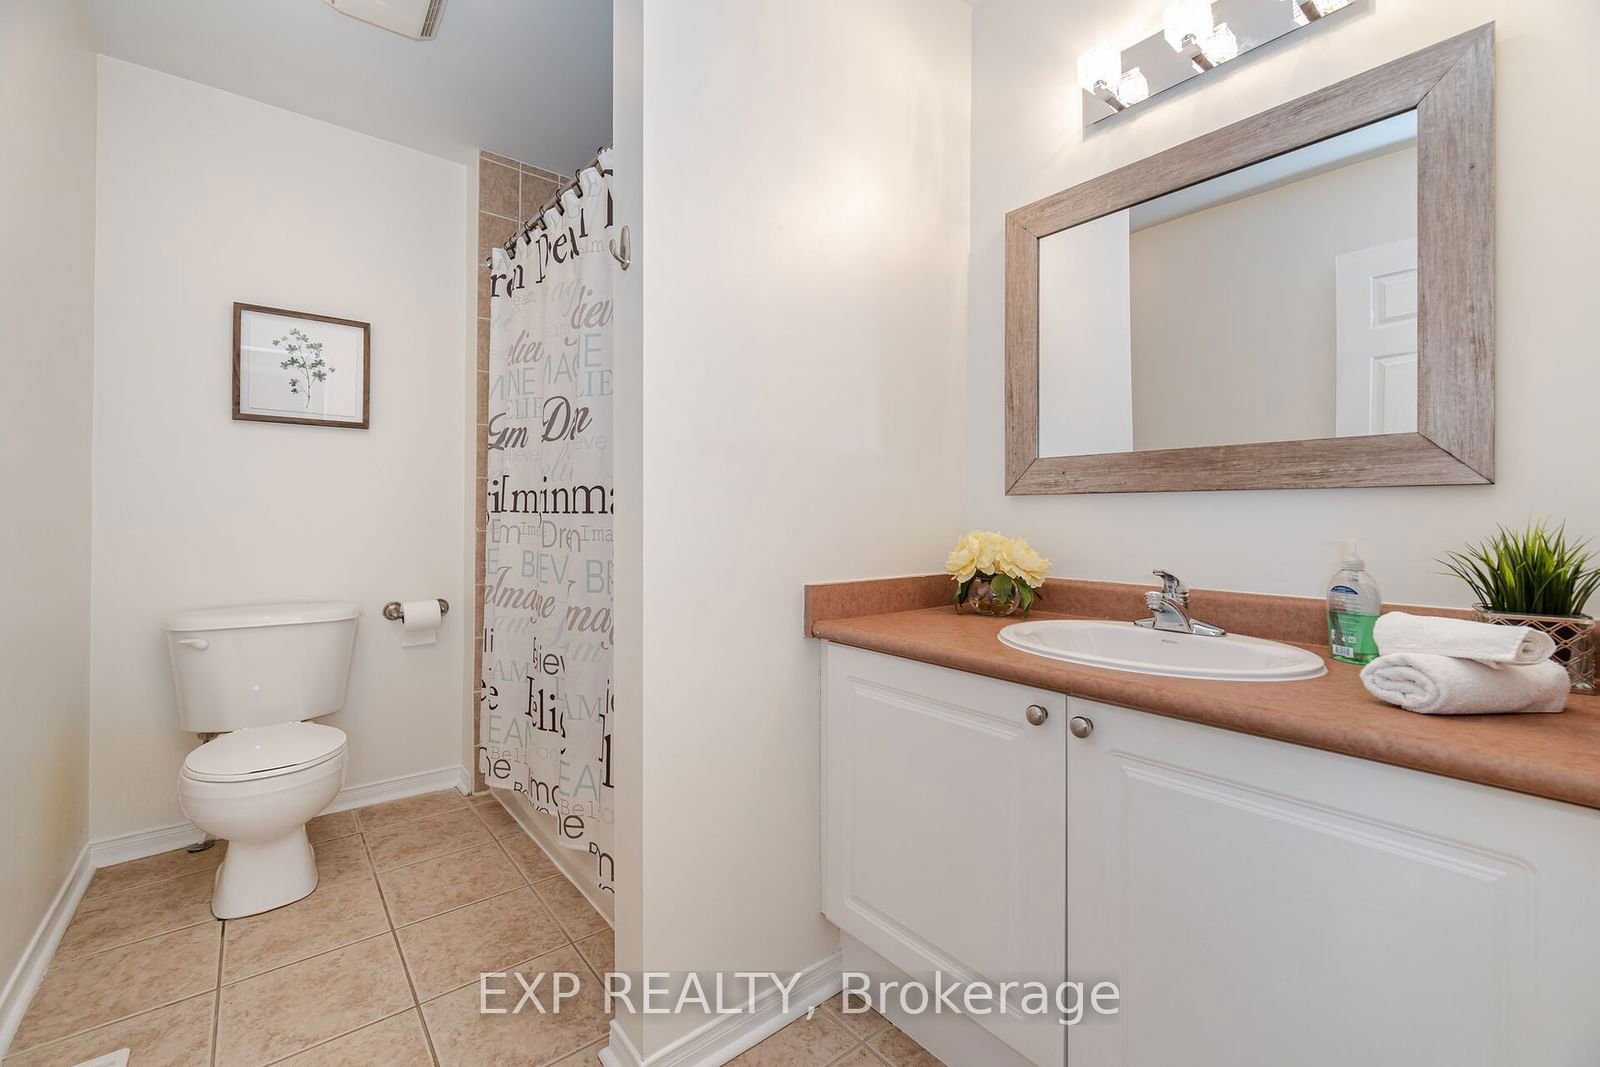
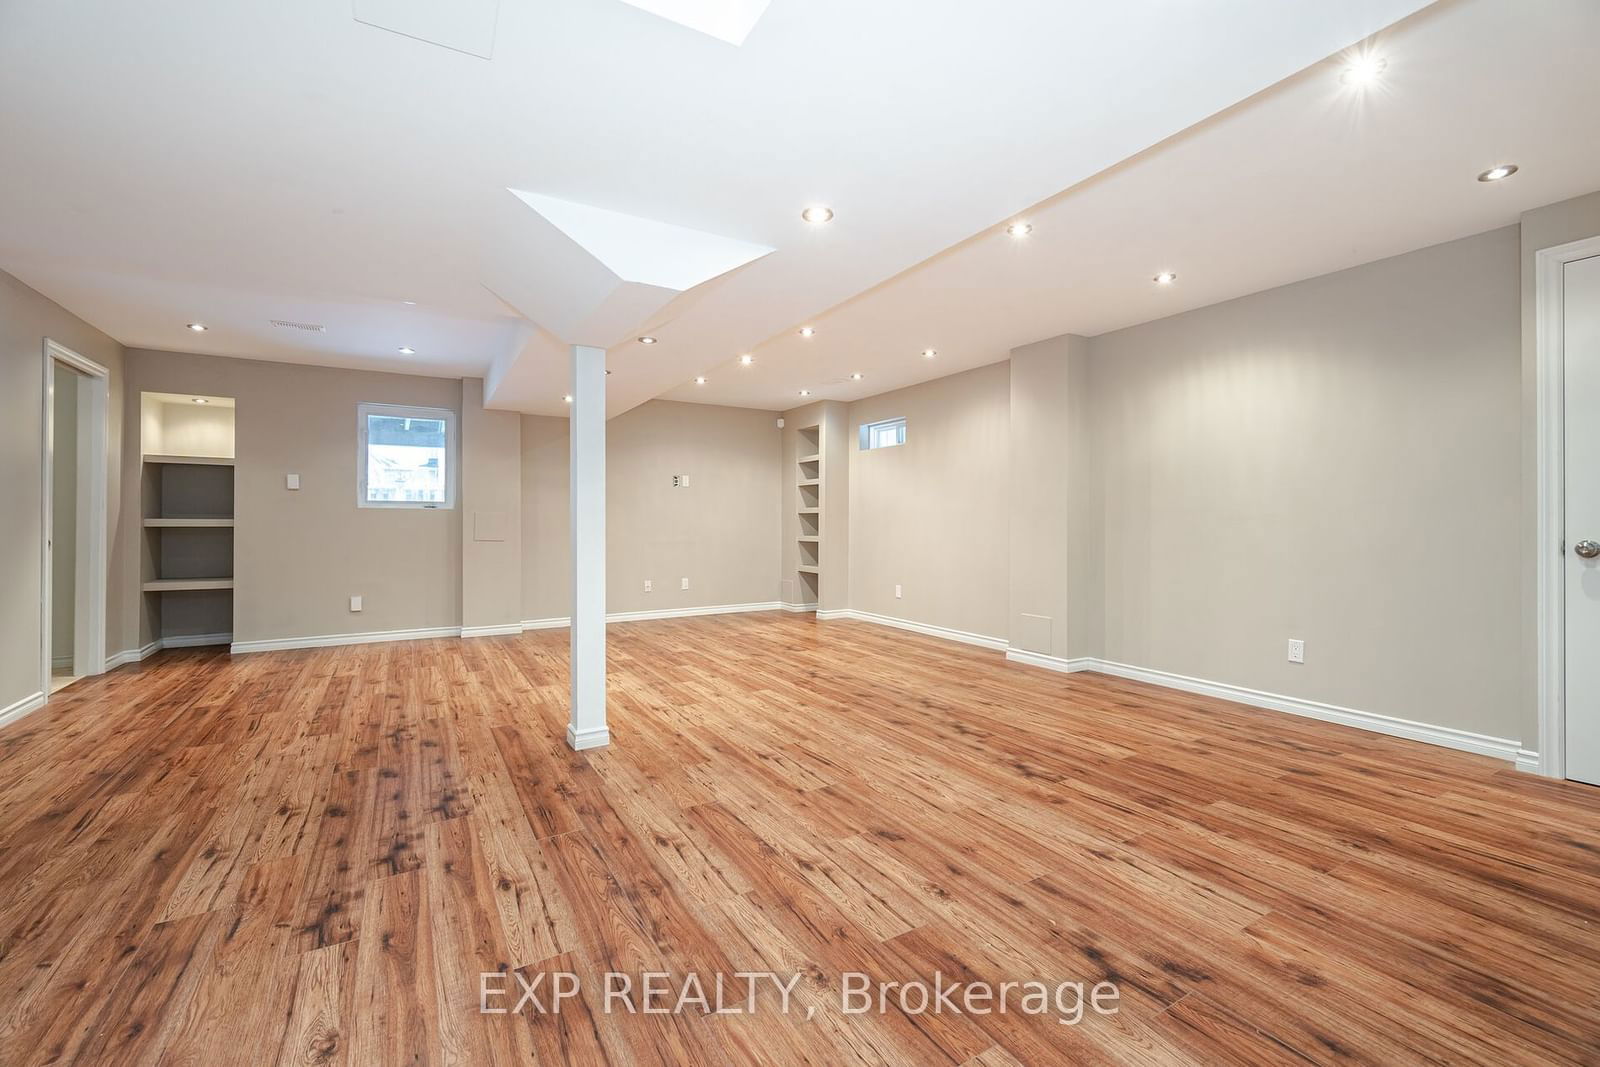
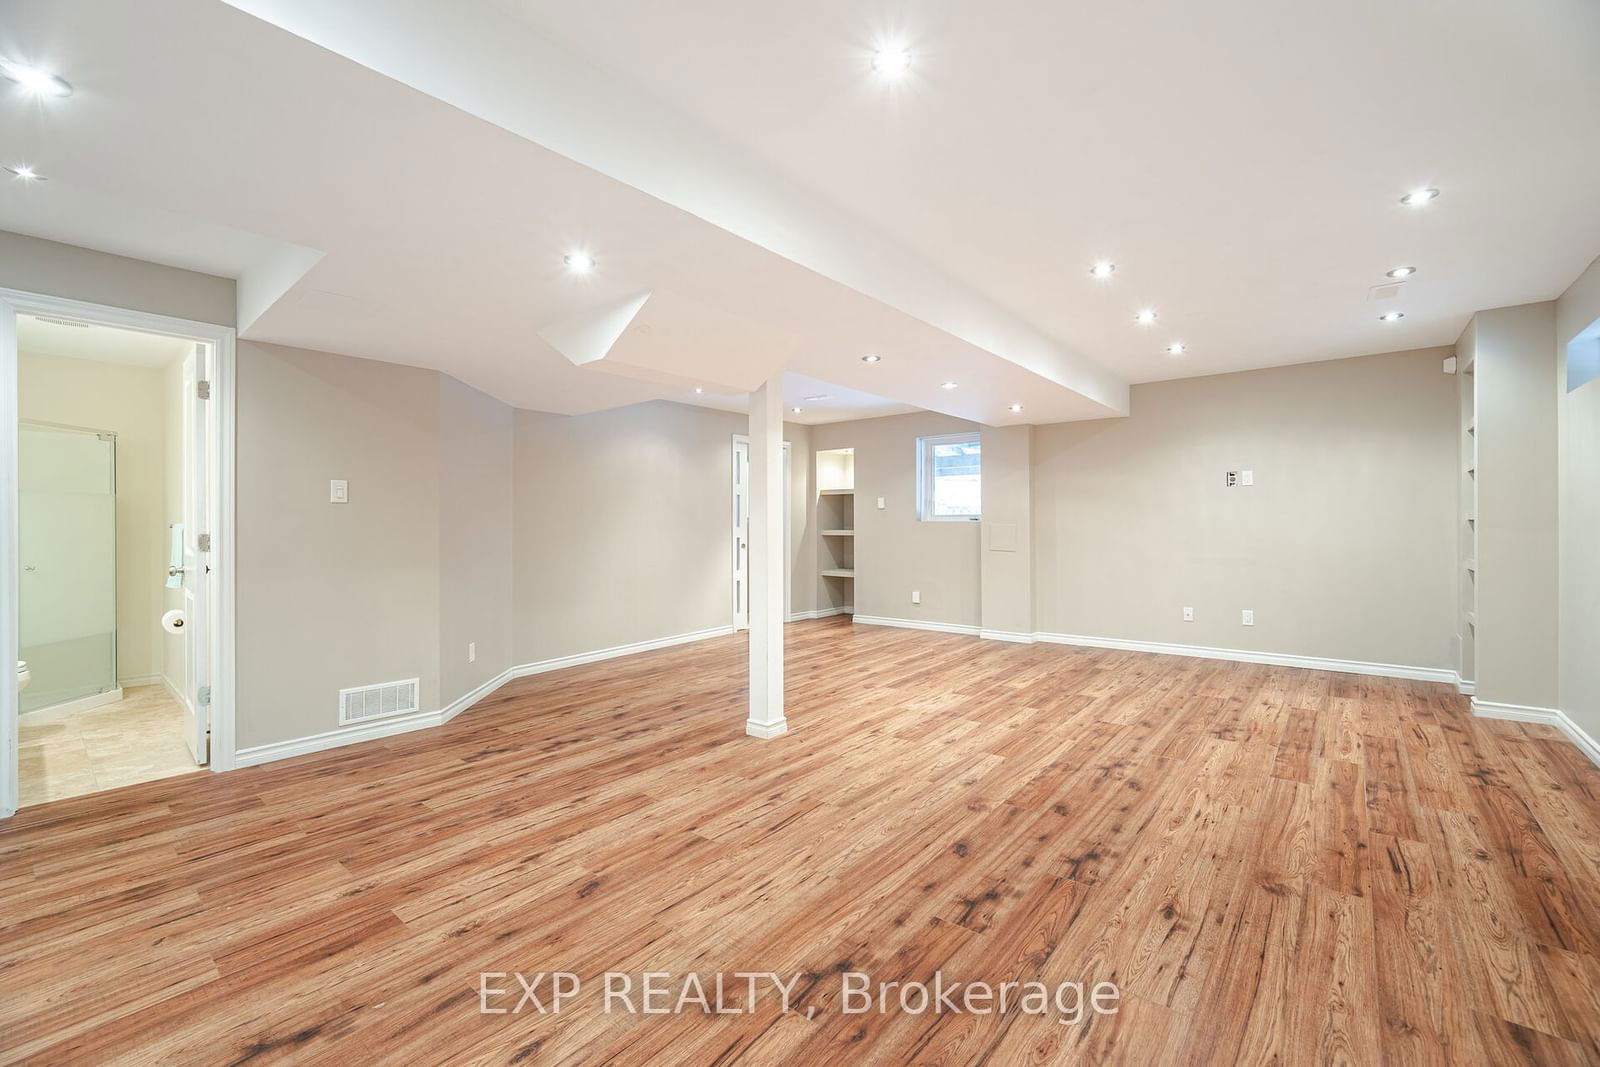
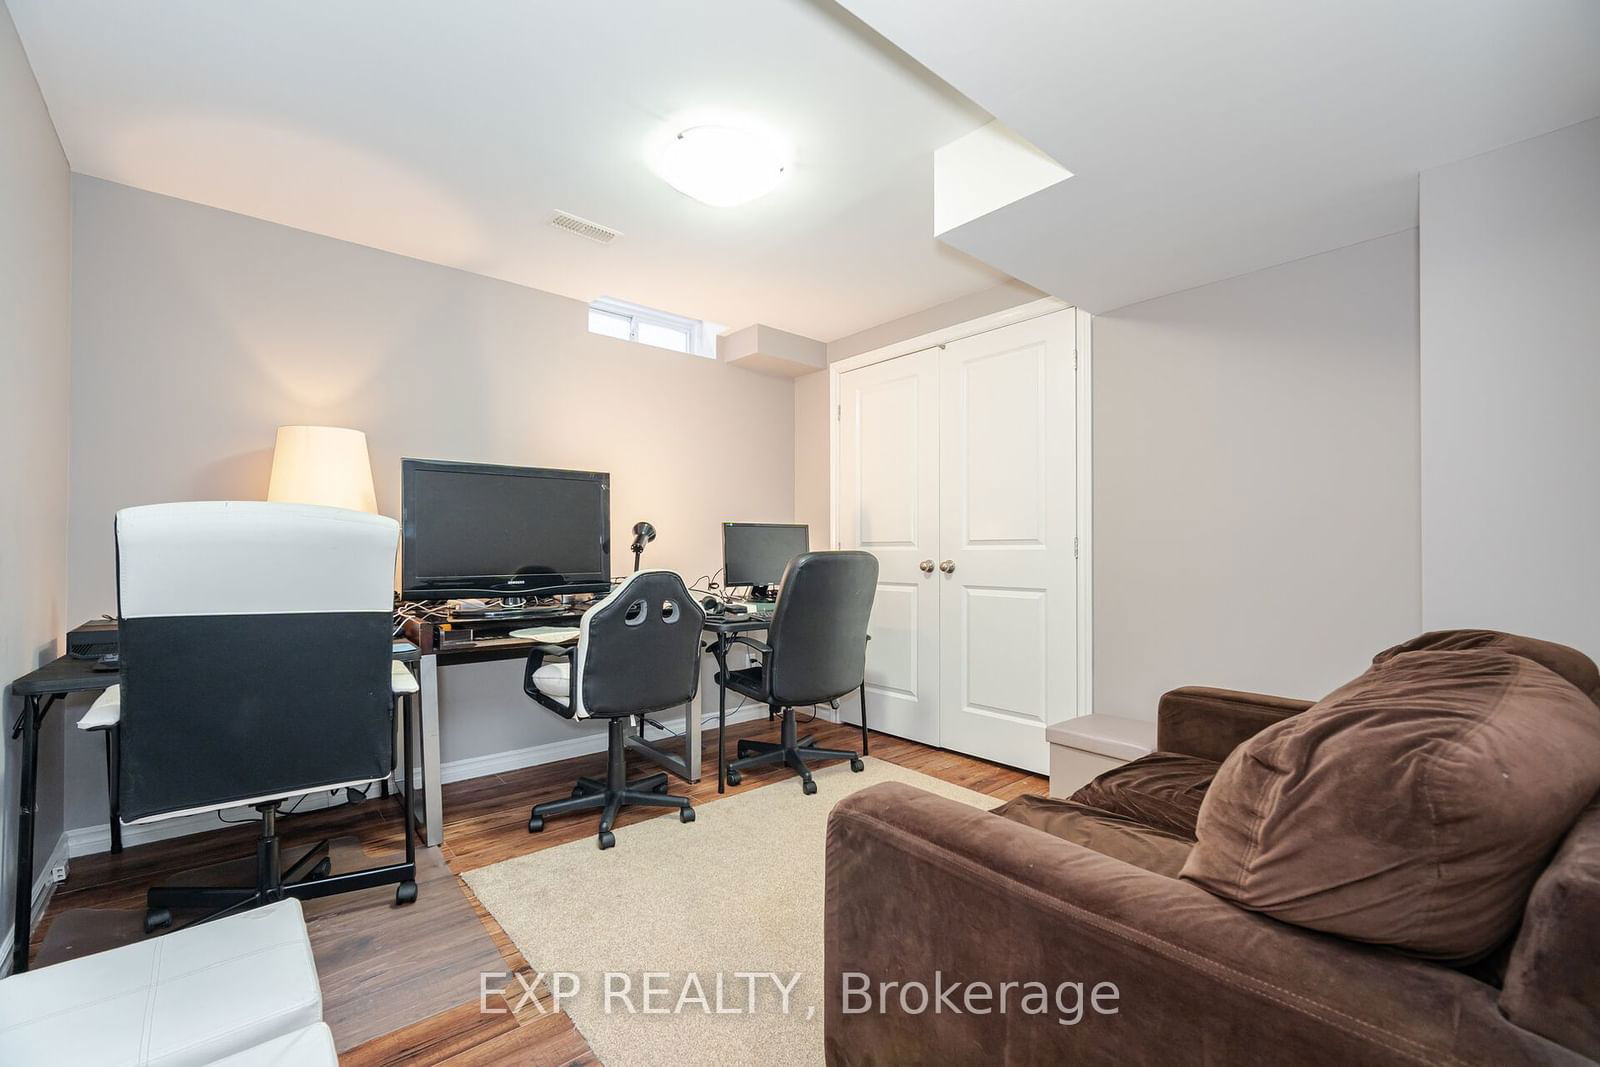
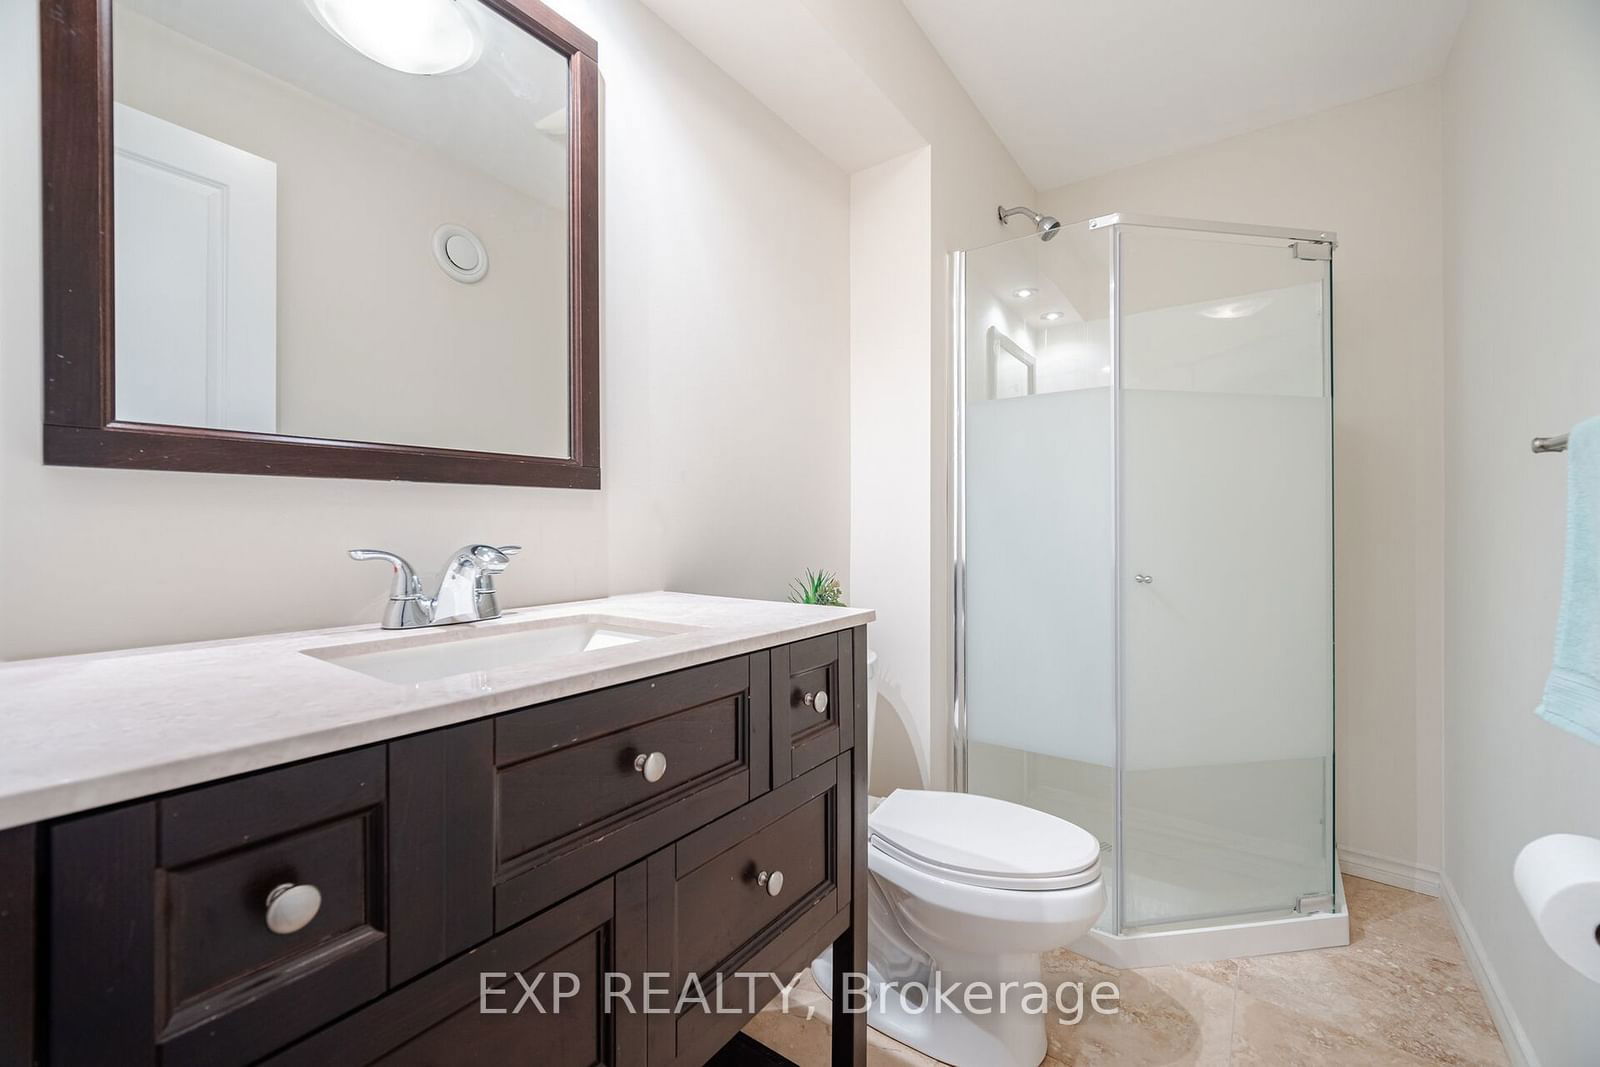
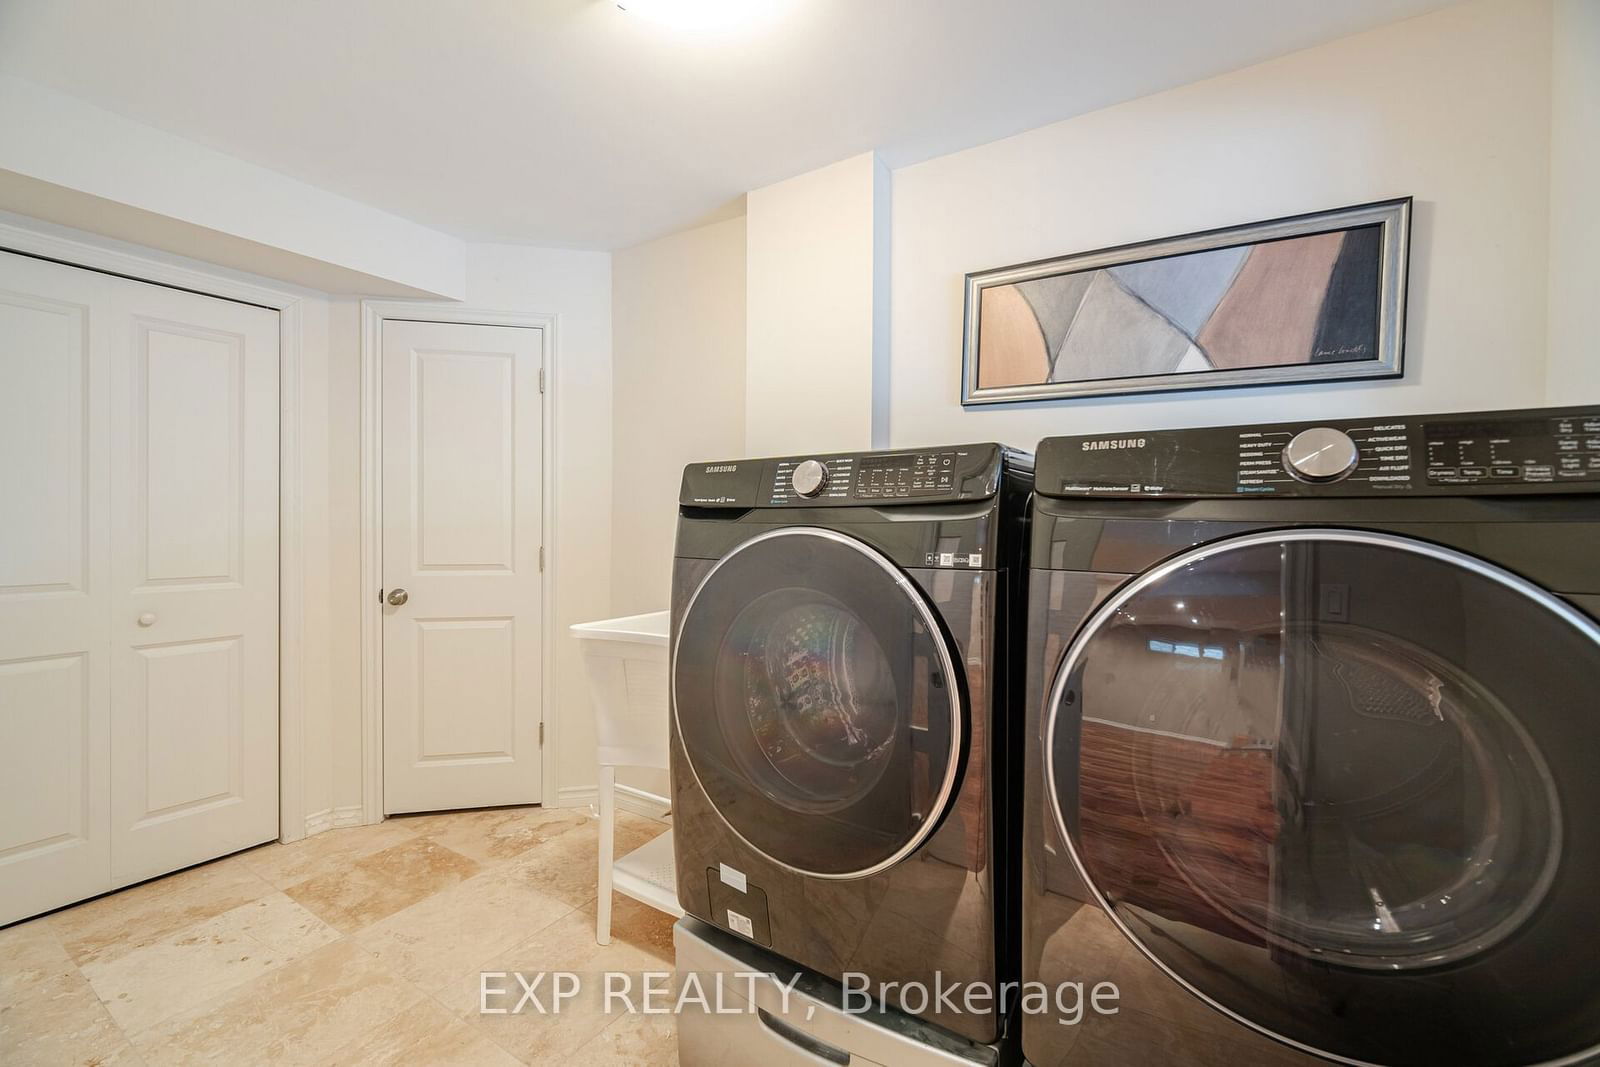
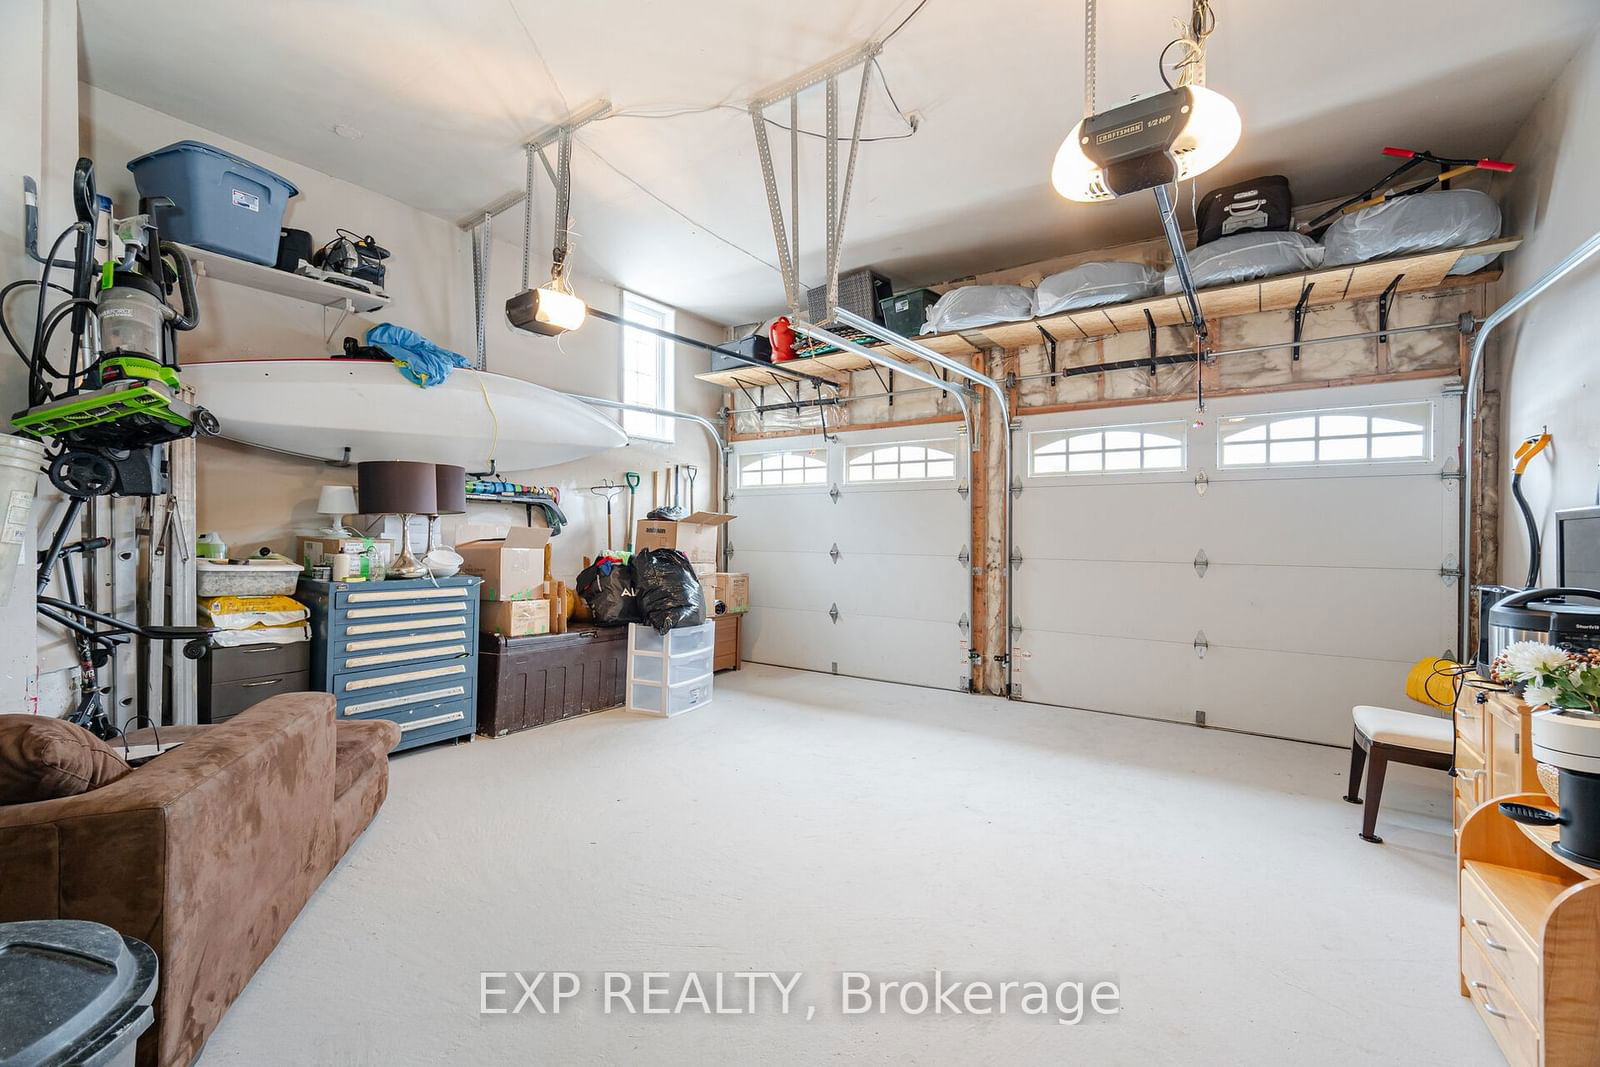
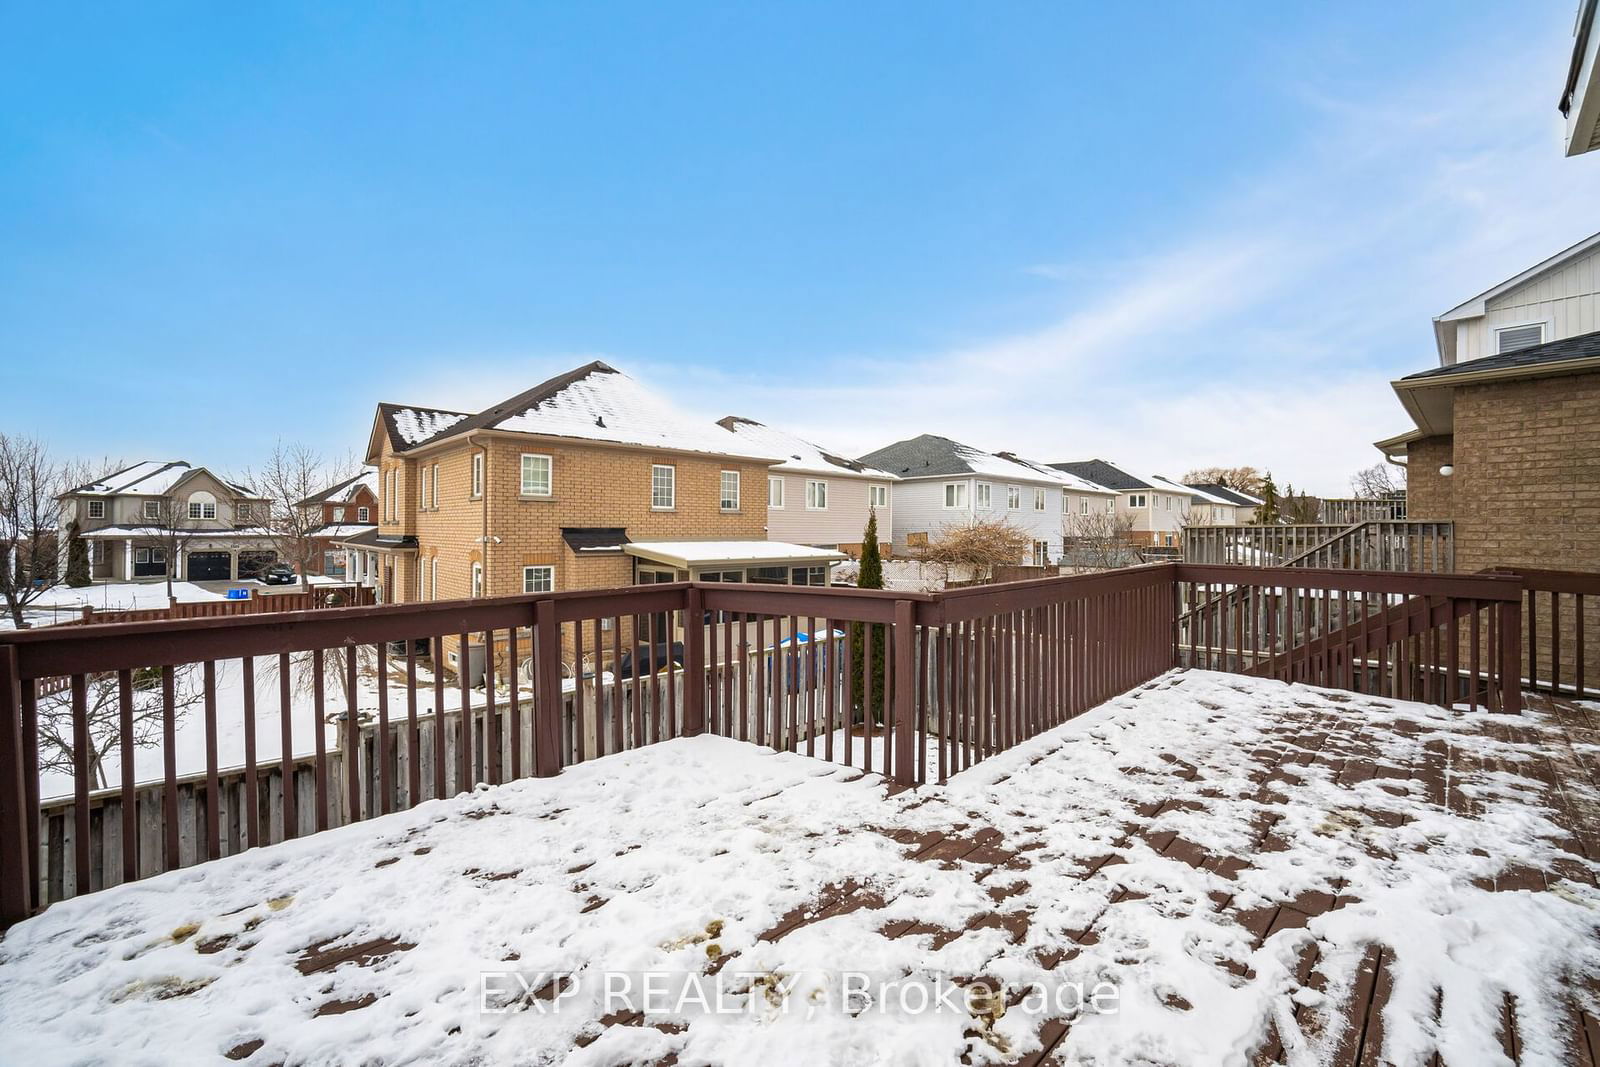
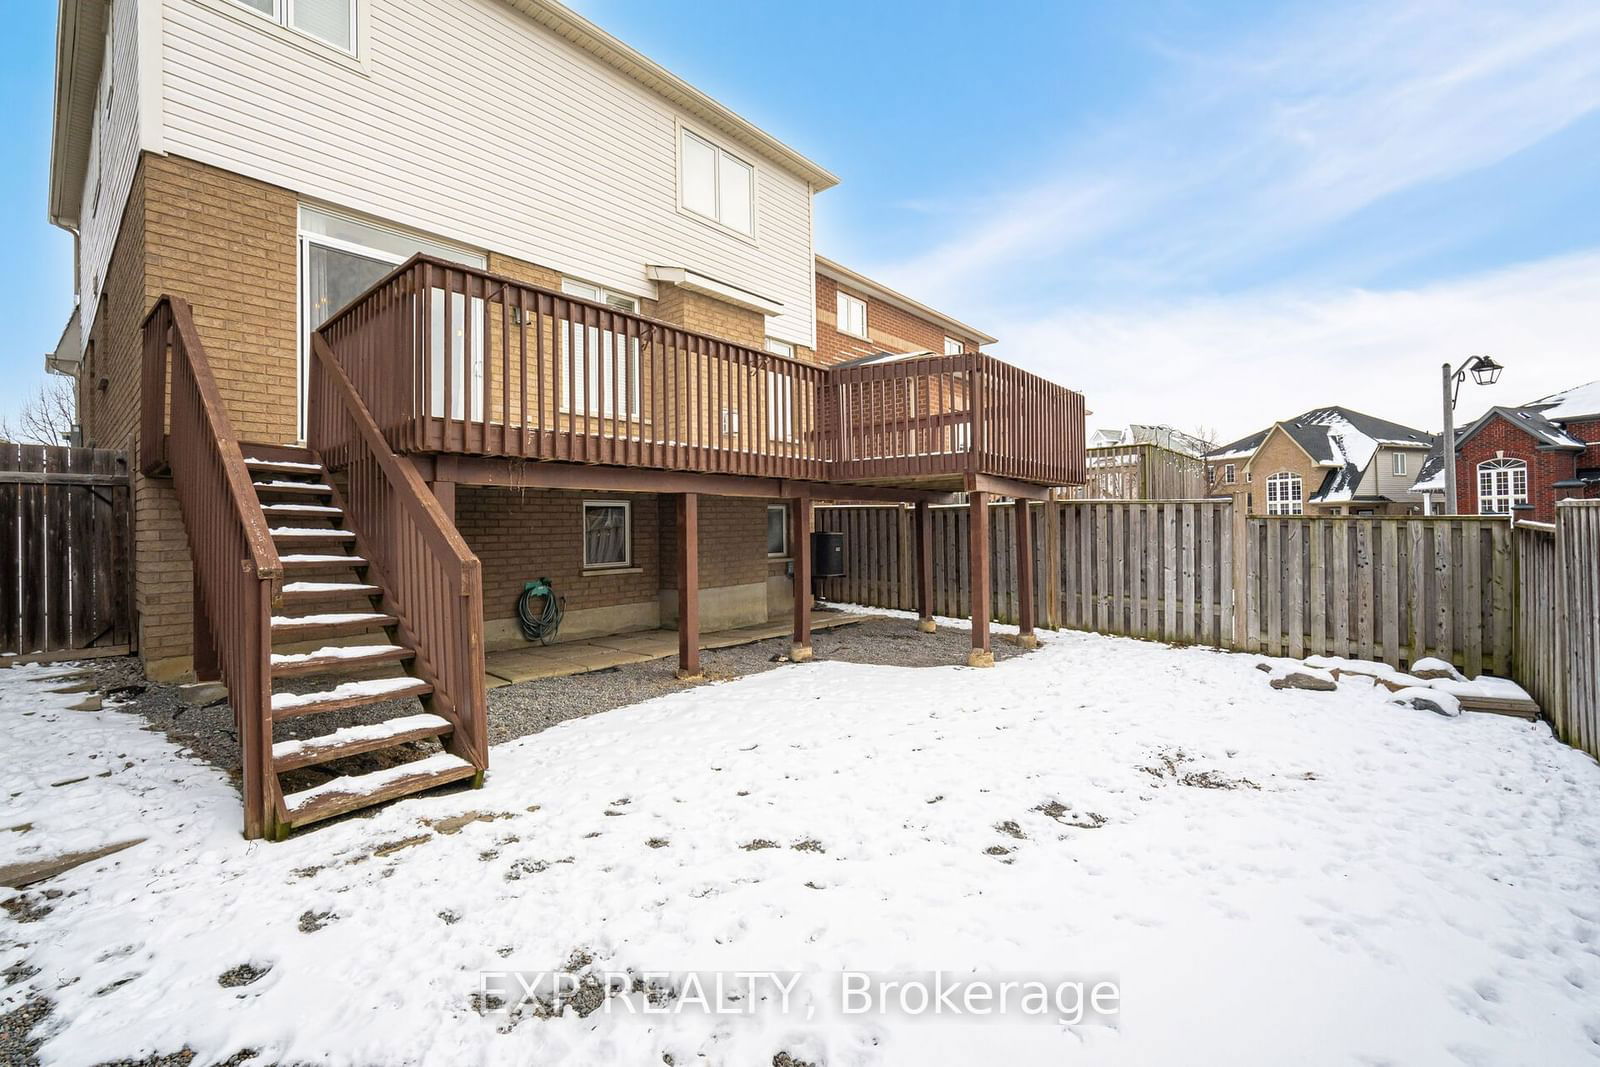
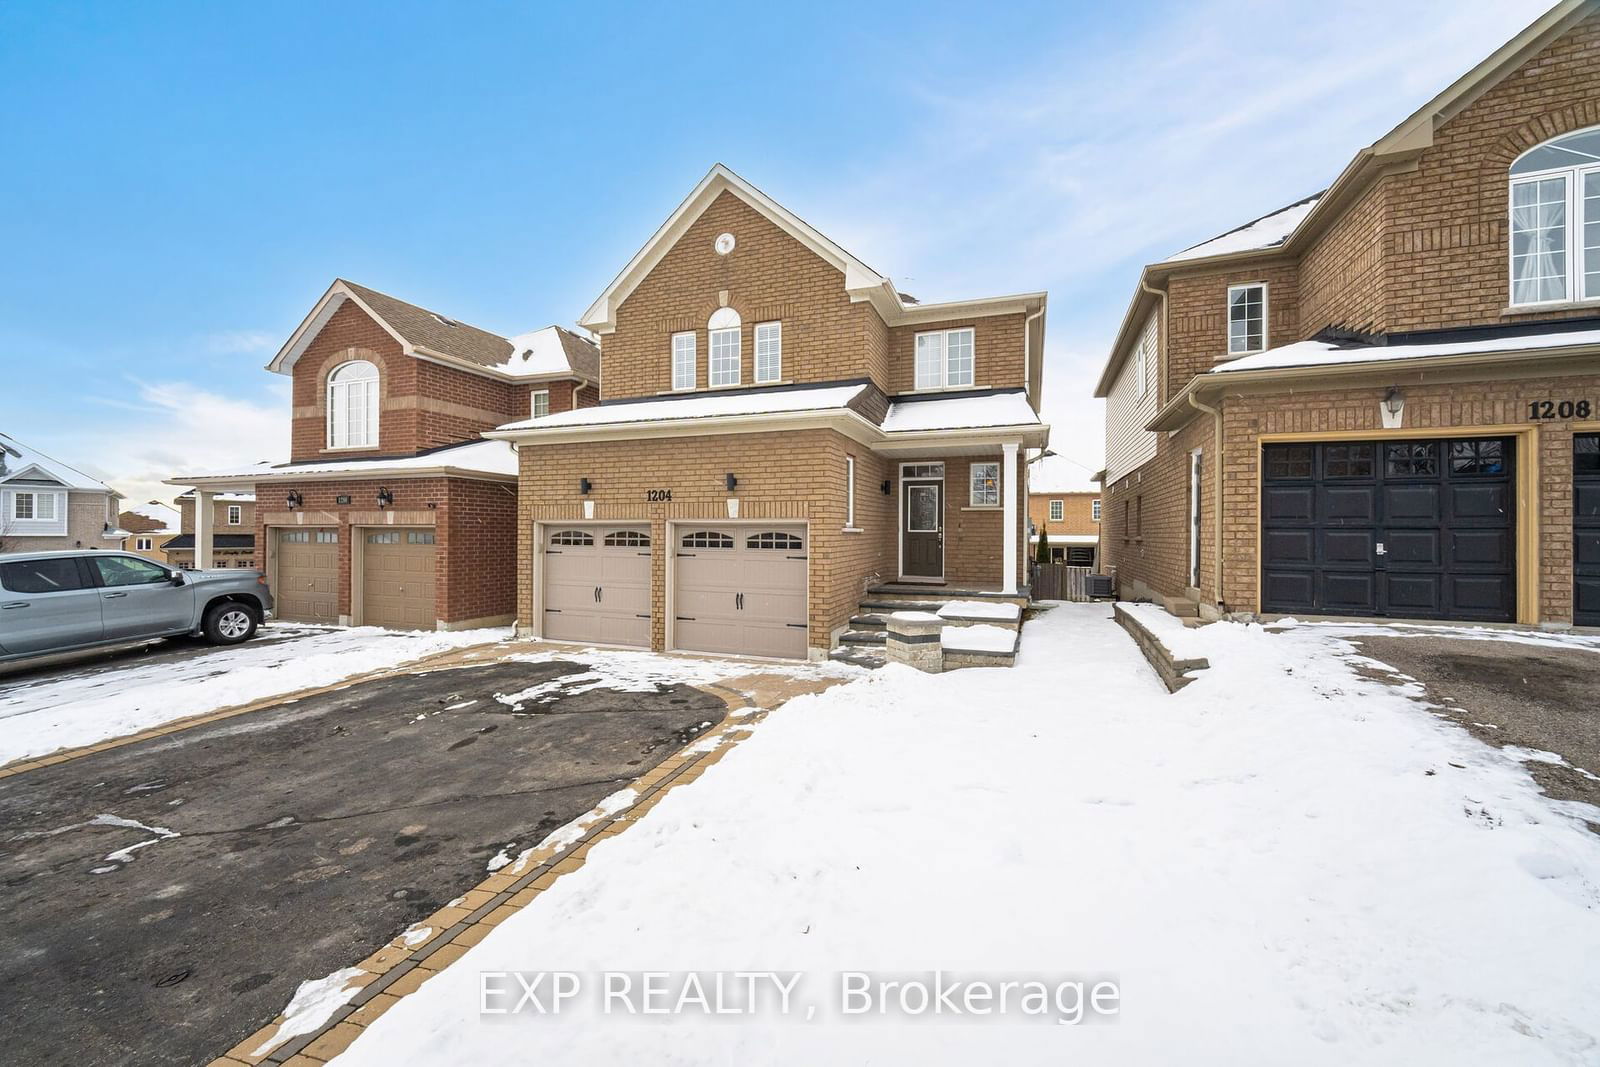
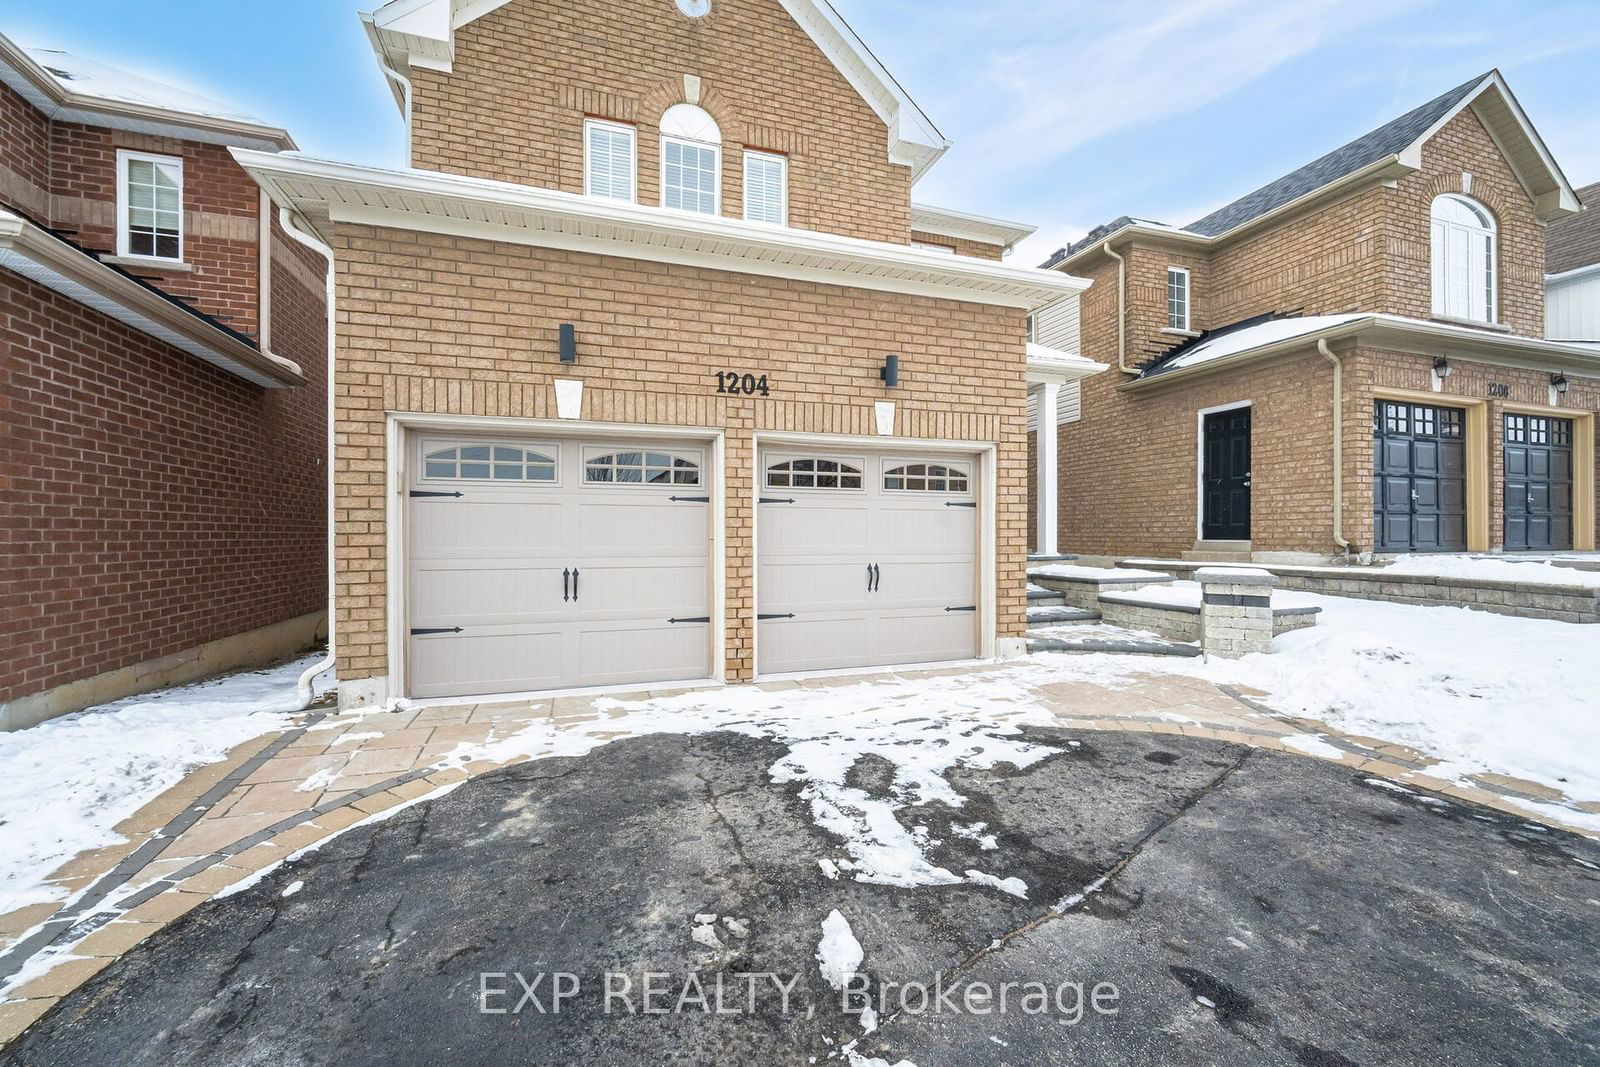
Wow! Welcome Home to Your Very Spacious 5 Bedroom (4+1) Detached 3,159sq.ft Total House with a Renovated Finished Basement and Extra Bedroom In One of Oshawa's Most Sought-After Family-Friendly Pinecrest Neighborhood. Thousands $$$ Invested in Upgraded Front Landscaping. This Beautiful Family Home Is Perfect for Growing Families or Those Who Love to Entertain. The Open-Concept Layout with a Large Living and Dining Area is Perfect for Hosting Your Family & Friends. The Chef-Inspired Spacious Kitchen is Equipped with Modern Appliances, Ample Cabinetry, and a Convenient Breakfast Bar, Making Meal Prep and Entertaining a Breeze. Walkout to Your Spacious Deck to Enjoy Your BBQ During those Summer Sunny Days. A Cozy Family Room with a Gas Burning Fireplace Adds the Warmth and Comfort to Your New Home. A Main Floor Powder Room with Convenient Access to Your Spacious Double Door Garage Completes this Main Level. The Spacious Primary Bedroom with a Walk-In Closet and a Luxurious 5-Piece Spa-like Ensuite Bathroom has You Feel at Home. The Three Additional Upper Level Bedrooms and Bathroom Provide Provide Plenty of Space for the Whole Family. The Beautifully Renovated Finished Basement Offers an Extra Bedroom and Even More Versatile Living Space, Ideal for Rec Room, Home Office or Gym. Hurry! This Won't Last. Must See Virtual Tour with Floor Plans. Visit www.1204LangleyCircle.com. **Open House Sat & Sun Jan 25th & 26th from 2-4pm**
Prime Location! Steps to Schools, Restaurants, Shopping Such as FarmBoy, Shoppers Drug Mart, Winners, HomeSense/Marshalls, Home Depot, LCBO, Best Buy, TD Bank, RBC, BMO, Petsmart & More! **Open House Sat & Sun Jan 25th & 26th from 2-4pm**
Living
Family
Dining
Kitchen
Prim Bdrm
2nd Br
3rd Br
4th Br
5th Br
Rec
Breakfast
The graph below compares the average list price and average sale price of homes in this neighborhood by month for the last 24 months. When average sale price is greater than average list price, this may suggest a buyer's market. When average sale price is lower than the average list price this may suggest a seller's market.
The graph below illustrates the average days on market for homes in this neighborhood. The yellow area may indicate a buyer's market, the green area may indicate a balanced market and the red area may indicate a seller's market.
Sales Representative, Century 21 People’s Choice Realty Inc., Brokerage
(647) 576 - 2100