
Century 21 People’s Choice Realty Inc., Brokerage
120 MATHESON BLVD E #103
MISSISSAUGA, Ontario
L4Z 1X1

Oshawa, Eastdale, L1K 1K4
$599,990
Listed by RIGHT AT HOME REALTY.
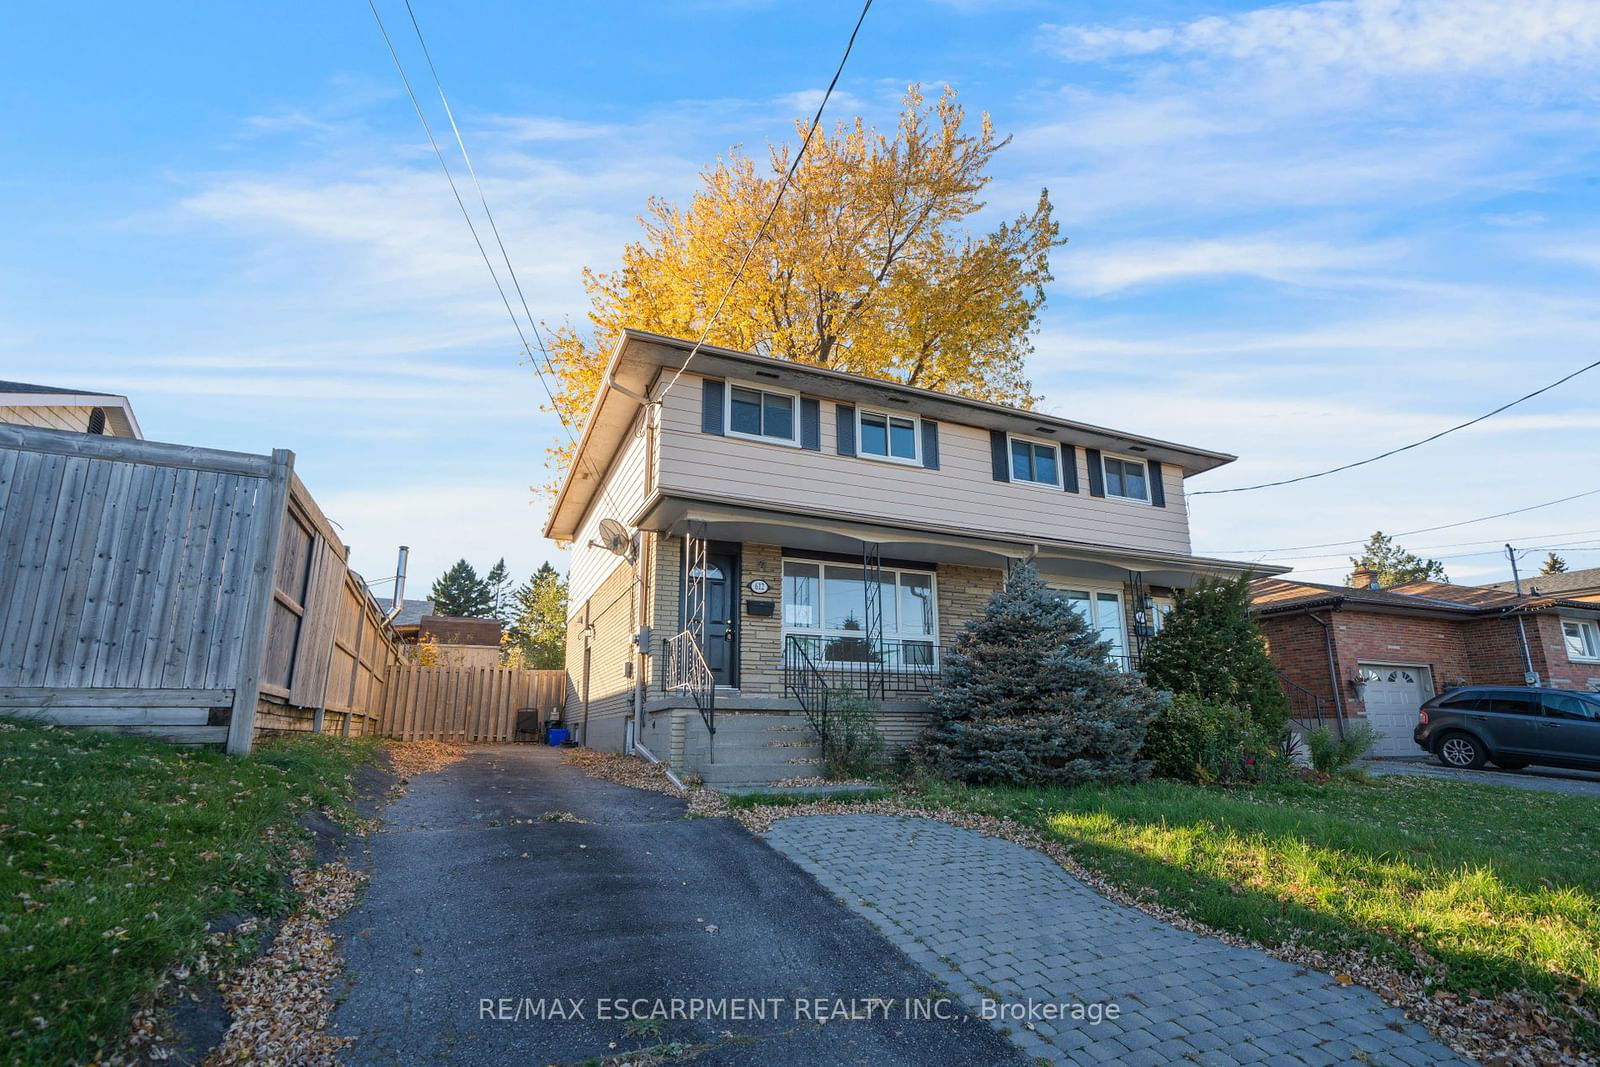
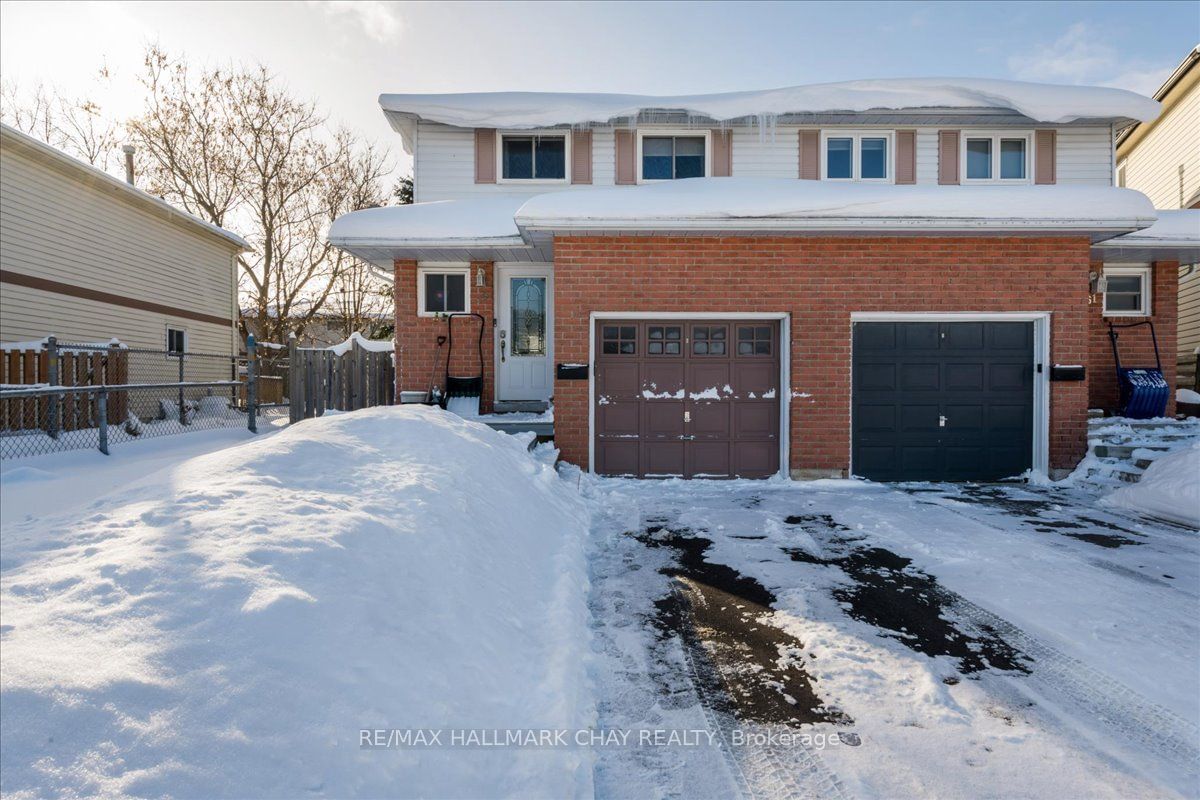
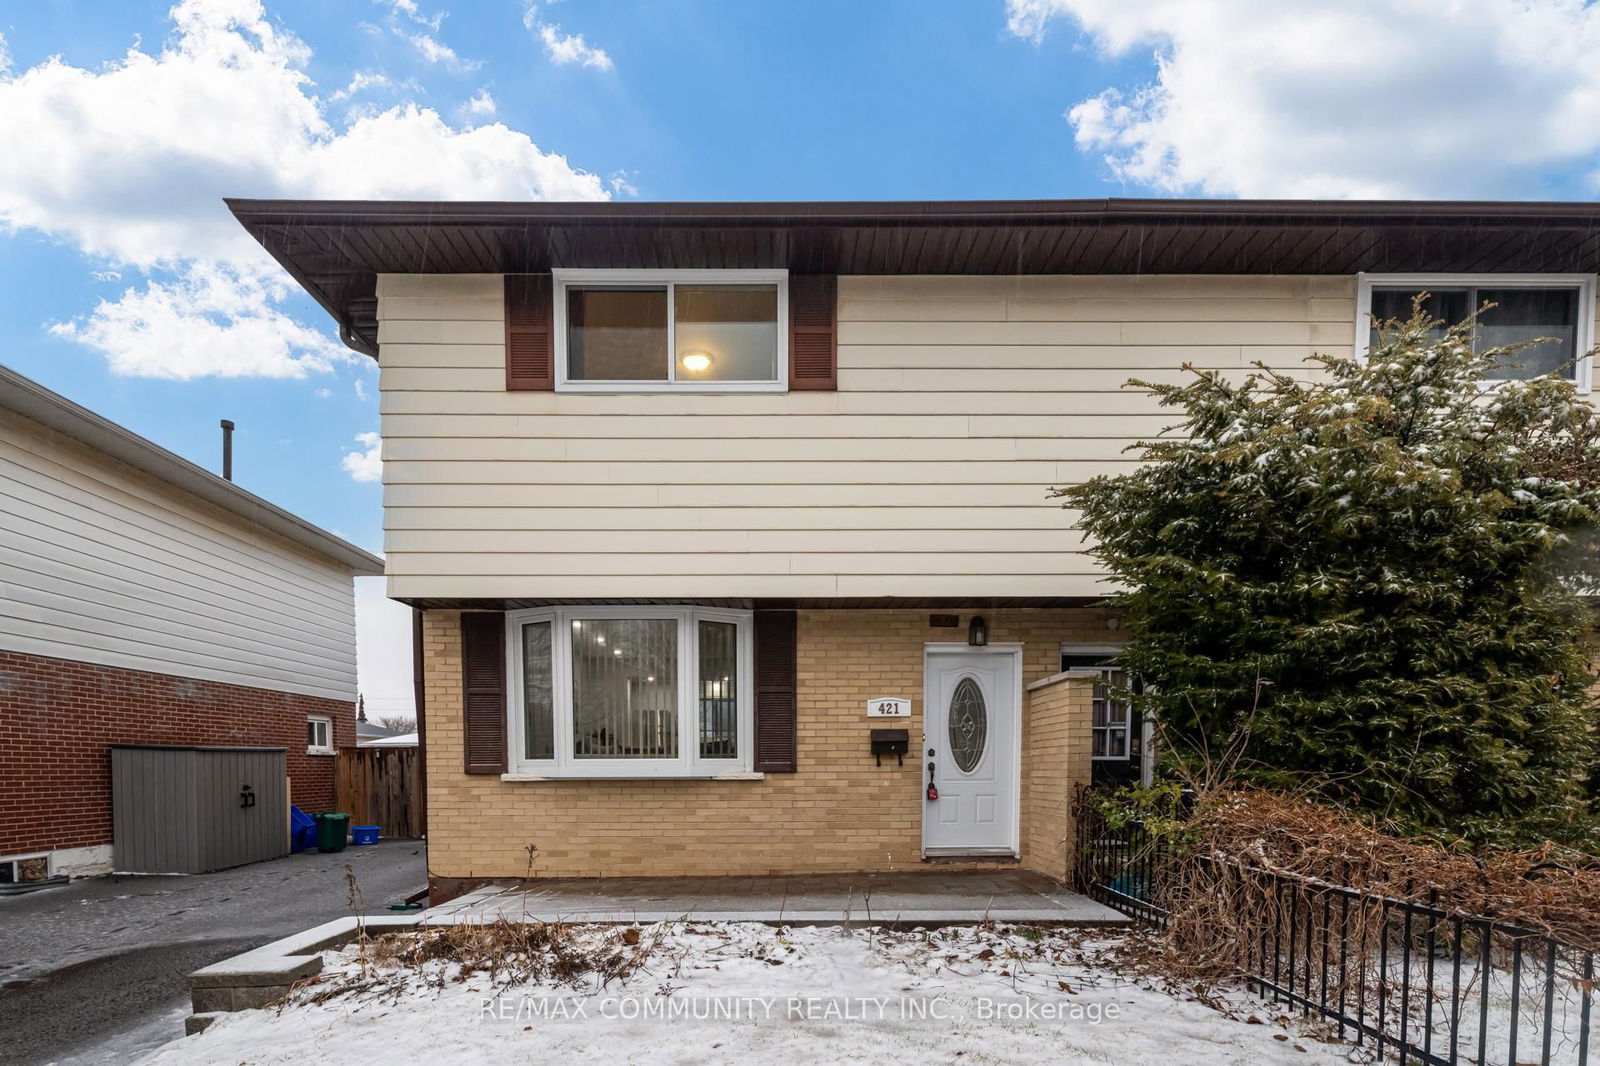
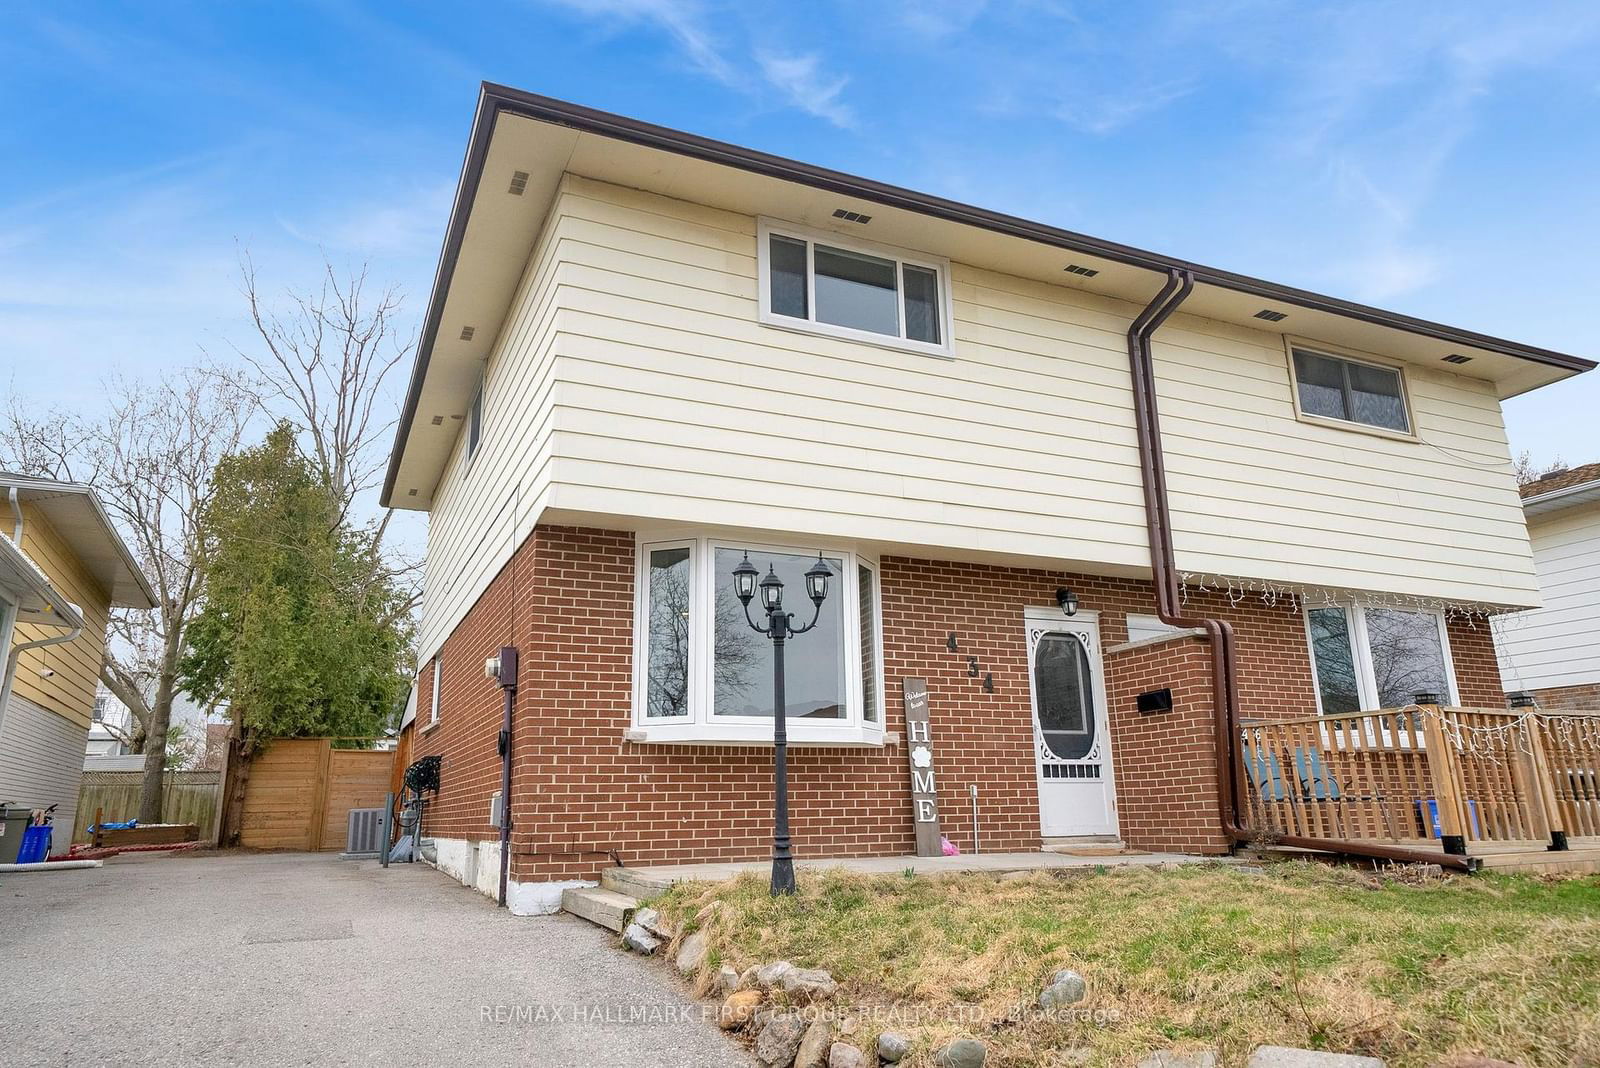
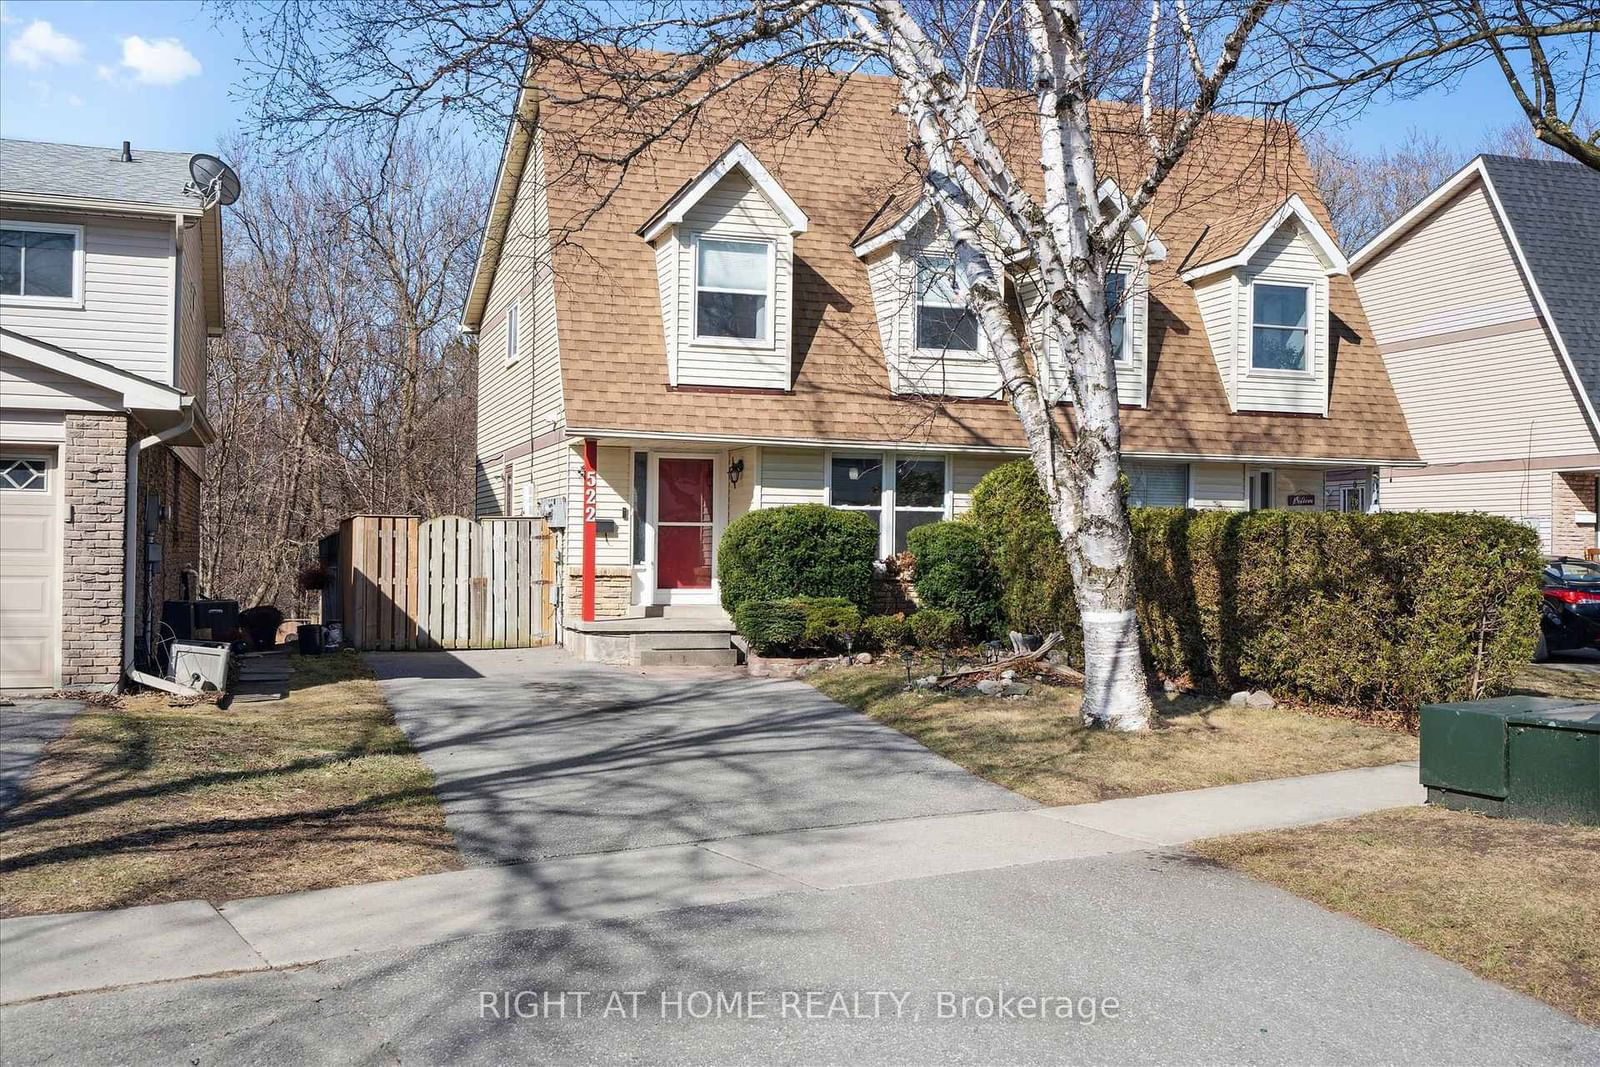
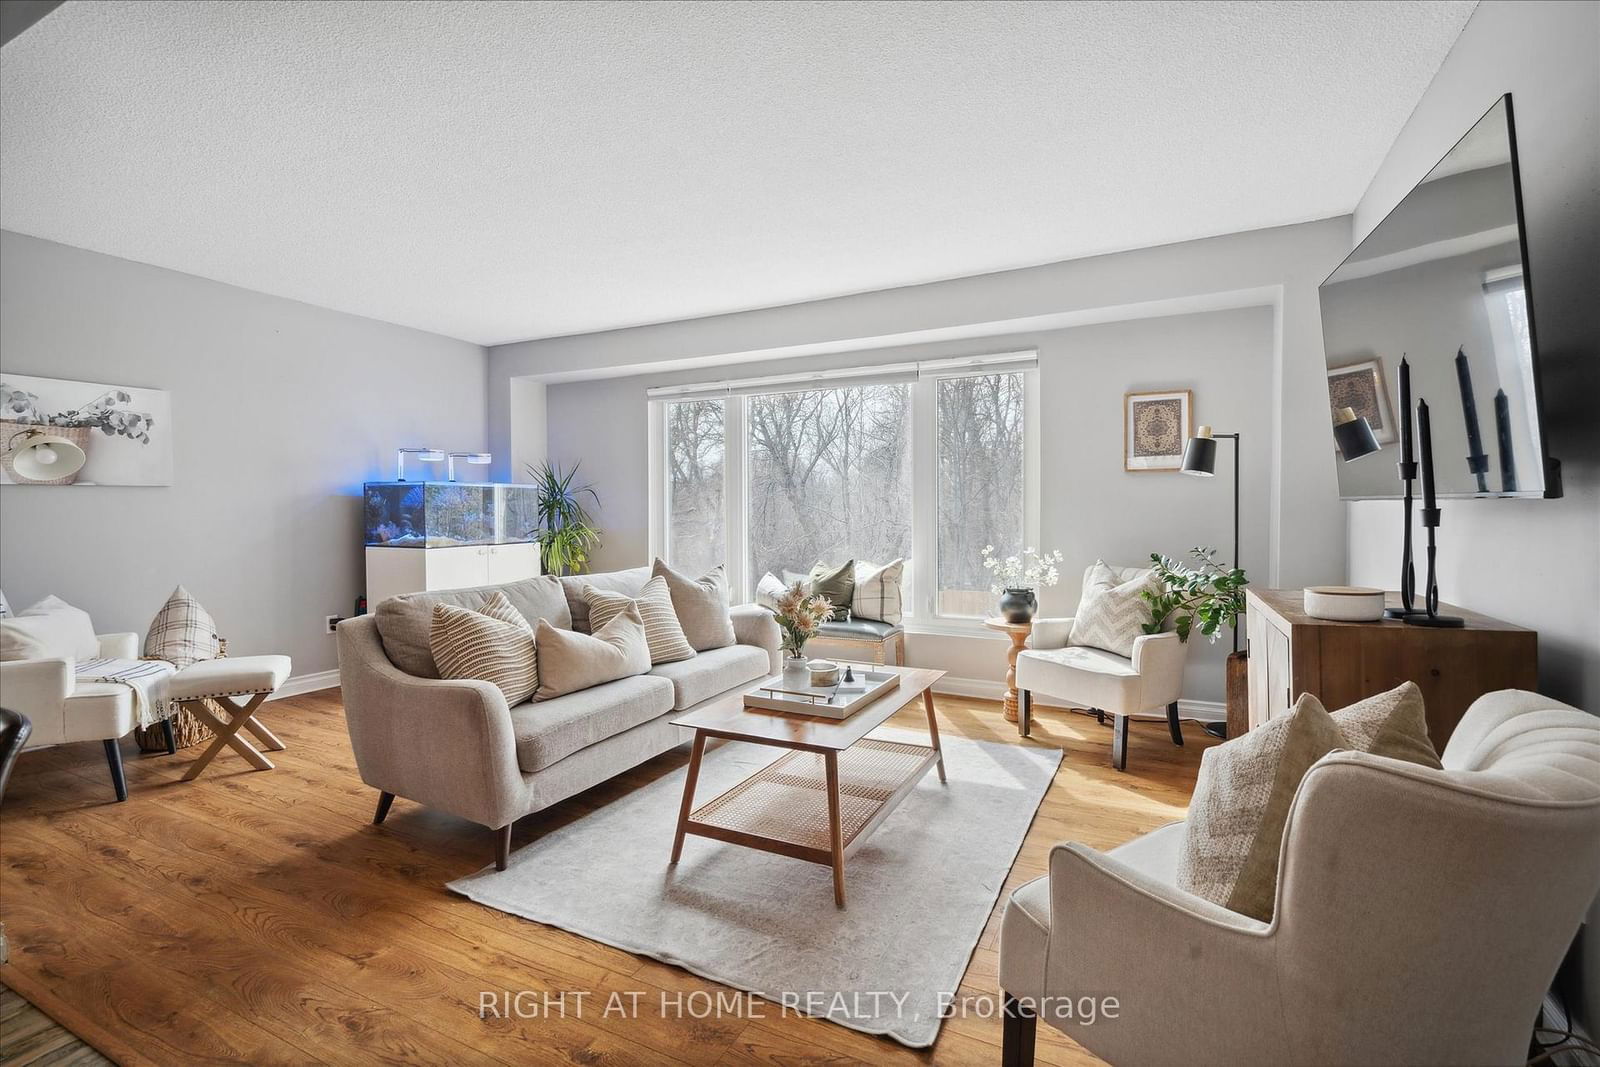
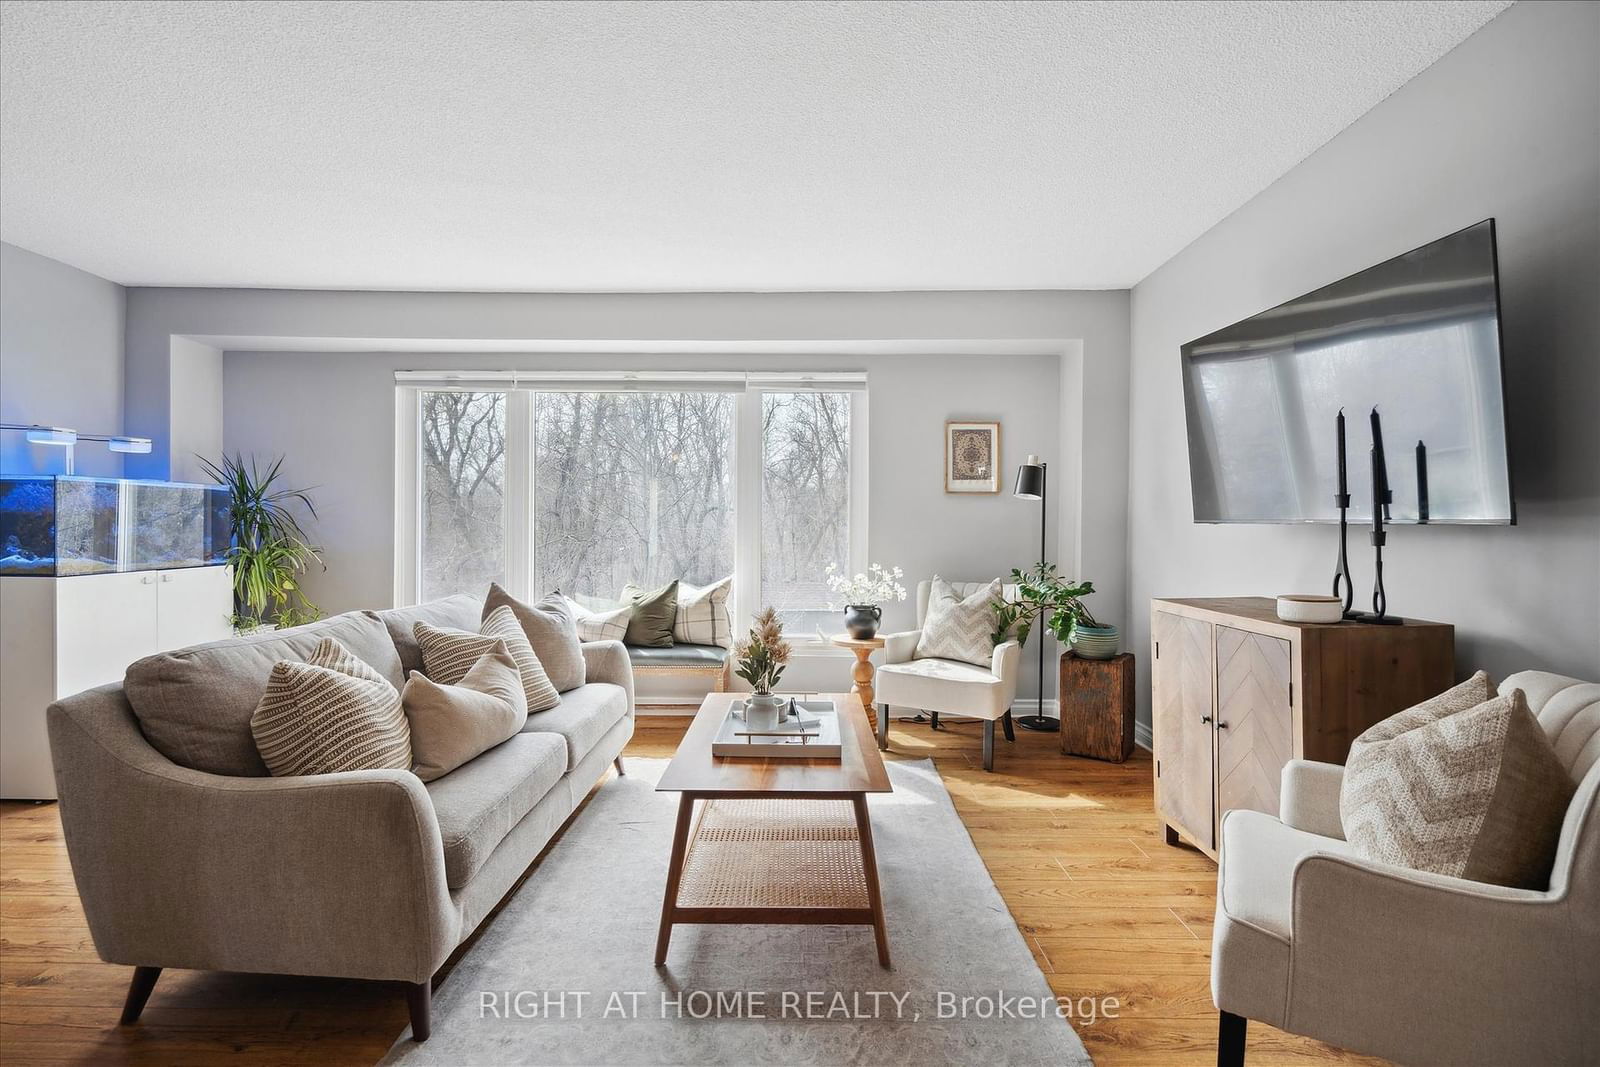
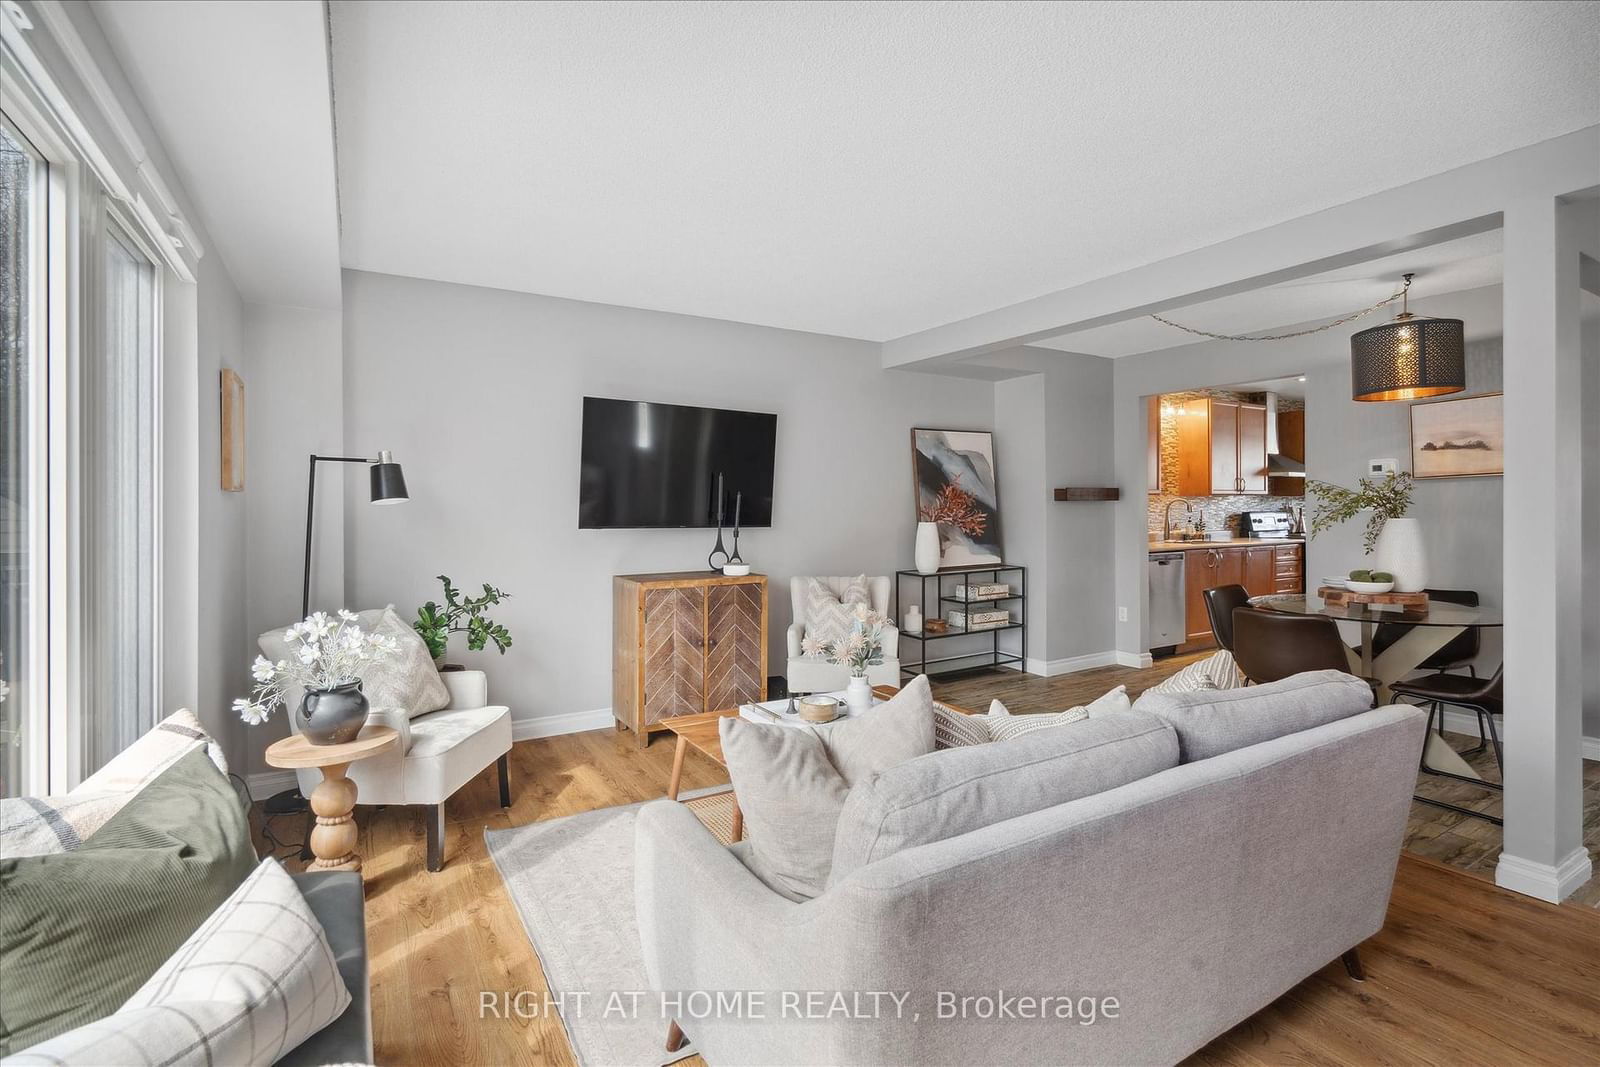
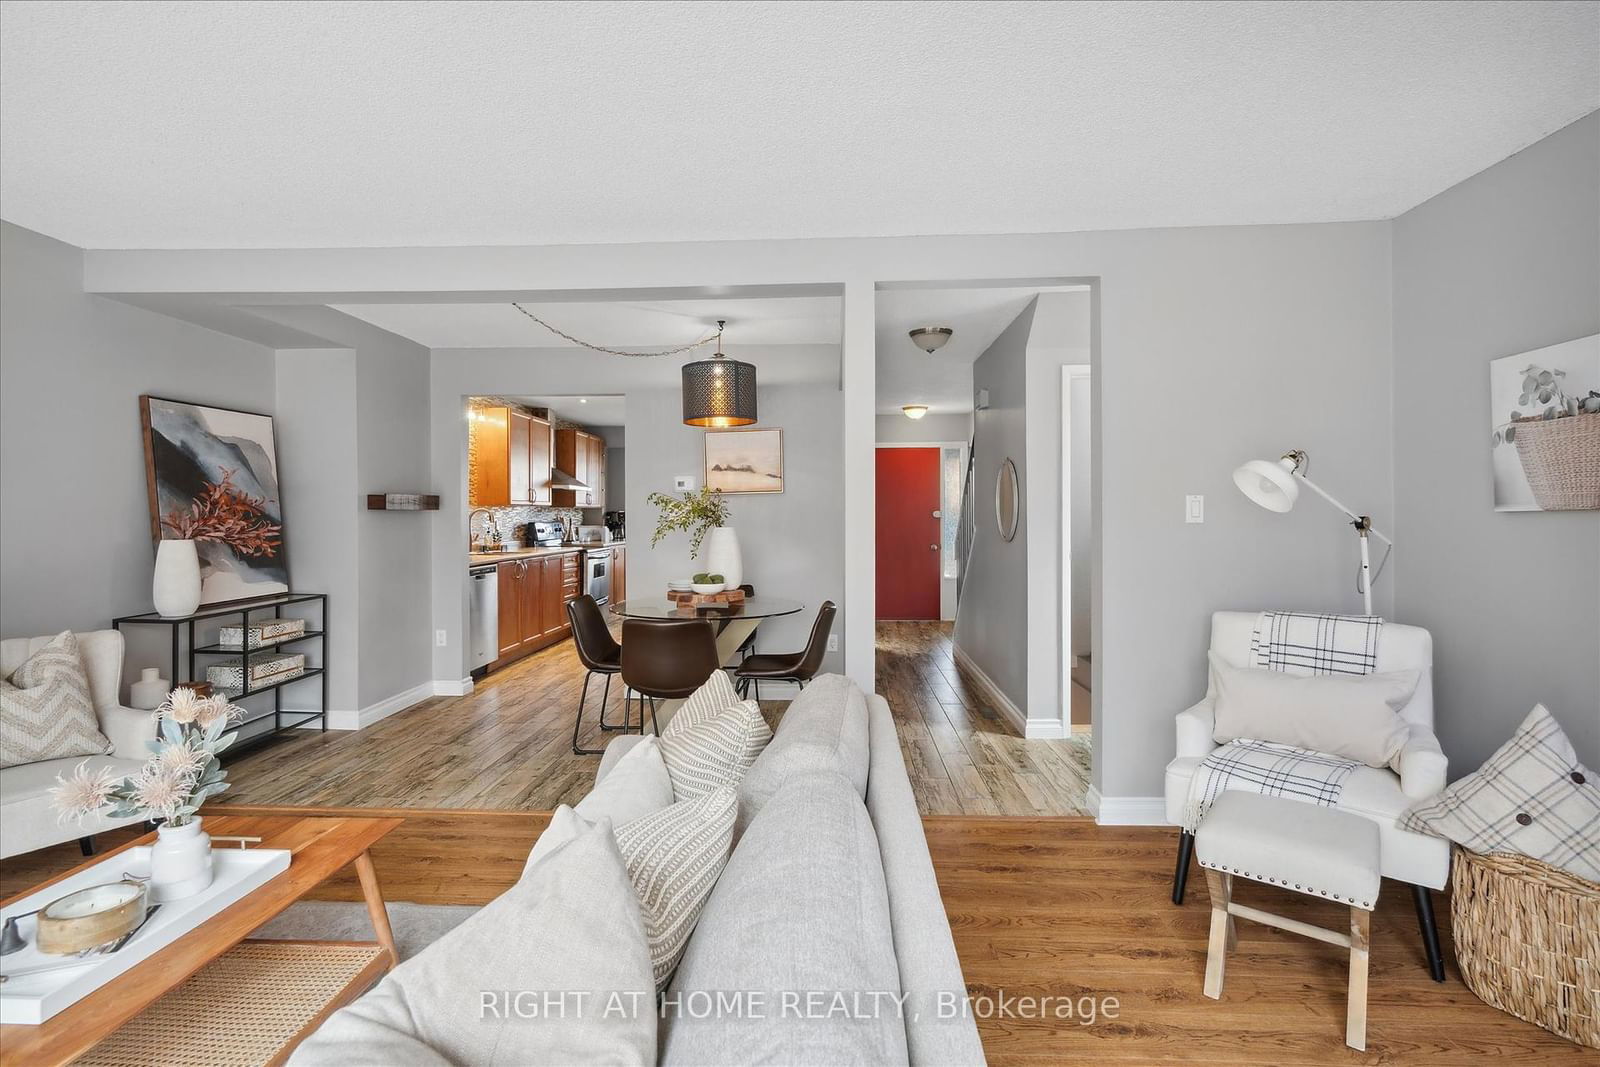
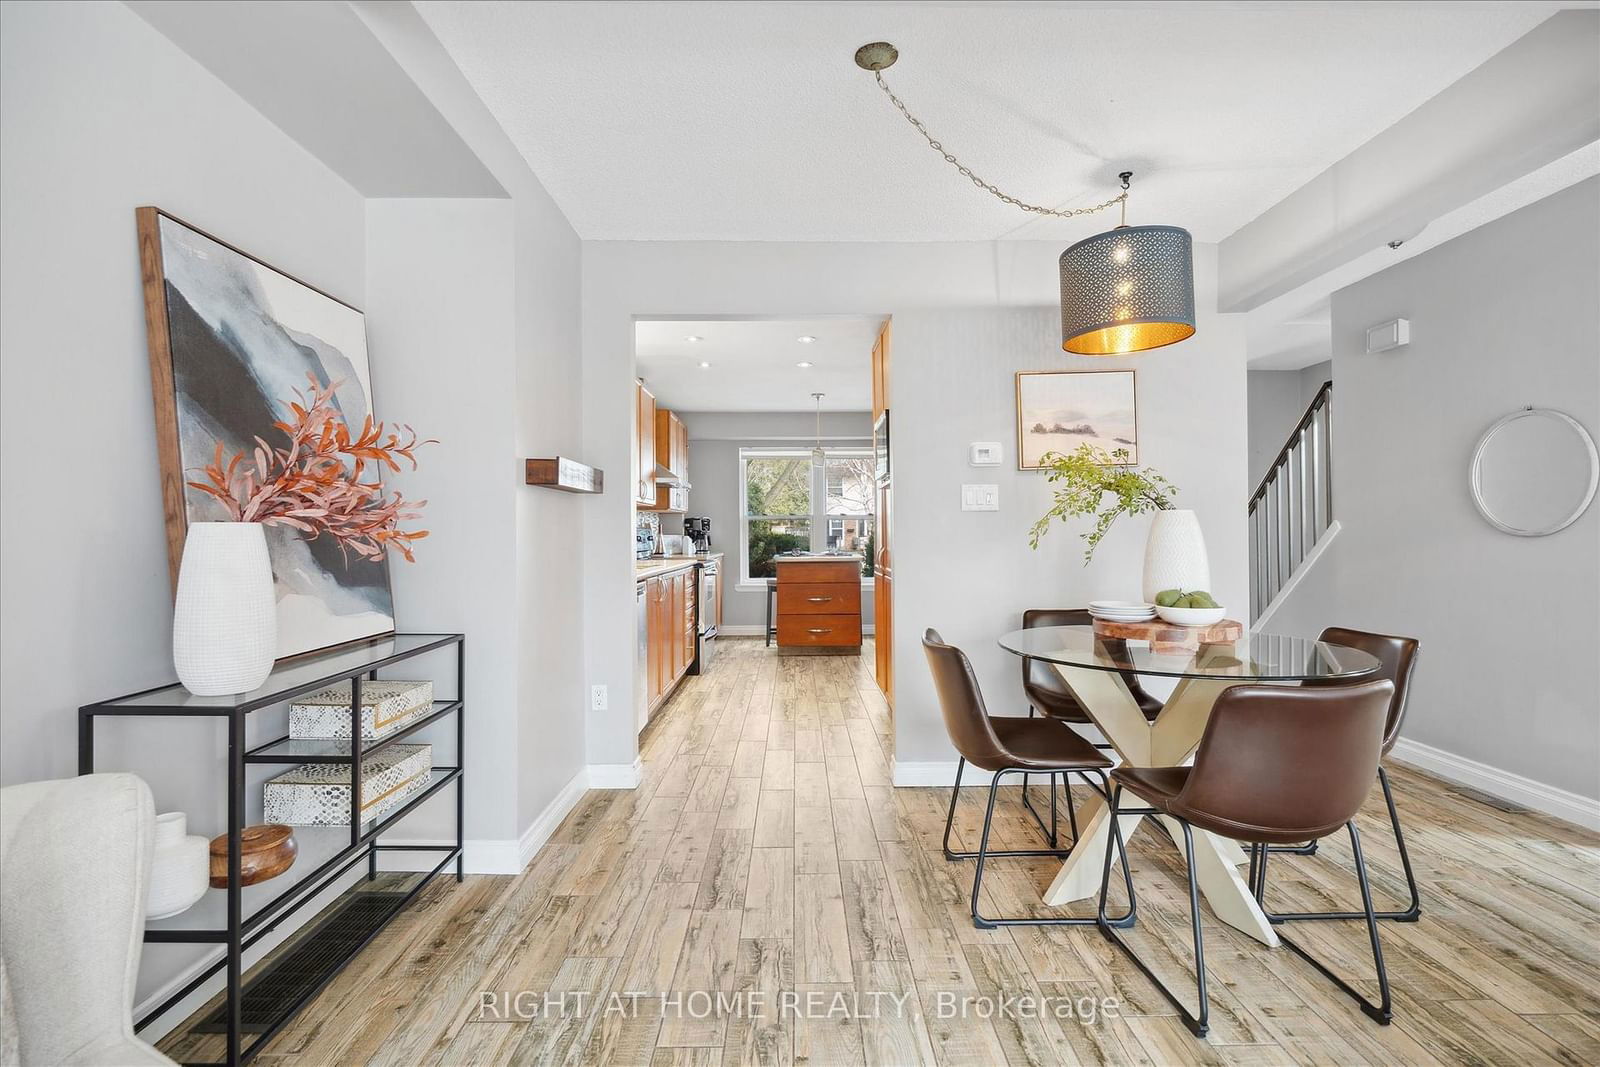
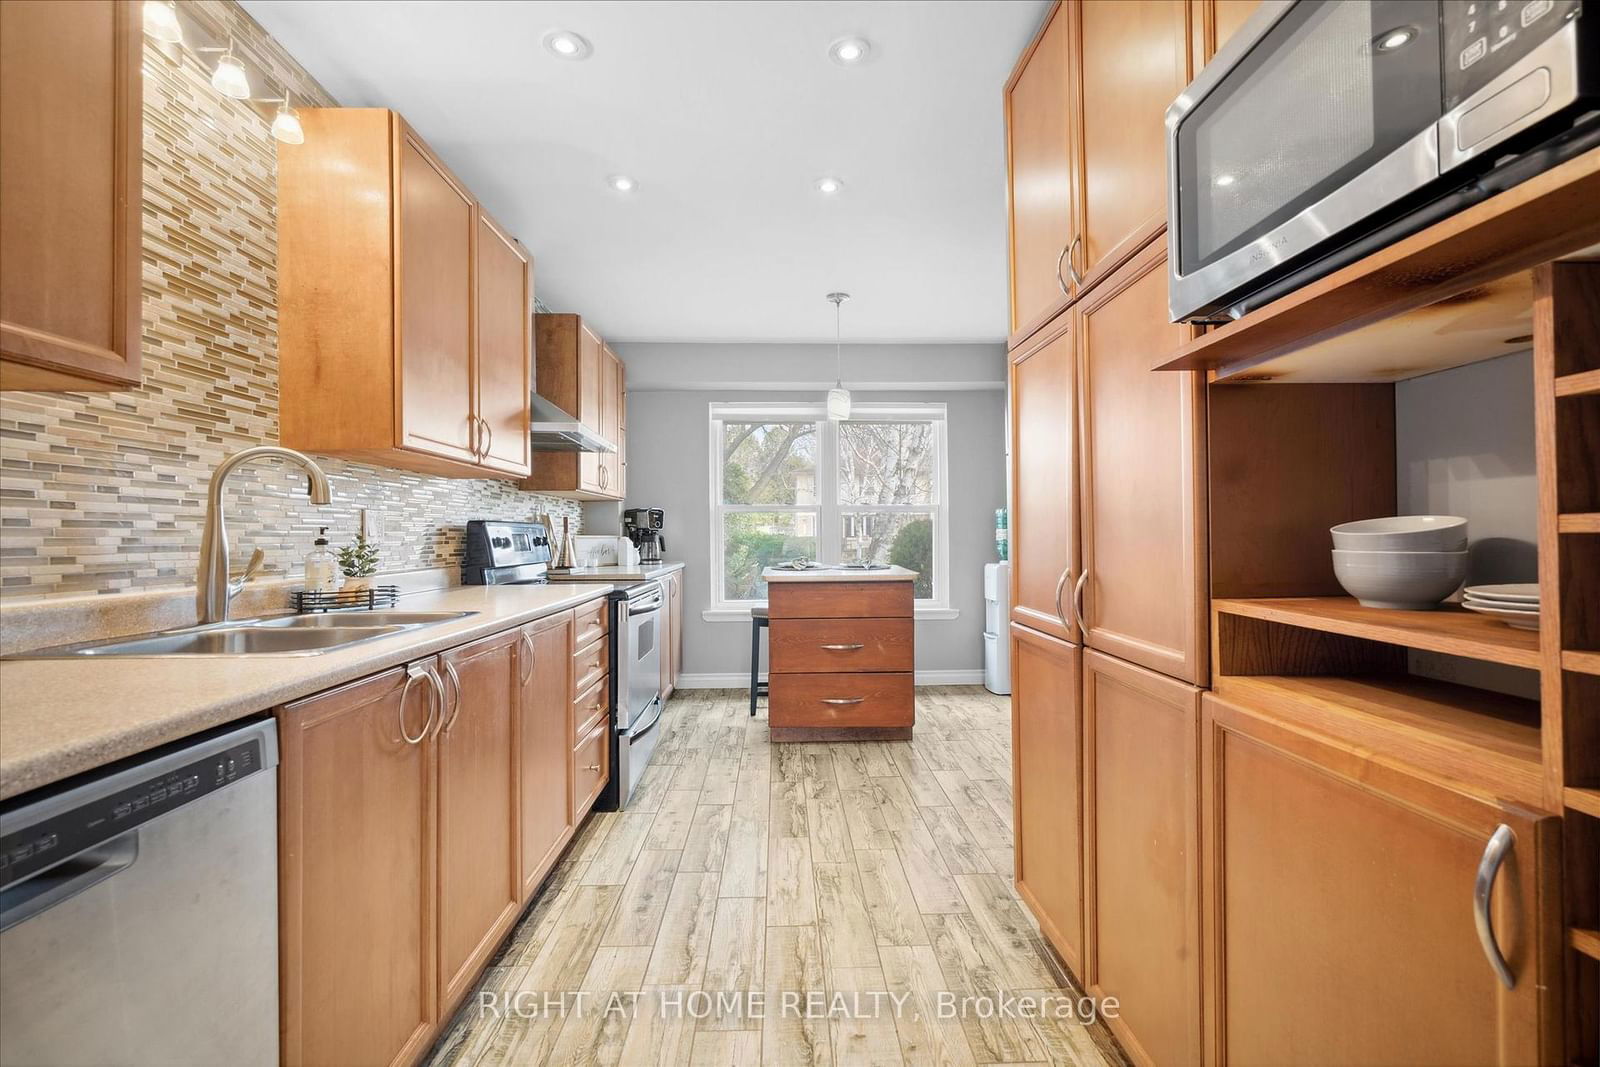
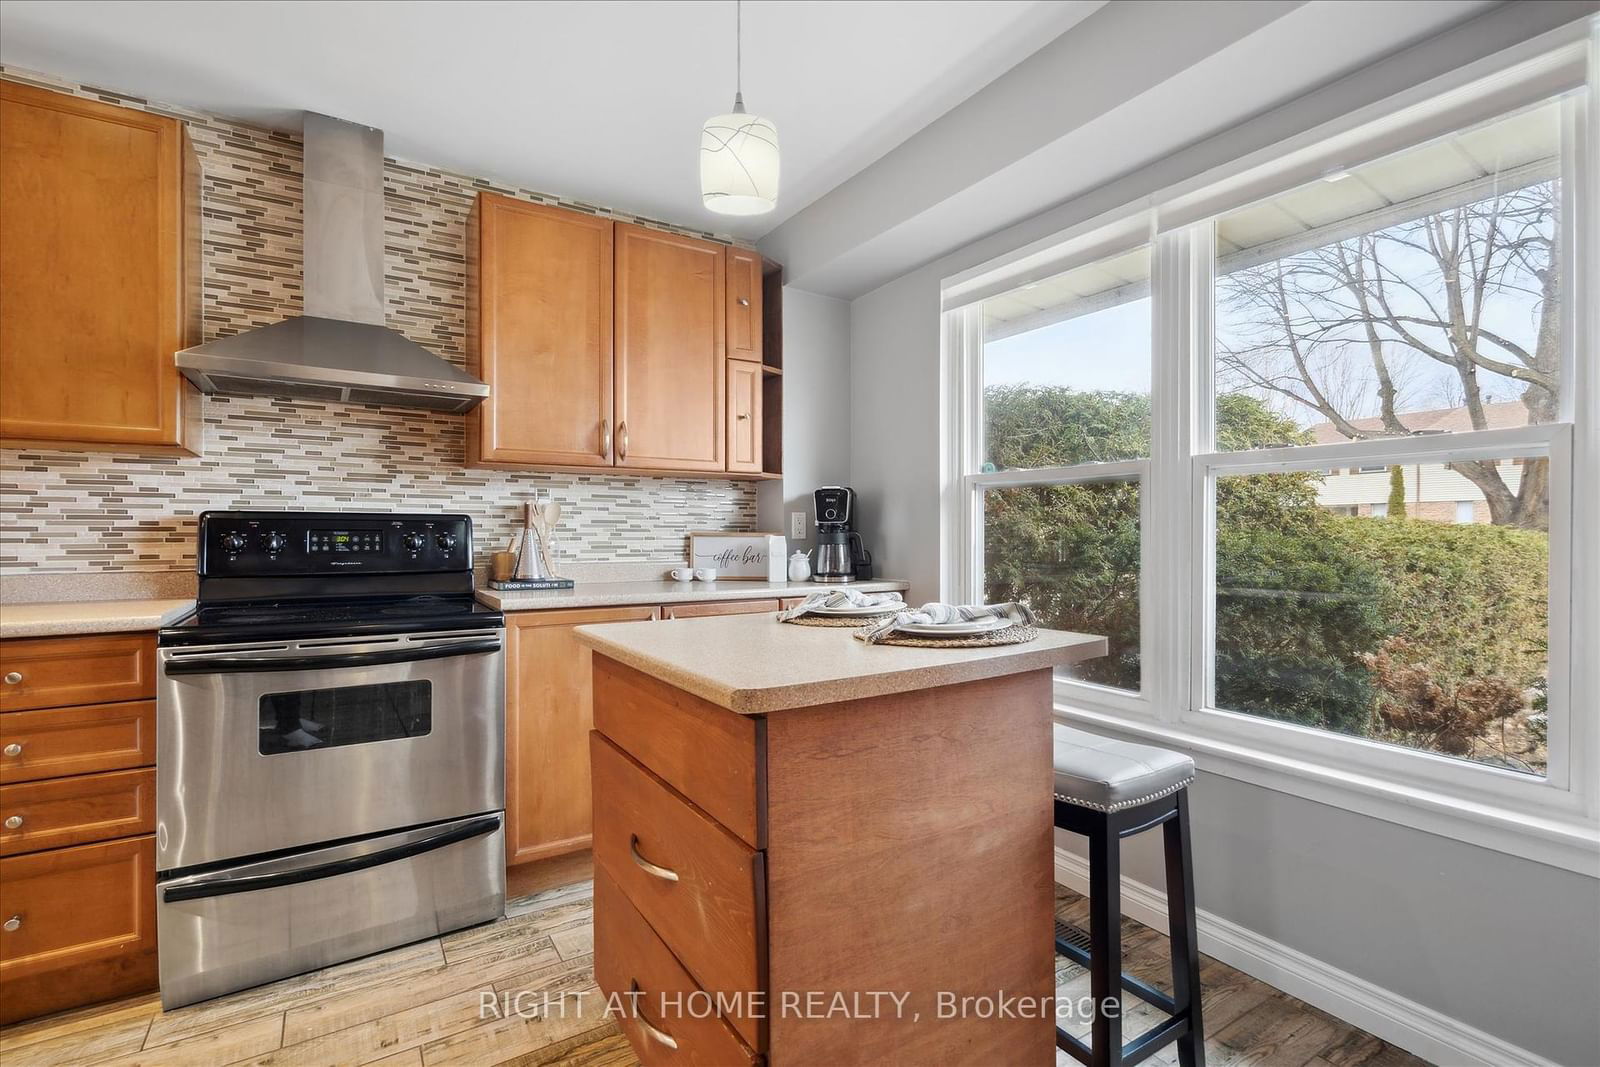
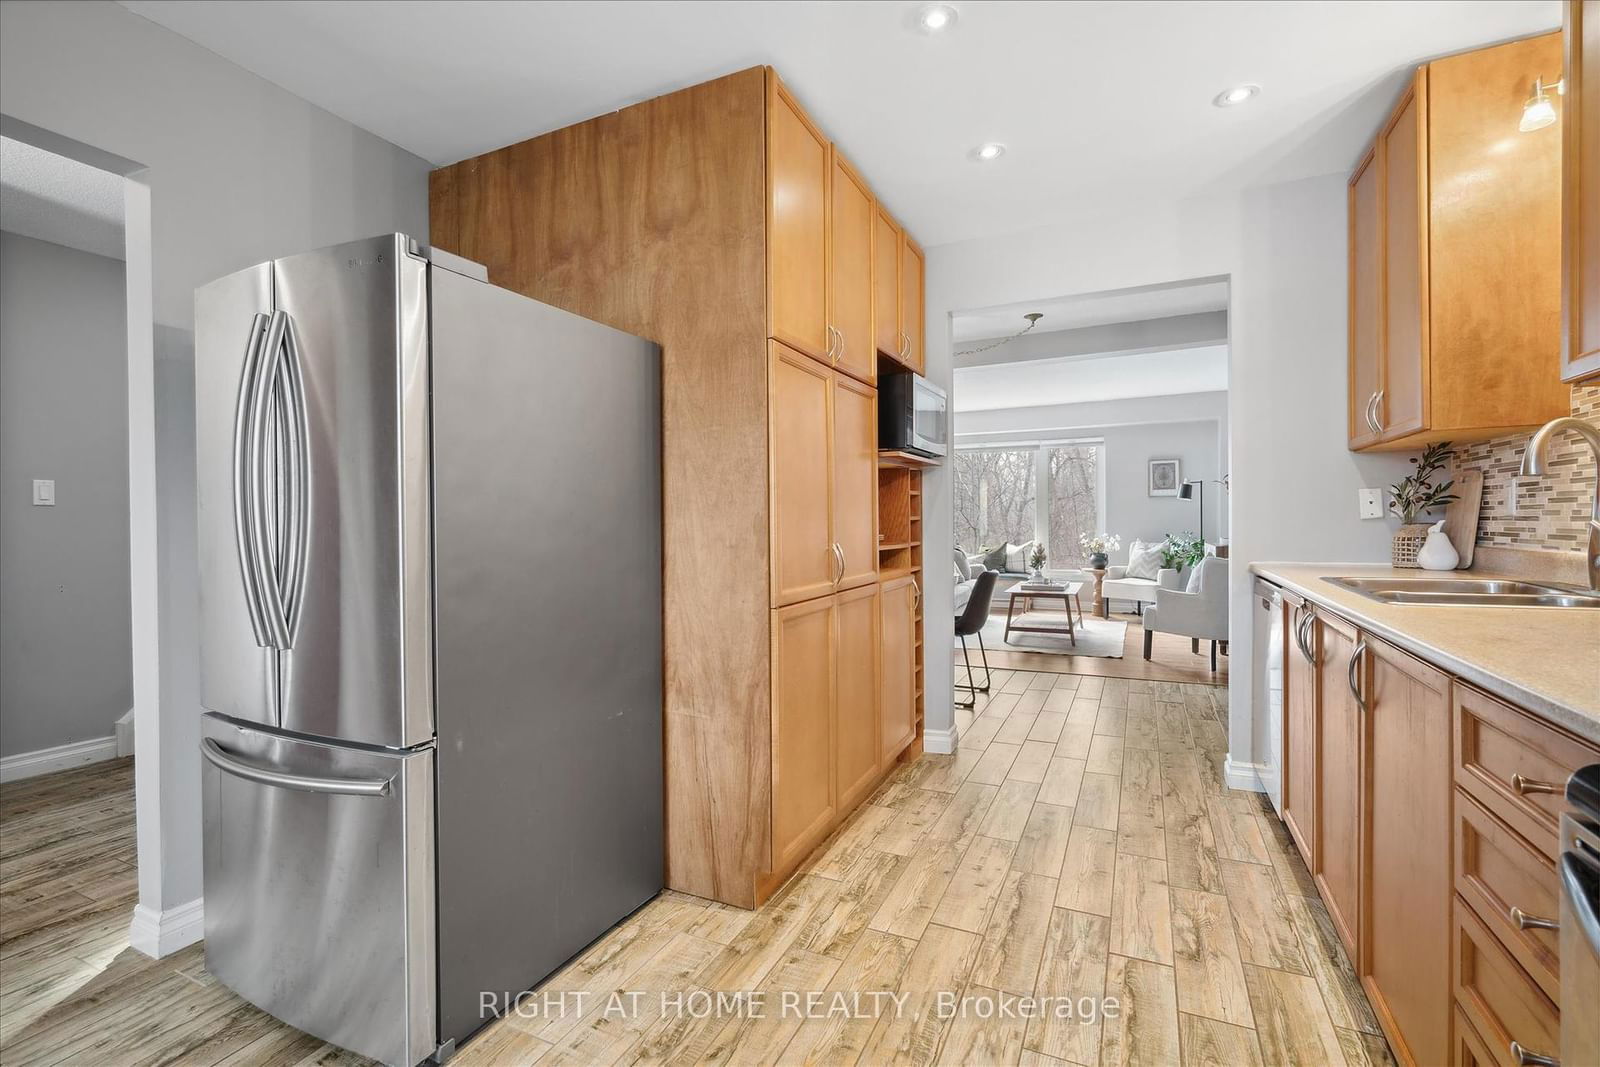
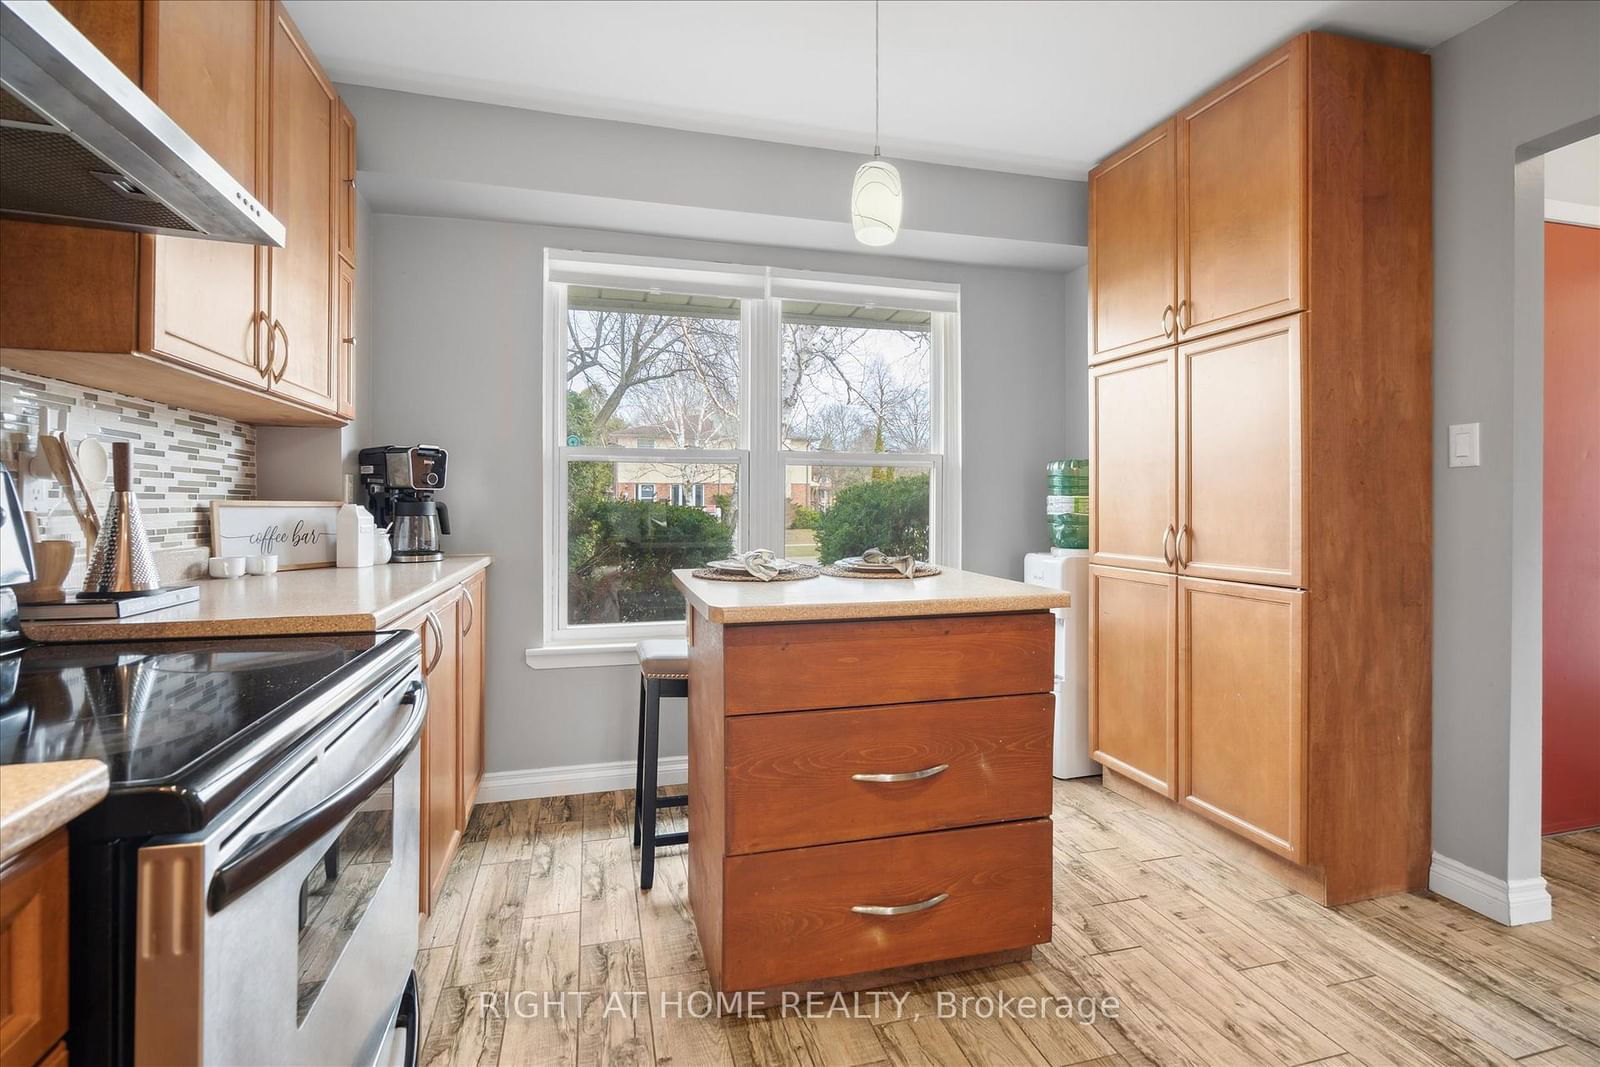
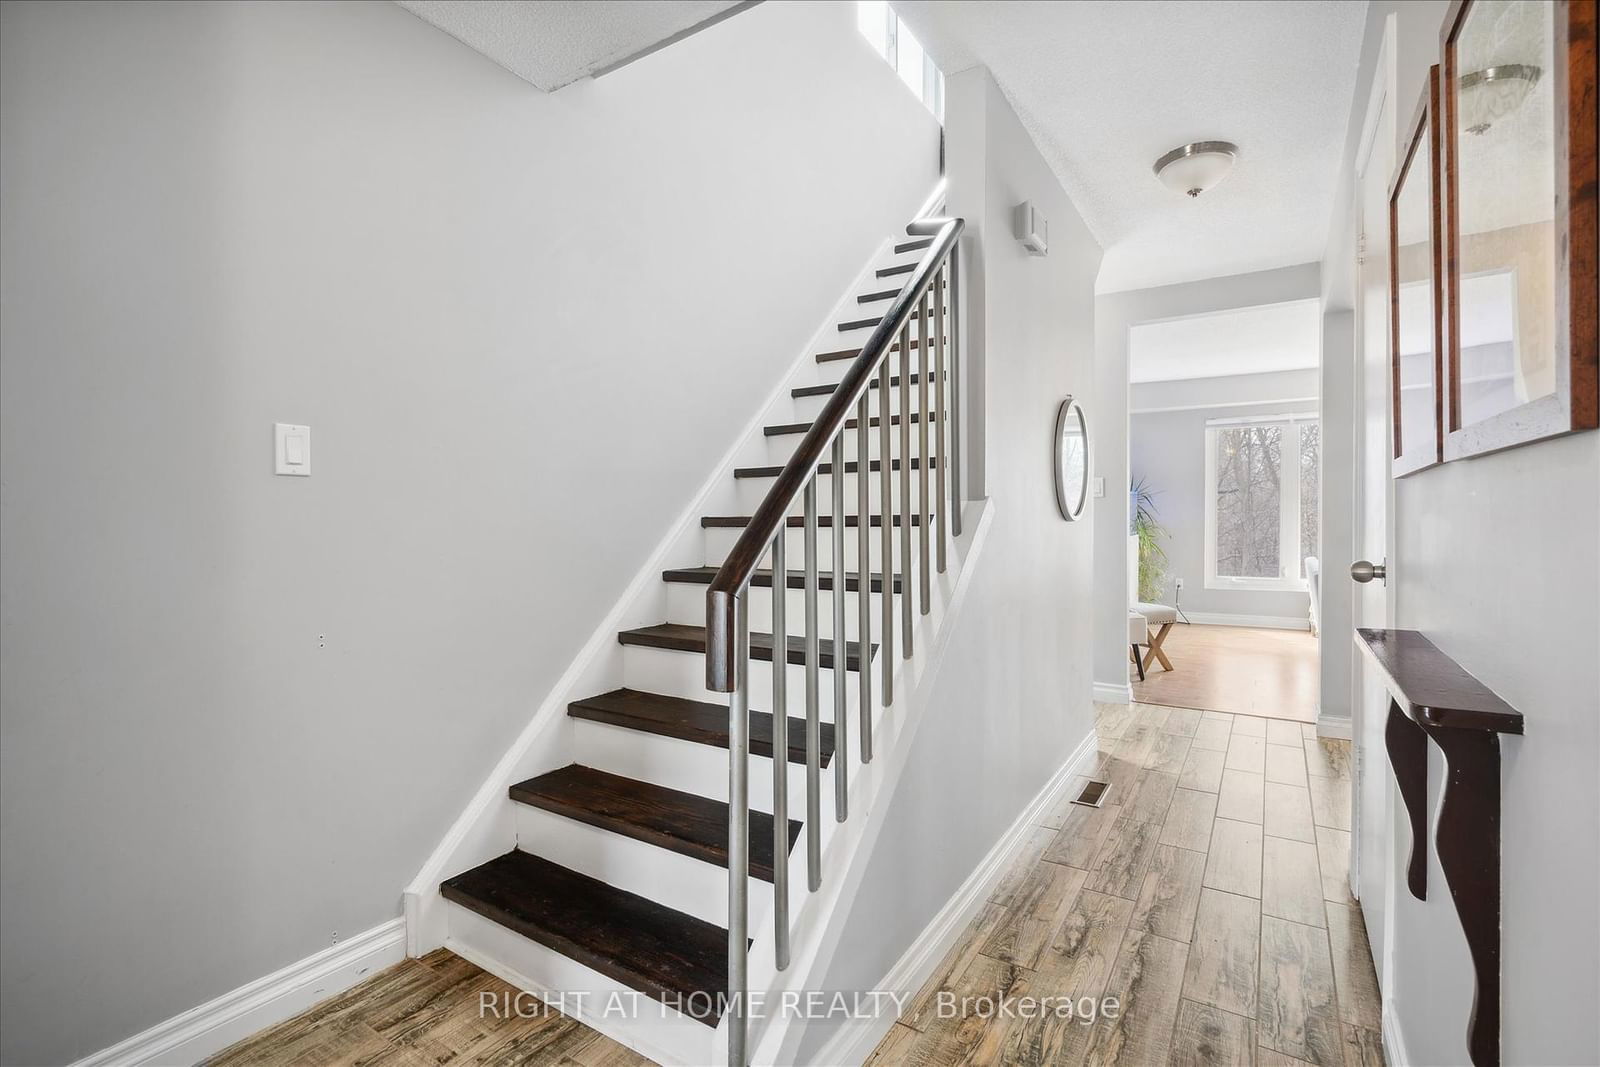
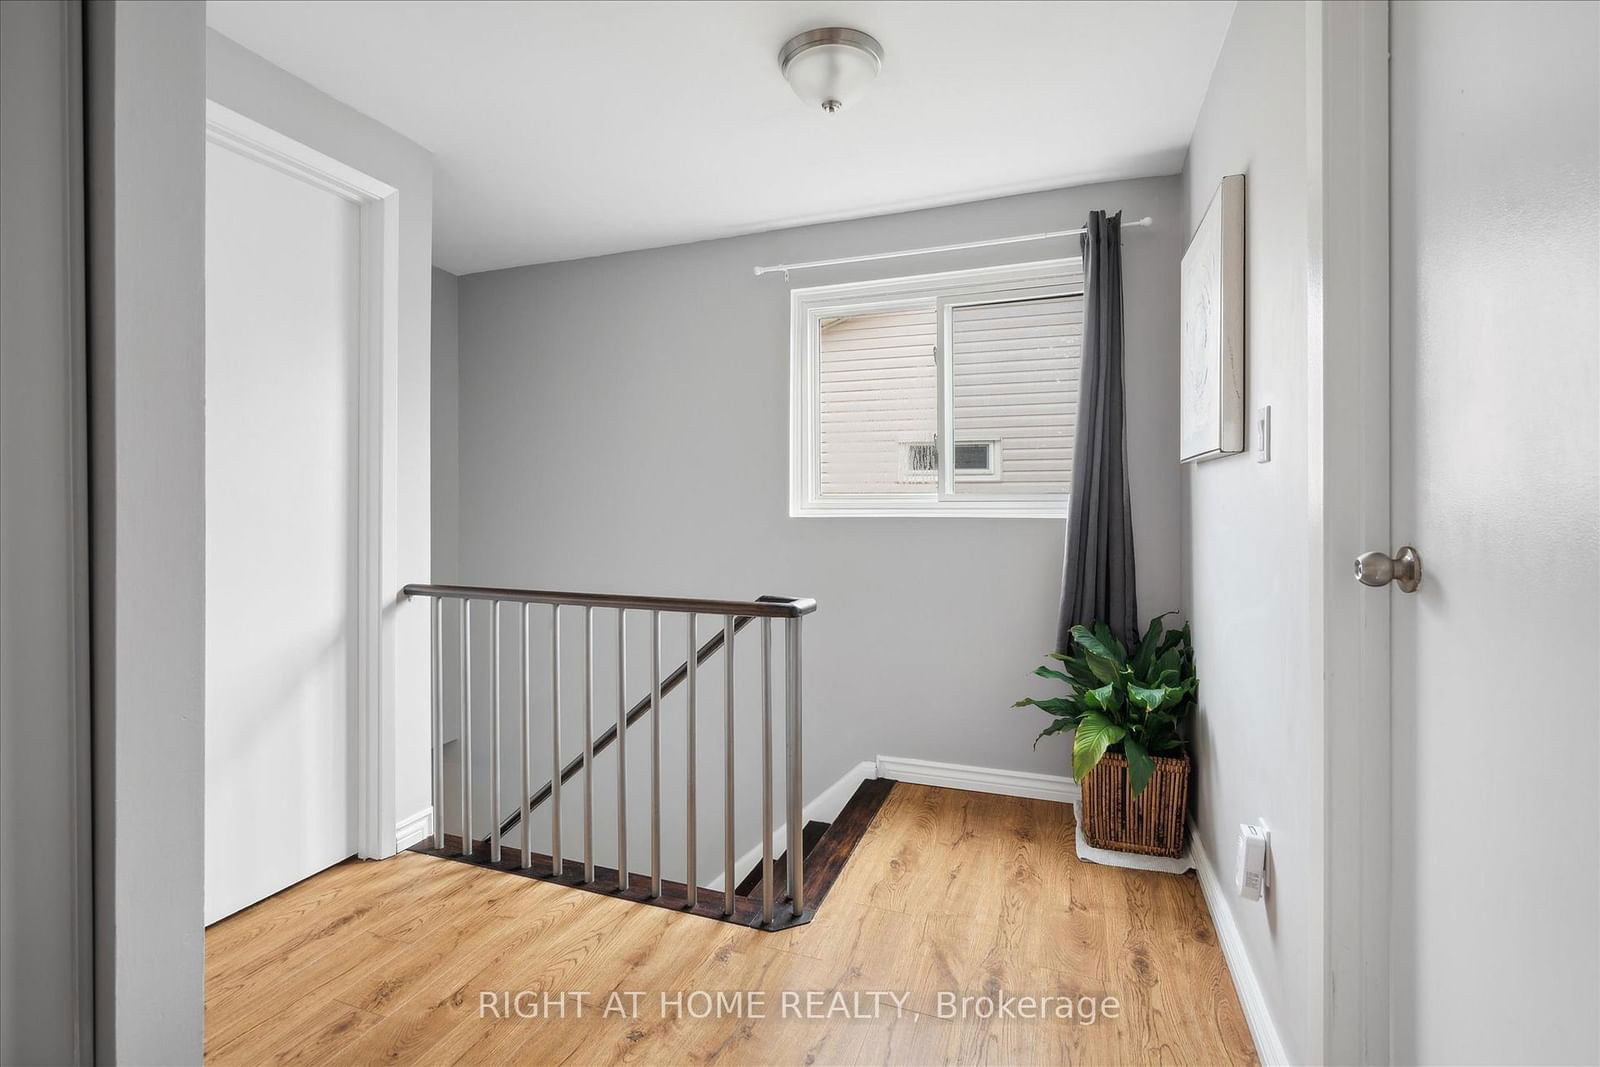
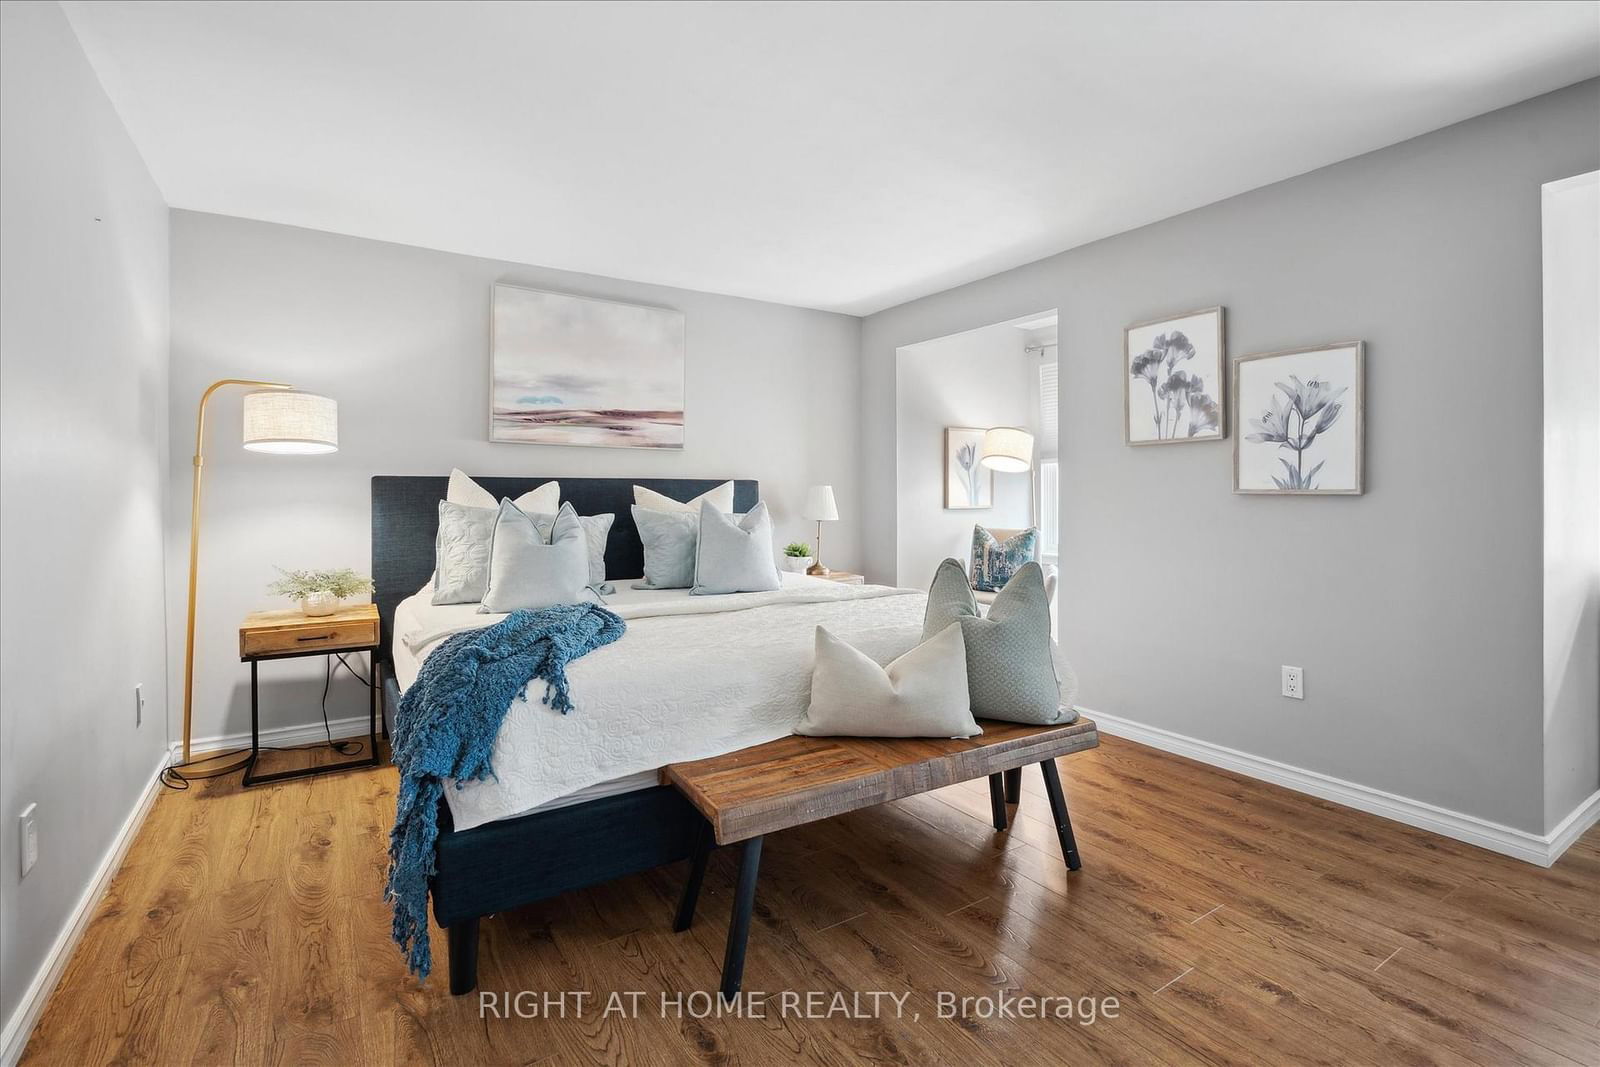
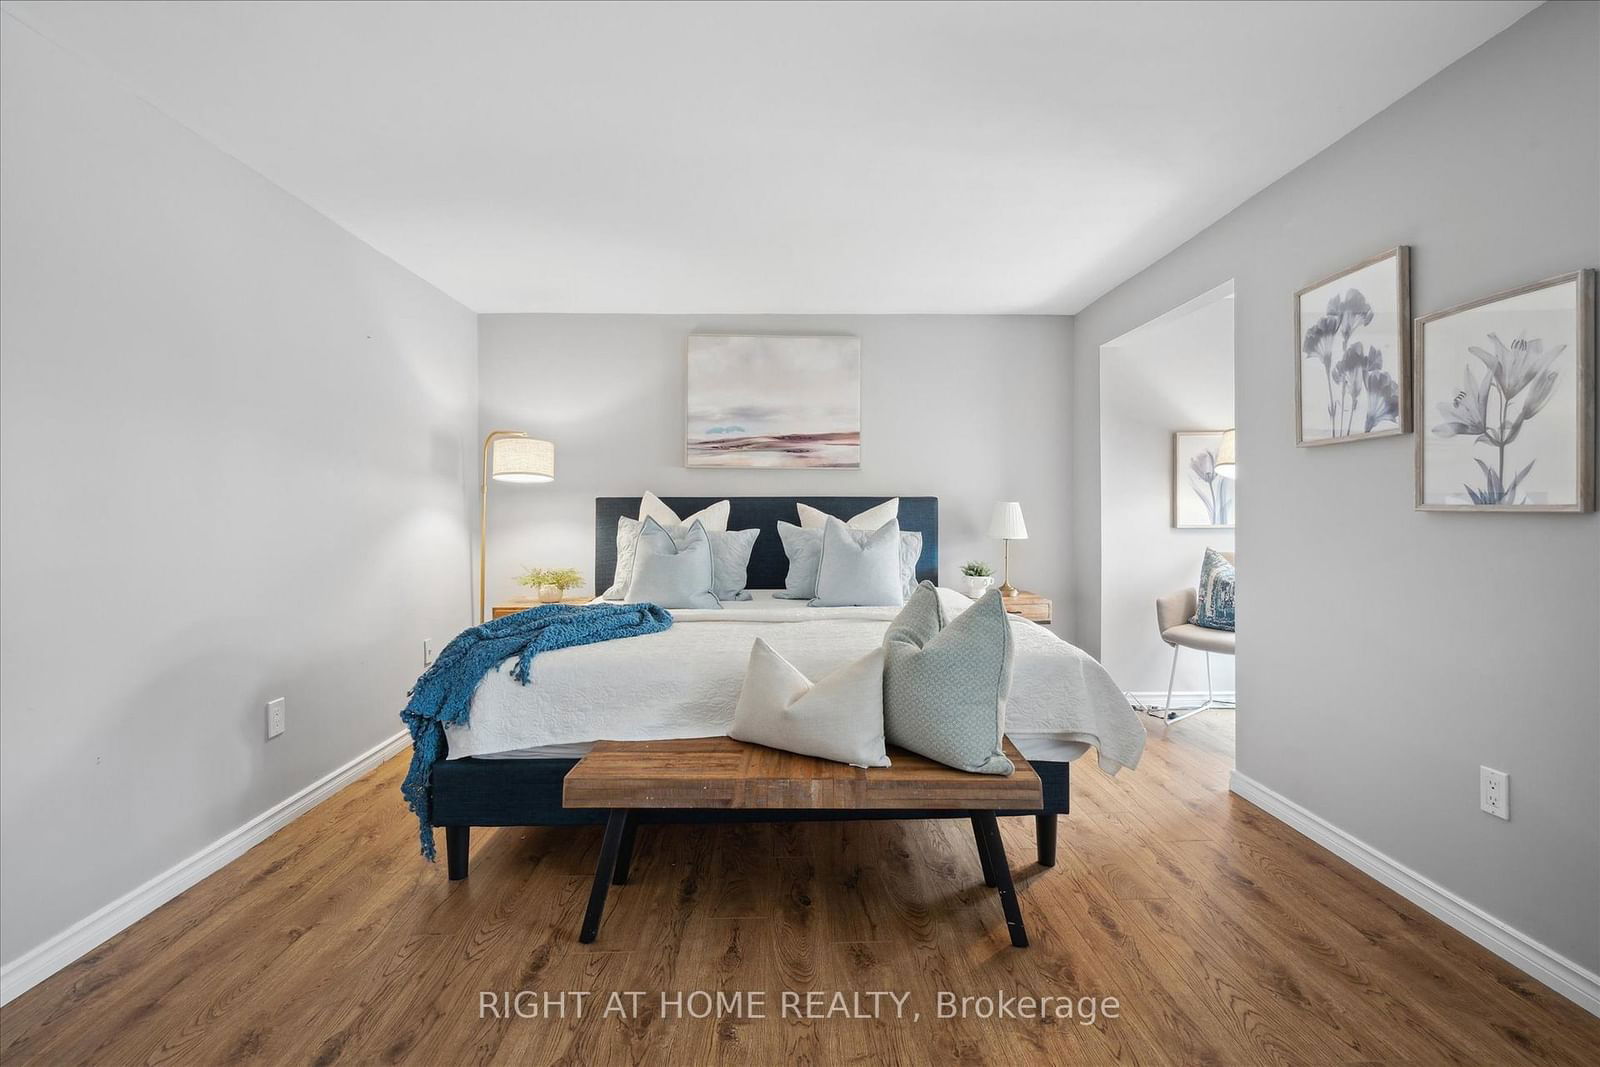
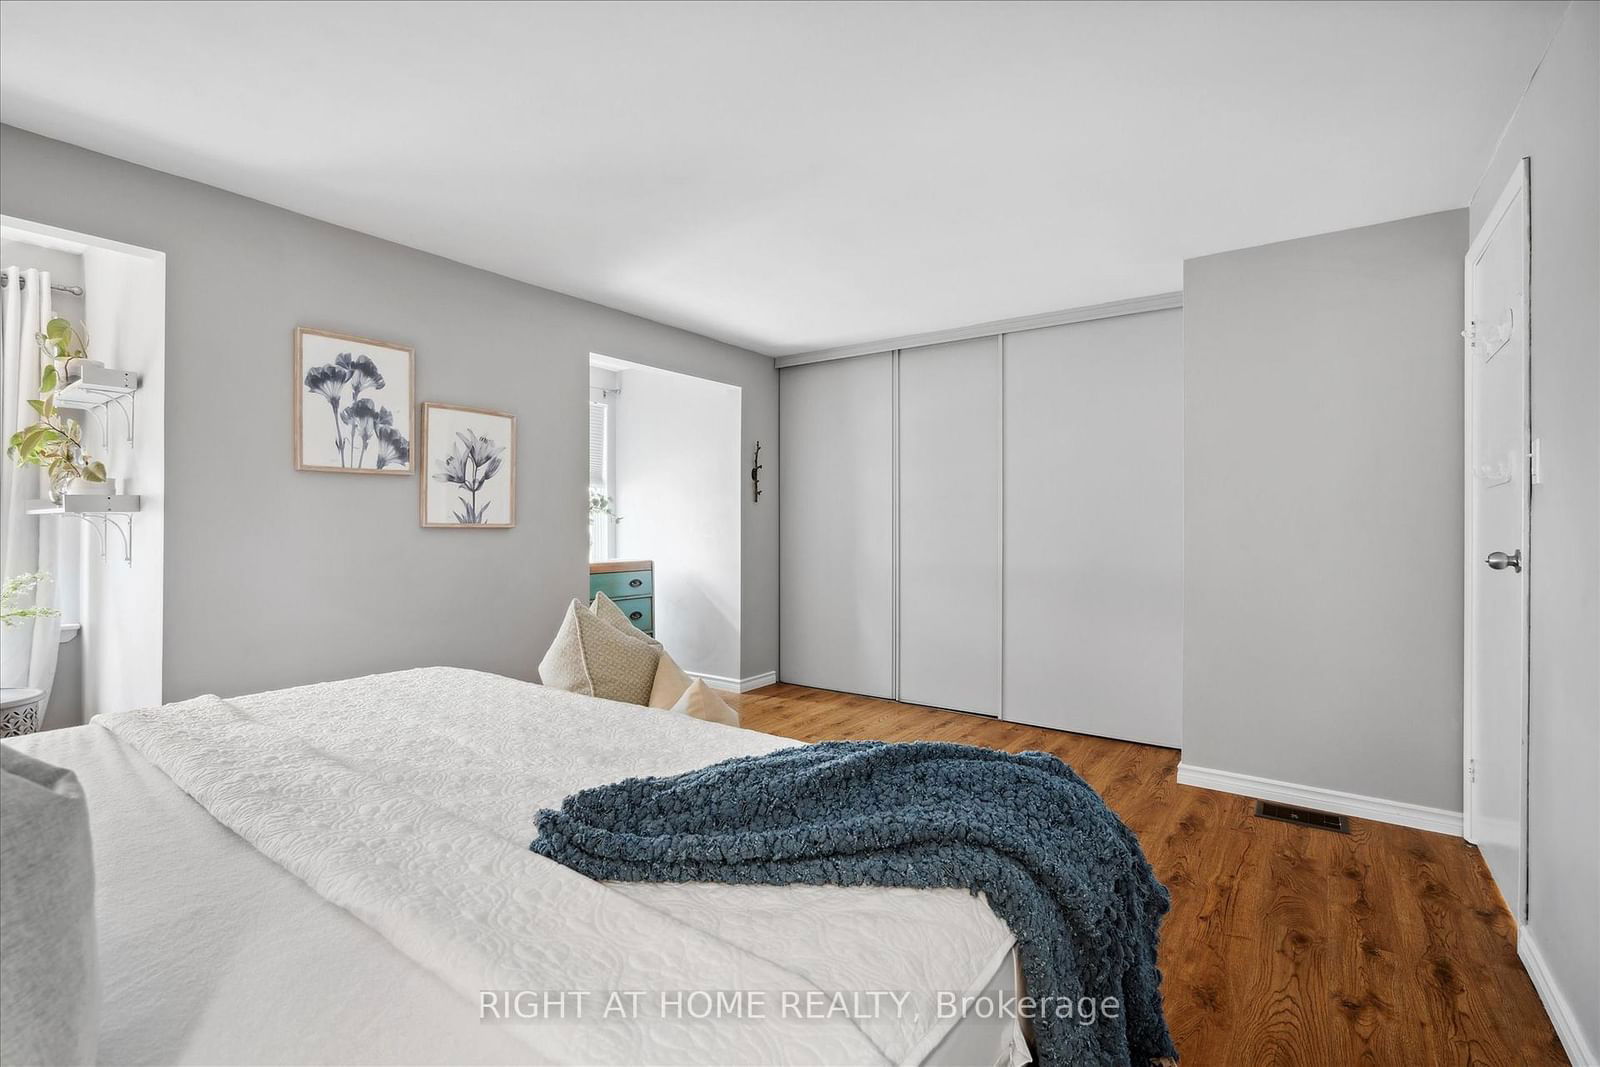
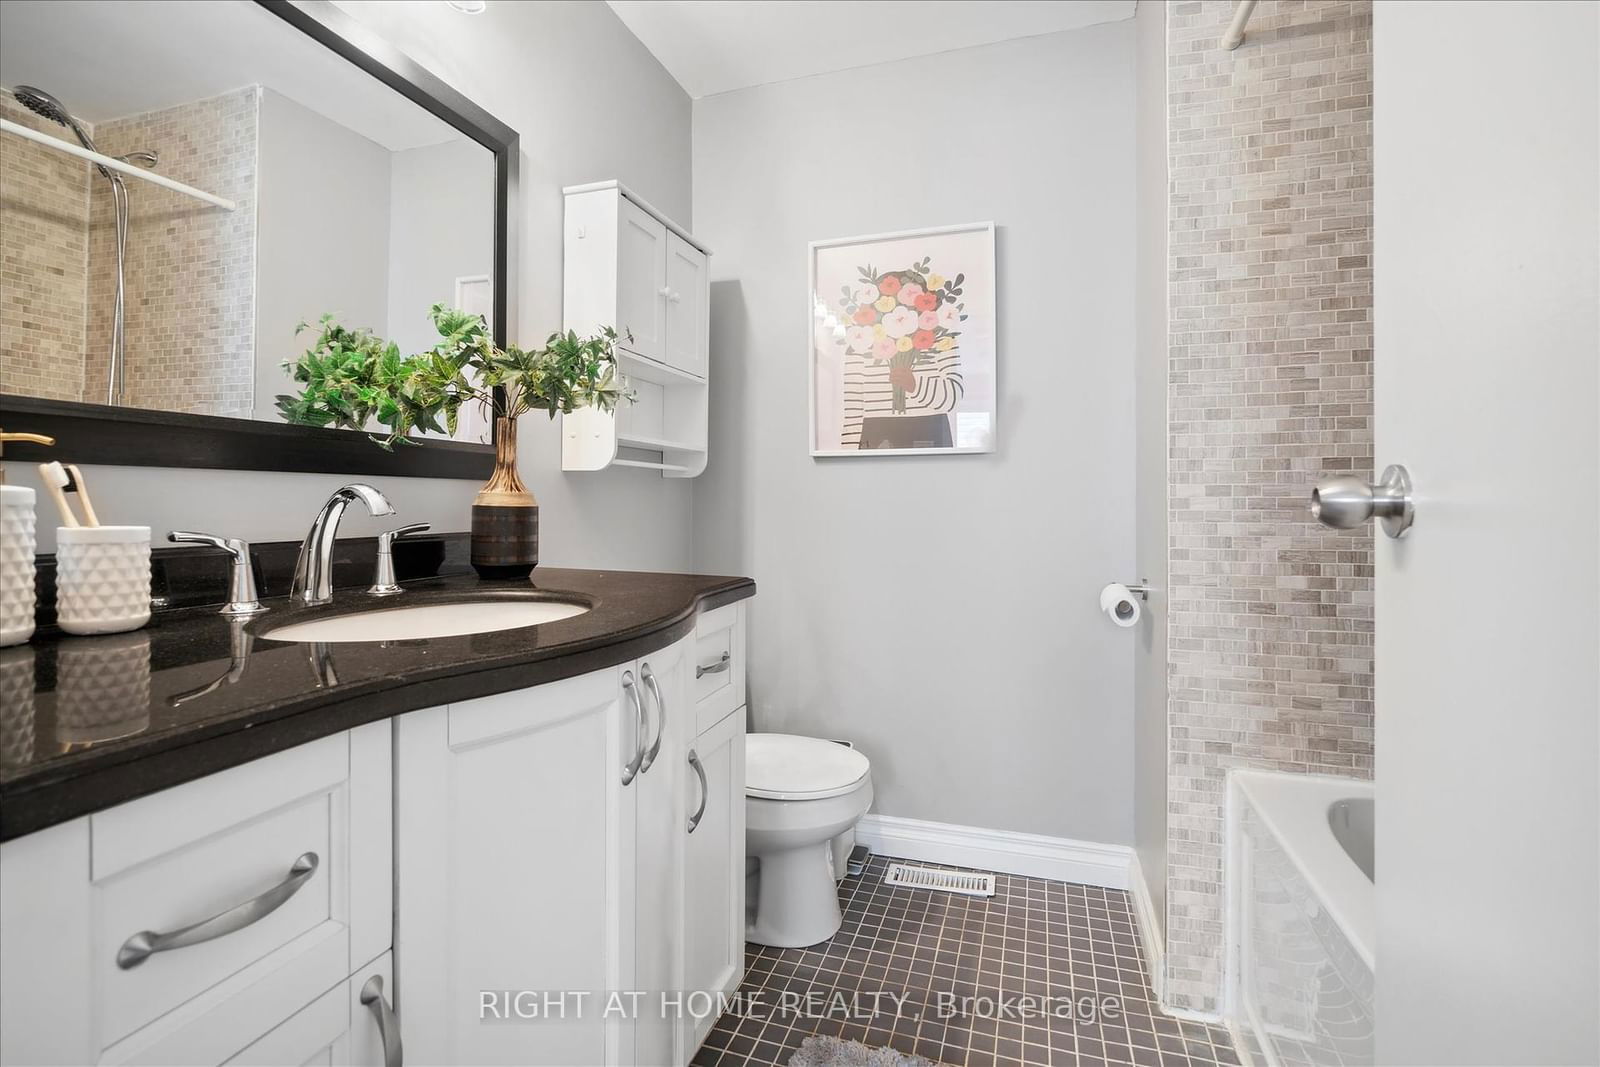
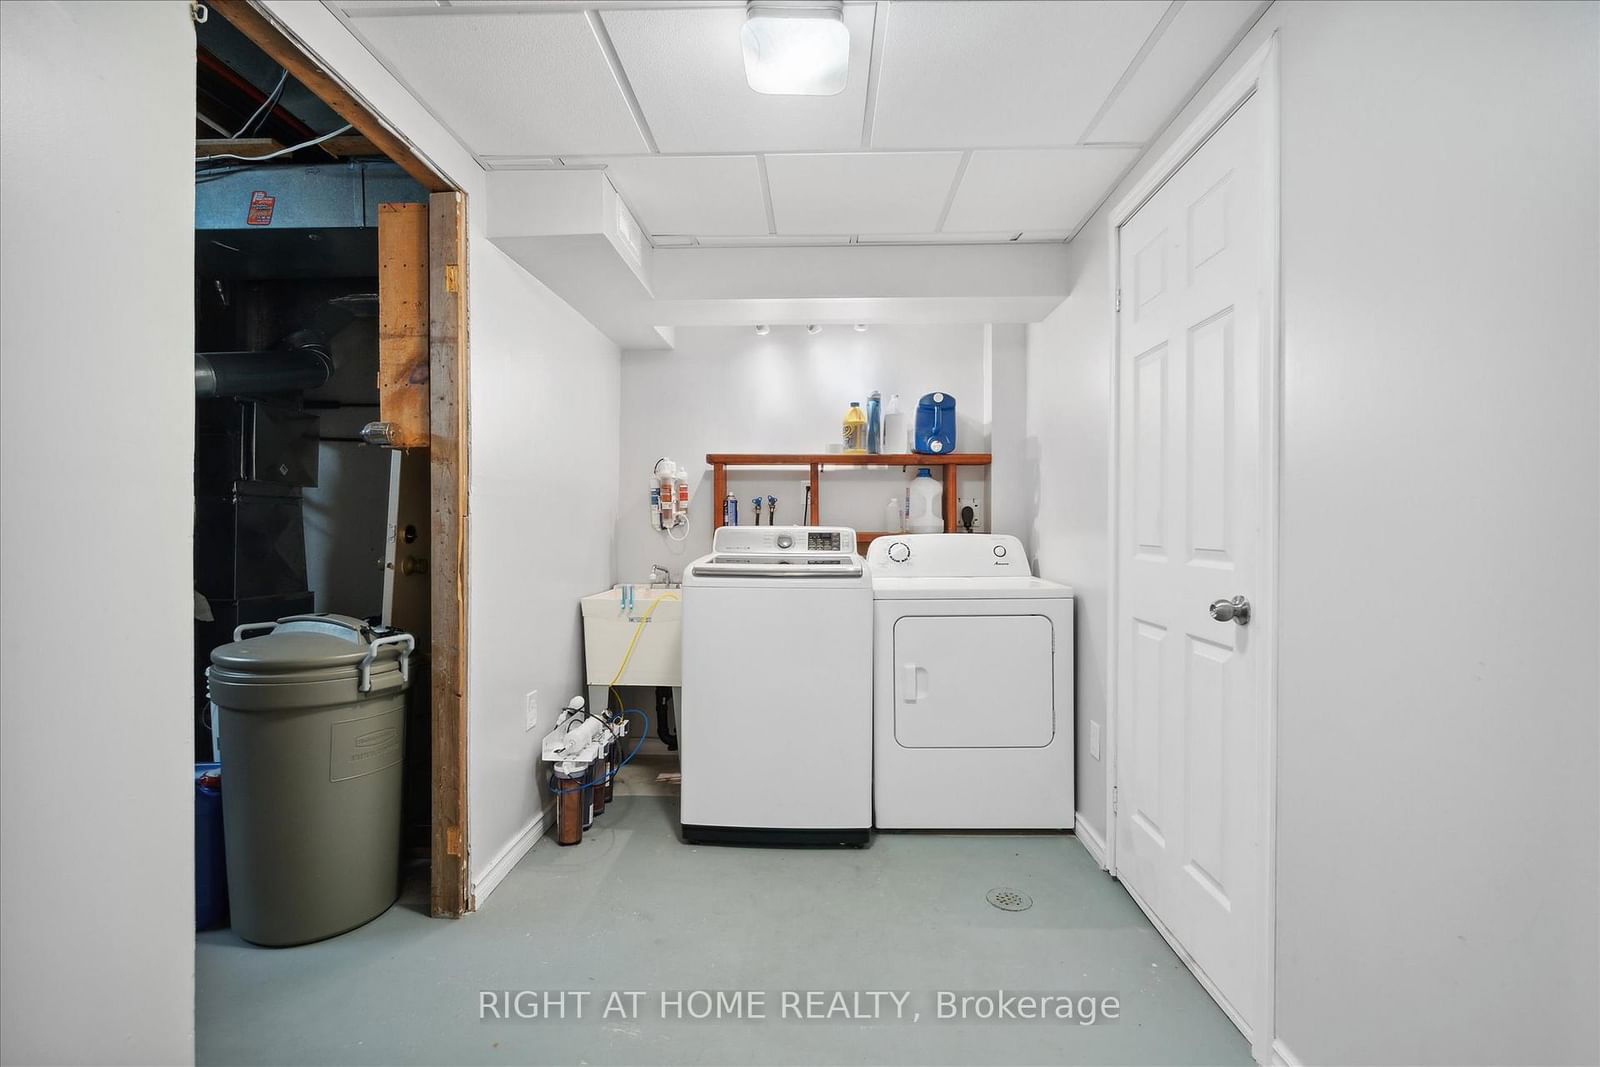
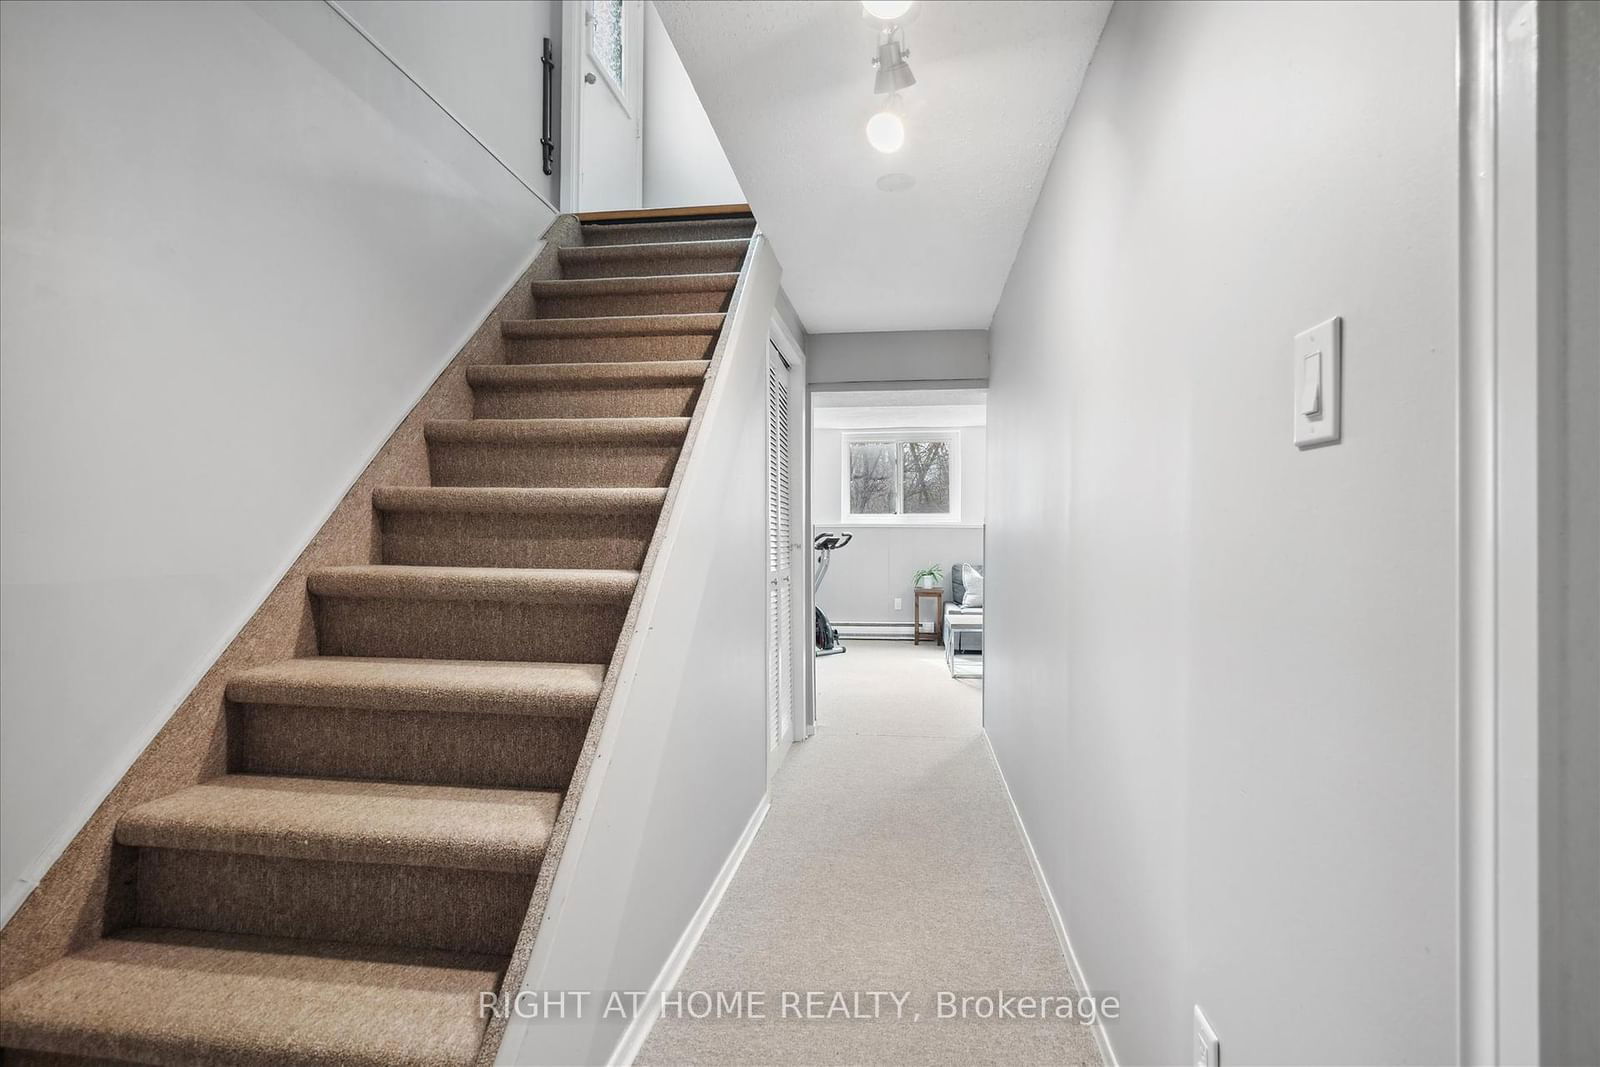
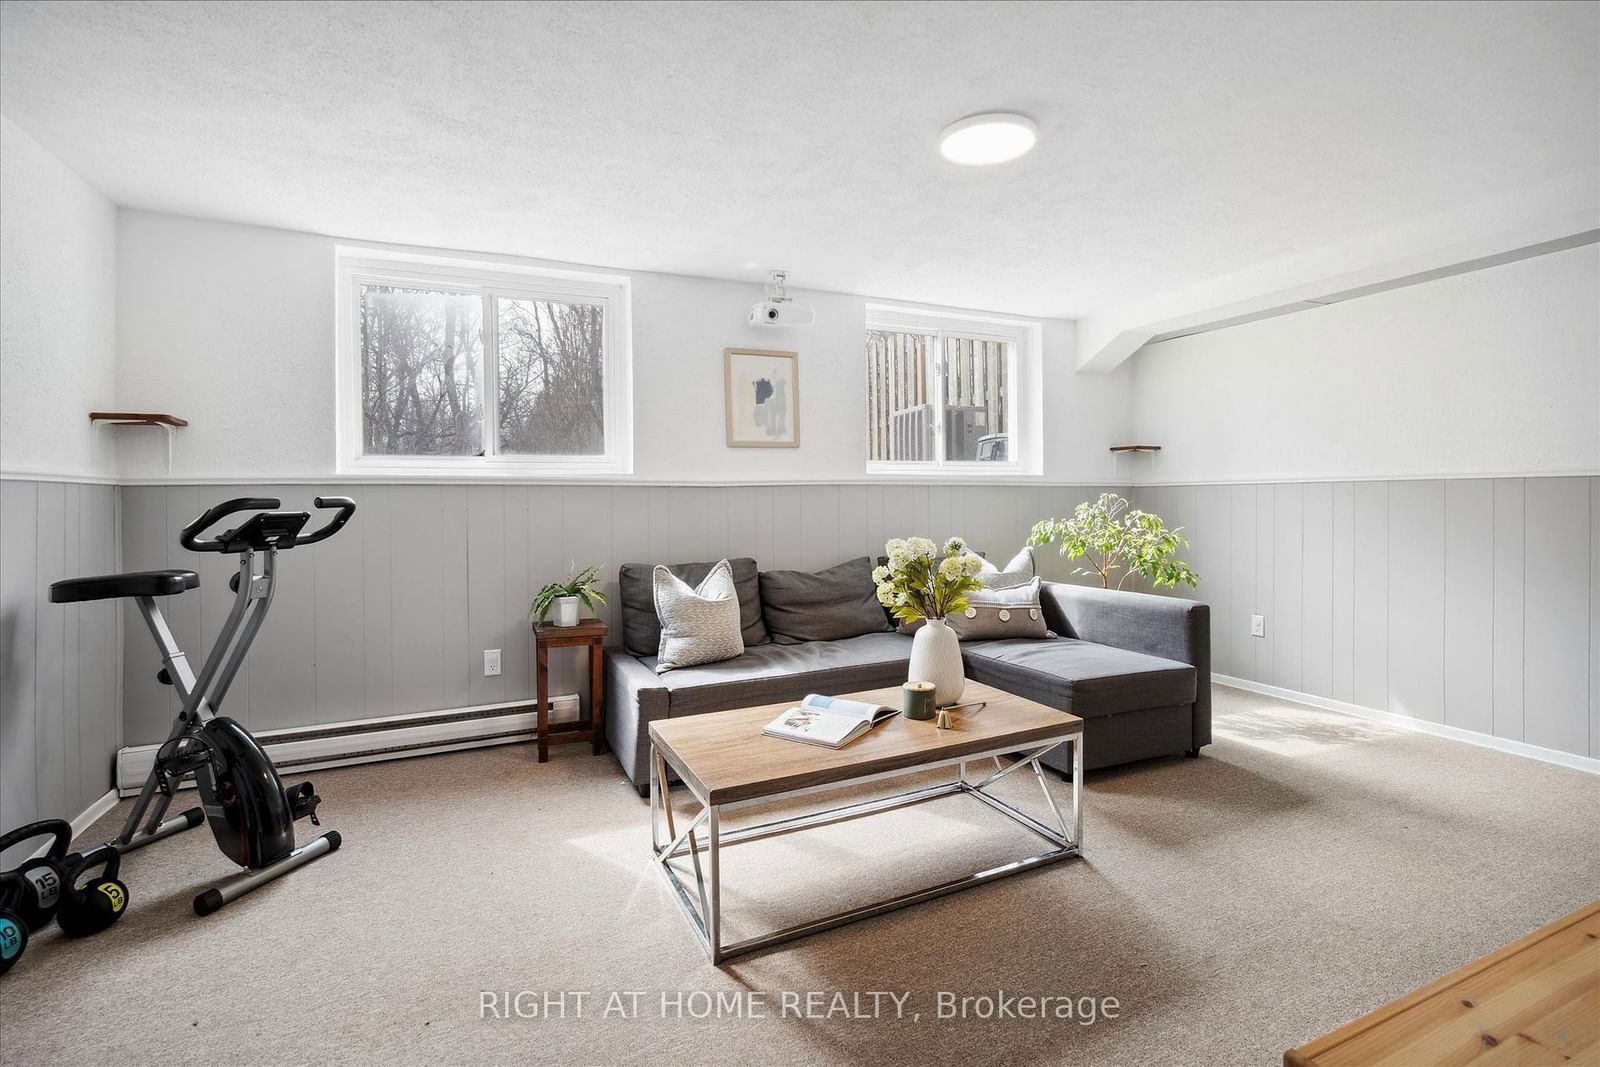
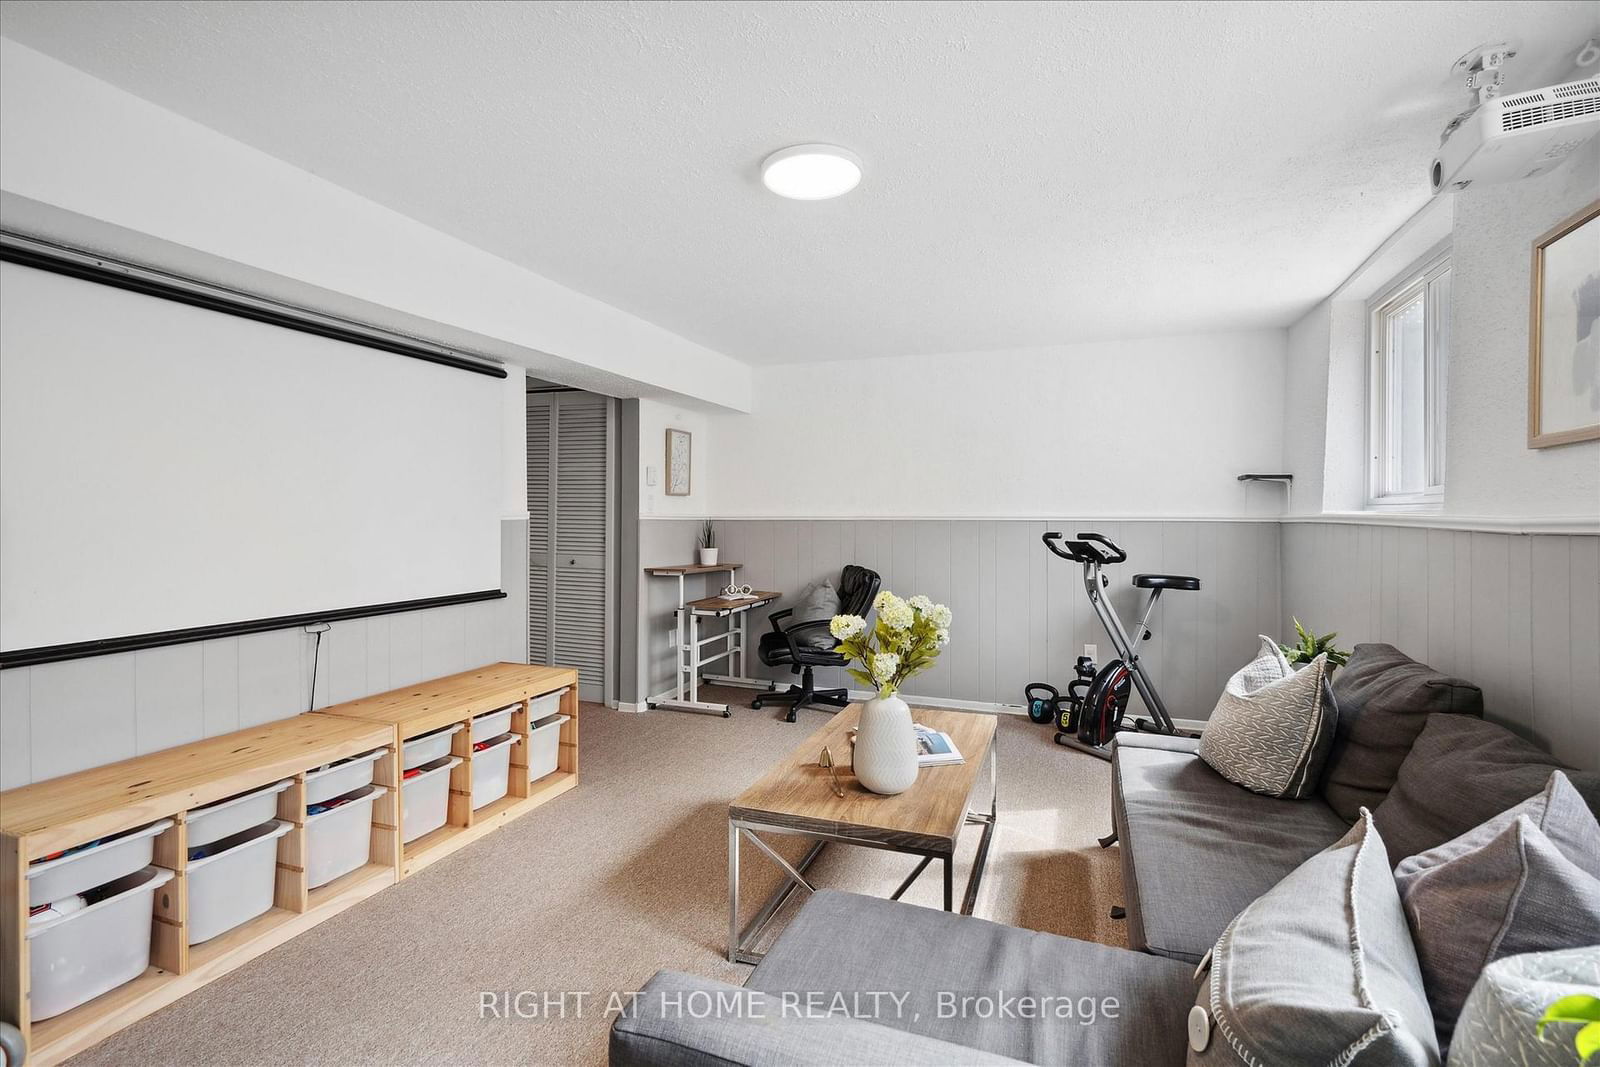
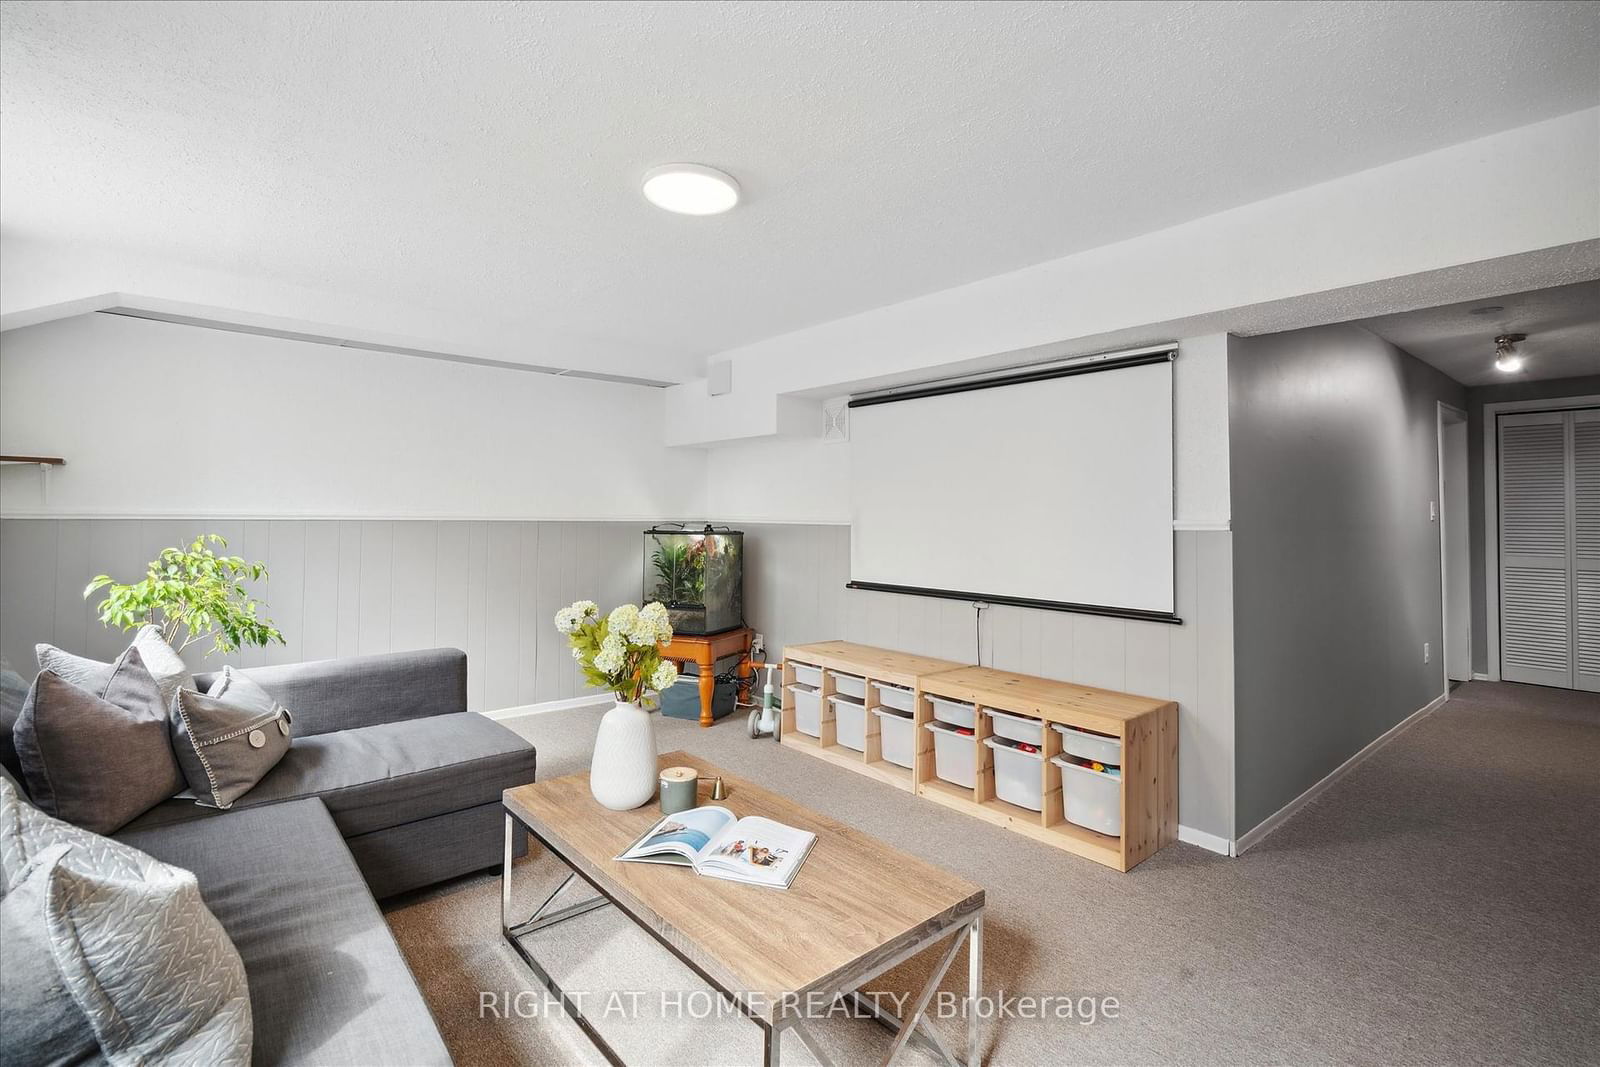
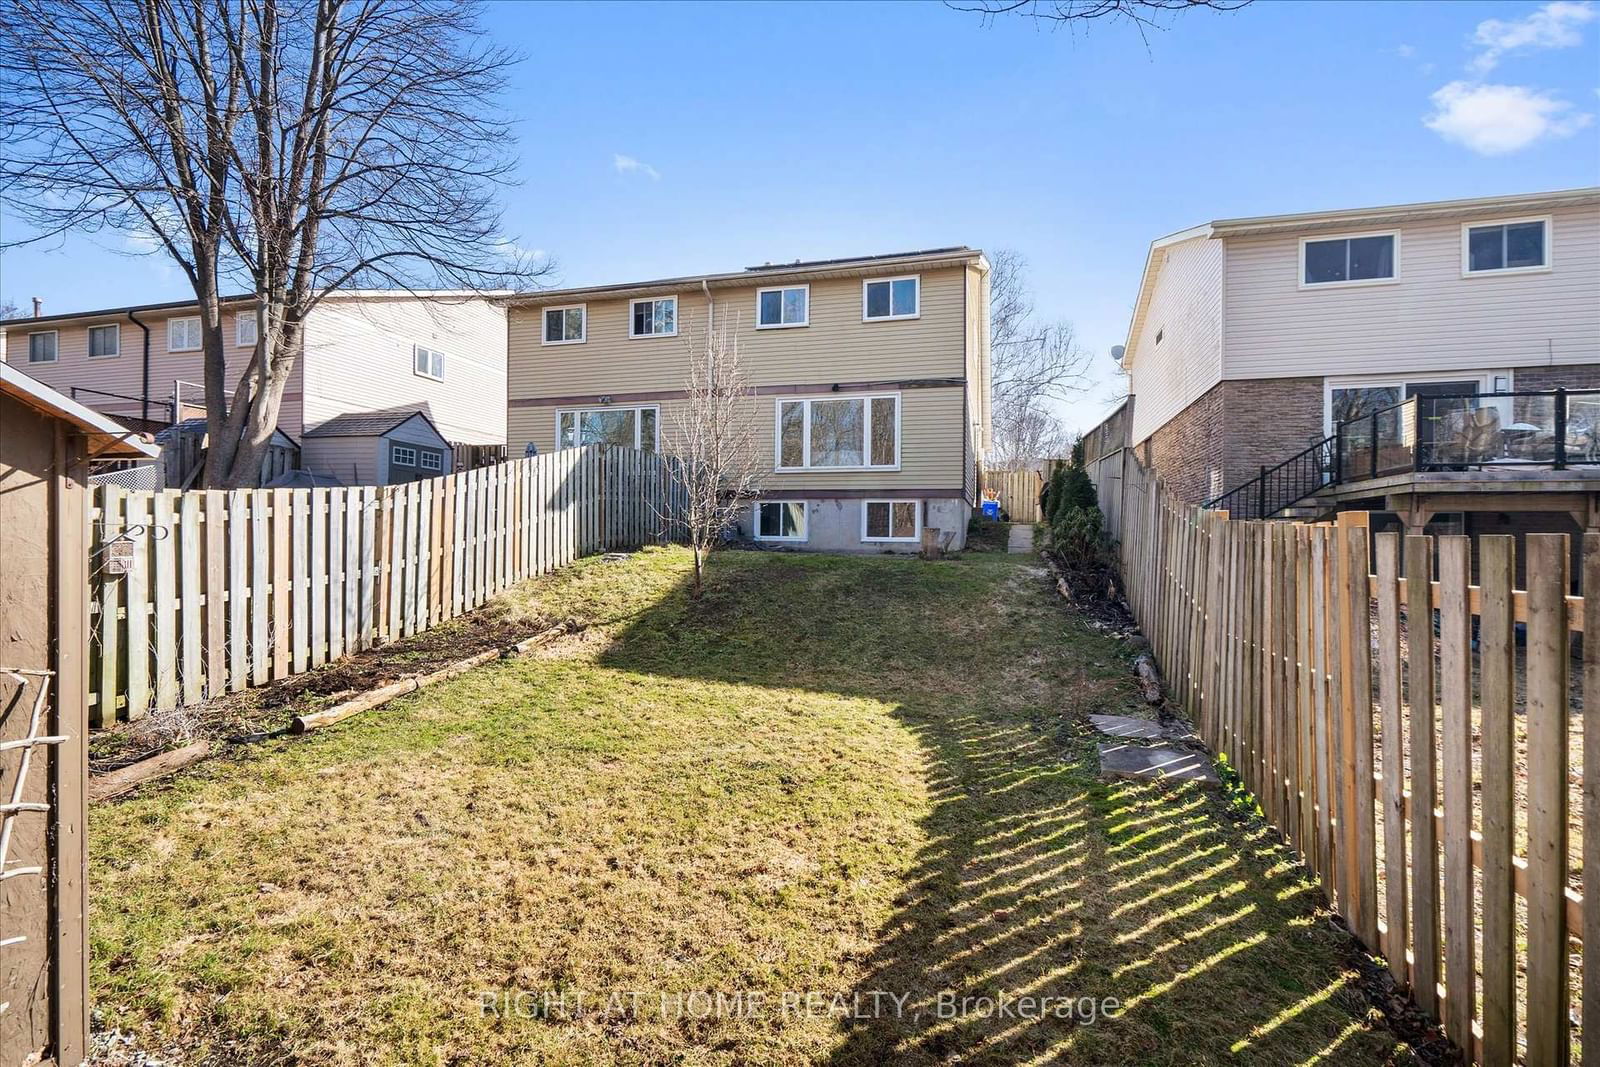
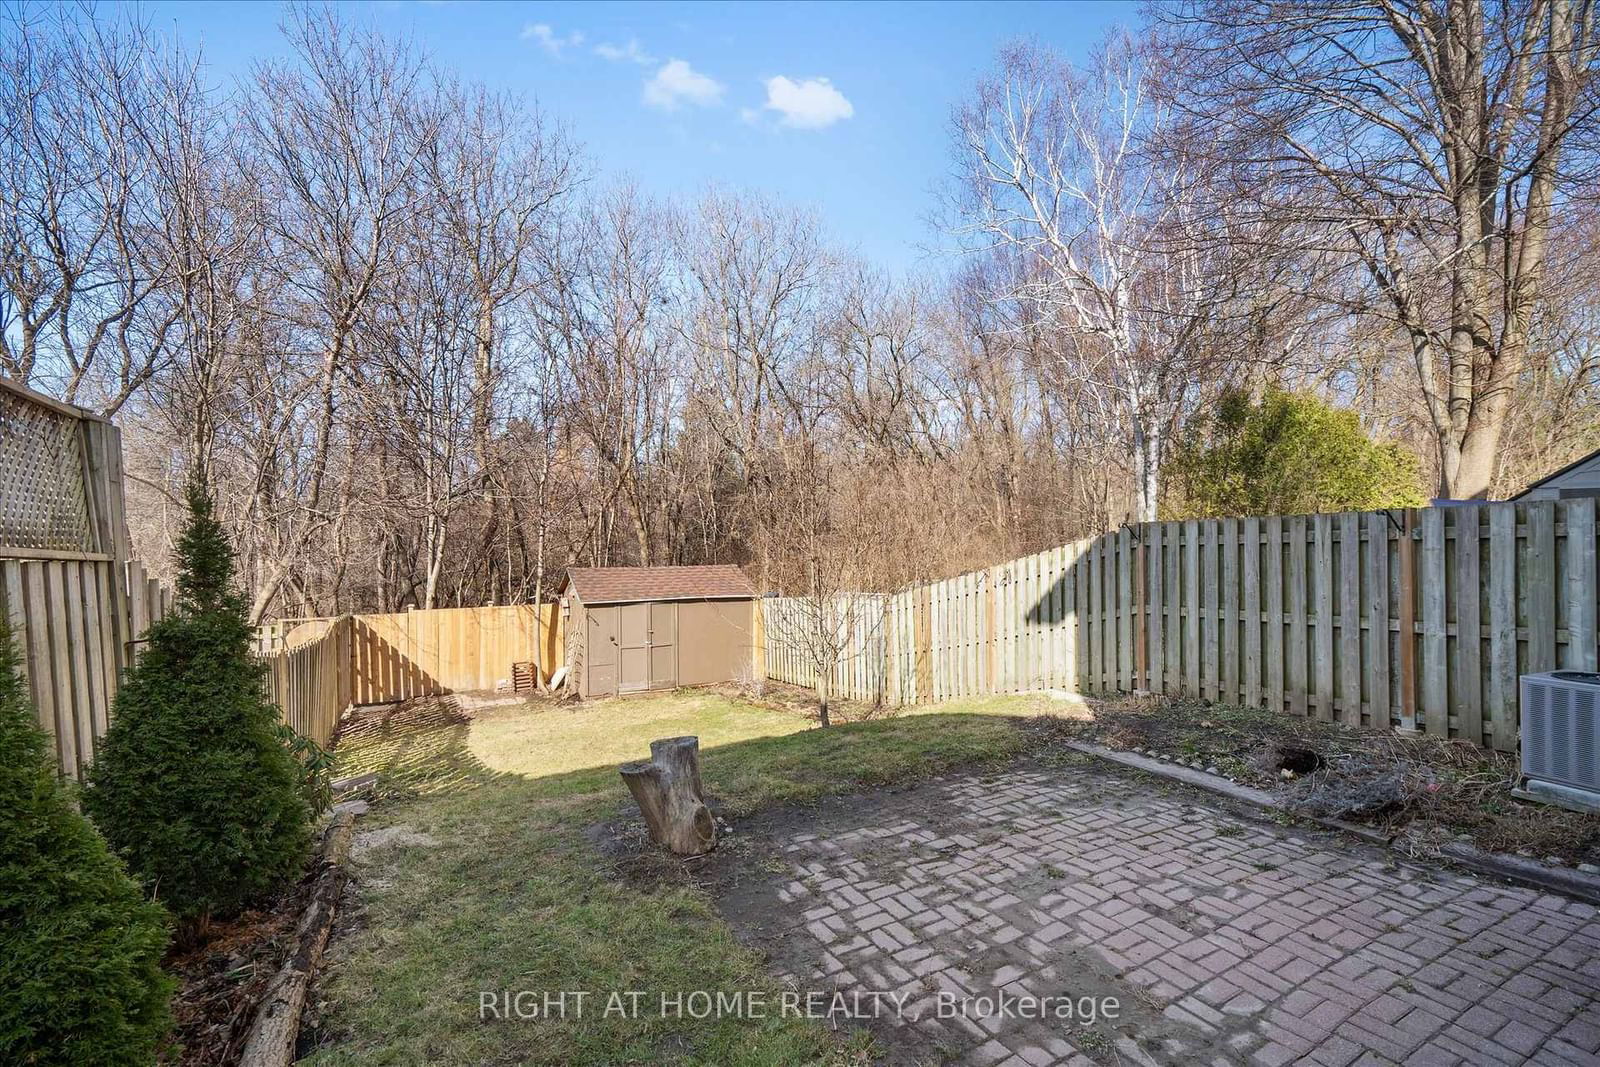
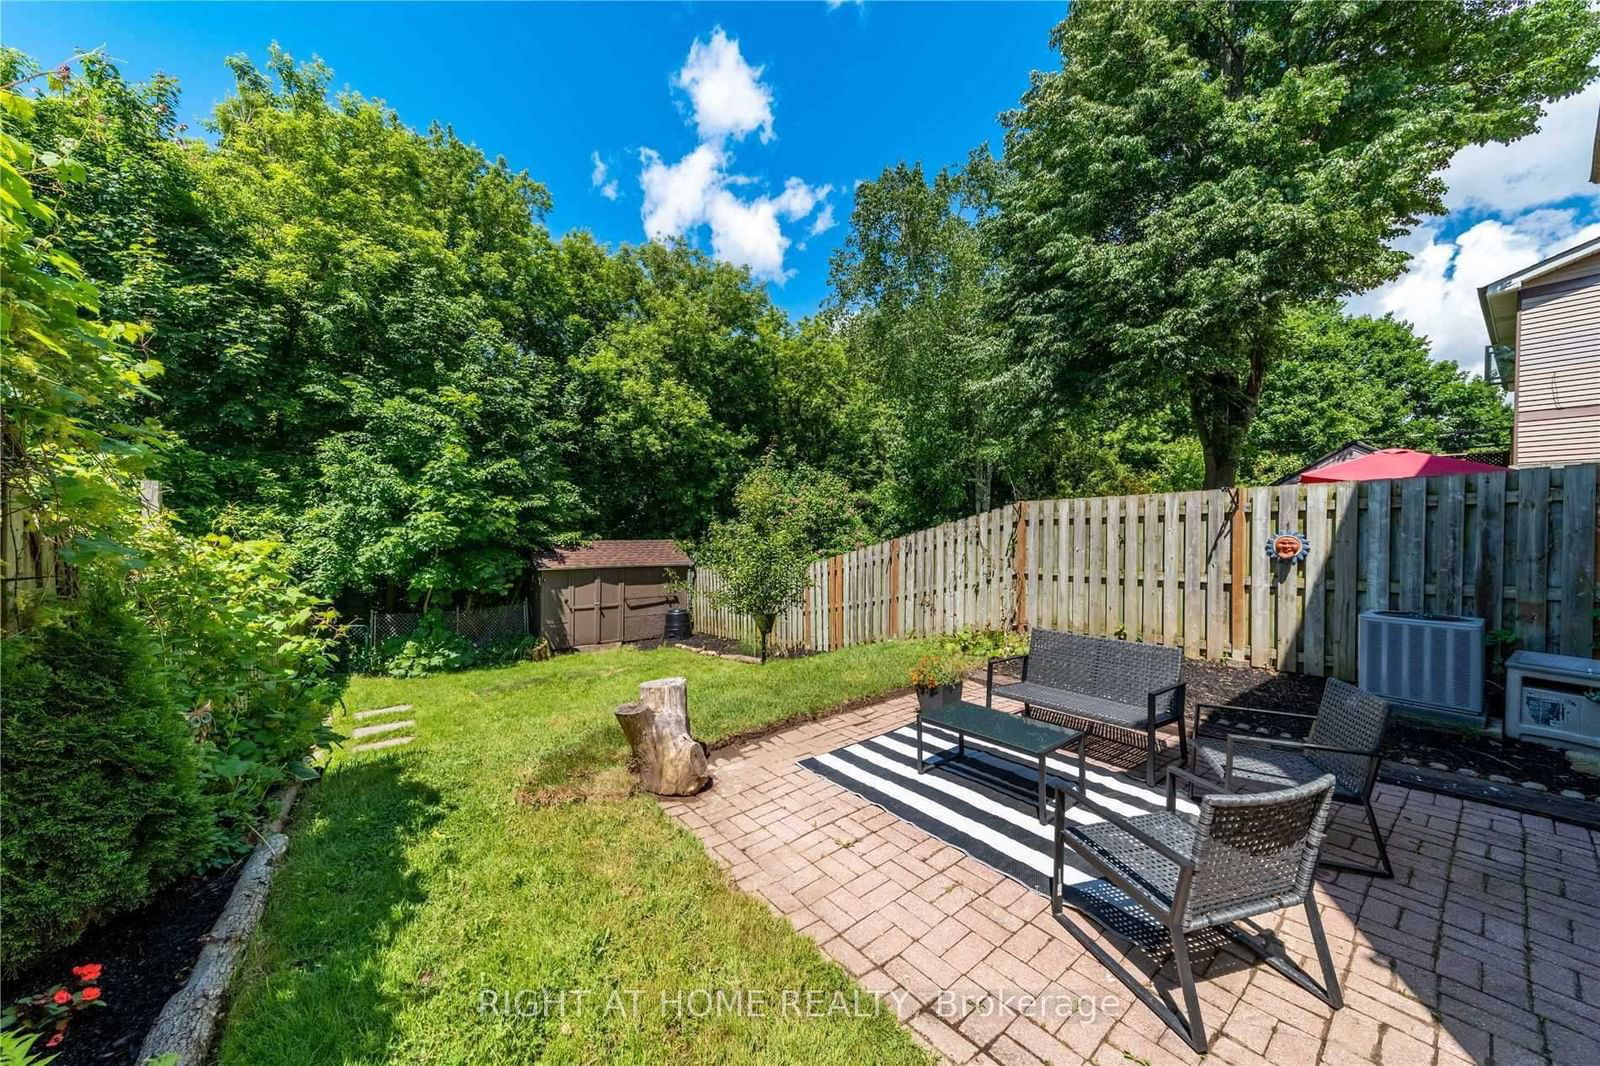
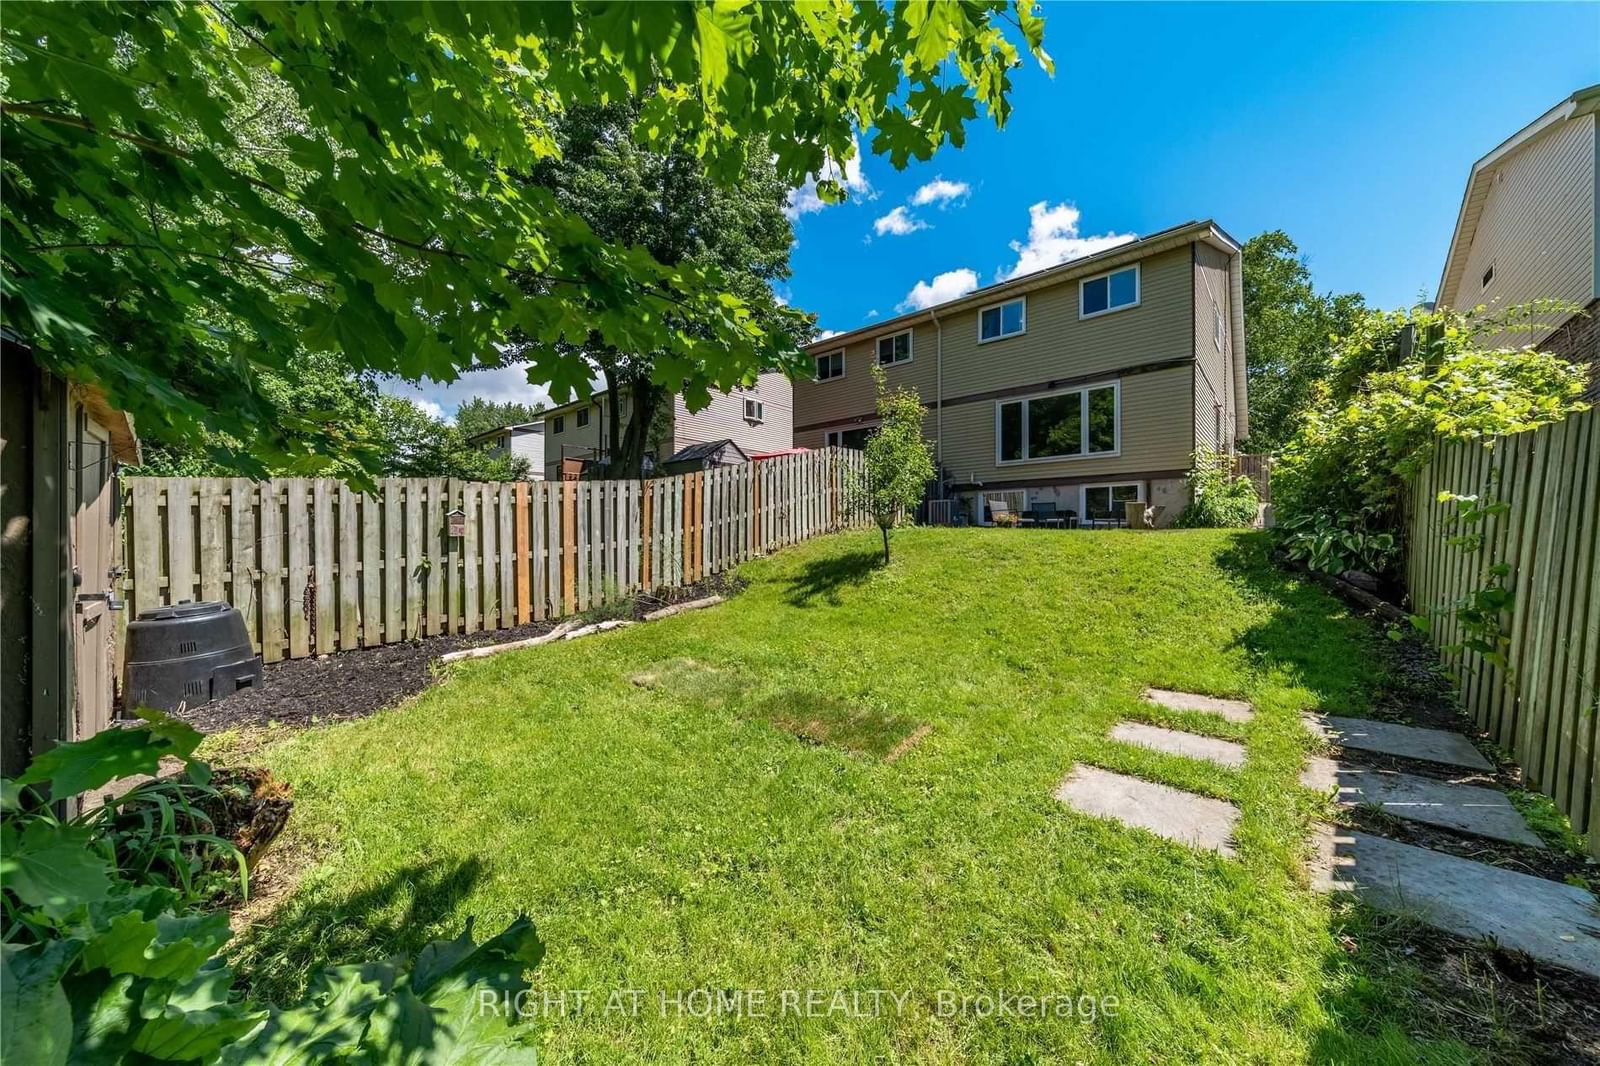
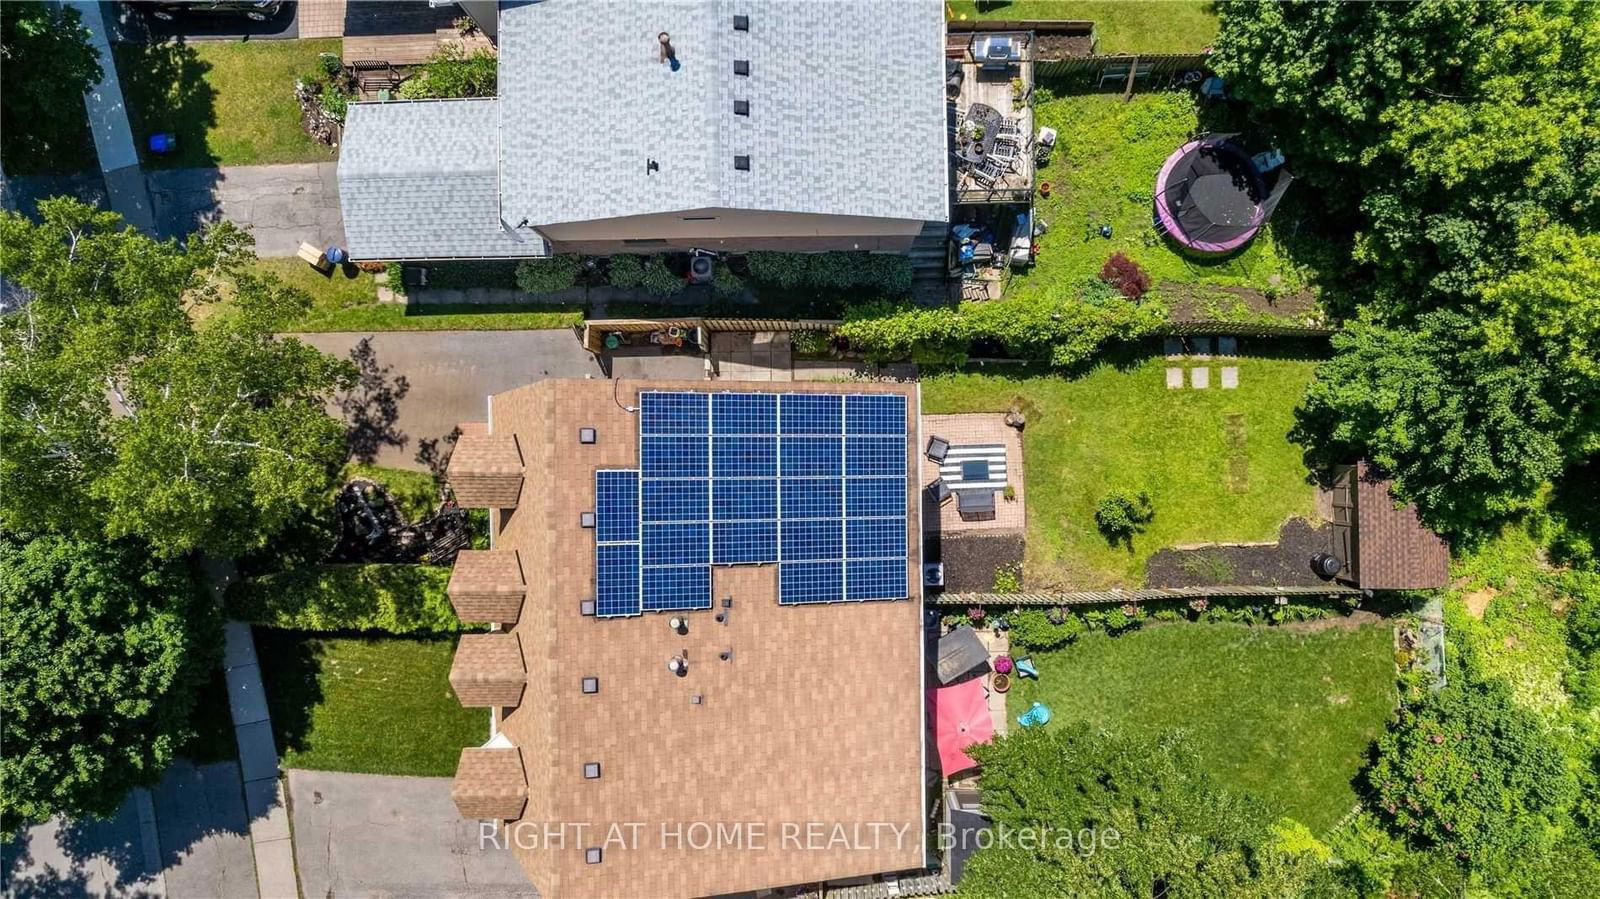
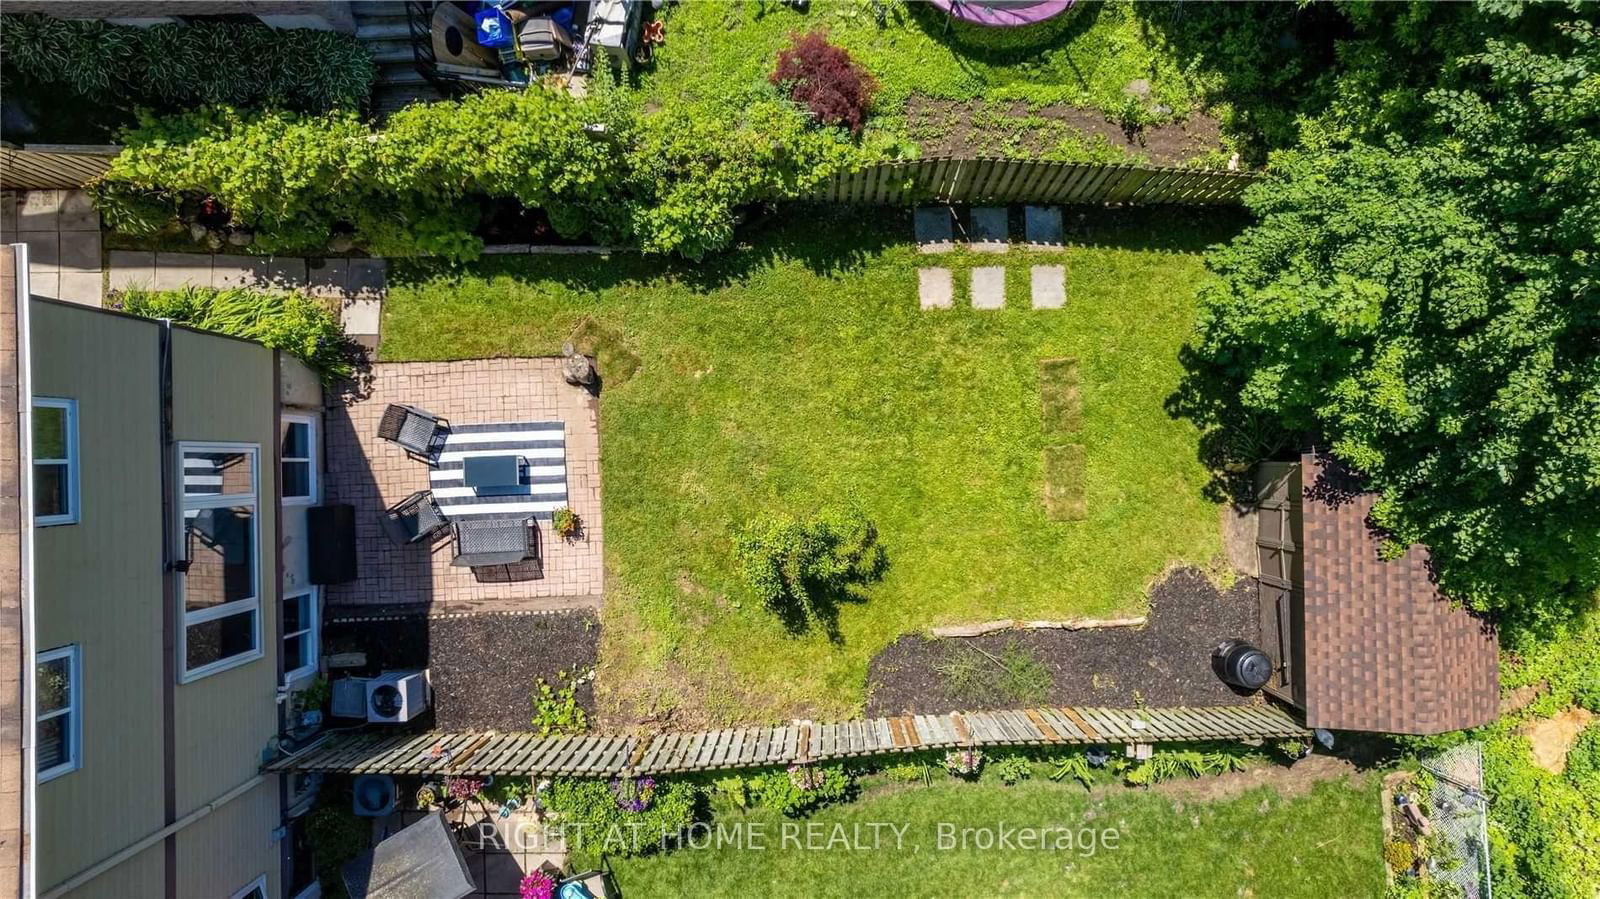
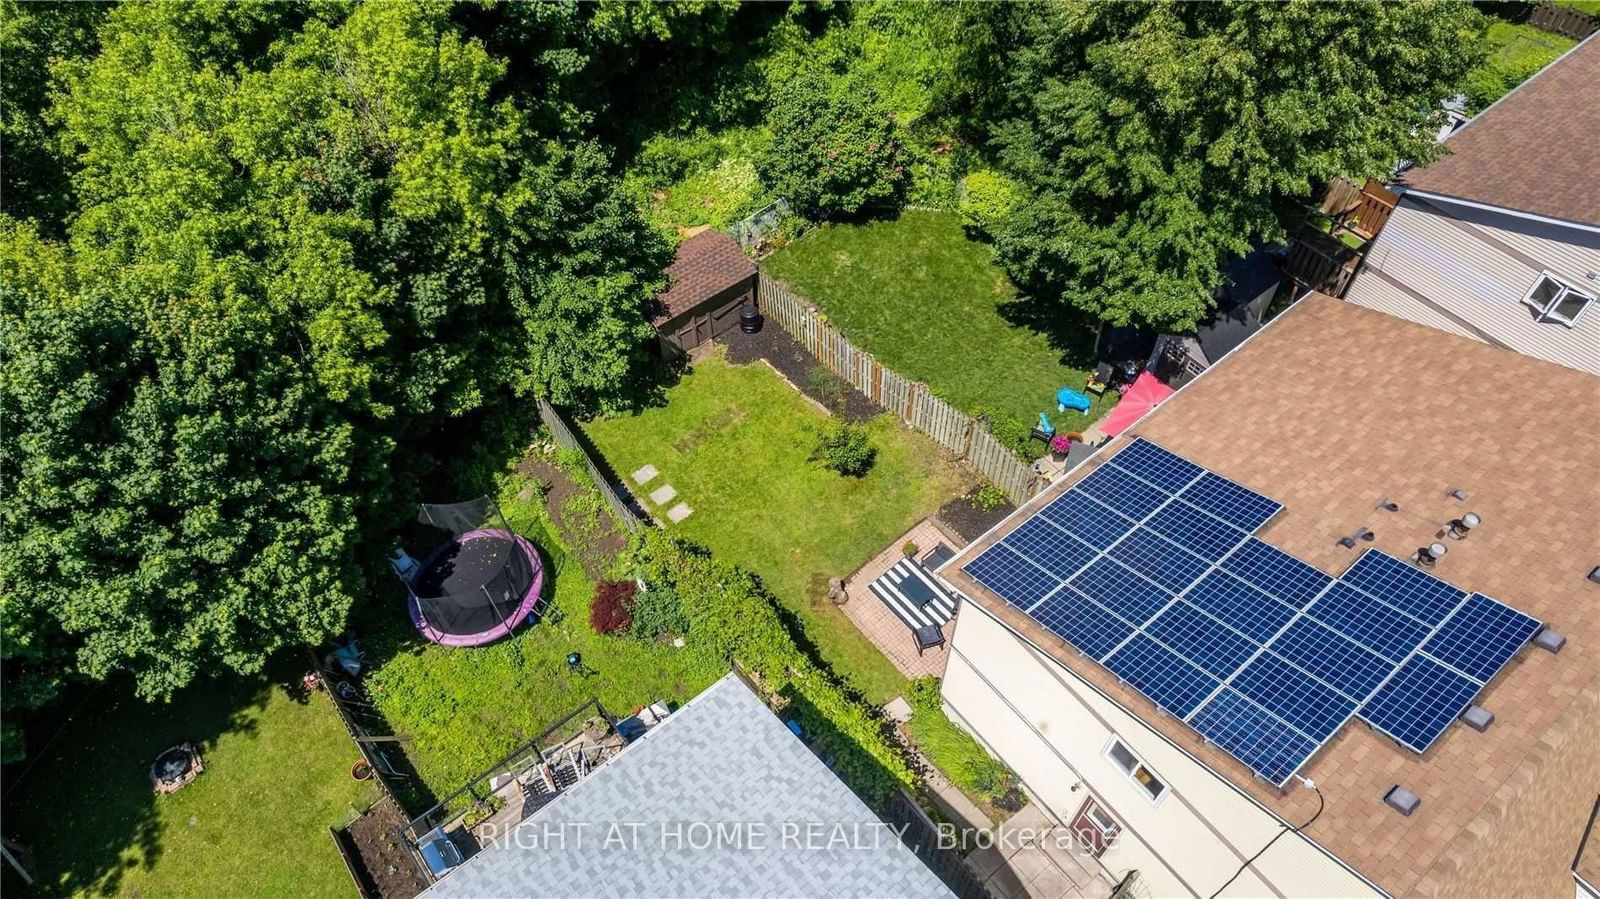
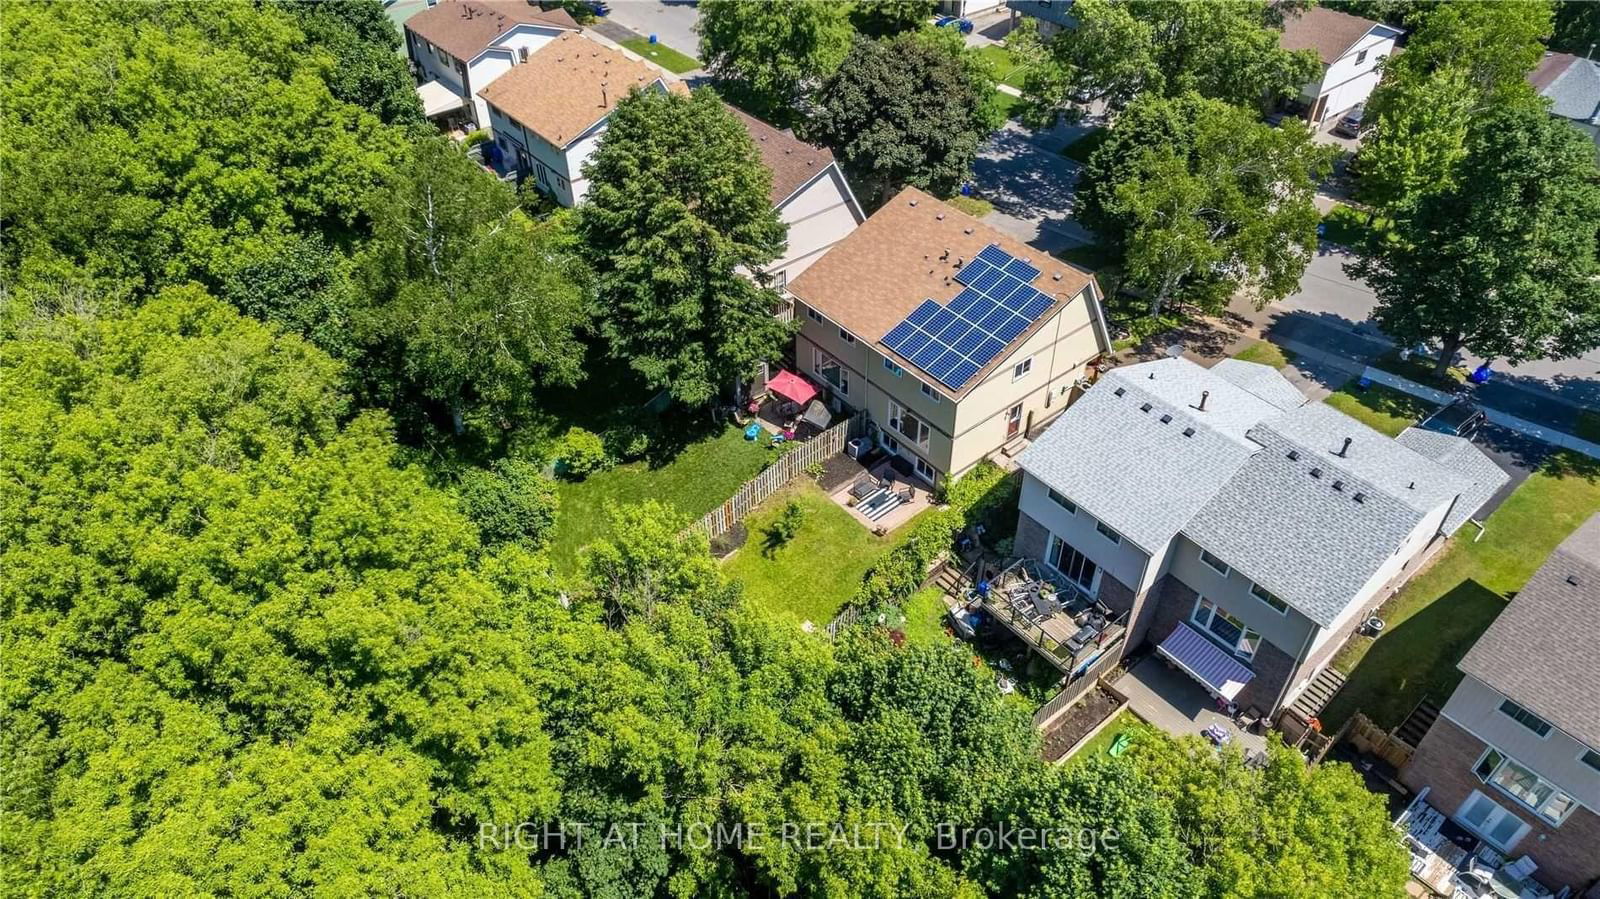
Welcome to 522 Camelot Dr. A Stunning Home on a Deep Ravine Lot! Experience the beauty of nature year-round with breathtaking views of lush, mature trees from summer through fall. This is a perfect blend of comfort and style. The main floor features an open-concept living and dining area that overlooks the ravine, creating a serene and picturesque backdrop. The kitchen is equipped with stainless steel appliances, ample cabinet storage, and a functional island with seating ideal for both casual meals and entertaining. Upstairs, you'll find three spacious bedrooms and a beautifully updated four-piece bathroom. The oversized primary bedroom boasts a large wall-to-wall closet for all your storage needs, along with two cozy nooks perfect for reading, relaxing, or a home office setup. The bright basement, with oversized above-ground windows, offers an inviting extension of the home. Currently used as a theatre room and work-from-home space, it provides endless possibilities to suit your lifestyle. Solar panels under contract which will reduce costs in the future and have a positive environmental impact. Additional highlights include durable laminate flooring throughout, a deep driveway with parking for 3 cars, and recent upgrades: Furnace (2018), A/C (2022), and Owned Hot Water Tank (2019). Located in a welcoming neighborhood, you're just a short walk from Harmony Creek Trails and in close proximity to Oshawa Costco Plaza. Plus, you're only minutes from HWY 401 and Oshawa GO Station for an effortless commute. Dont miss out on this fantastic opportunity to own a home in a prime location!
Include S/S Fridge, S/S Stove, B/I Dishwasher, Washer, Dryer, Microwave, Solar Panels. Hot Water Tank Owned (2021), Furnace (2020).
Kitchen
Dining
Living
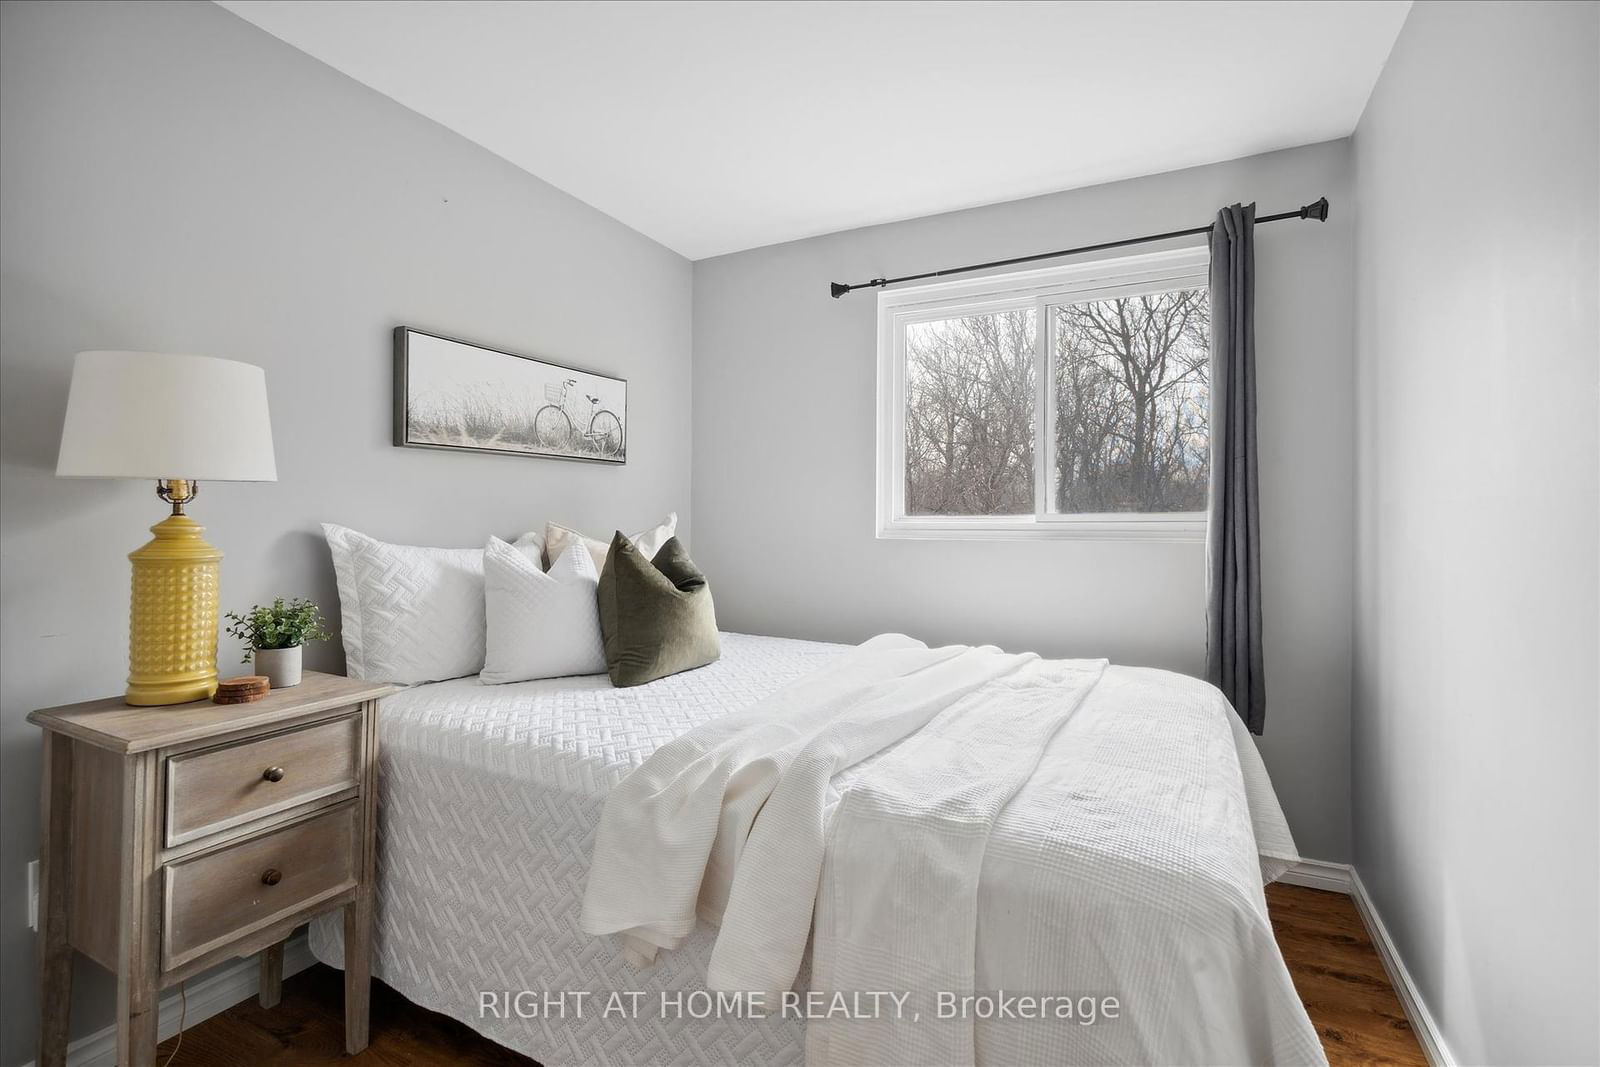
Primary
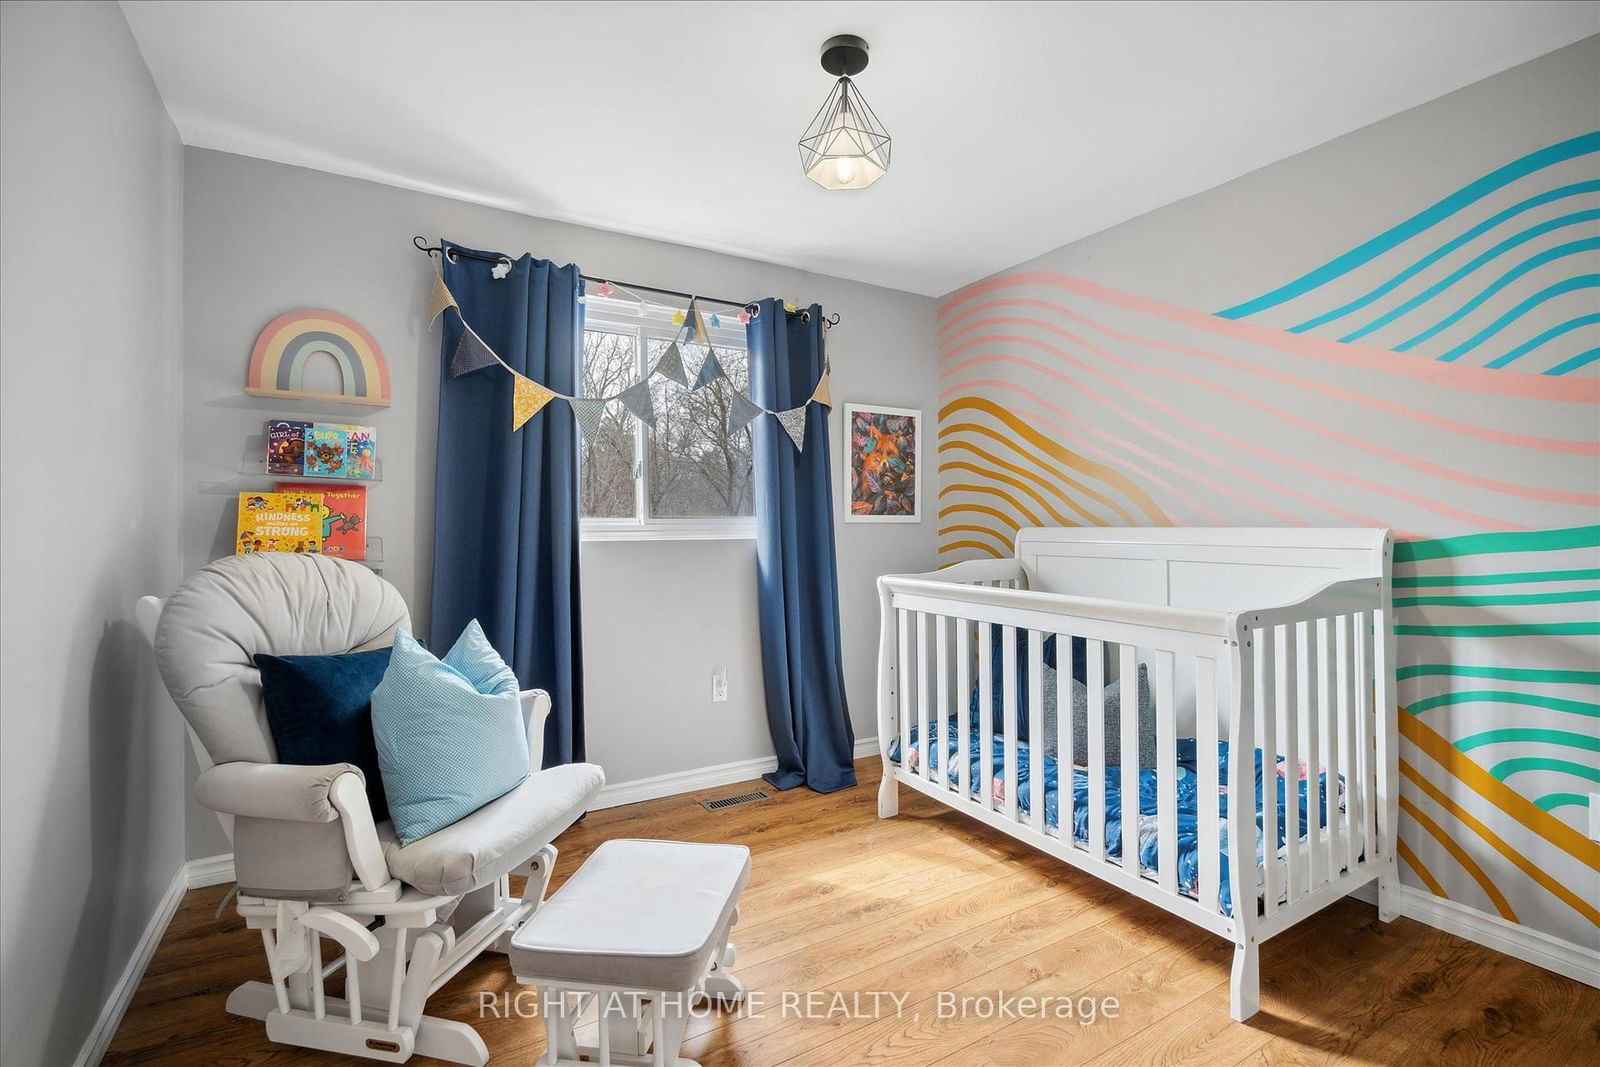
2nd Br
3rd Br
Rec
The graph below compares the average list price and average sale price of homes in this neighborhood by month for the last 24 months. When average sale price is greater than average list price, this may suggest a buyer's market. When average sale price is lower than the average list price this may suggest a seller's market.
The graph below illustrates the average days on market for homes in this neighborhood. The yellow area may indicate a buyer's market, the green area may indicate a balanced market and the red area may indicate a seller's market.
Sales Representative, Century 21 People’s Choice Realty Inc., Brokerage
(647) 576 - 2100