Century 21 People’s Choice Realty Inc., Brokerage
120 MATHESON BLVD E #103
MISSISSAUGA, Ontario
L4Z 1X1


Oshawa, Central, L1H 5Z3
$799,000$000000
Listed by SUTTON GROUP REALTY SYSTEMS INC..
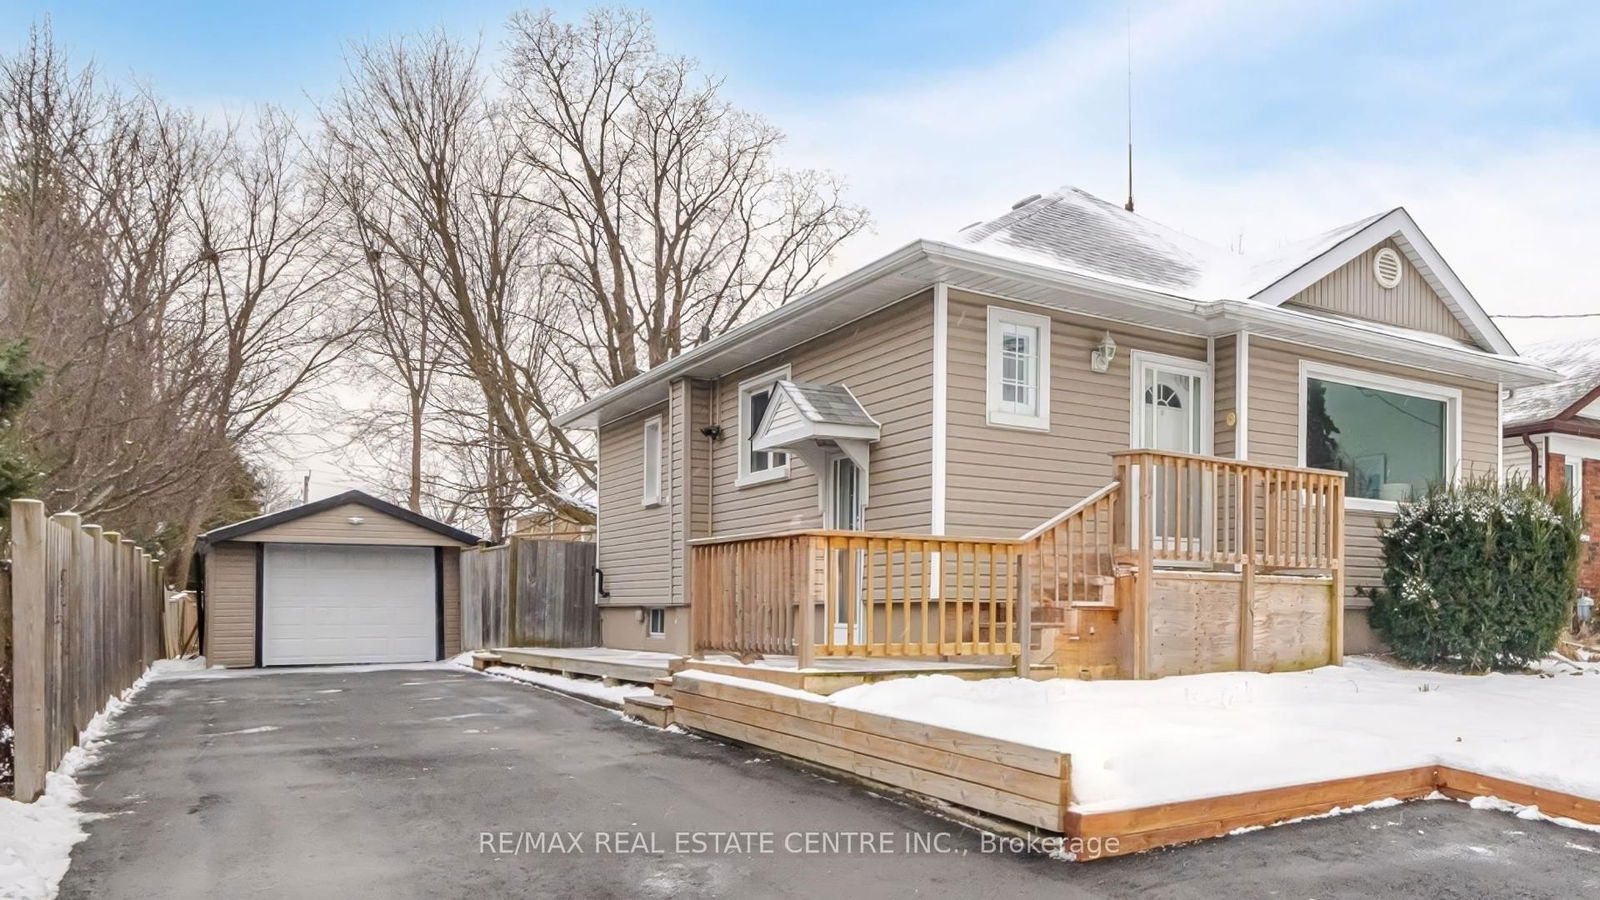
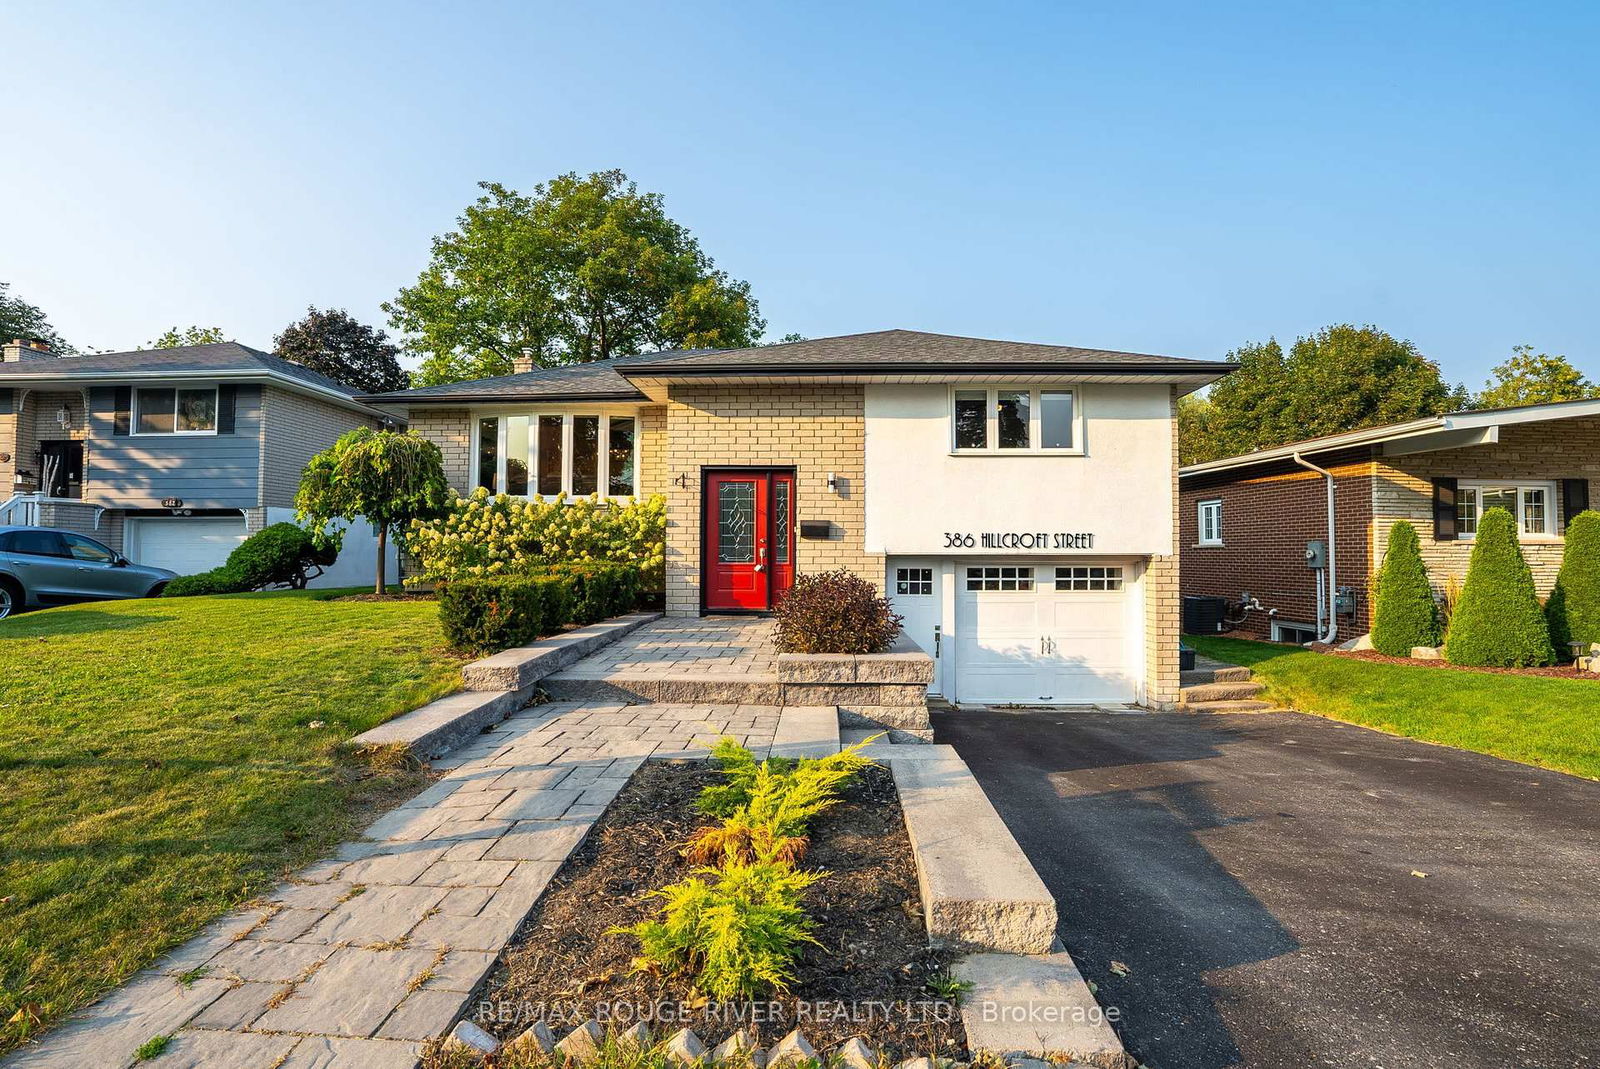
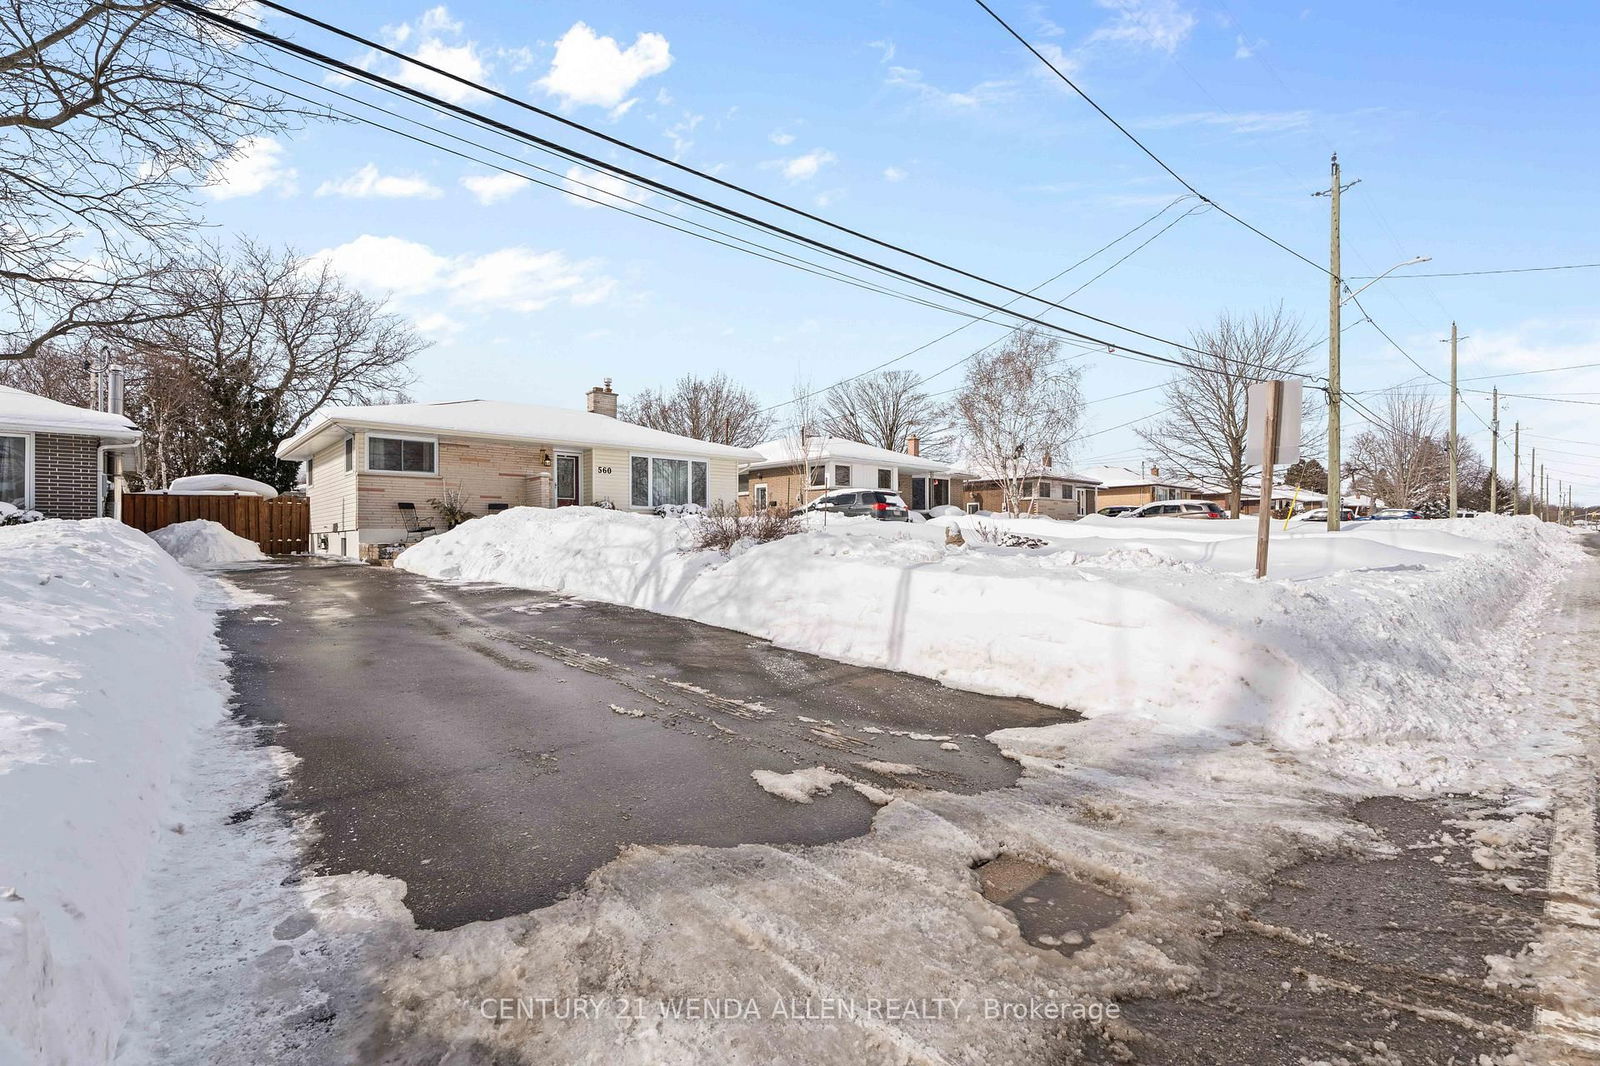
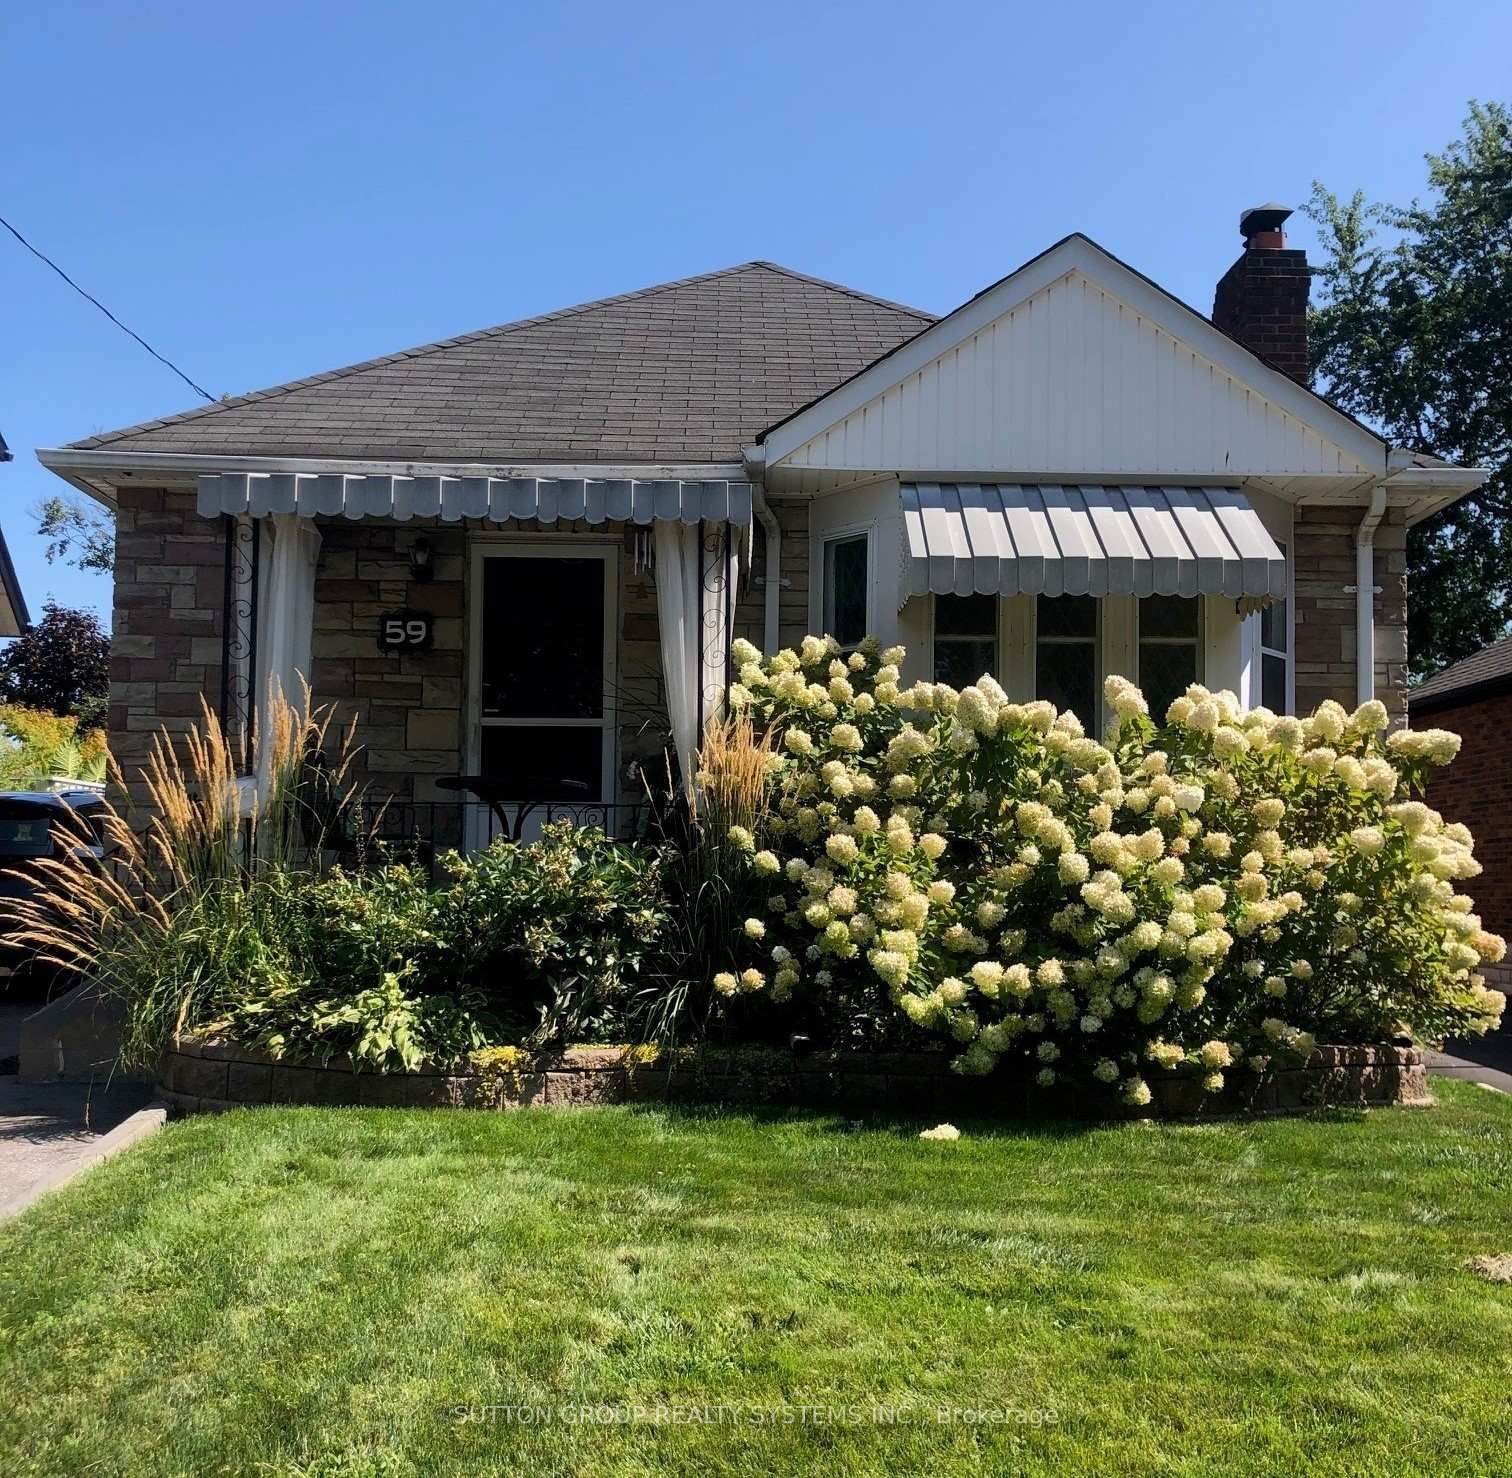
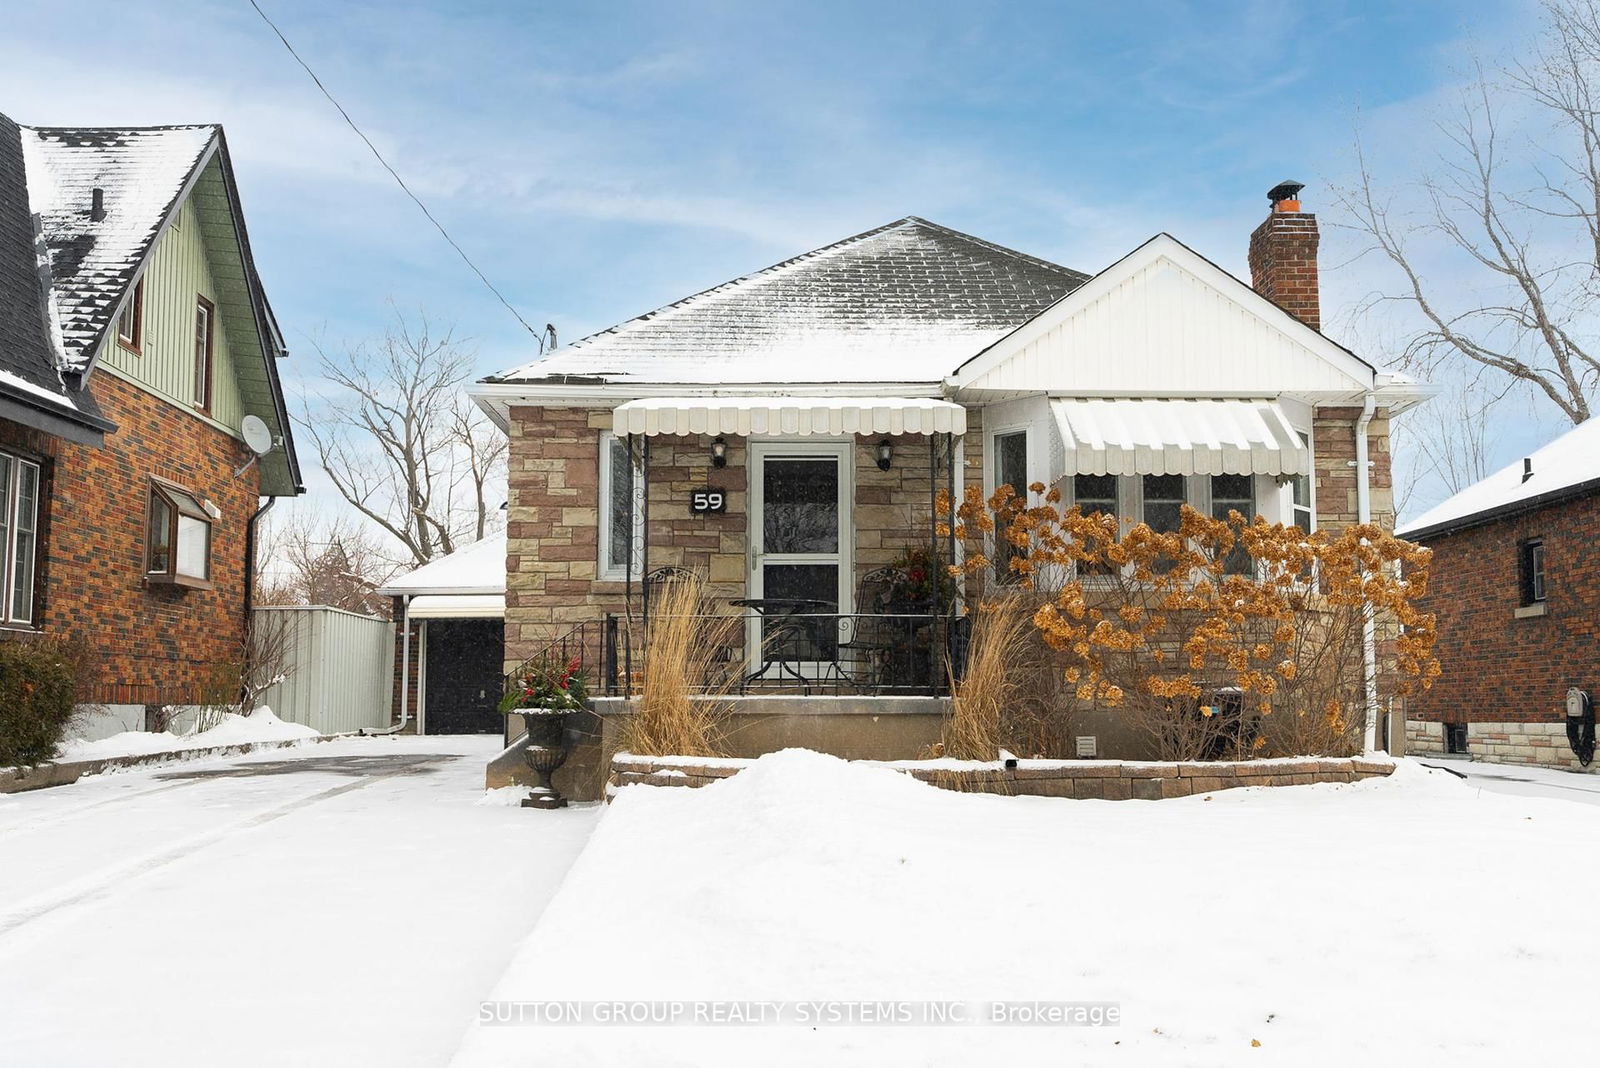
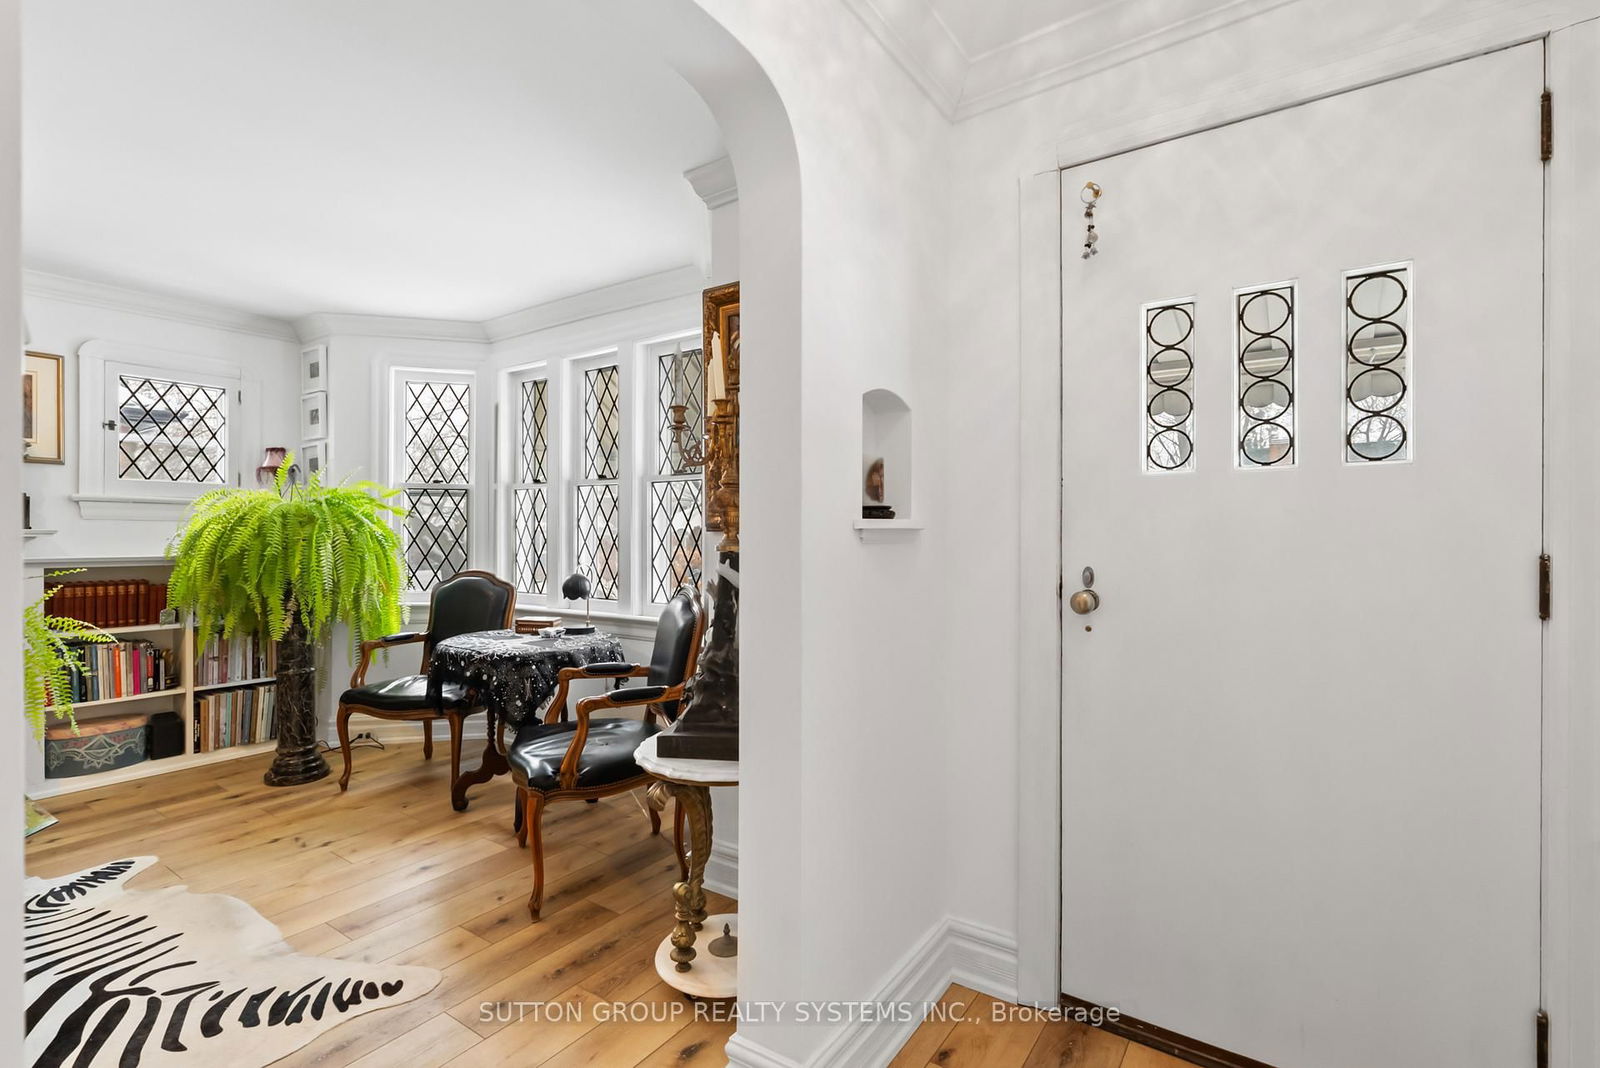
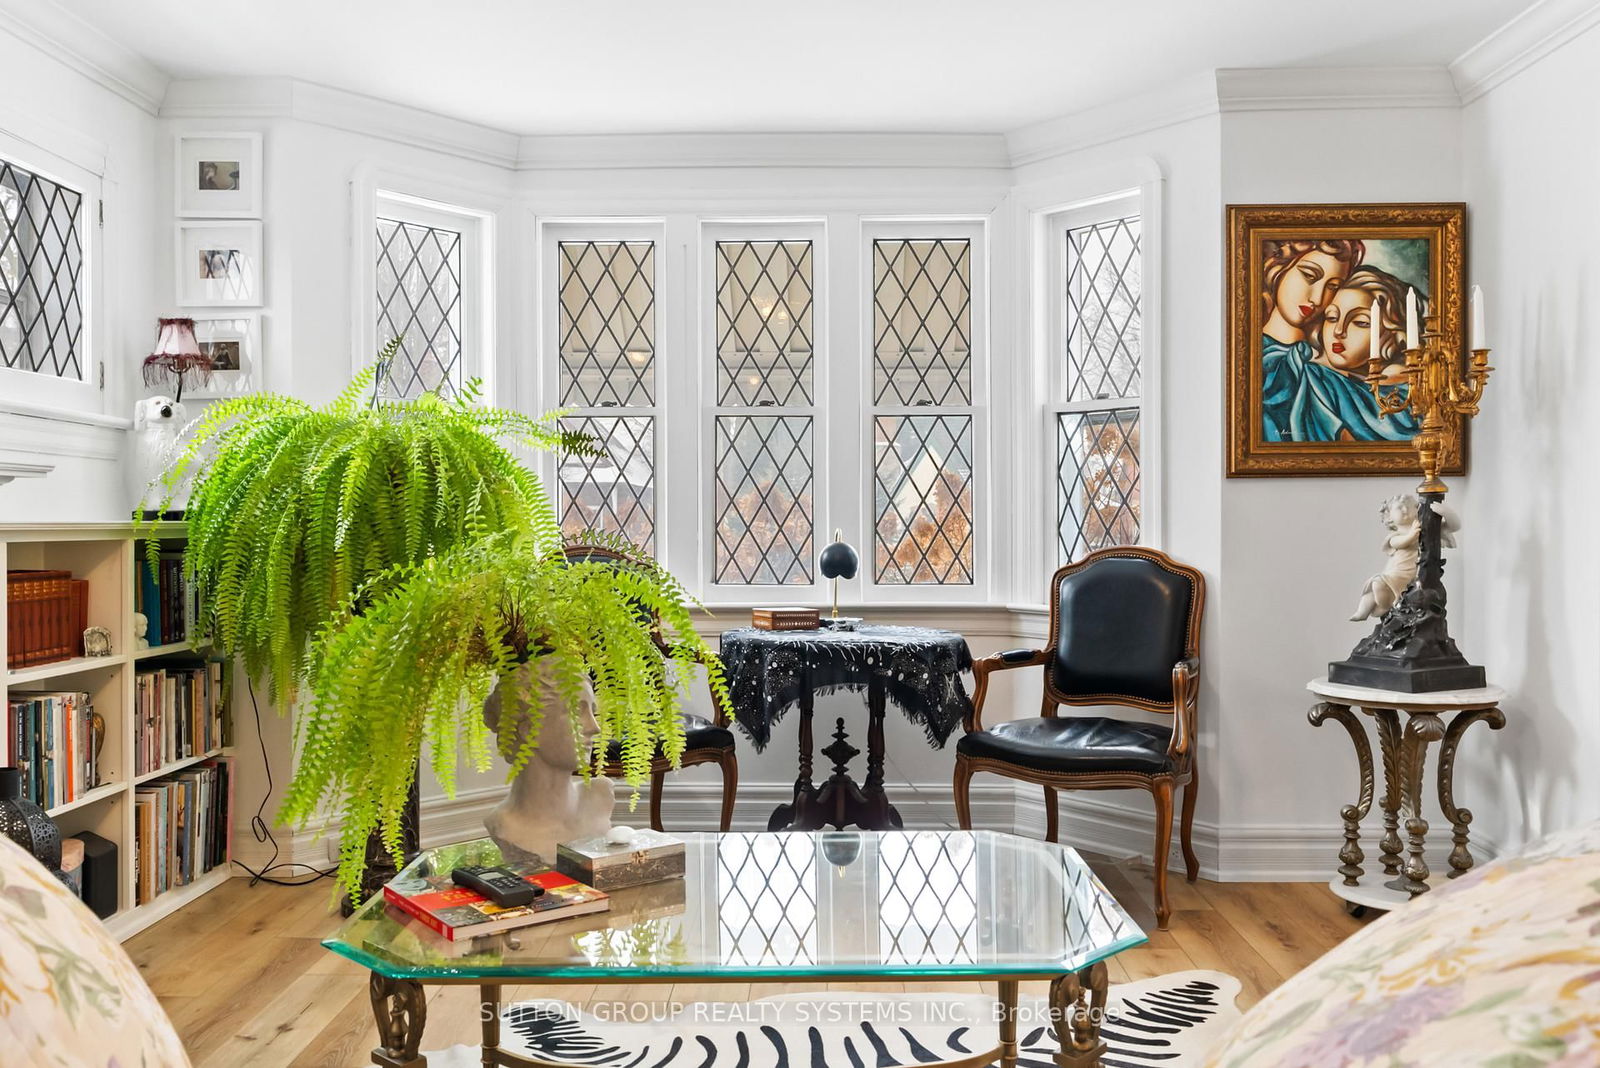
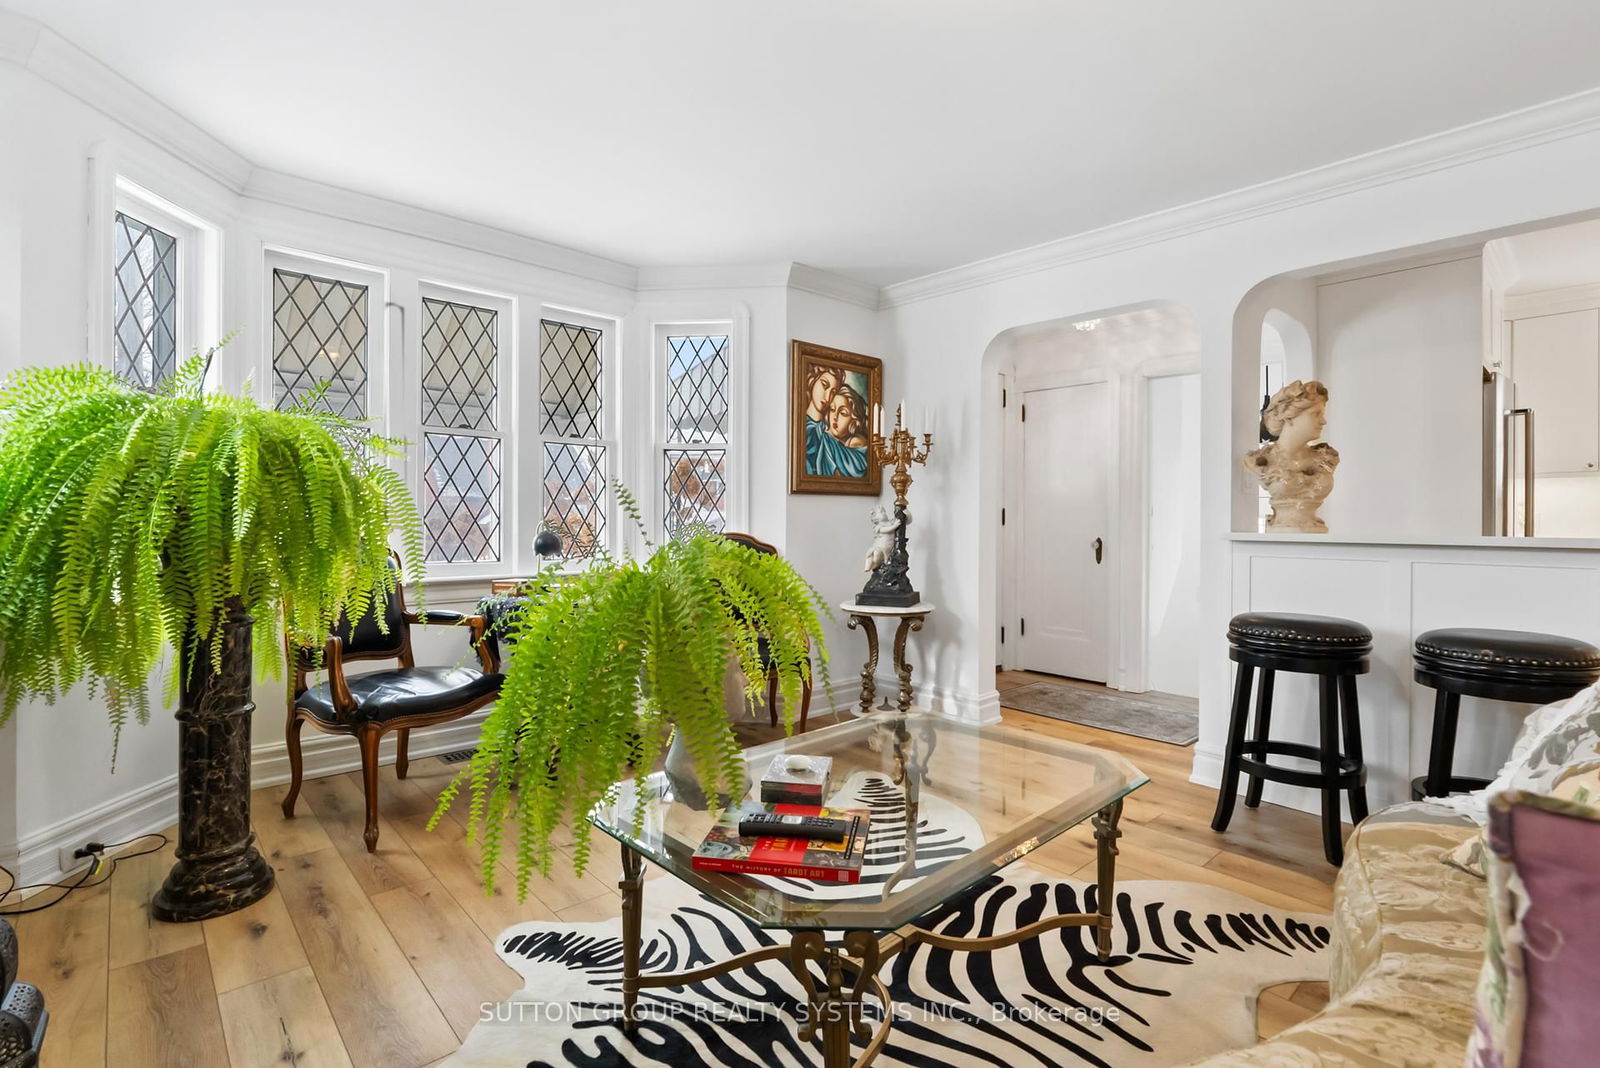
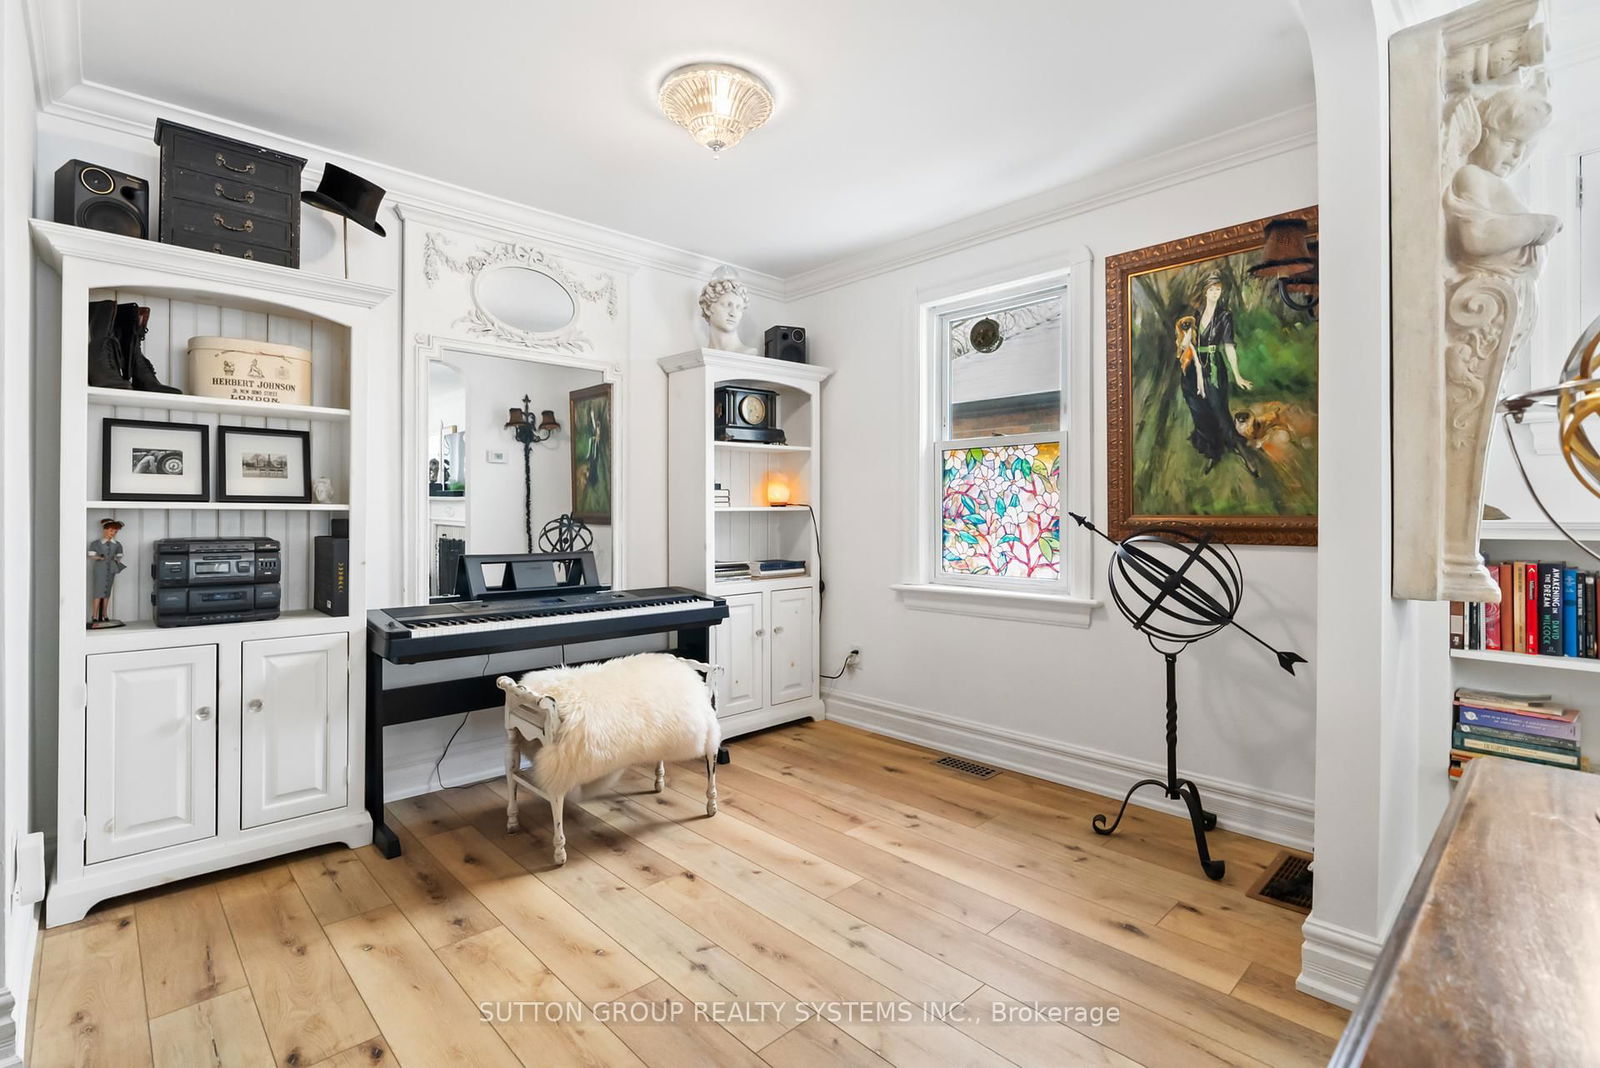
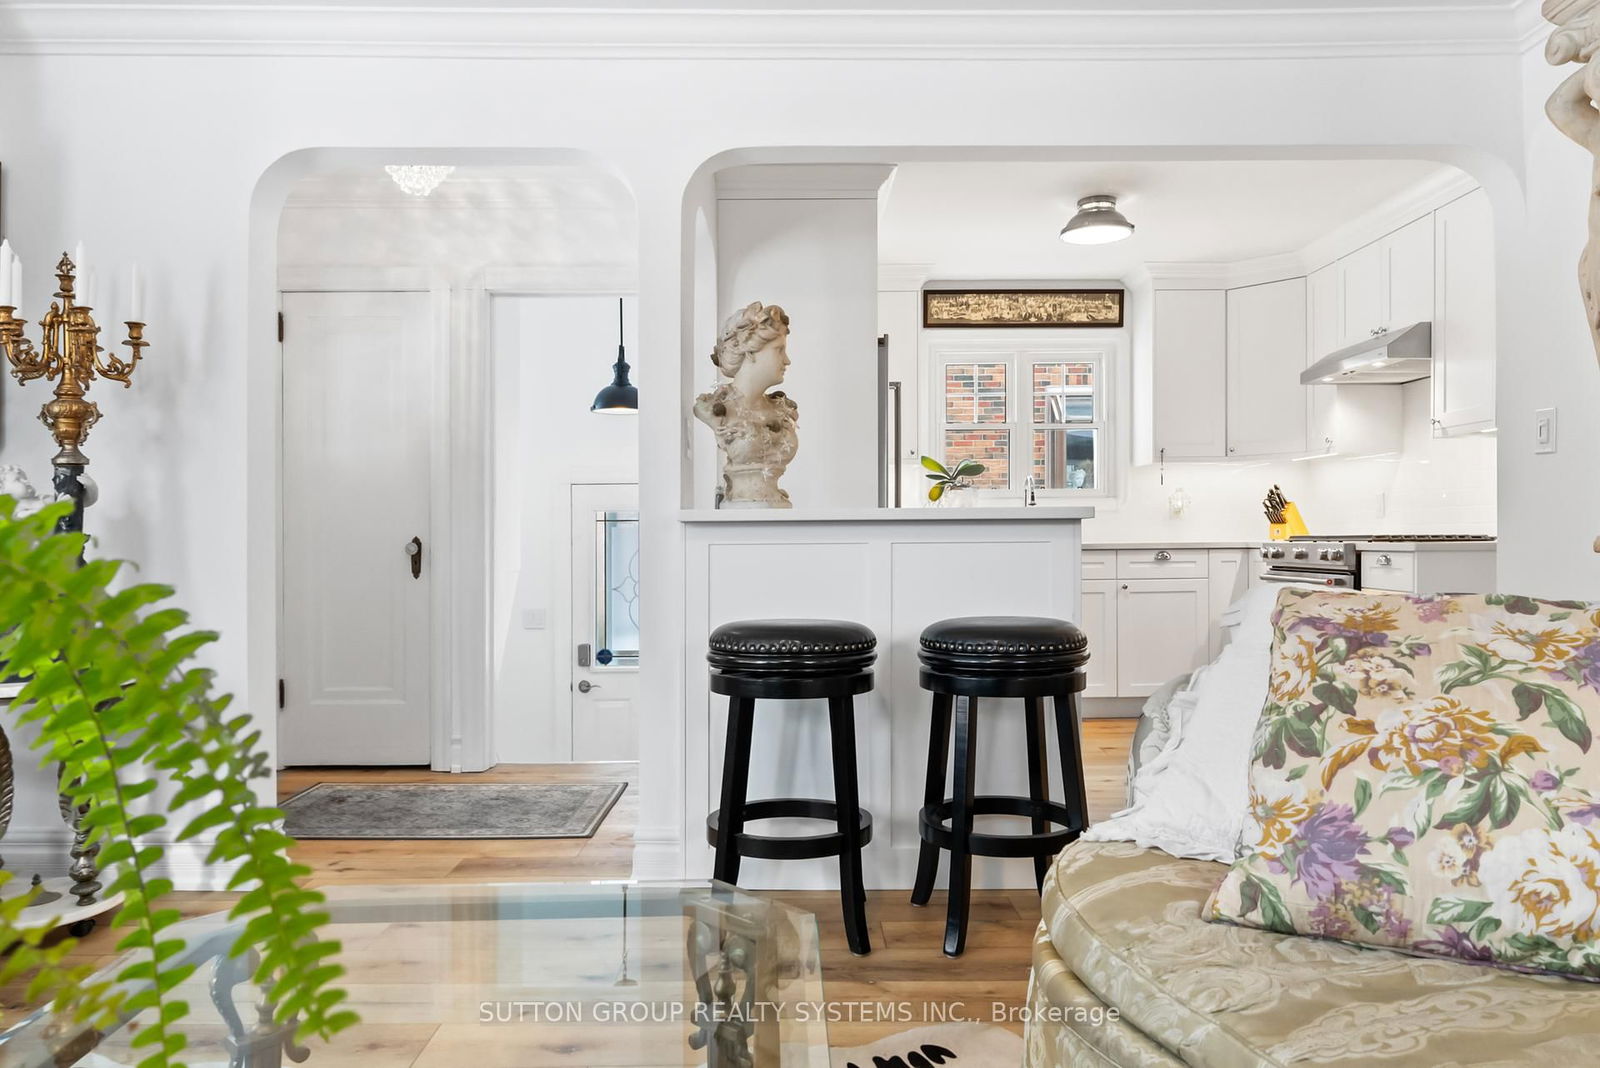
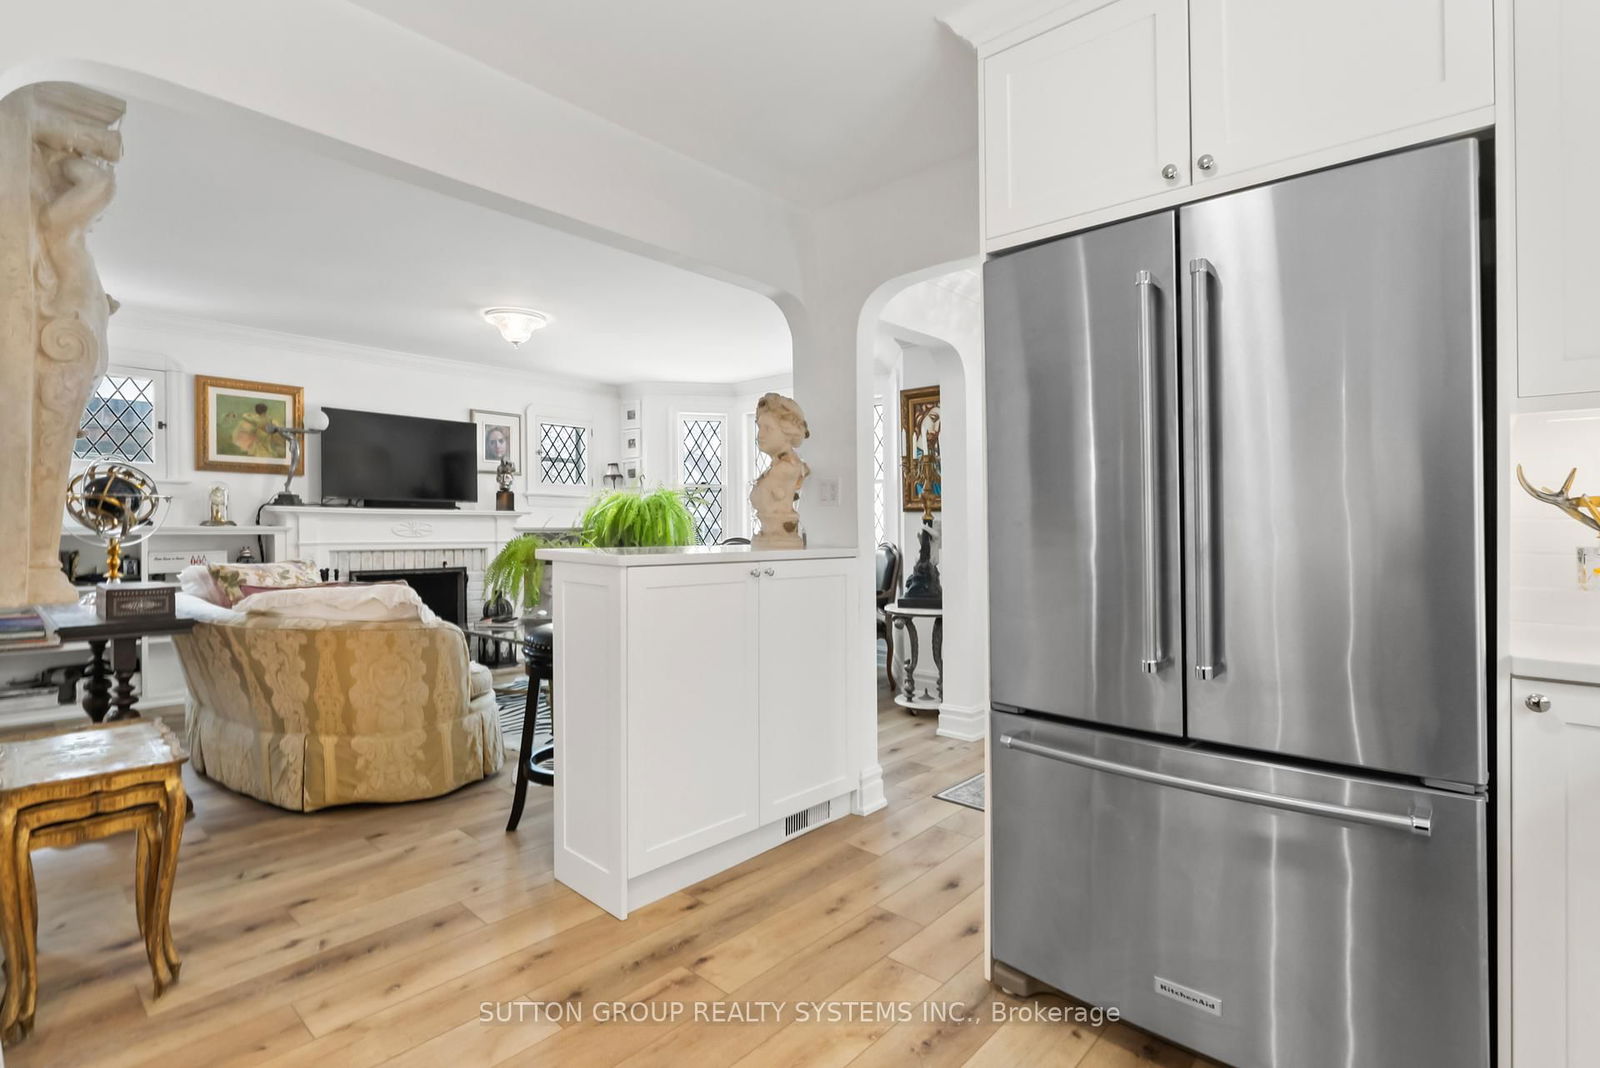
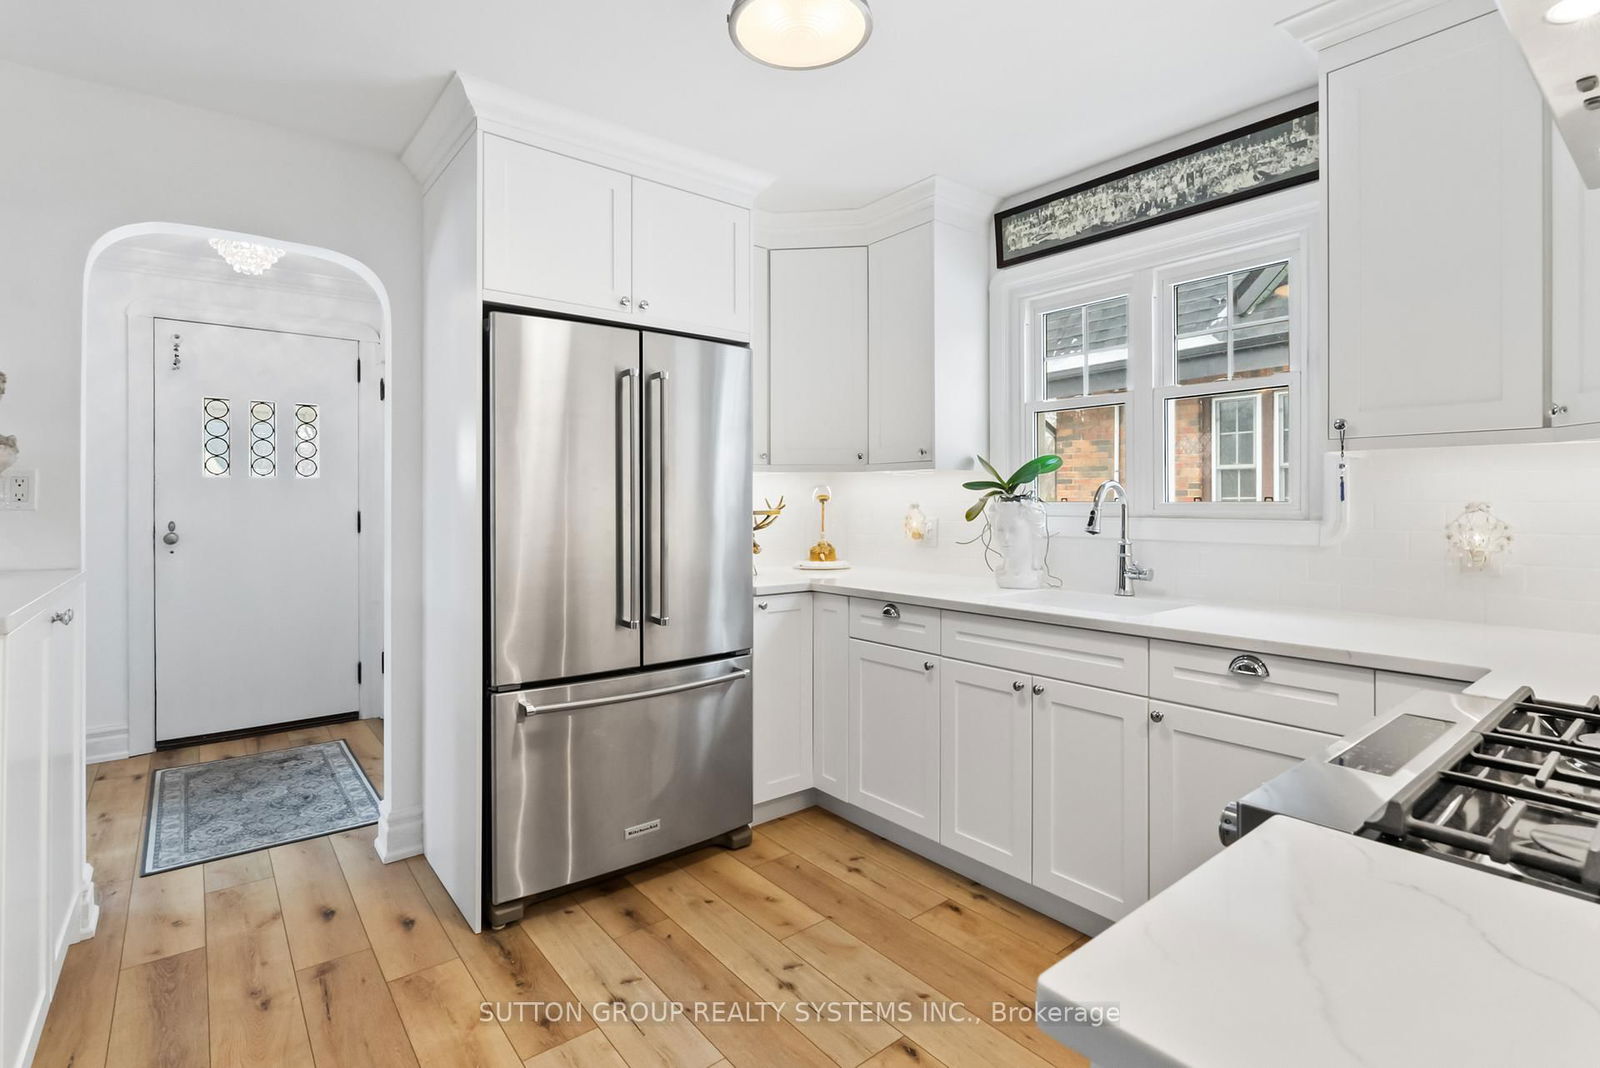
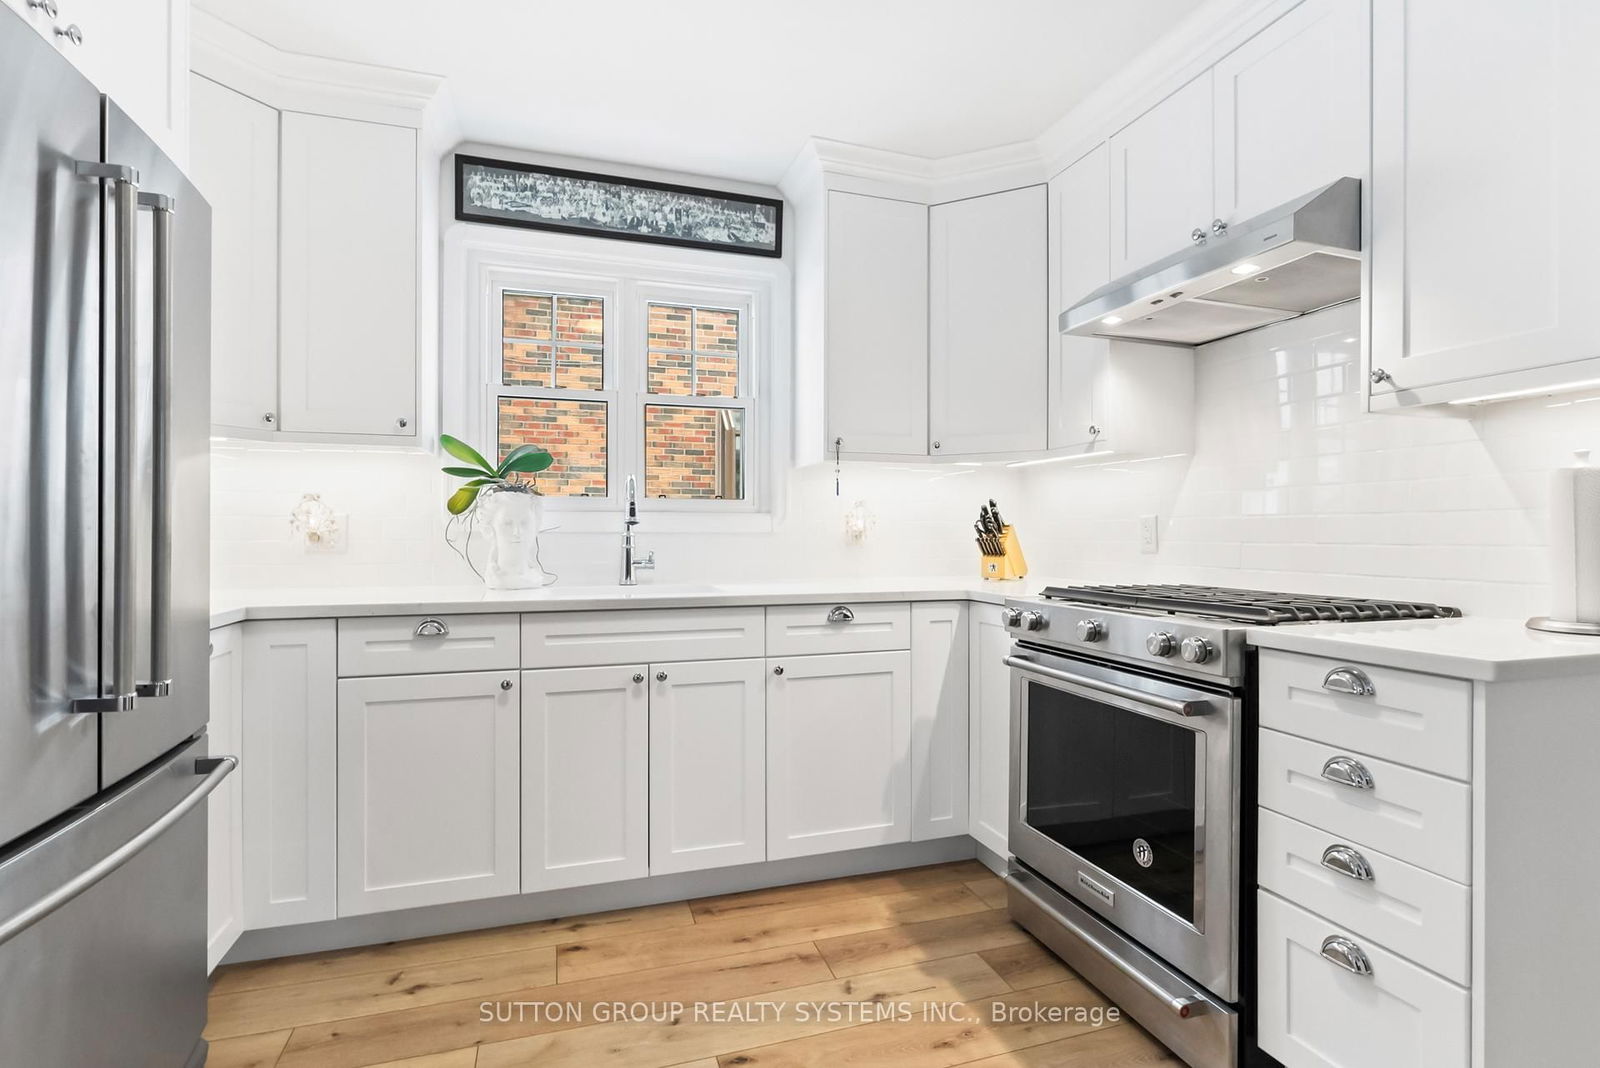
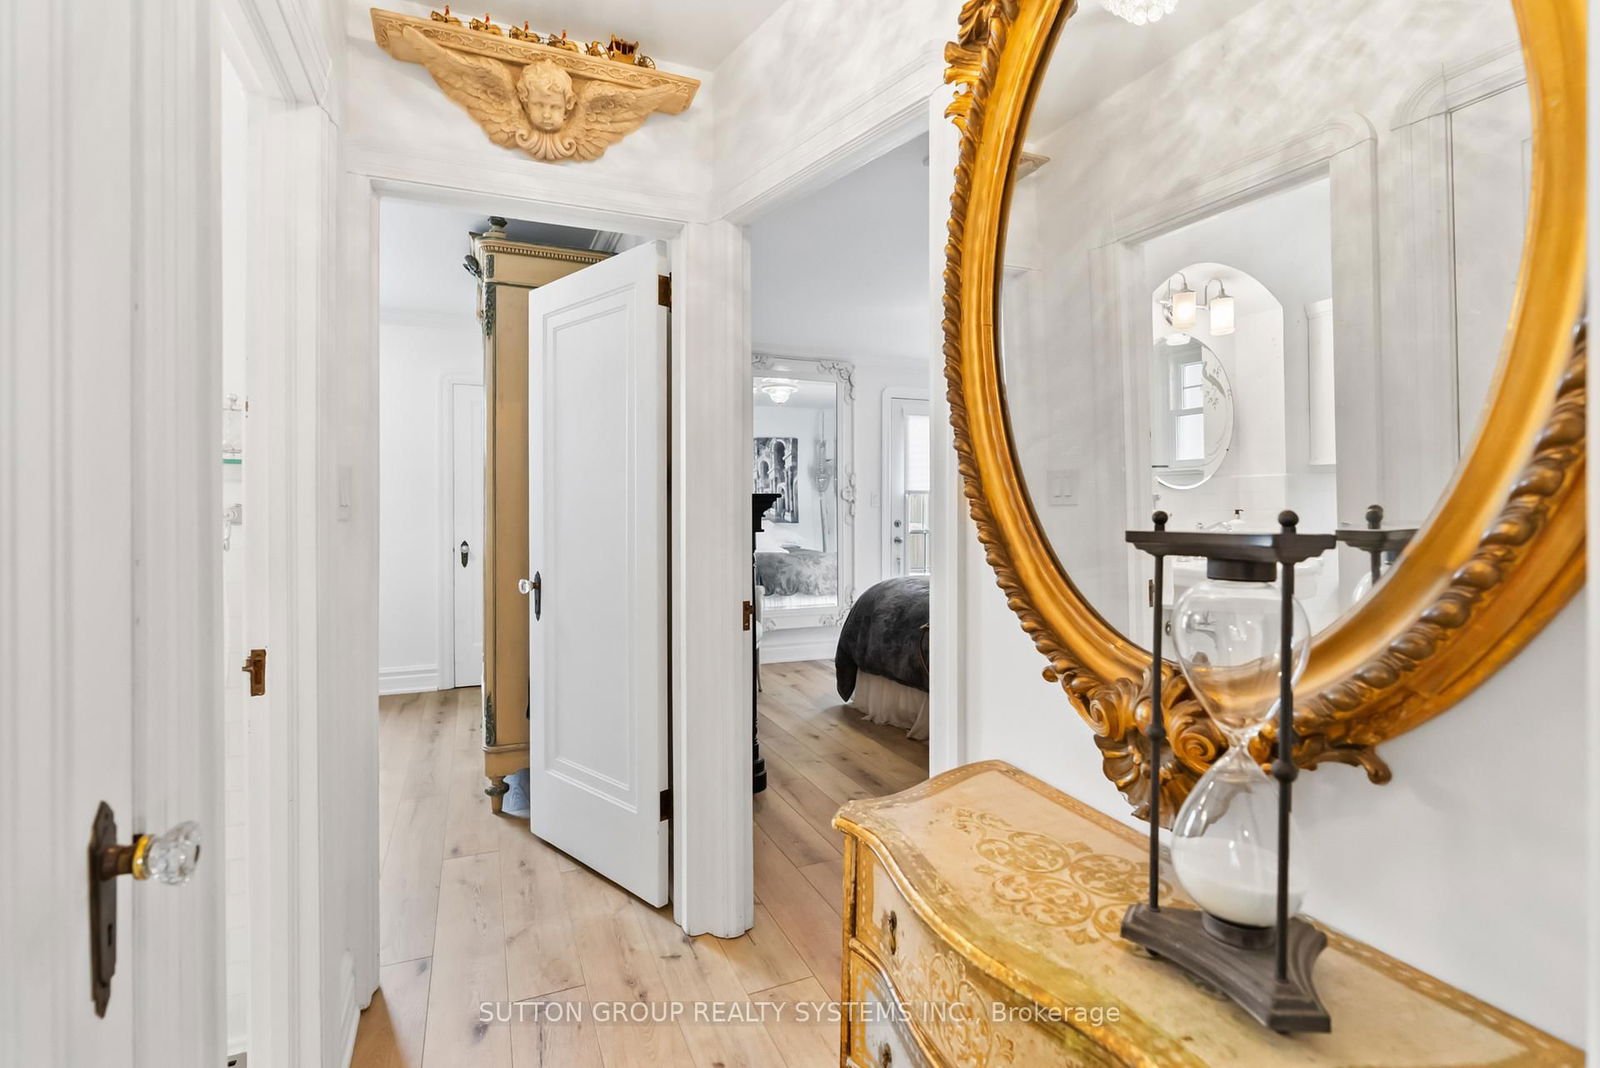
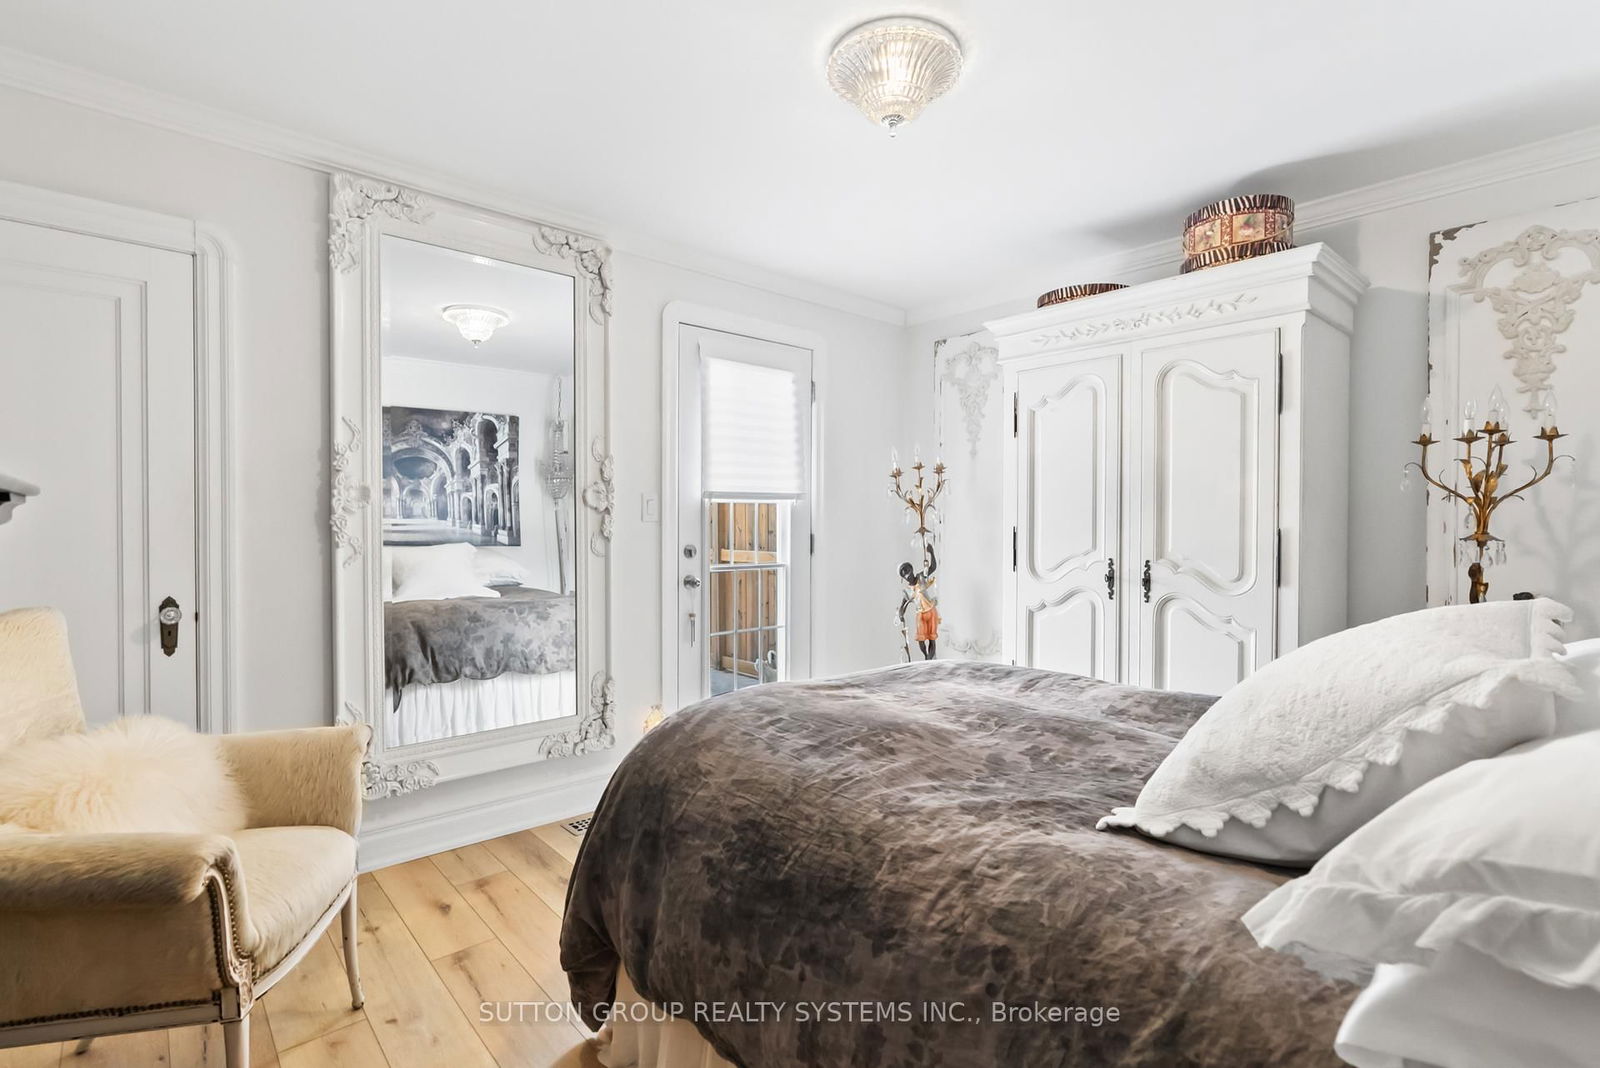
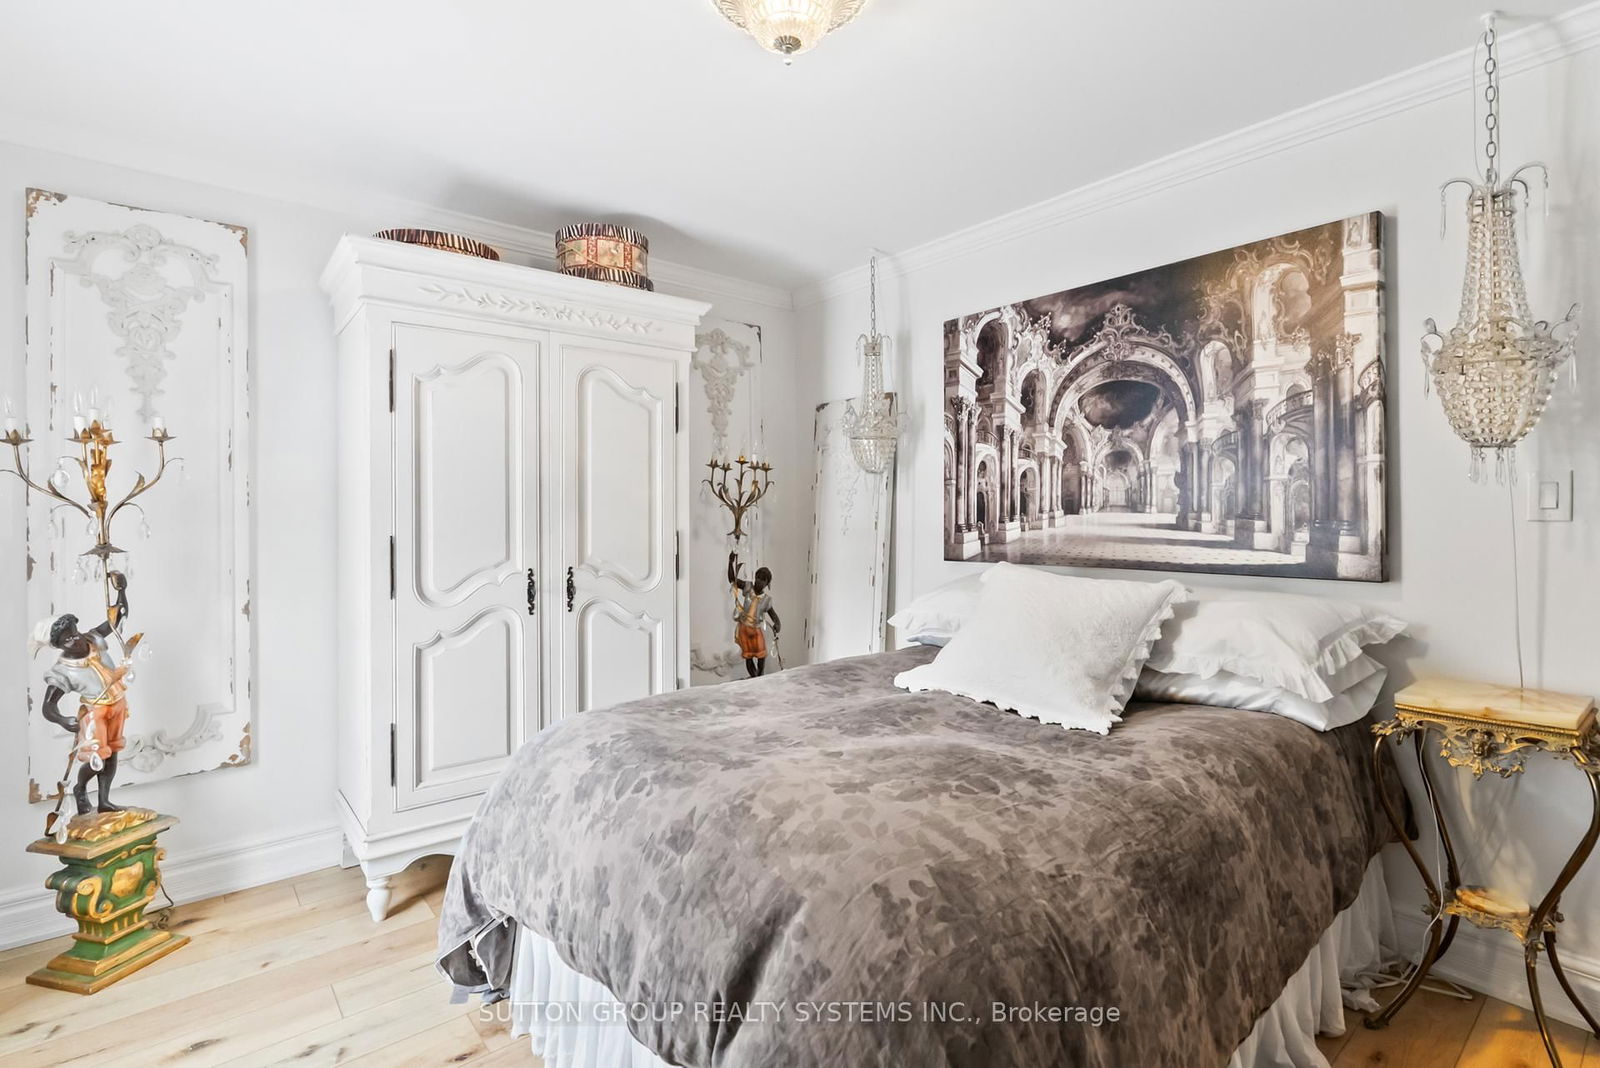
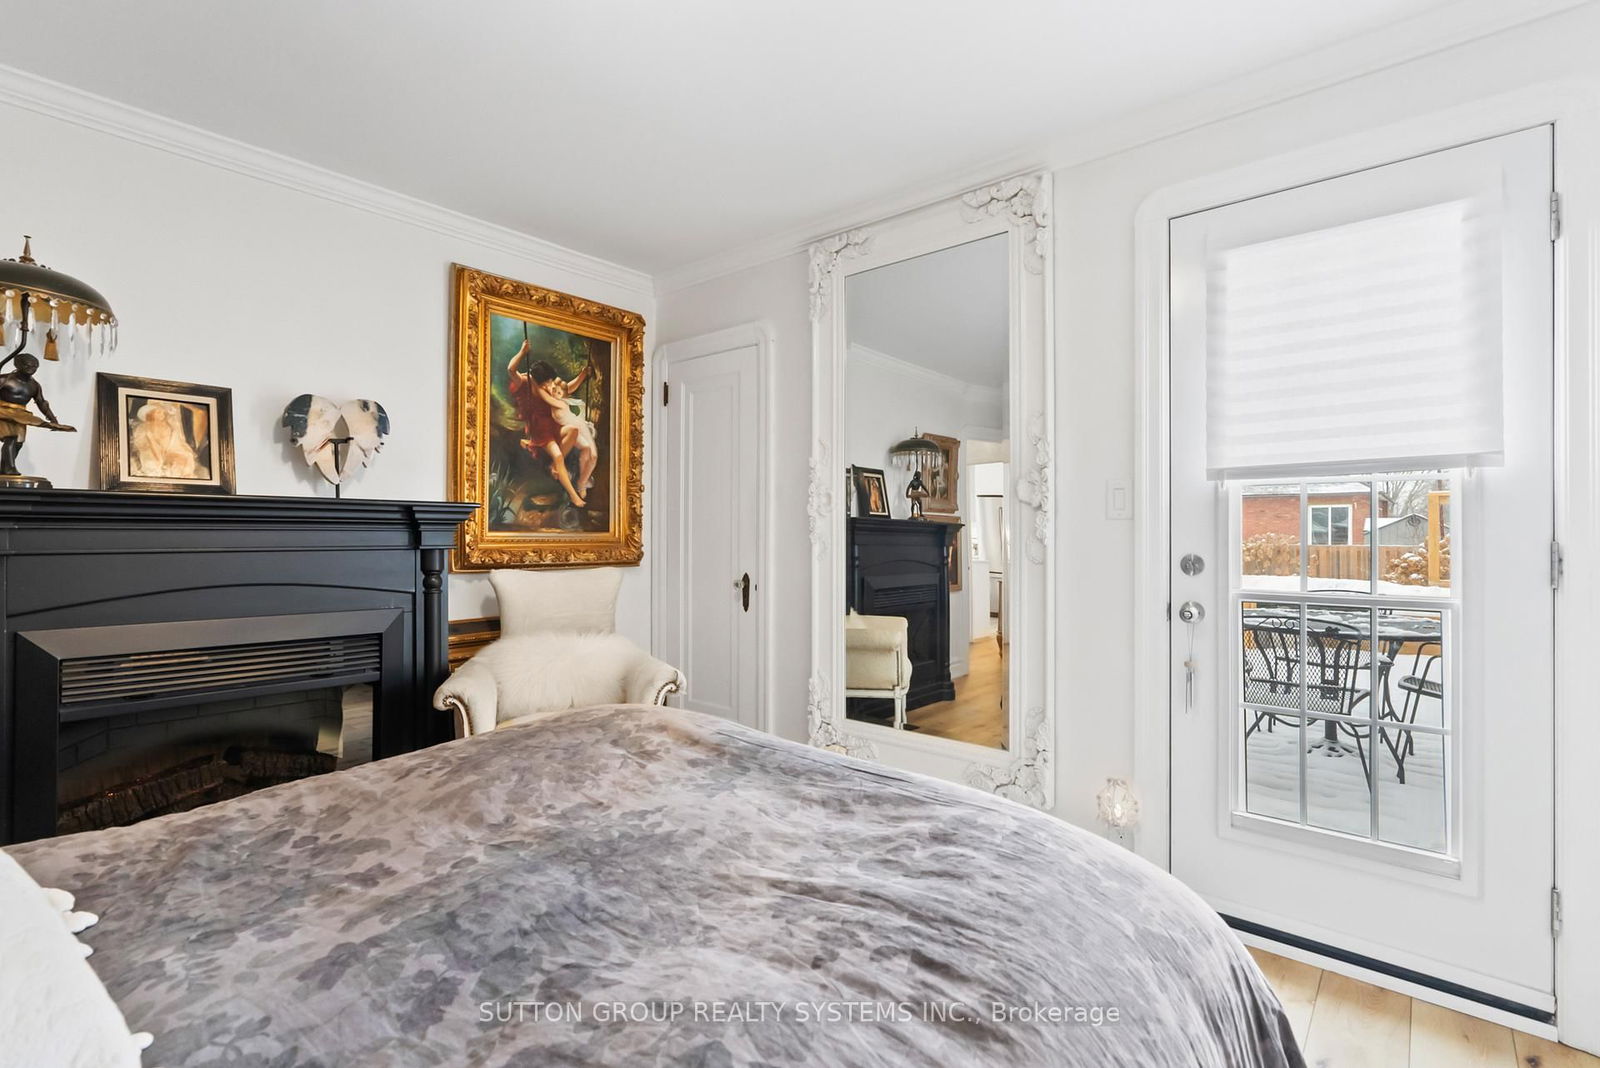
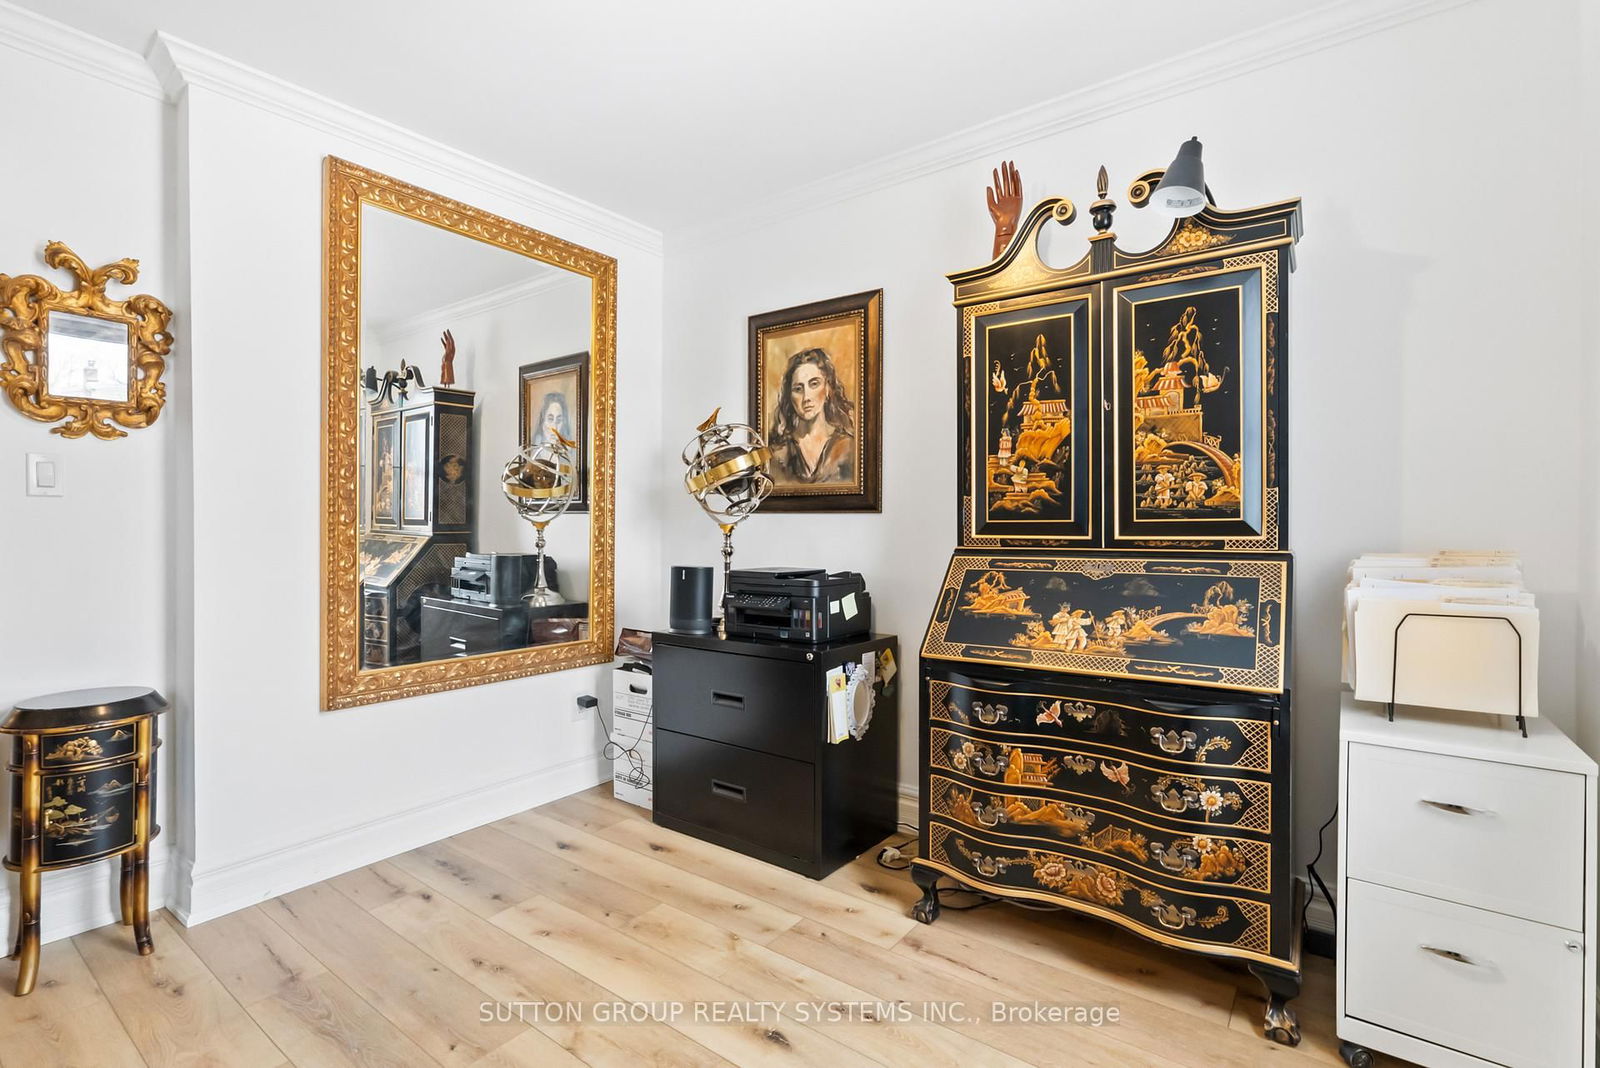
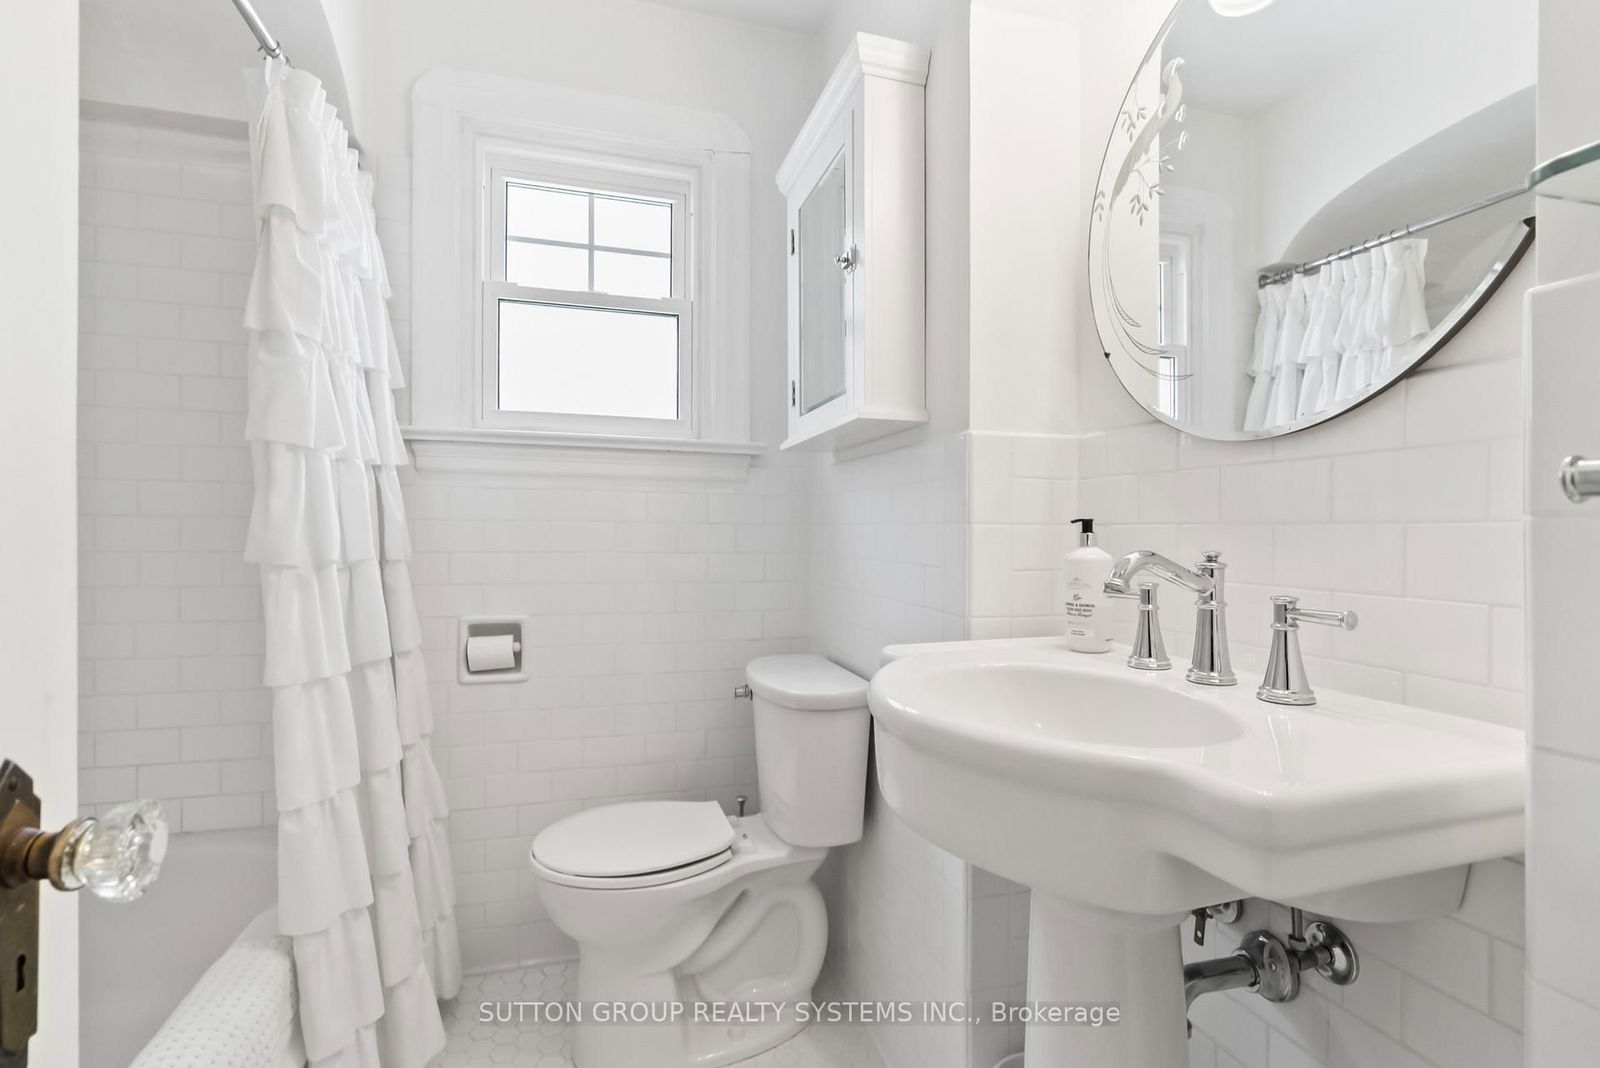
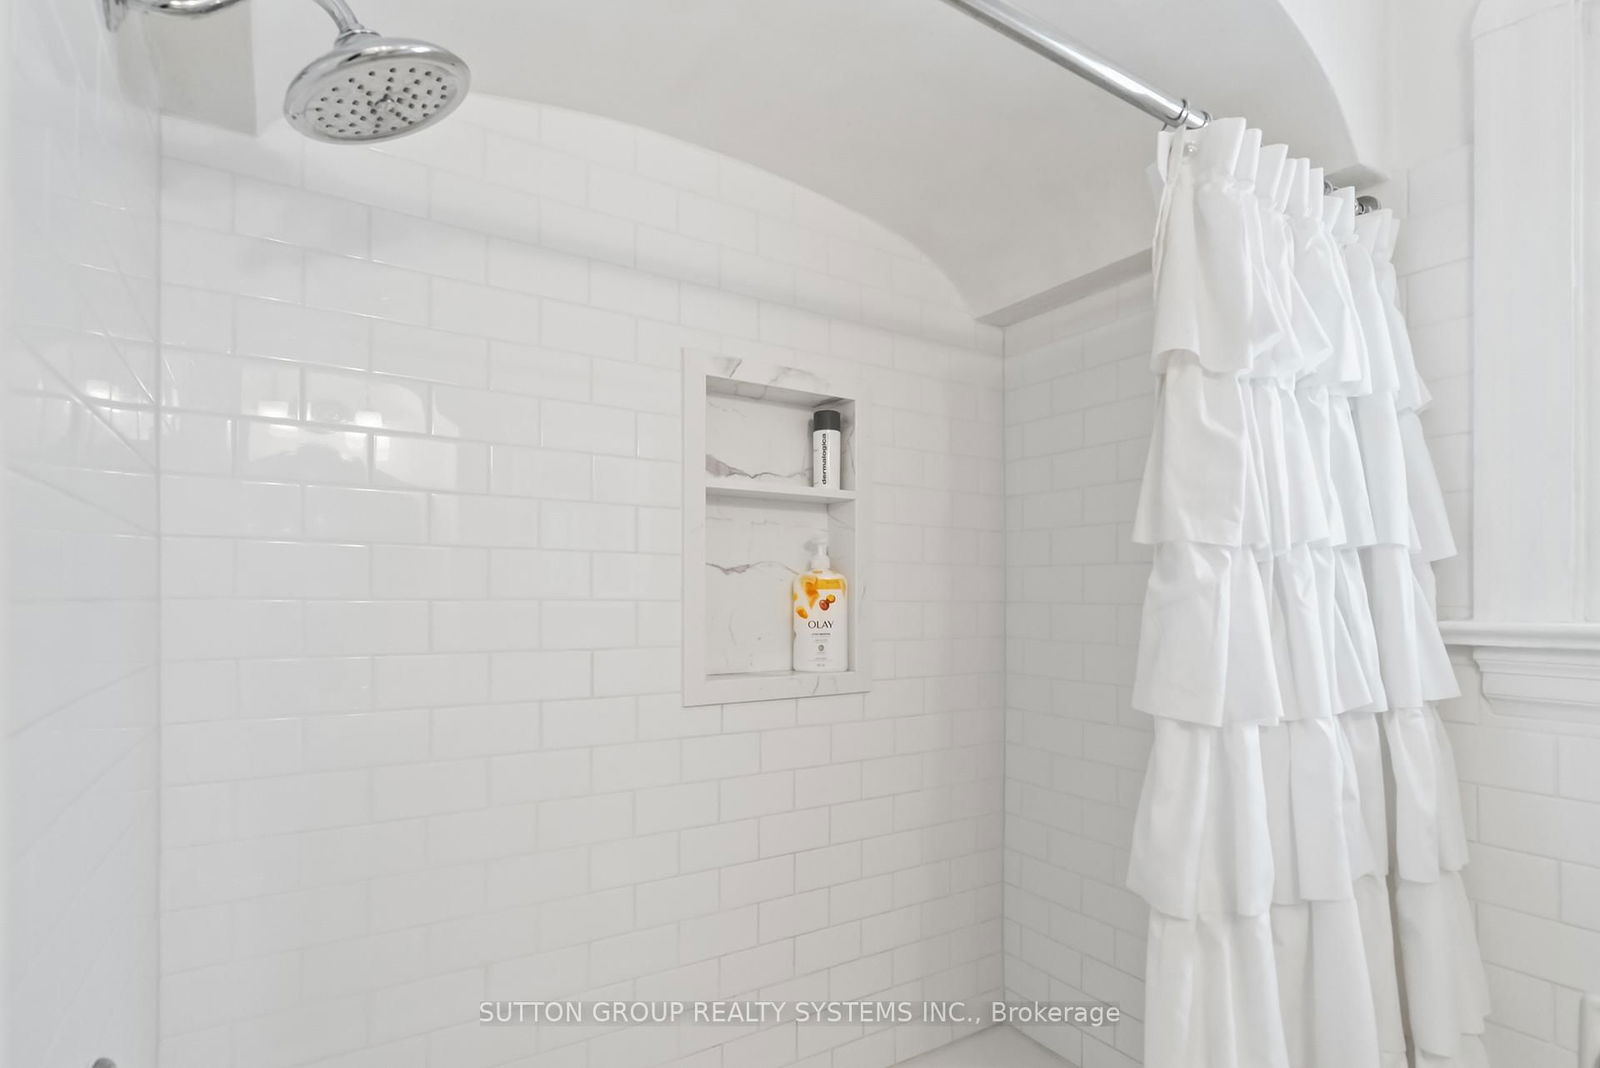
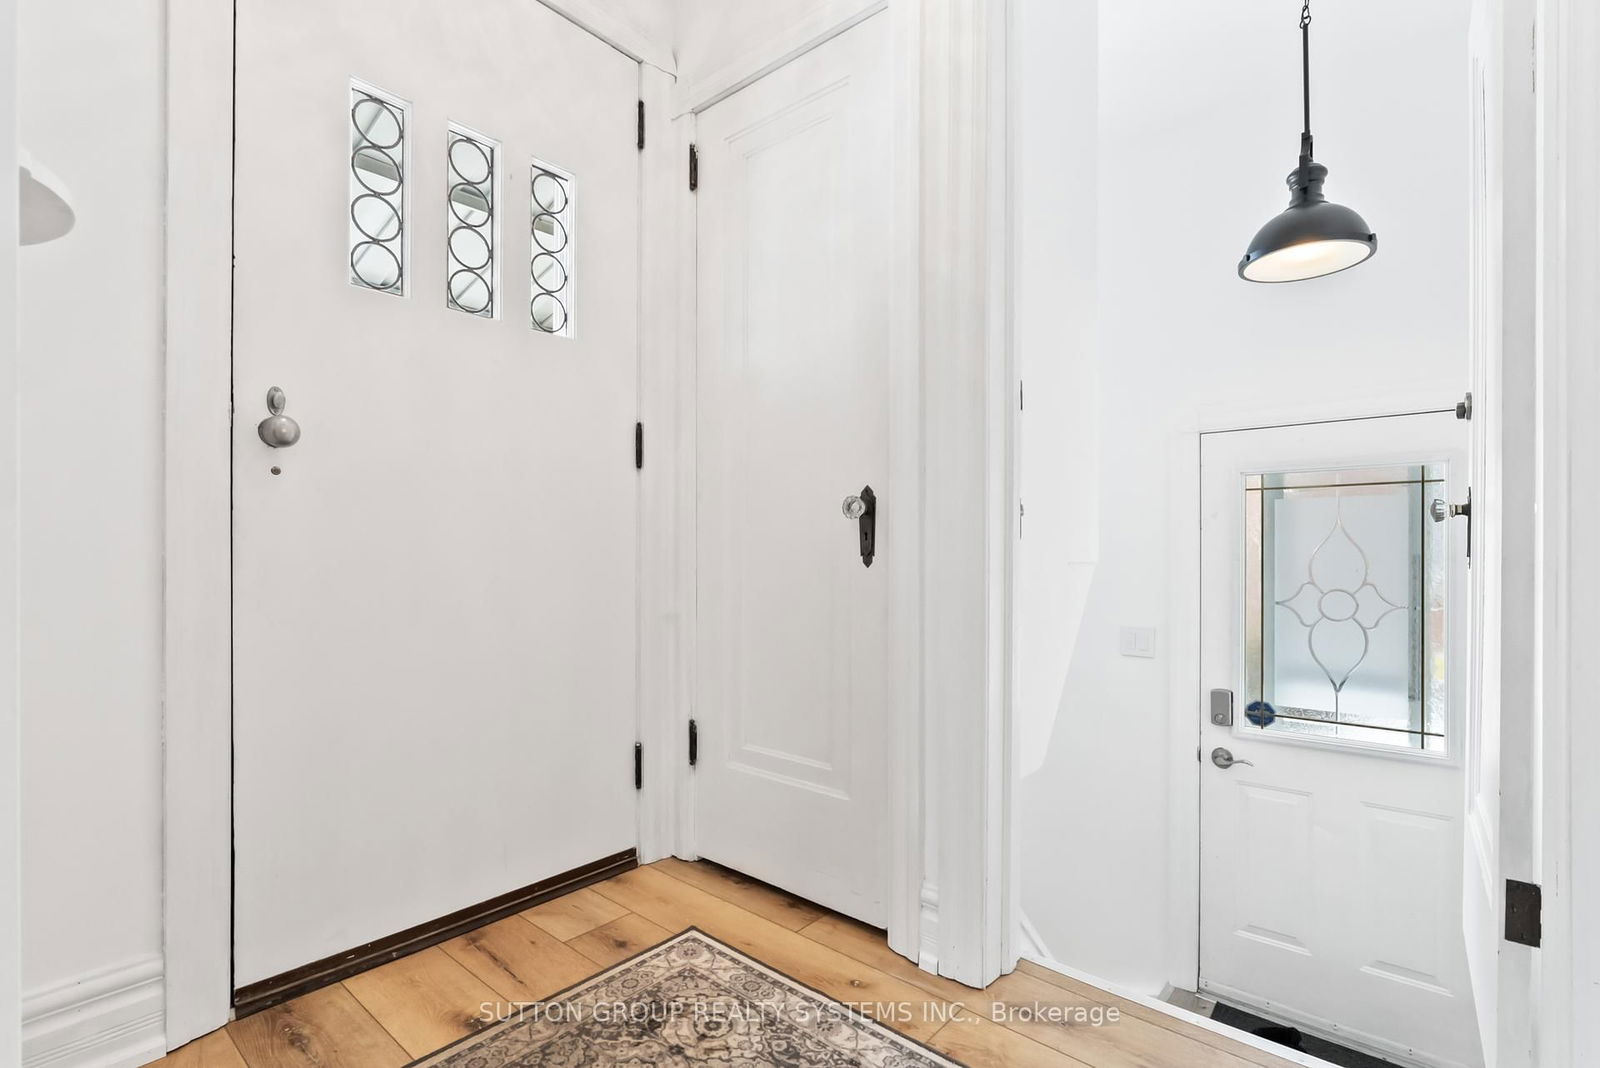
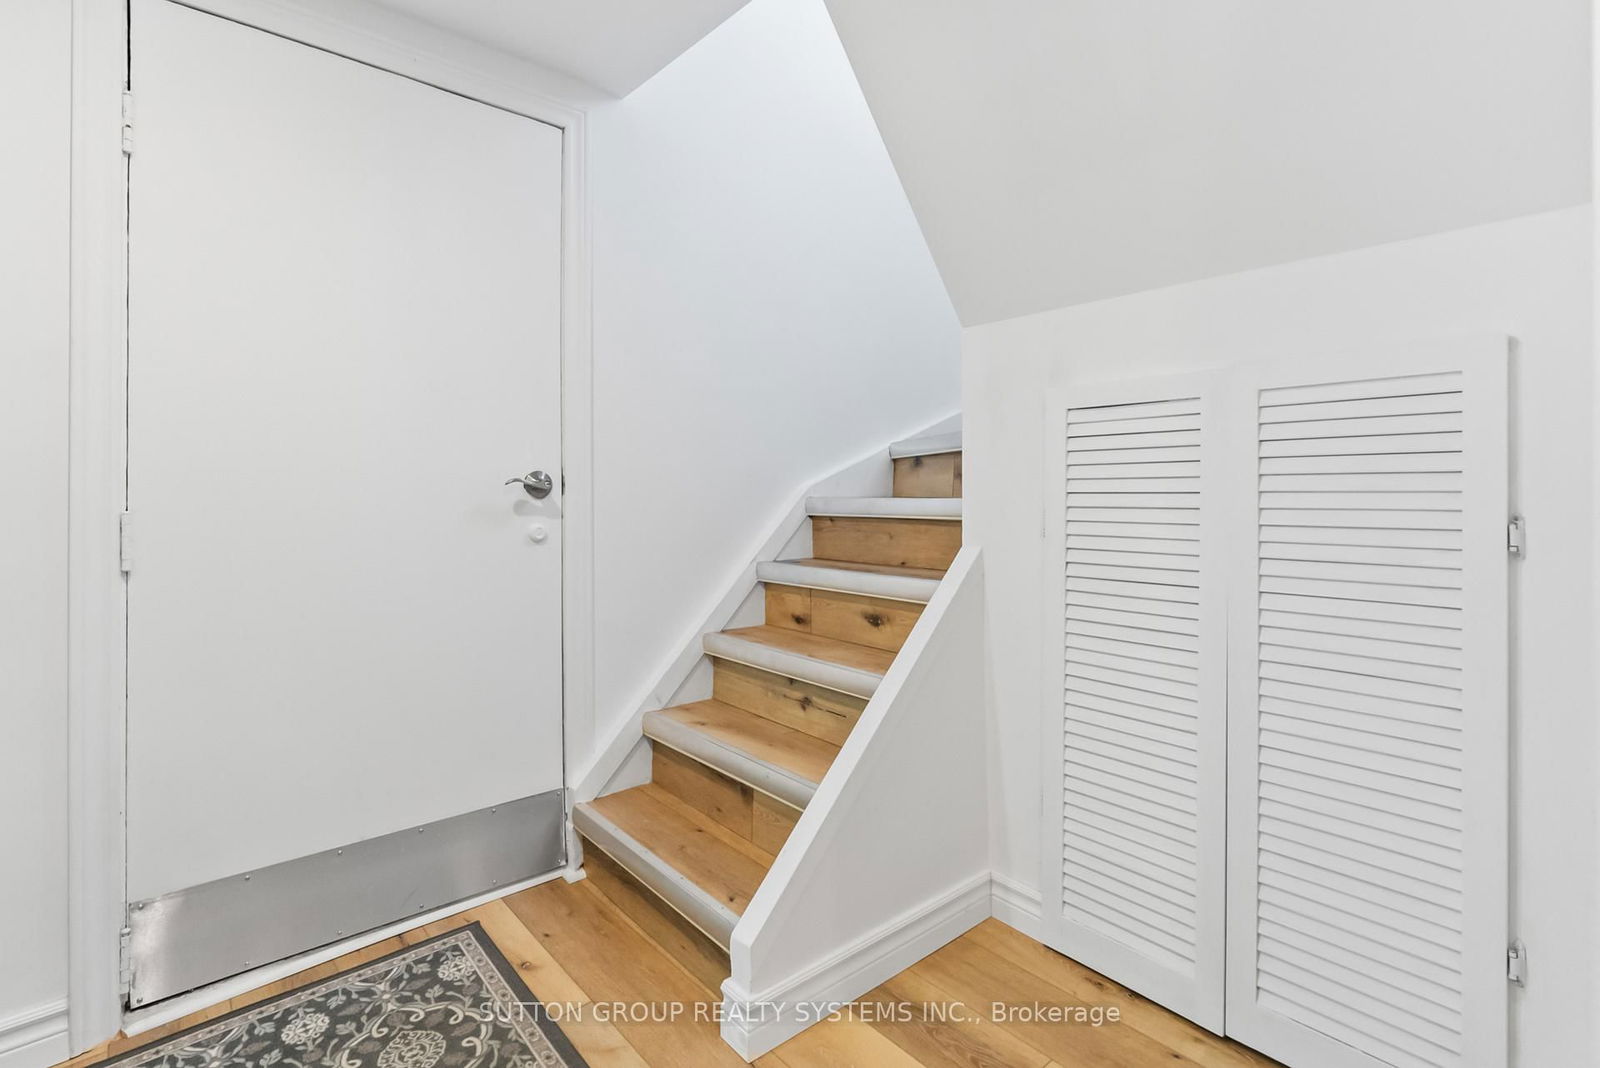
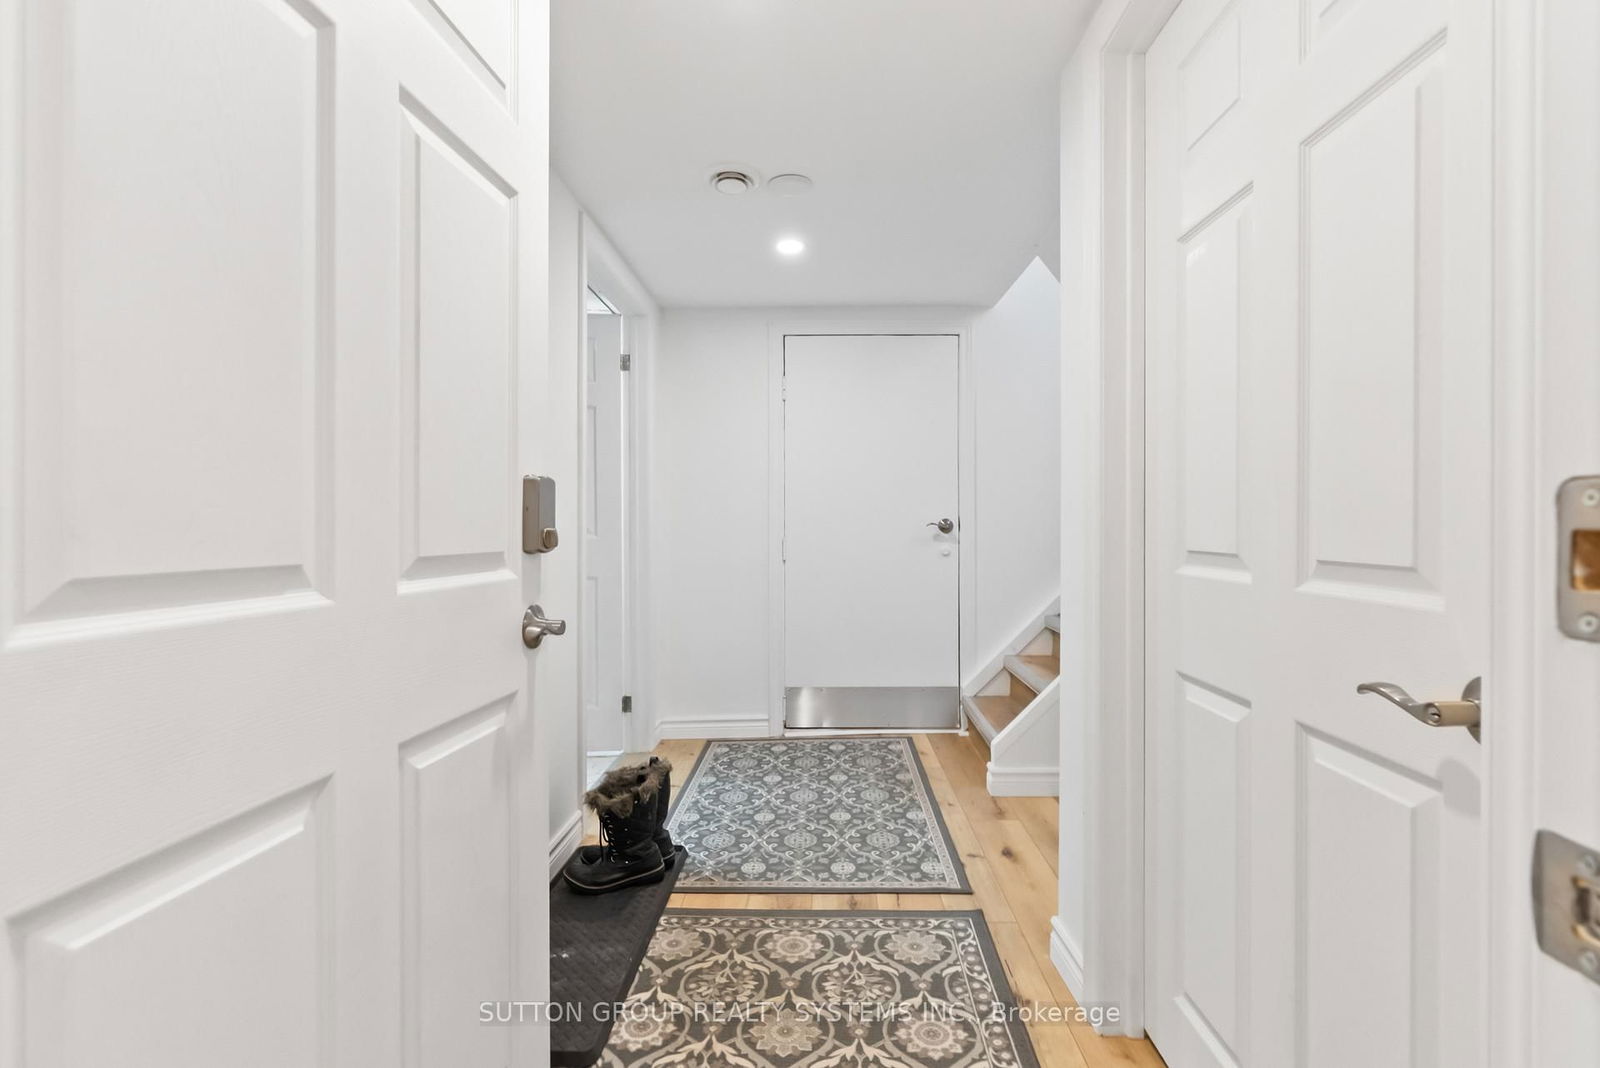
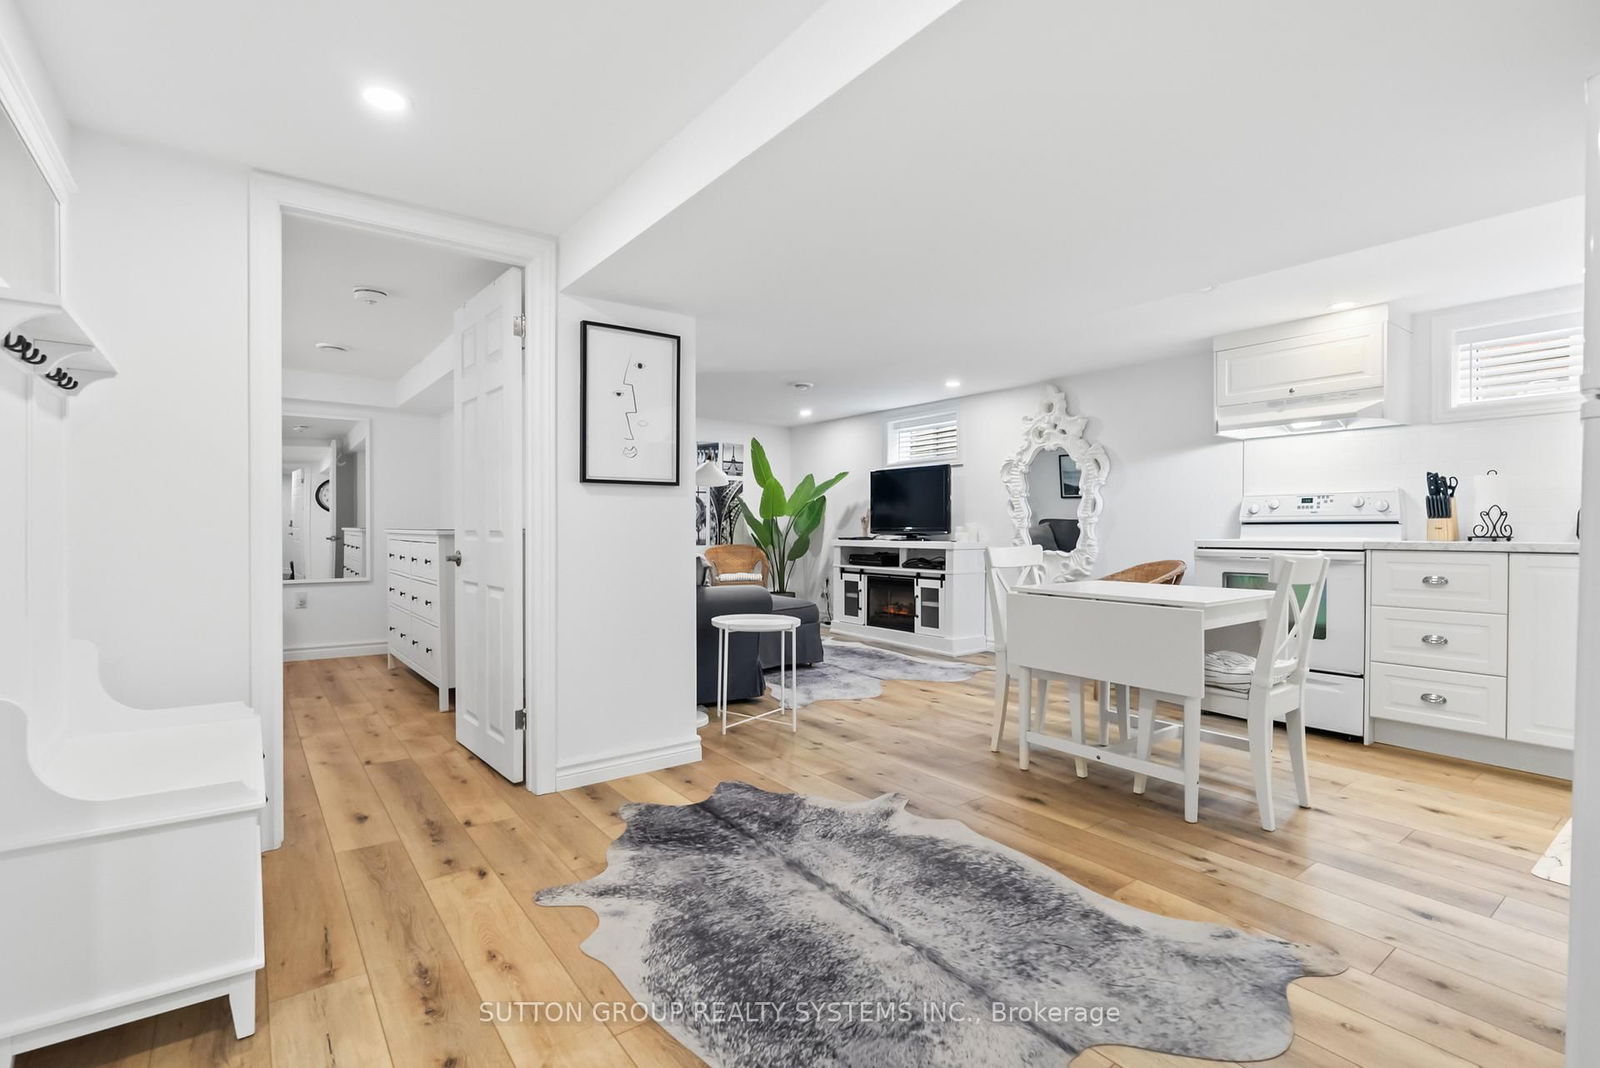
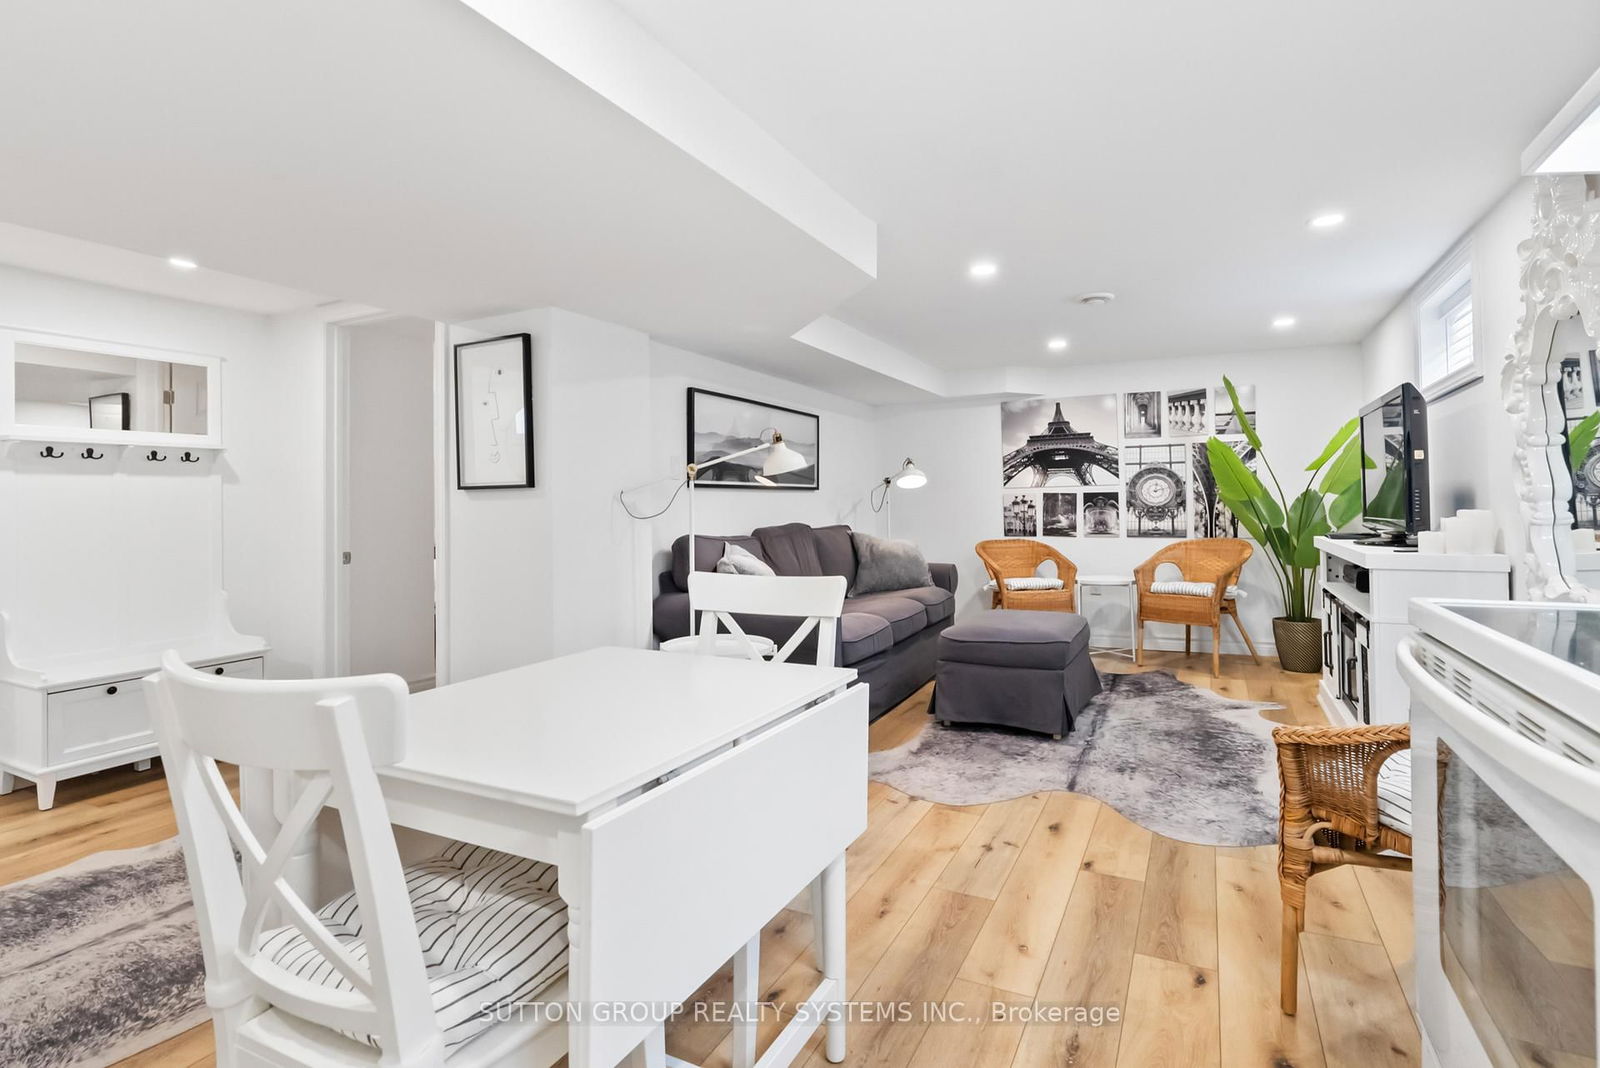
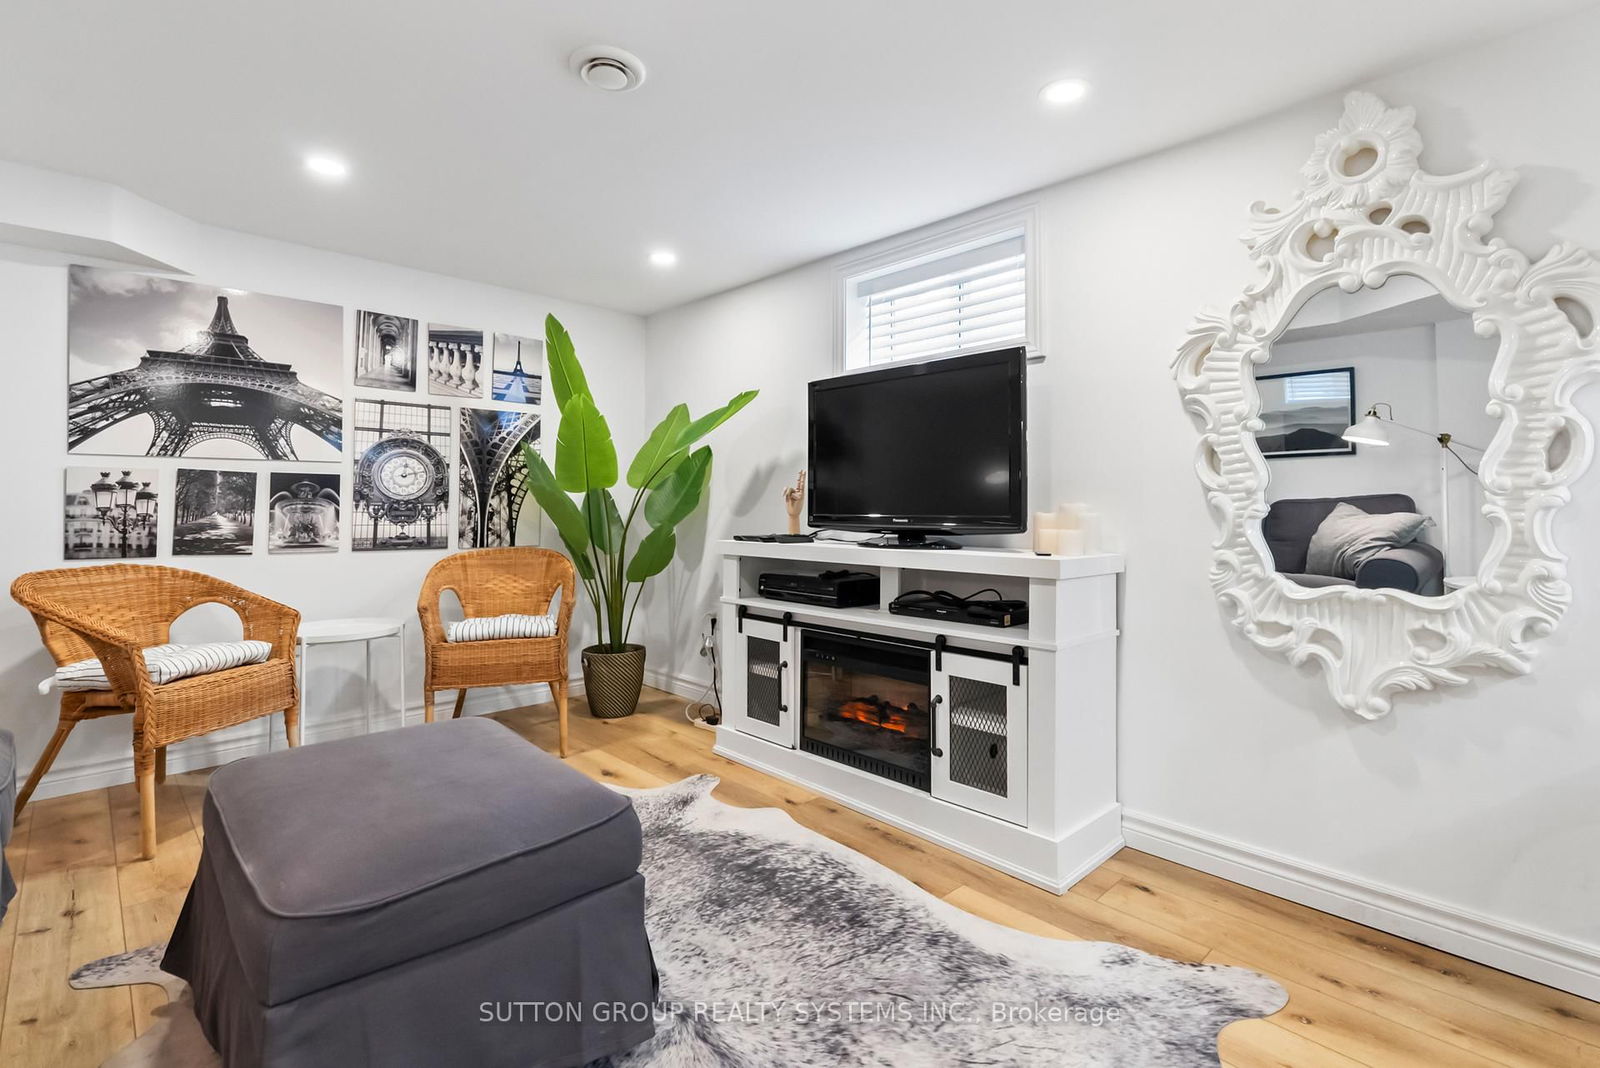
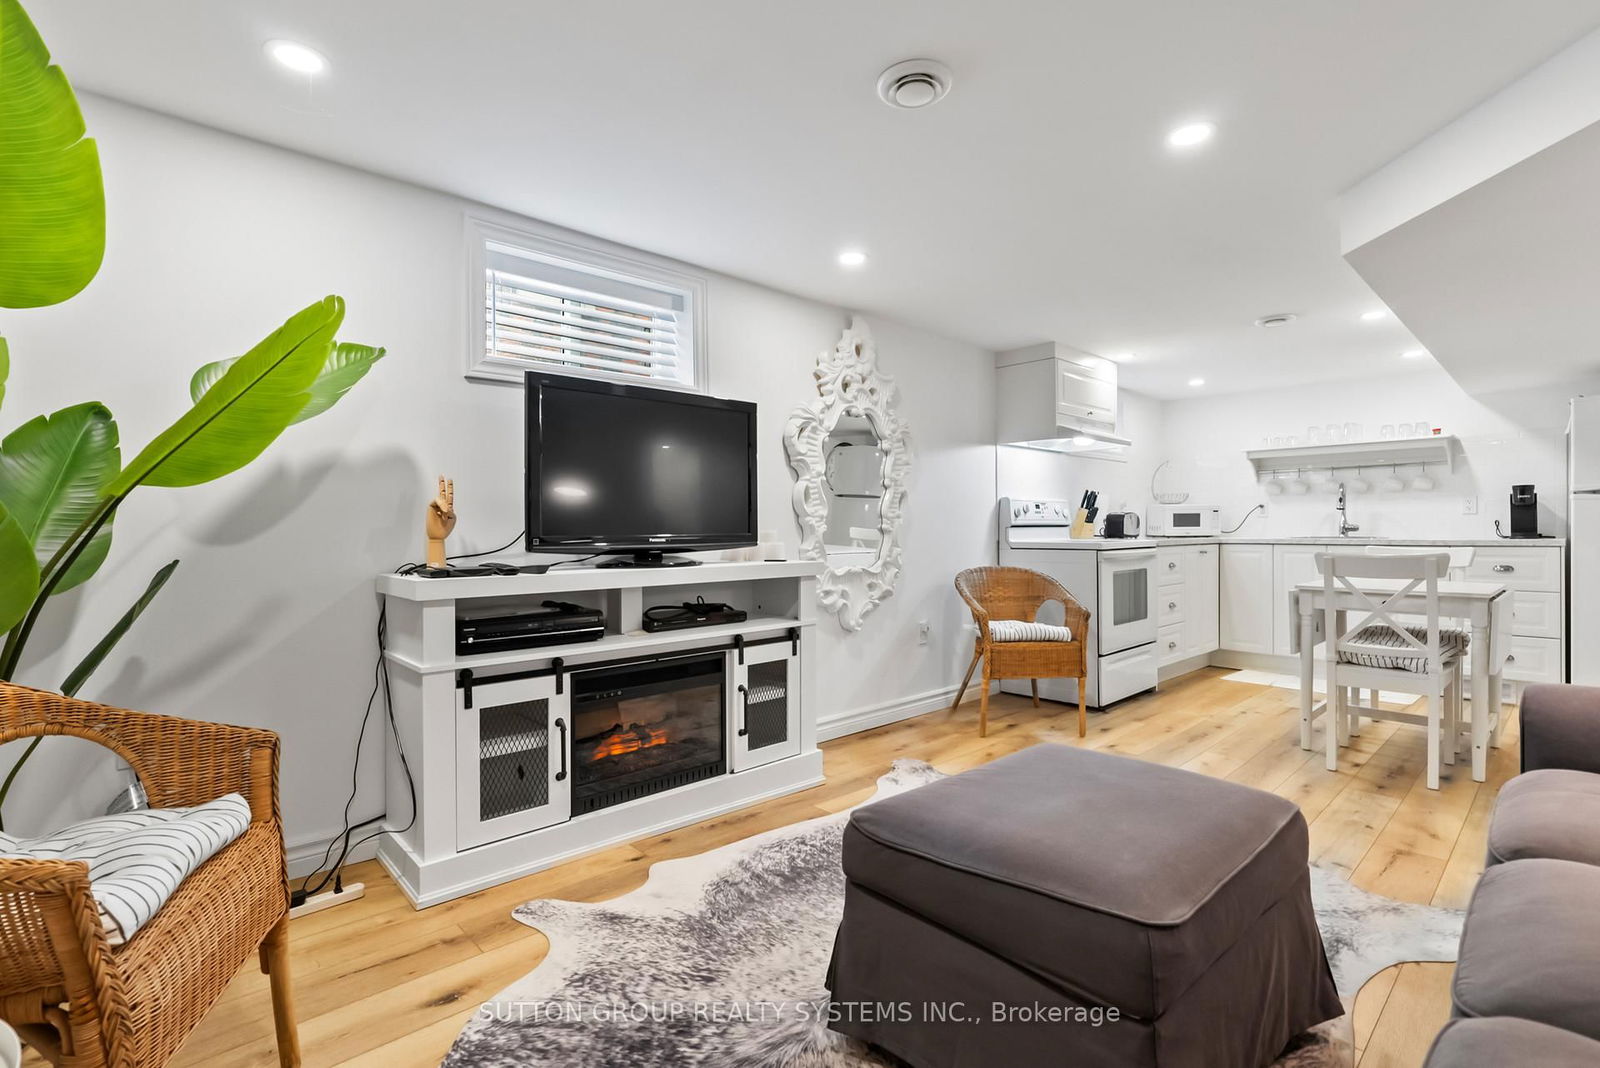
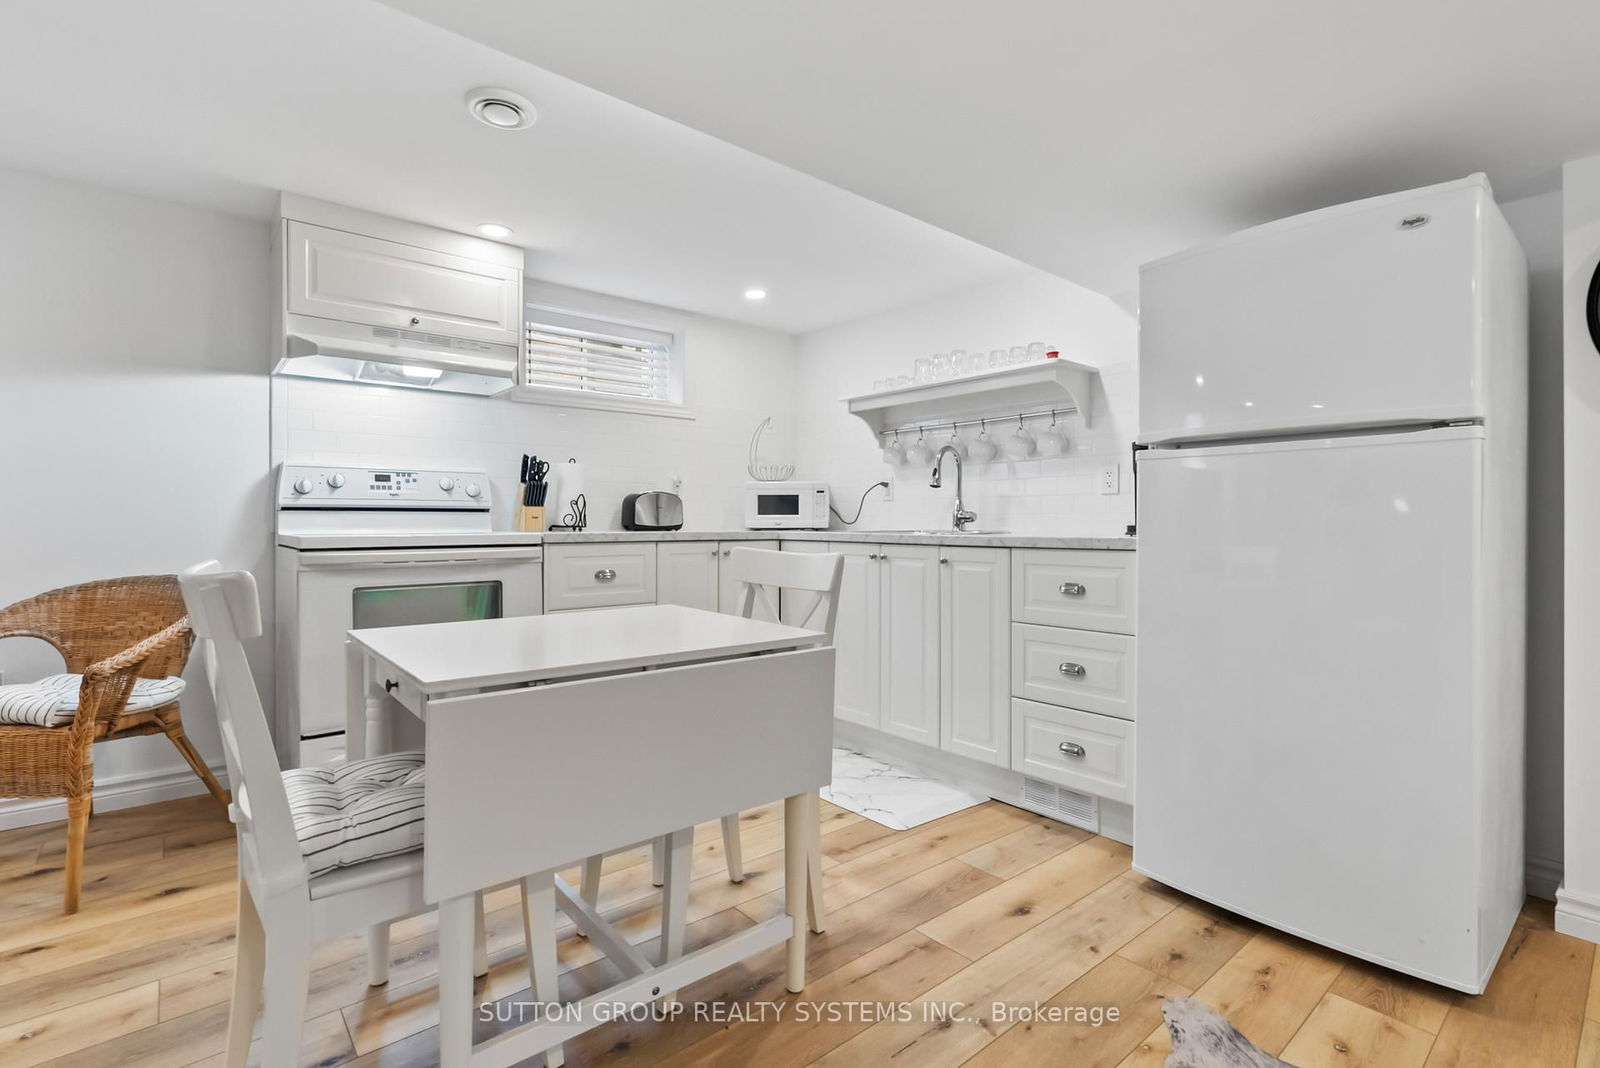
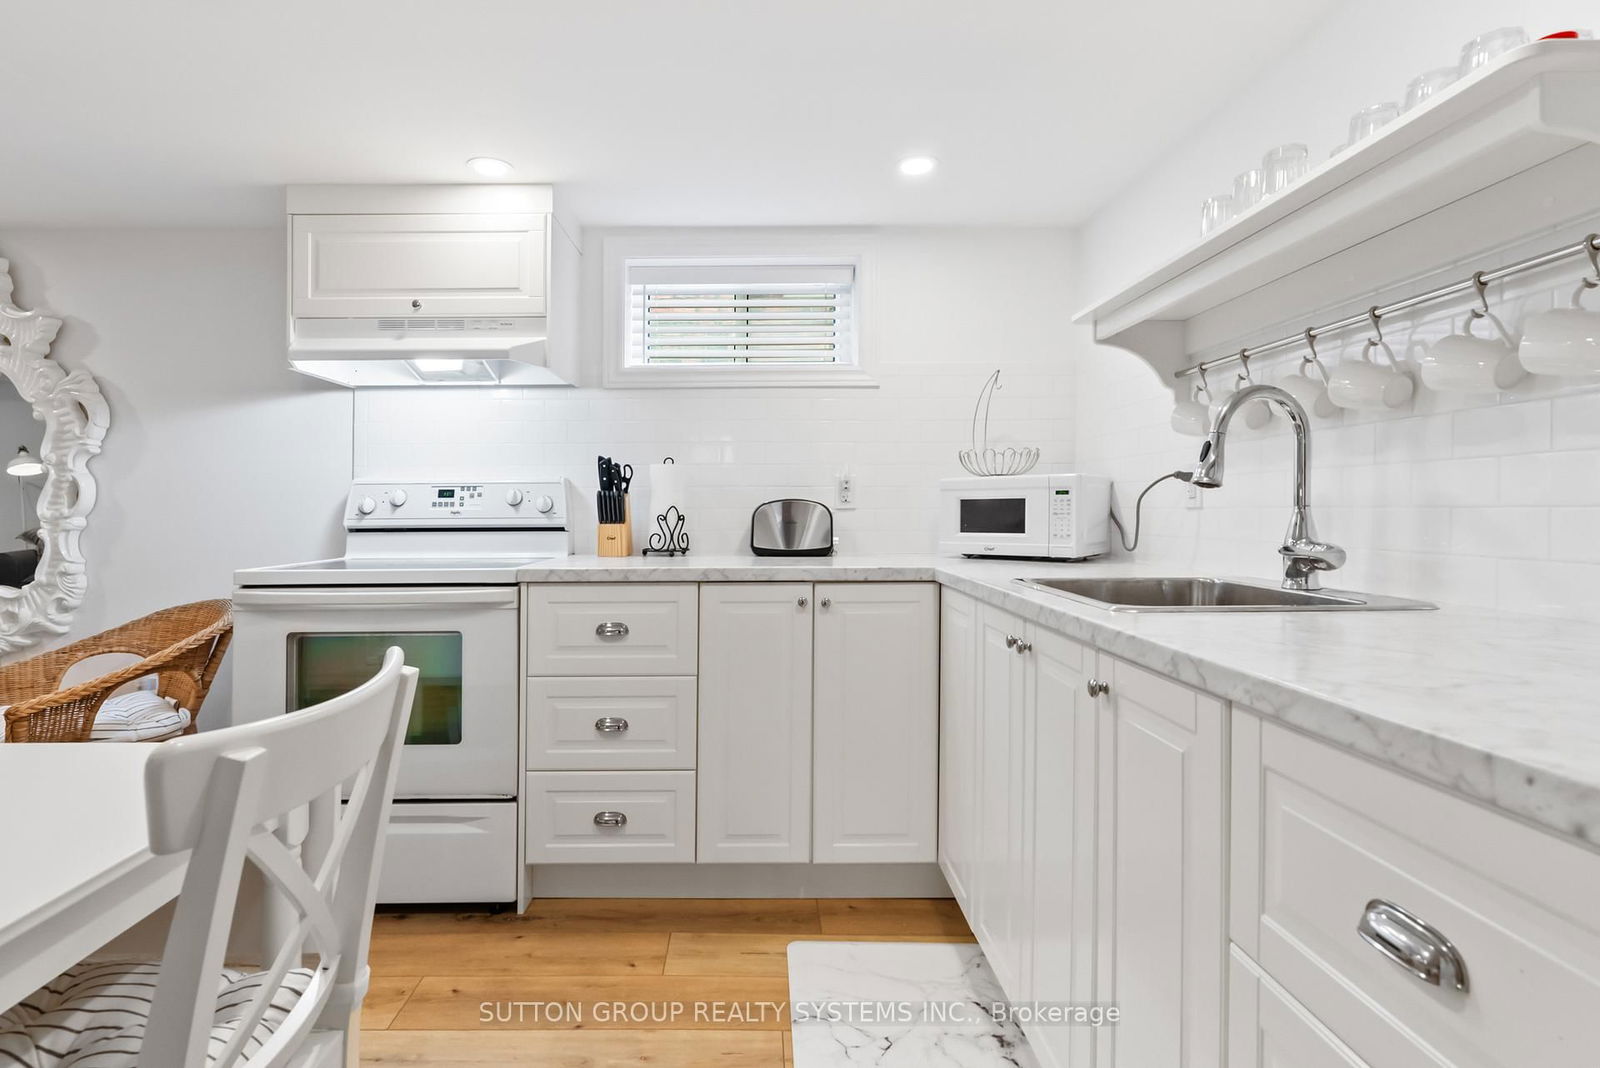
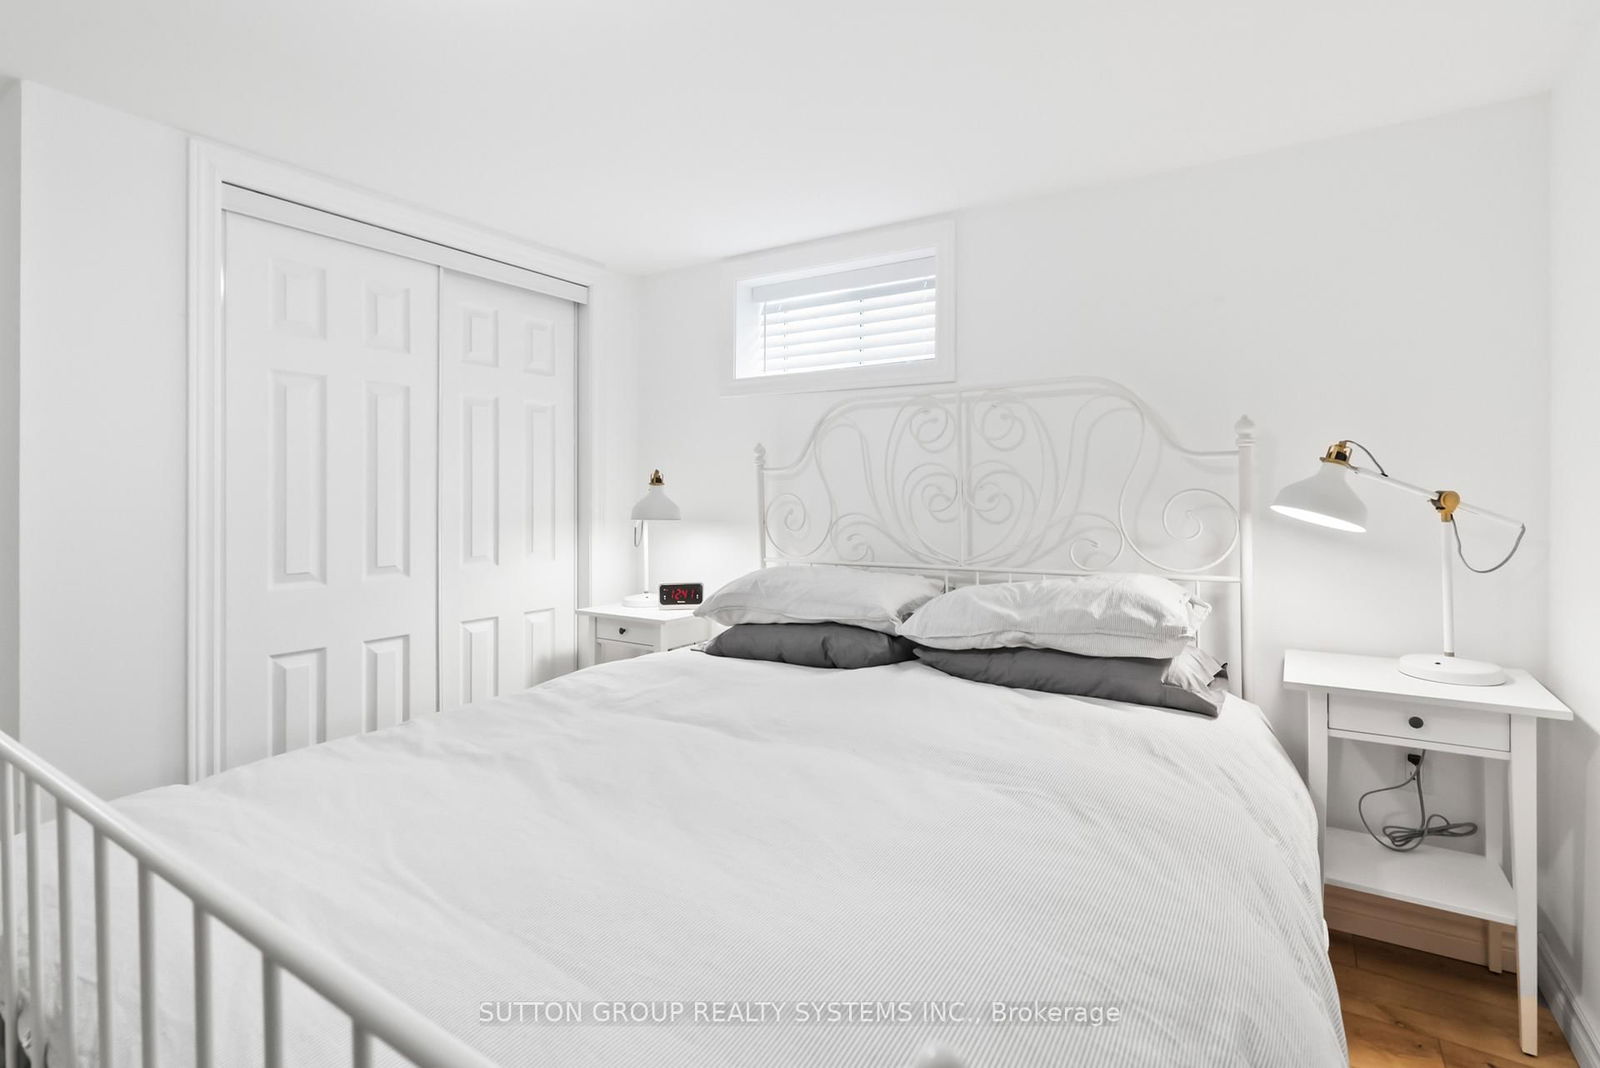
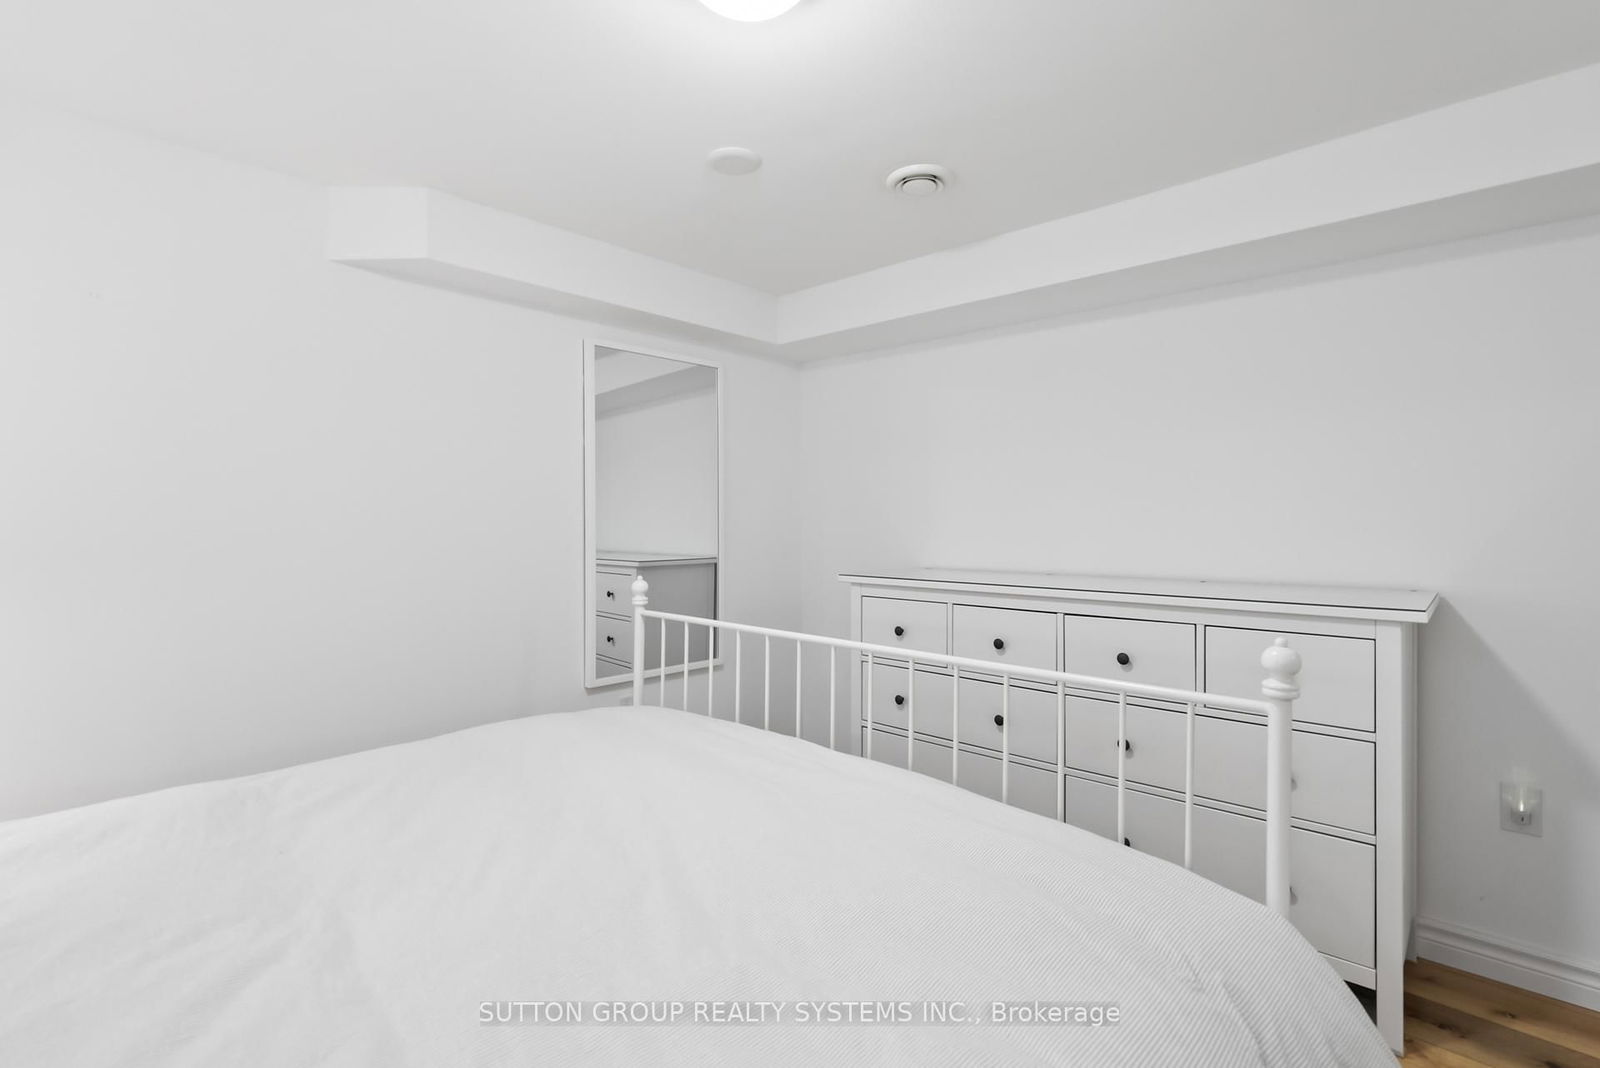
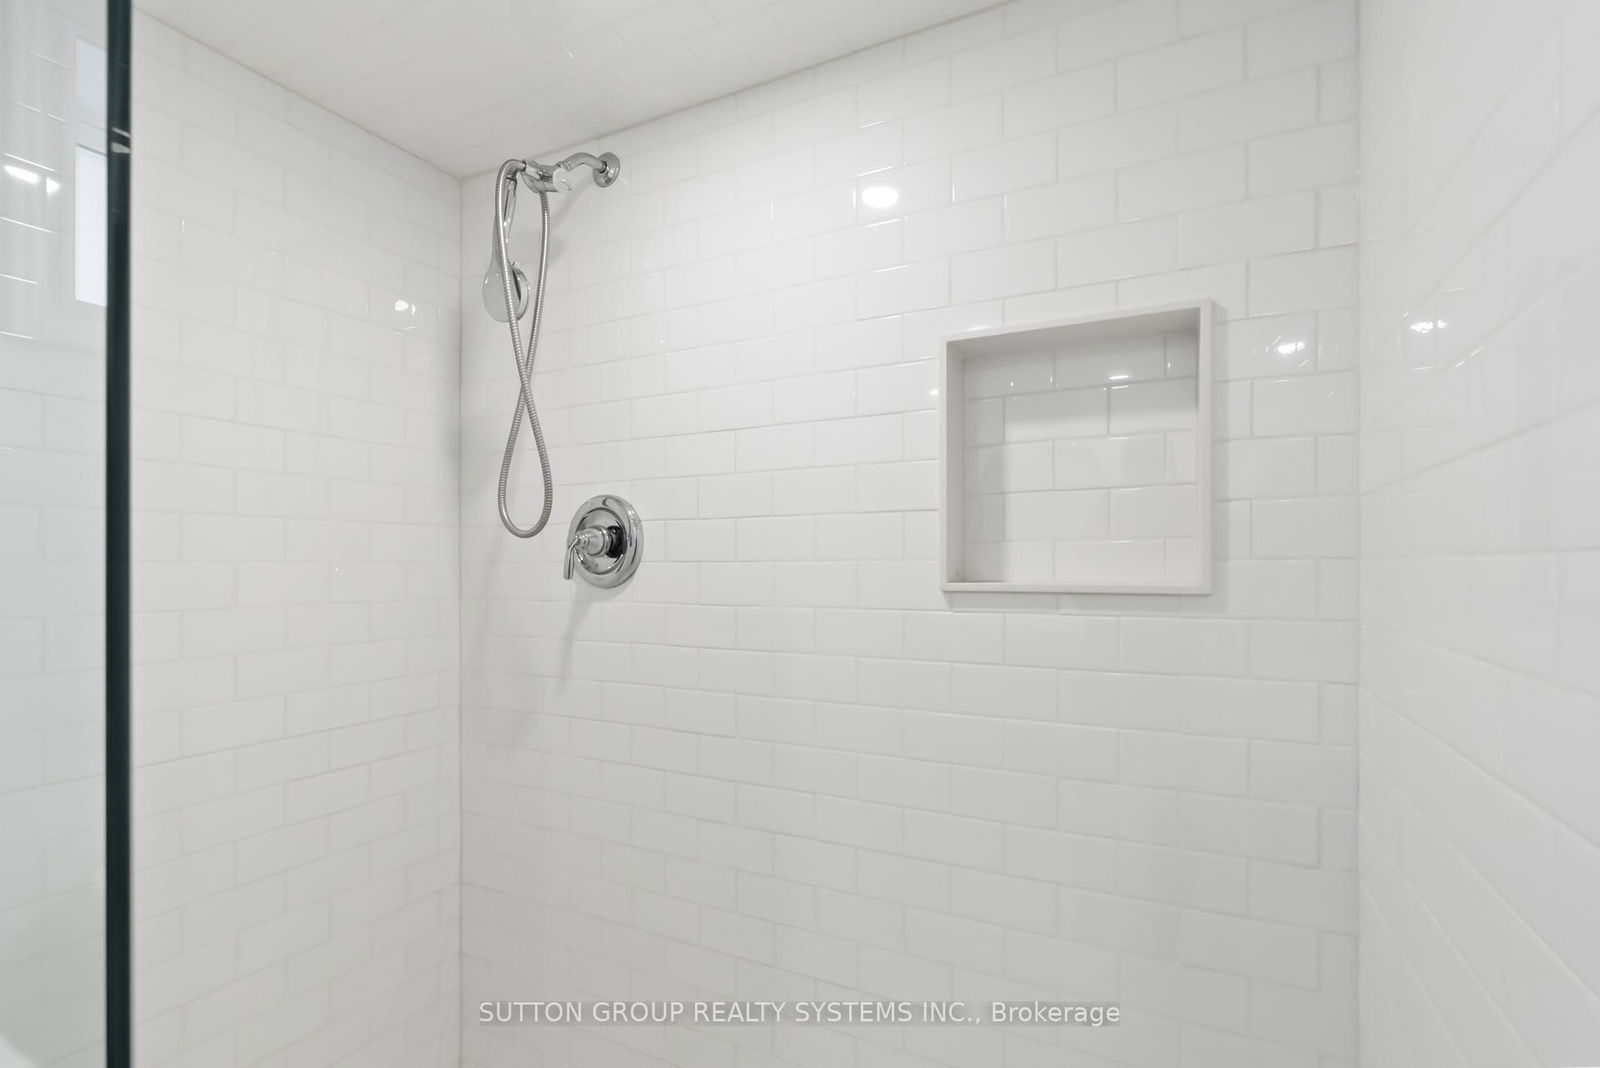
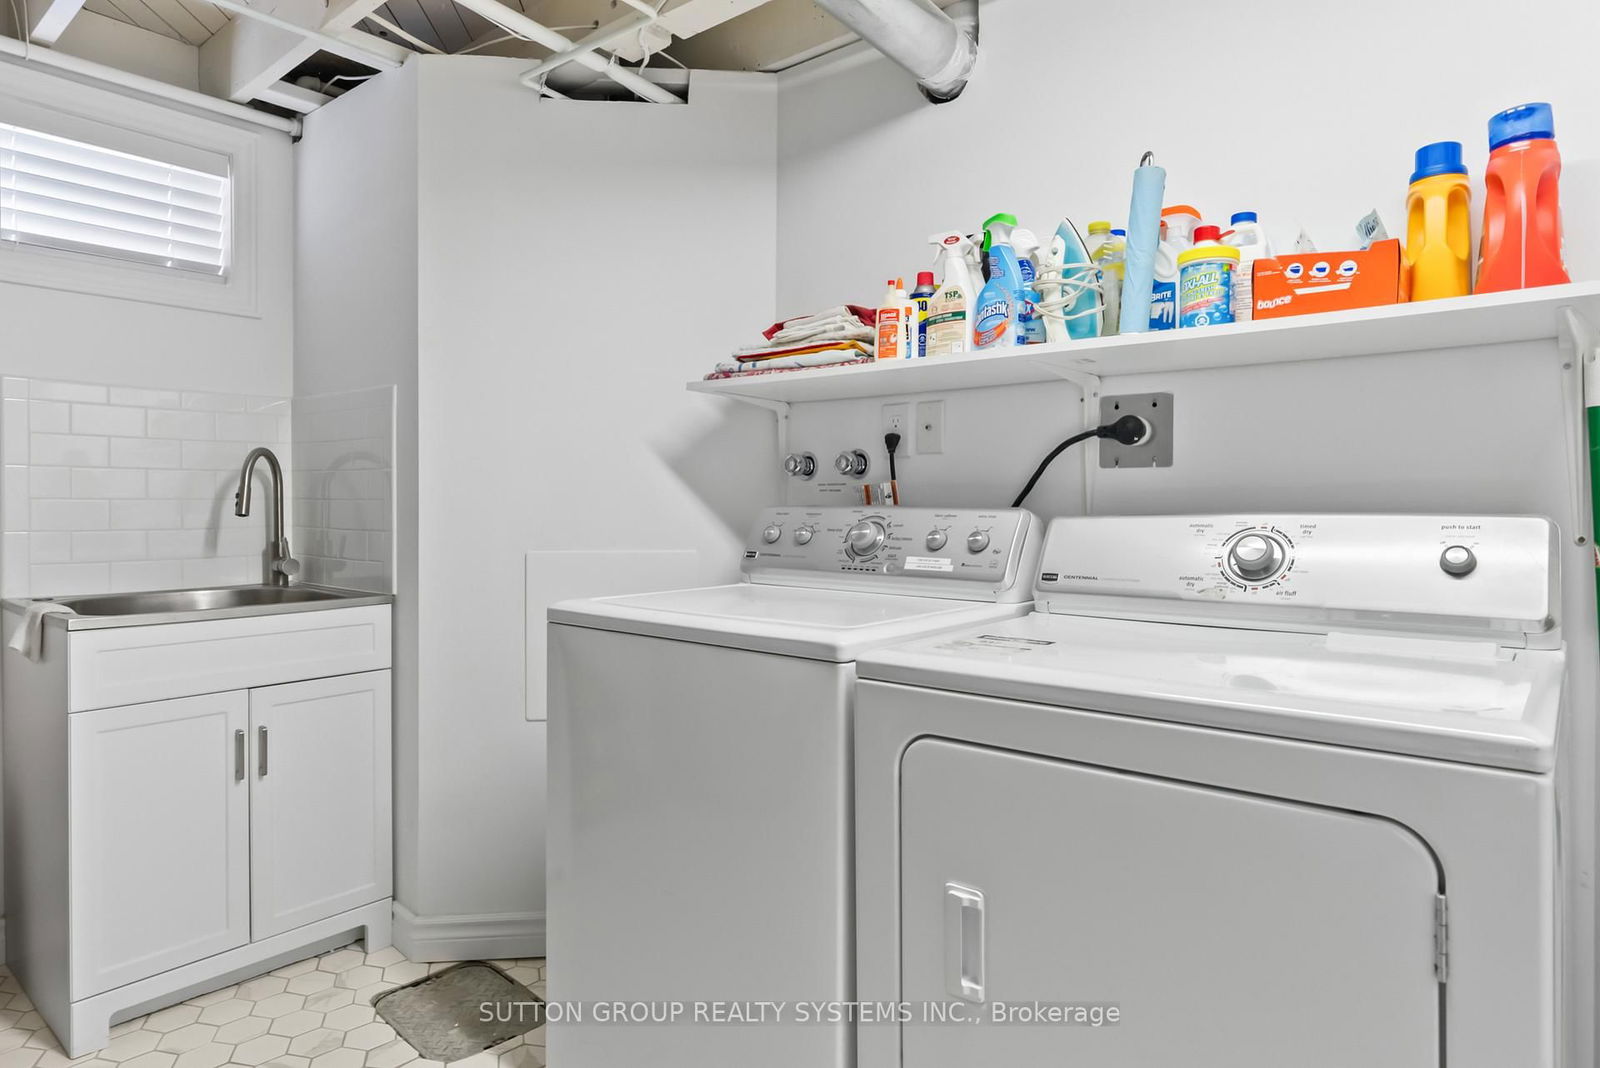
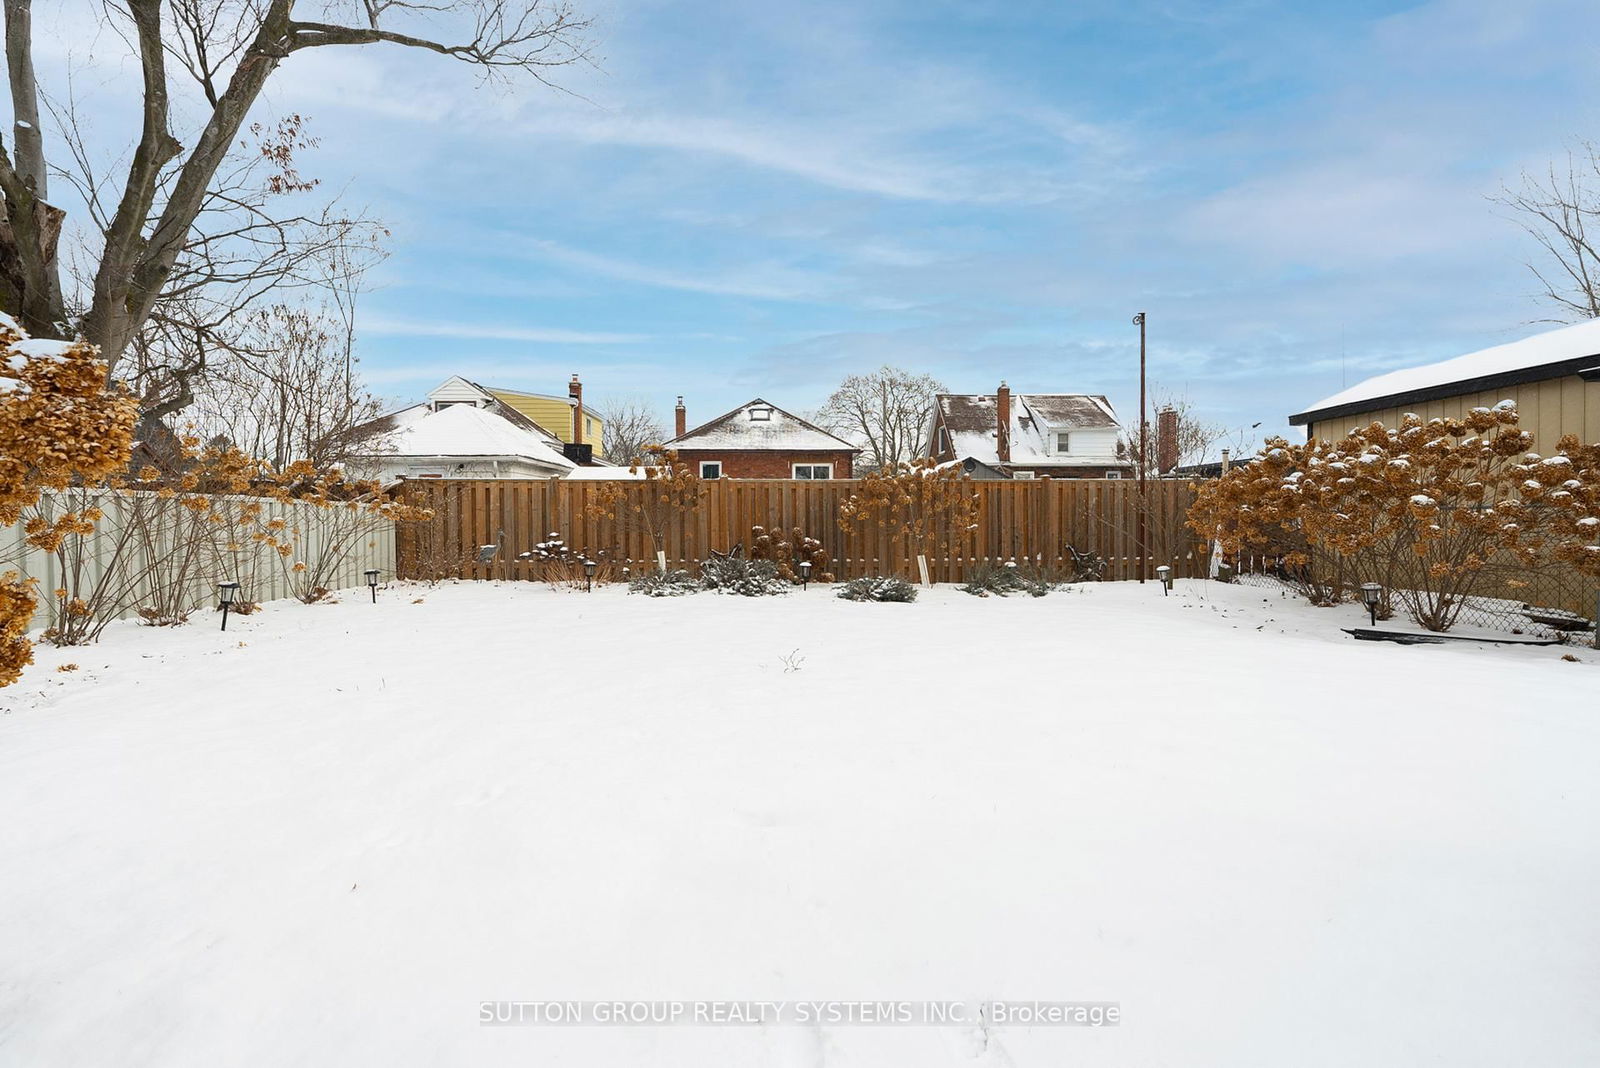
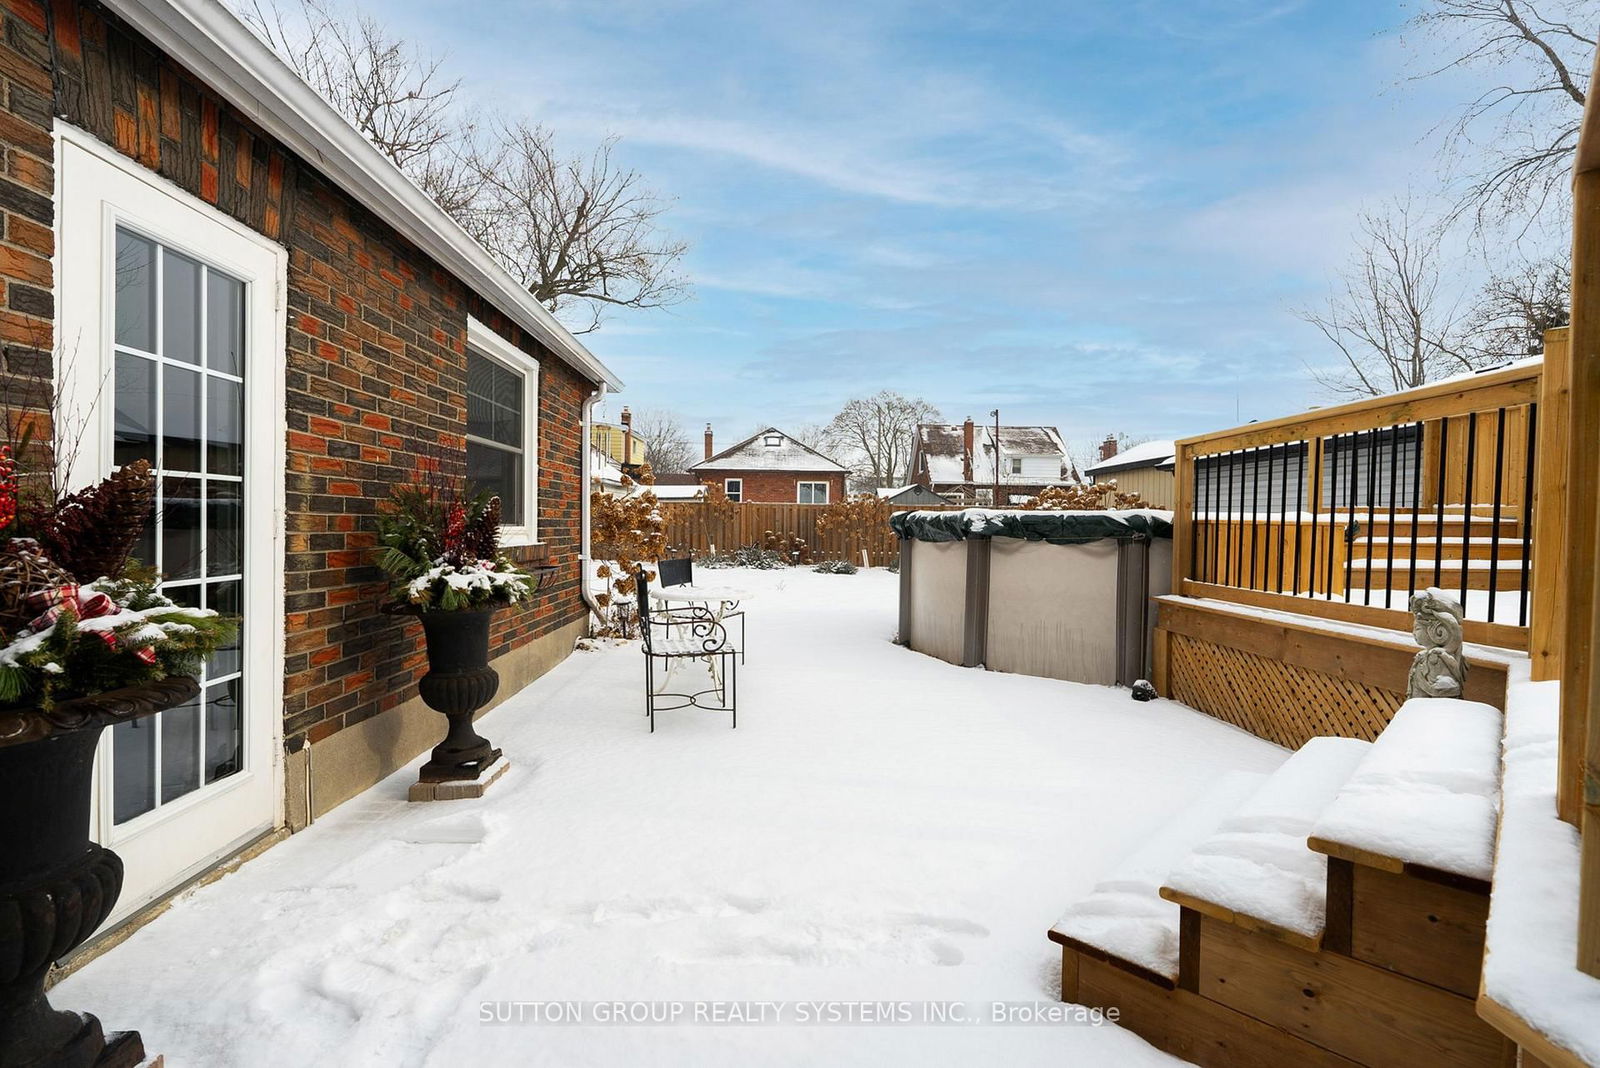
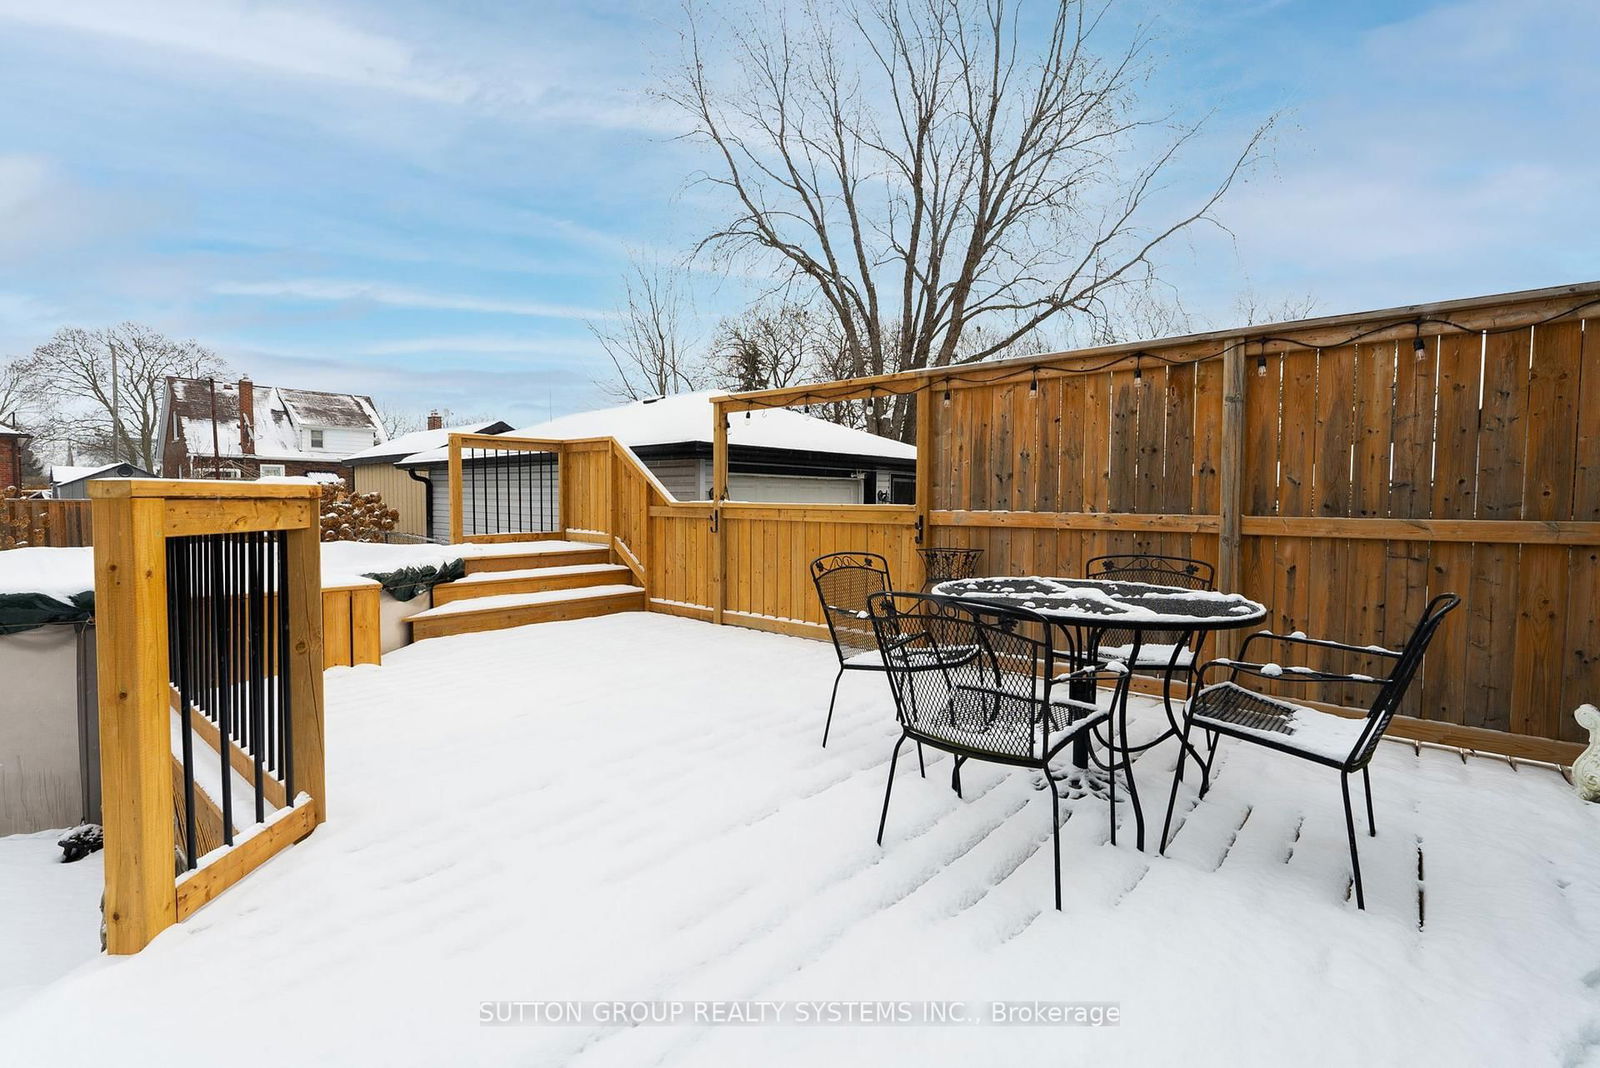
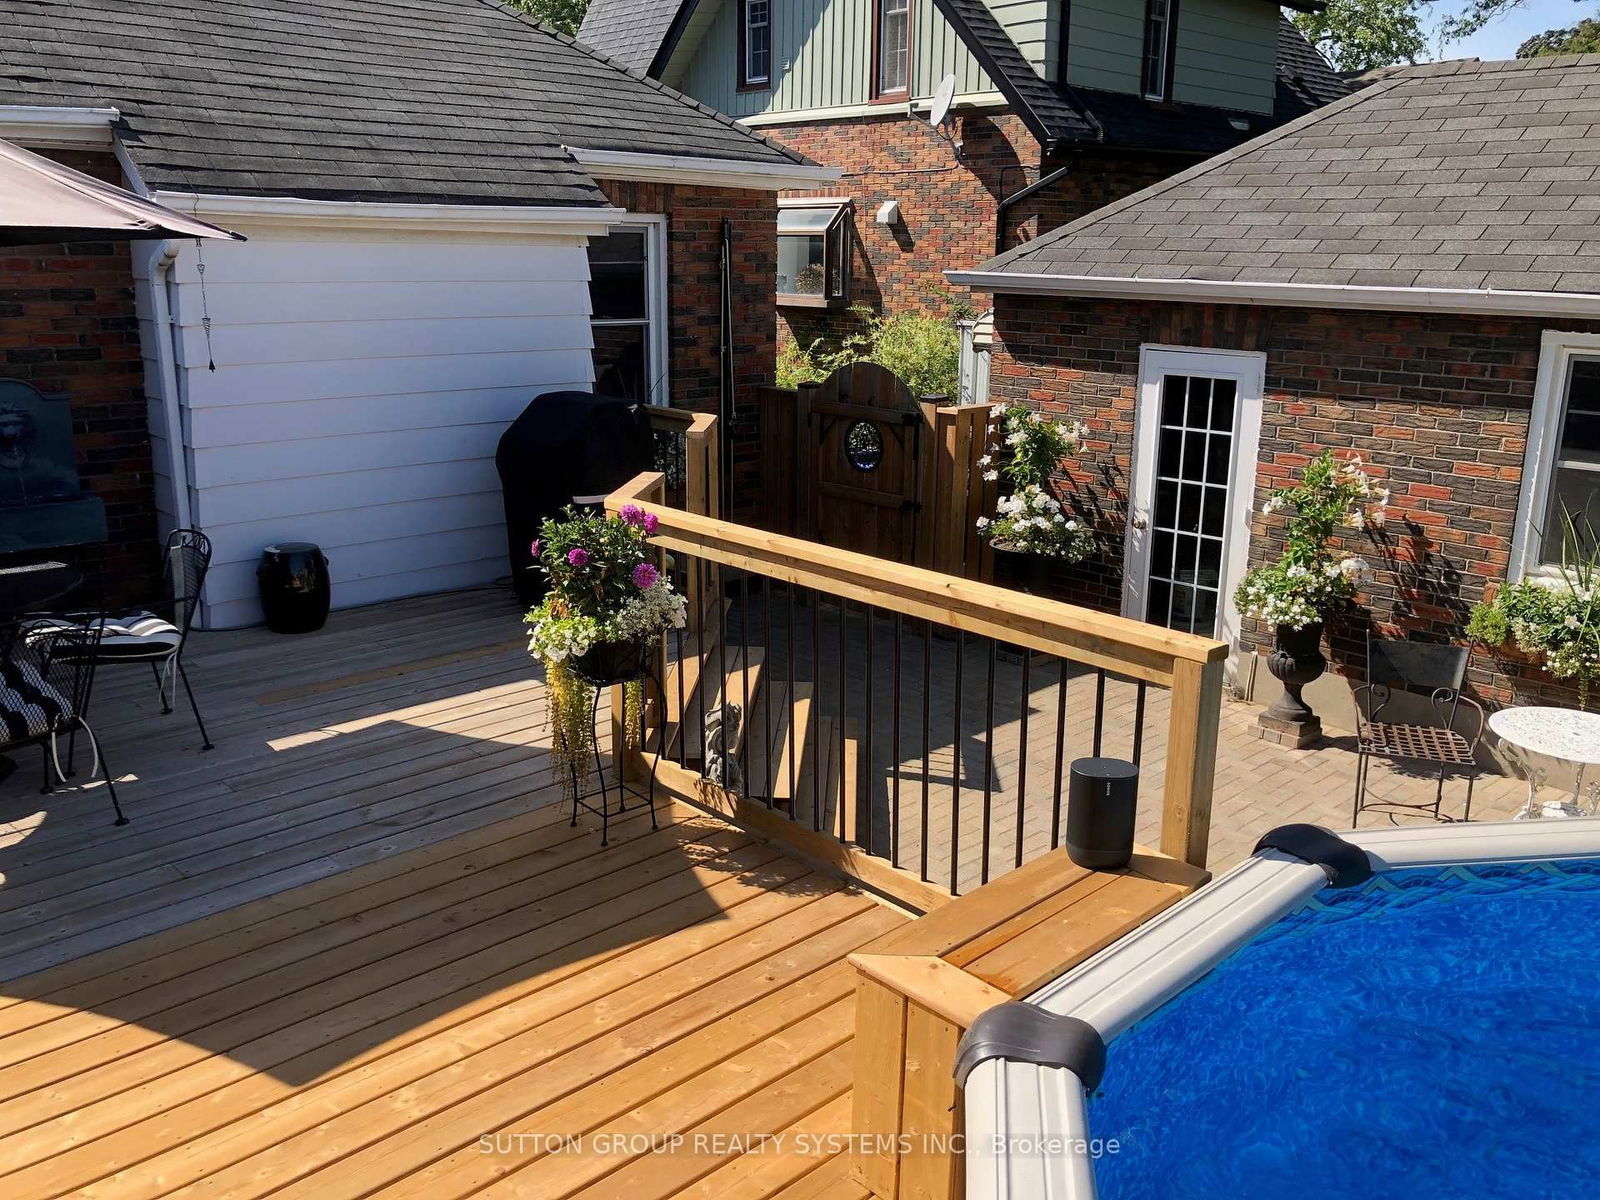
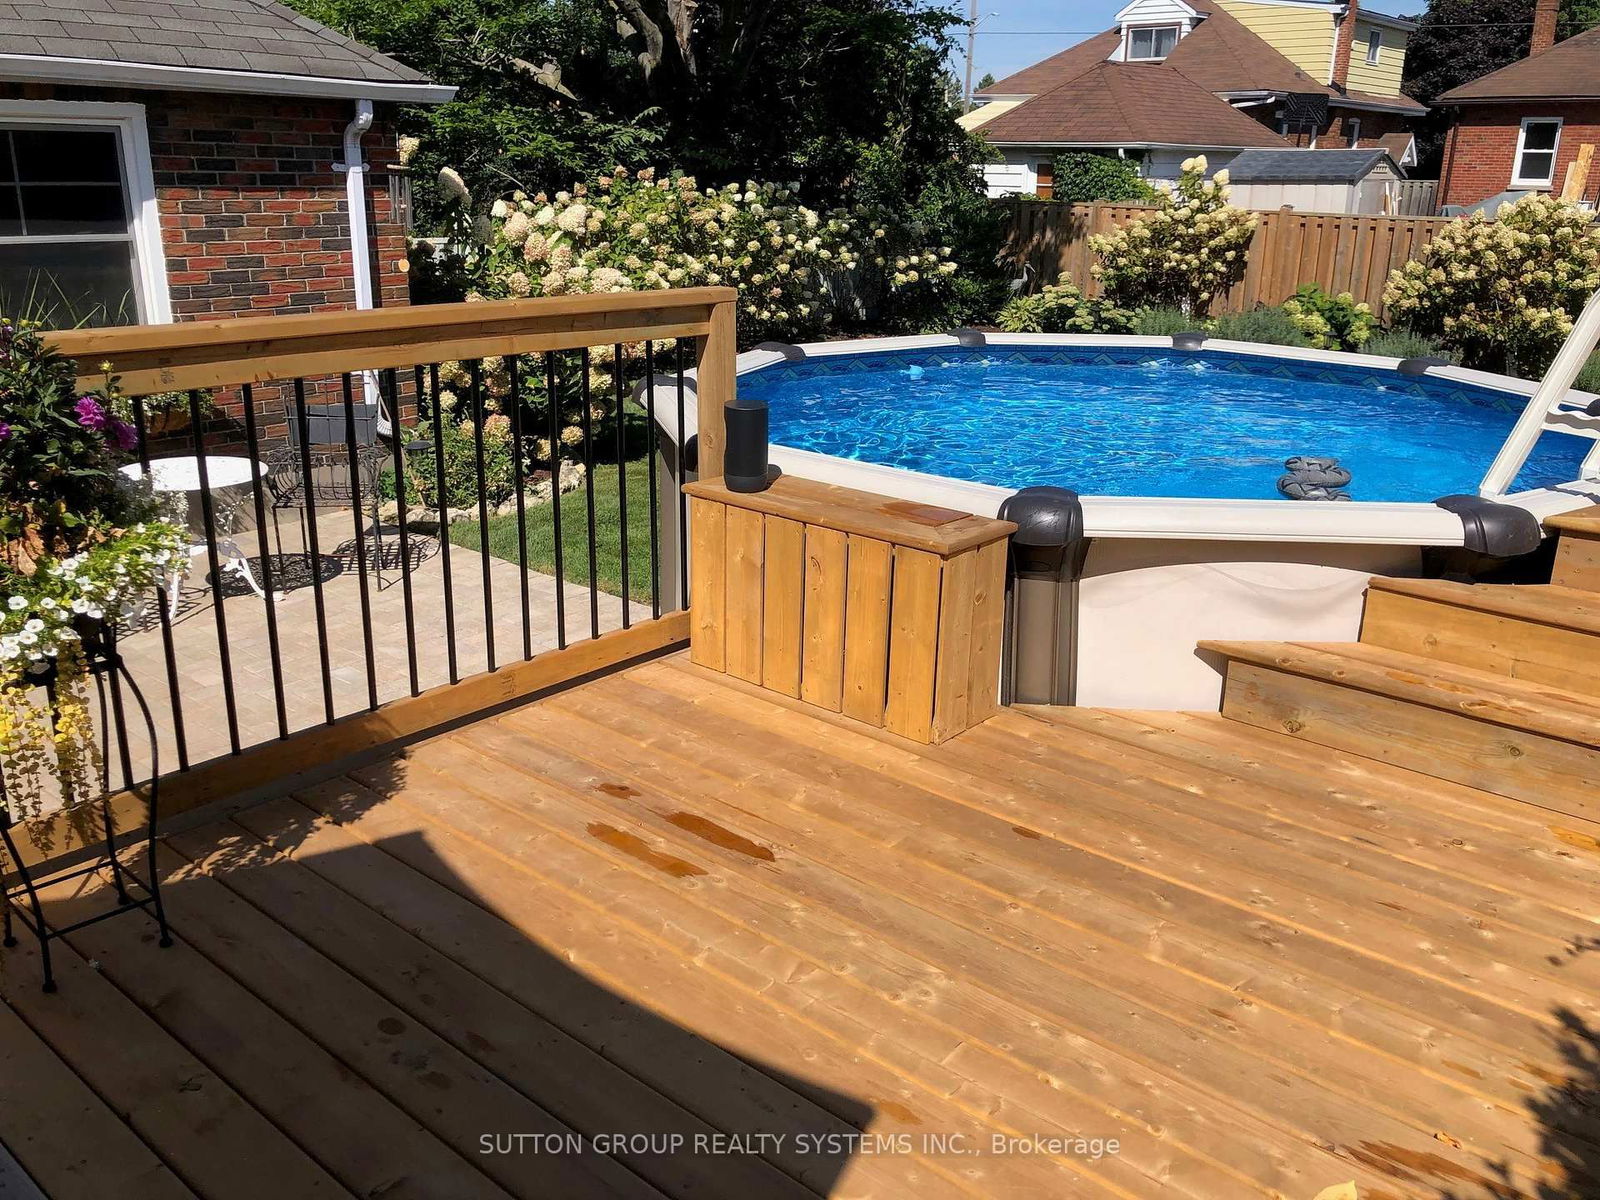
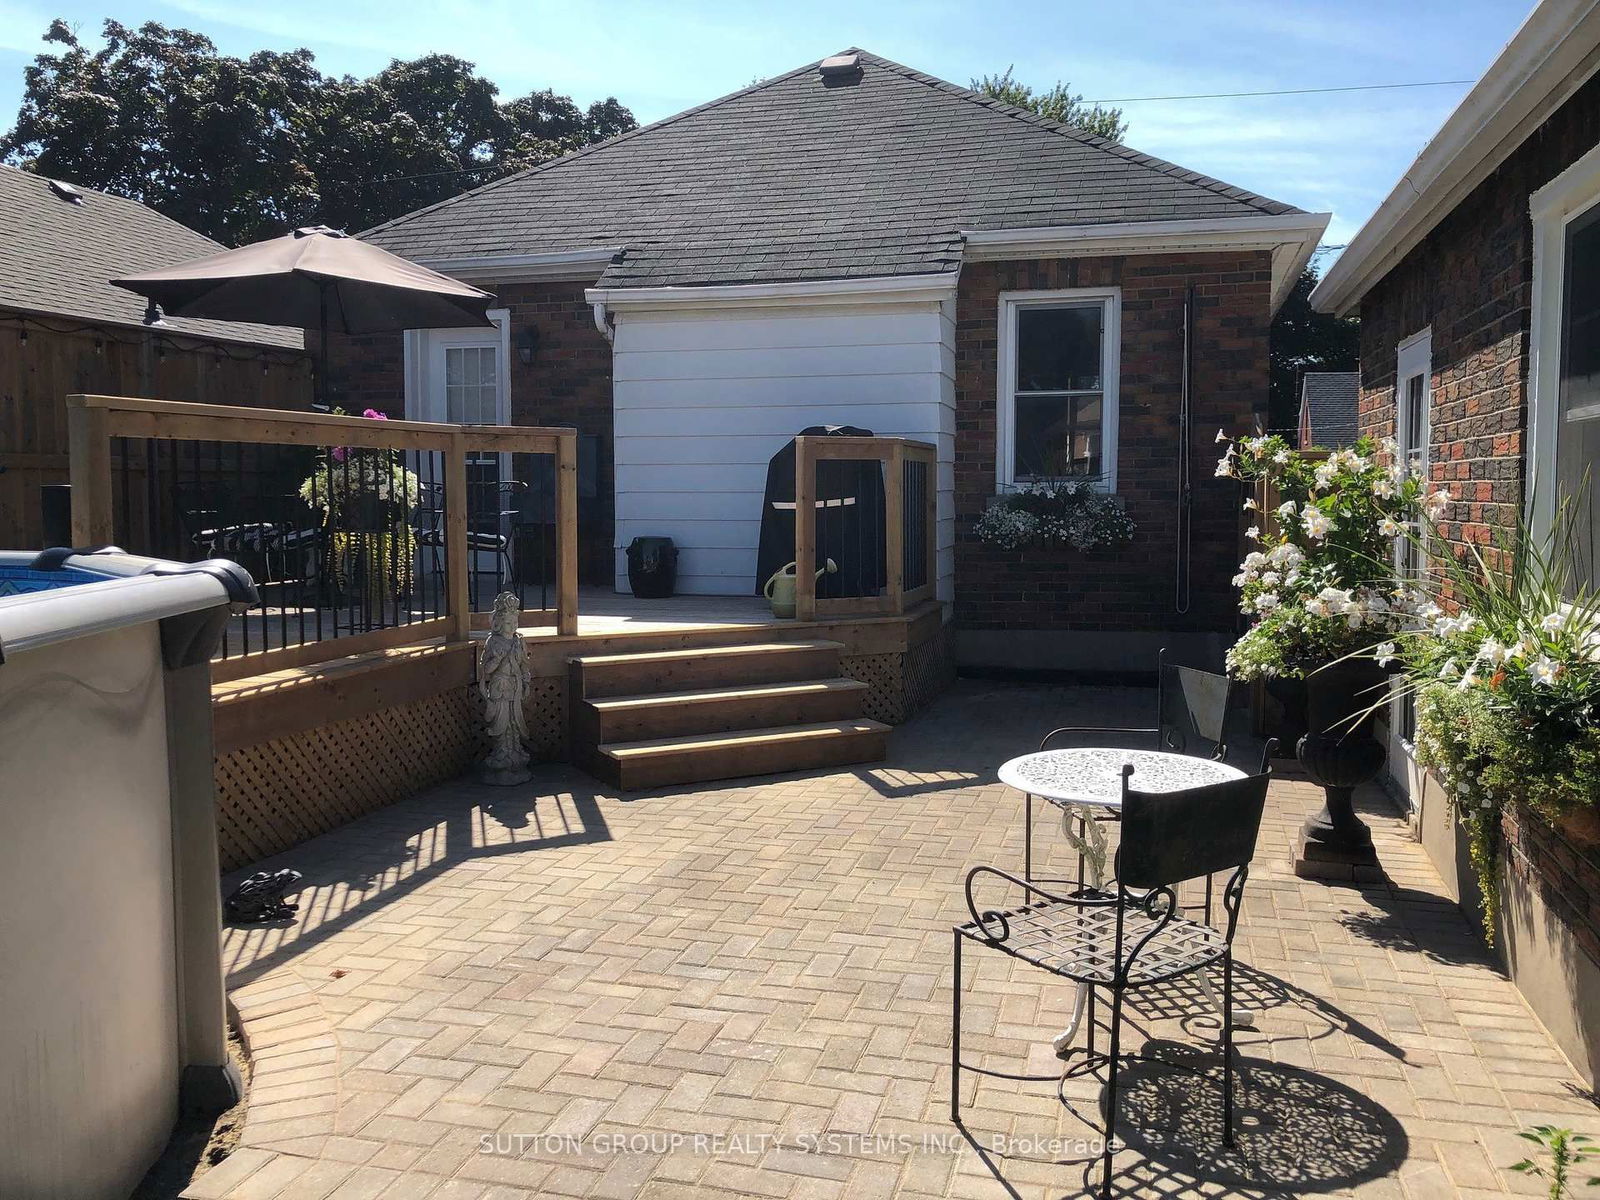
Stunning Bungalow Beautifully Renovated With All The Charm From Top To Bottom In A Highly Sought After Quiet And Mature Neighbourhood On A Tree Lined Street. This Original Stone And Brick Home Has So Many Features, No Expense Has Been Spared With Every Detail To The Finishes And The Historical Charm Of The Home. Please See Attached List Of Extensive Renovations And Upgrades. Enjoy The Custom Built Open Concept Kitchen With Stainless Steel Appliances And A Breakfast Bar Combined With A Sun-filled Livingroom/Diningroom With Original Lead Glass Windows, A Wood Burning Fireplace, Custom Bookcases Built In and Custom Architectural Archways Thru Into The Main Floor Bathroom. The Prime Bedroom Has A Walkout To Your Summer Oasis. Step Out Onto Your Large Private Deck, Interlock Patio, BBQ Gas Hook-Up And Swimming Pool. Cool Off On Those Hot Summers Days, A Great Place To Relax Or Entertain. The Backyard Is Fully Fenced And Landscaped For Minimum Maintenance. Basement In-Law Suite Has Separate Entrance With A Bright Open Concept Kitchen/Livingroom, Separate Bedroom And A Bathroom with A Custom Tiled Walk-in Shower. Laundry Room Has A Tiled Floor. There's Also A Utility Room/Storage And A Cold Storage Room. High Grade Vinyl Plank Flooring Completely Throughout The Home For Easy Maintenance. Double Brick Garage Has Separate Pony Amp And Garage Door Opener, Could Make A Great Workshop/Studio. Ready To Move In & Enjoy, The Work Has Been Done!
All Elfs, window coverings, 2 stoves, 2 fridges, 2 stove fans, washer/dryer, 2 bathroom mirrors, medicine cabinet main bath, fireplace screen & tools, pool pump/filter/ladder/accessories
Living
Dining
Kitchen
Primary
2nd Br
Bathroom
Living
Kitchen
3rd Br
Bathroom
Laundry
Utility
Cold/Cant
The graph below compares the average list price and average sale price of homes in this neighborhood by month for the last 24 months. When average sale price is greater than average list price, this may suggest a buyer's market. When average sale price is lower than the average list price this may suggest a seller's market.
The graph below illustrates the average days on market for homes in this neighborhood. The yellow area may indicate a buyer's market, the green area may indicate a balanced market and the red area may indicate a seller's market.
Sales Representative, Century 21 People’s Choice Realty Inc., Brokerage
(647) 576 - 2100