Century 21 People’s Choice Realty Inc., Brokerage
120 MATHESON BLVD E #103
MISSISSAUGA, Ontario
L4Z 1X1


Woodstock, North, N4T 0N9
$889,900
Listed by CMI REAL ESTATE INC.
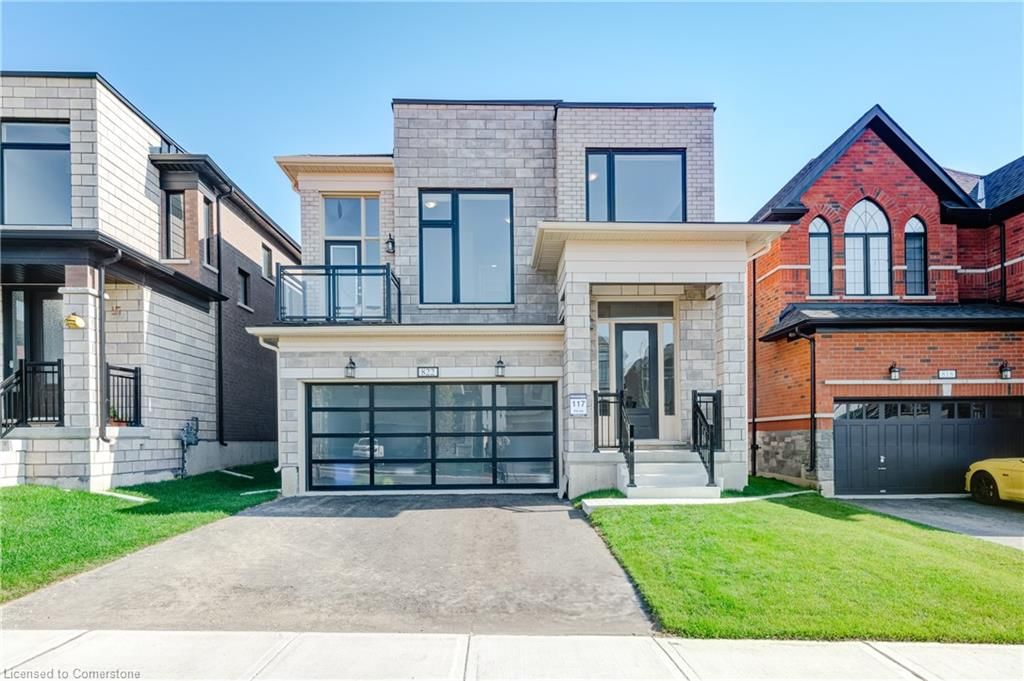
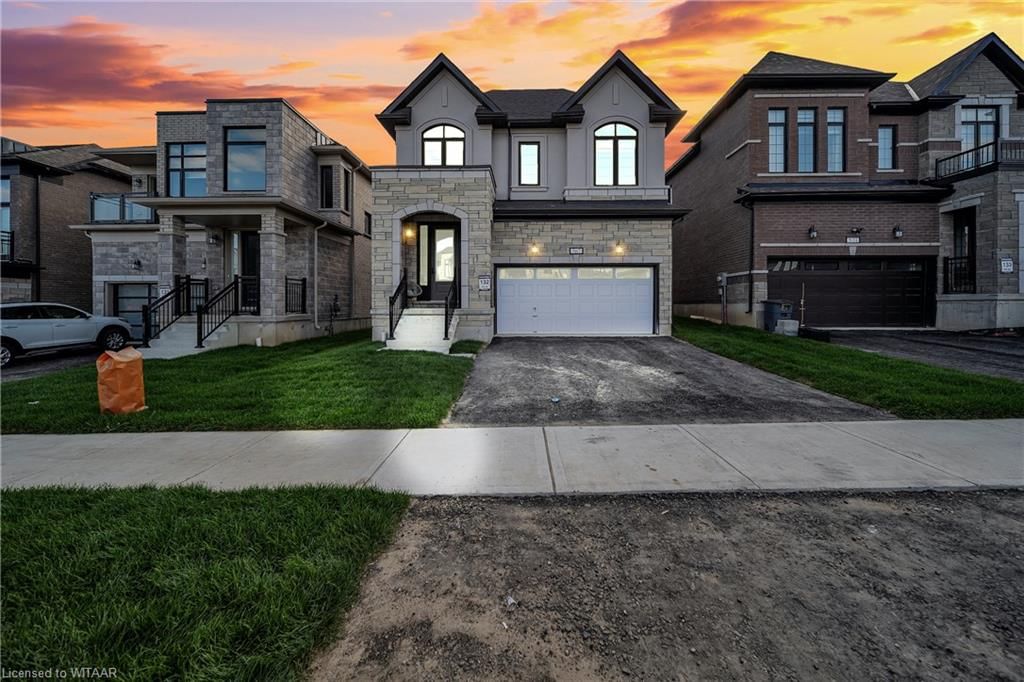
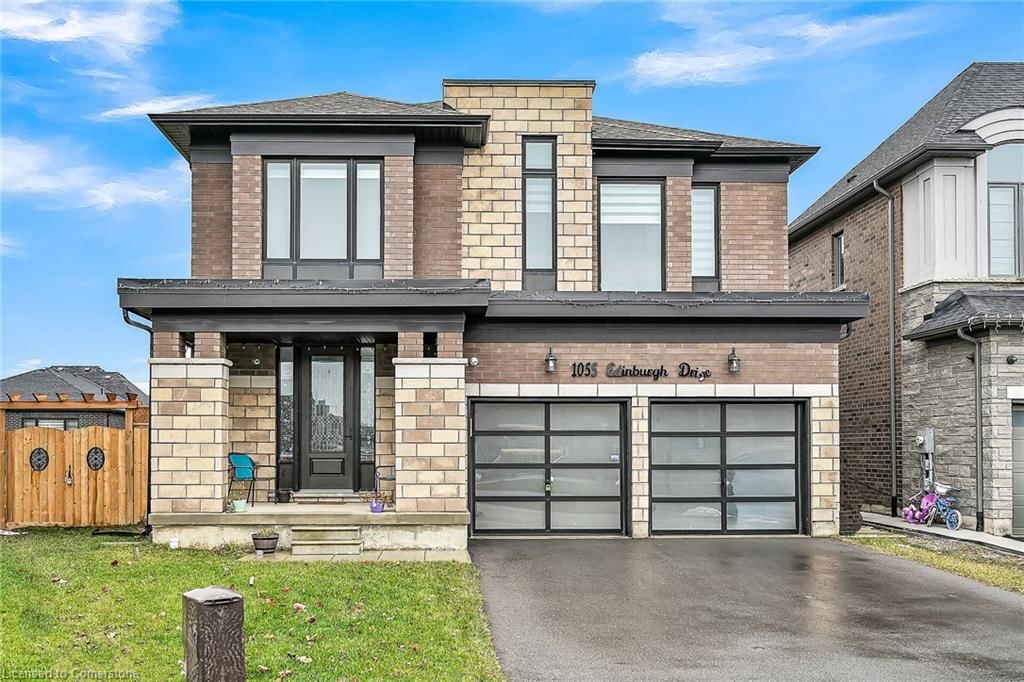
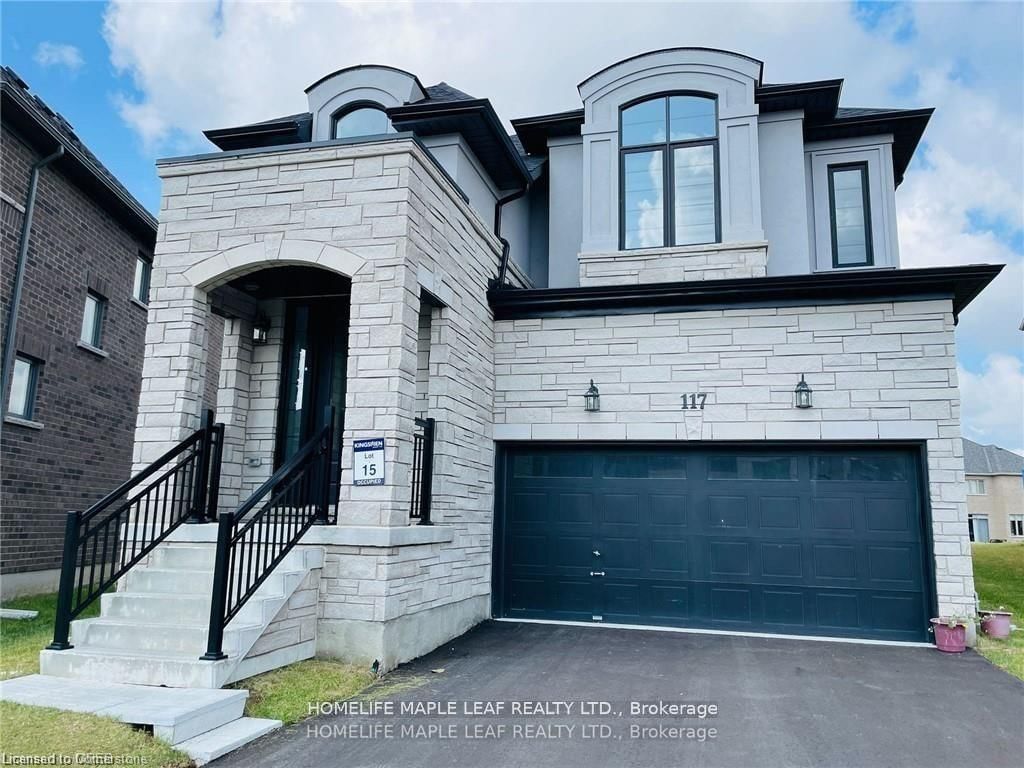
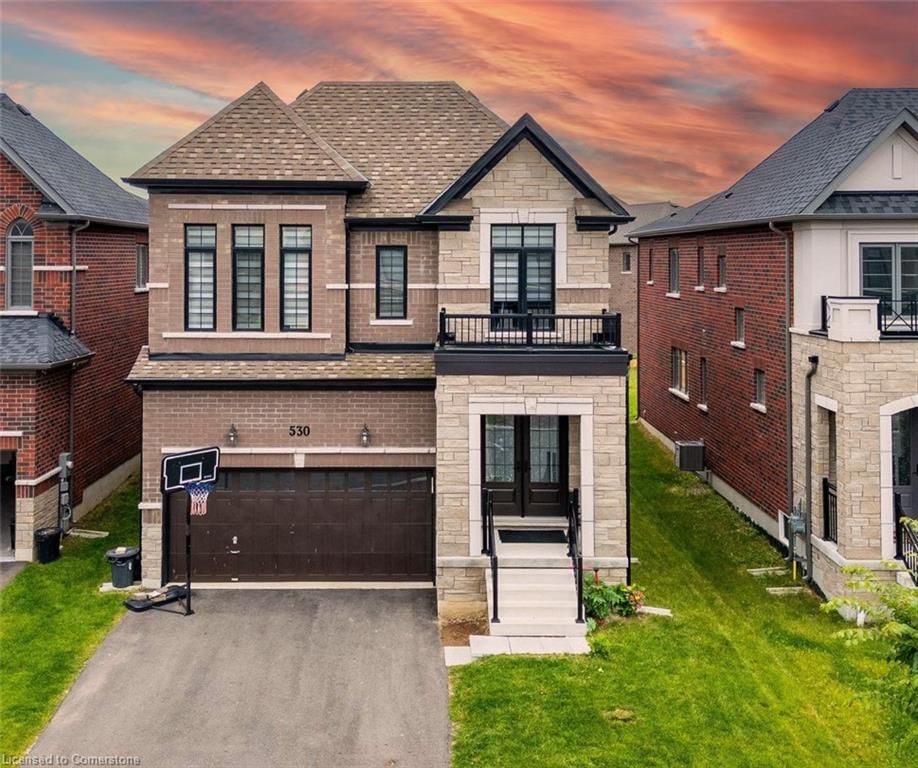
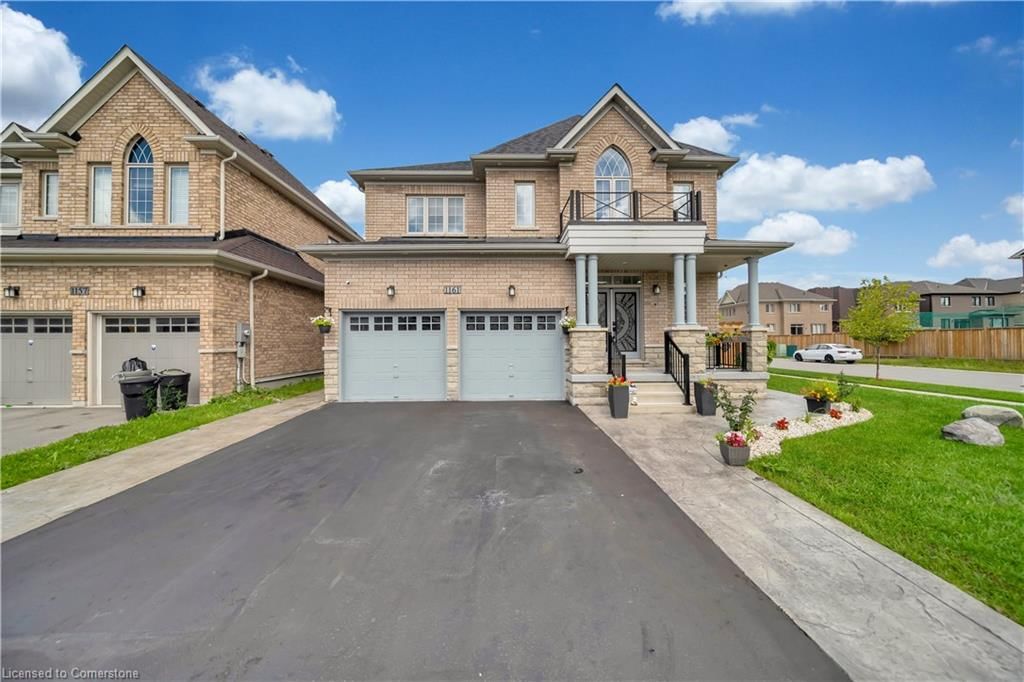
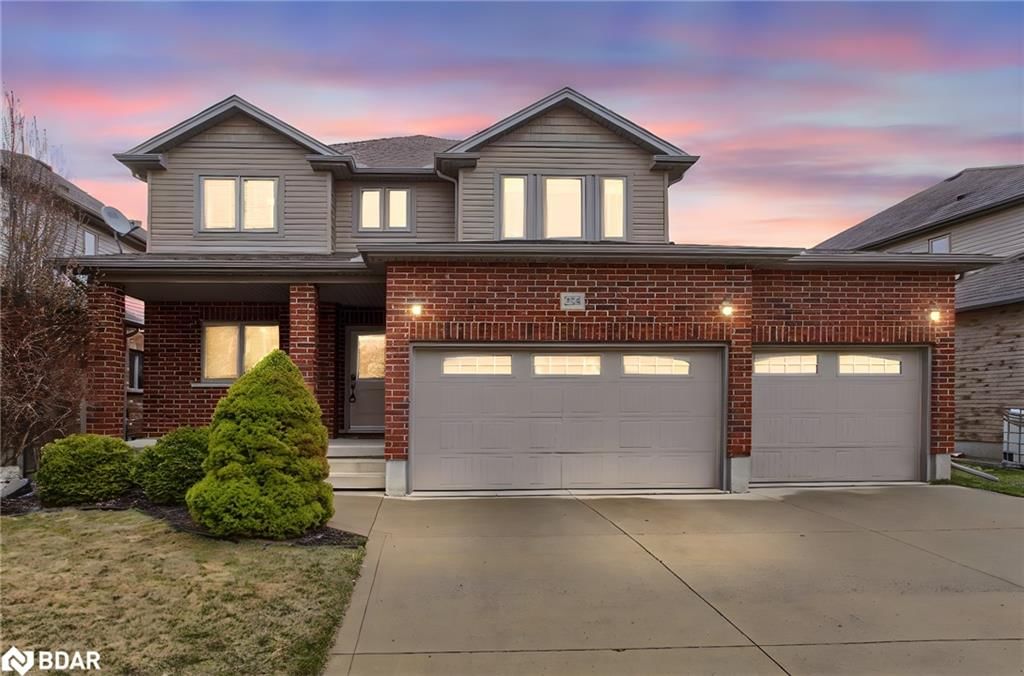
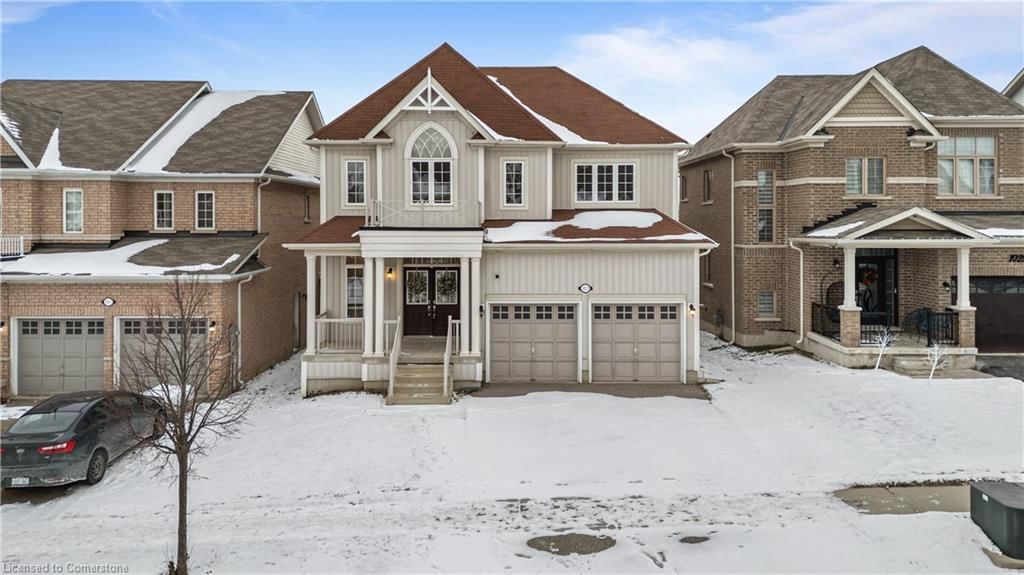
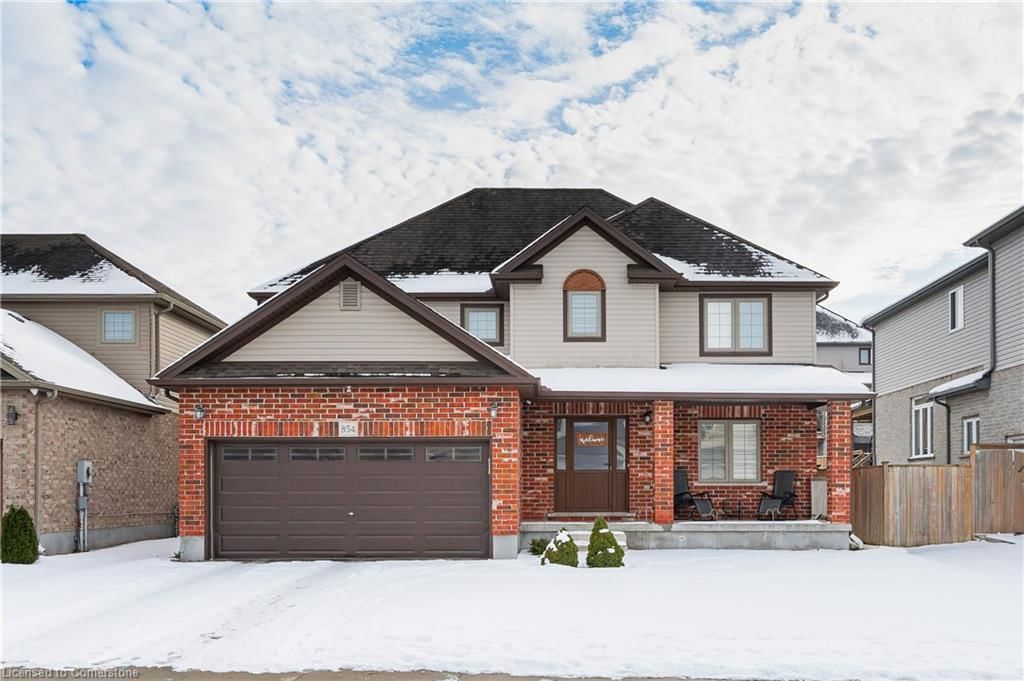
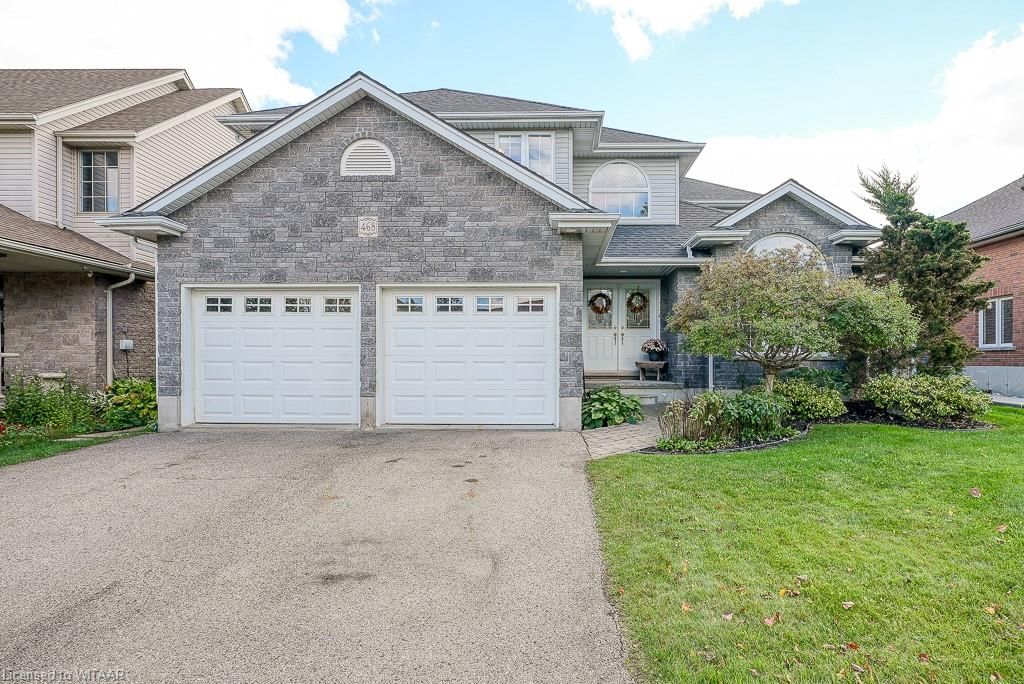
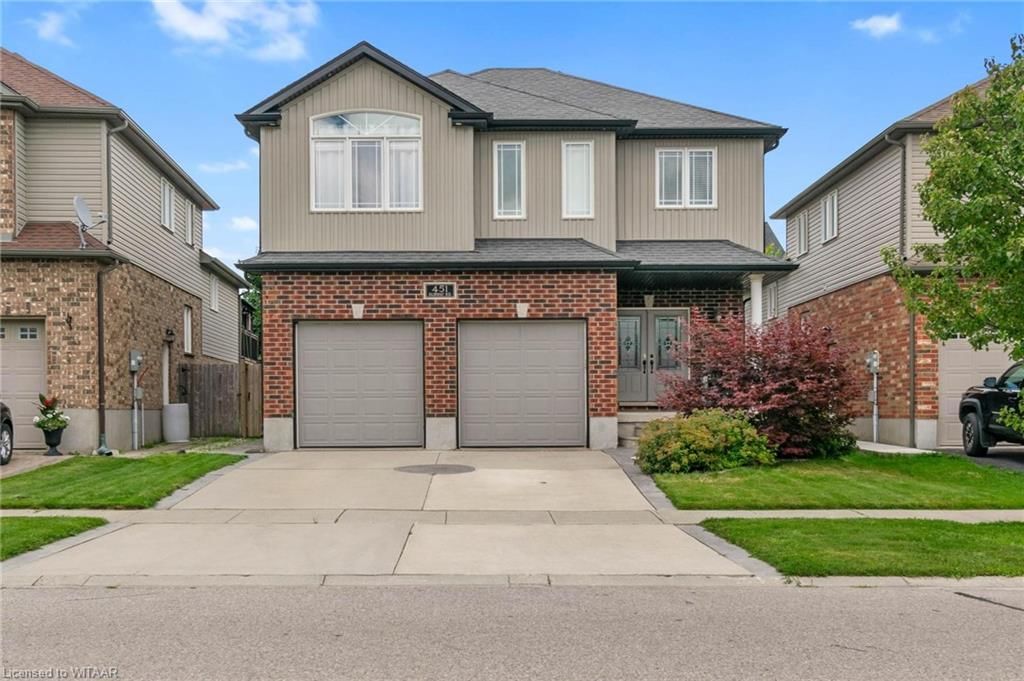
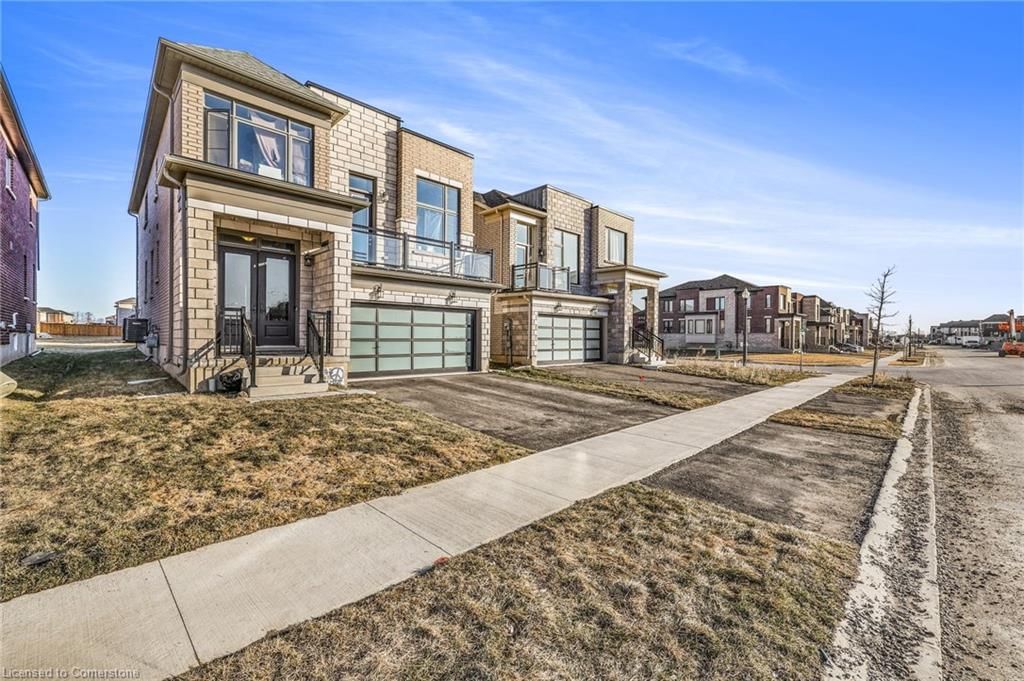
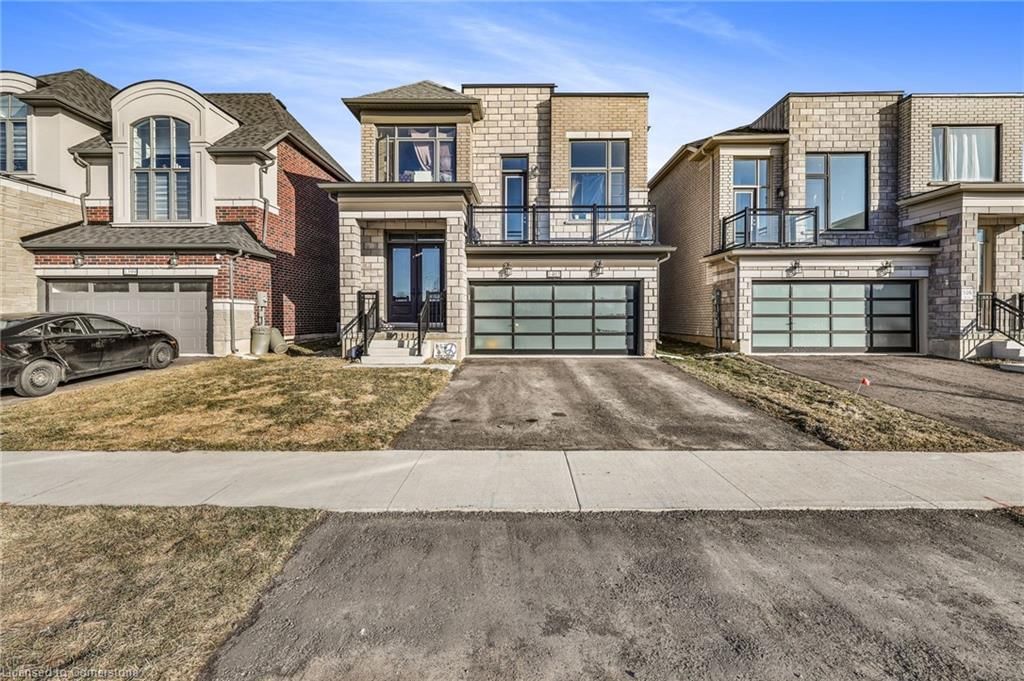
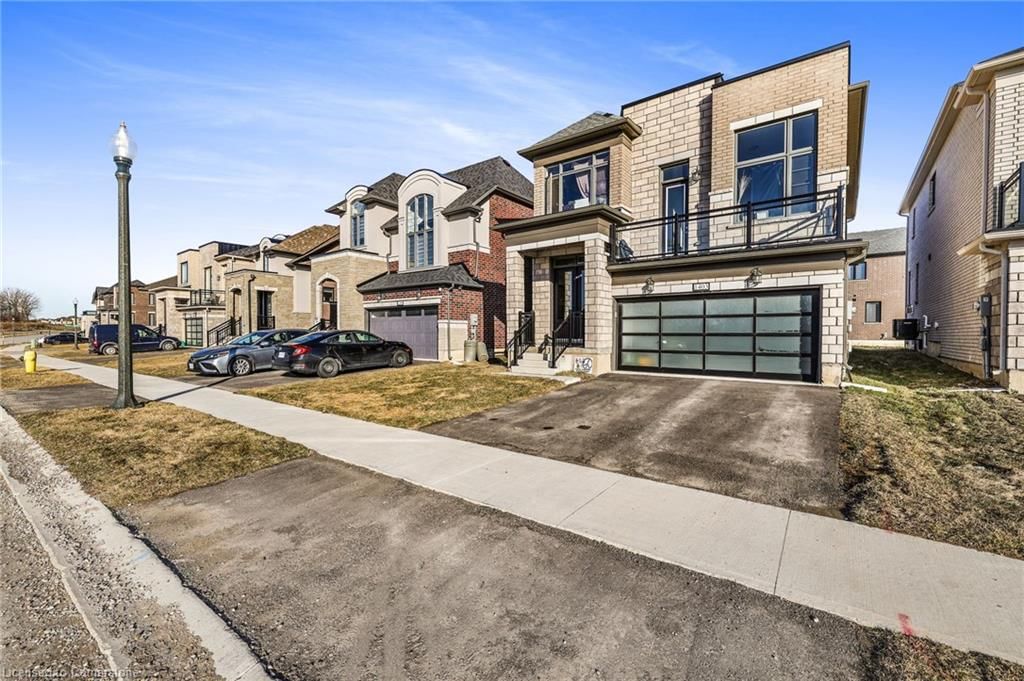
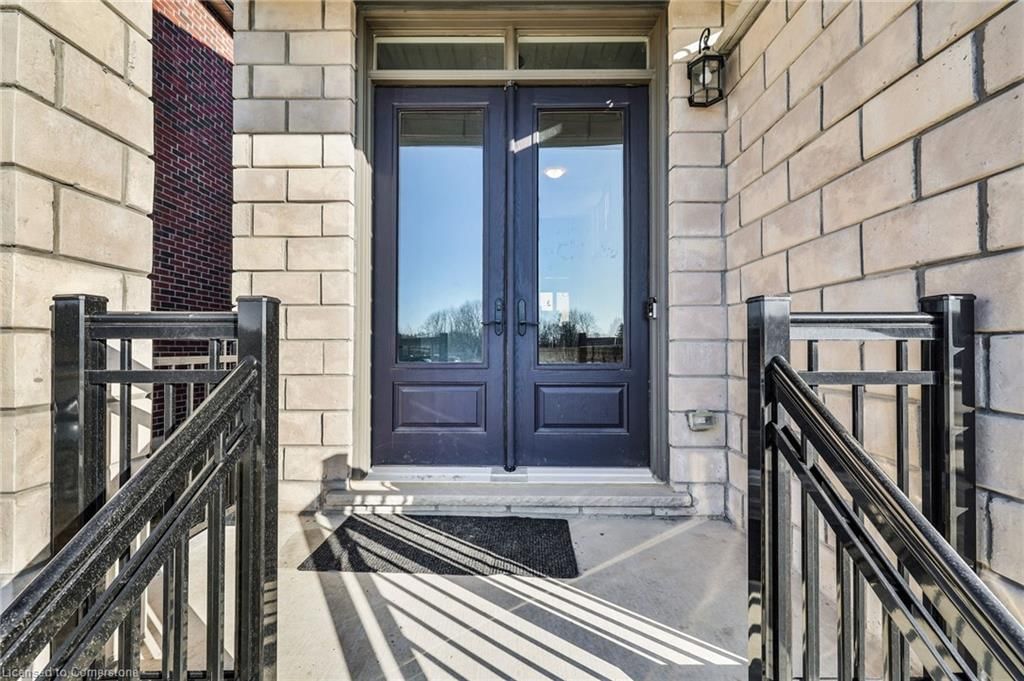
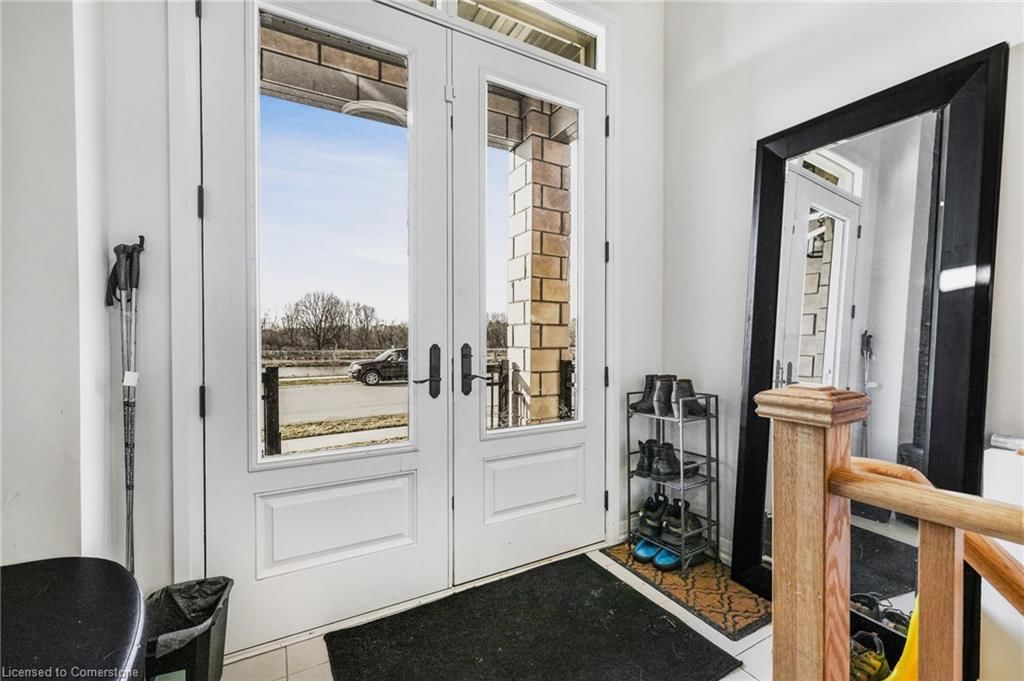
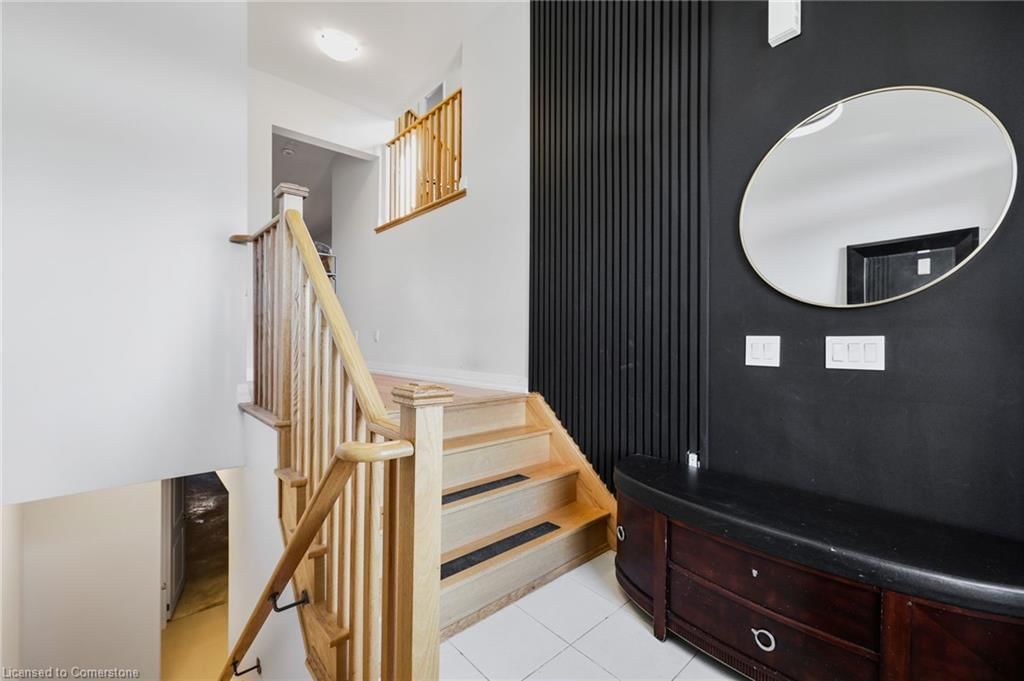
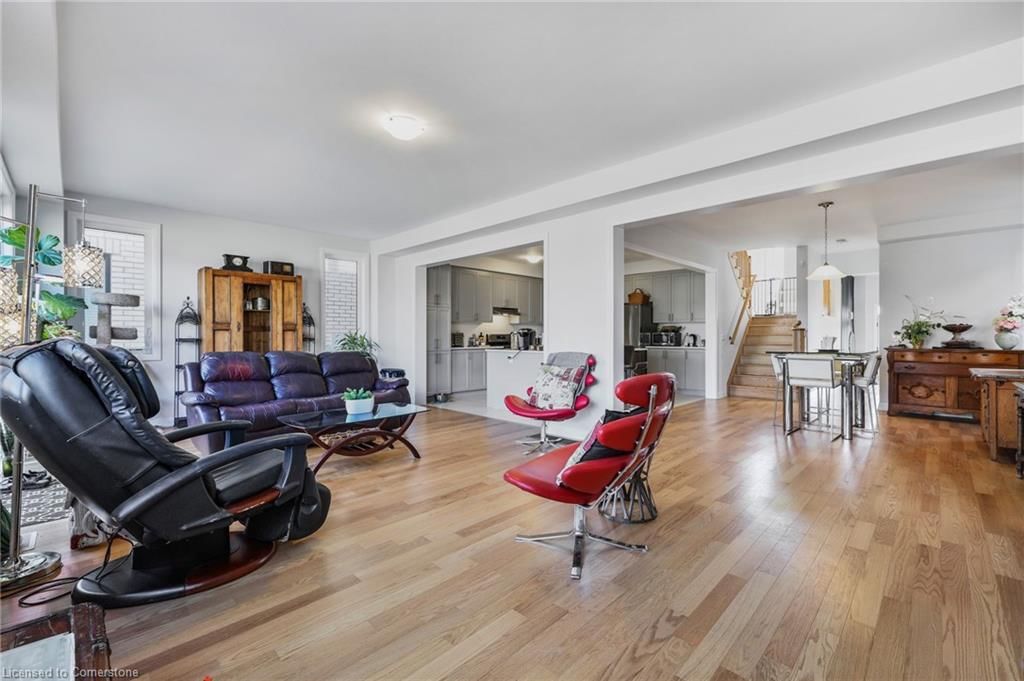
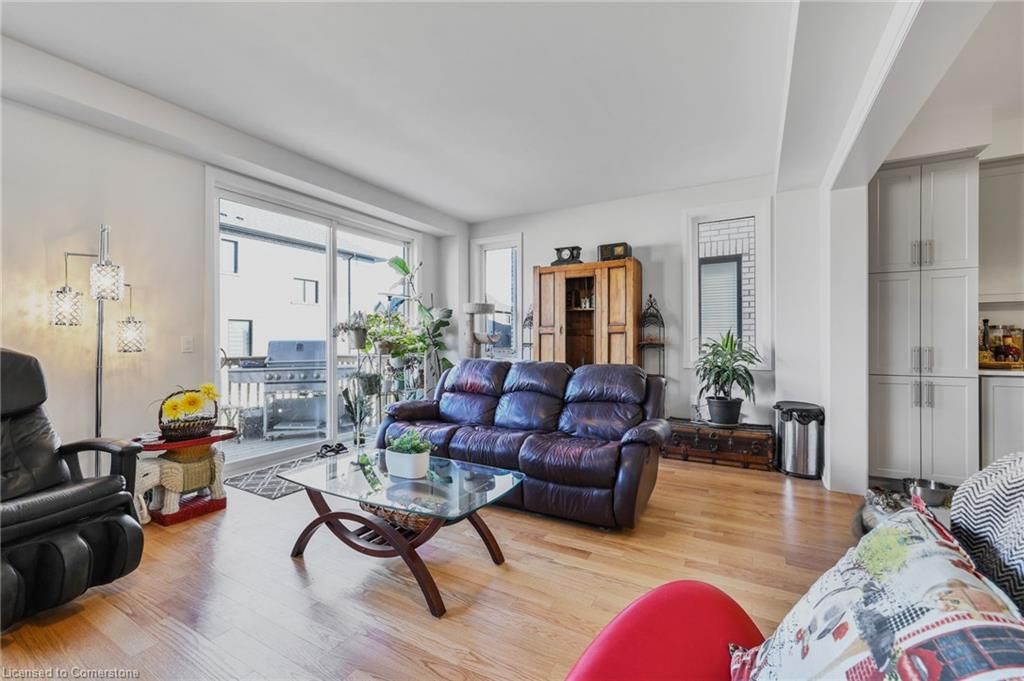
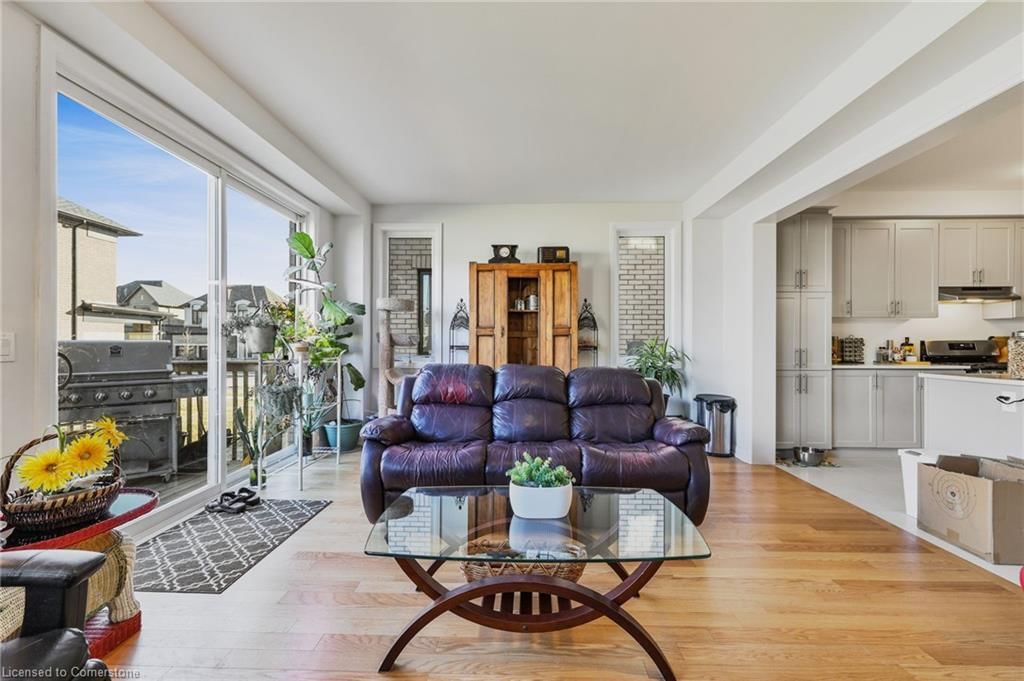
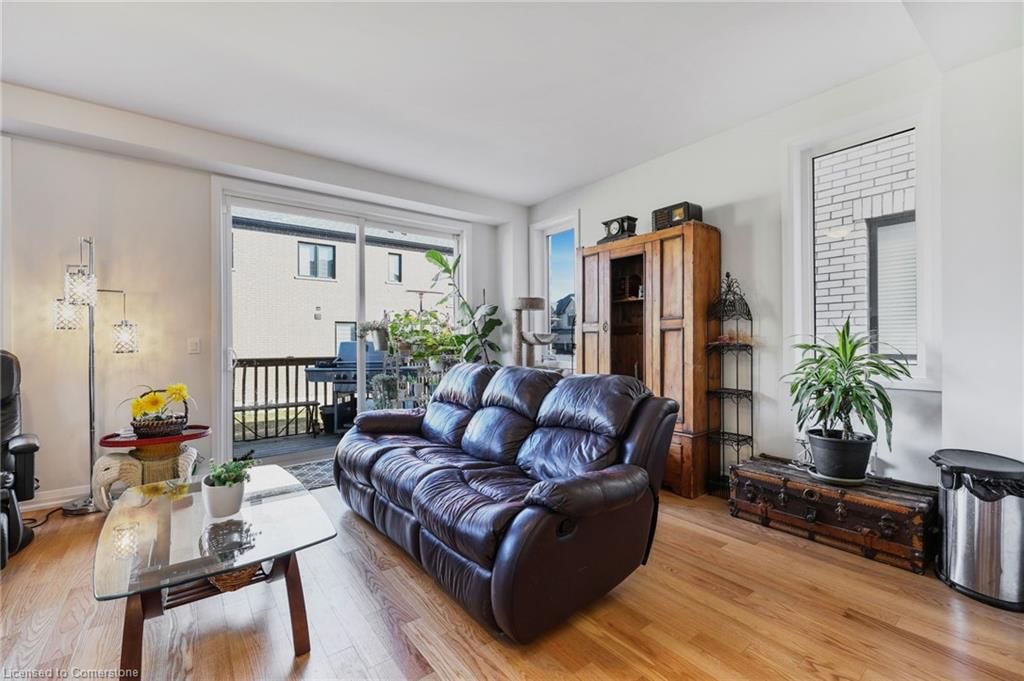
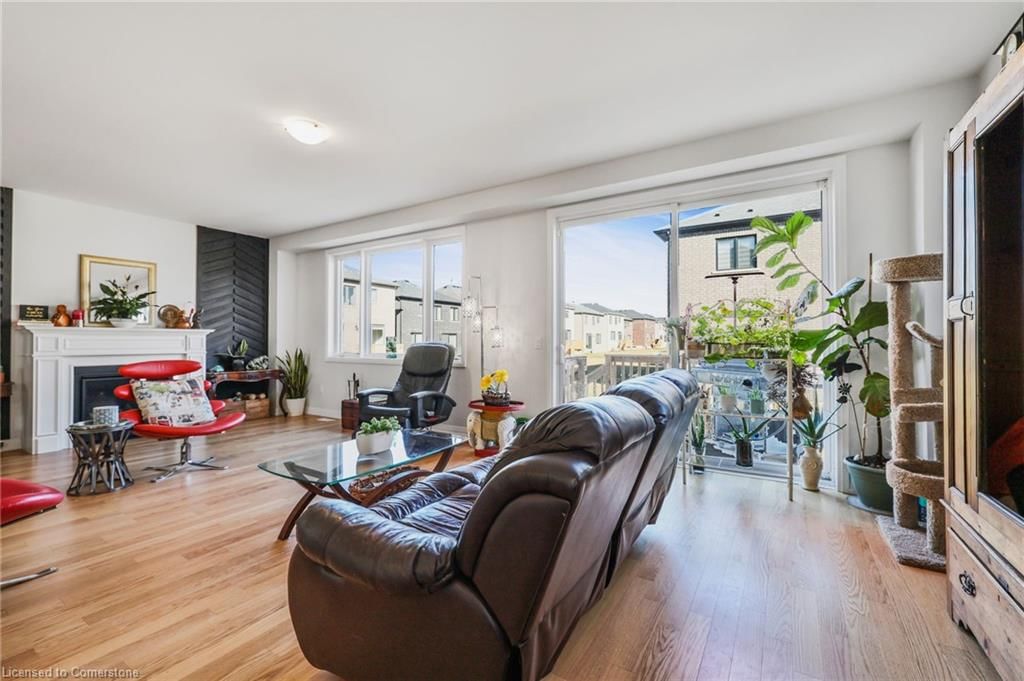
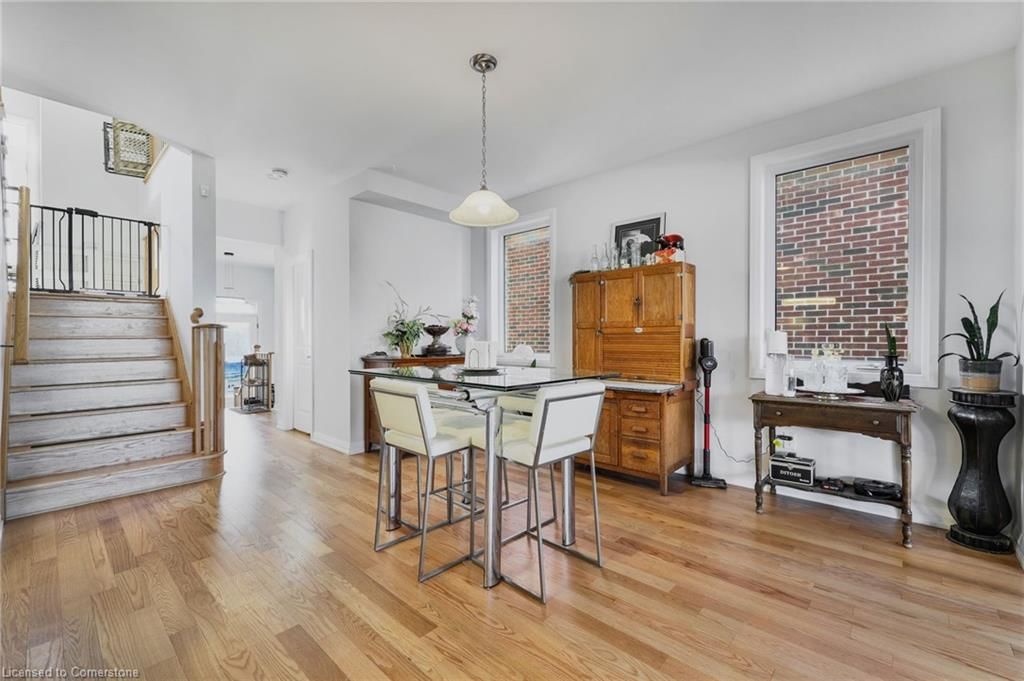
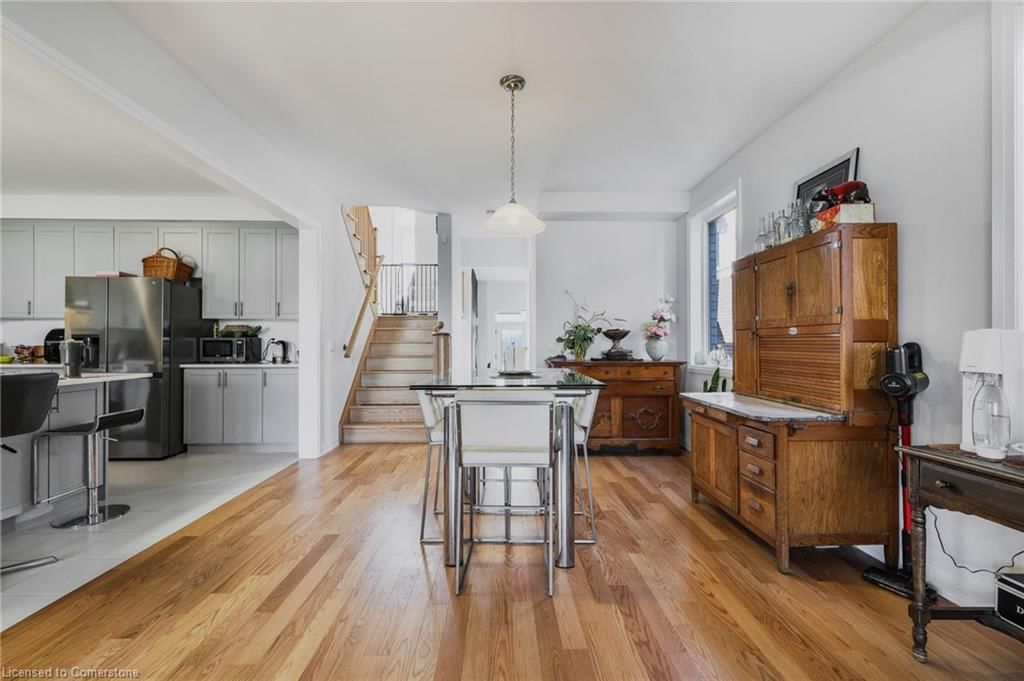
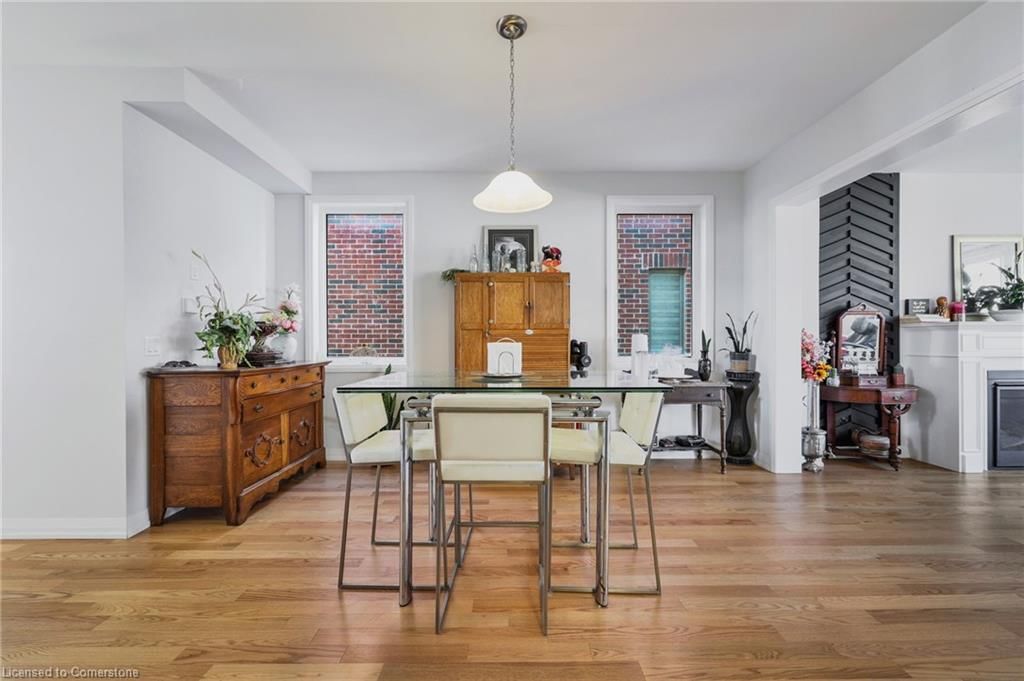
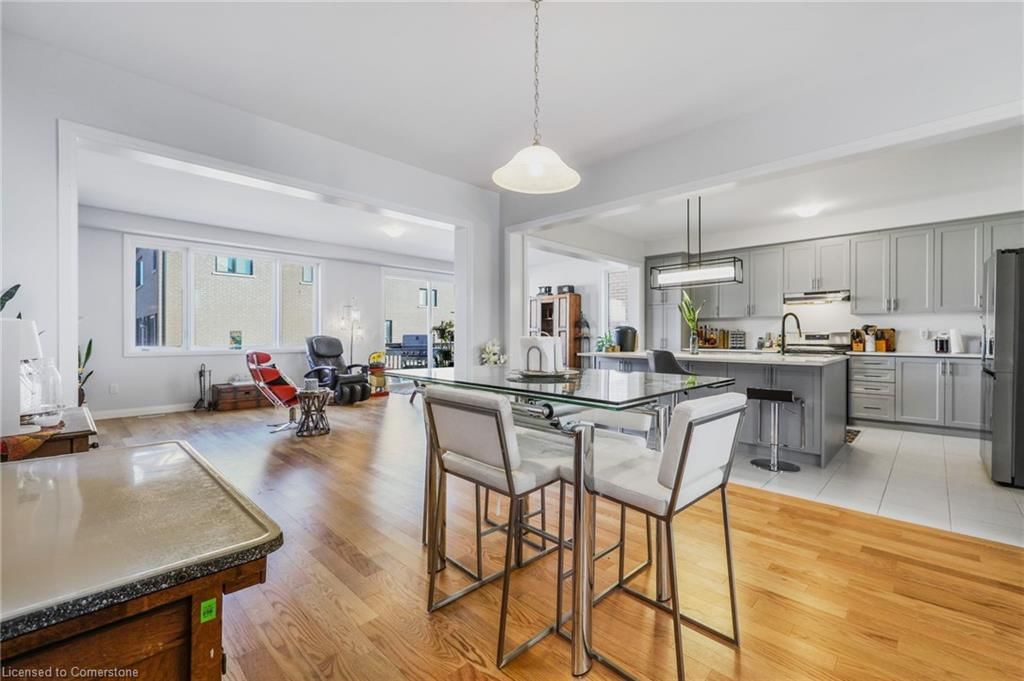
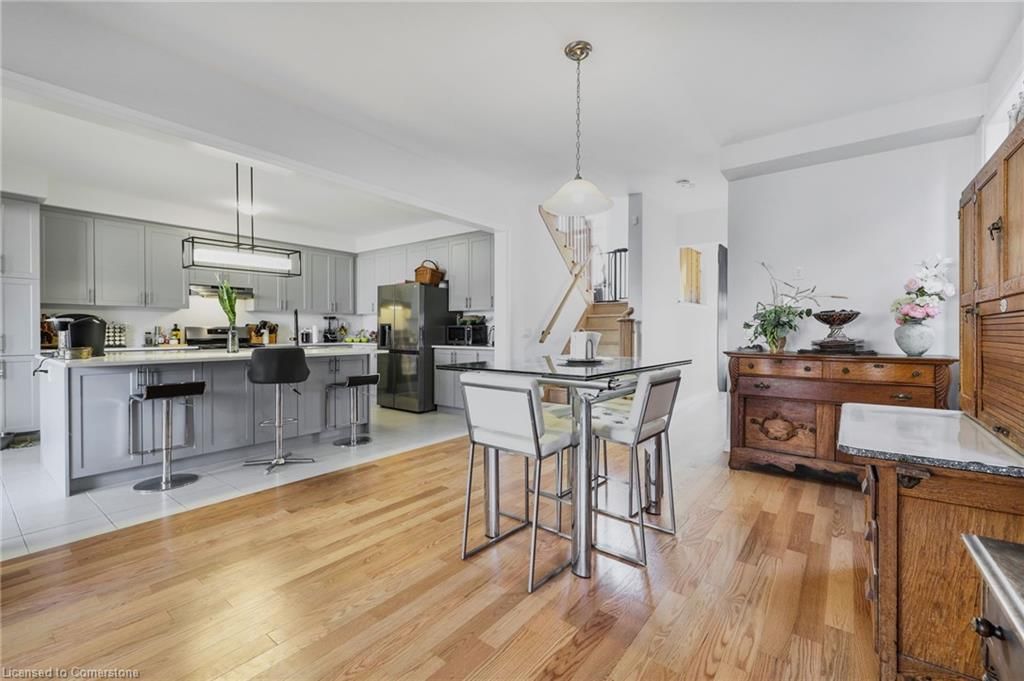
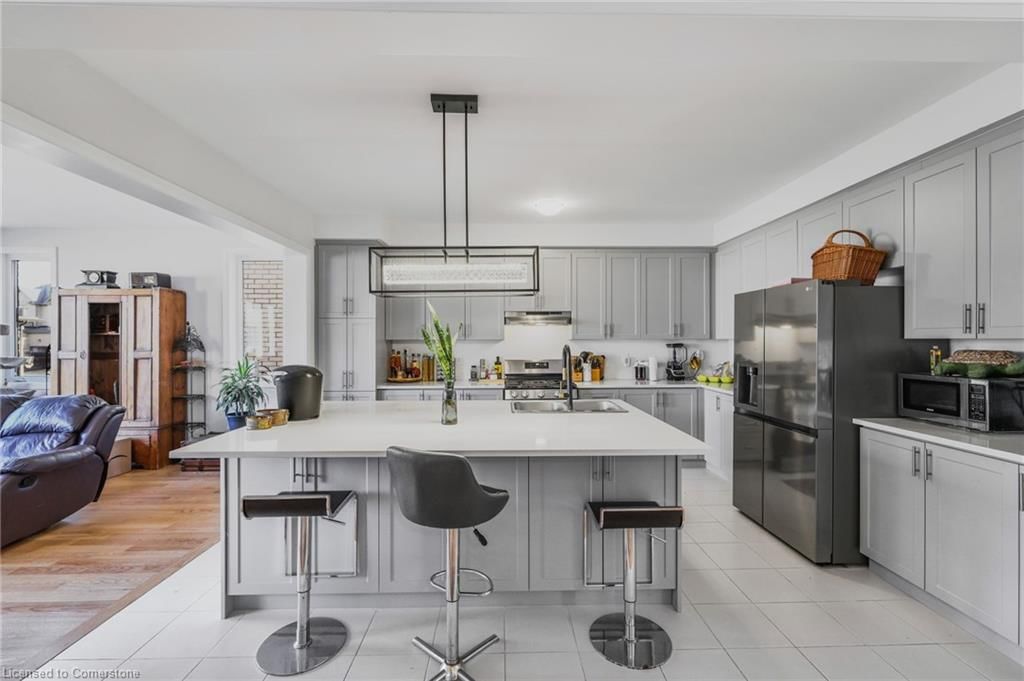
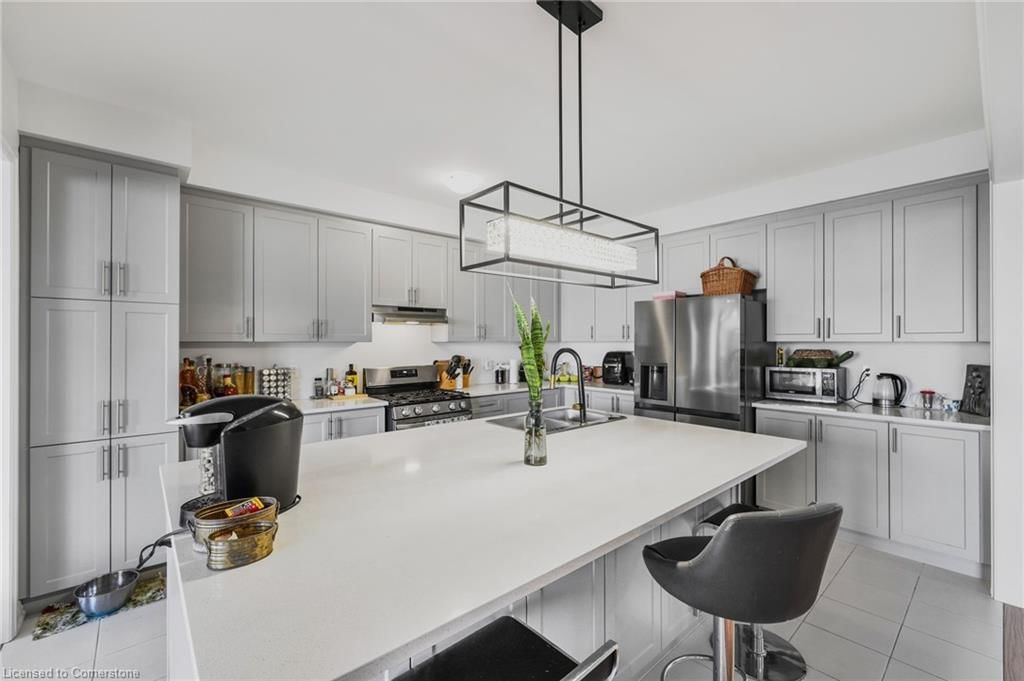
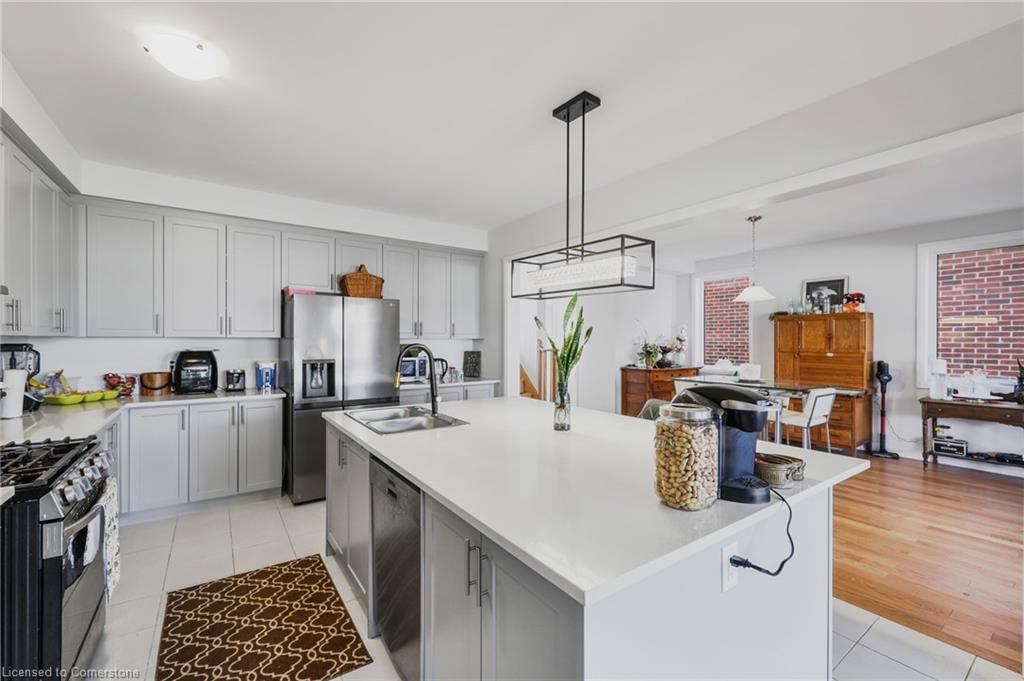
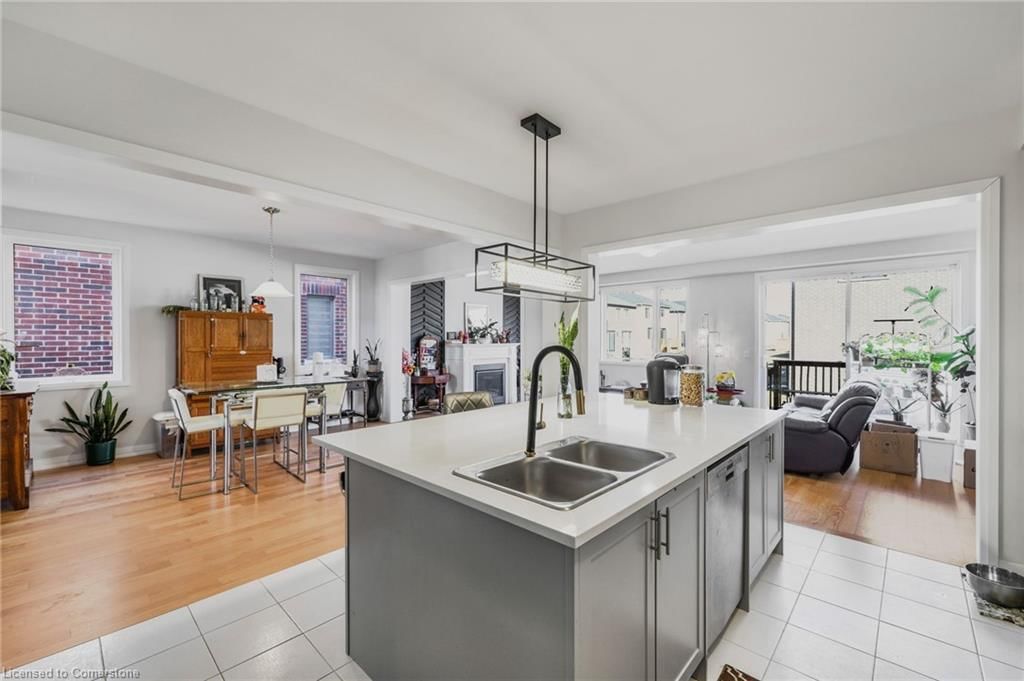
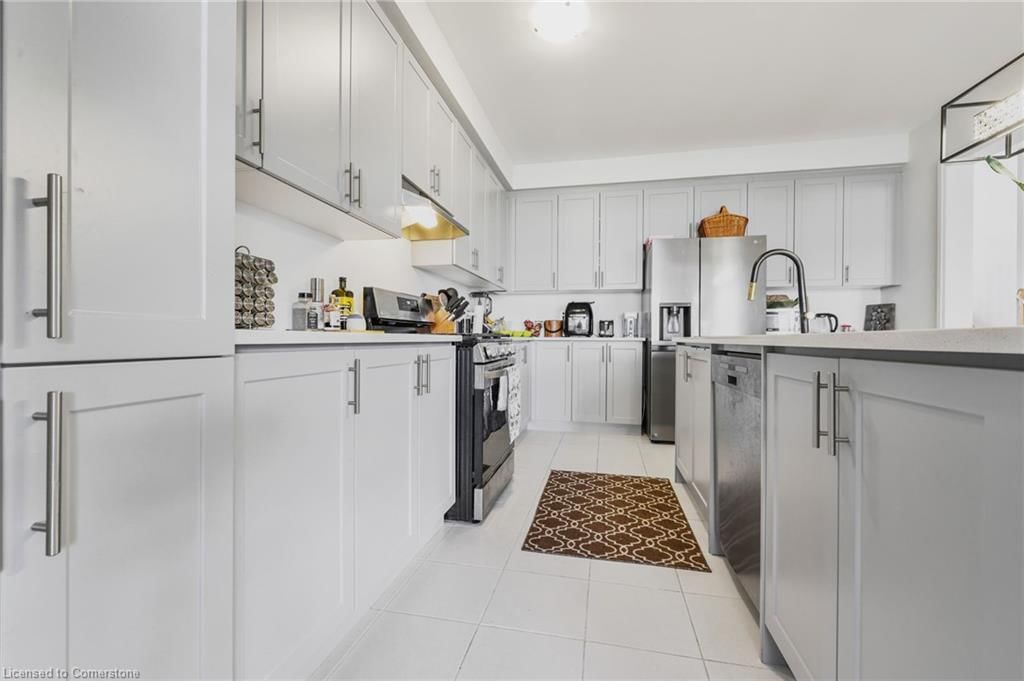
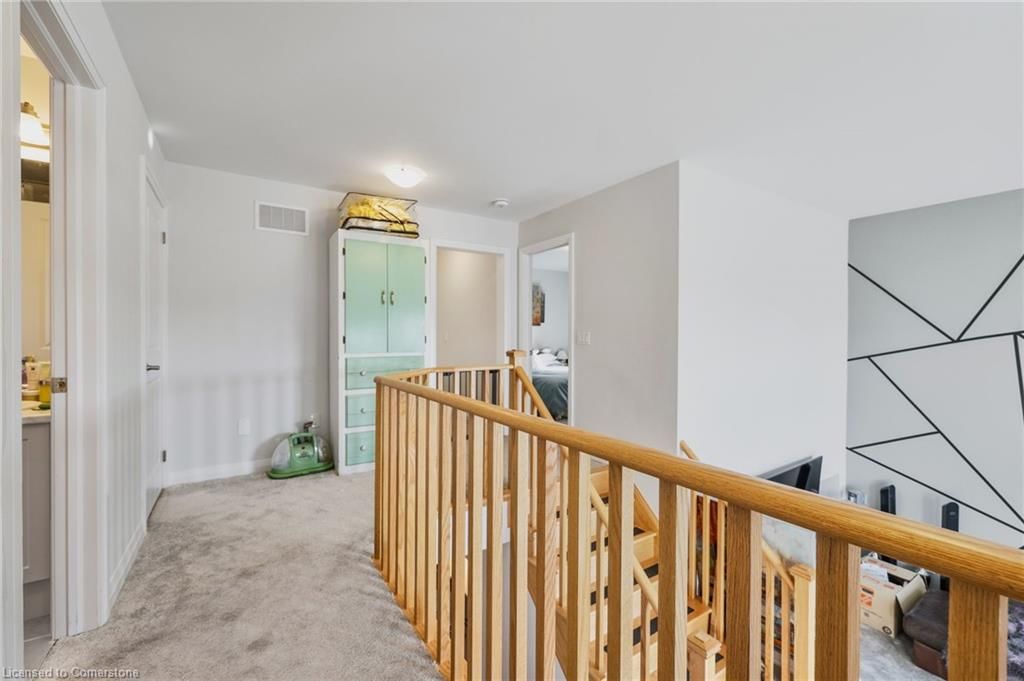
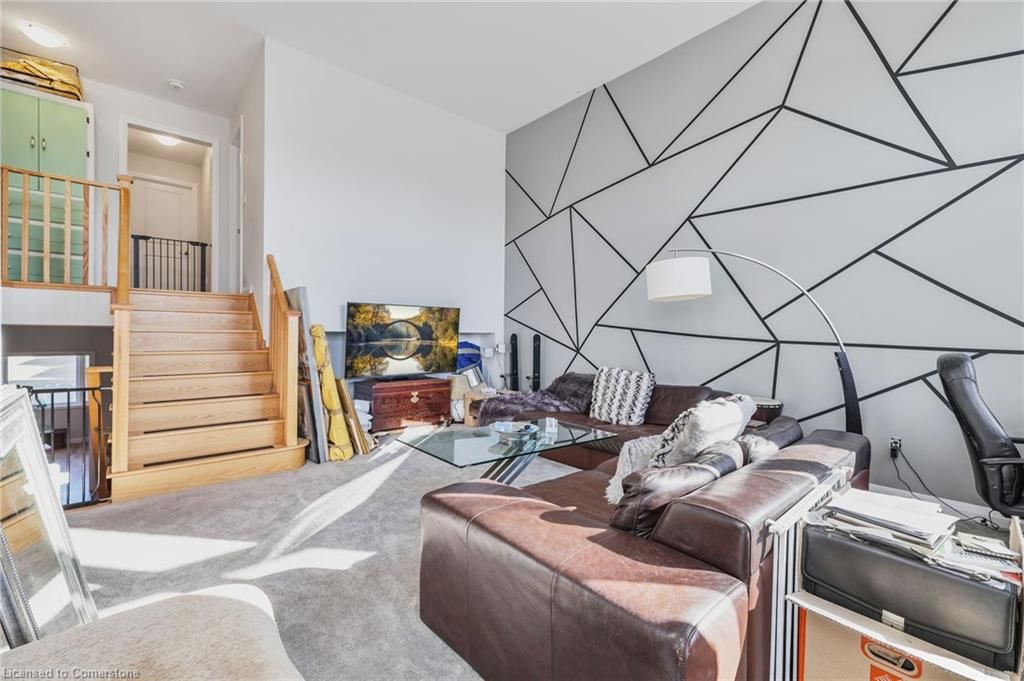
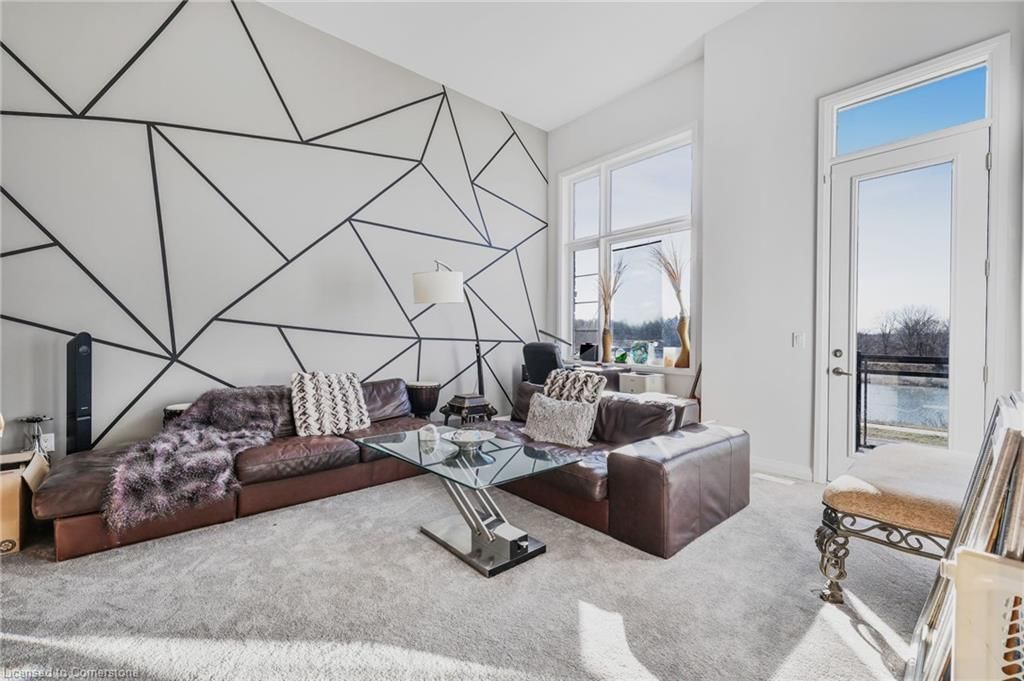
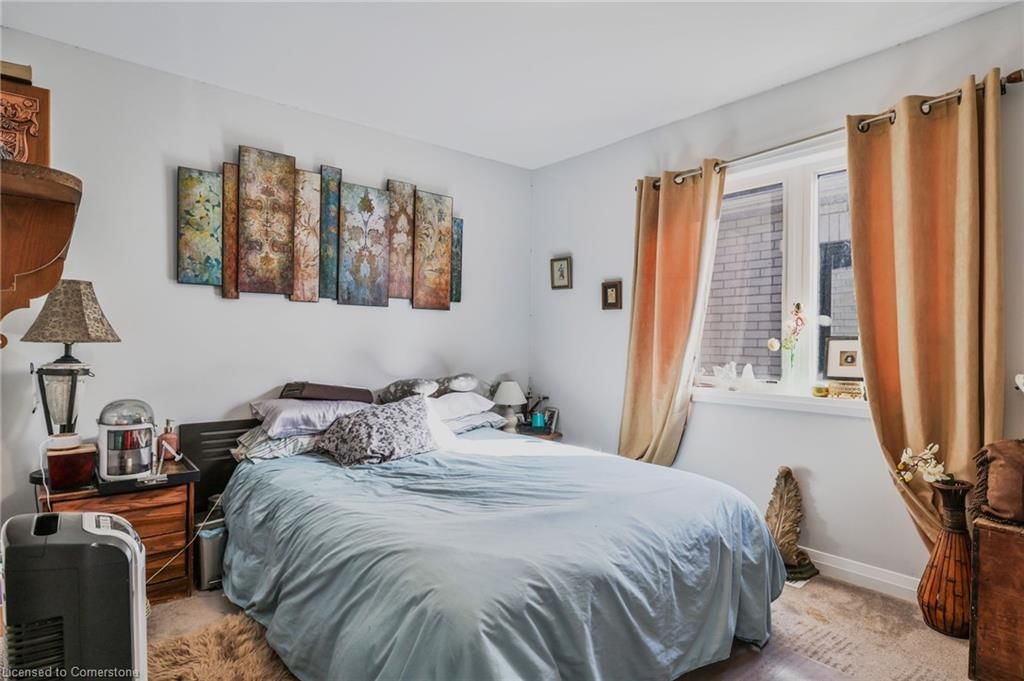
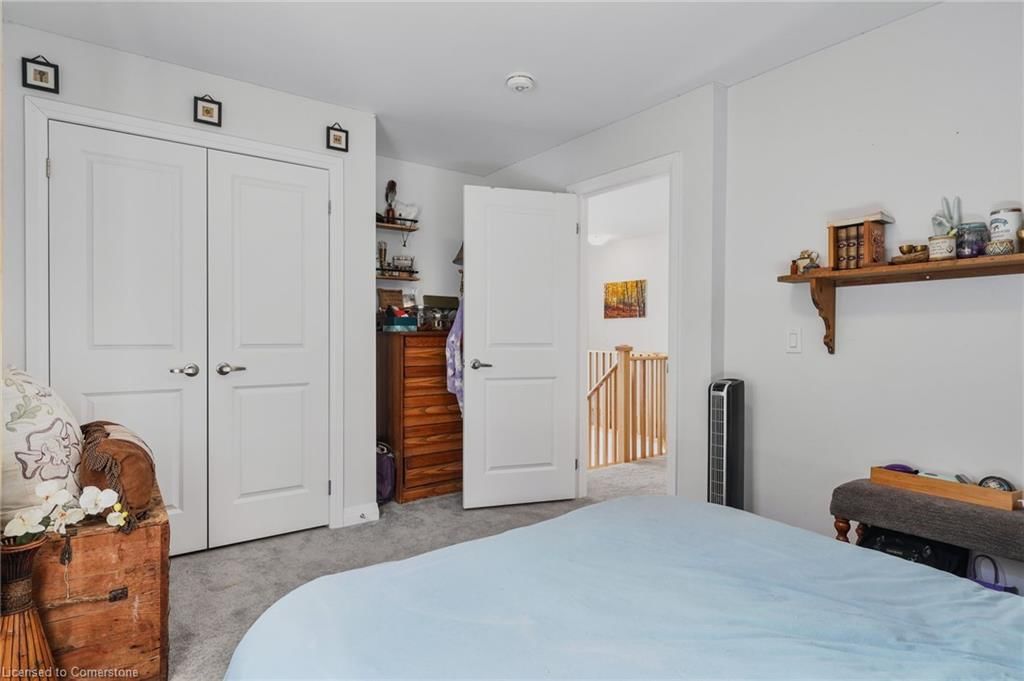
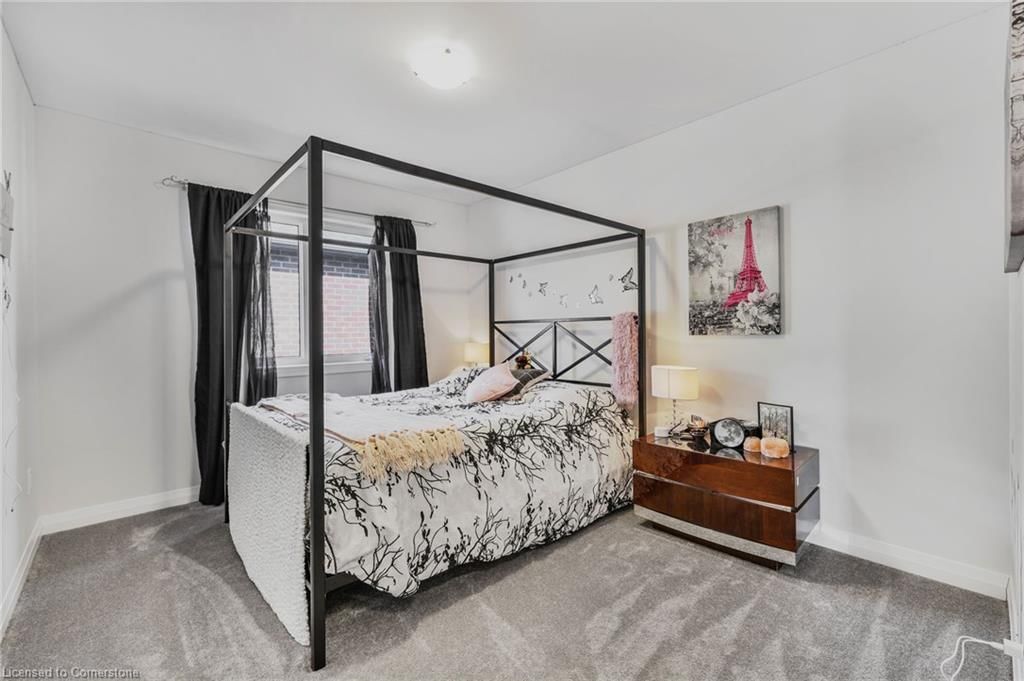
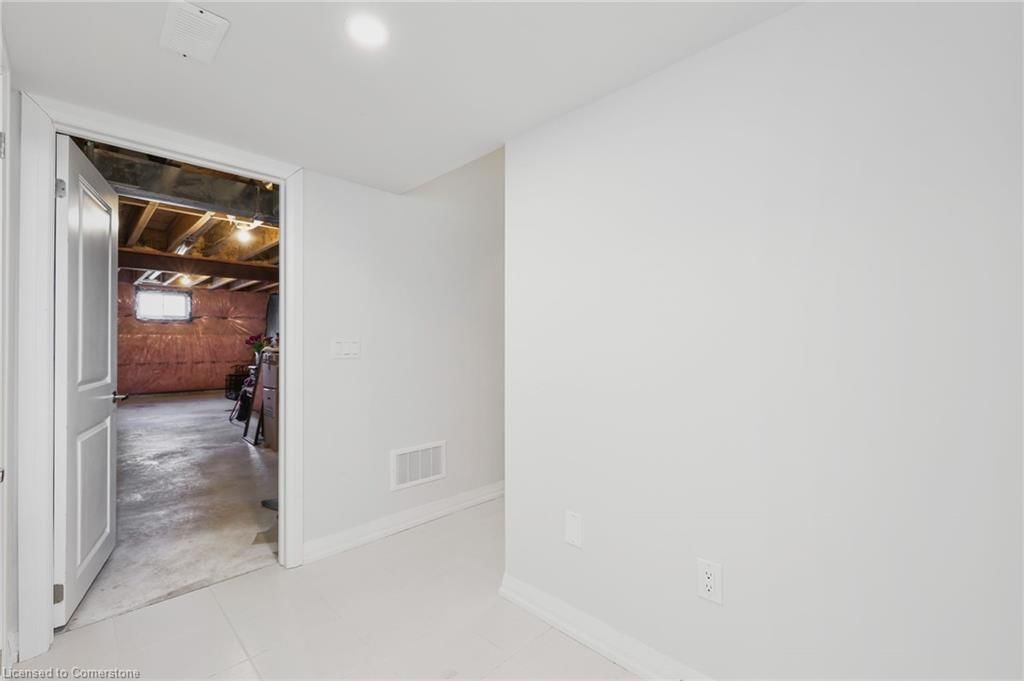
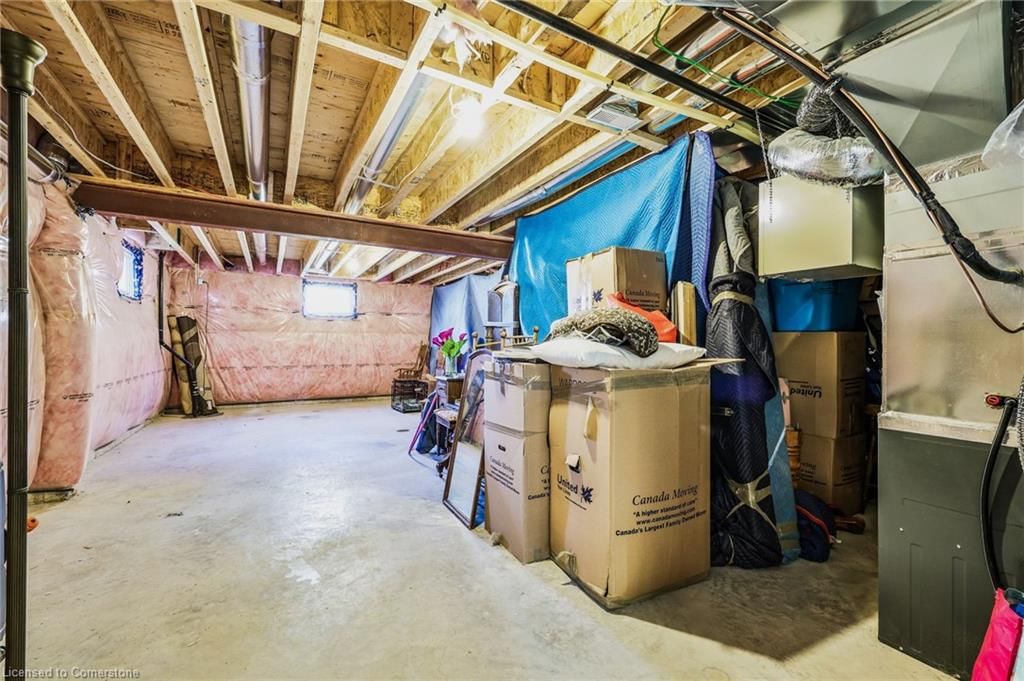
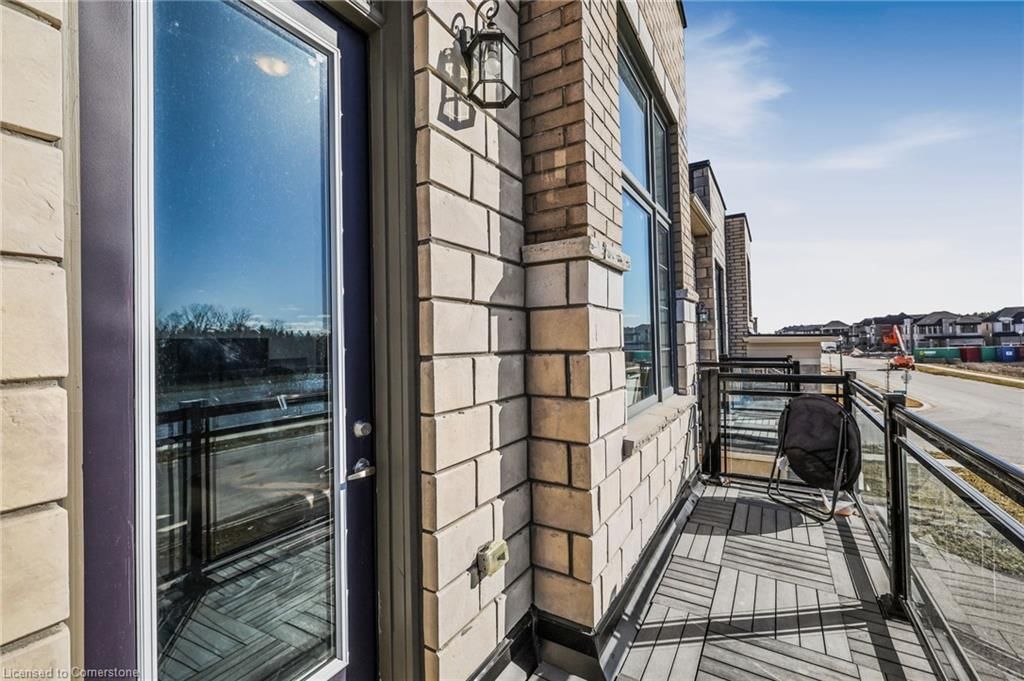
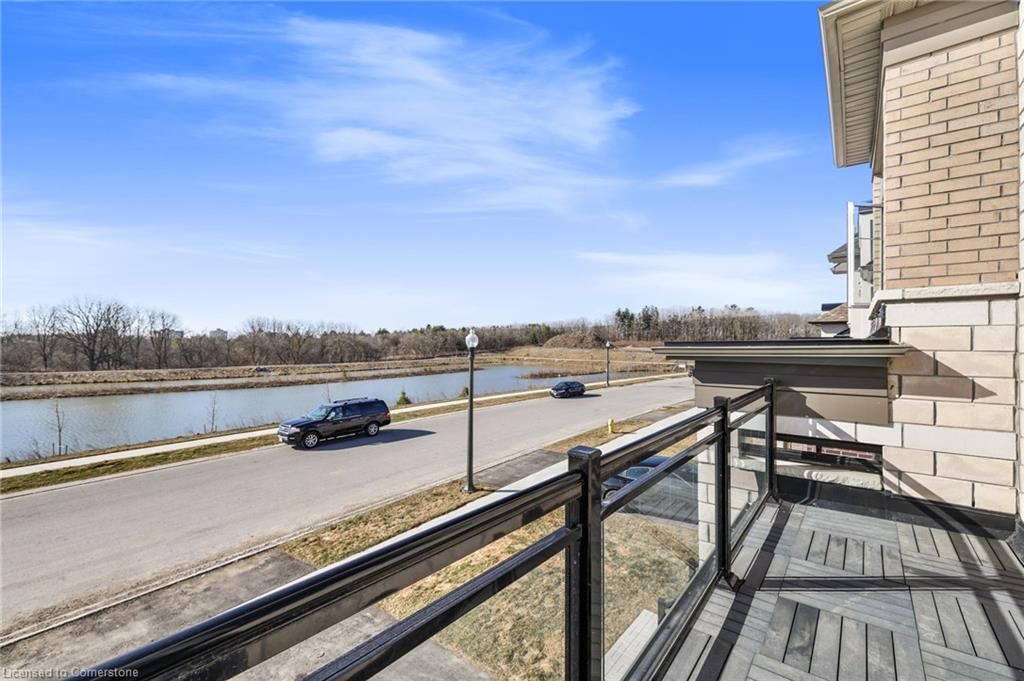
Havelock Corners exclusive community produced by Kingsmen Group in one of the most sought-after neighborhoods of North Woodstock steps to top rated schools, major hwys, local amenities, conservation areas & much more! Presenting this premium 38ft lot detached w/ contemporary finishes & cleverly laid out floorplan offering over 2600sqft of living space located across from a freshwater pond providing serene water views. Covered porch leads to double door entry into bright sunken foyer w/ access to bsmt & garage. Open-concept main-lvl finished w/ formal dining space, Eat-in kitchen, & expansive living space w/ fireplace & walk-out to rear deck. *9ft ceilings & hardwood flooring thru-out* Executive chef’s kitchen upgraded w/ tall modern cabinetry, quartz counters, high-end SS appliances, centre island, breakfast bar, & B/I pantry offering the perfect space for growing families. In-between lvl w/ formal family room finished w/ accent wall & W/O to front balcony ideal for morning coffee or evening drinks. Upper lvl w/ no compromises presents 4 spacious bedrooms, 2-full bathrooms, & convenient laundry. Primary bedroom retreat w/ W/I closet & 5-pc ensuite. Unfinished bsmt awaiting your vision w/ sep-entrance through garage ideal for in-law suite or rental.
Negotiable,All Fixtures Permanently Attached To The Property In "as Is" Condition.
Copyright 2025 Information Technology Systems Ontario, Inc. The information provided herein must only be used by consumers that have a bona fide interest in the purchase, sale, or lease of real estate and may not be used for any commercial purpose or any other purpose.
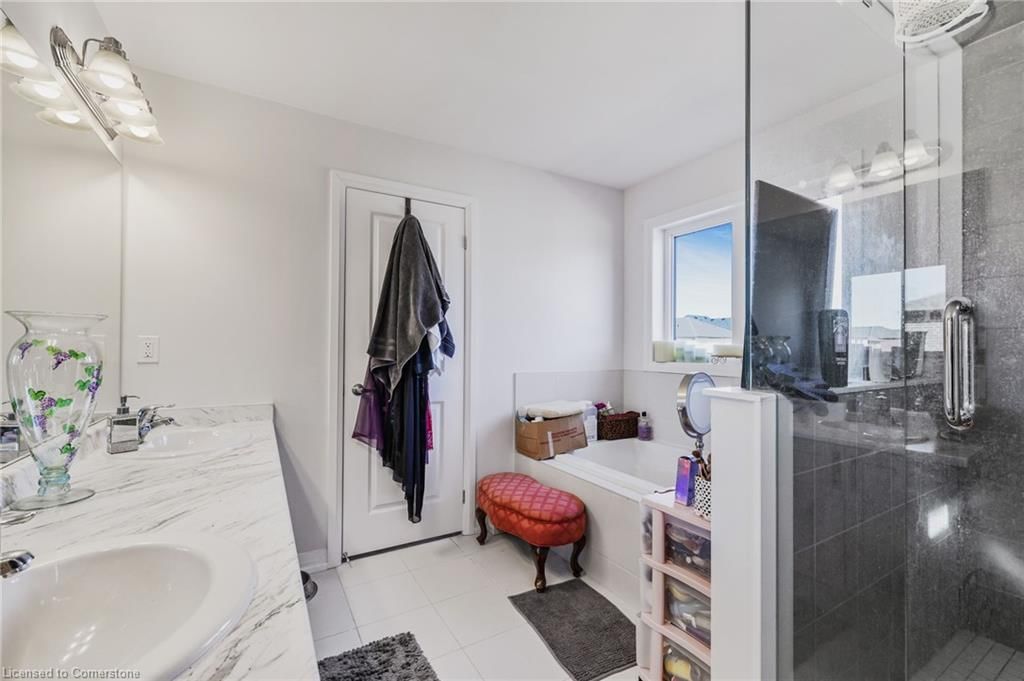
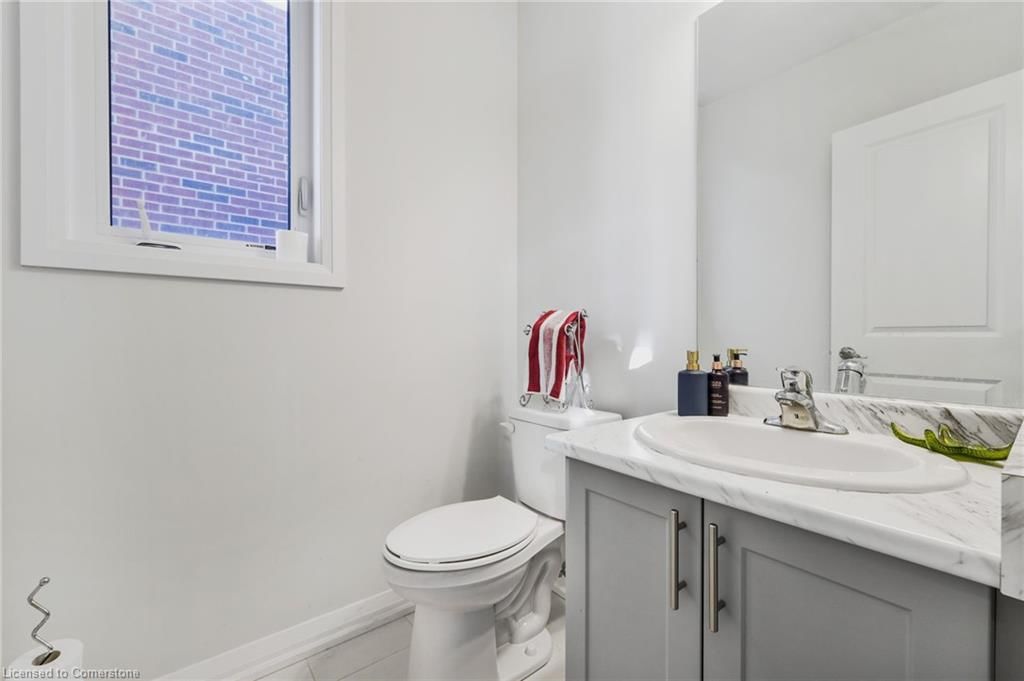
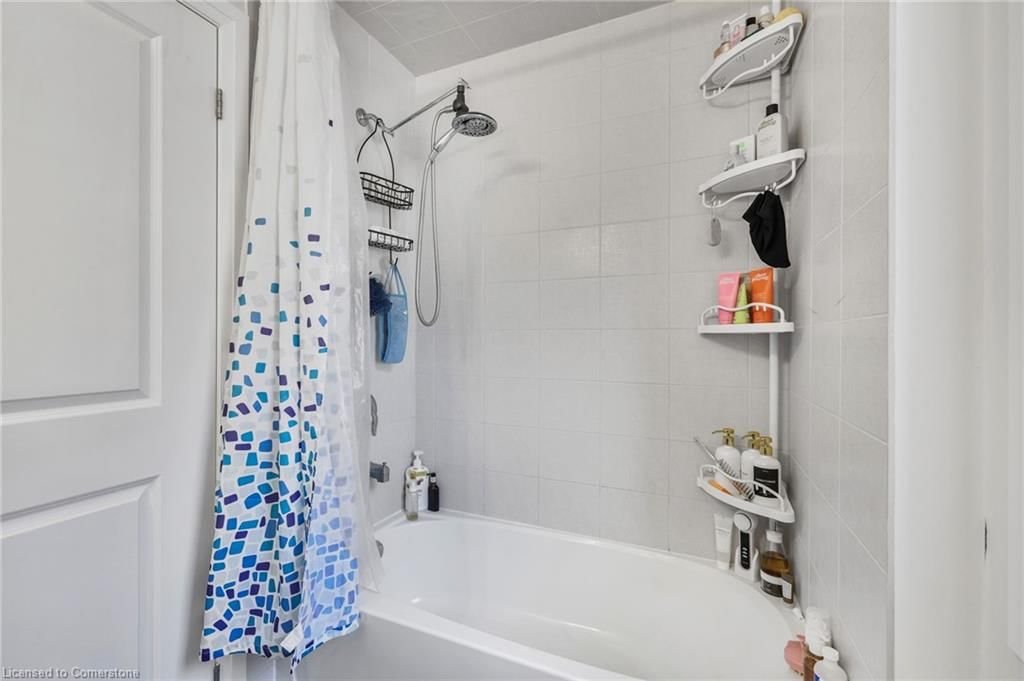
Bathroom
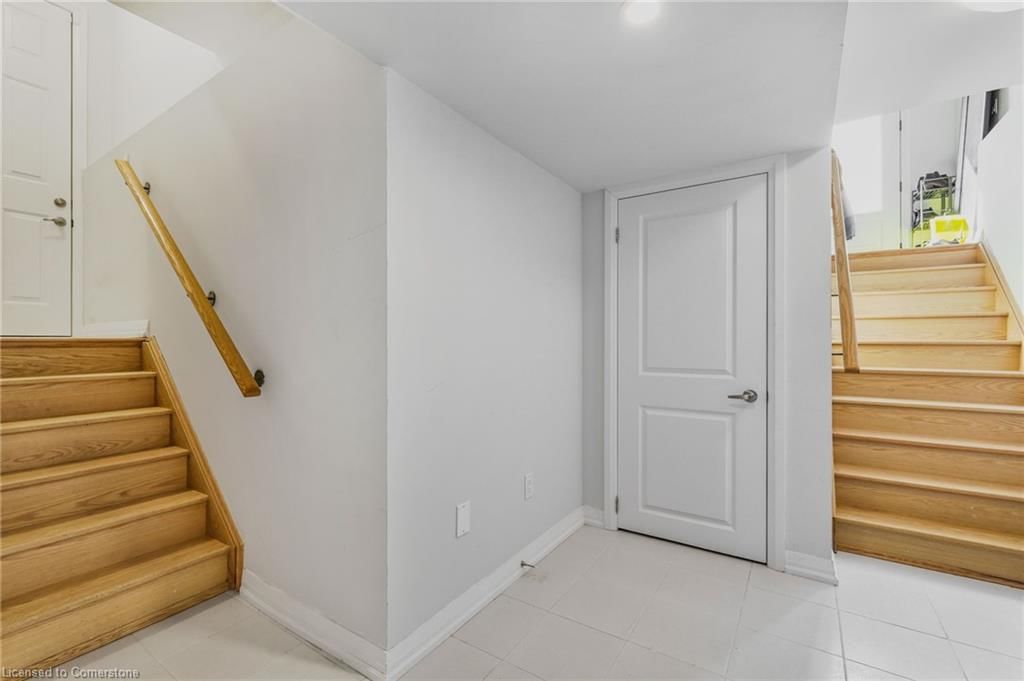
Foyer
Eat-in Kitchen
Dining Room
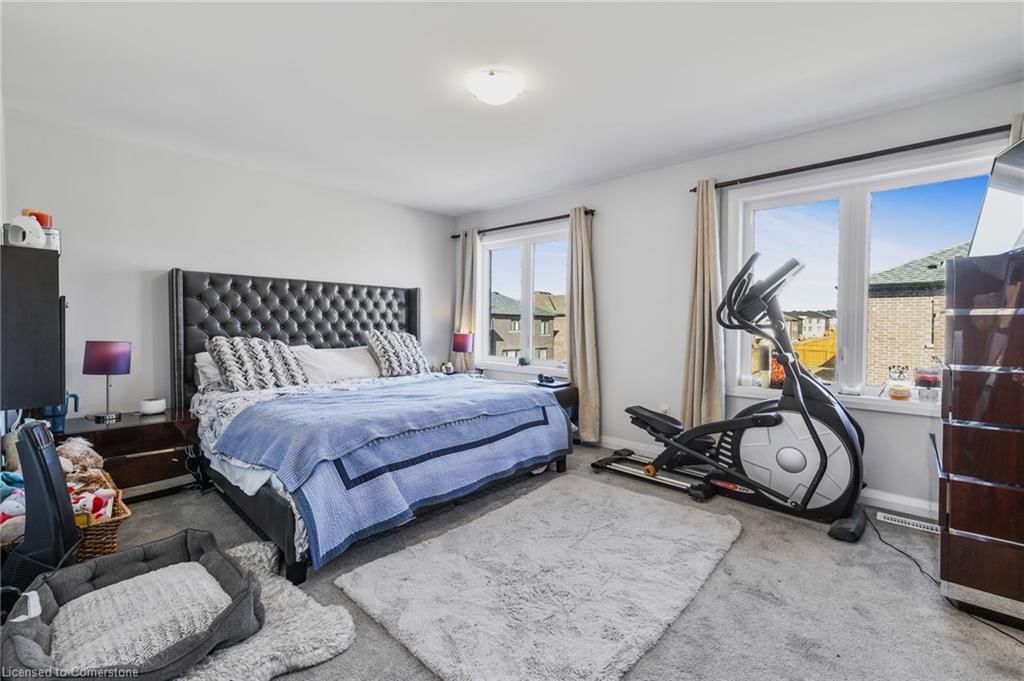
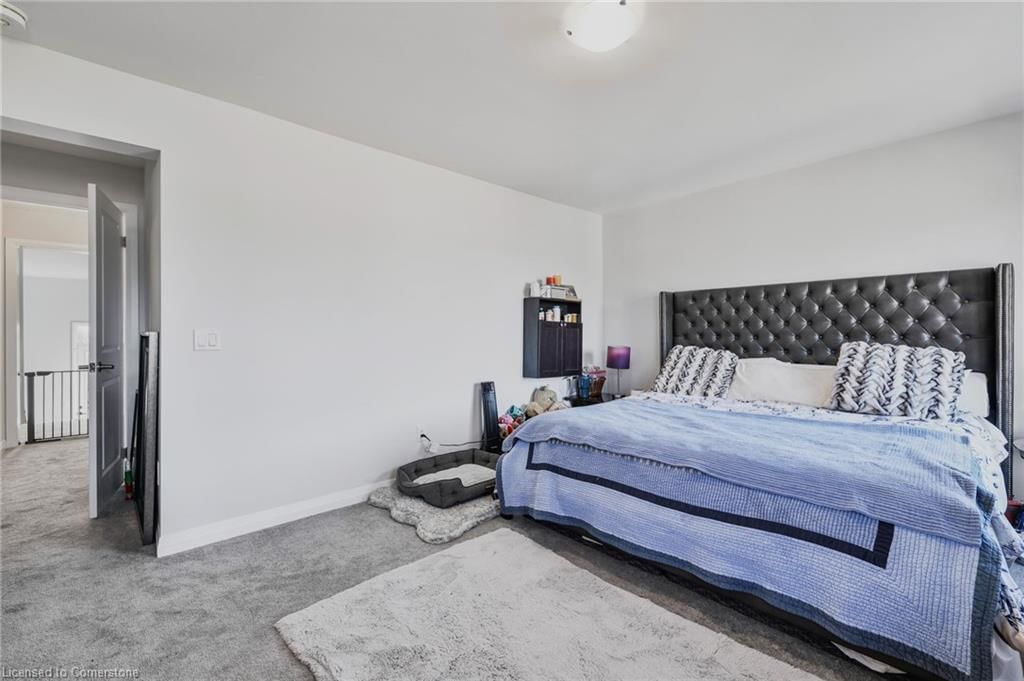
Bedroom Primary
Living Room
Family Room
Bedroom
Bedroom
Bedroom
Bathroom
Laundry
The graph below compares the average list price and average sale price of homes in this neighborhood by month for the last 24 months. When average sale price is greater than average list price, this may suggest a buyer's market. When average sale price is lower than the average list price this may suggest a seller's market.
The graph below illustrates the average days on market for homes in this neighborhood. The yellow area may indicate a buyer's market, the green area may indicate a balanced market and the red area may indicate a seller's market.
Sales Representative, Century 21 People’s Choice Realty Inc., Brokerage
(647) 576 - 2100