

Century 21 People’s Choice Realty Inc., Brokerage
120 MATHESON BLVD E #103
MISSISSAUGA, Ontario
L4Z 1X1


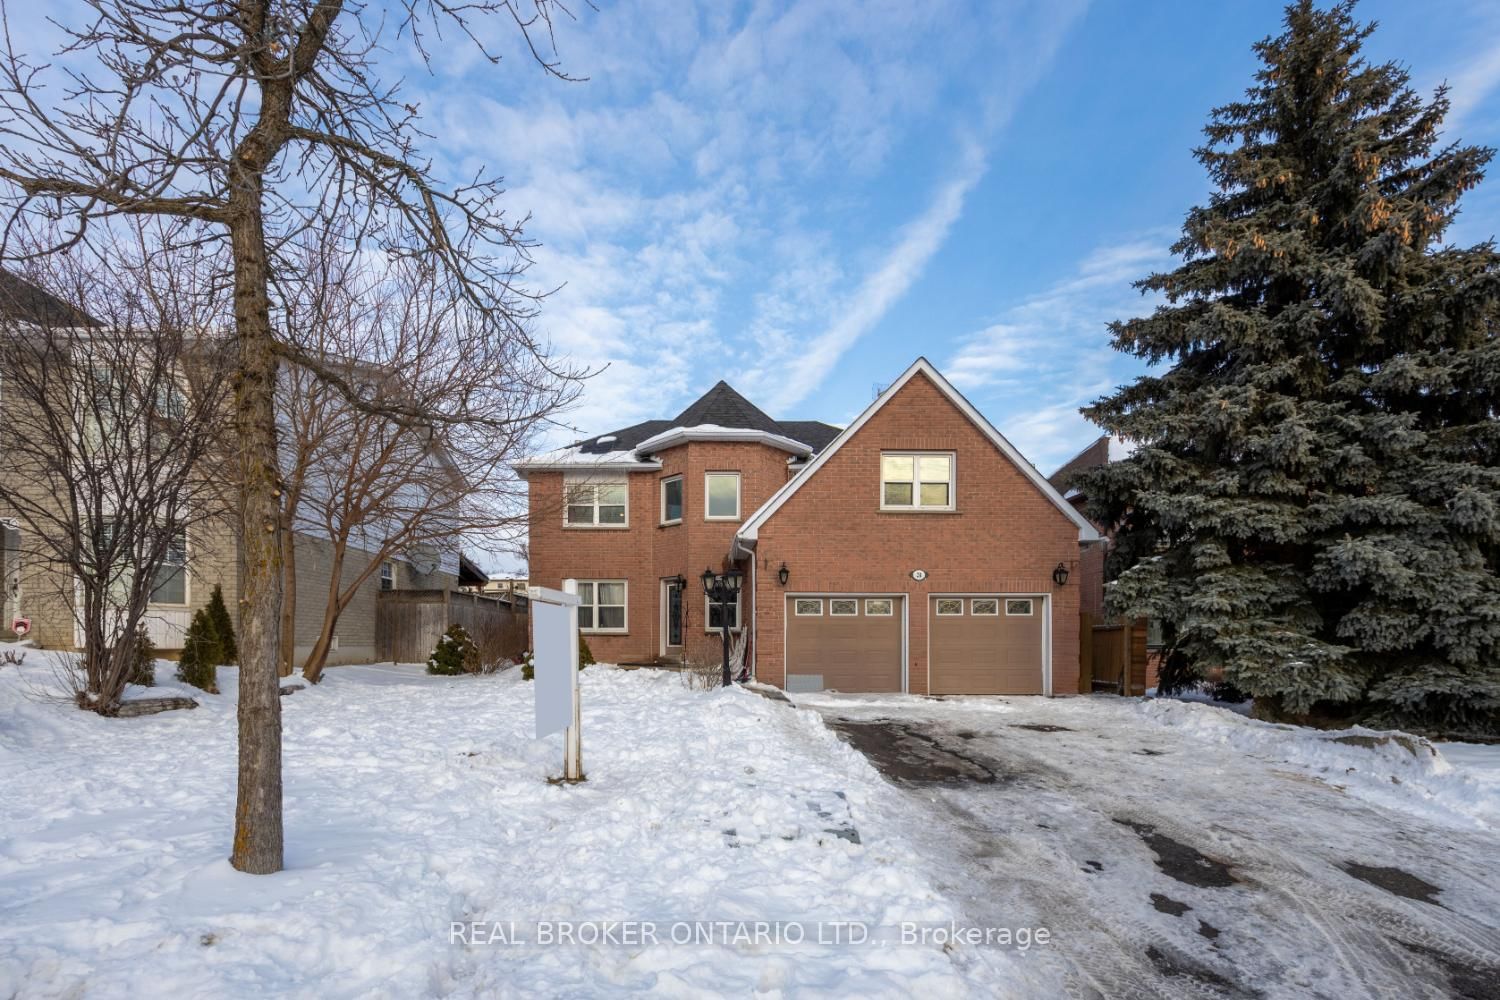
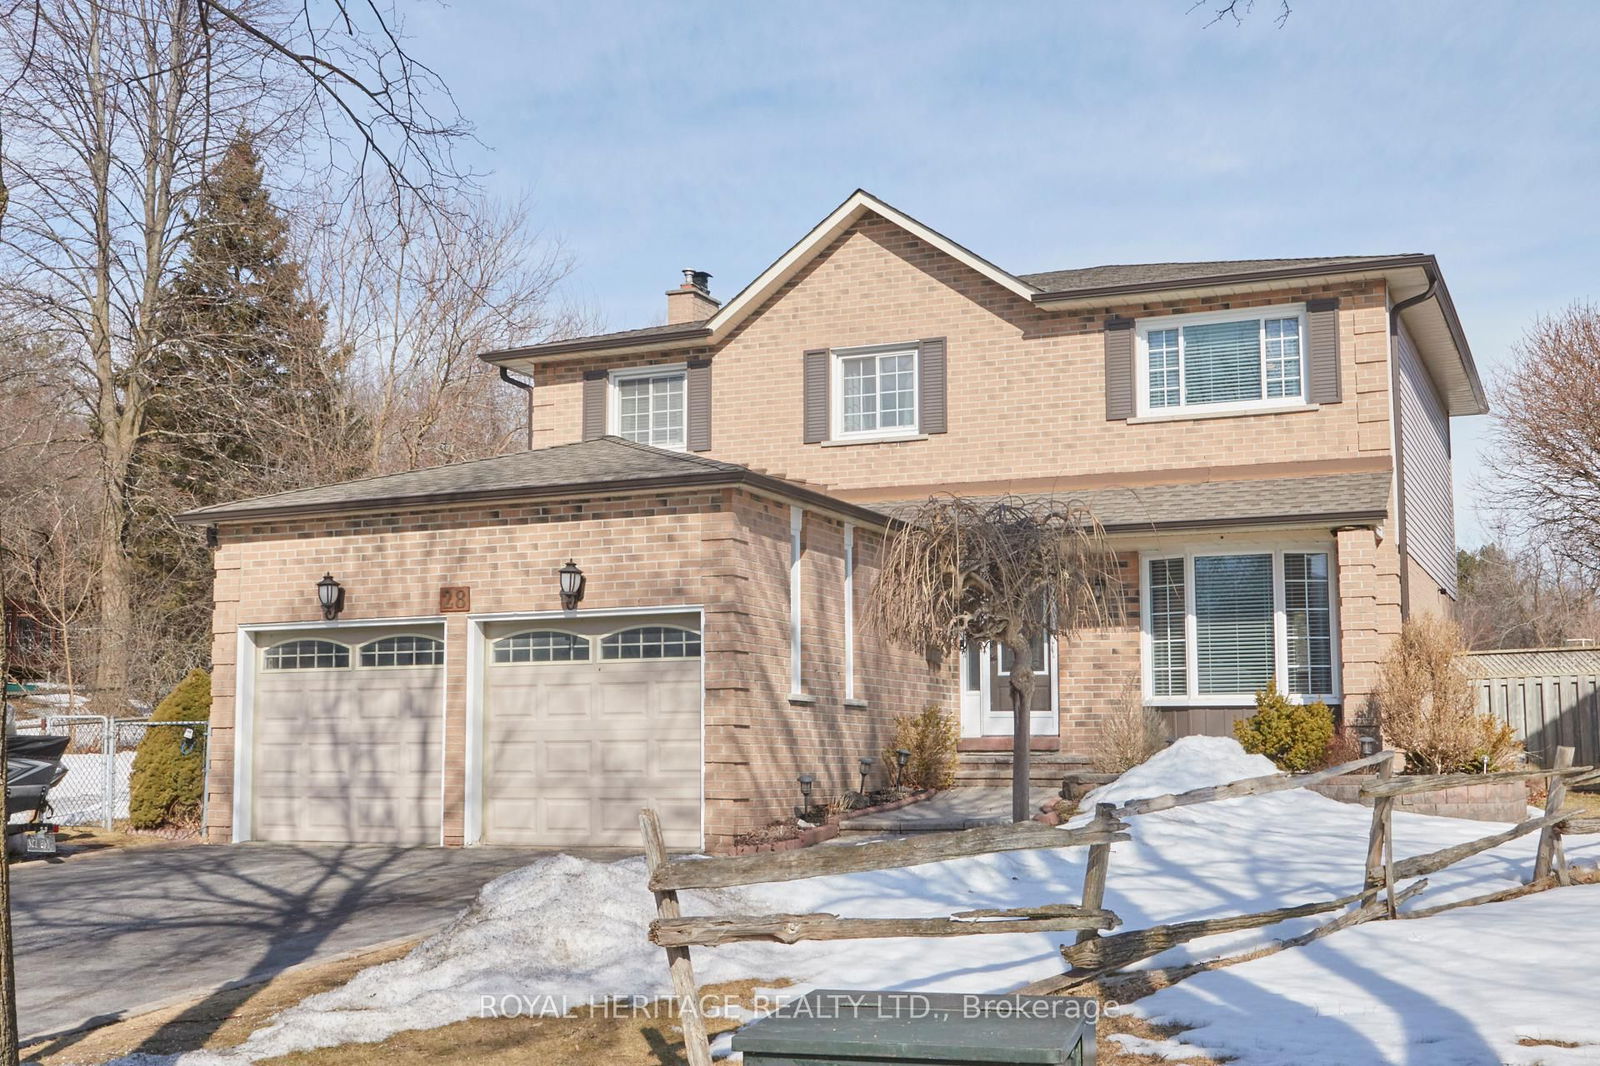
Whitby, Blue Grass Meadows, L1N 6P6
$1,099,900
Listed by RE/MAX JAZZ INC..
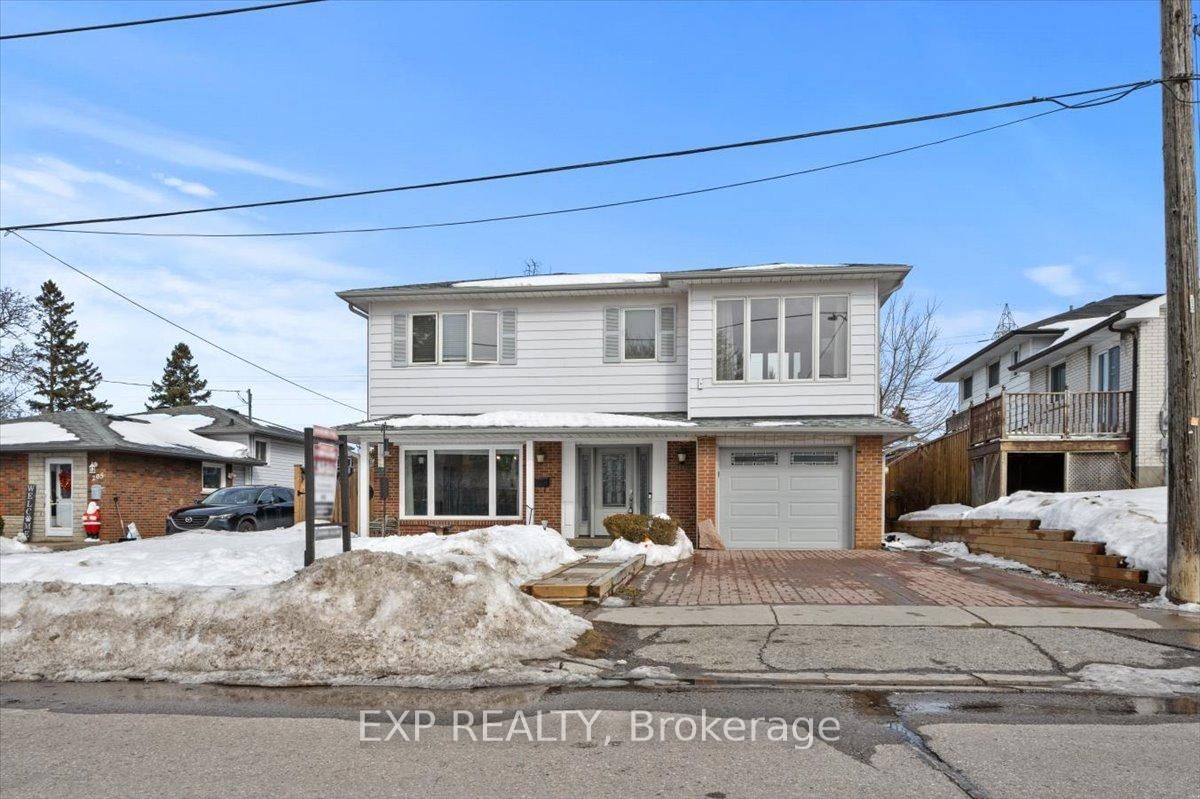
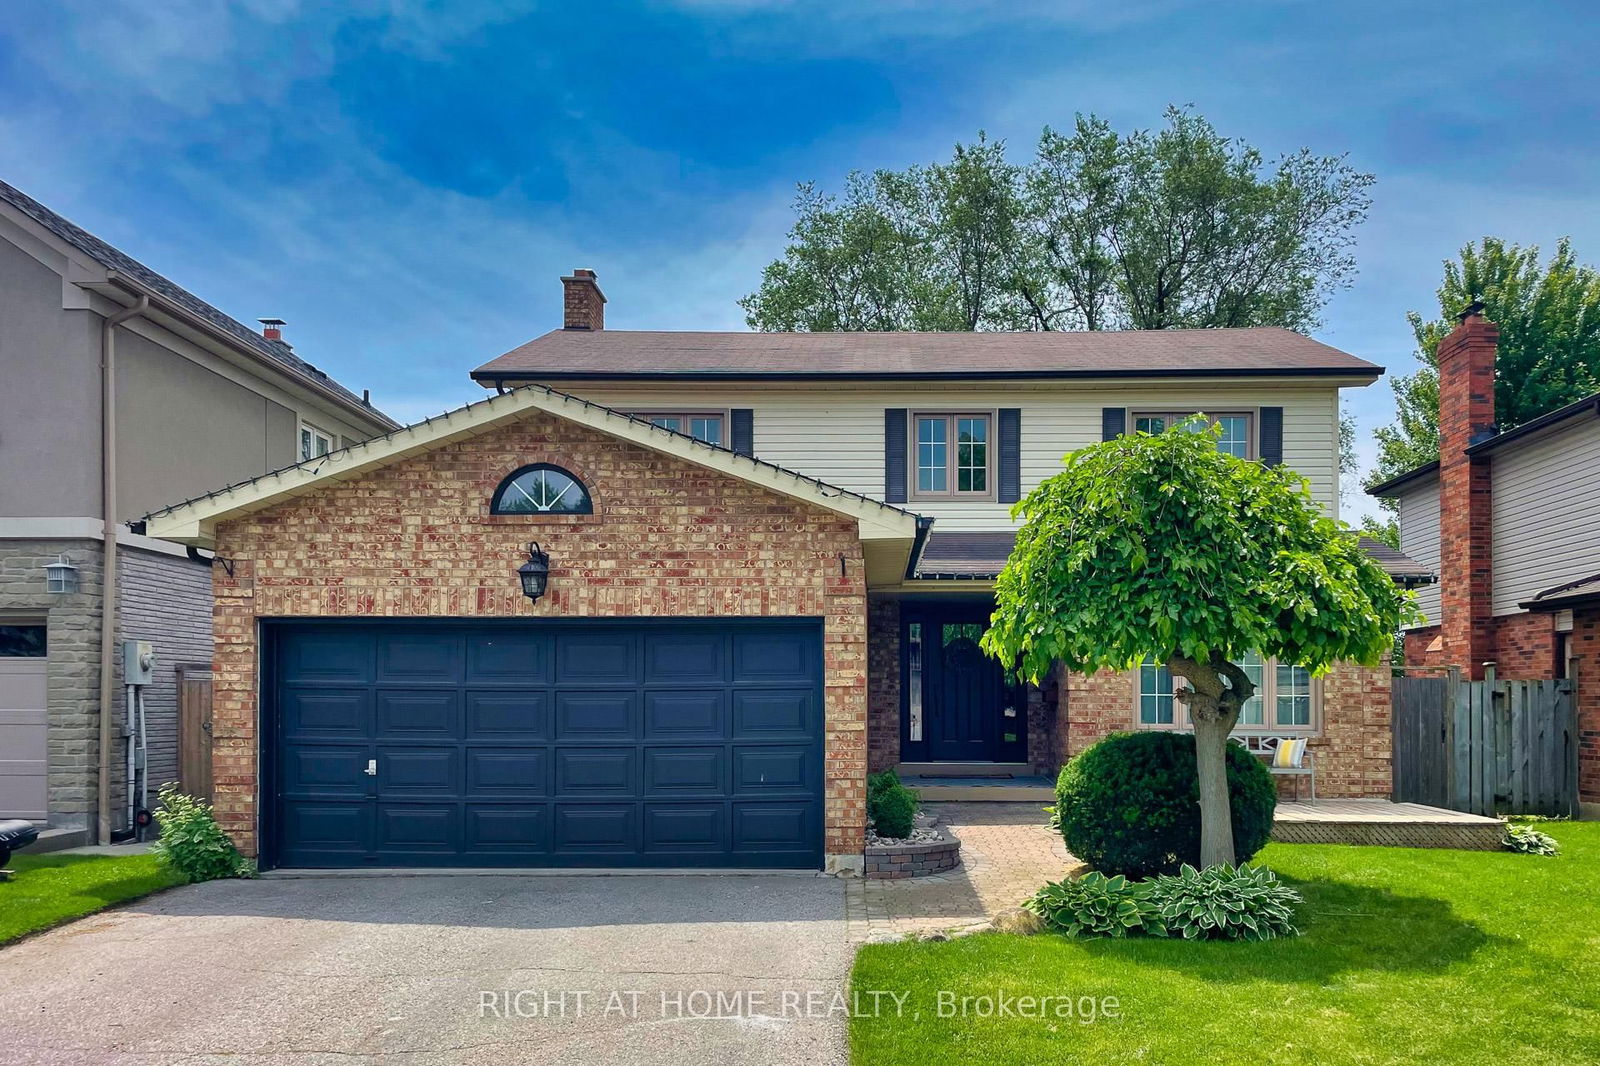
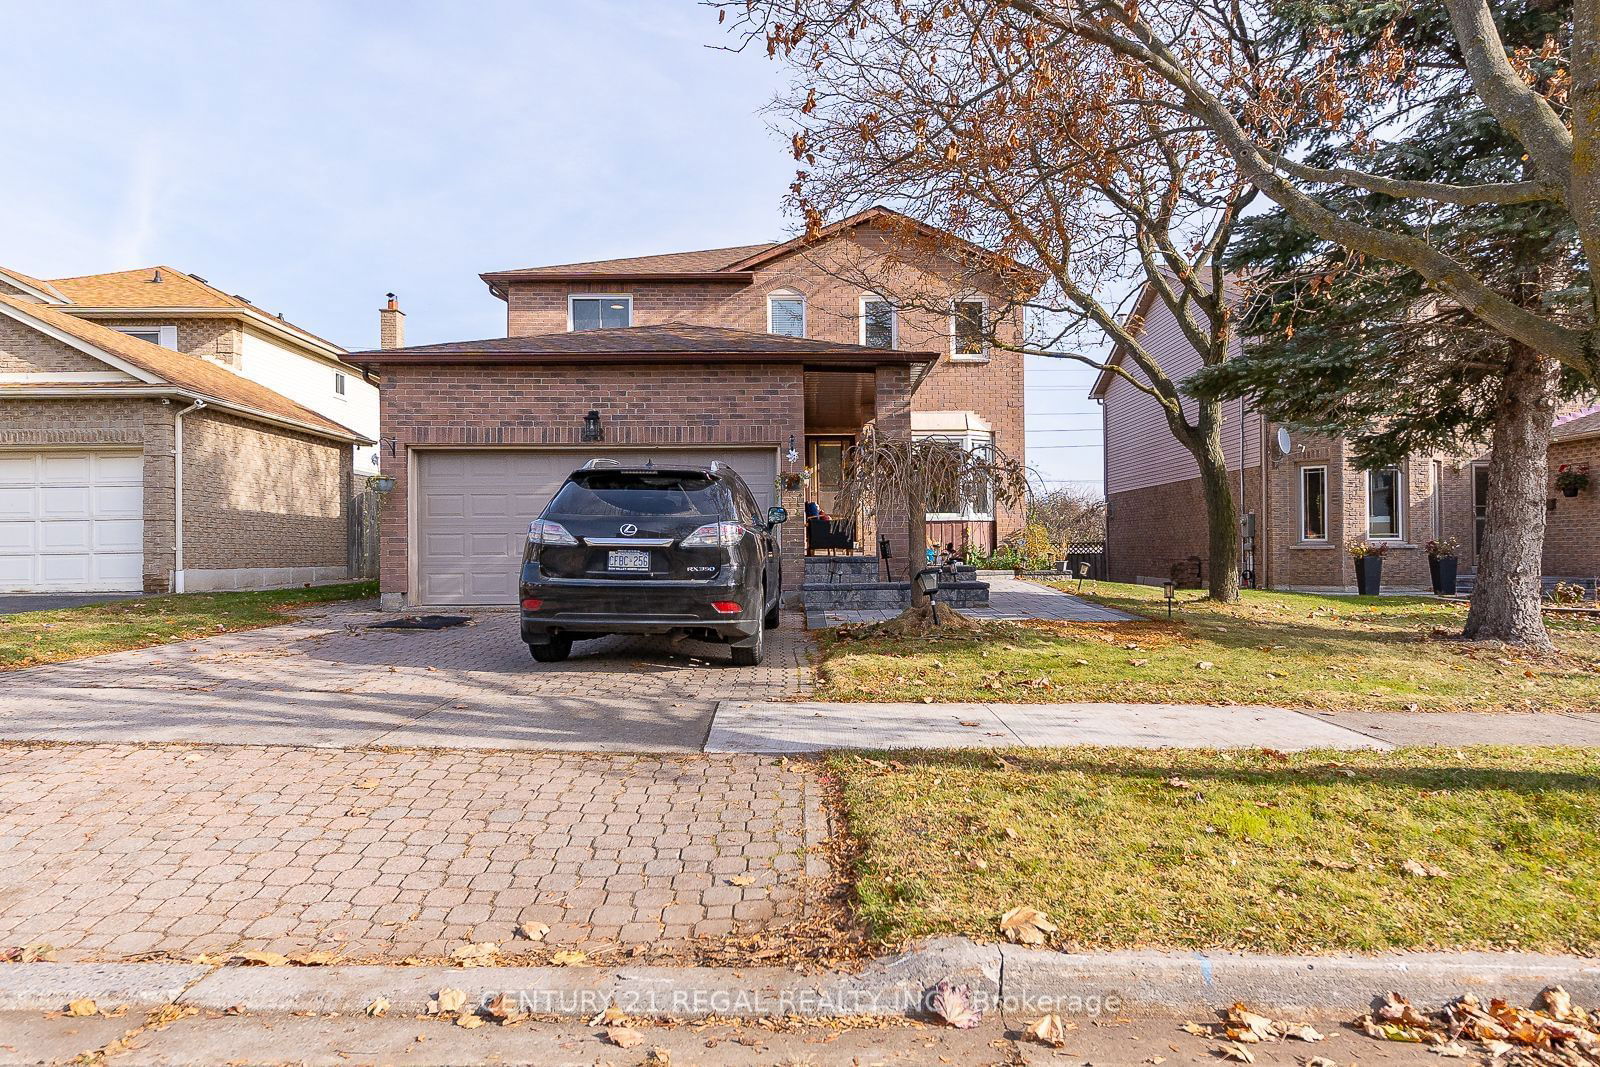
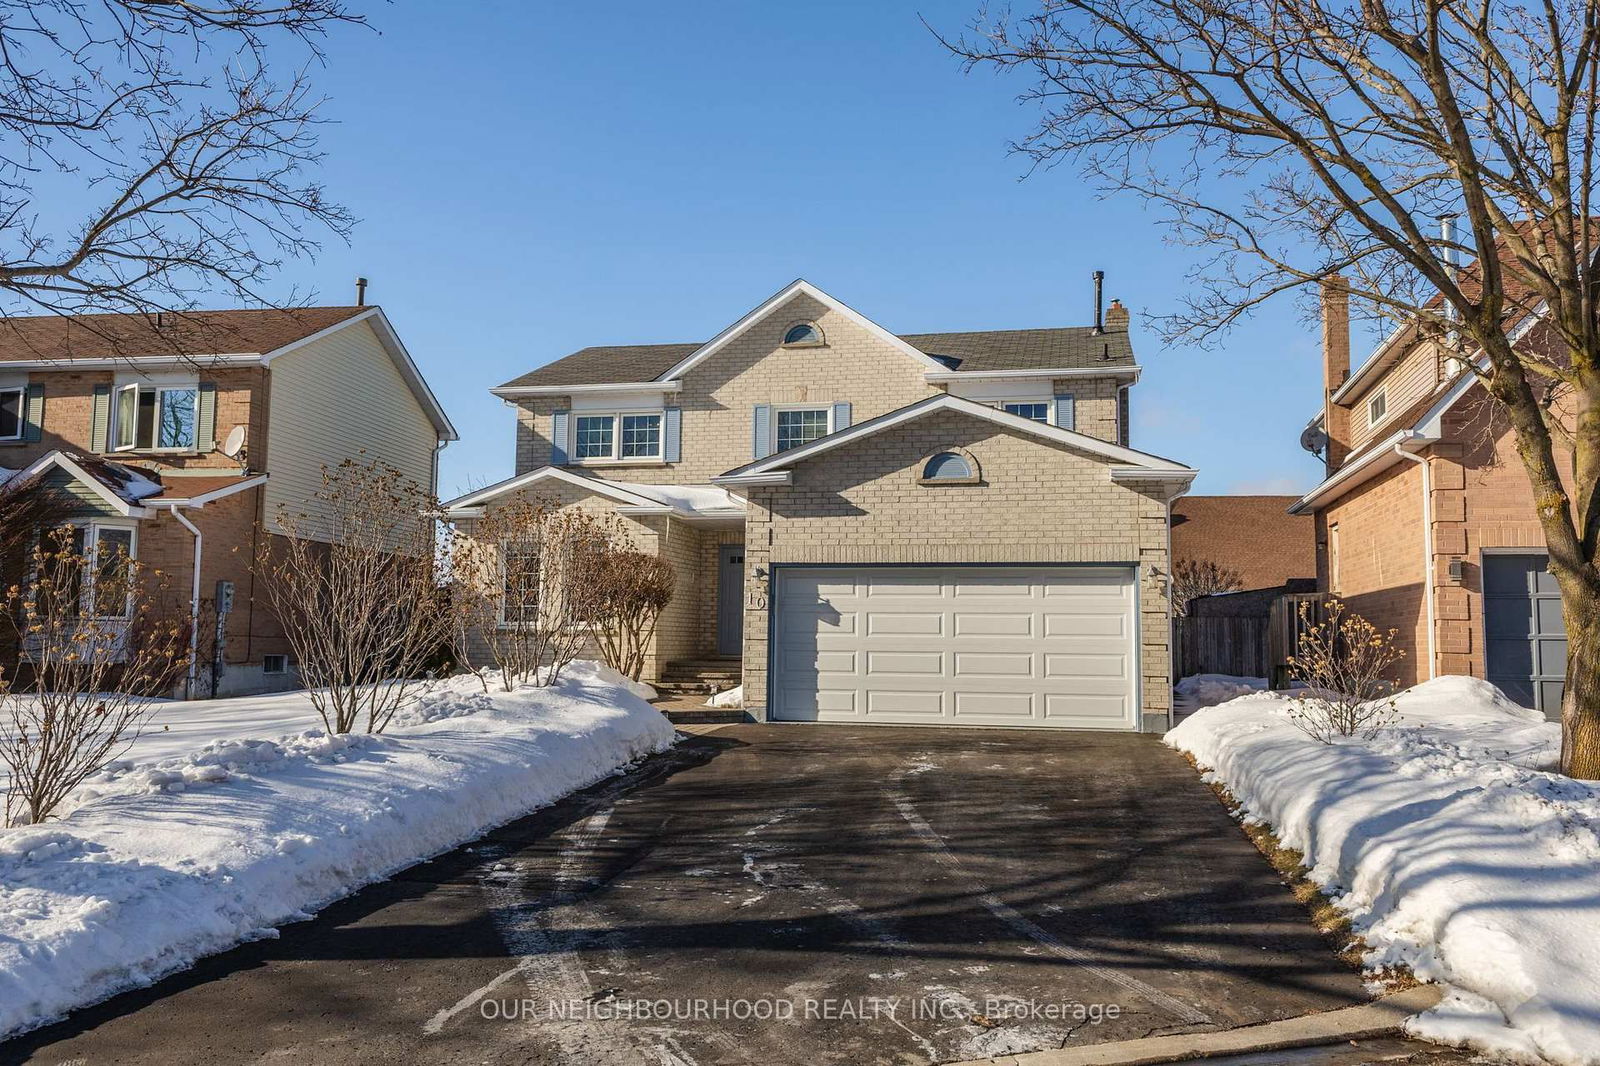
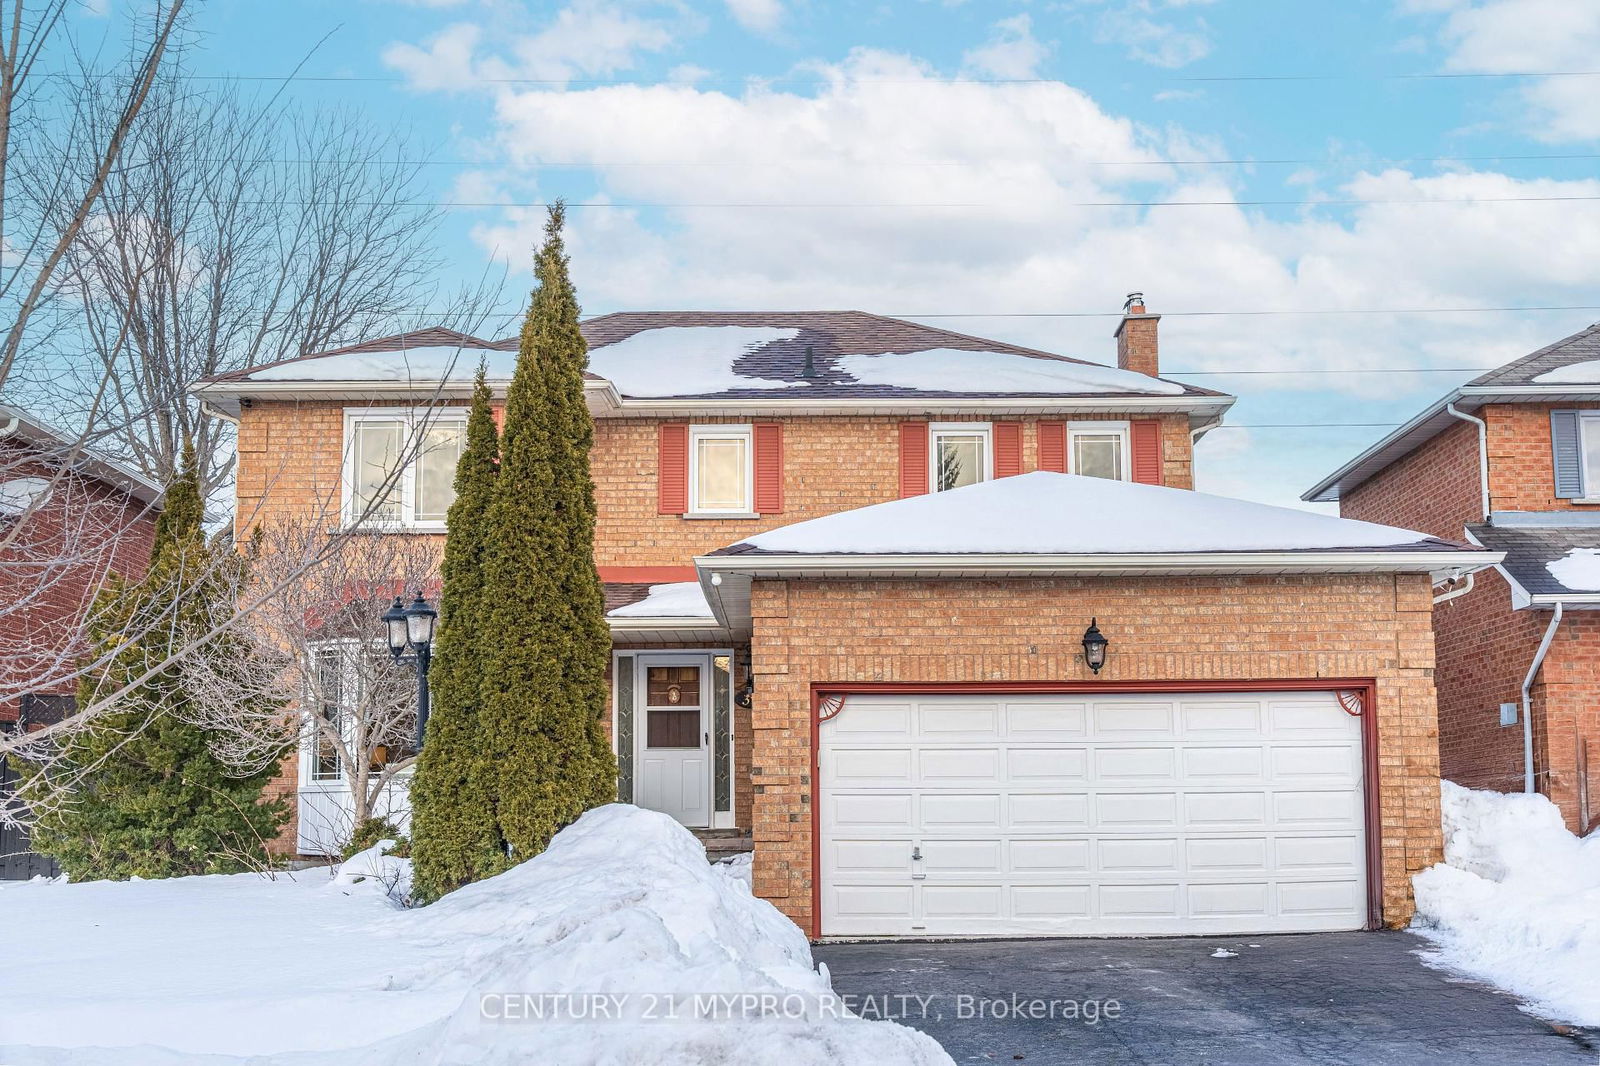
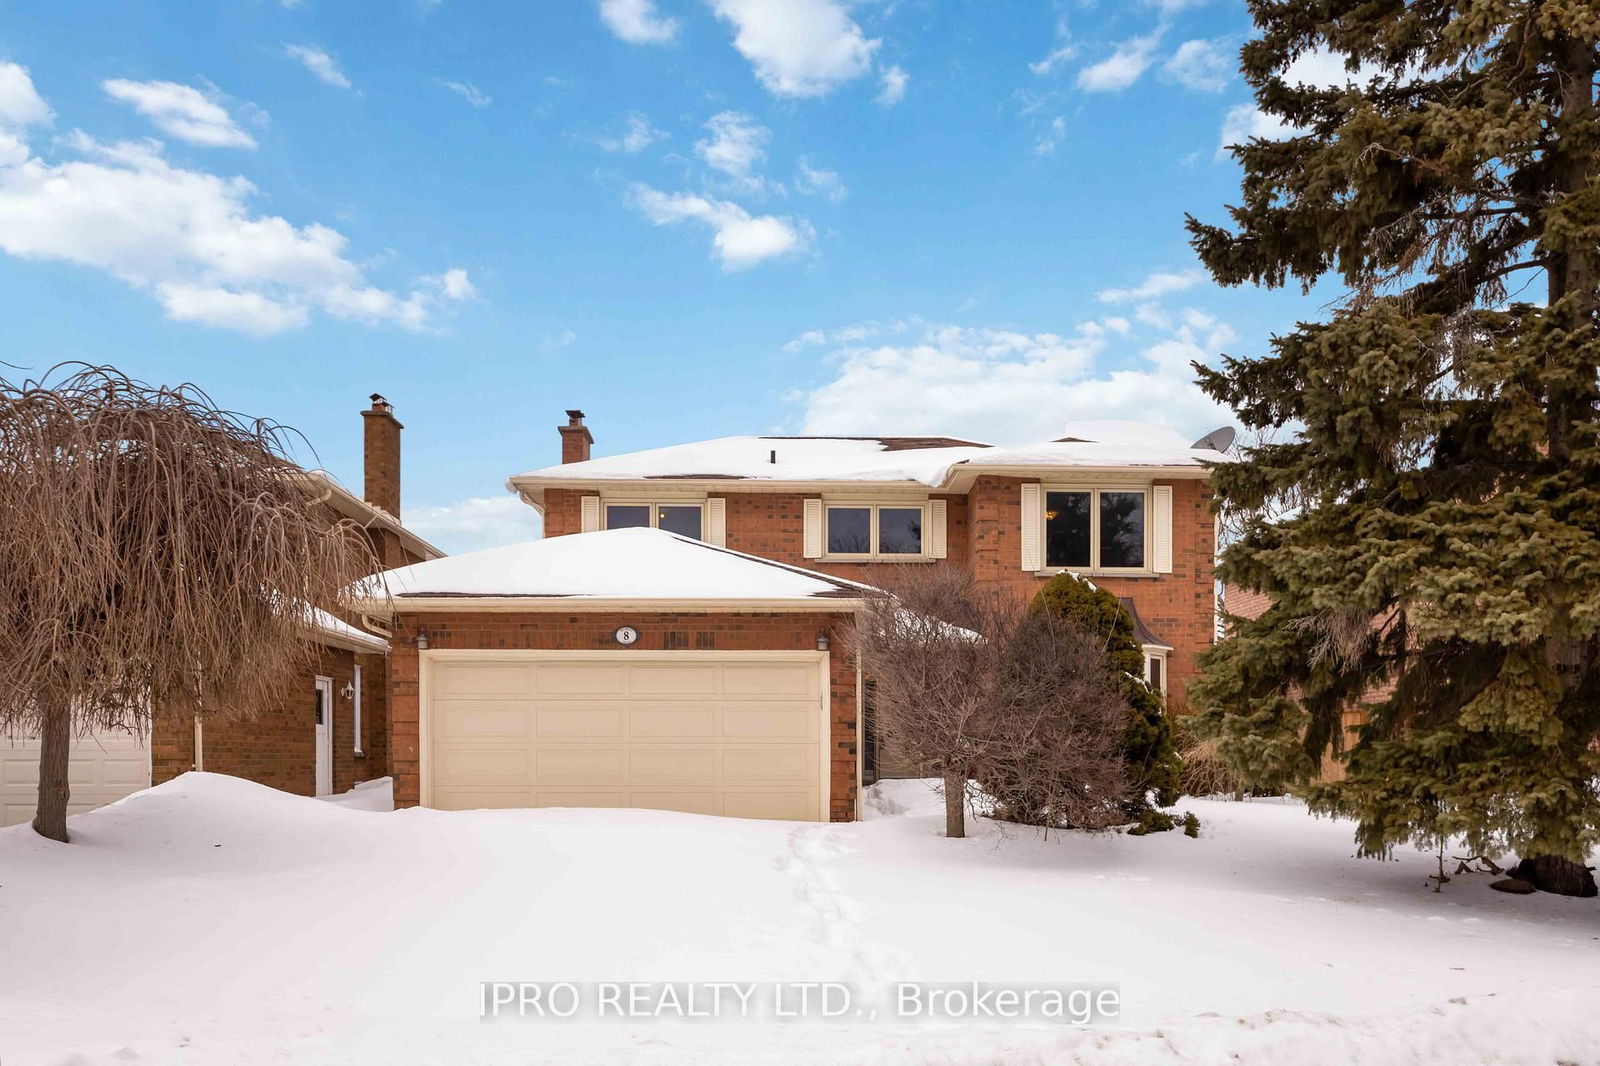
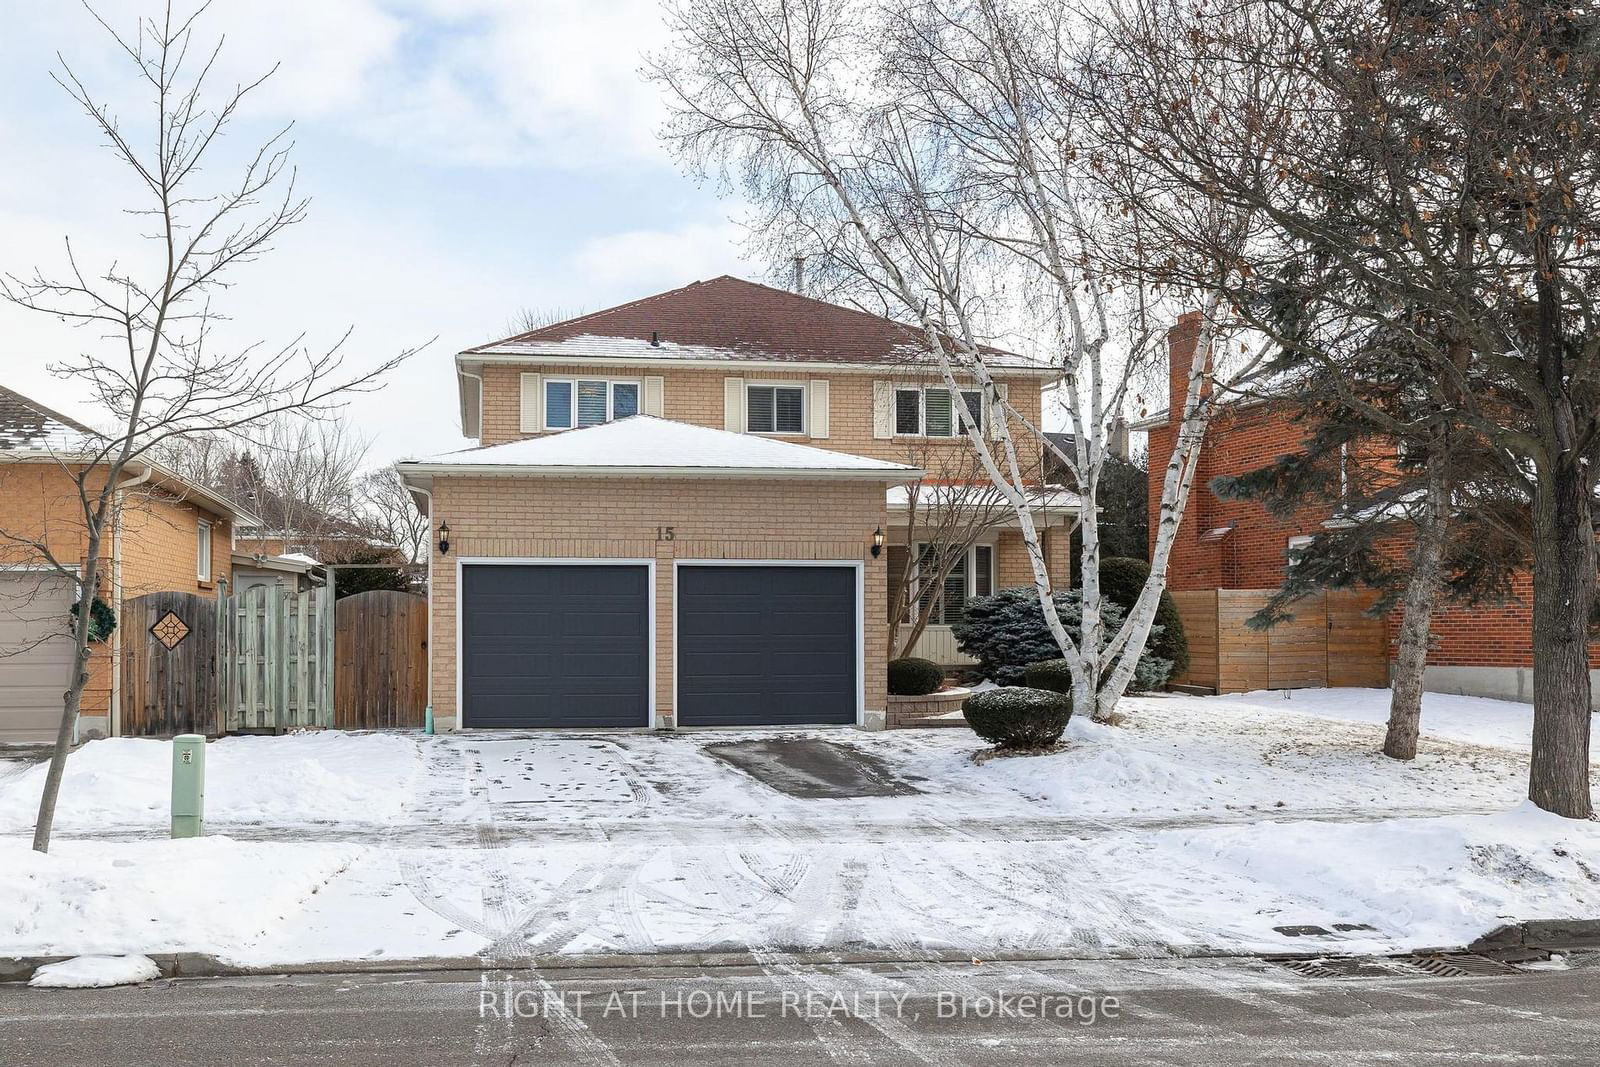
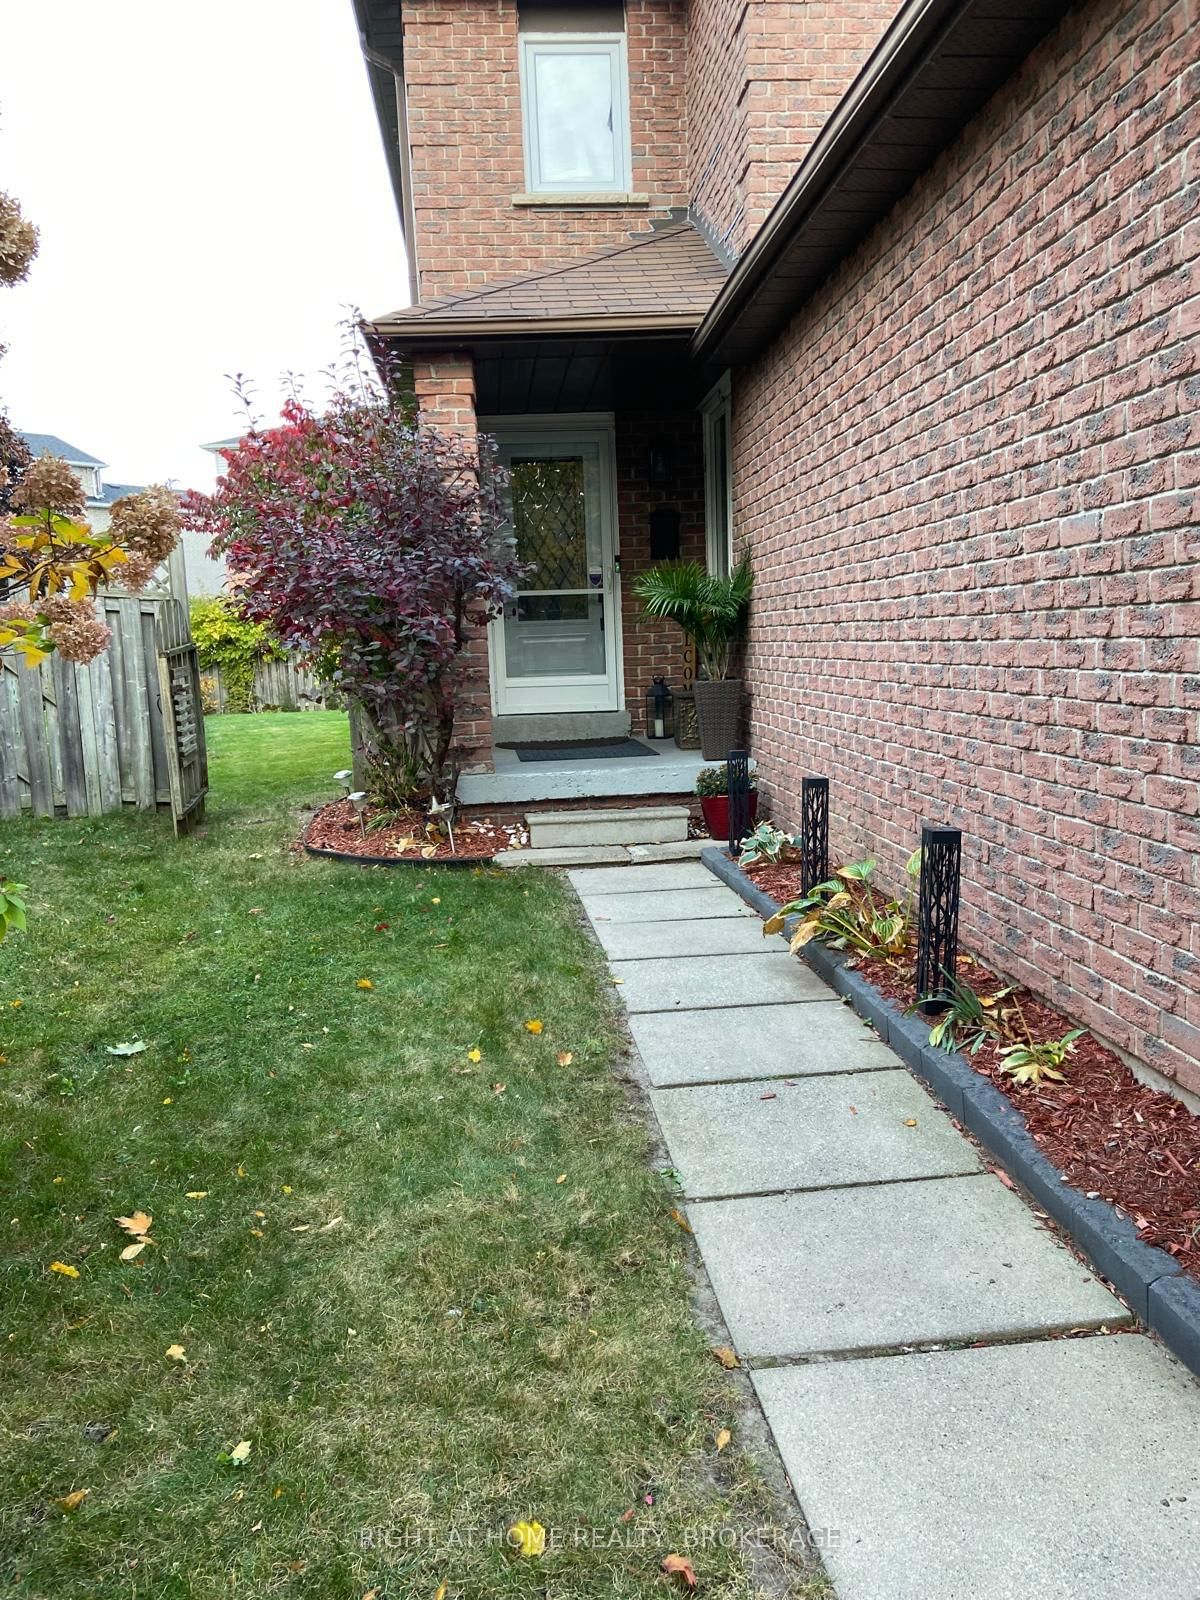
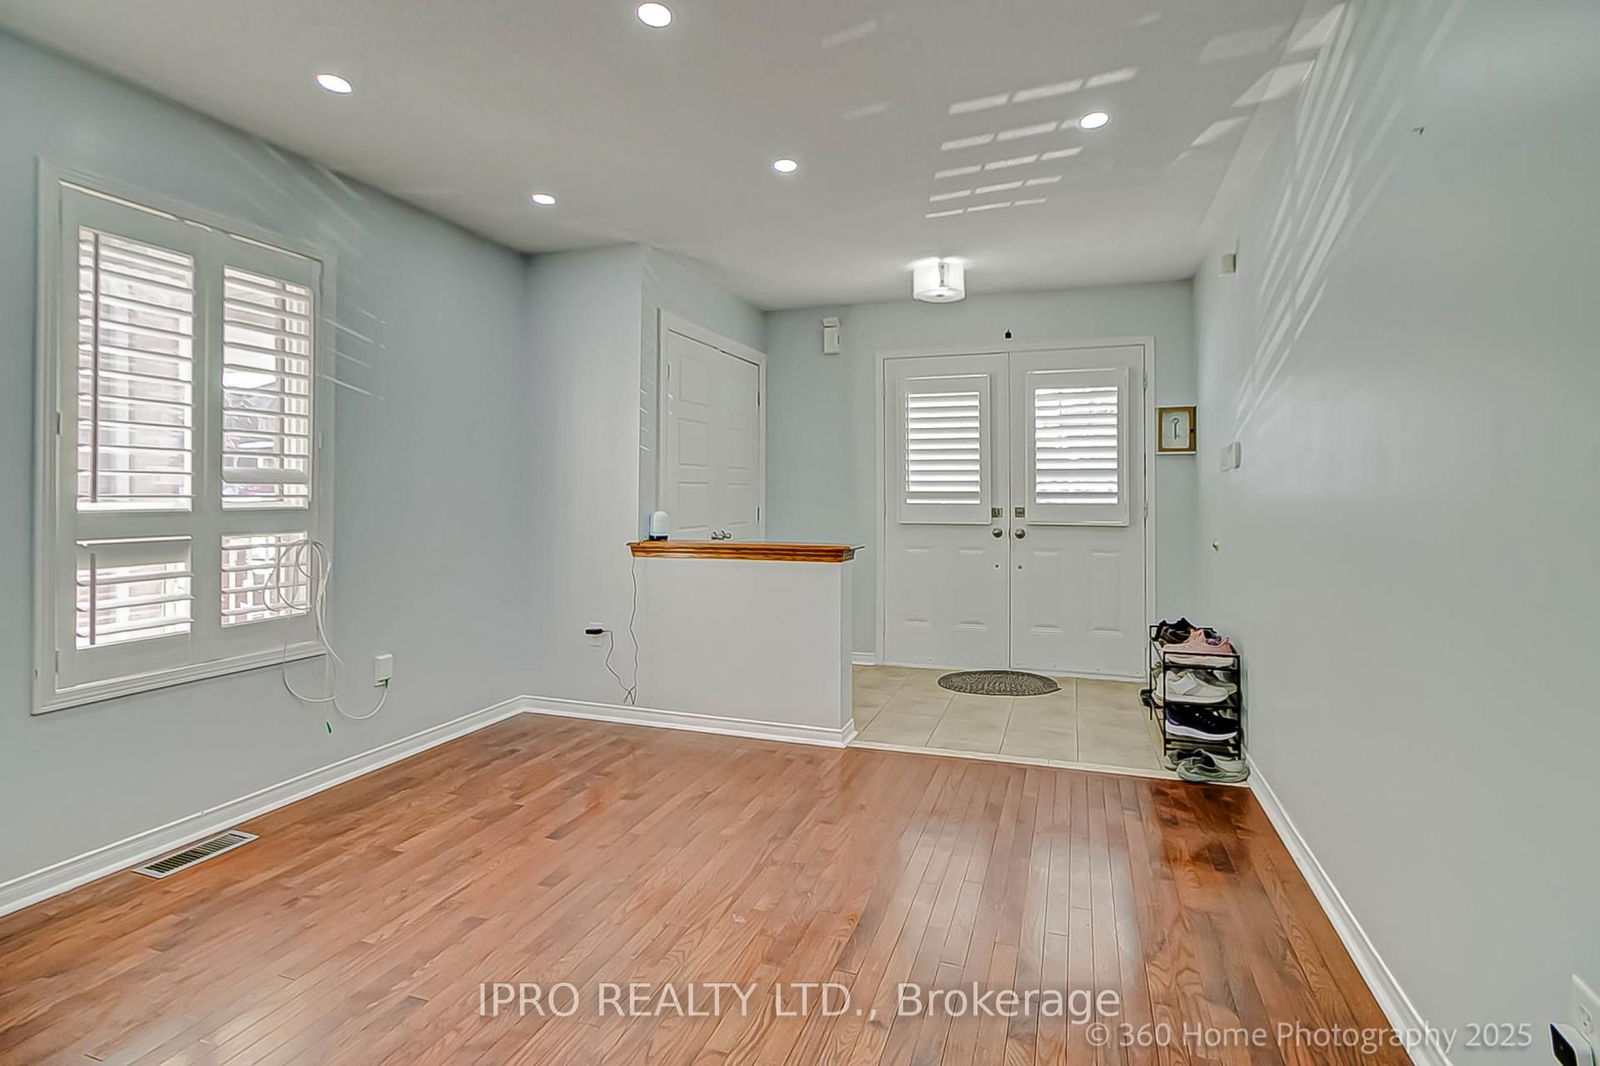
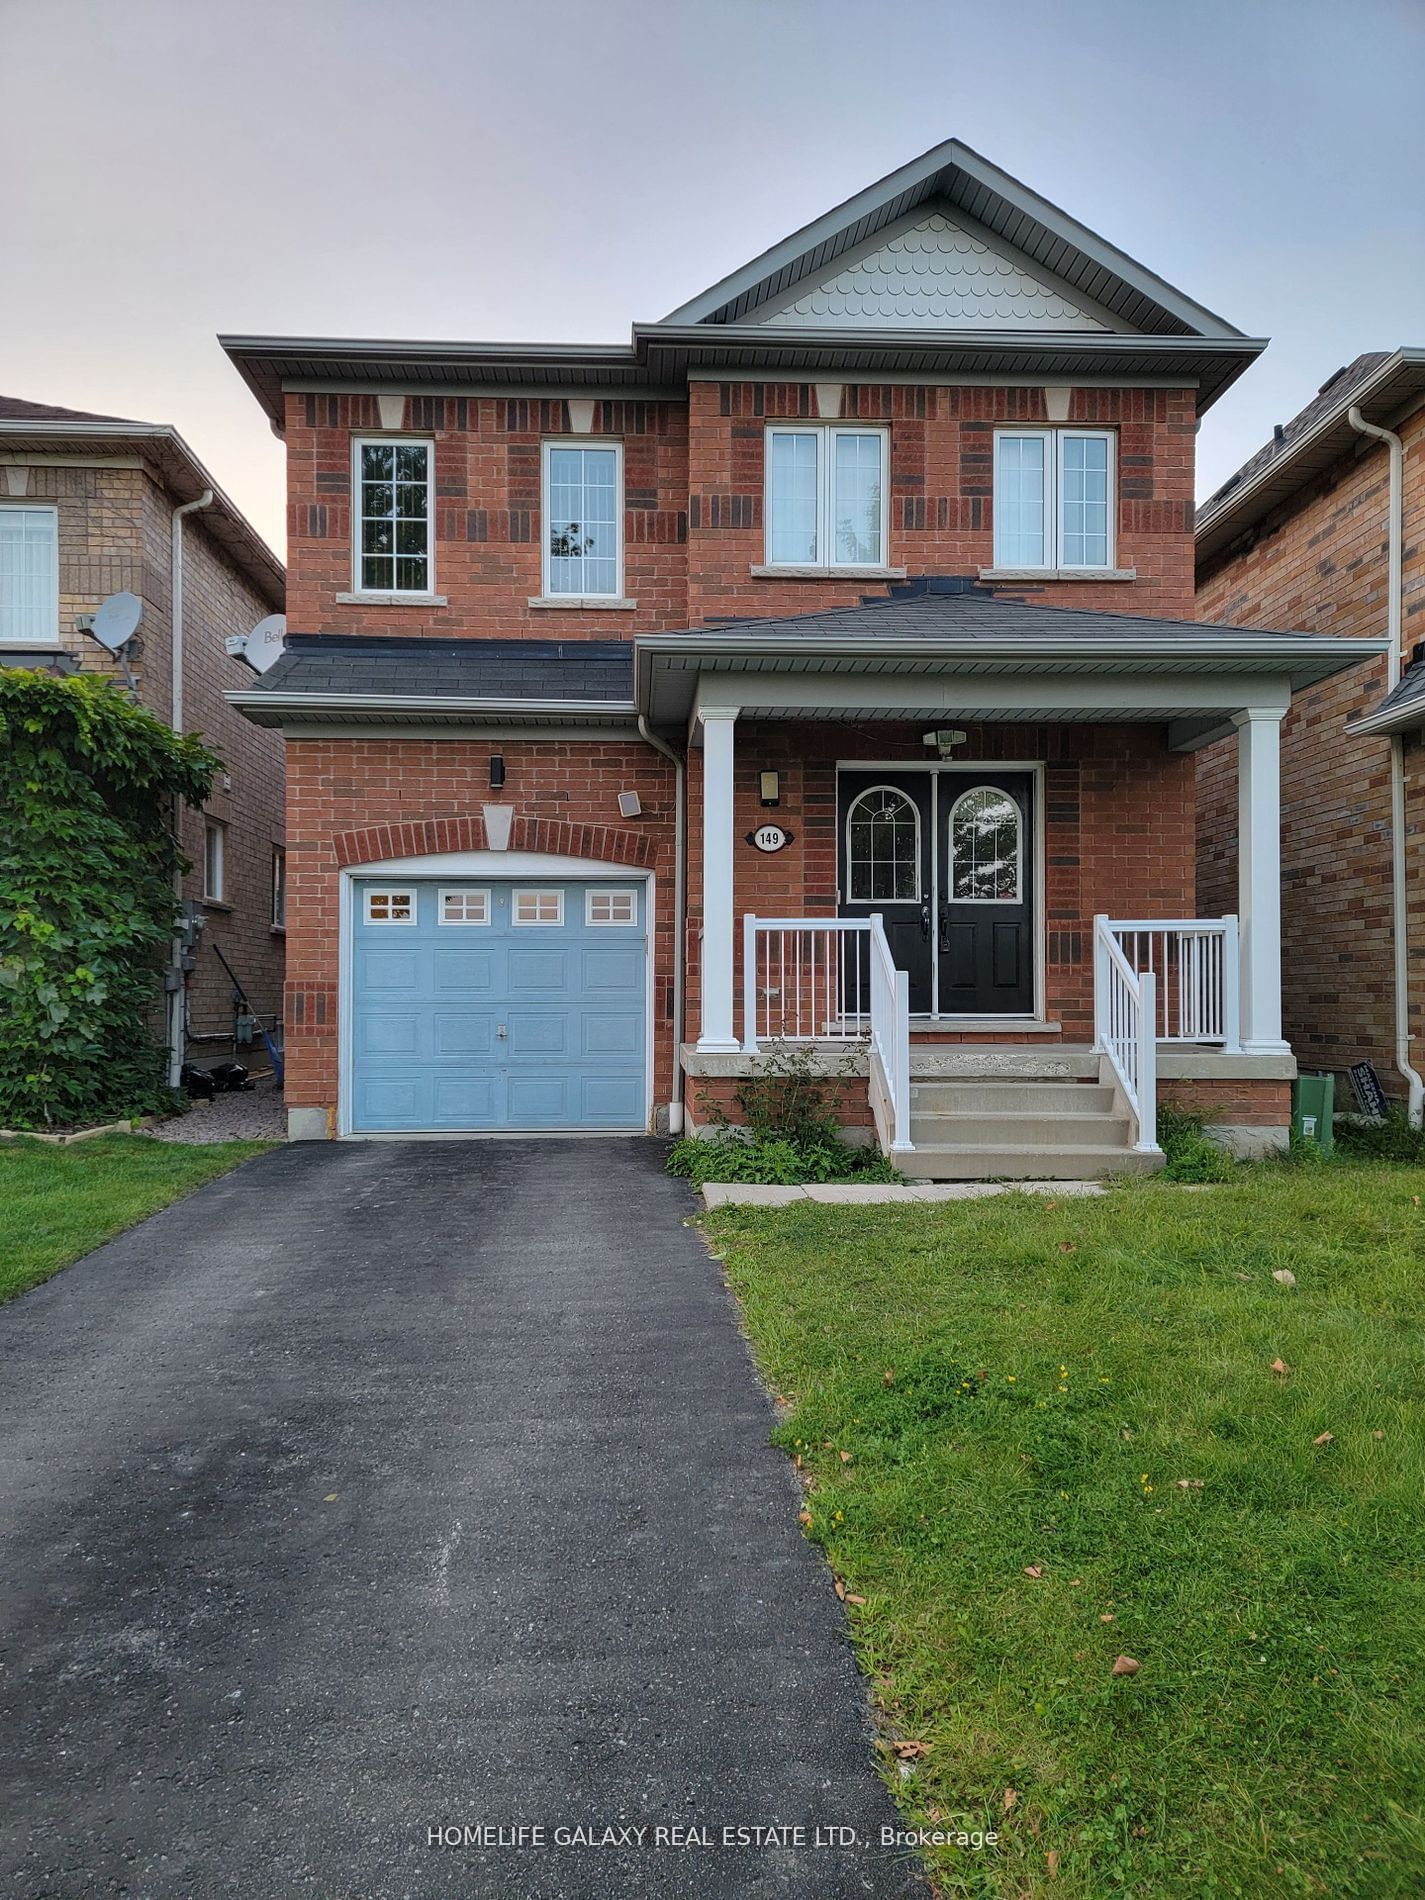
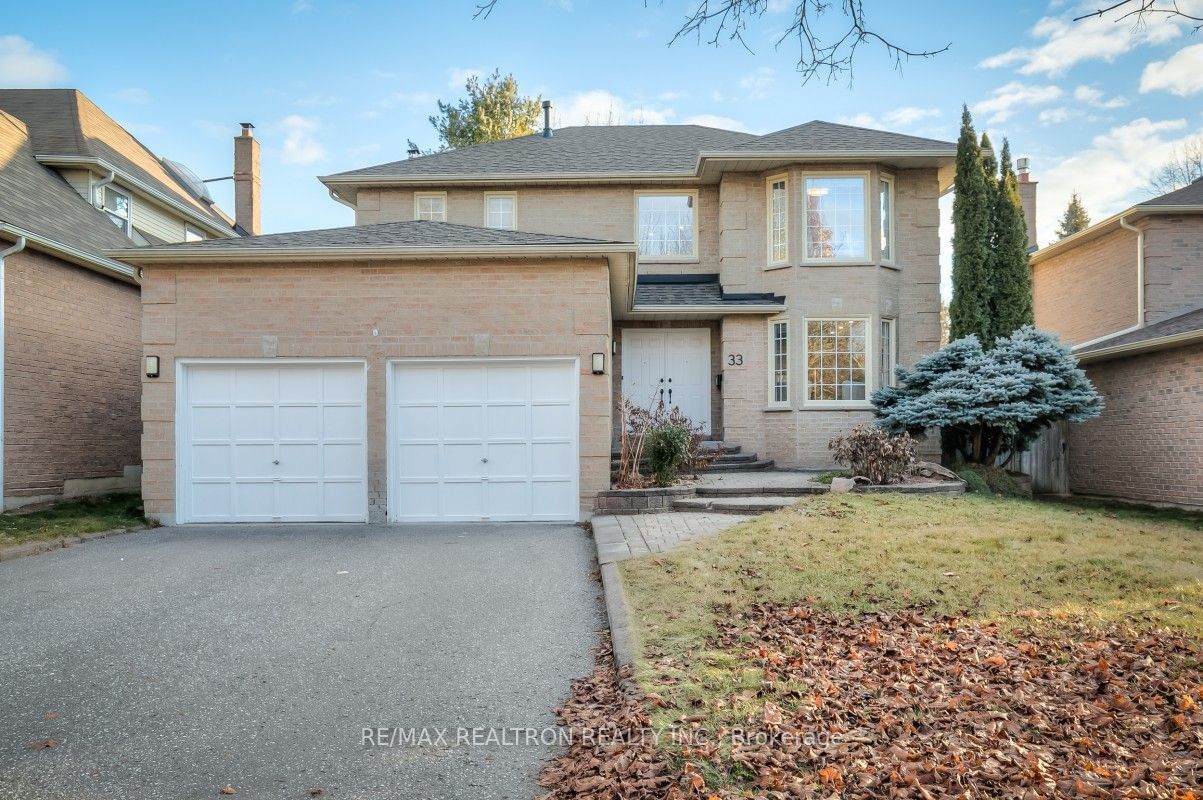
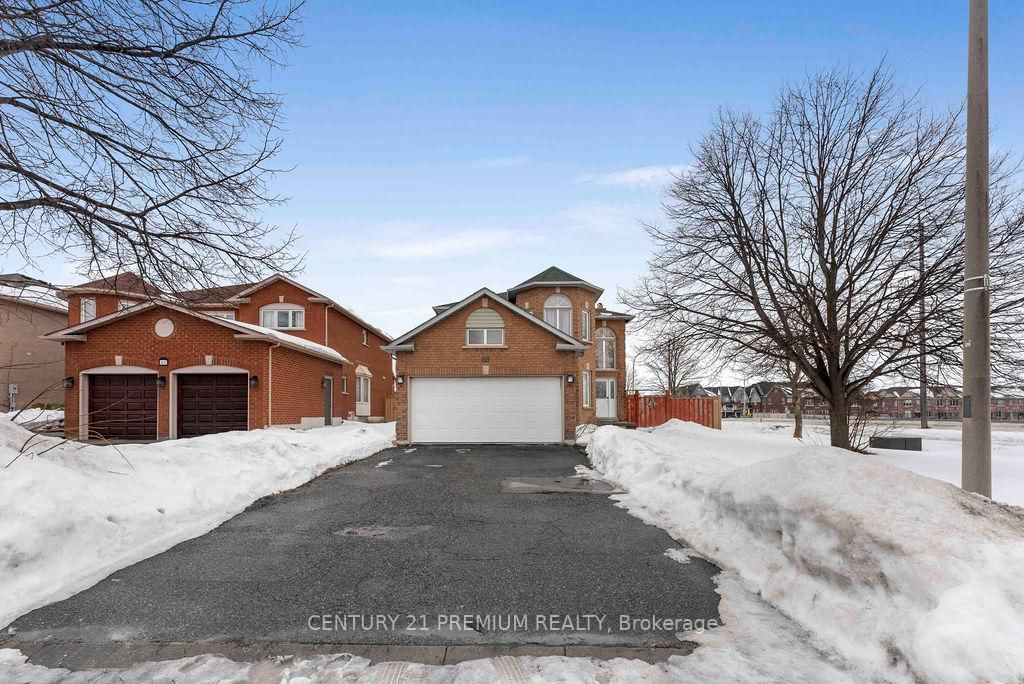
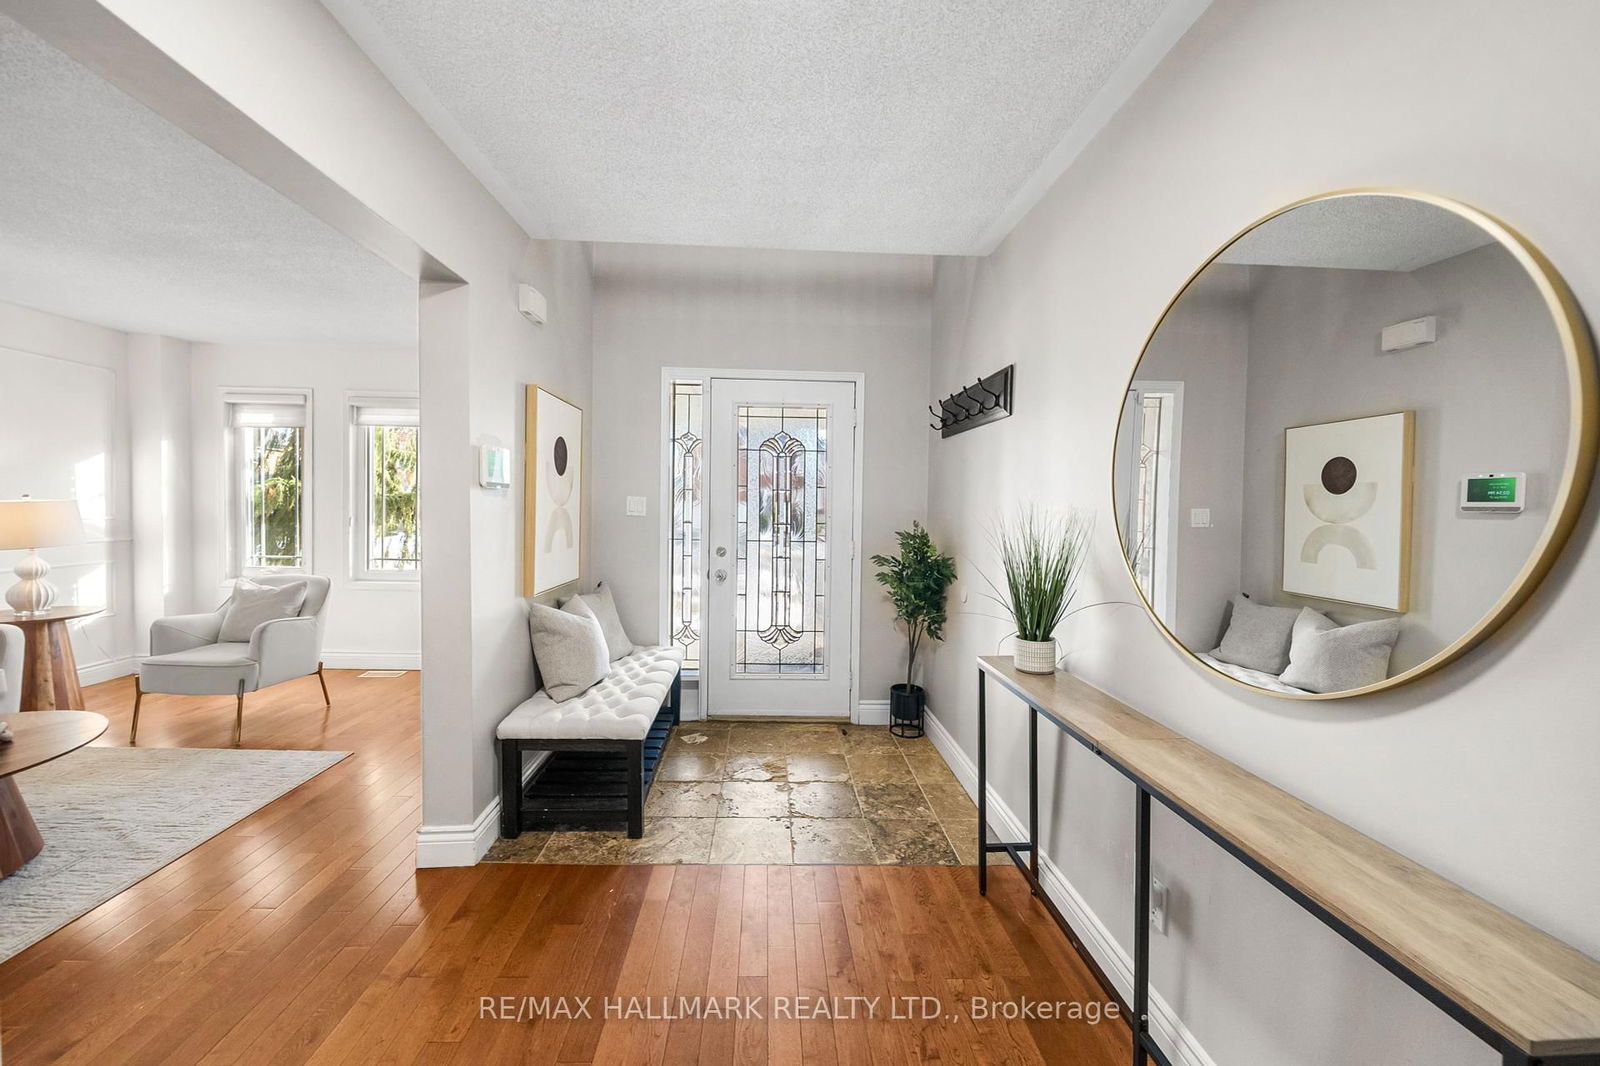
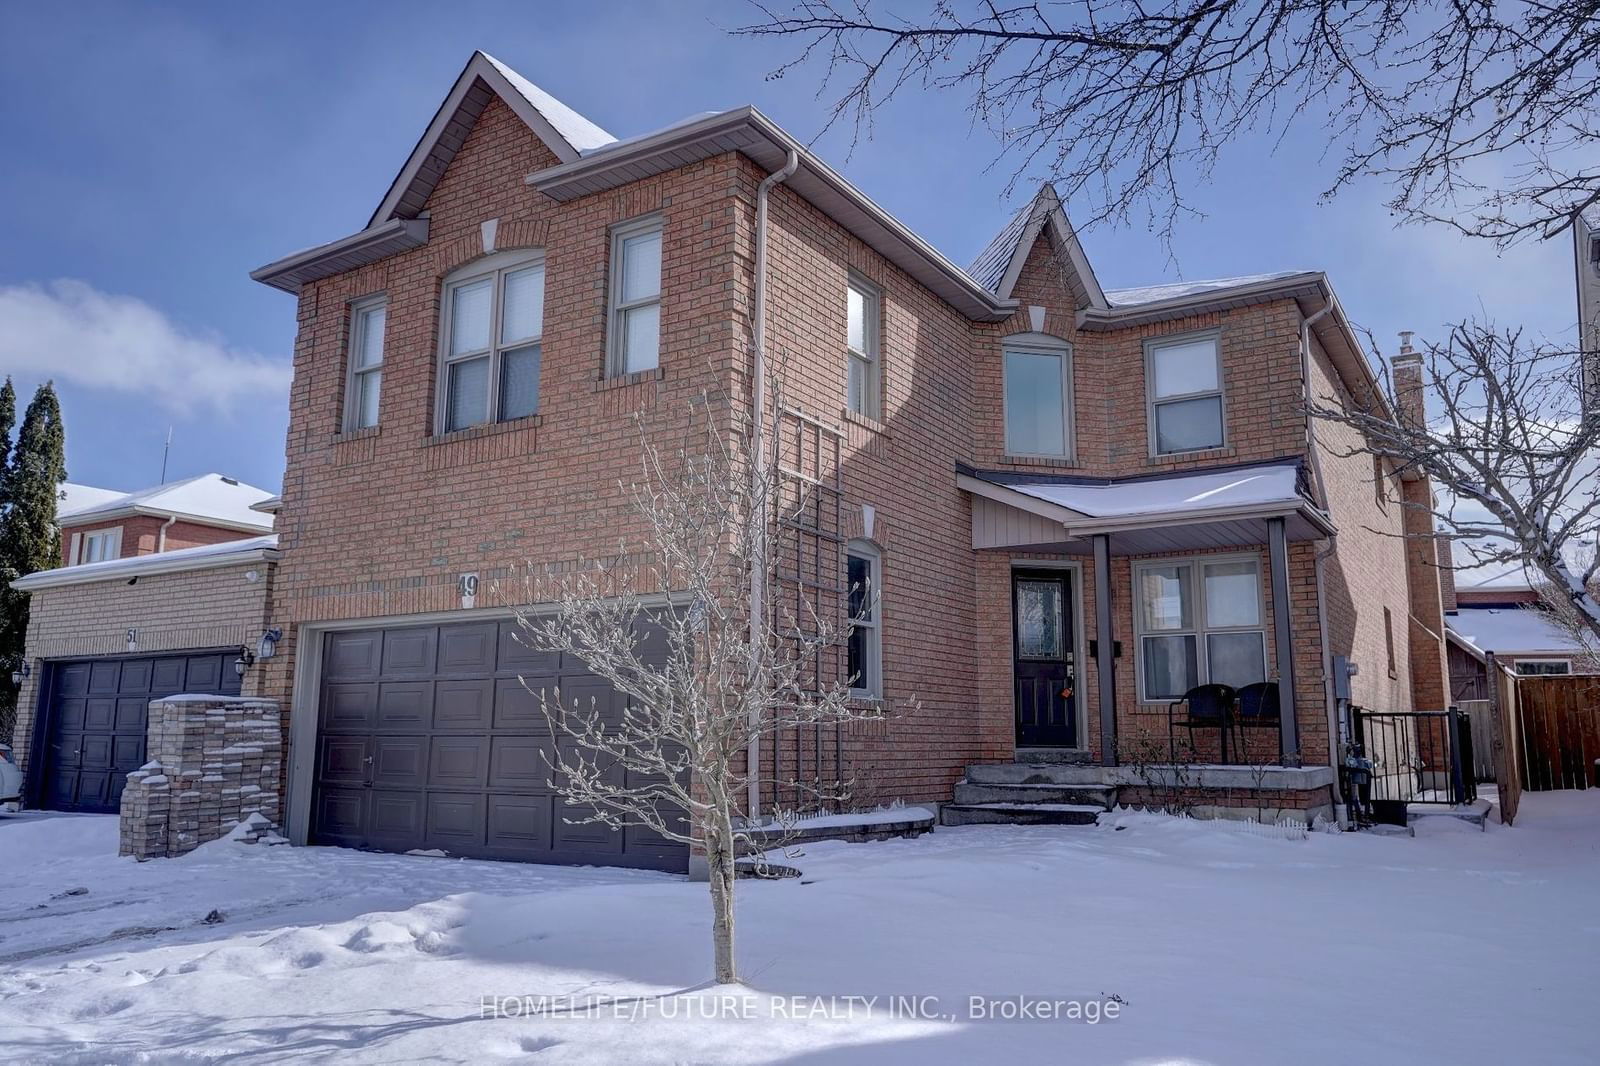
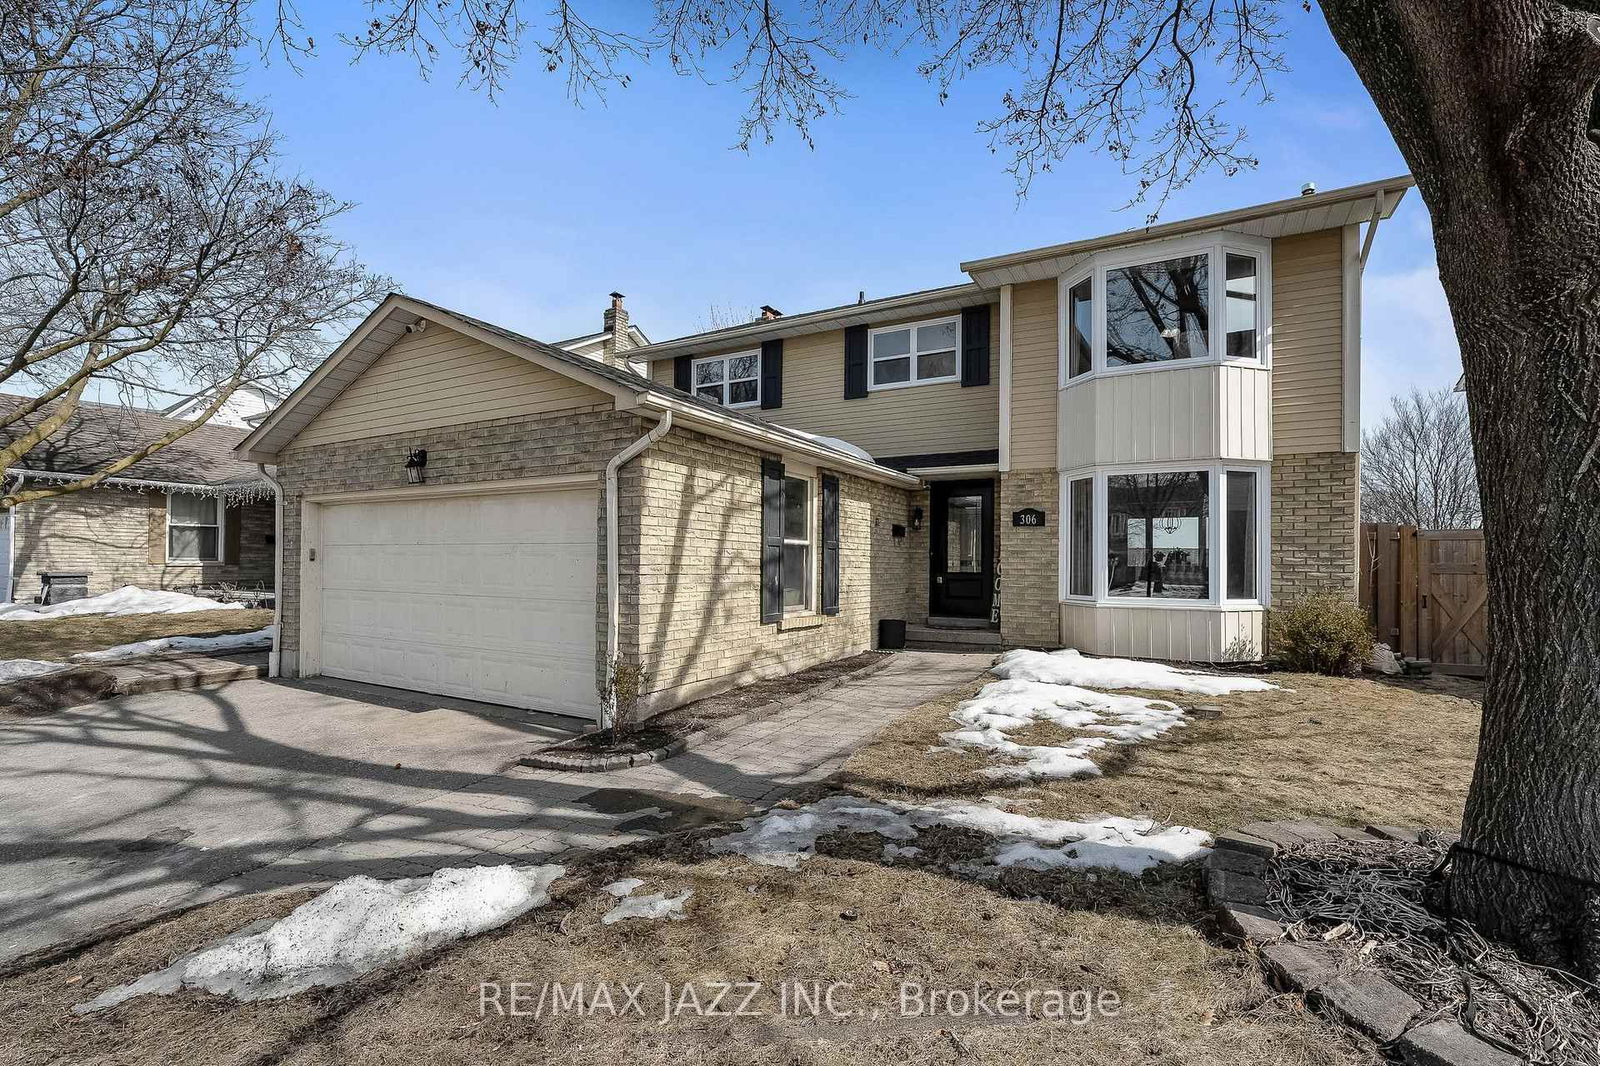
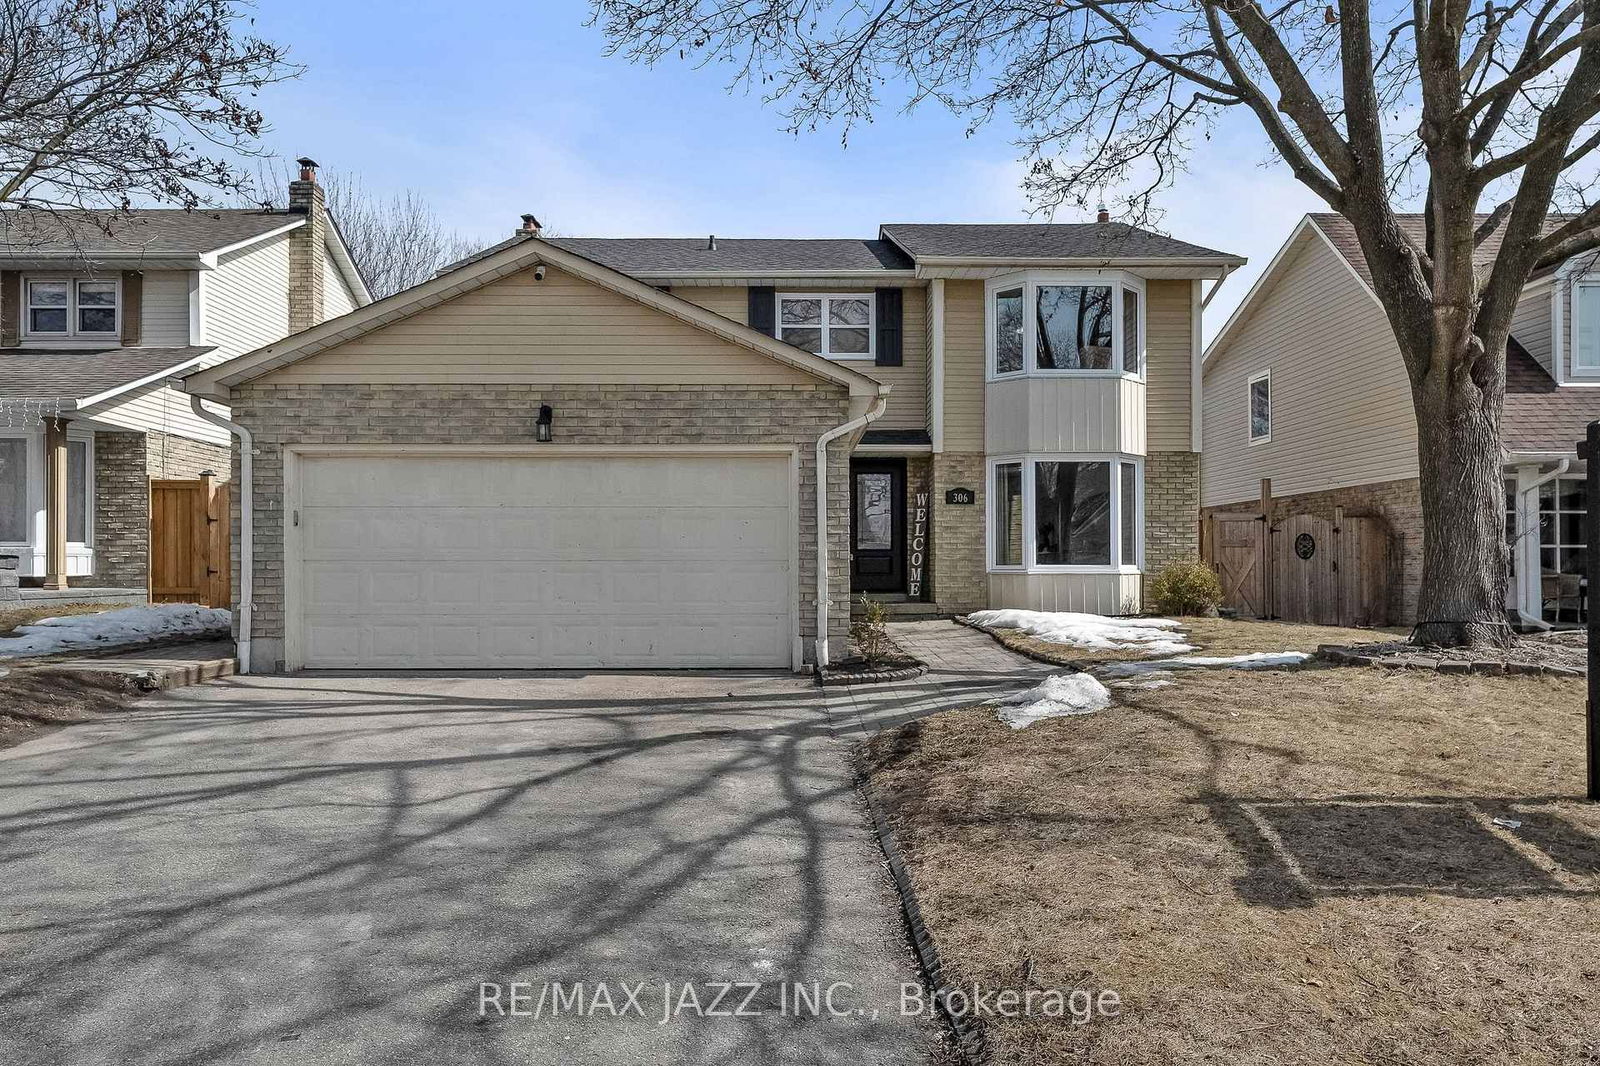
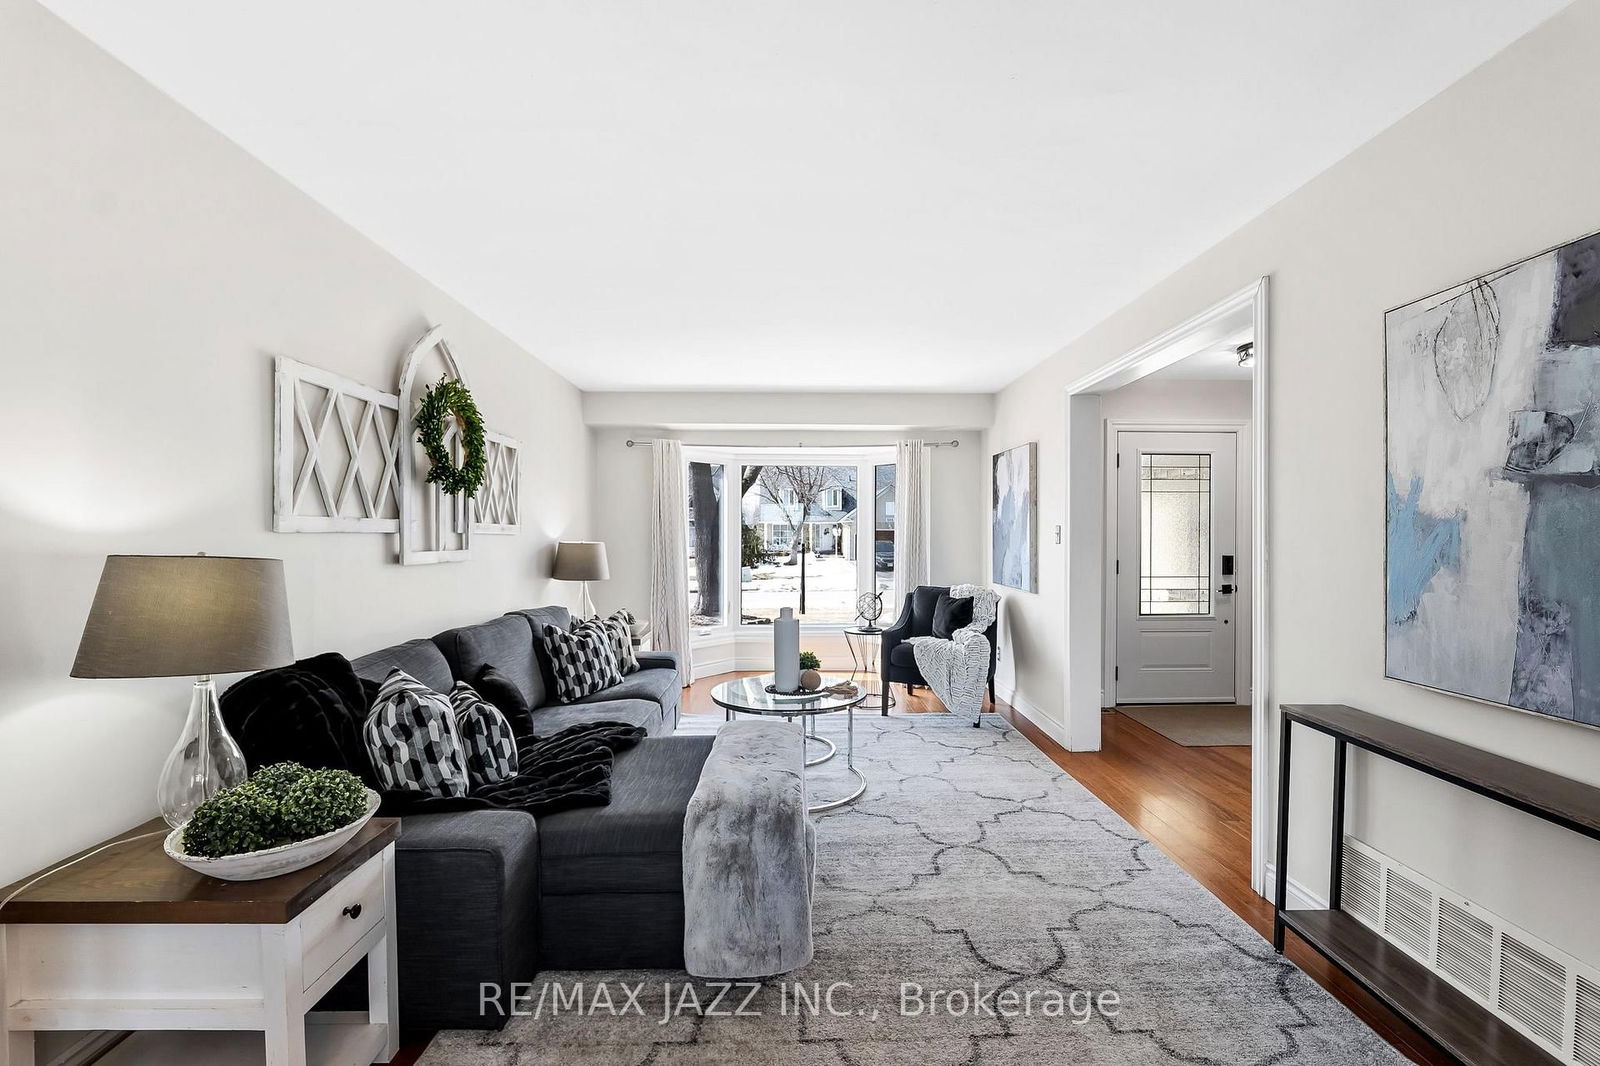
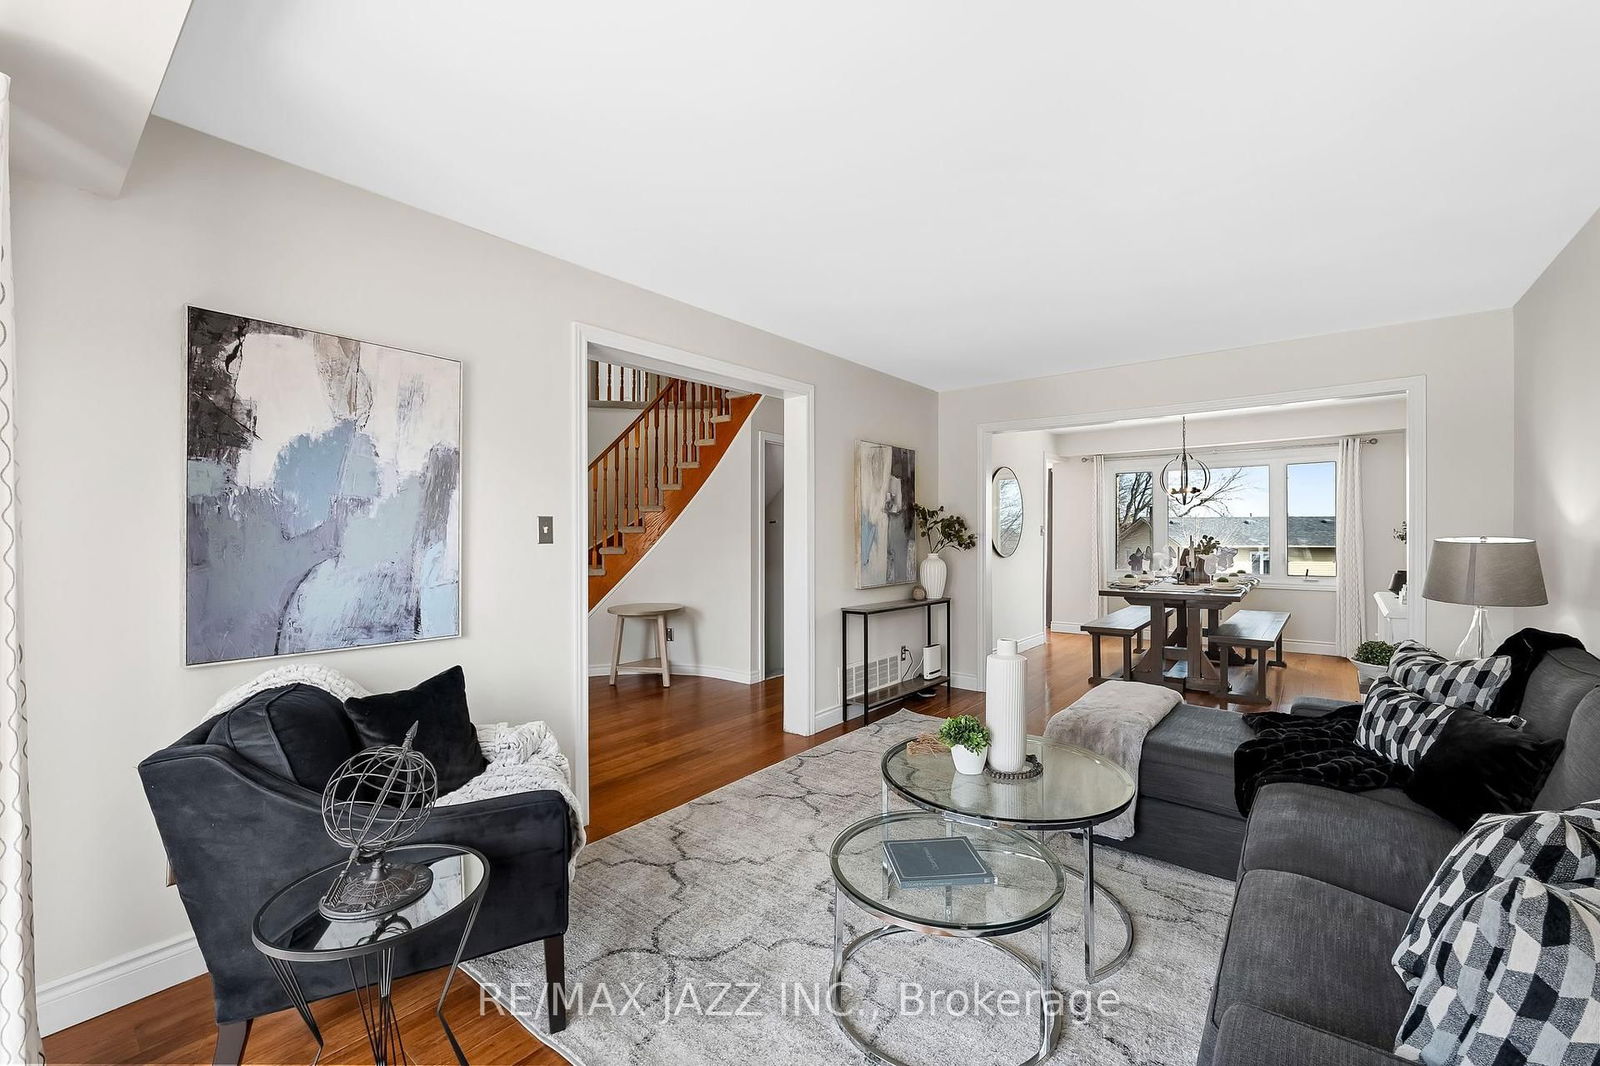
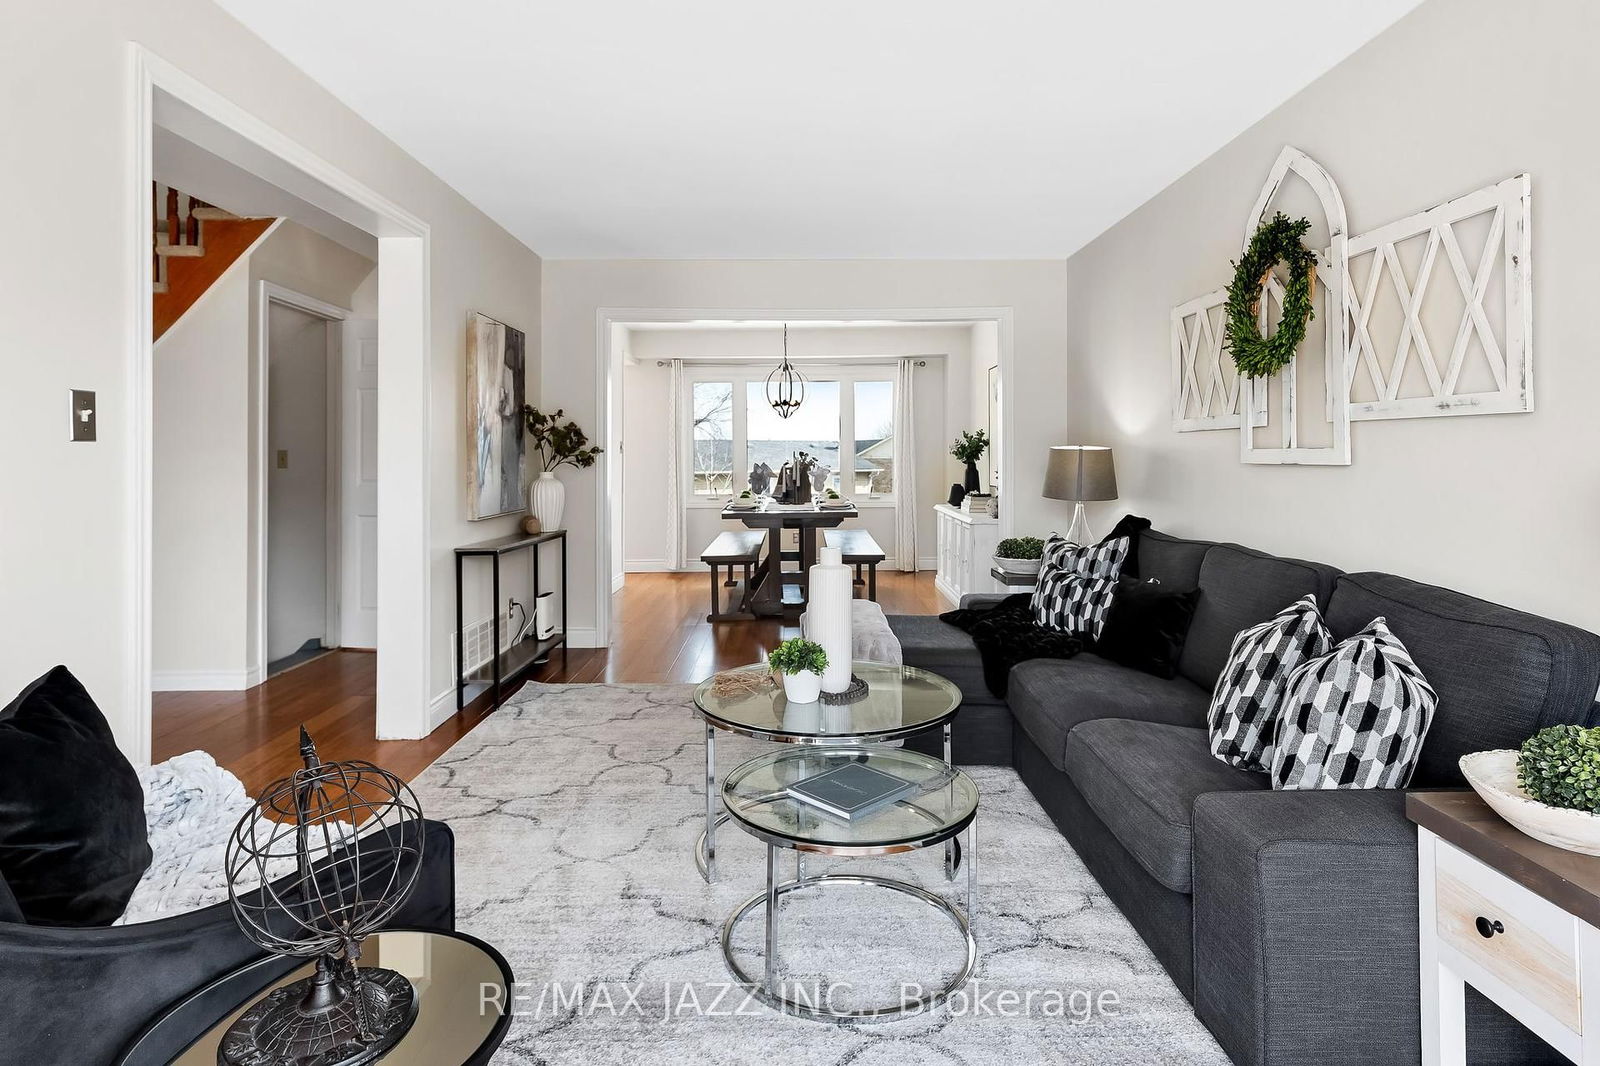
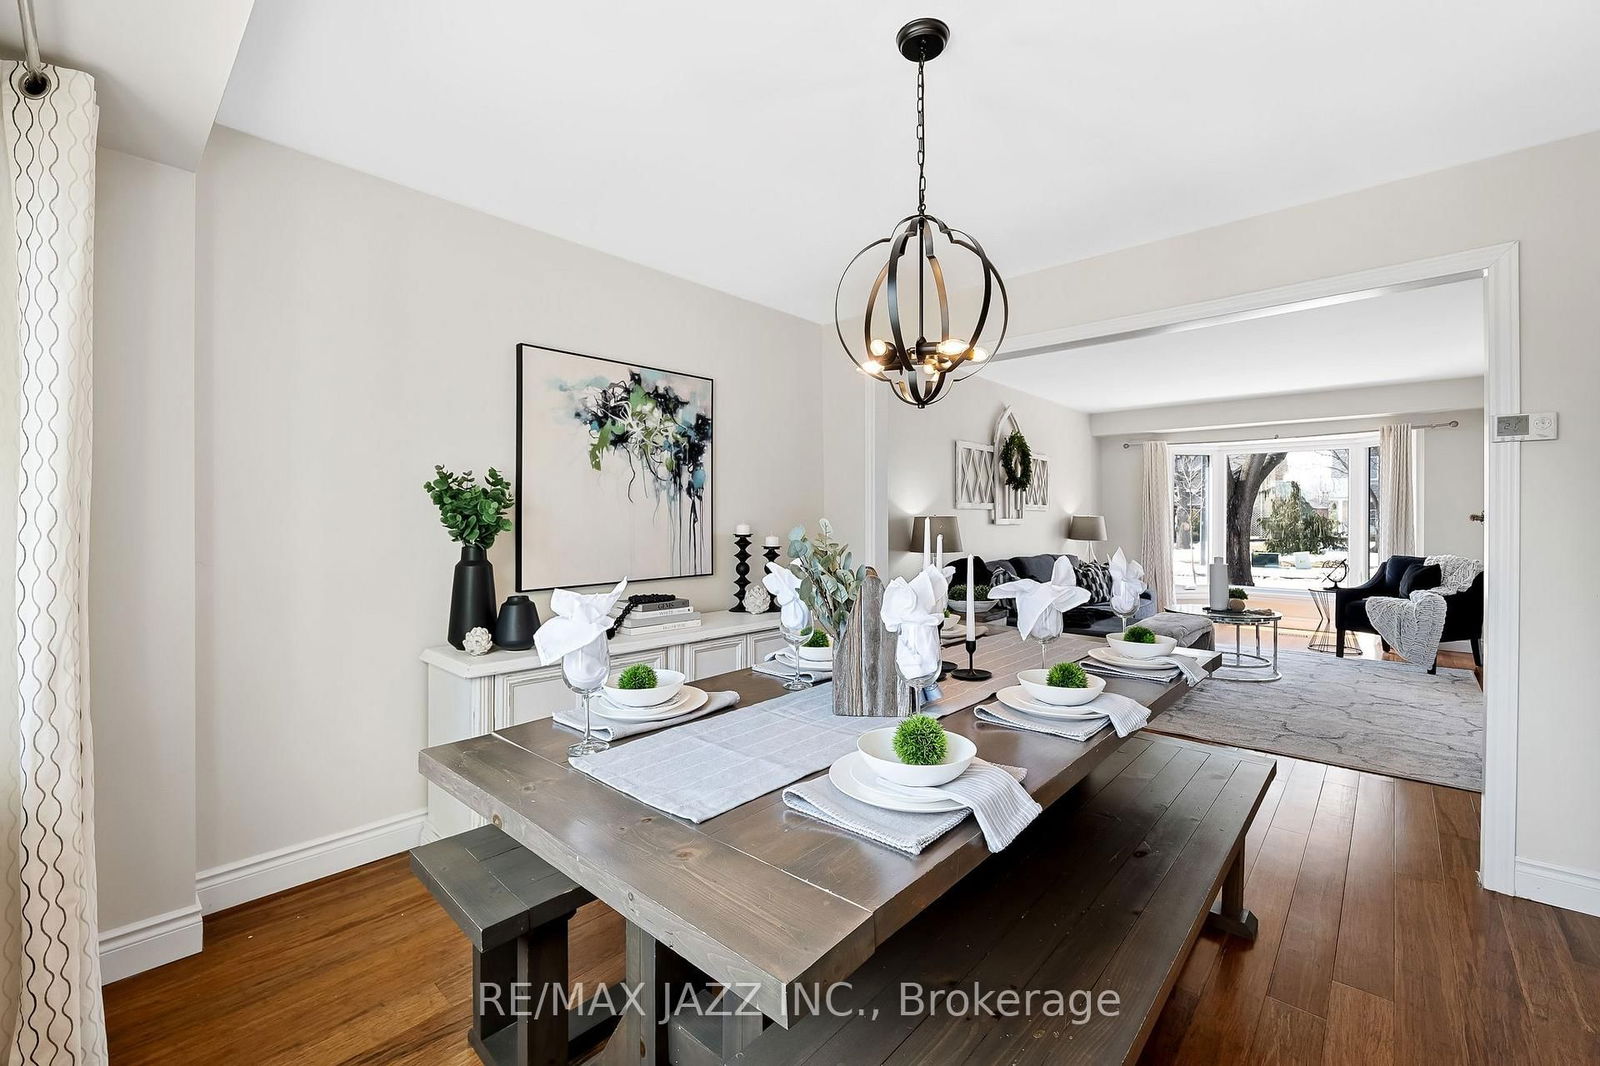
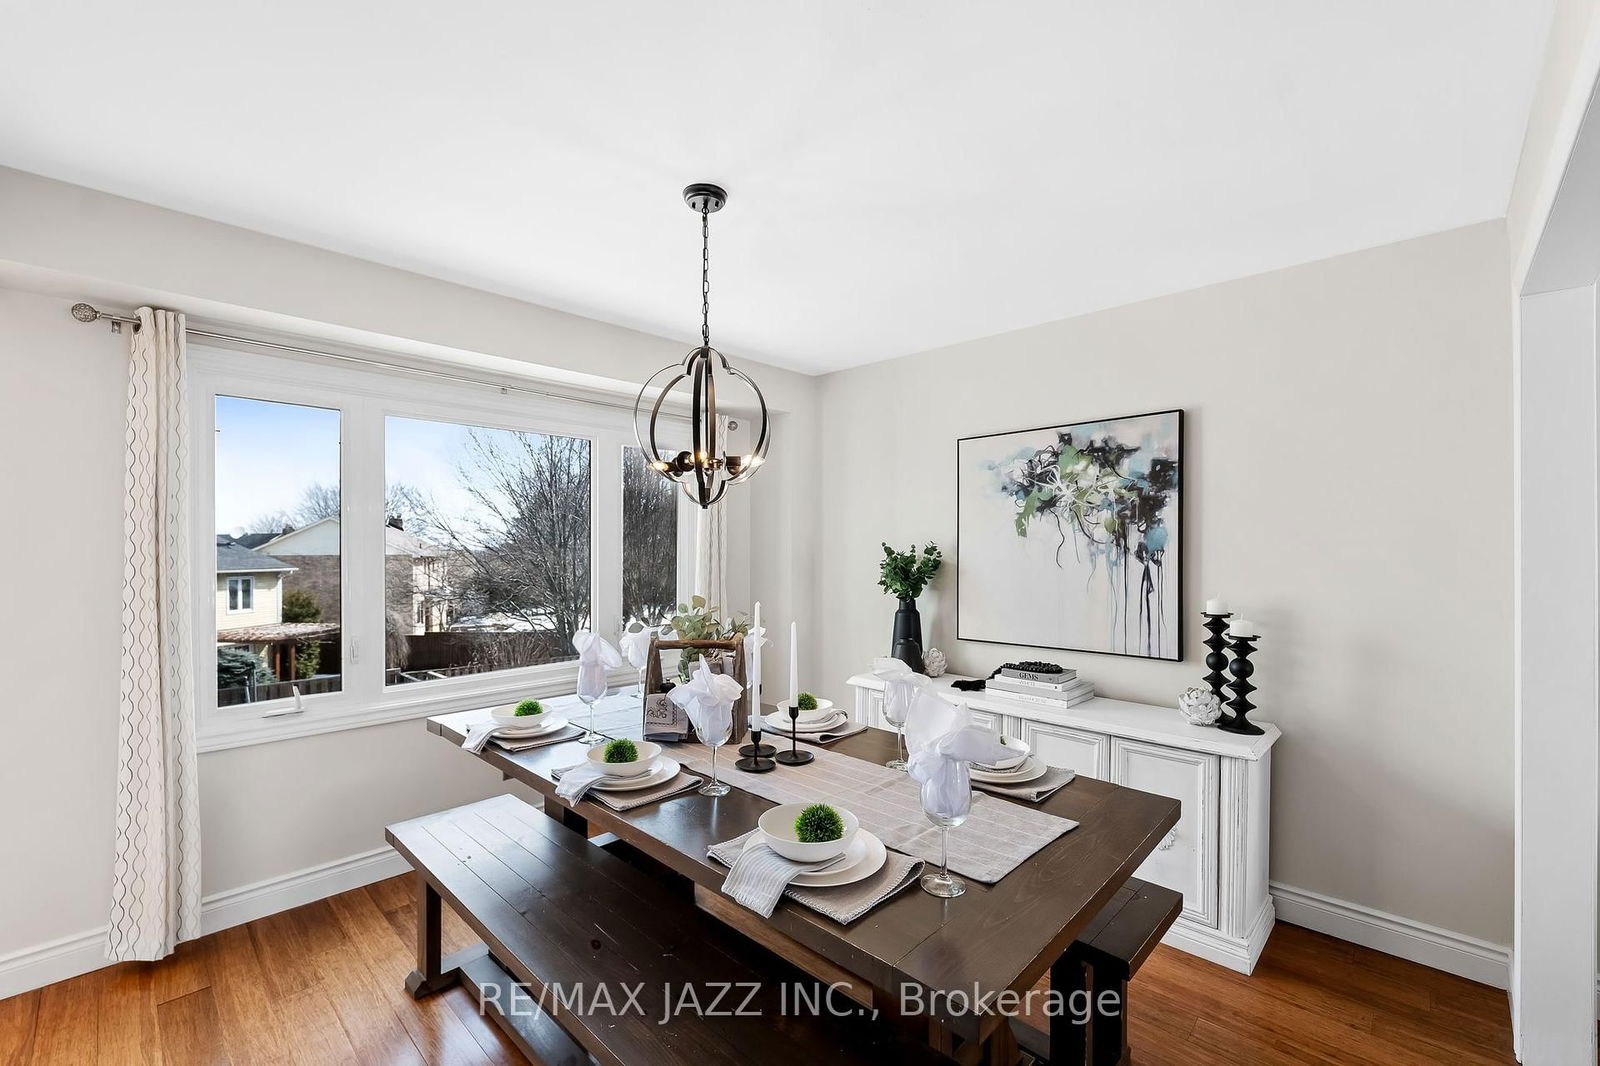
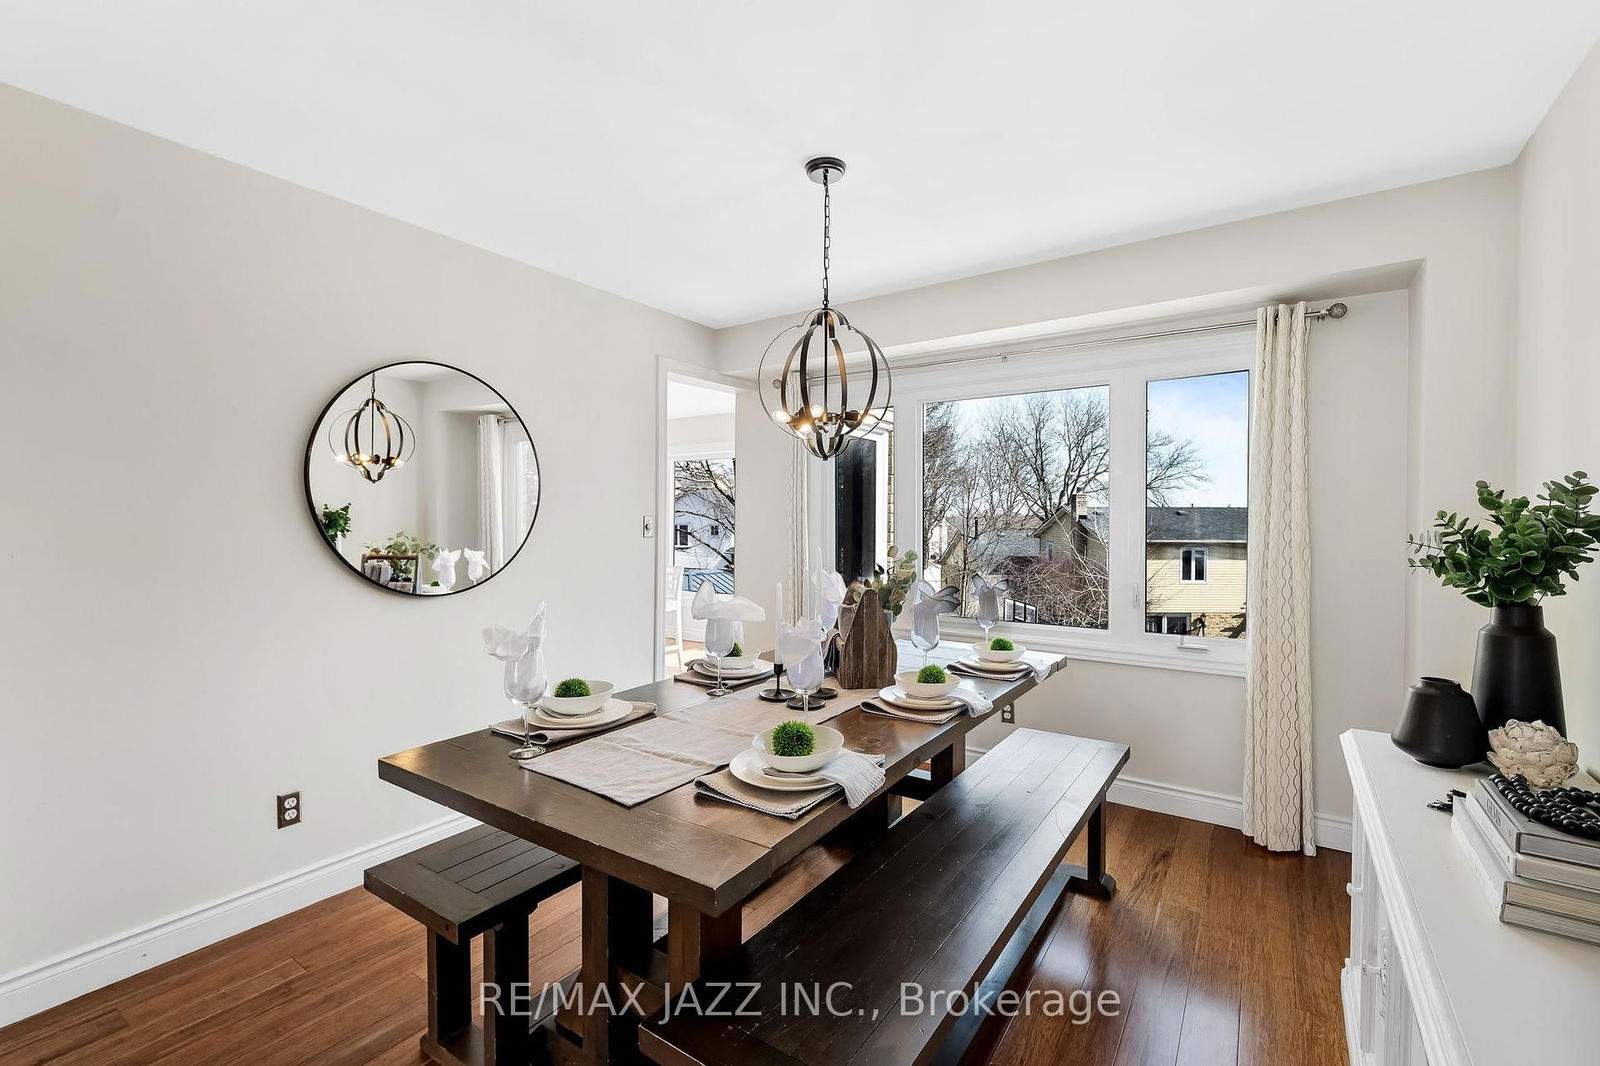
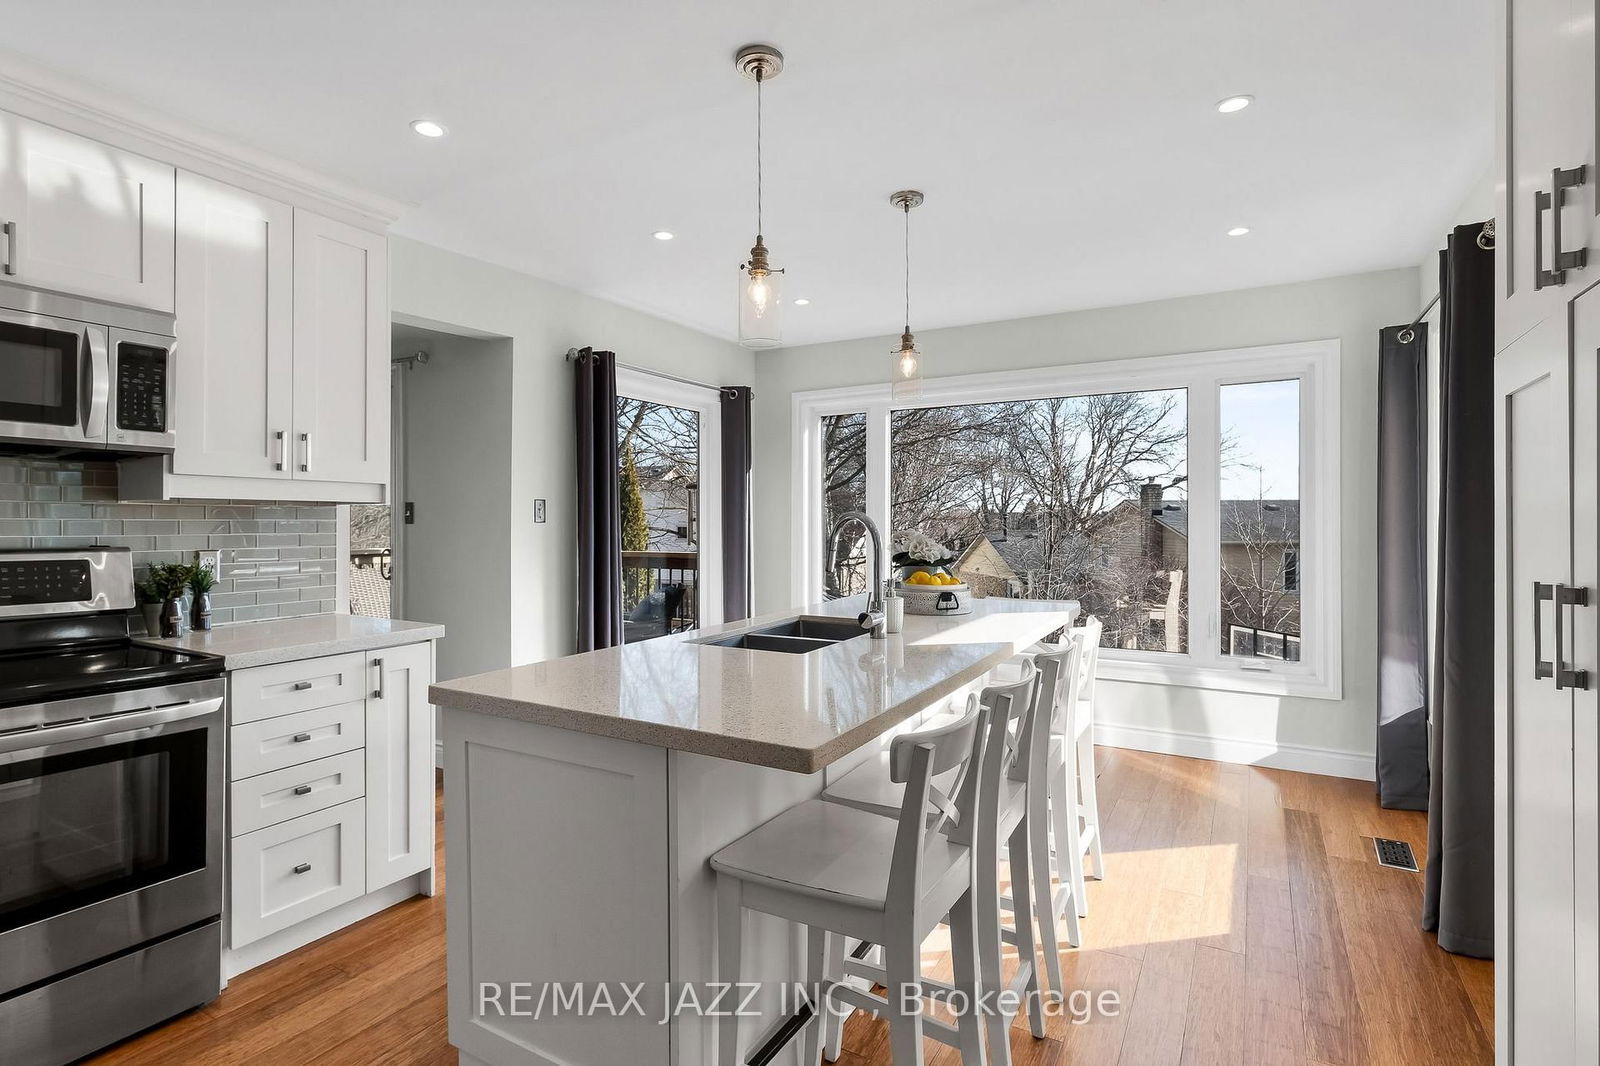
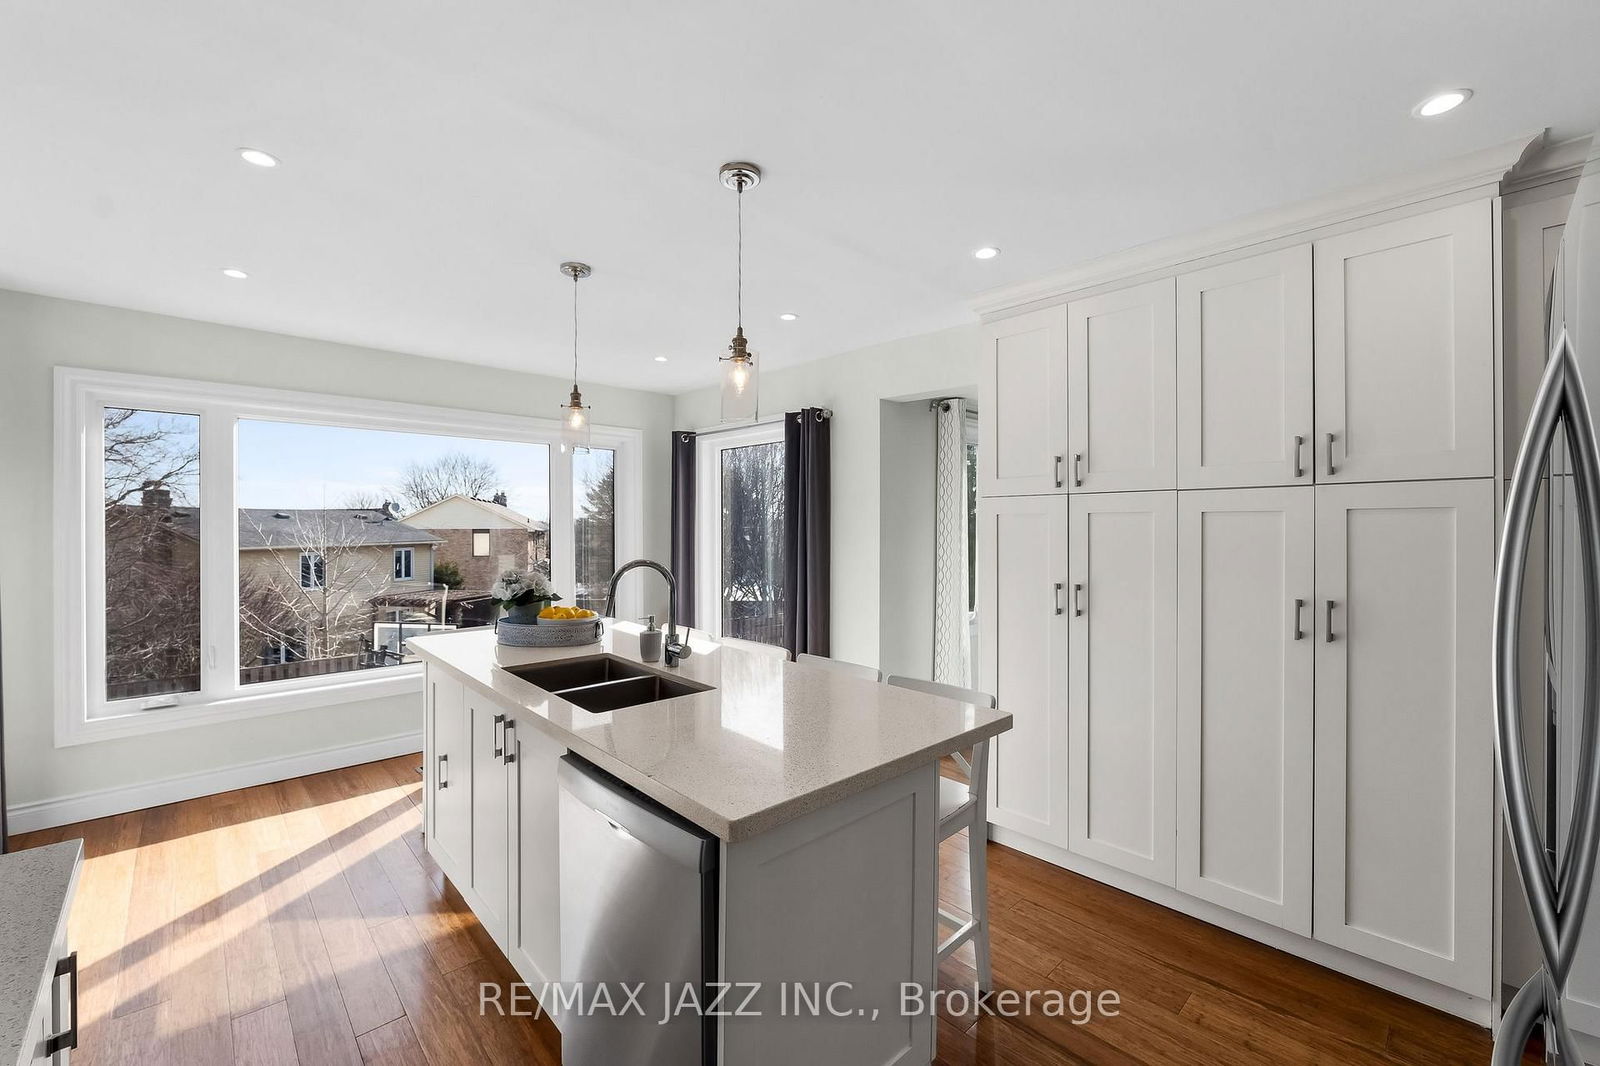
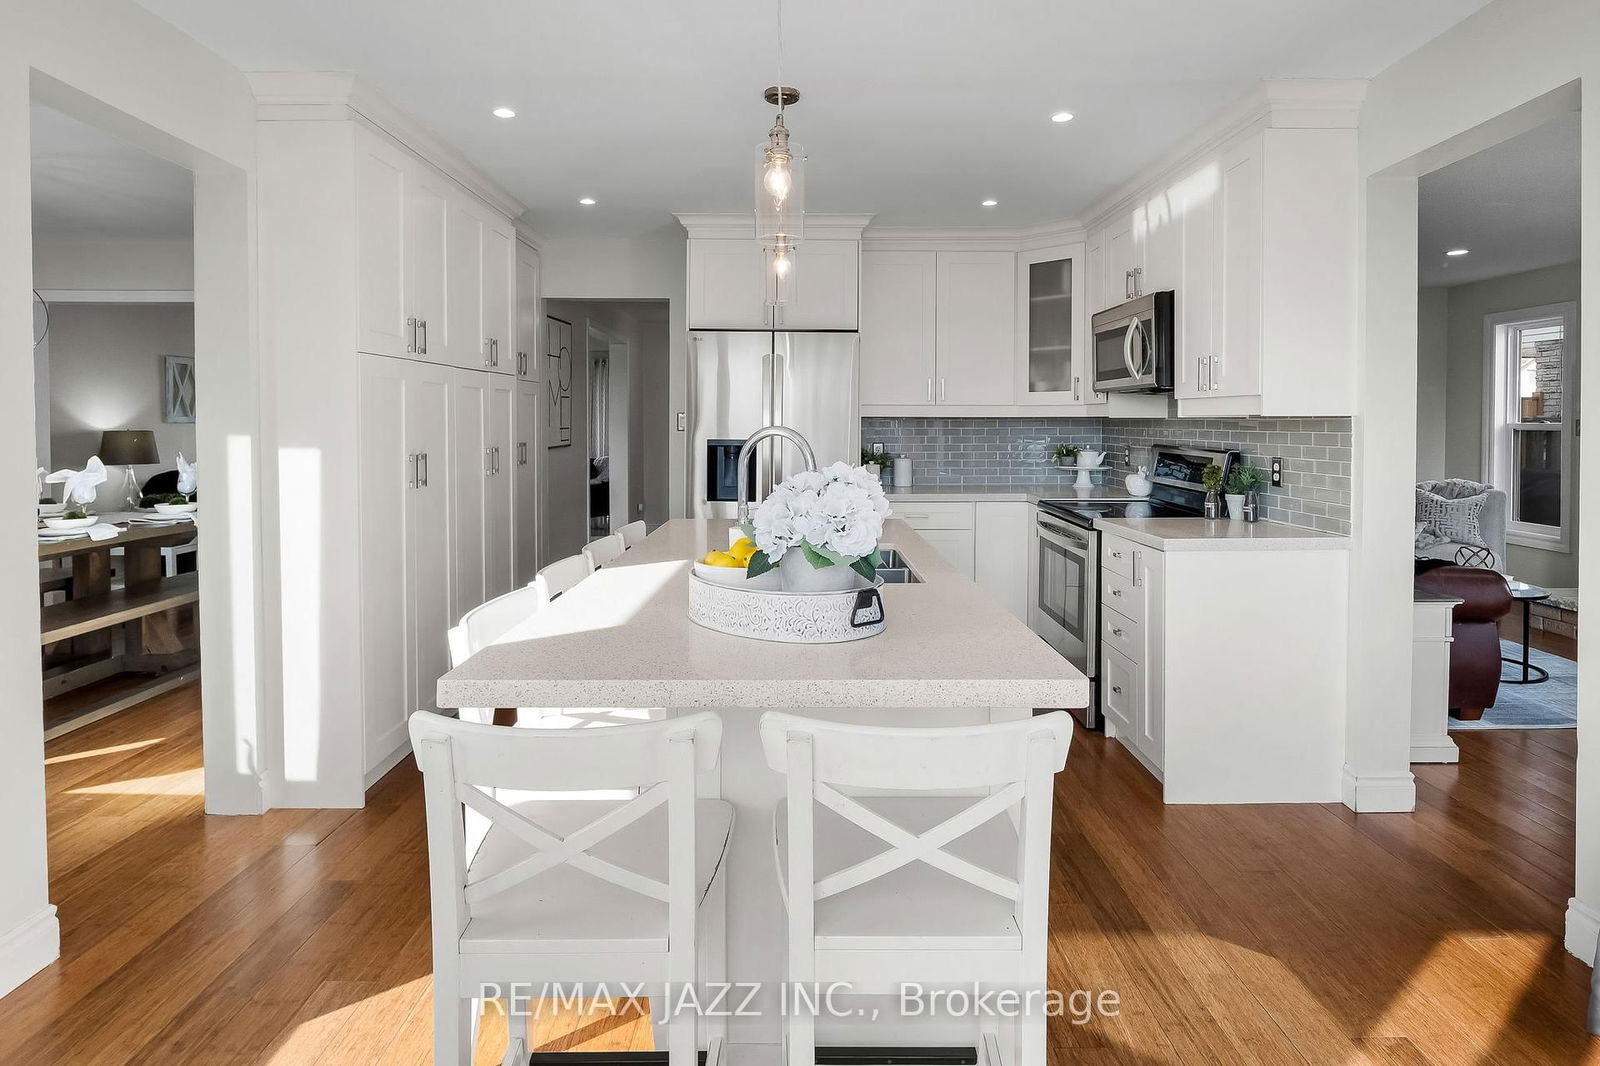
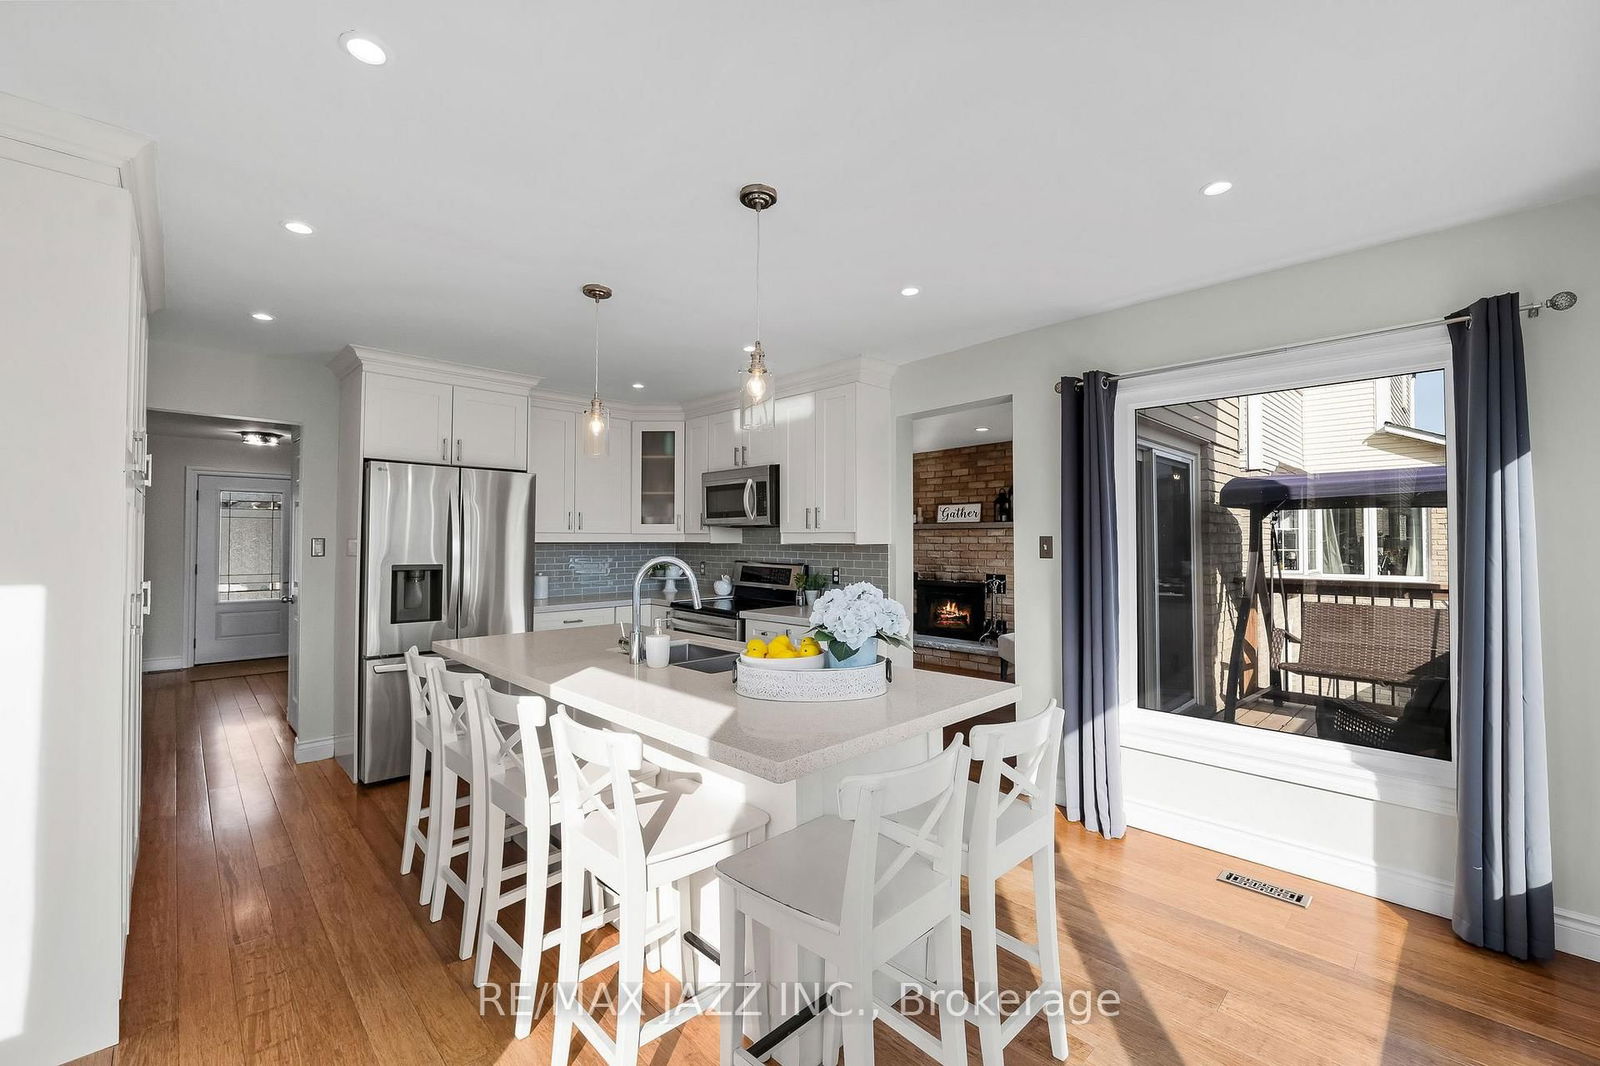
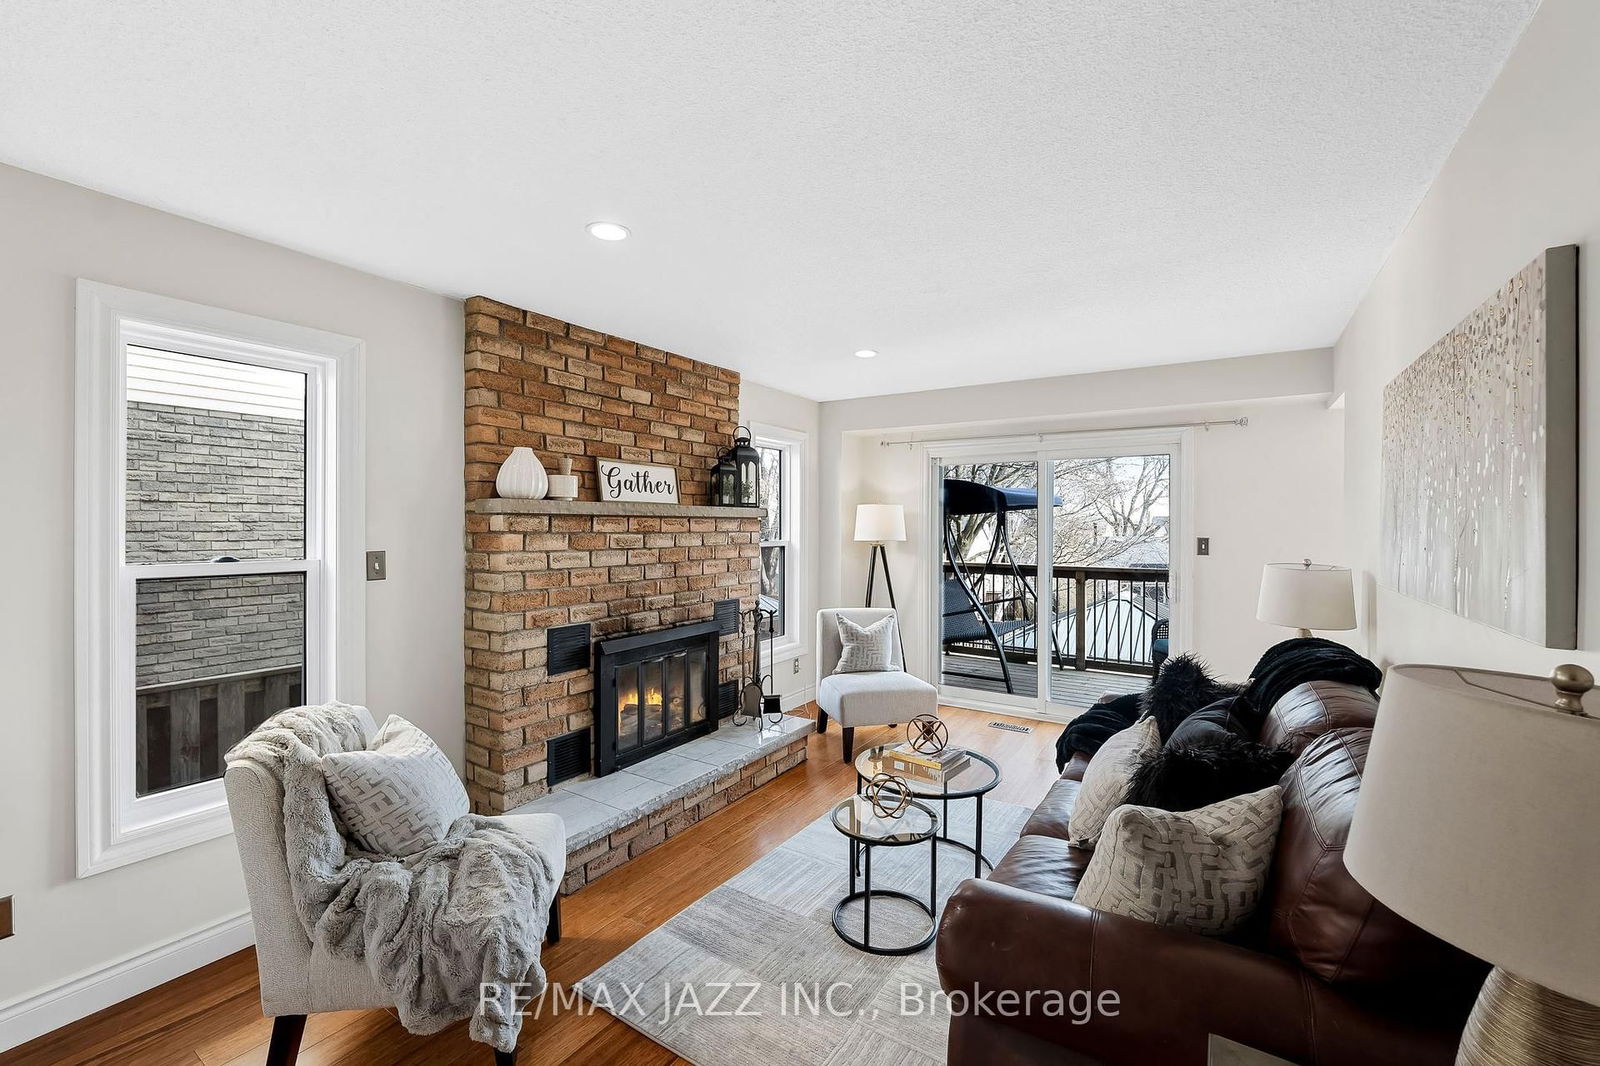
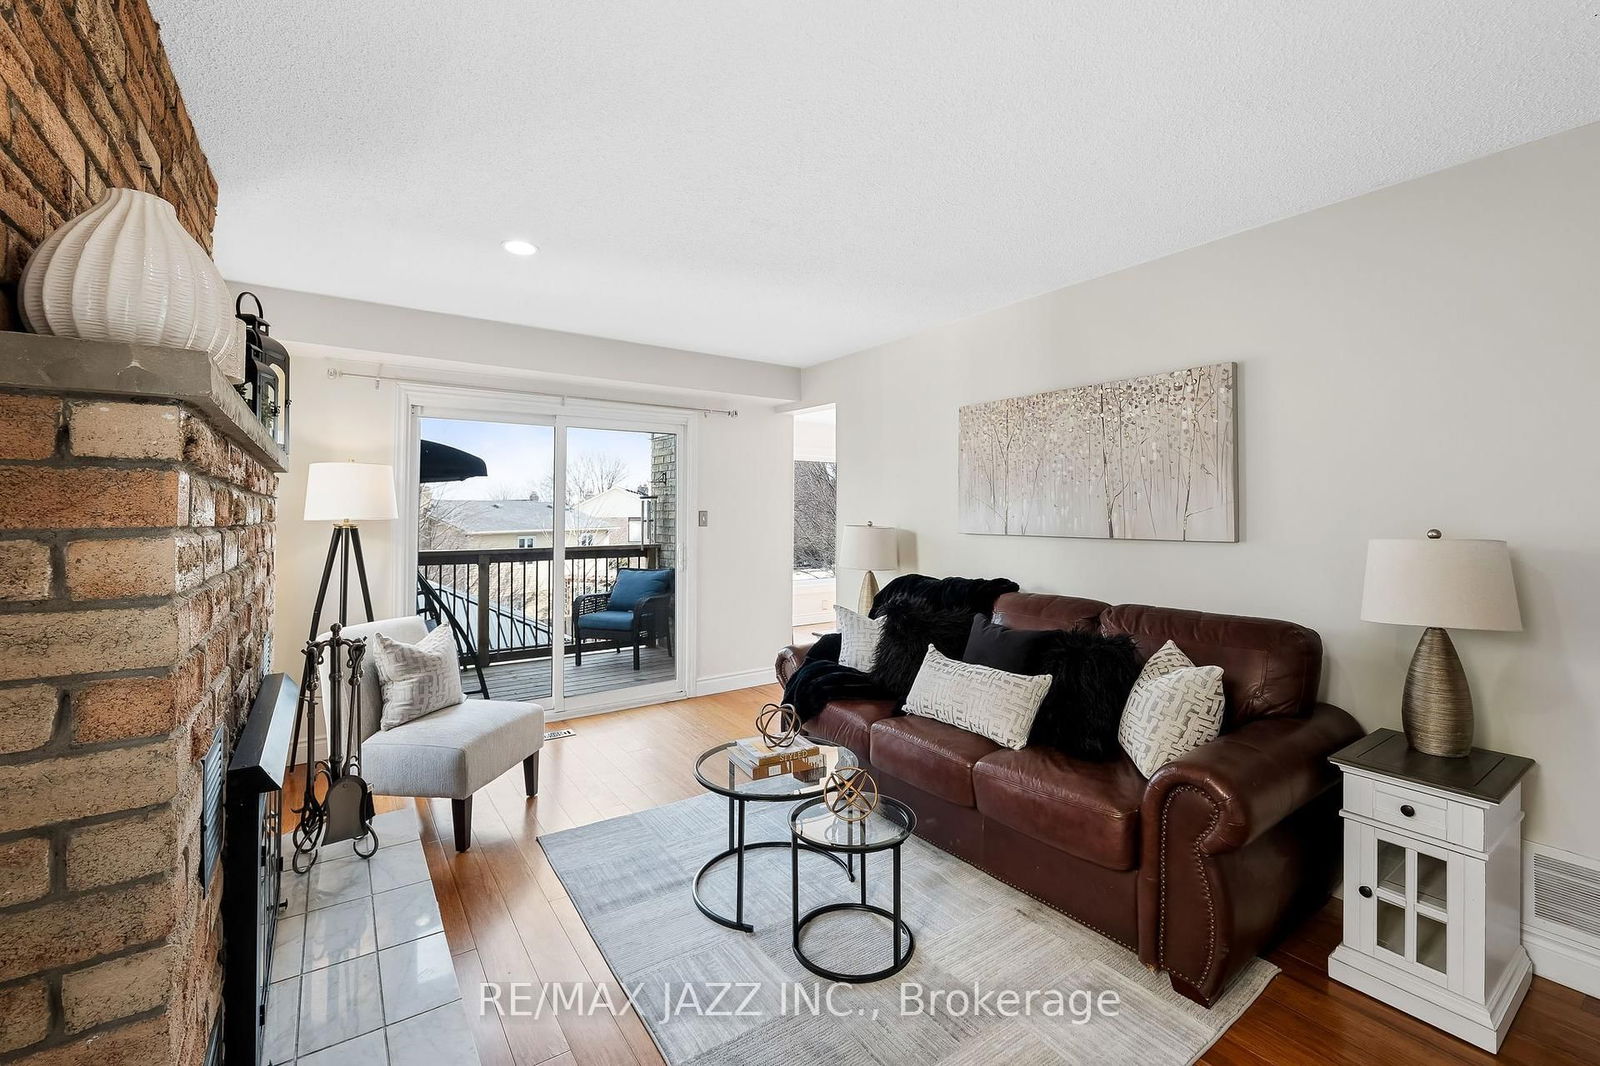
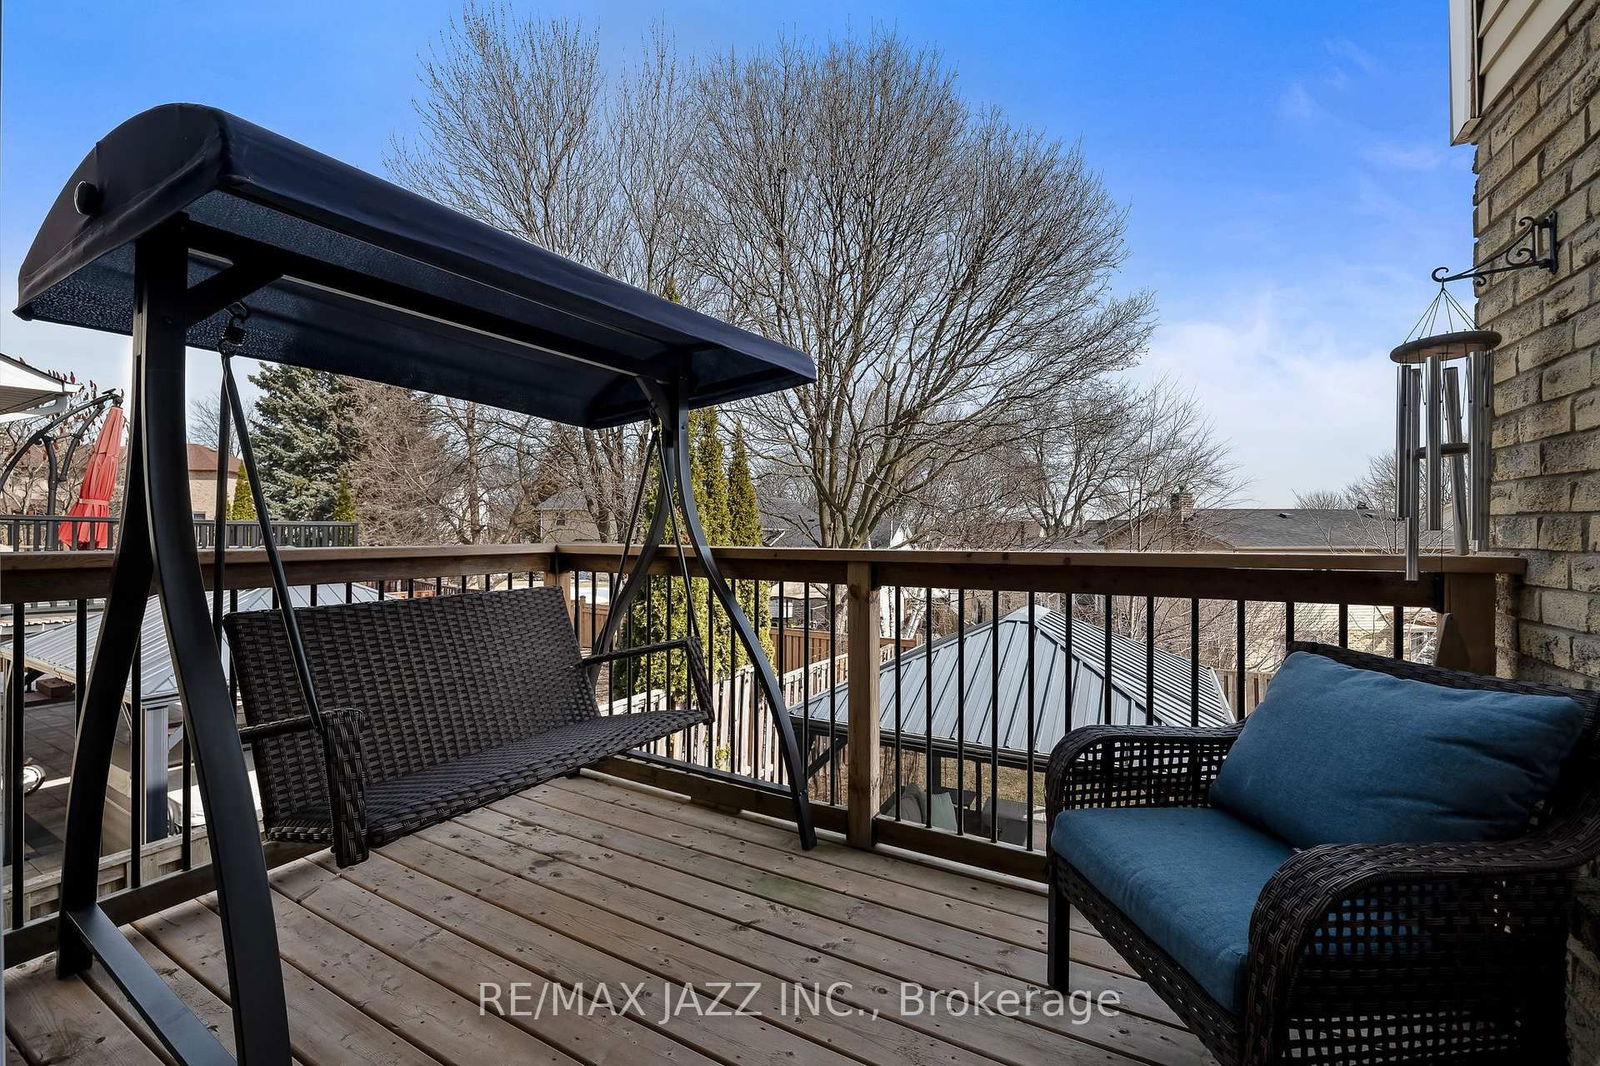
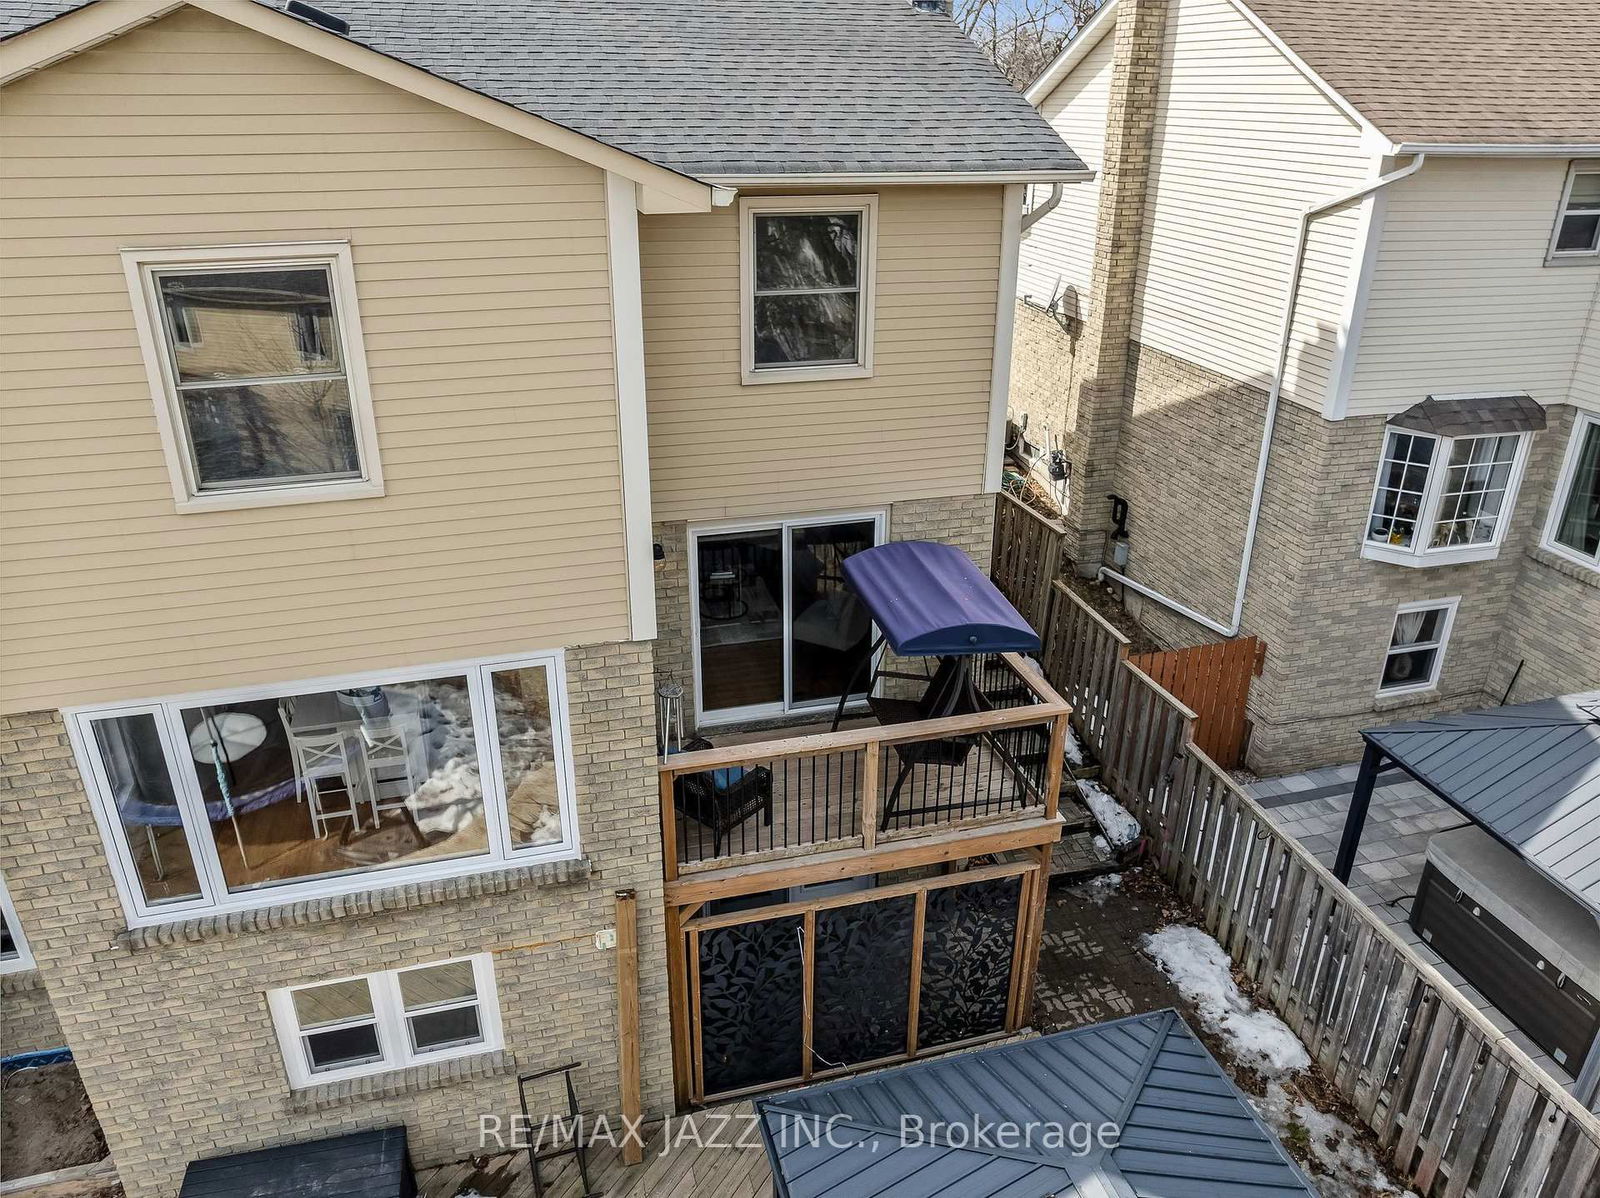
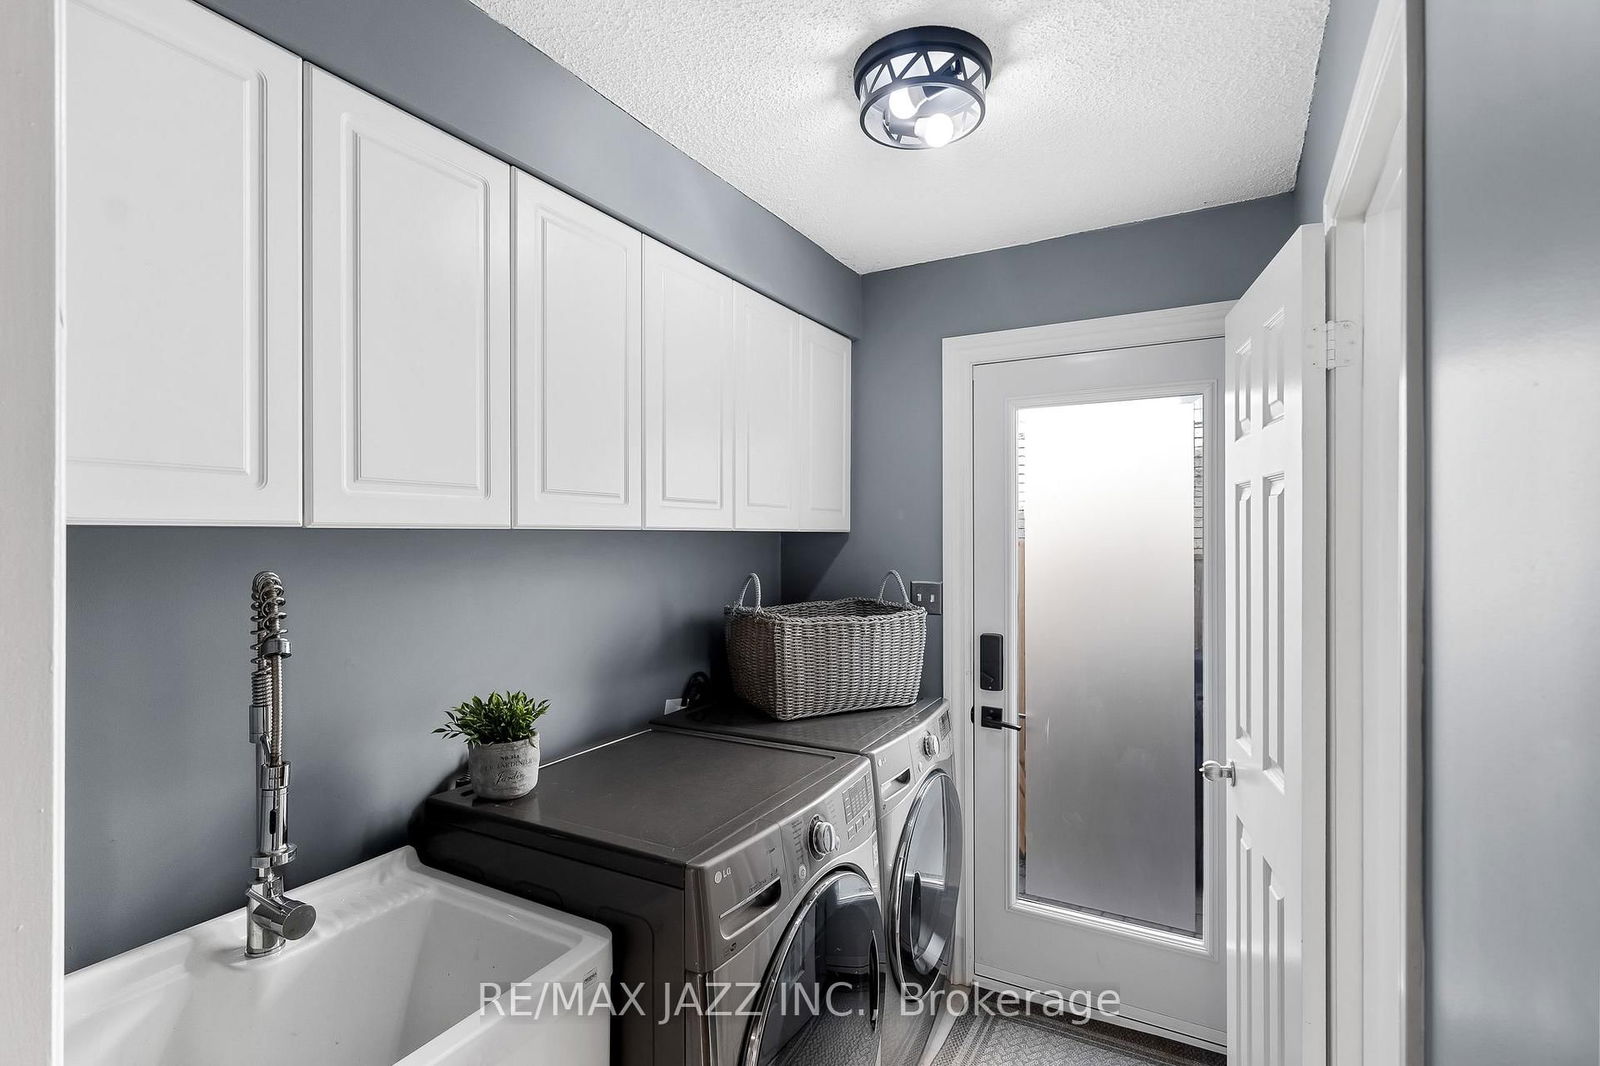
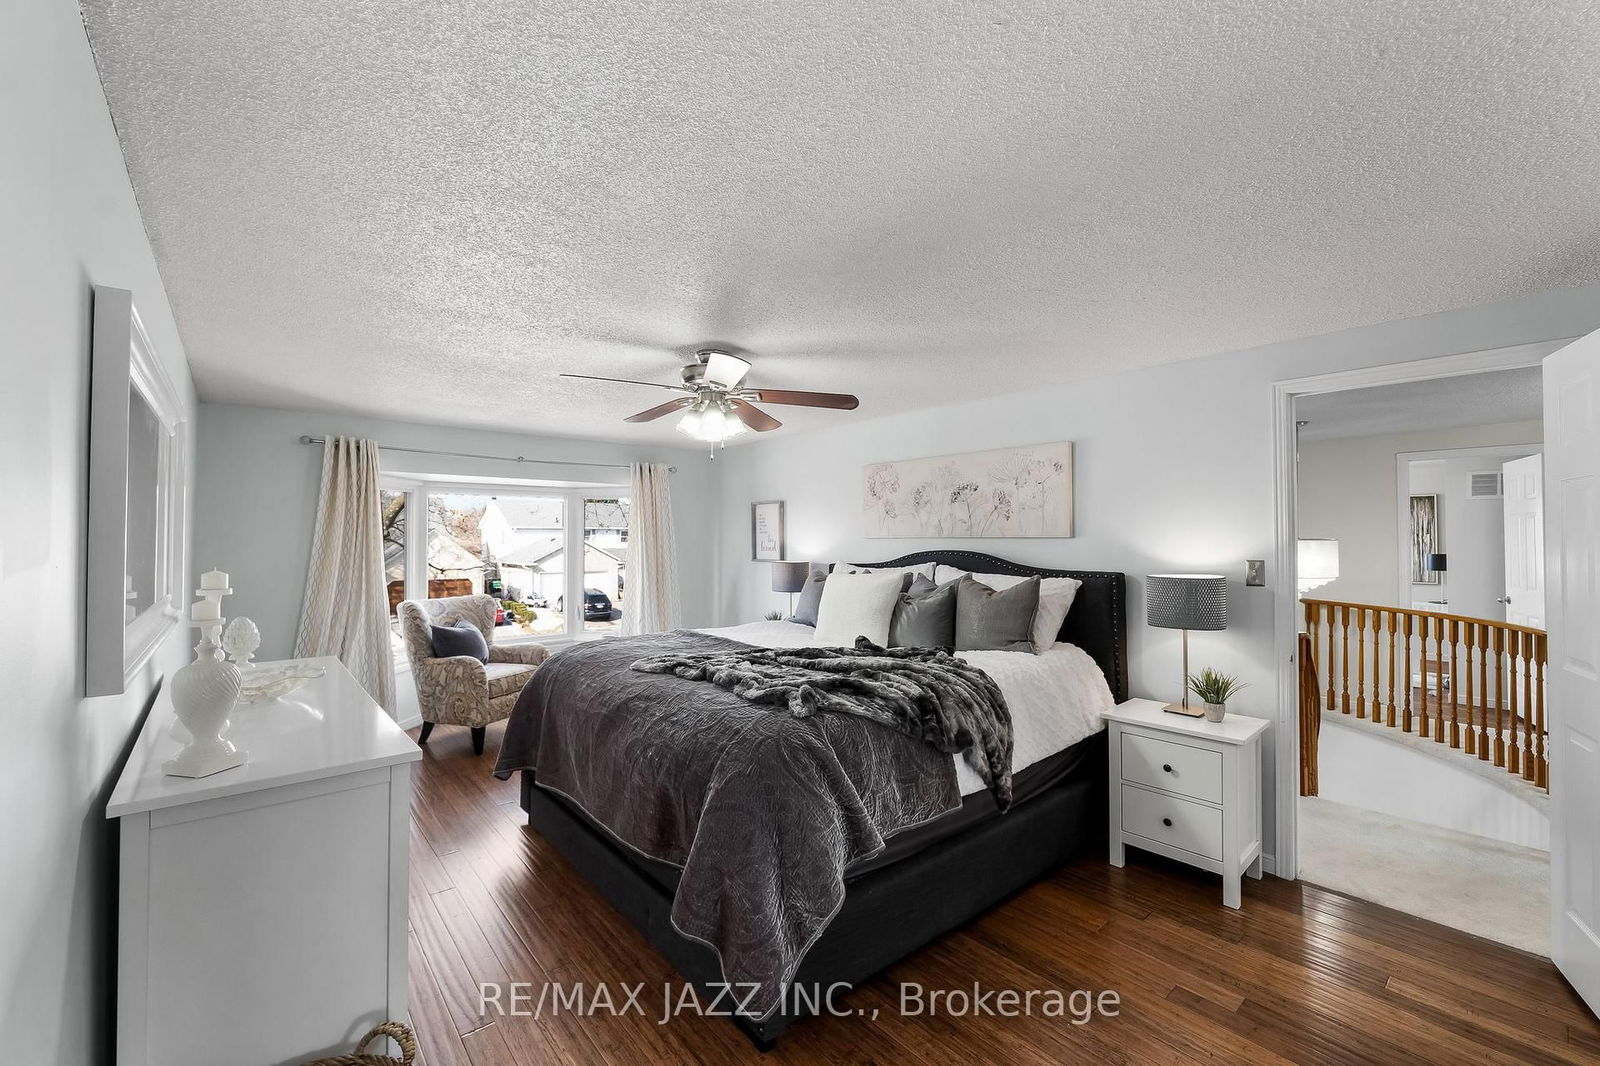
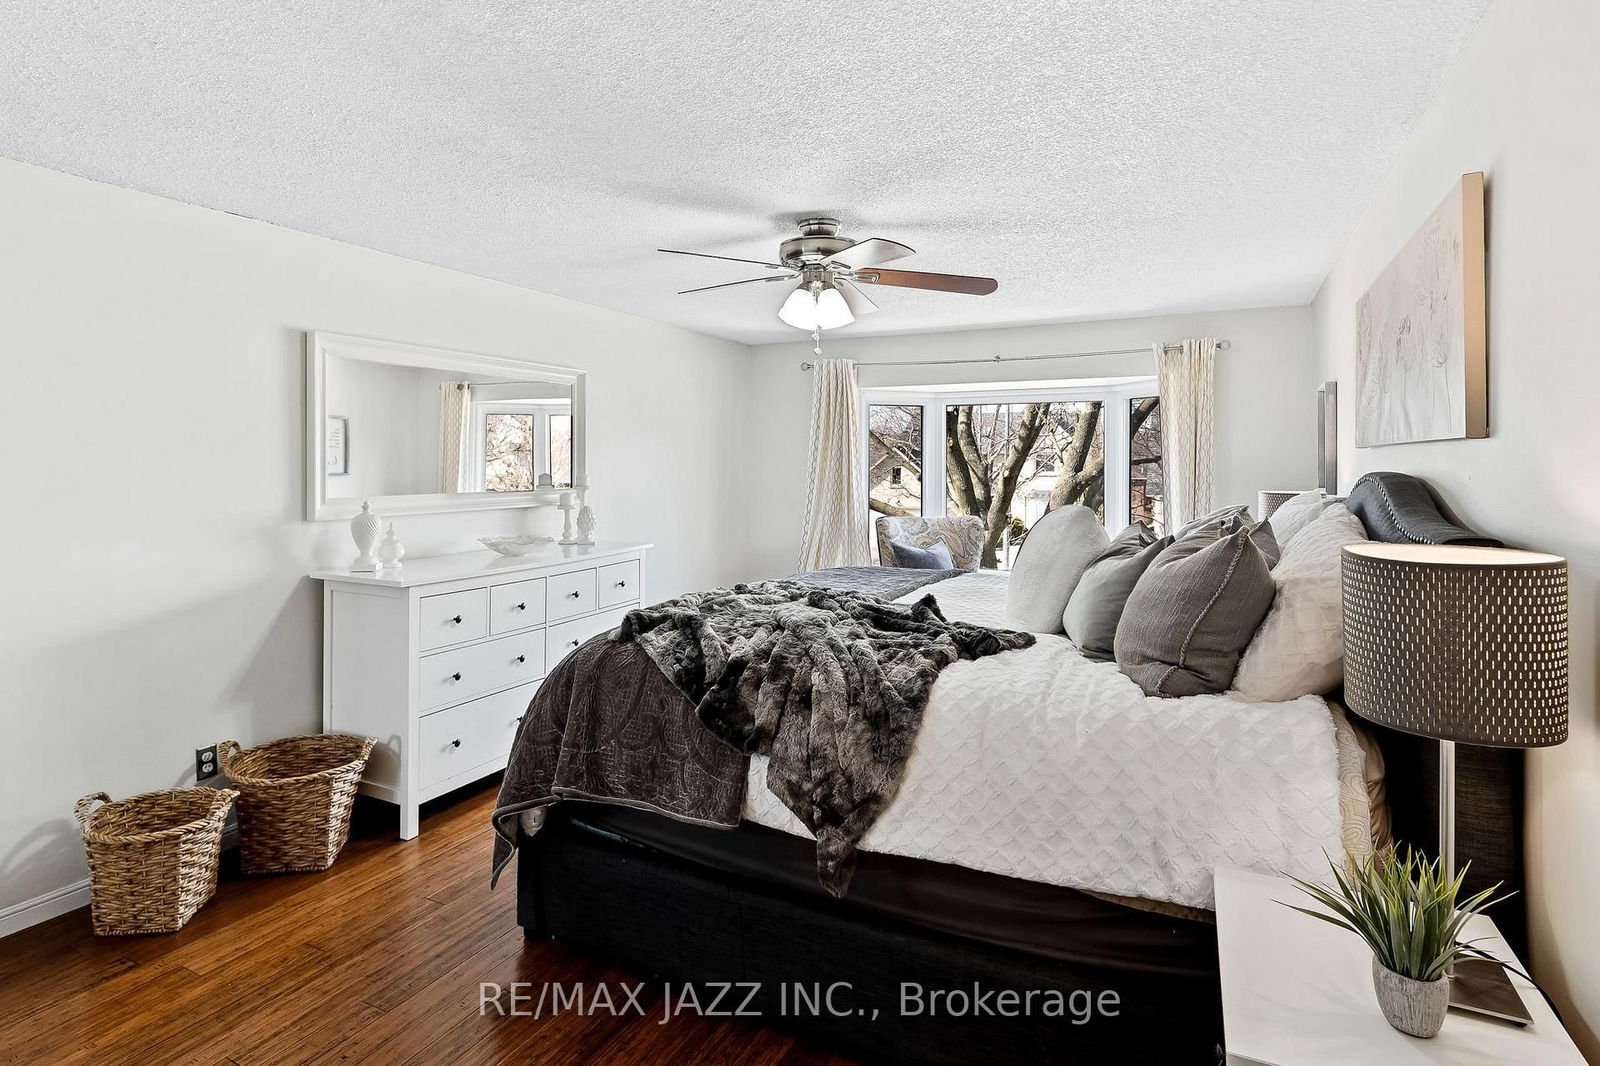
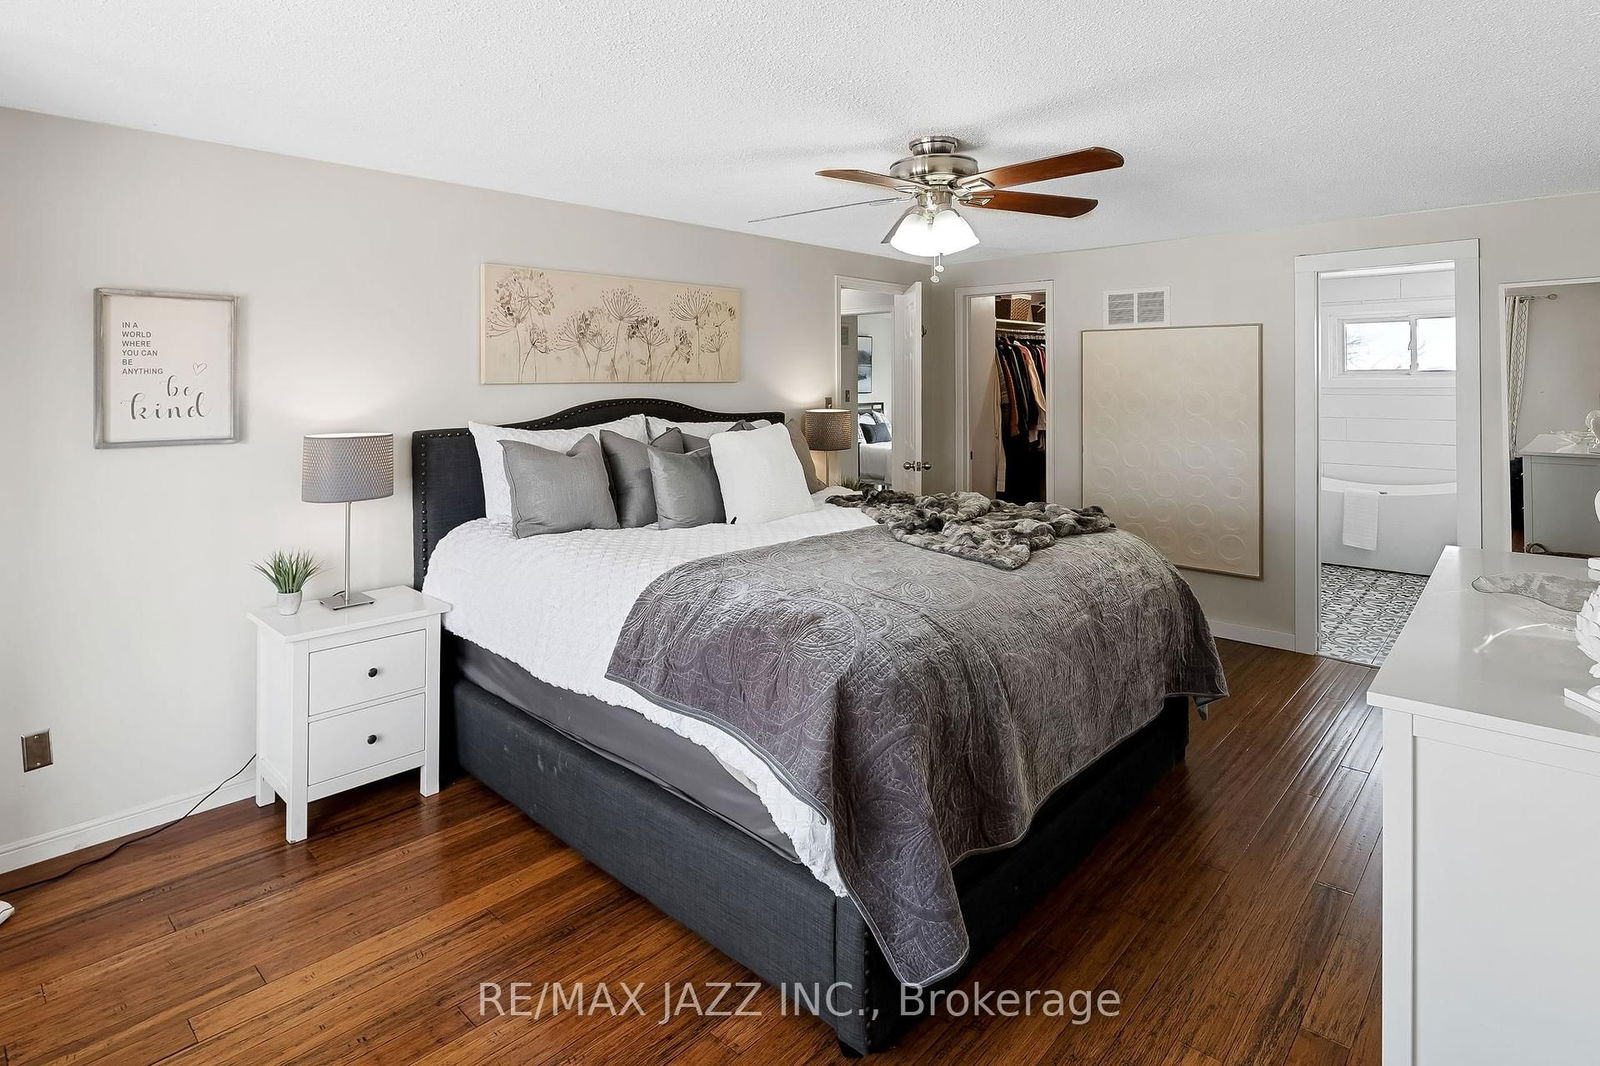
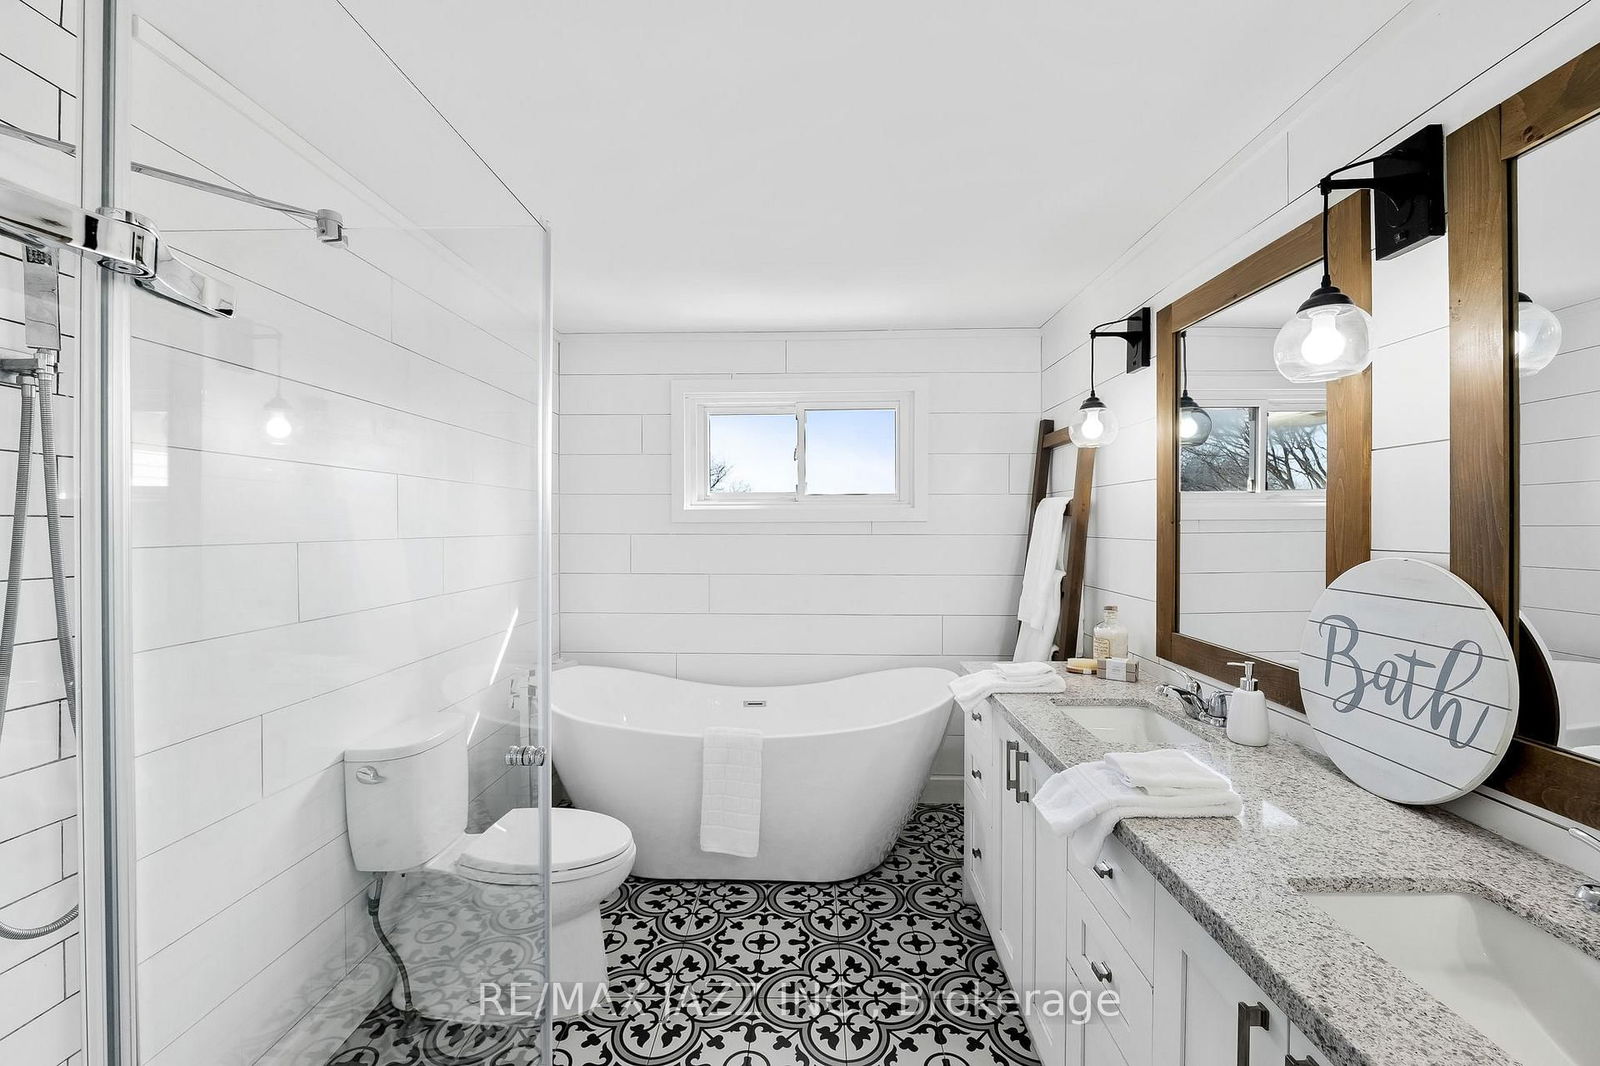
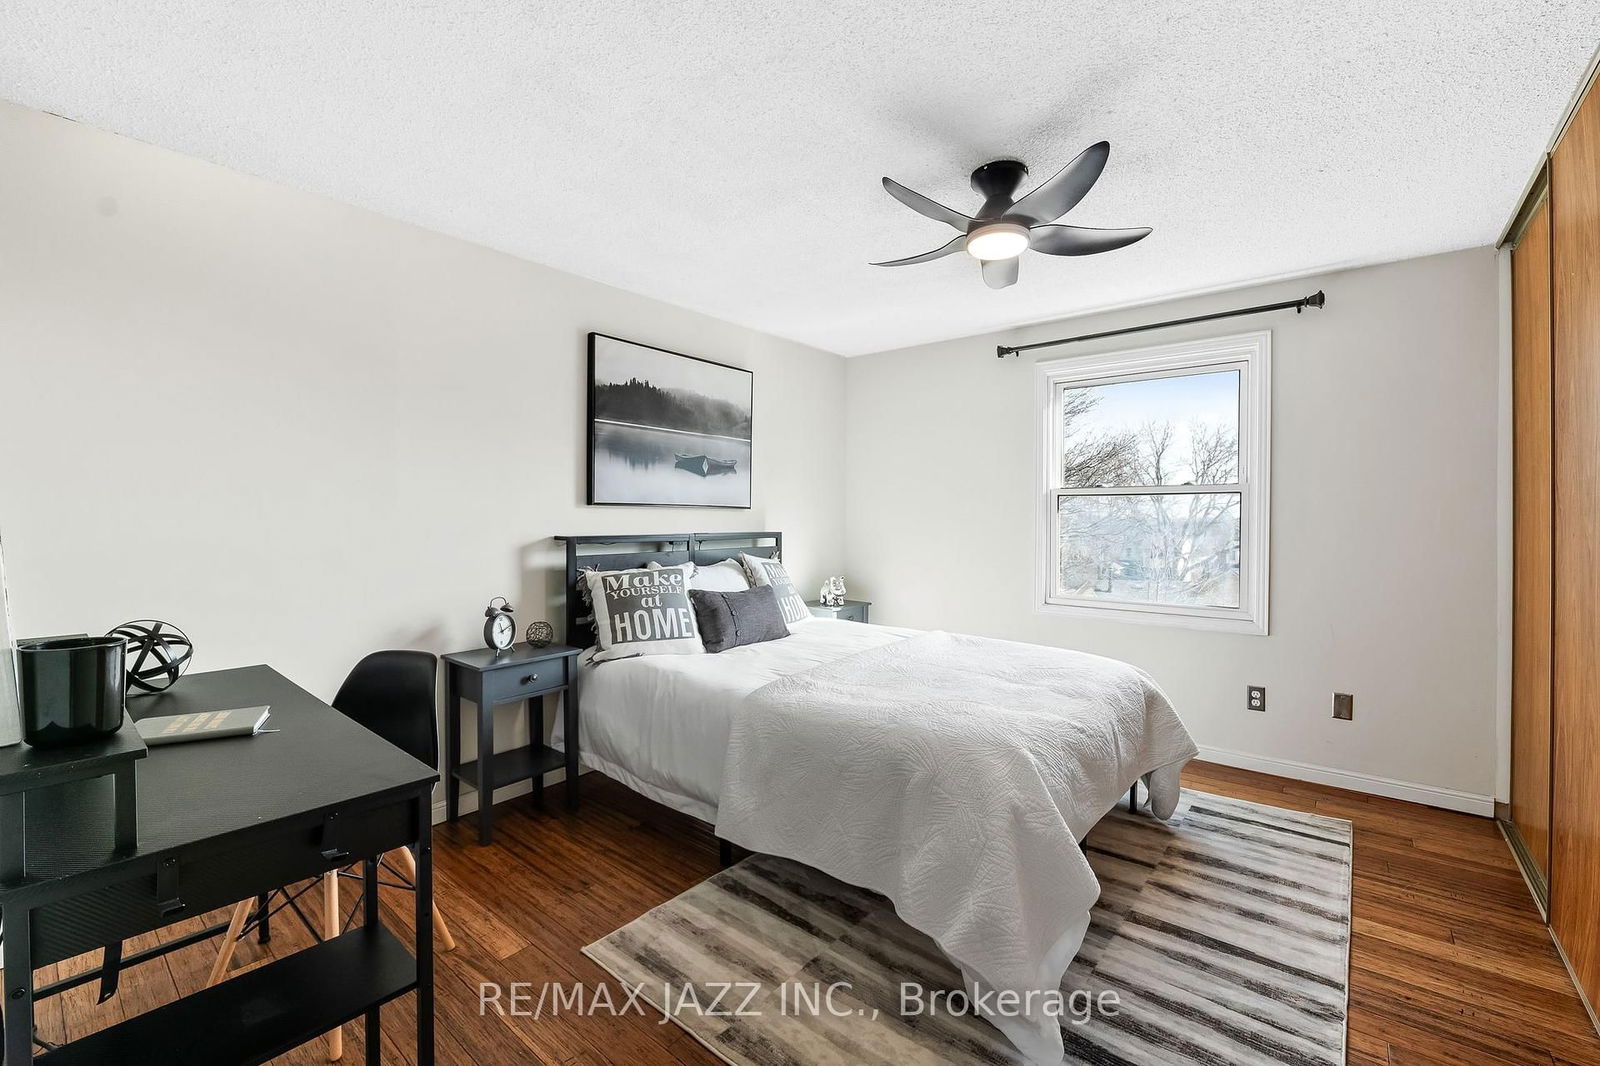
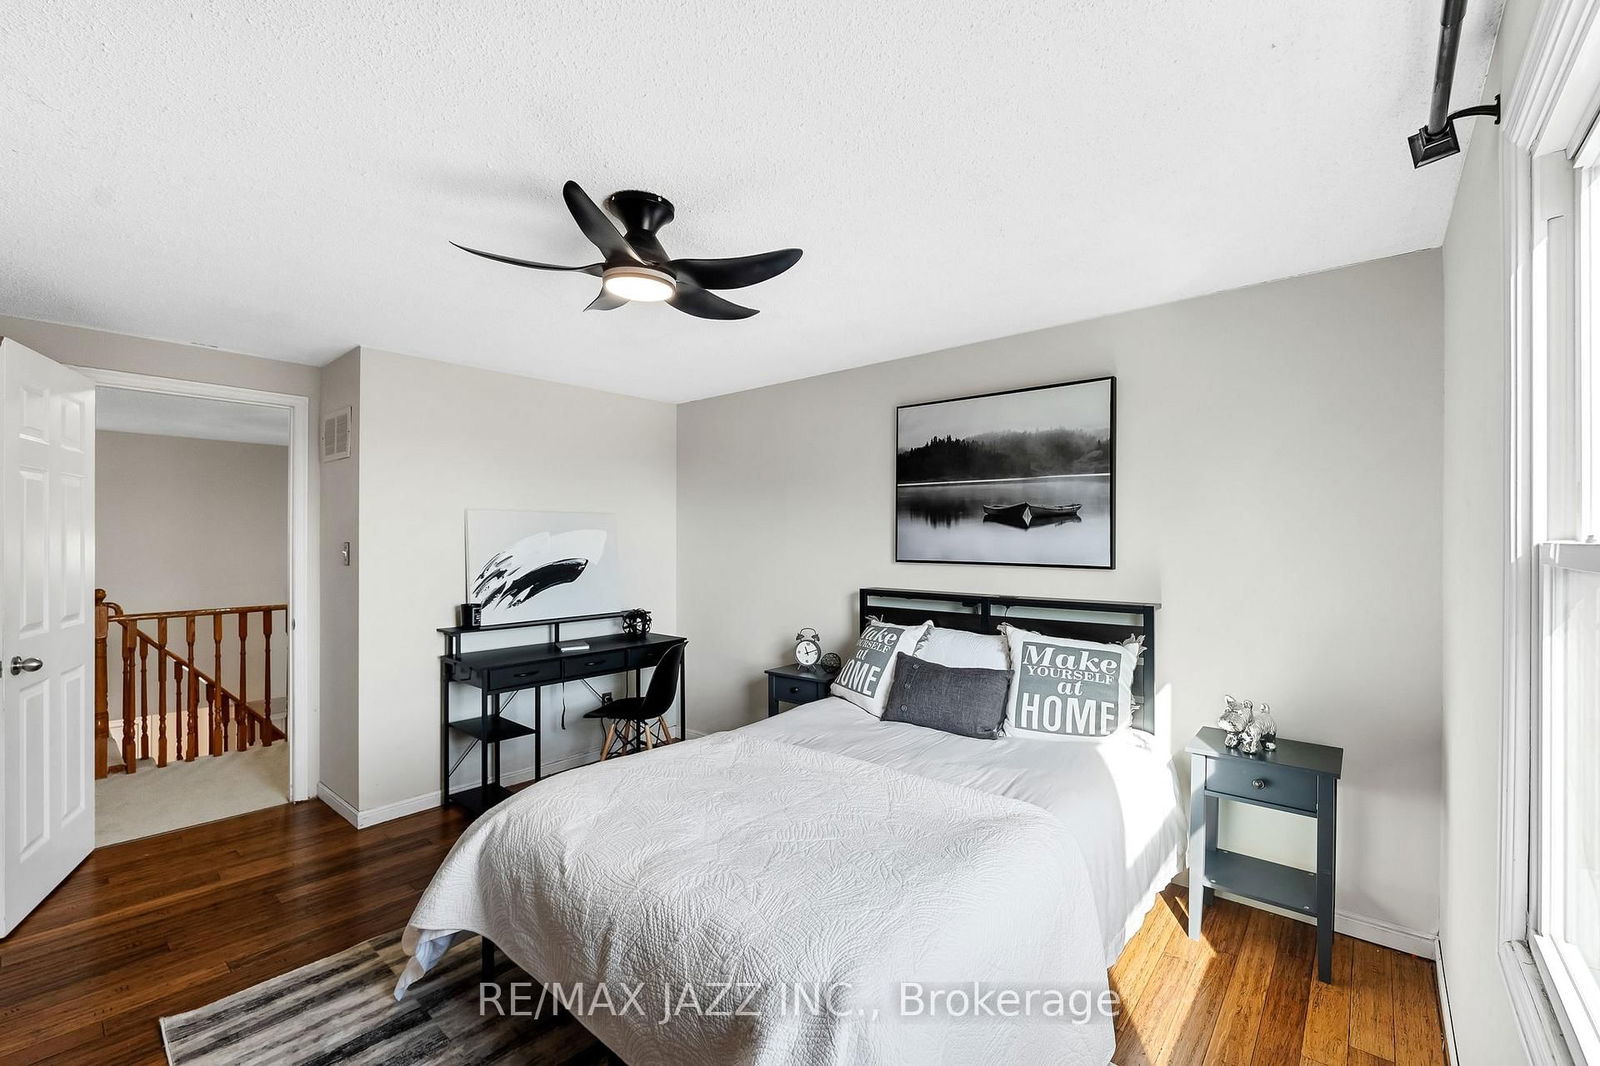
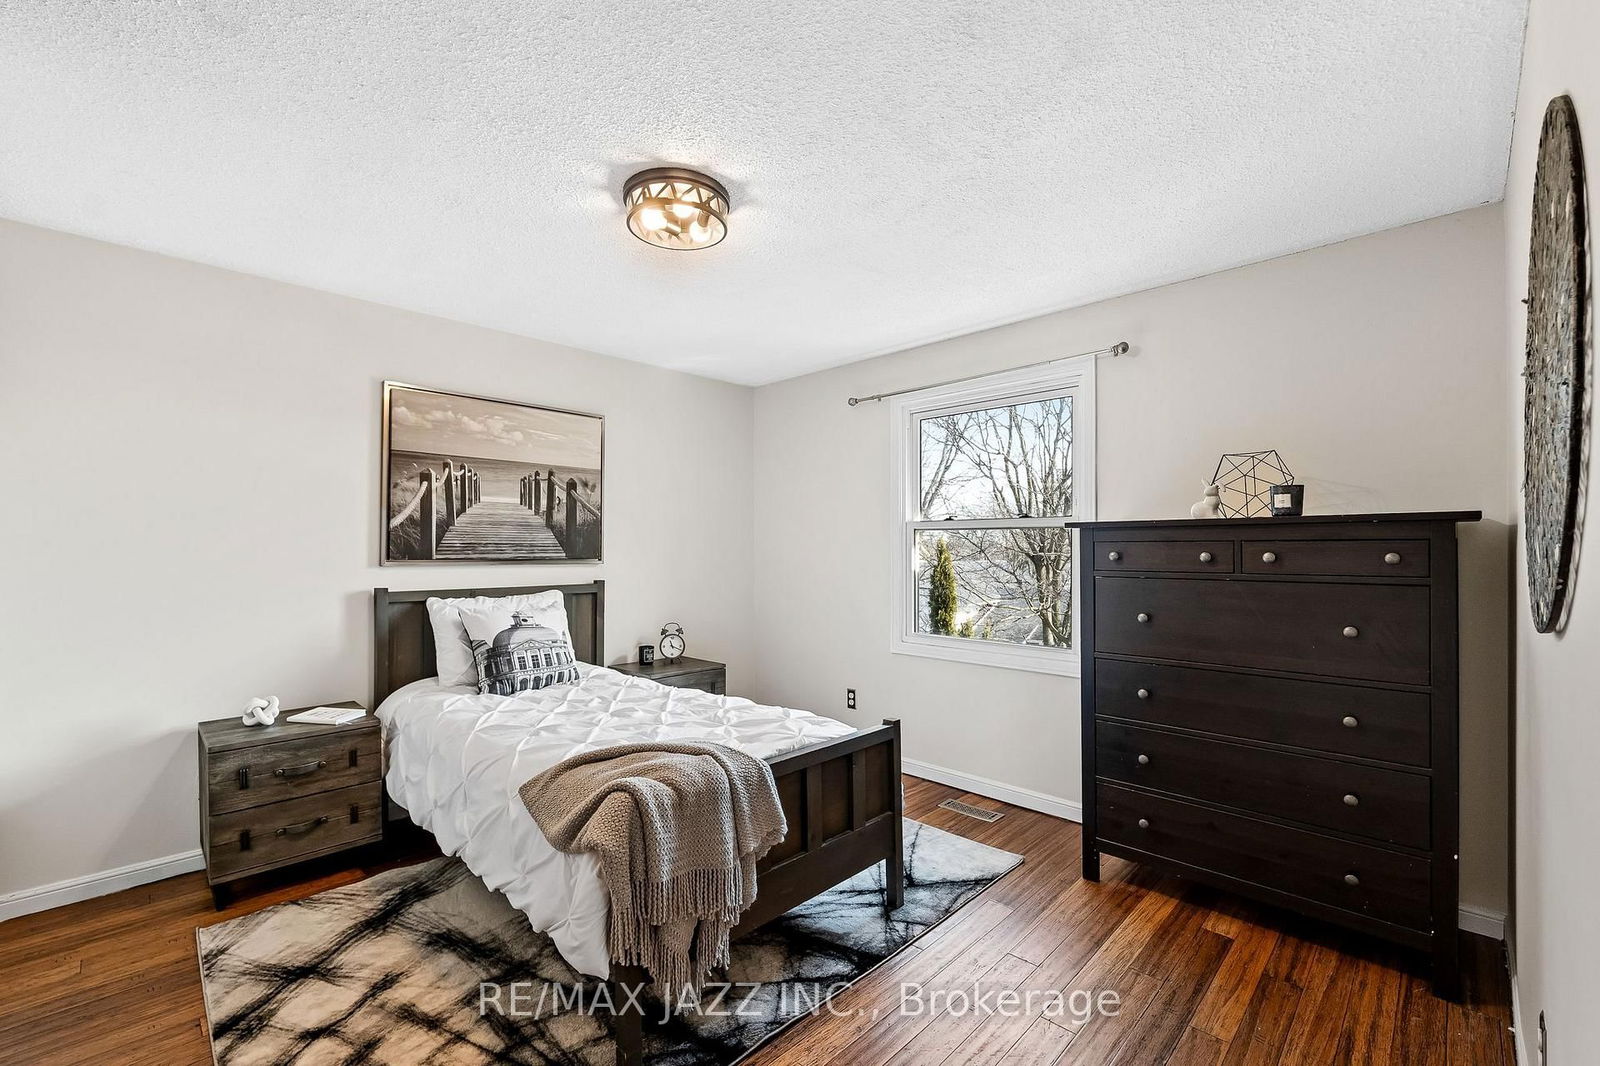
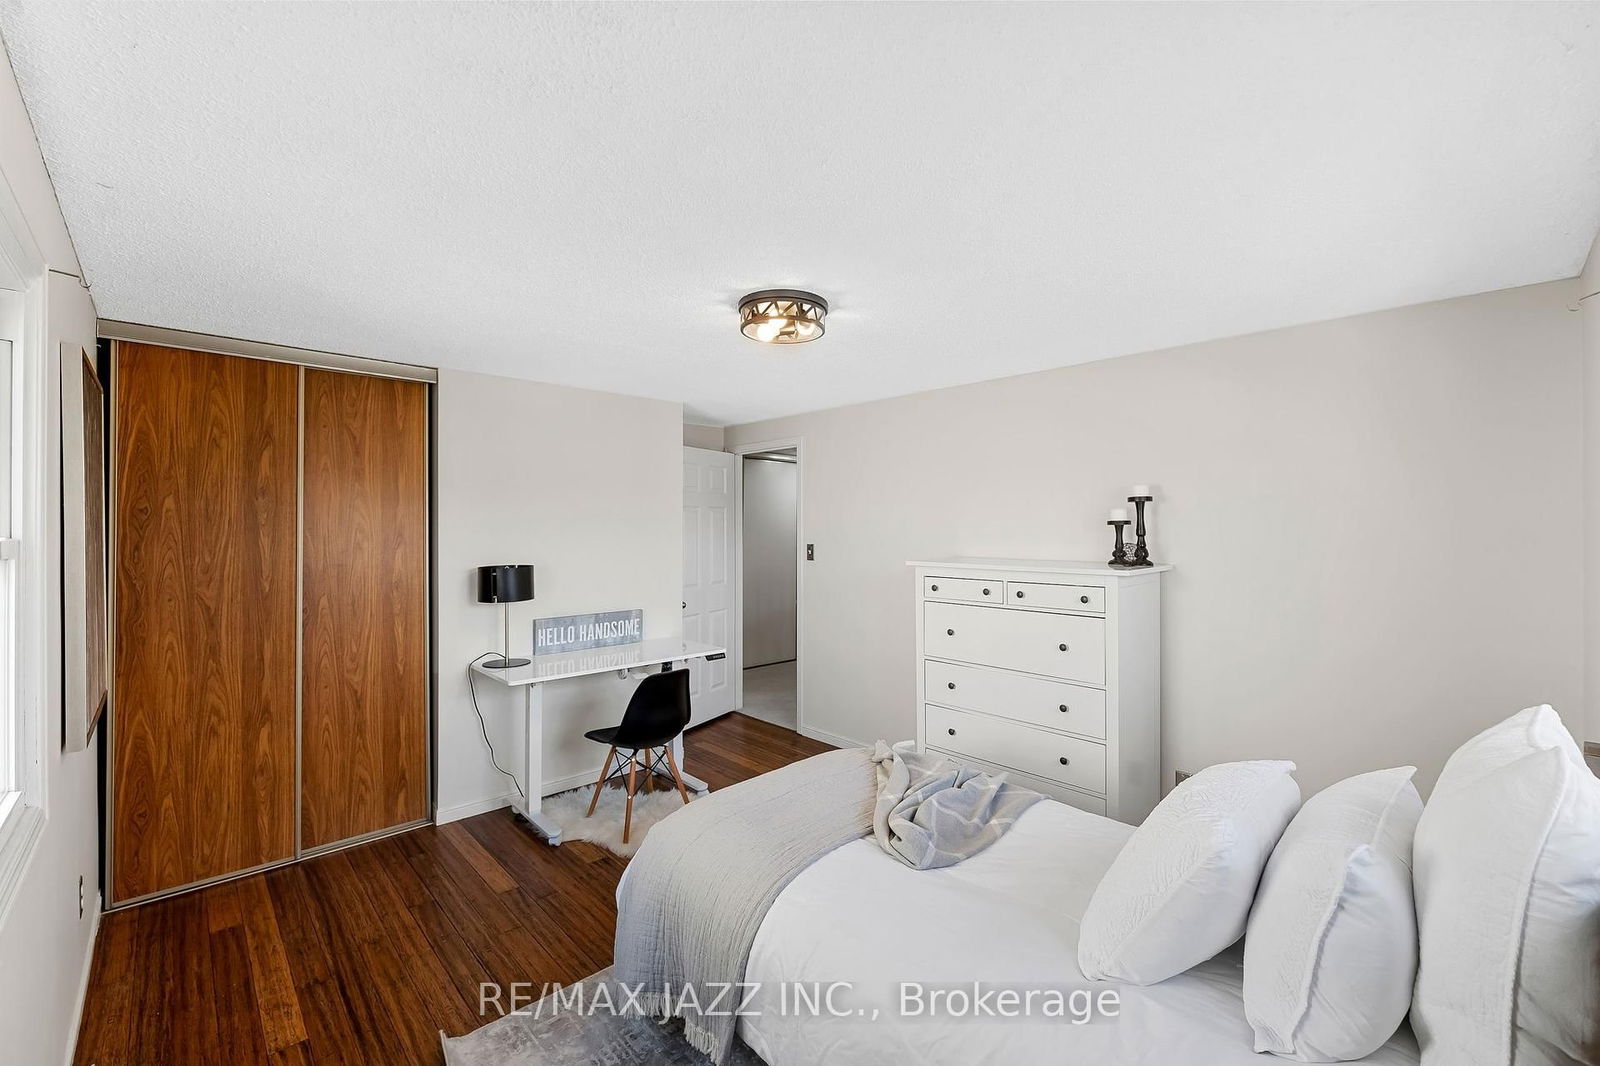
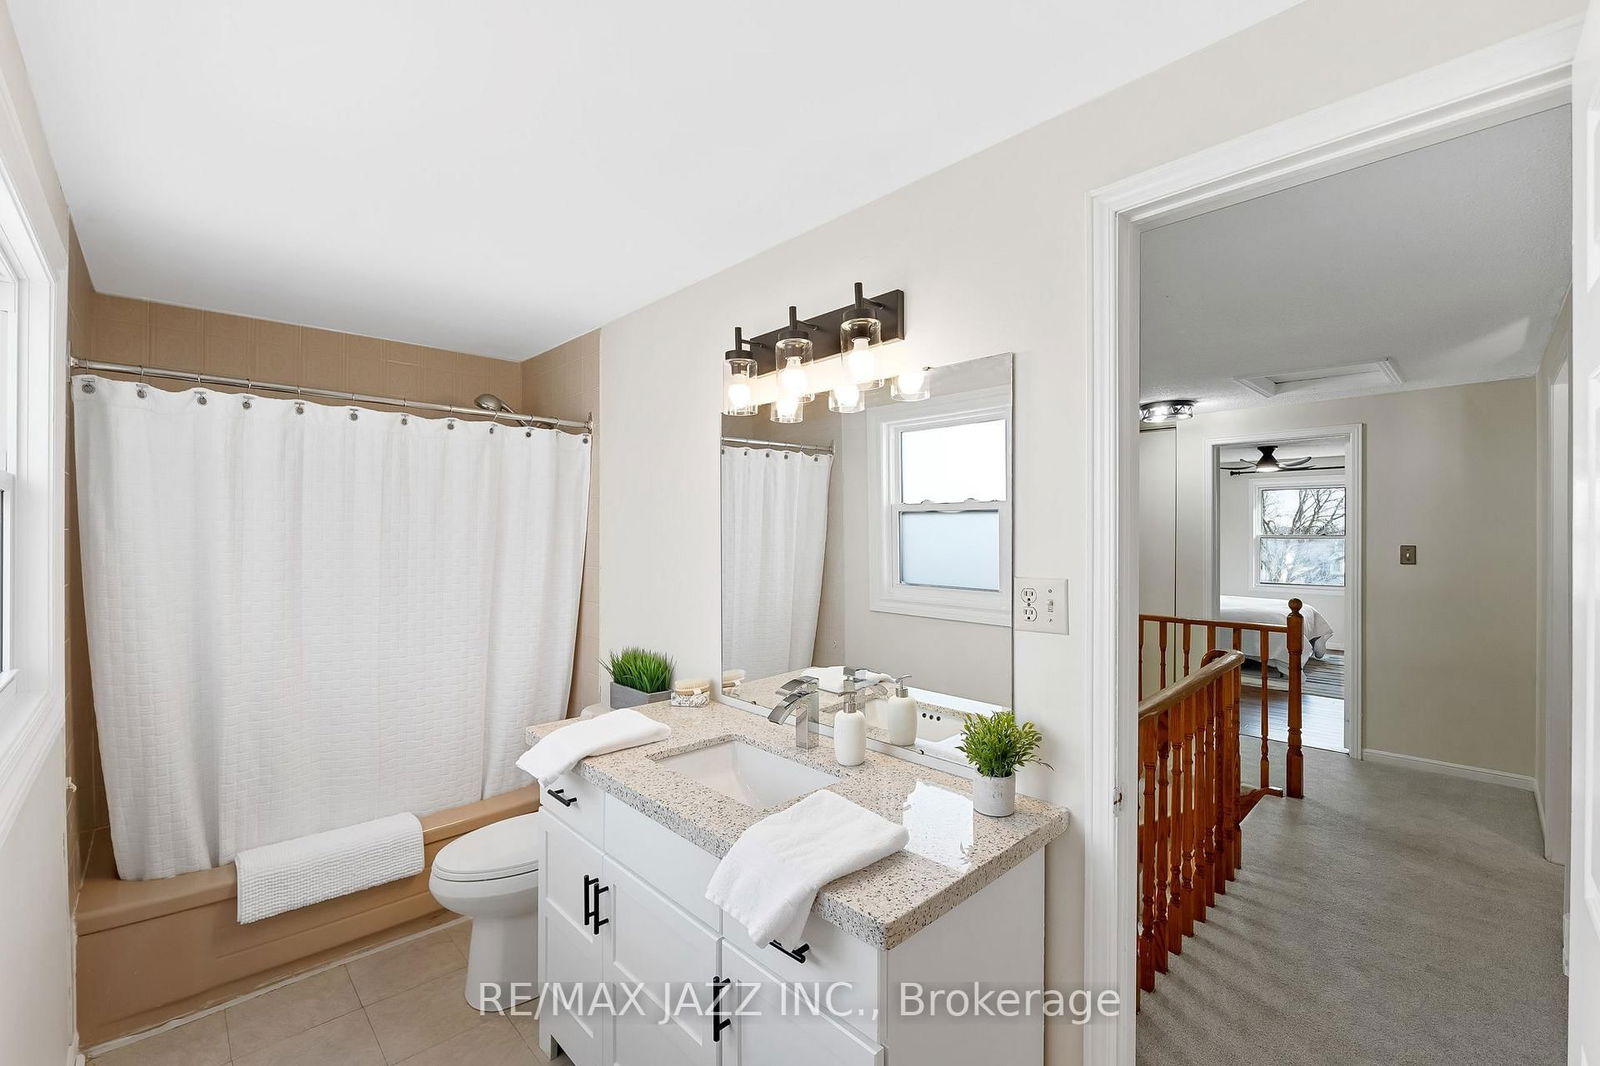
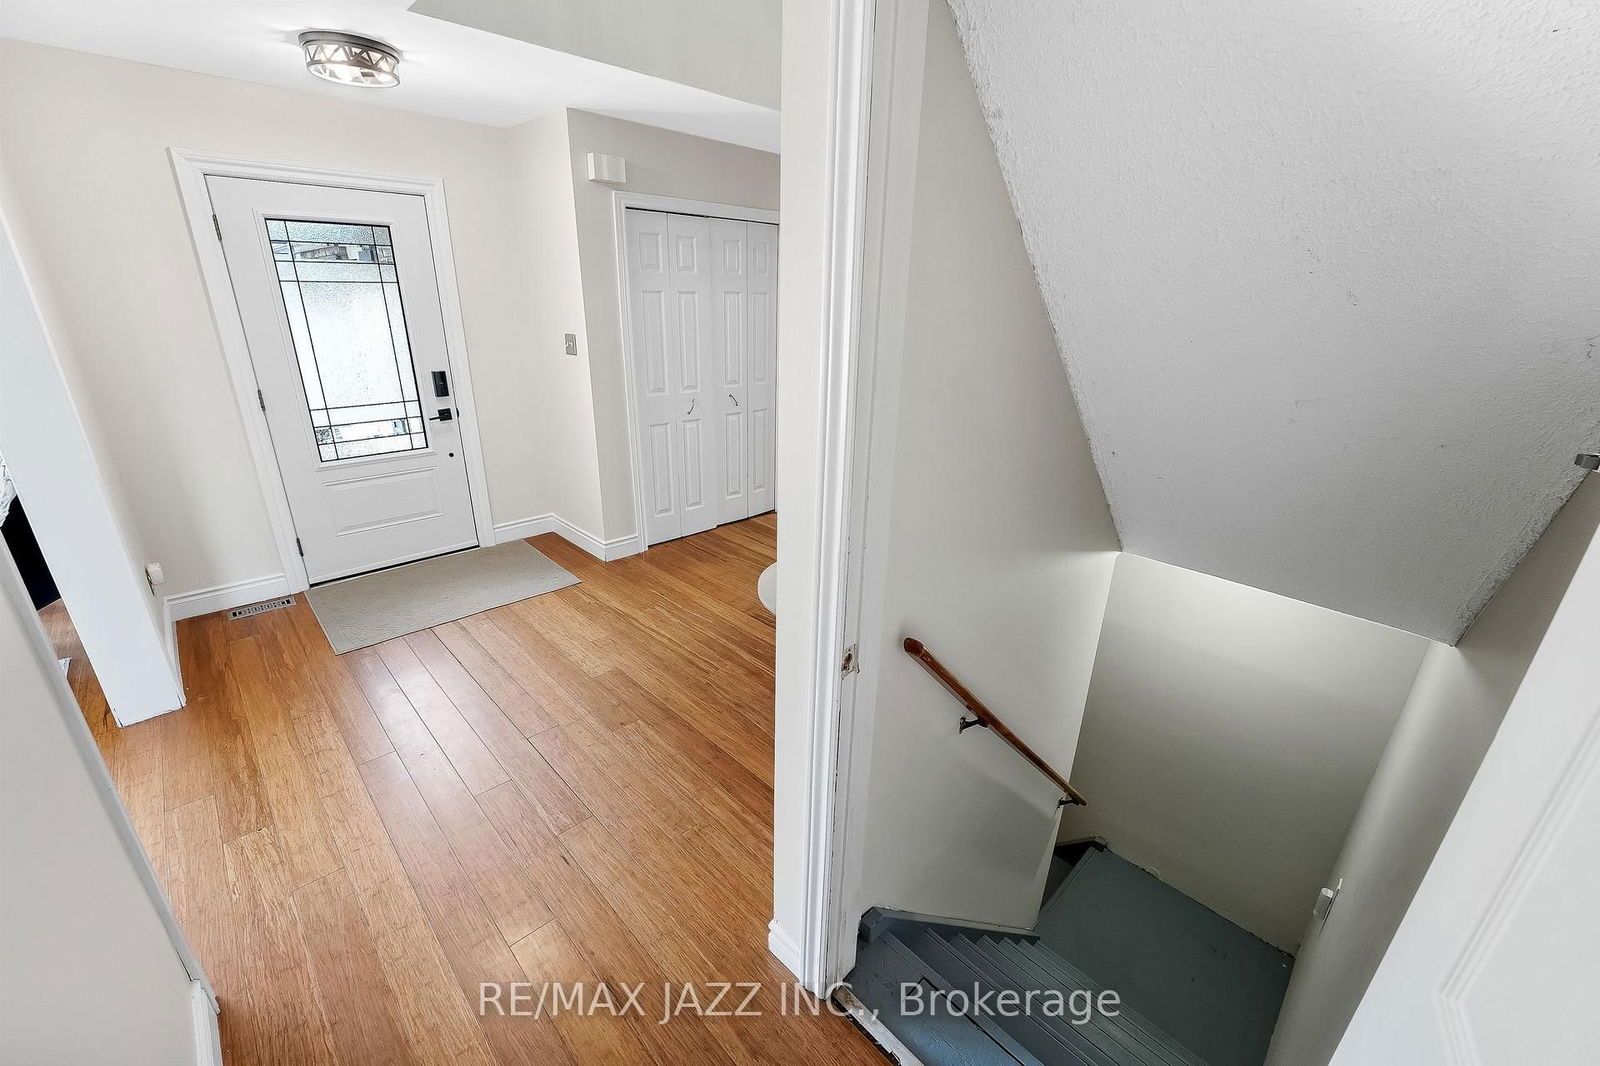
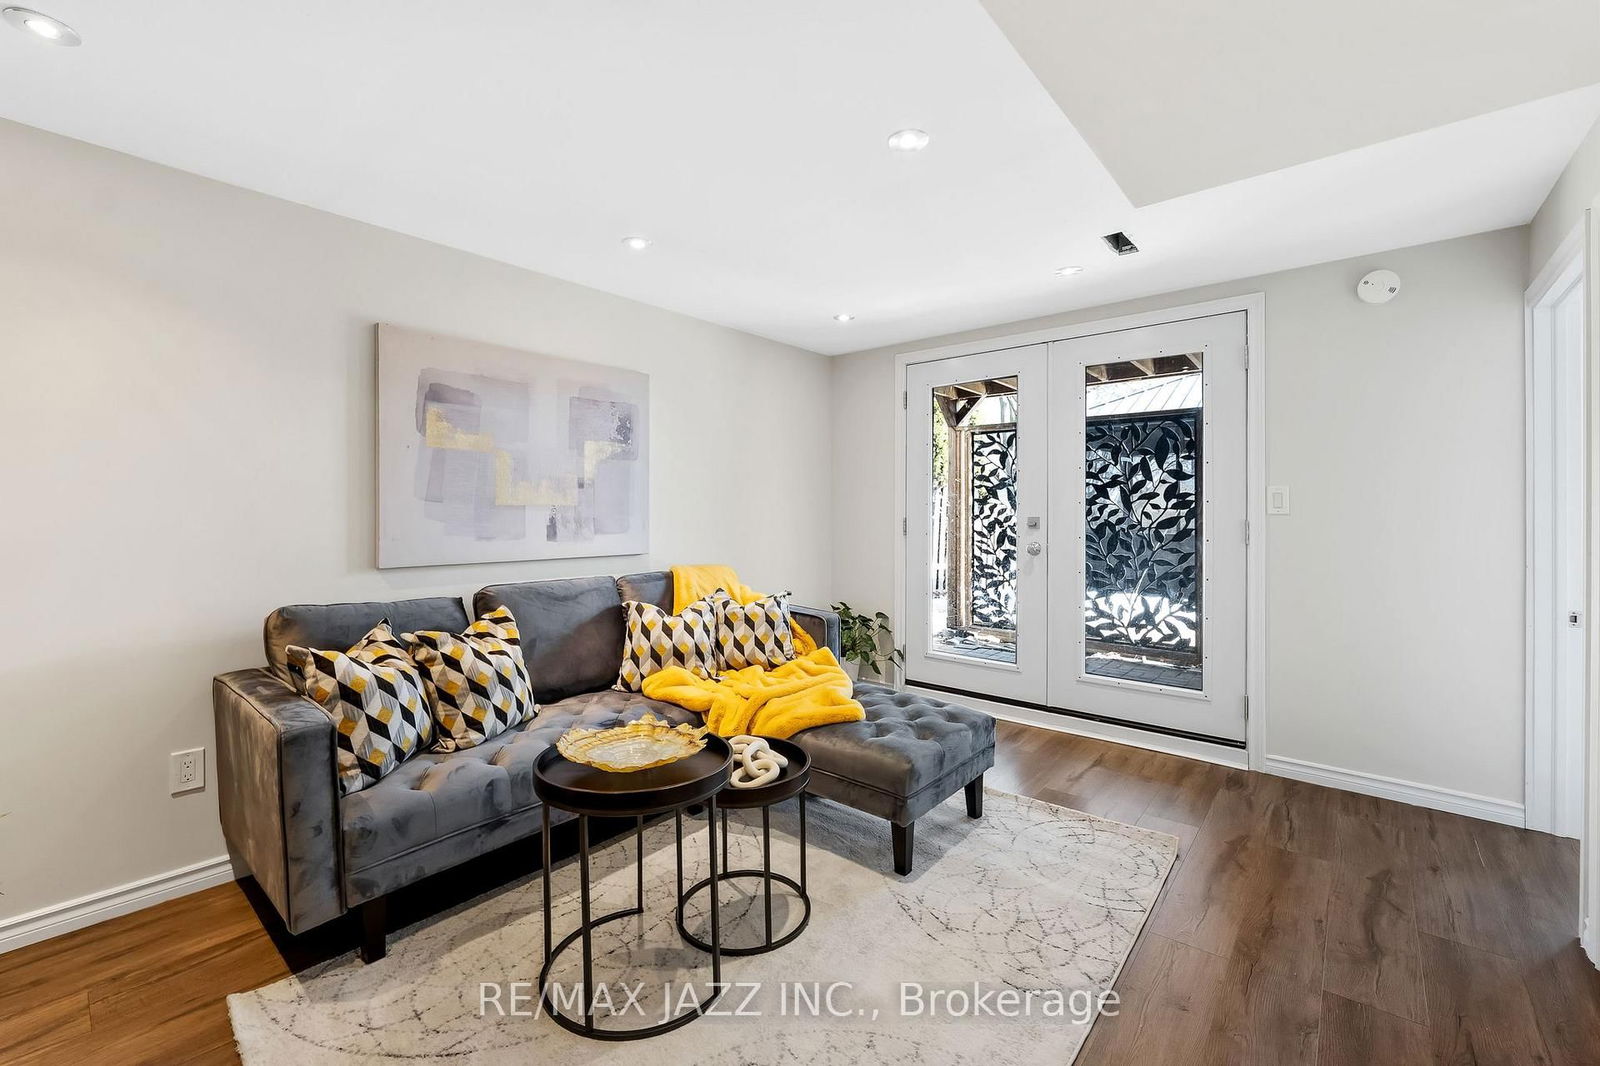
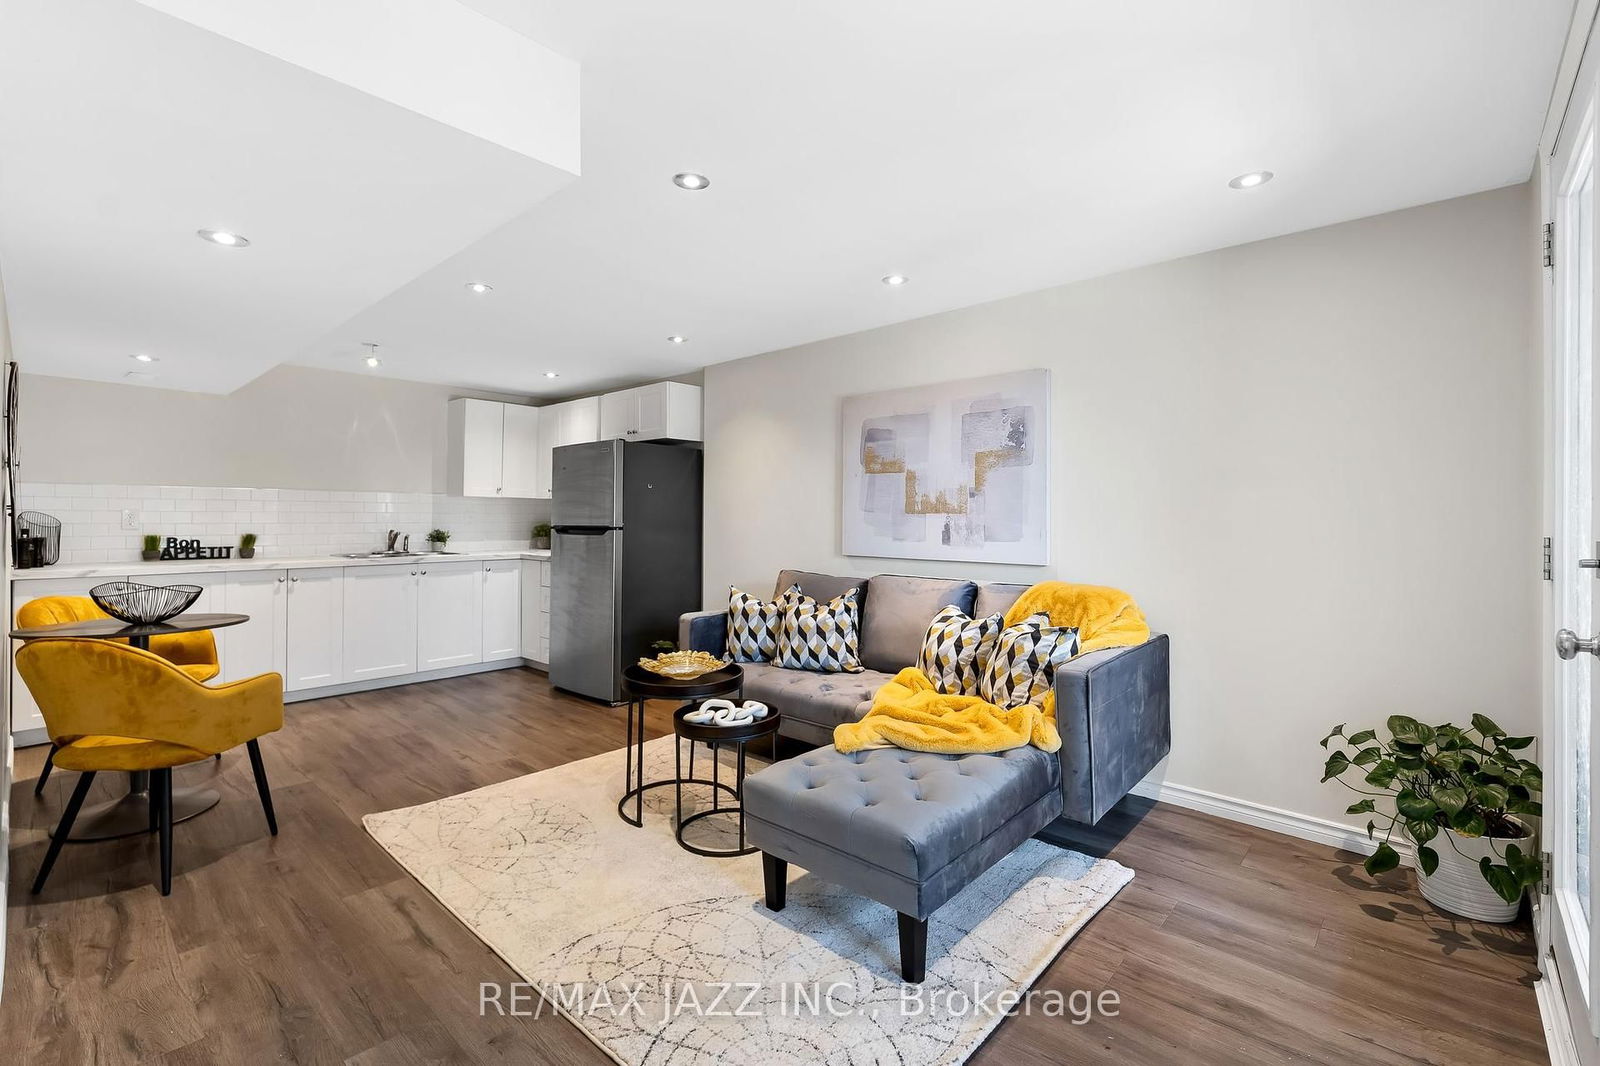
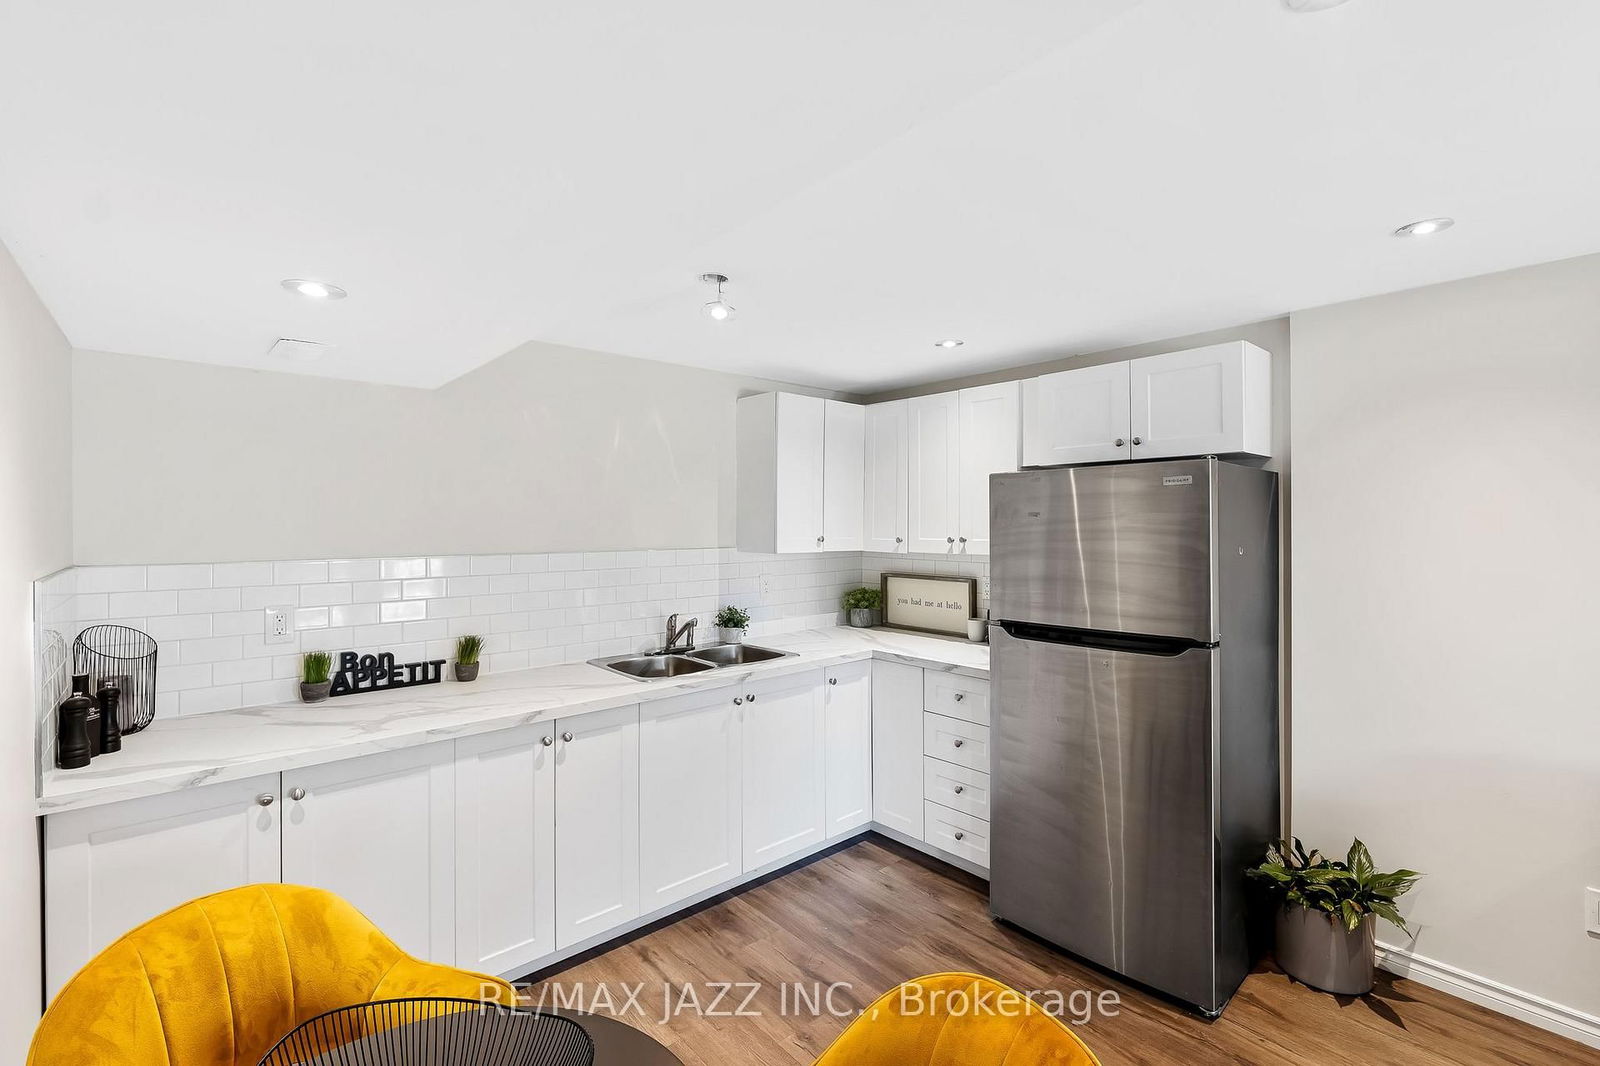
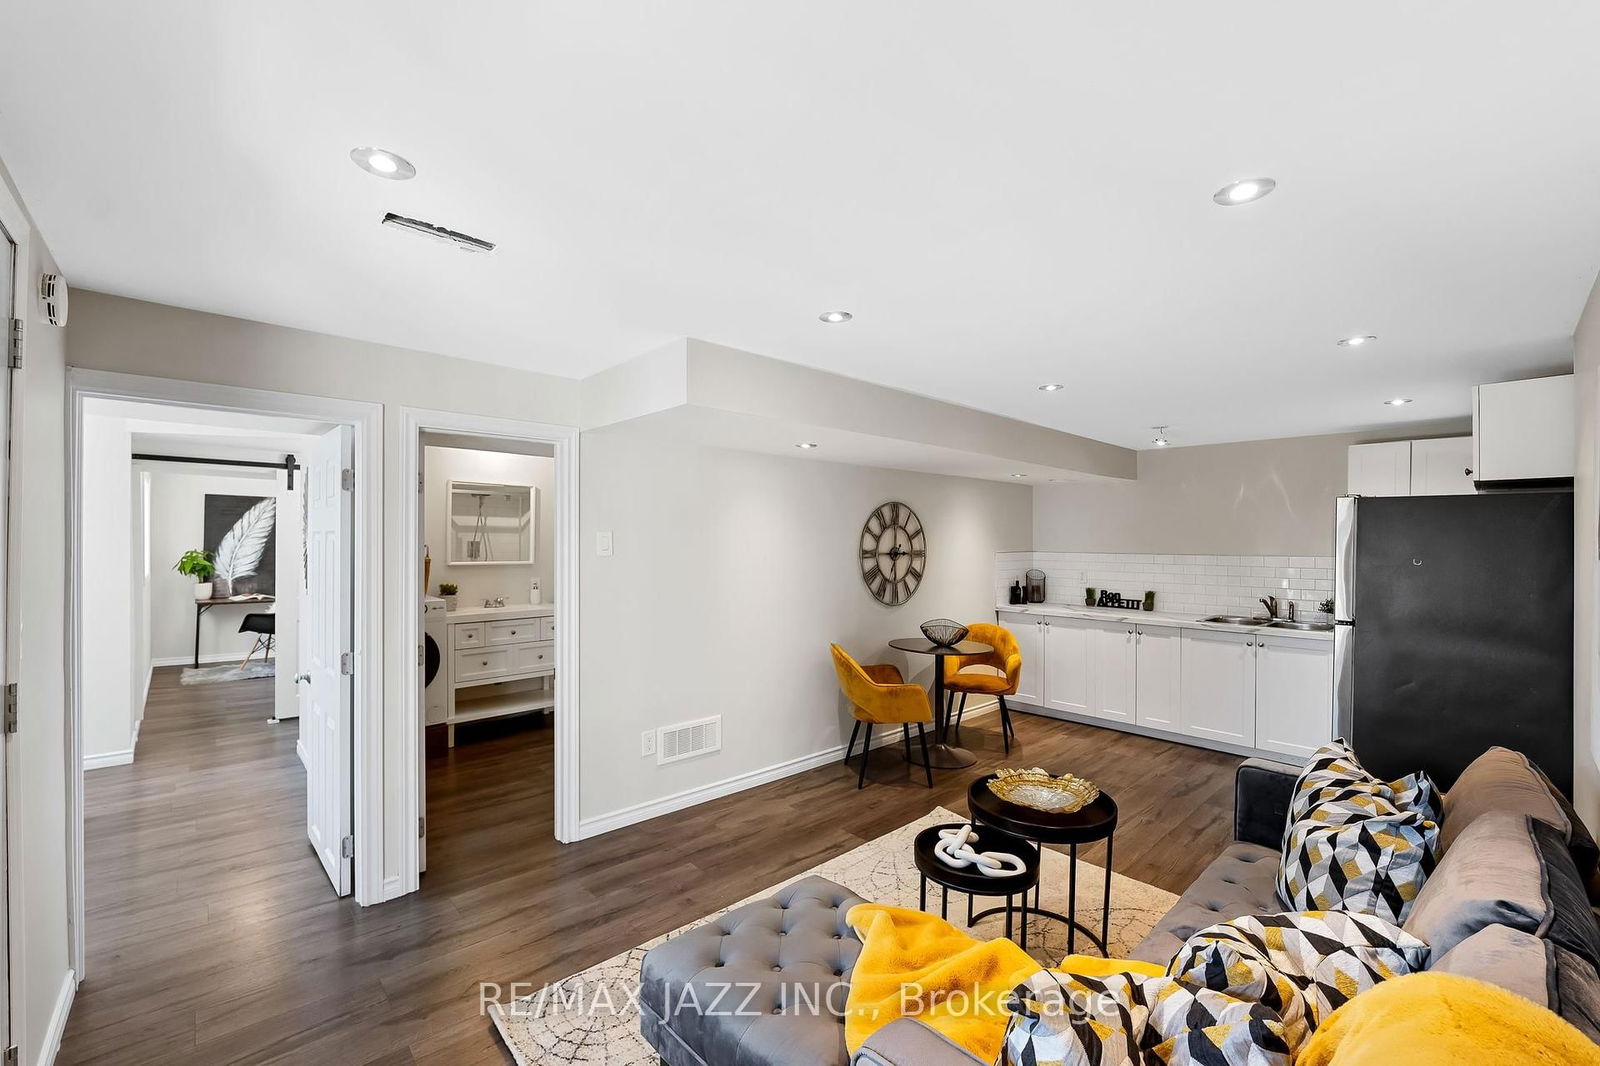
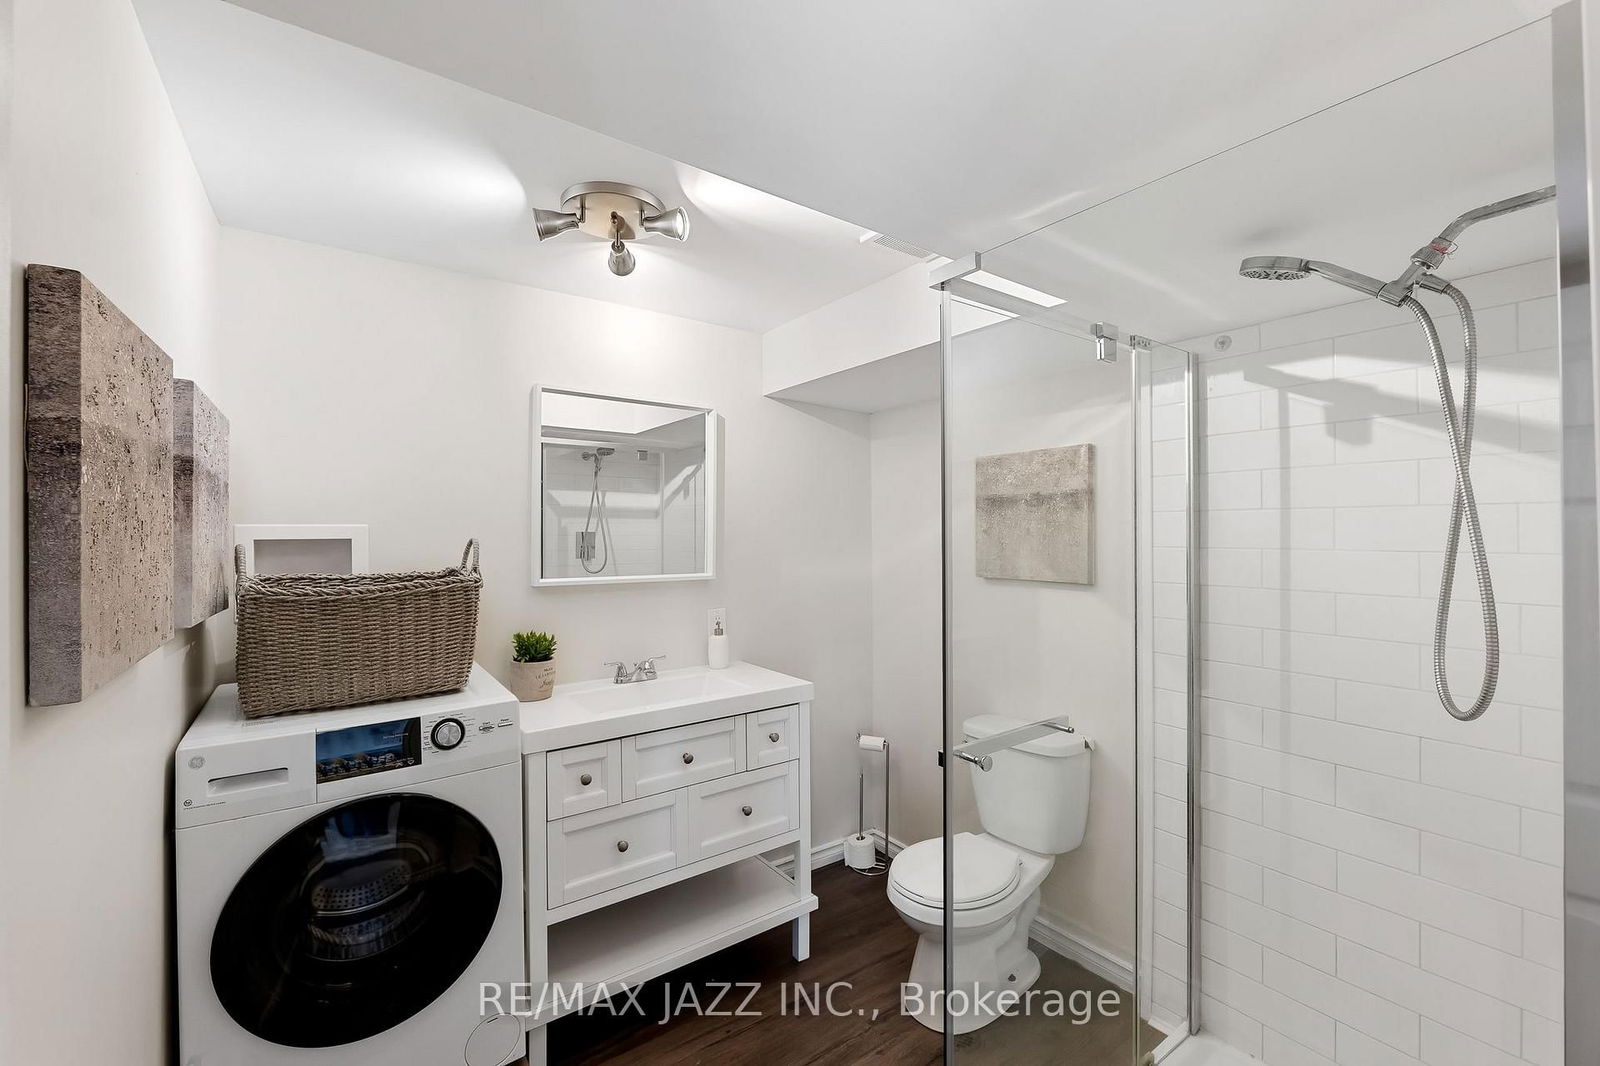
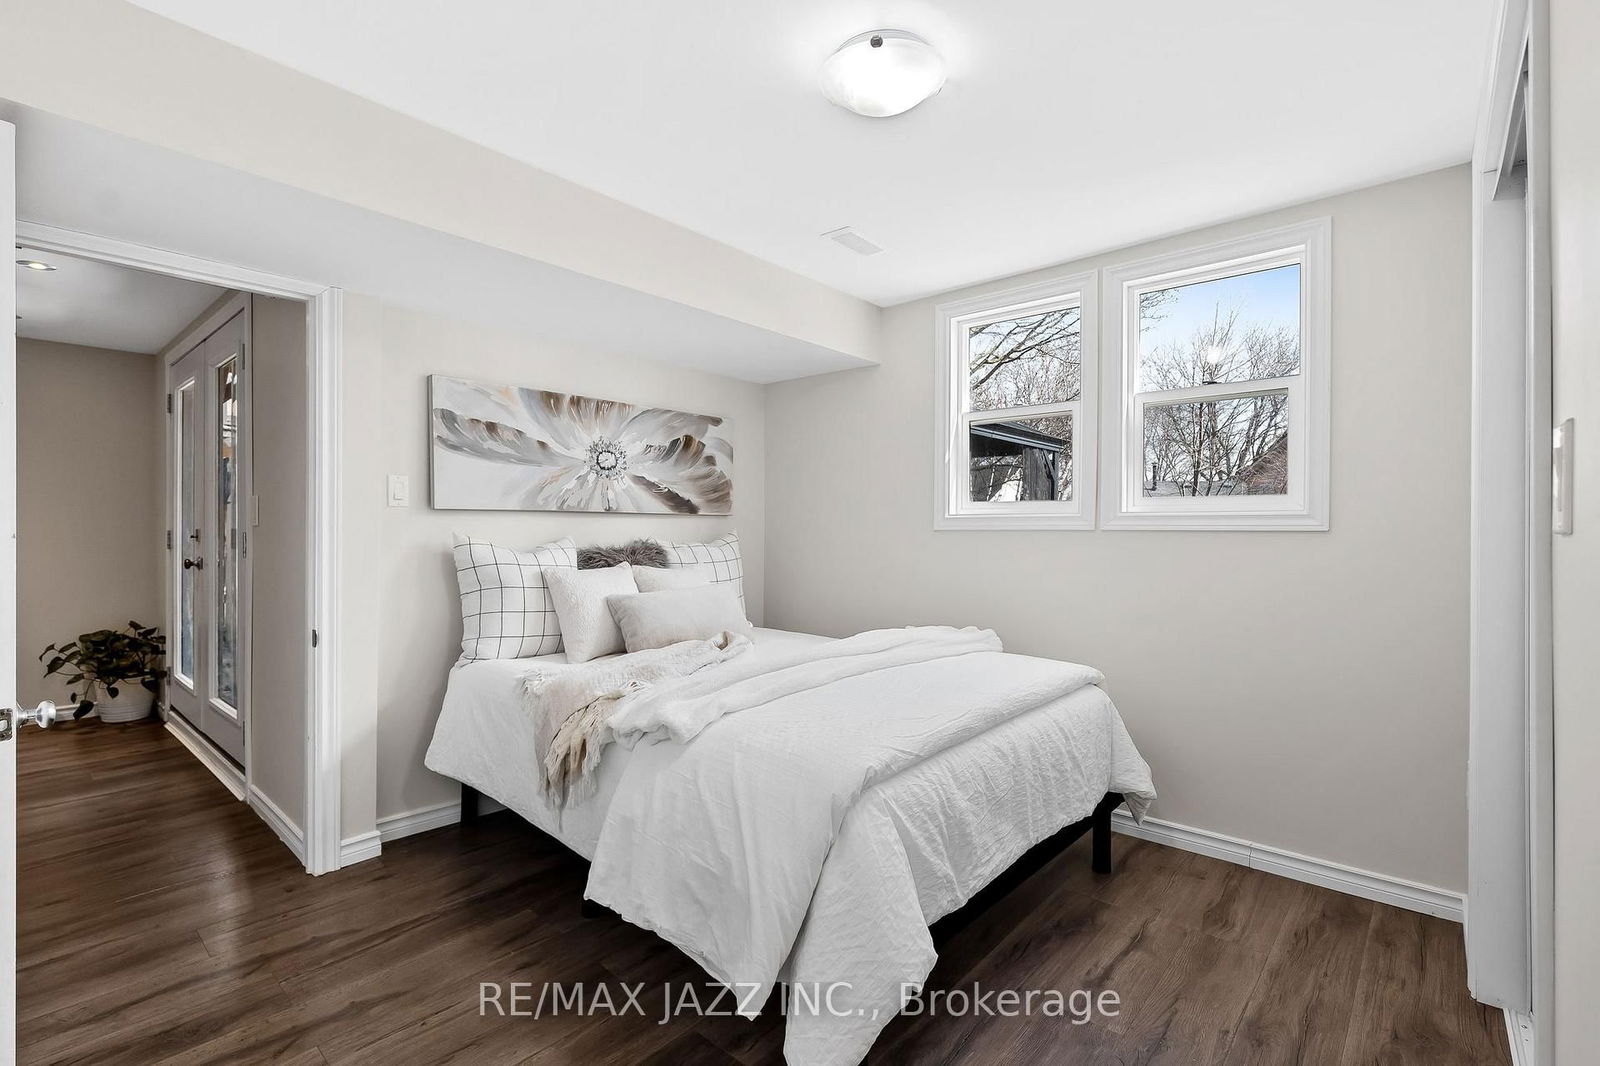
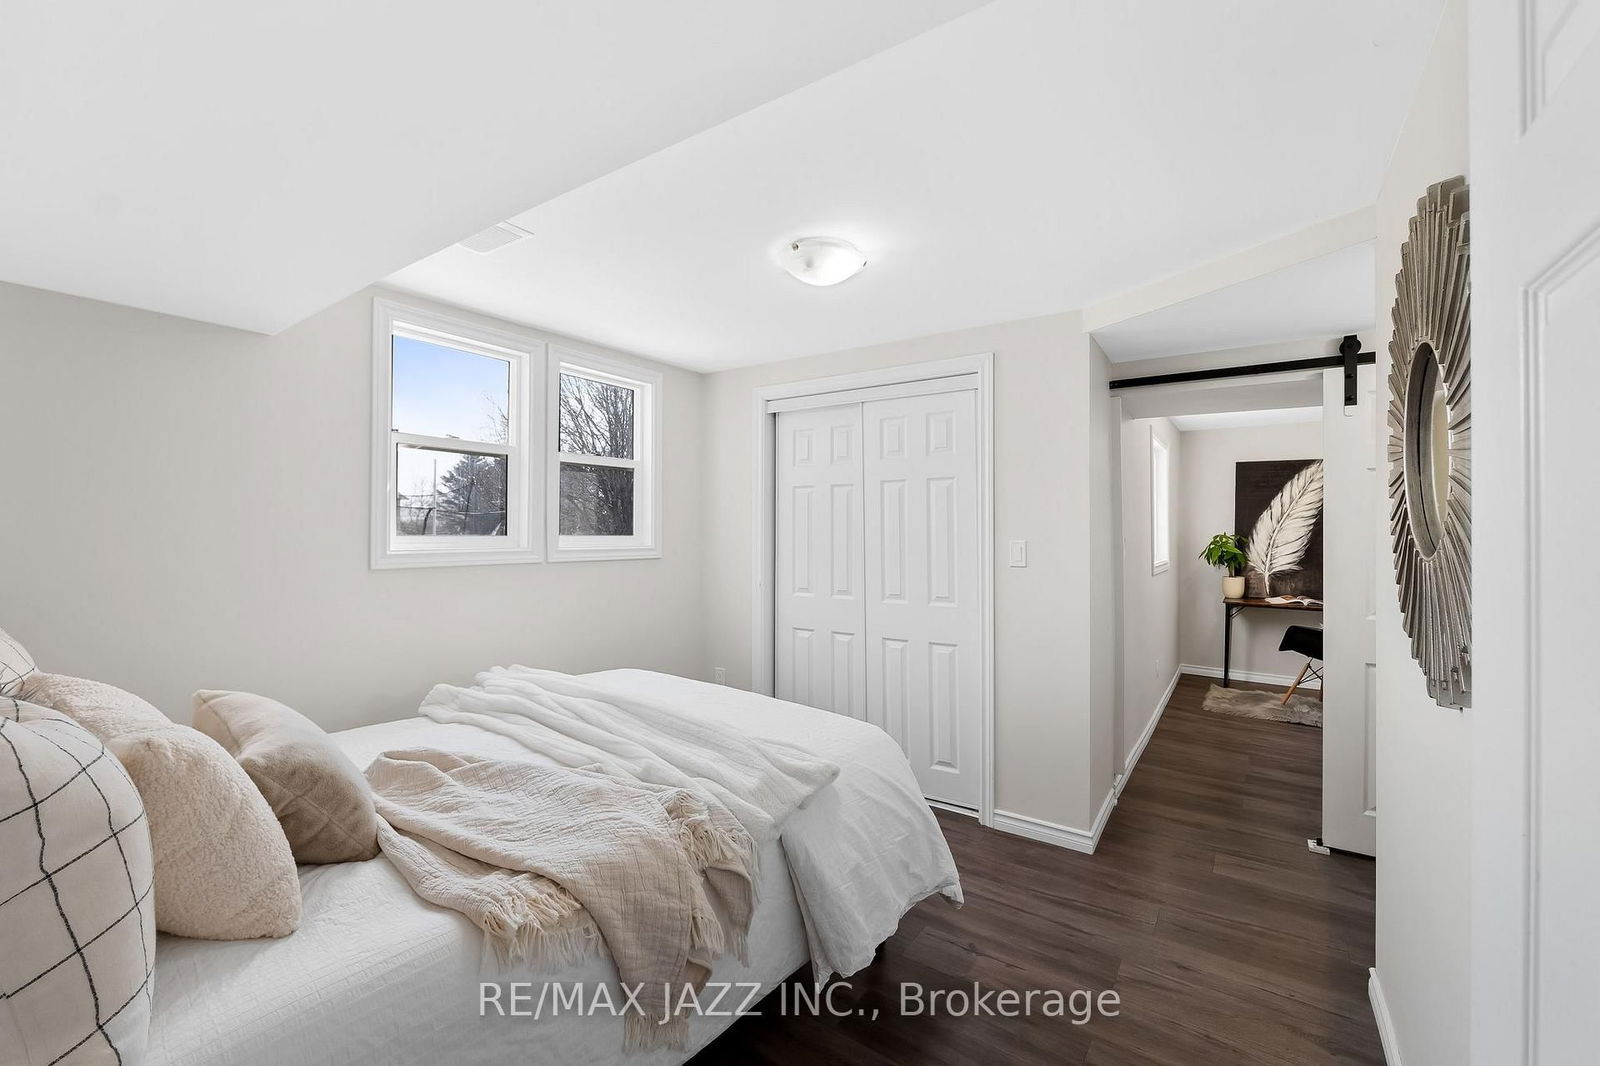
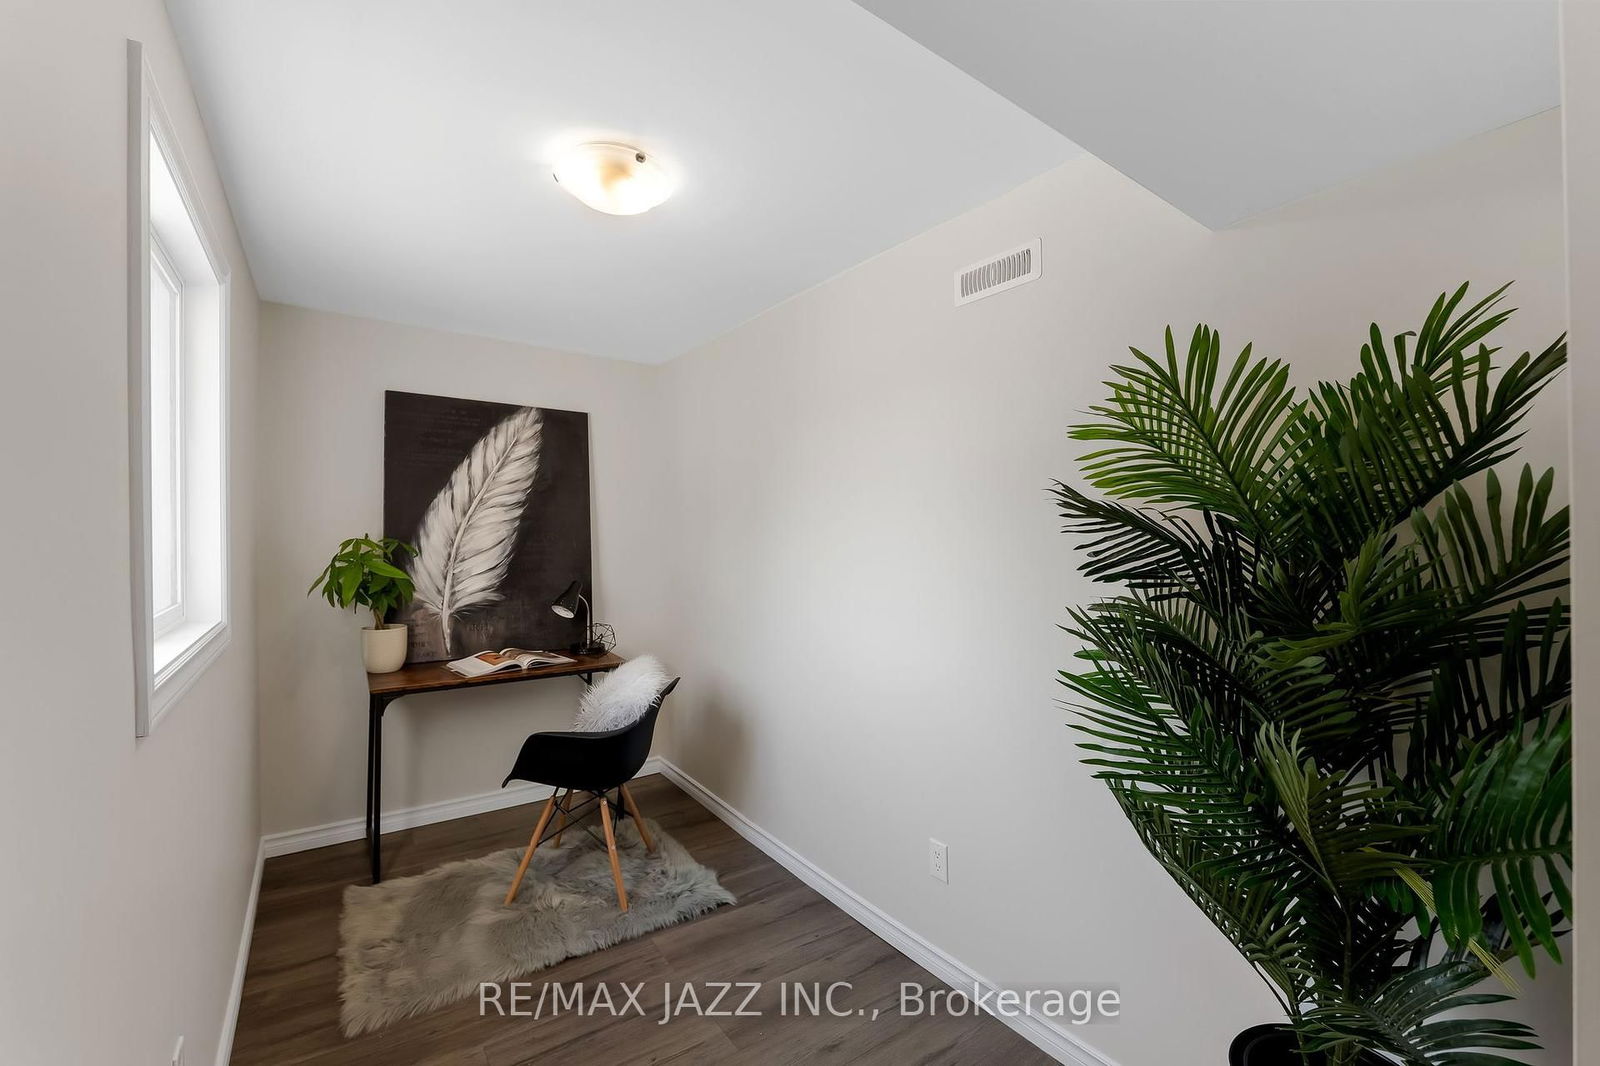
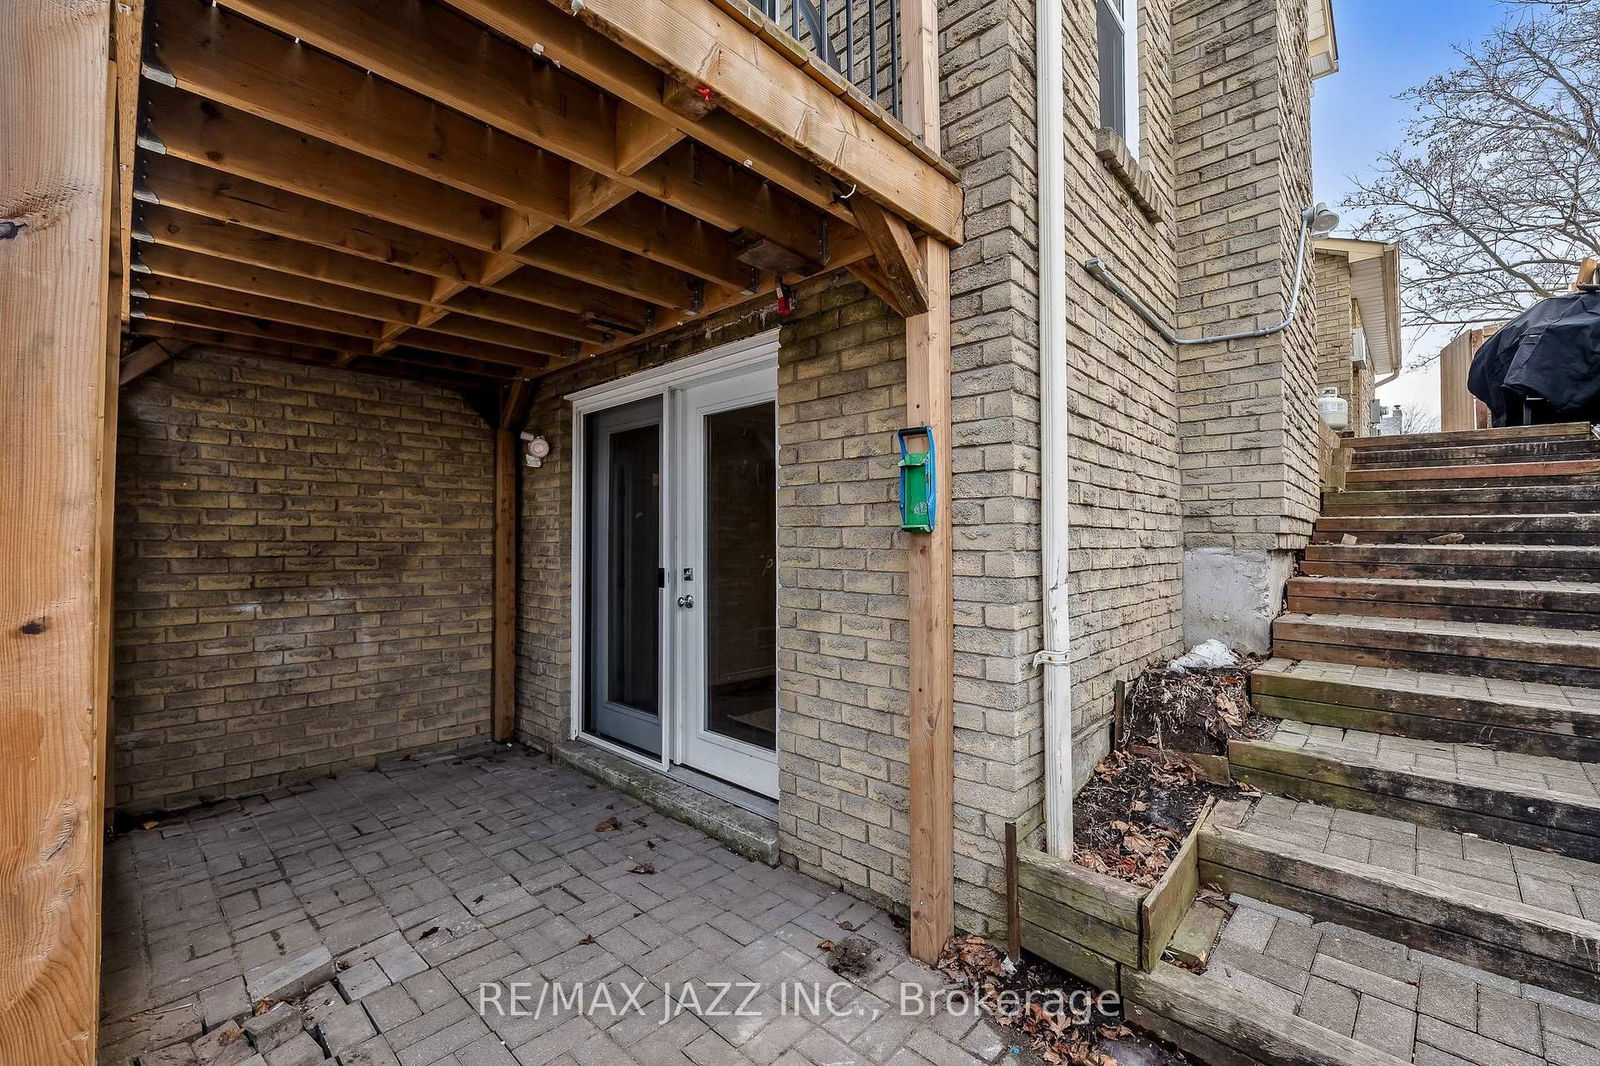
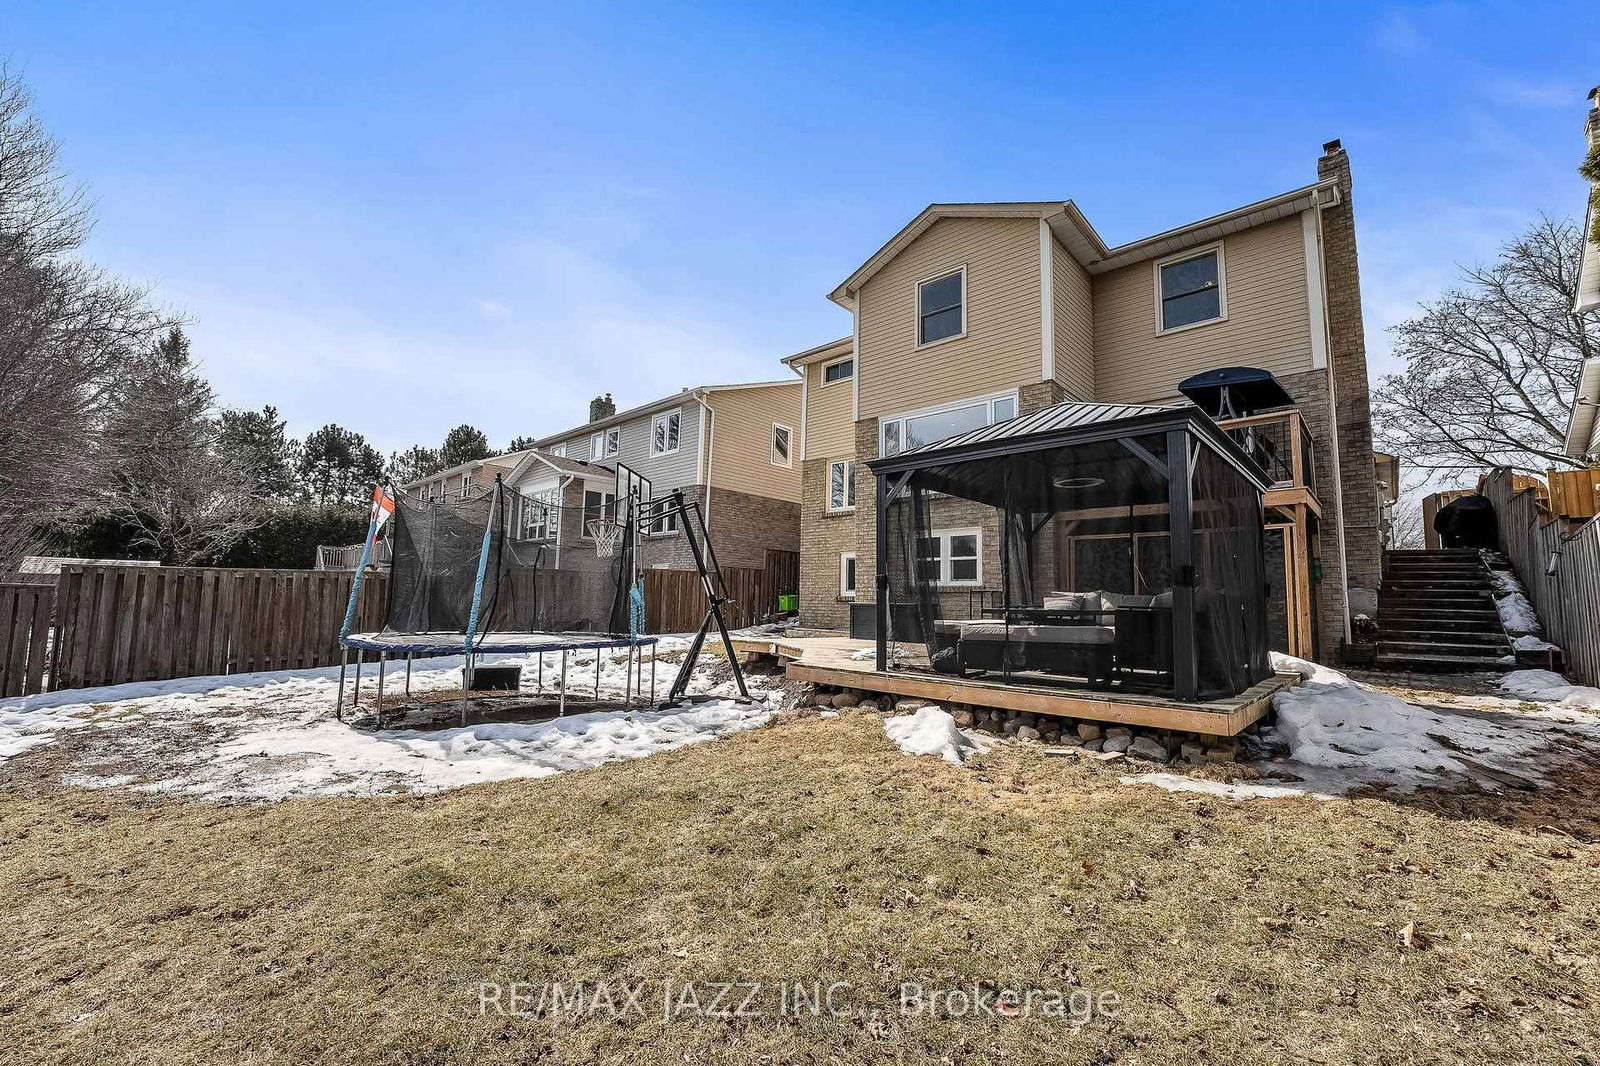
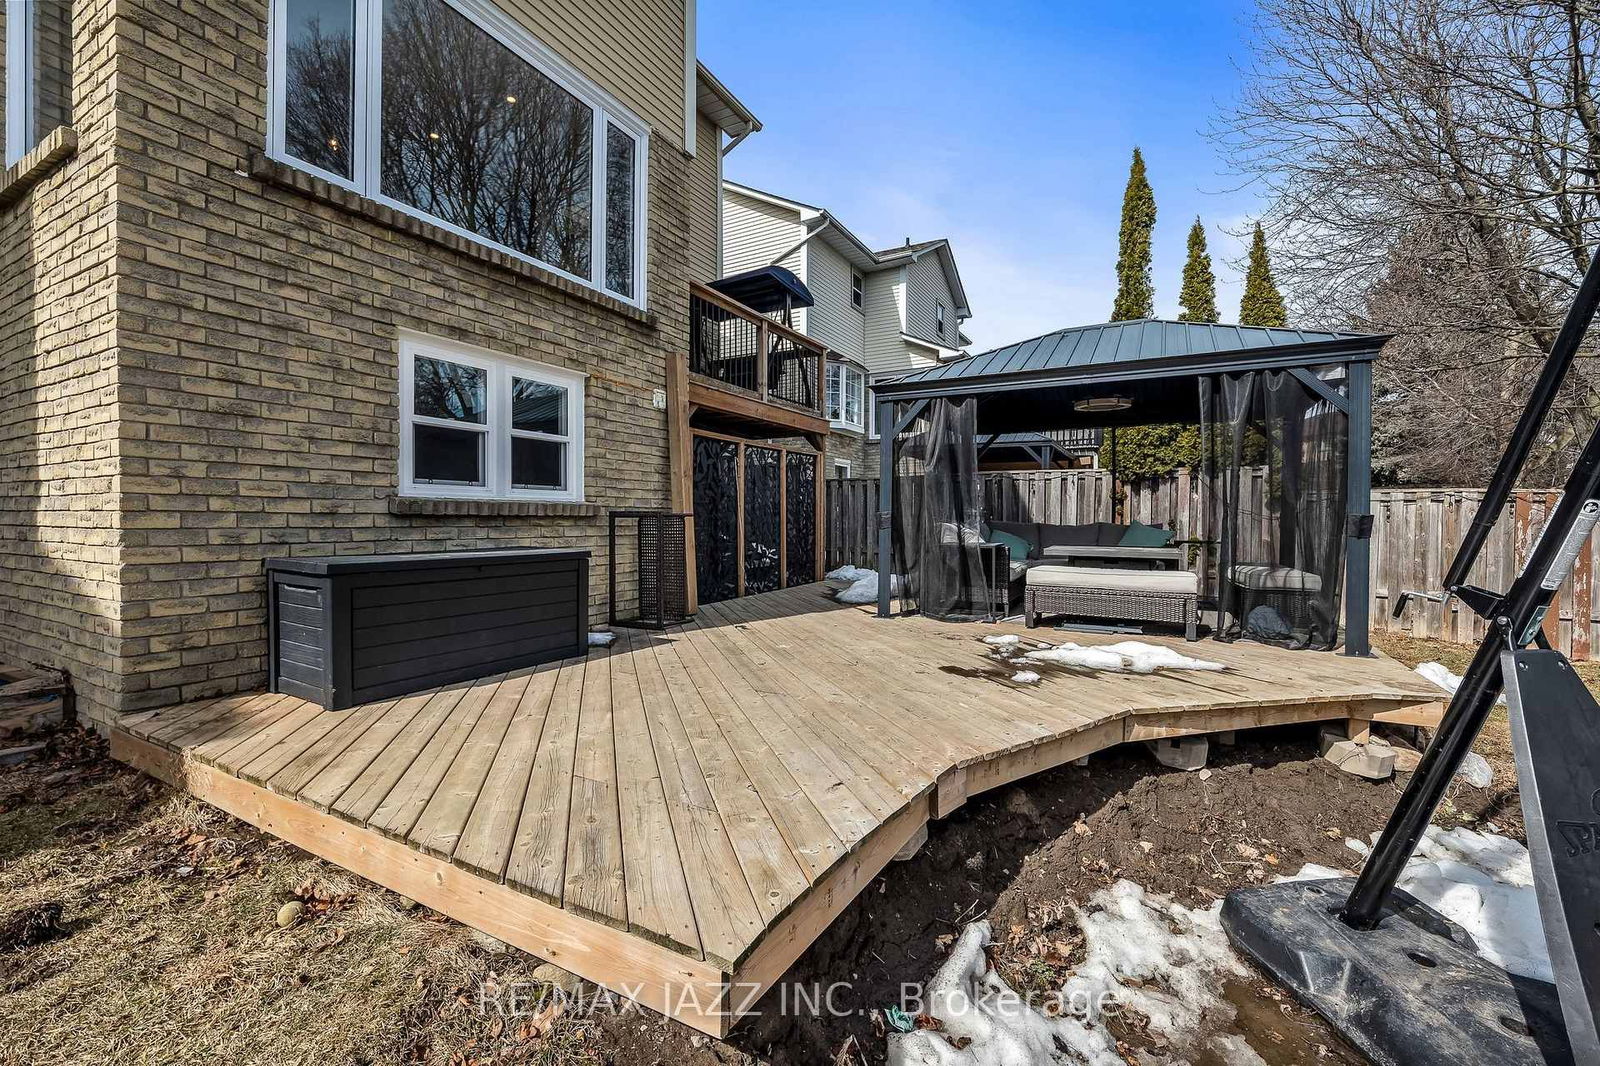
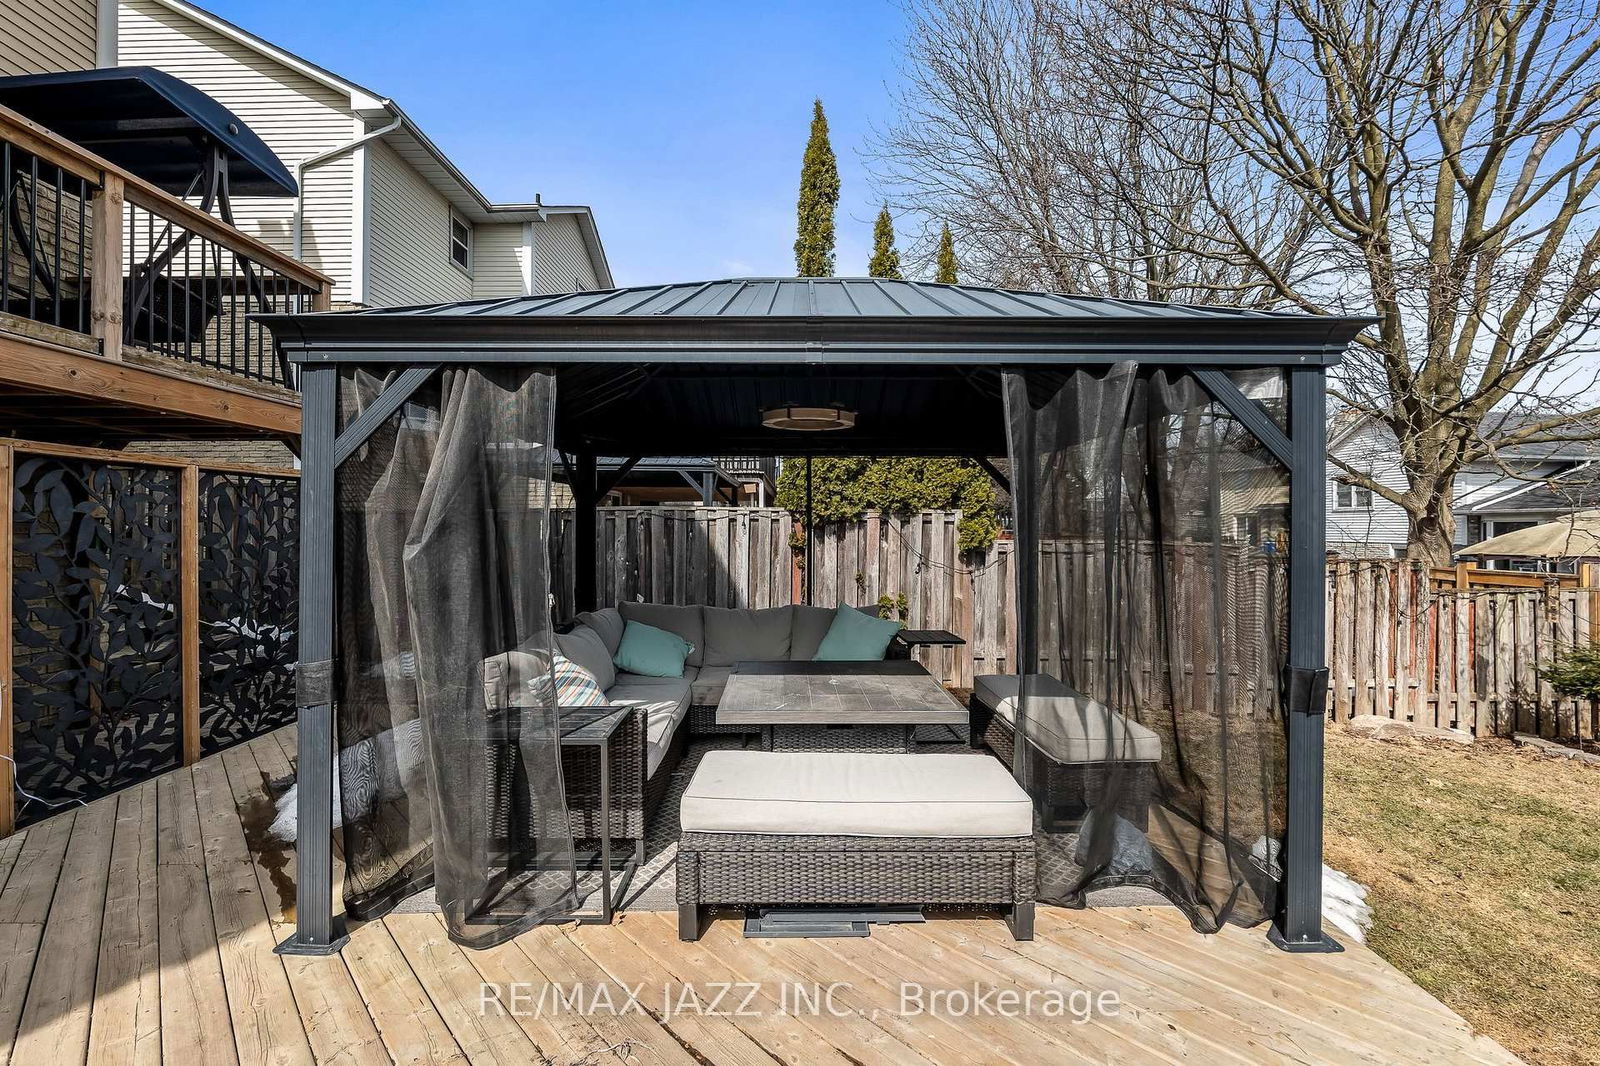
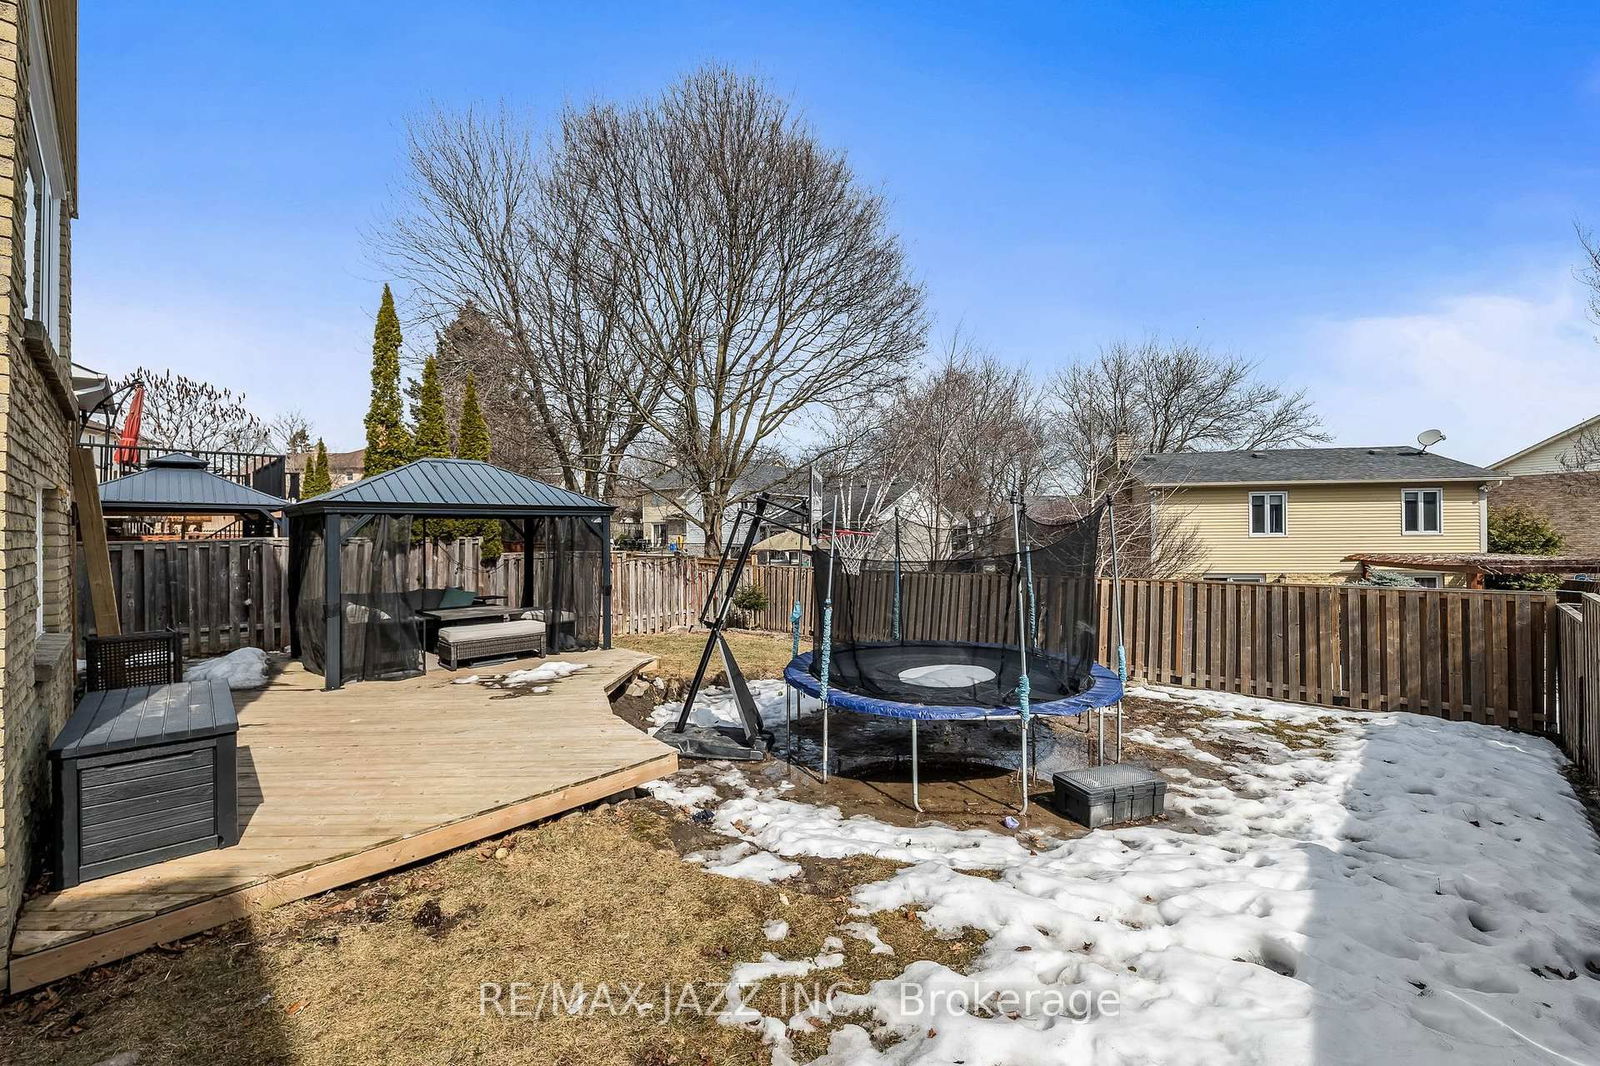
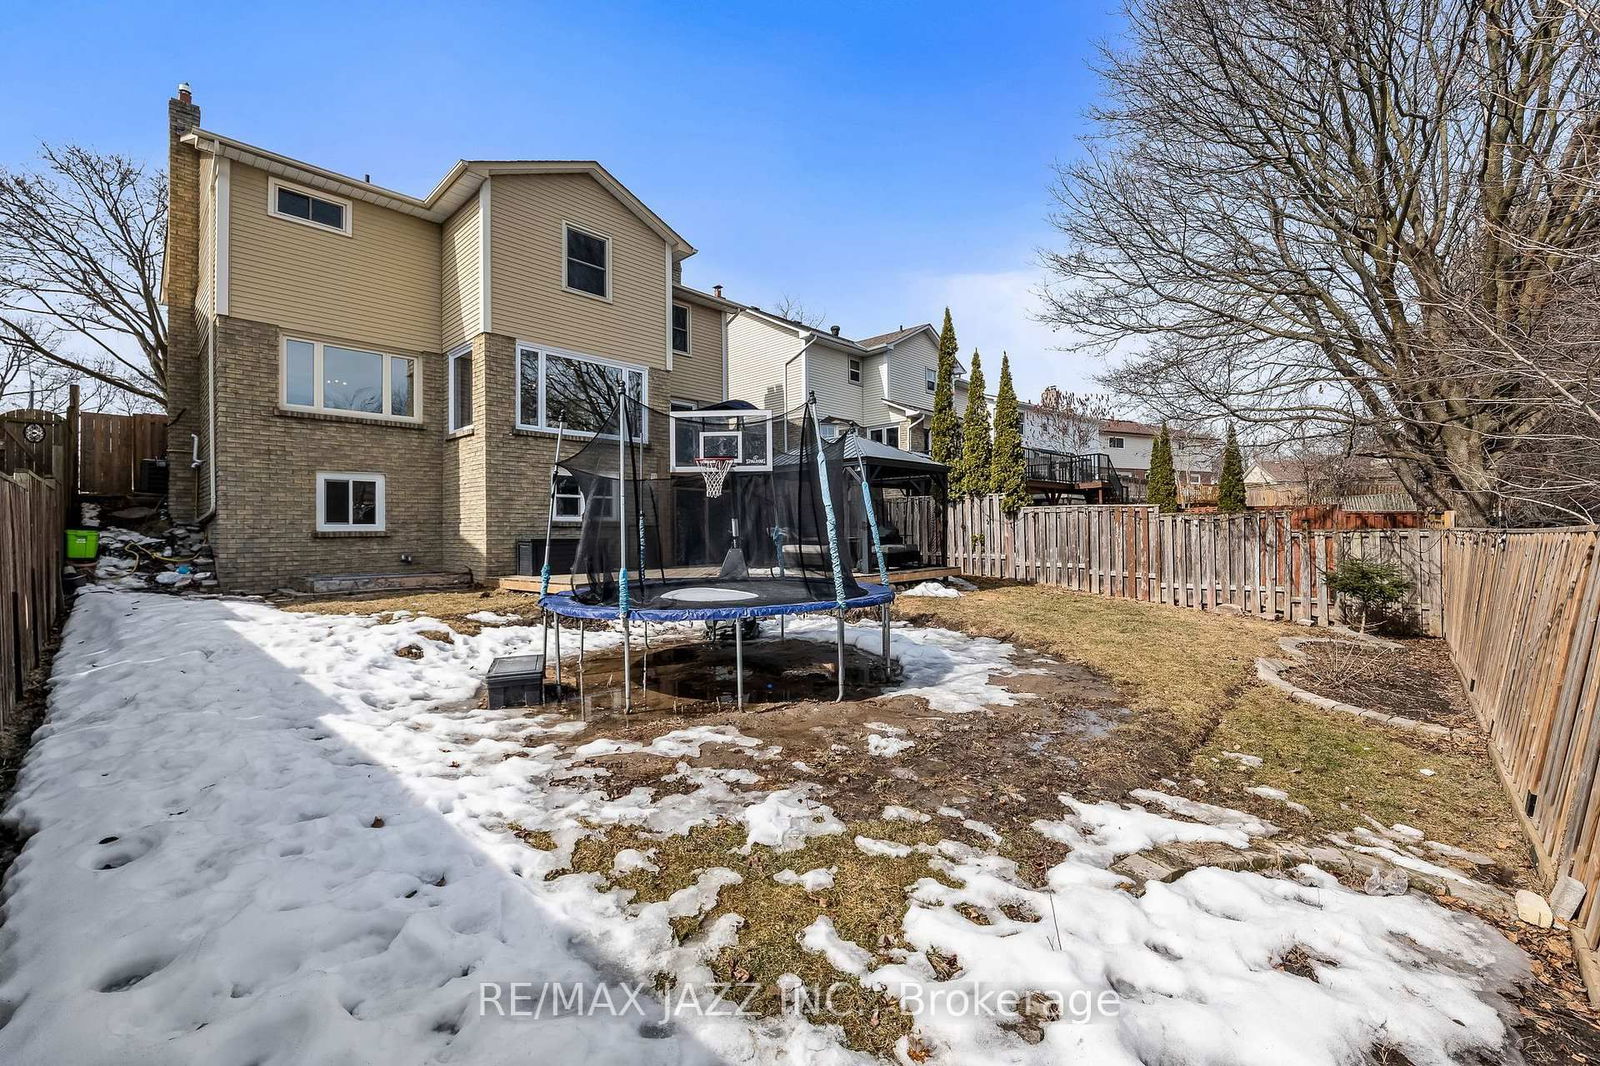
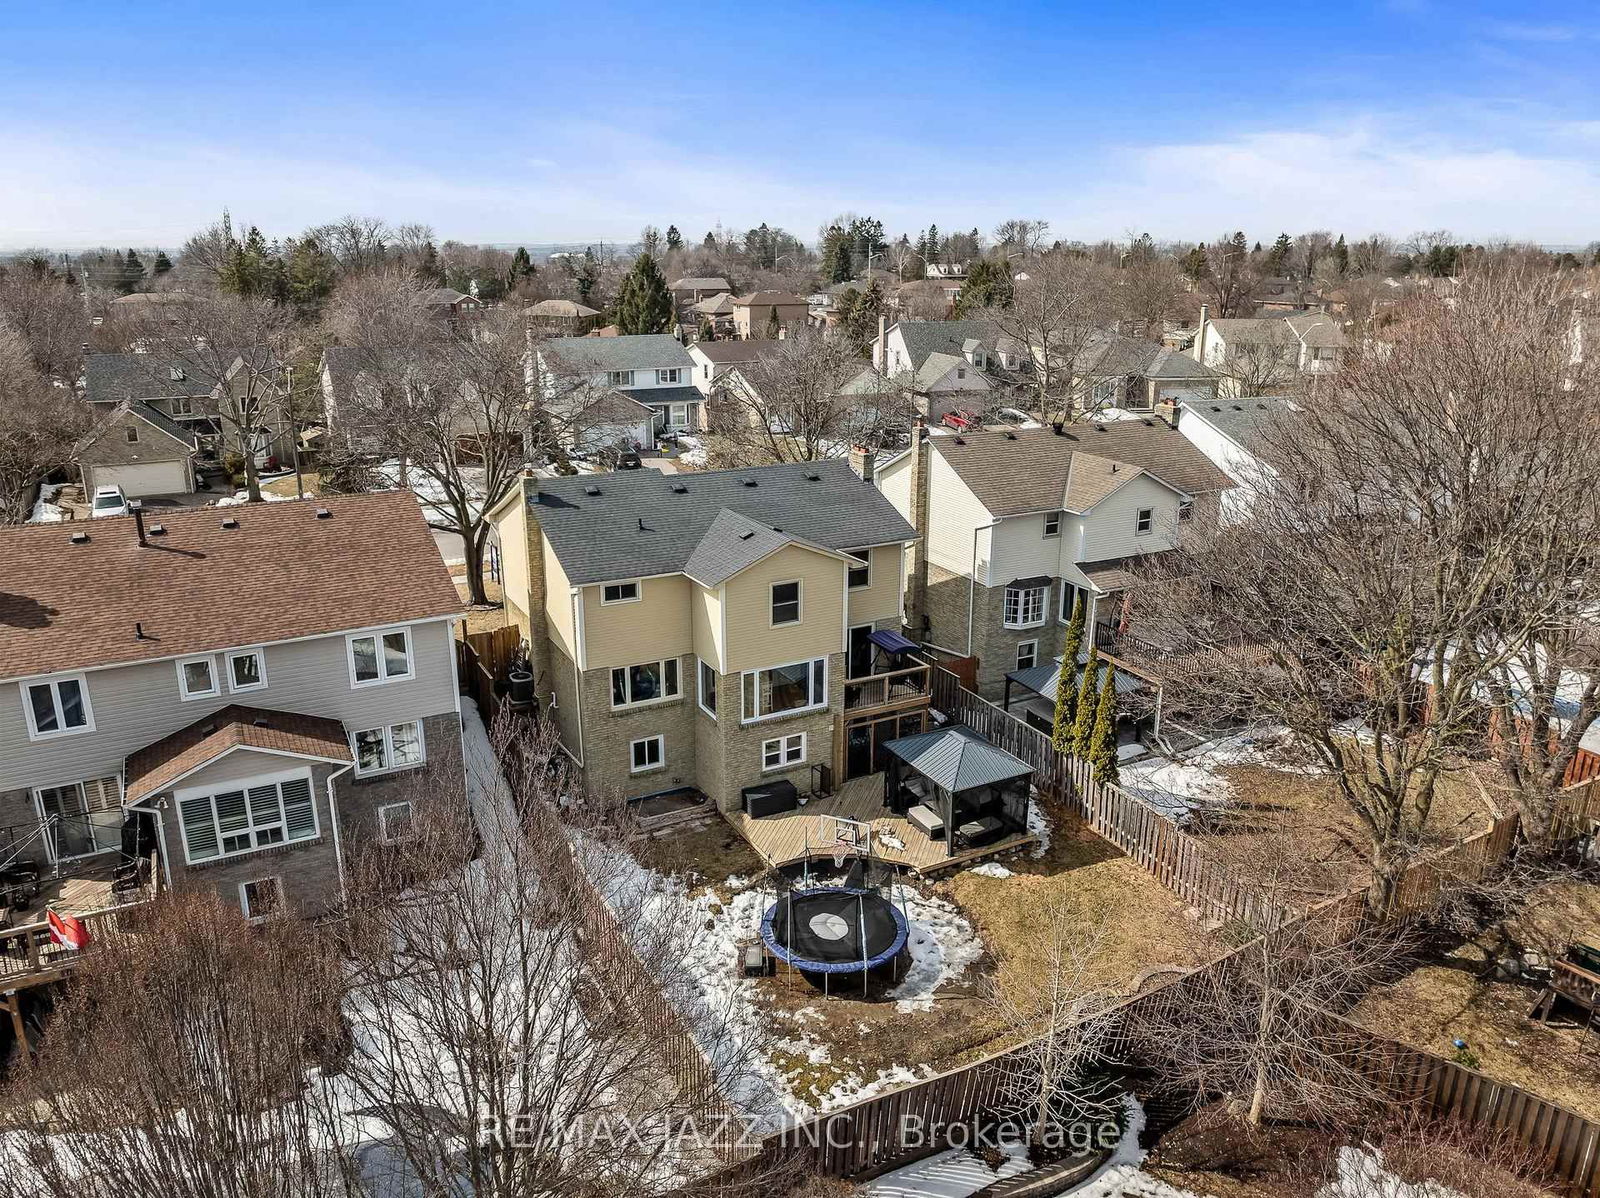
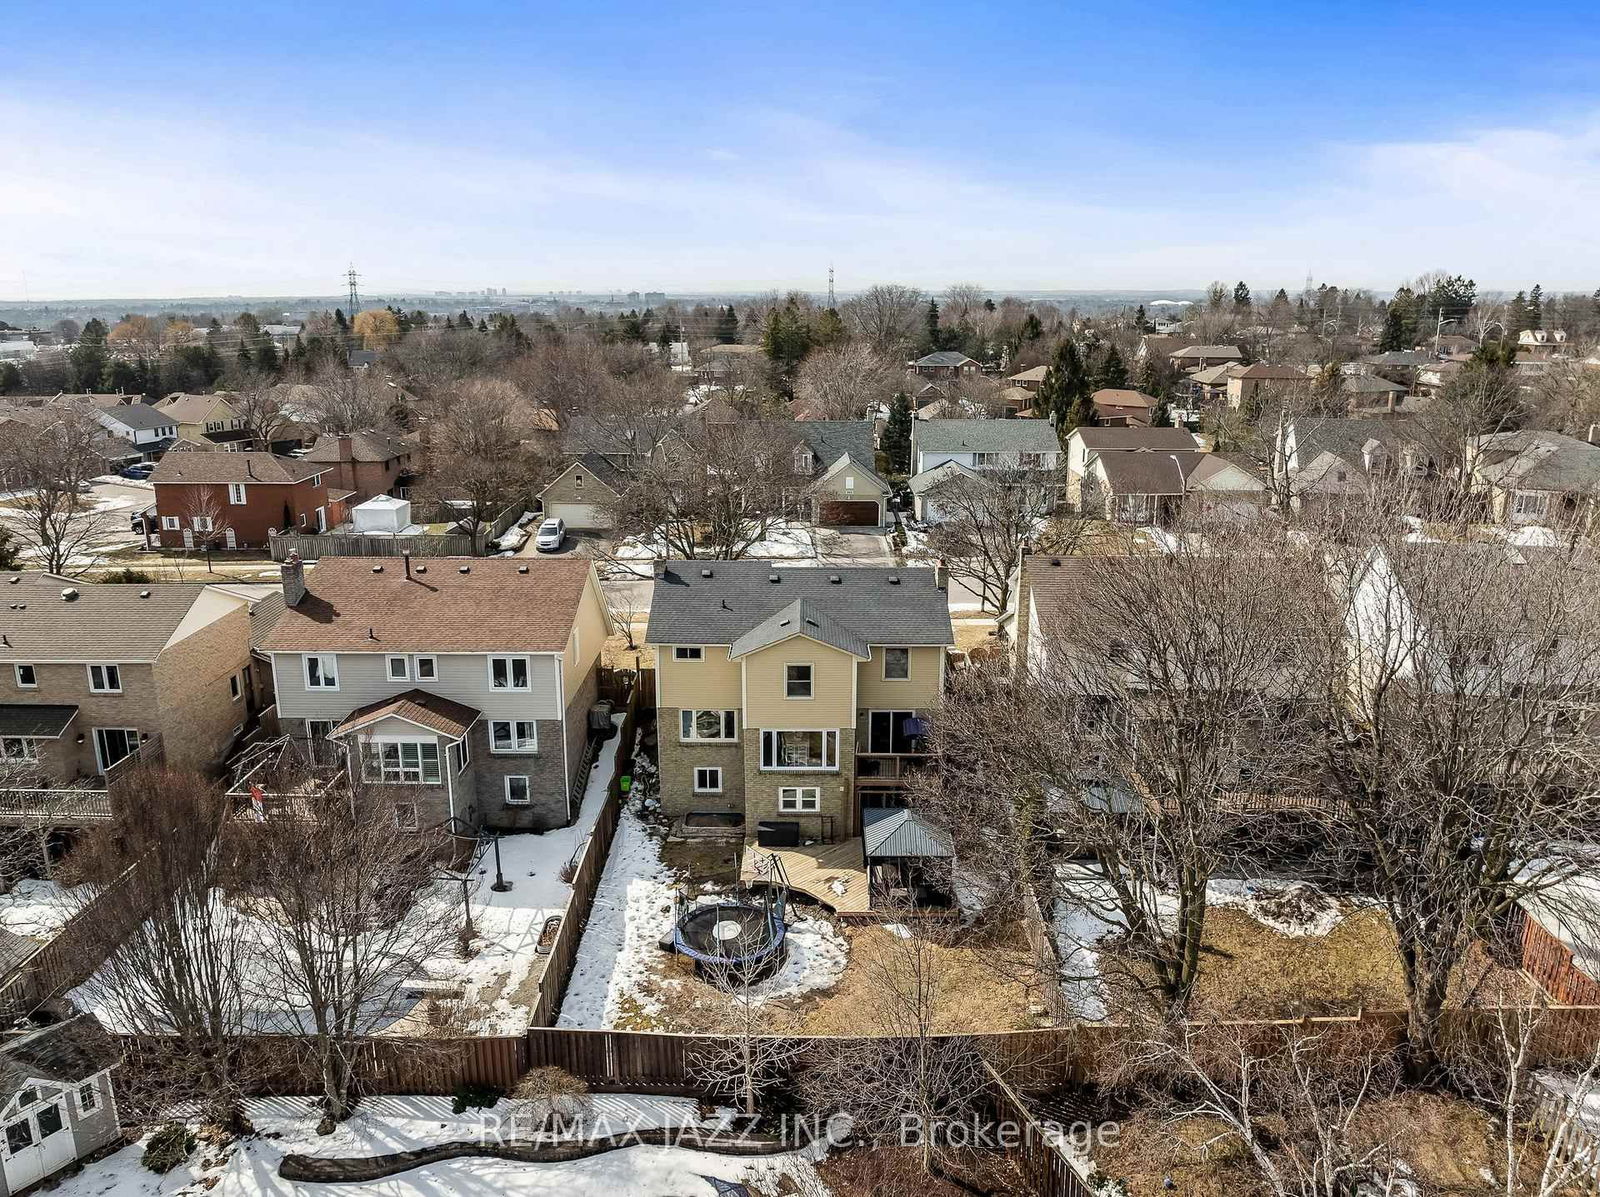
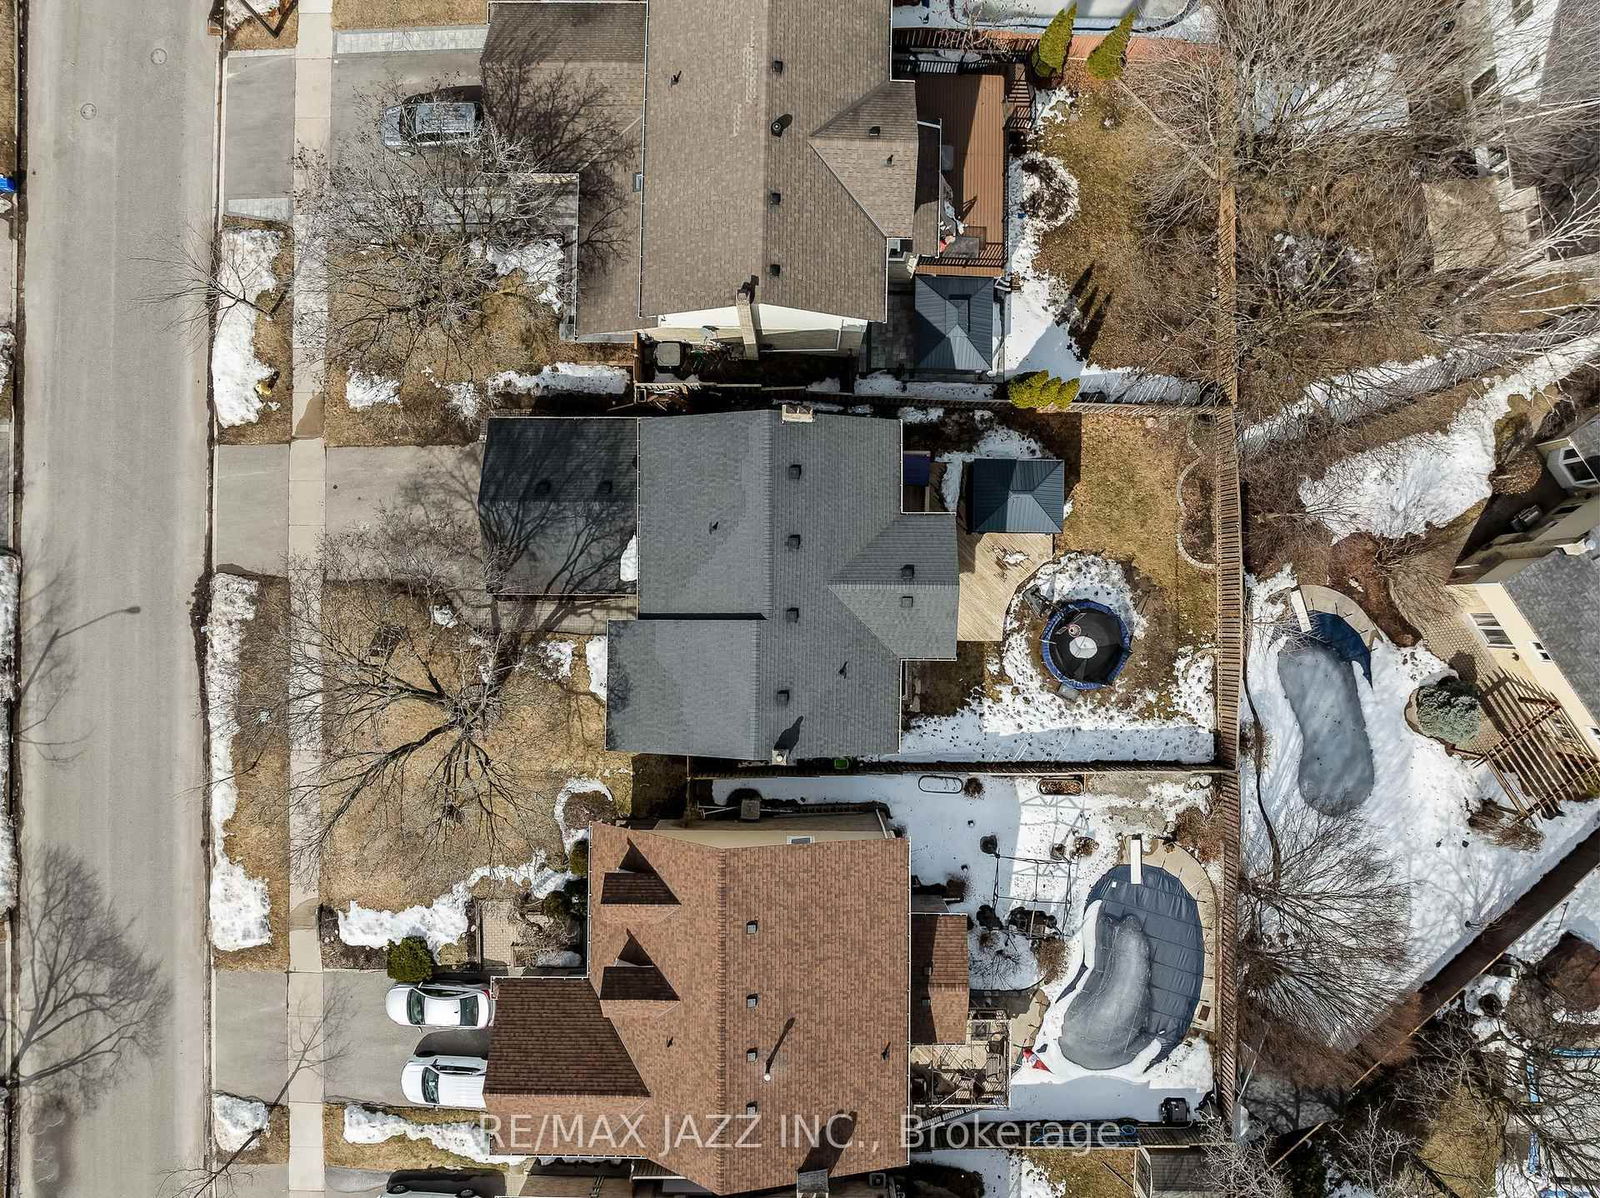
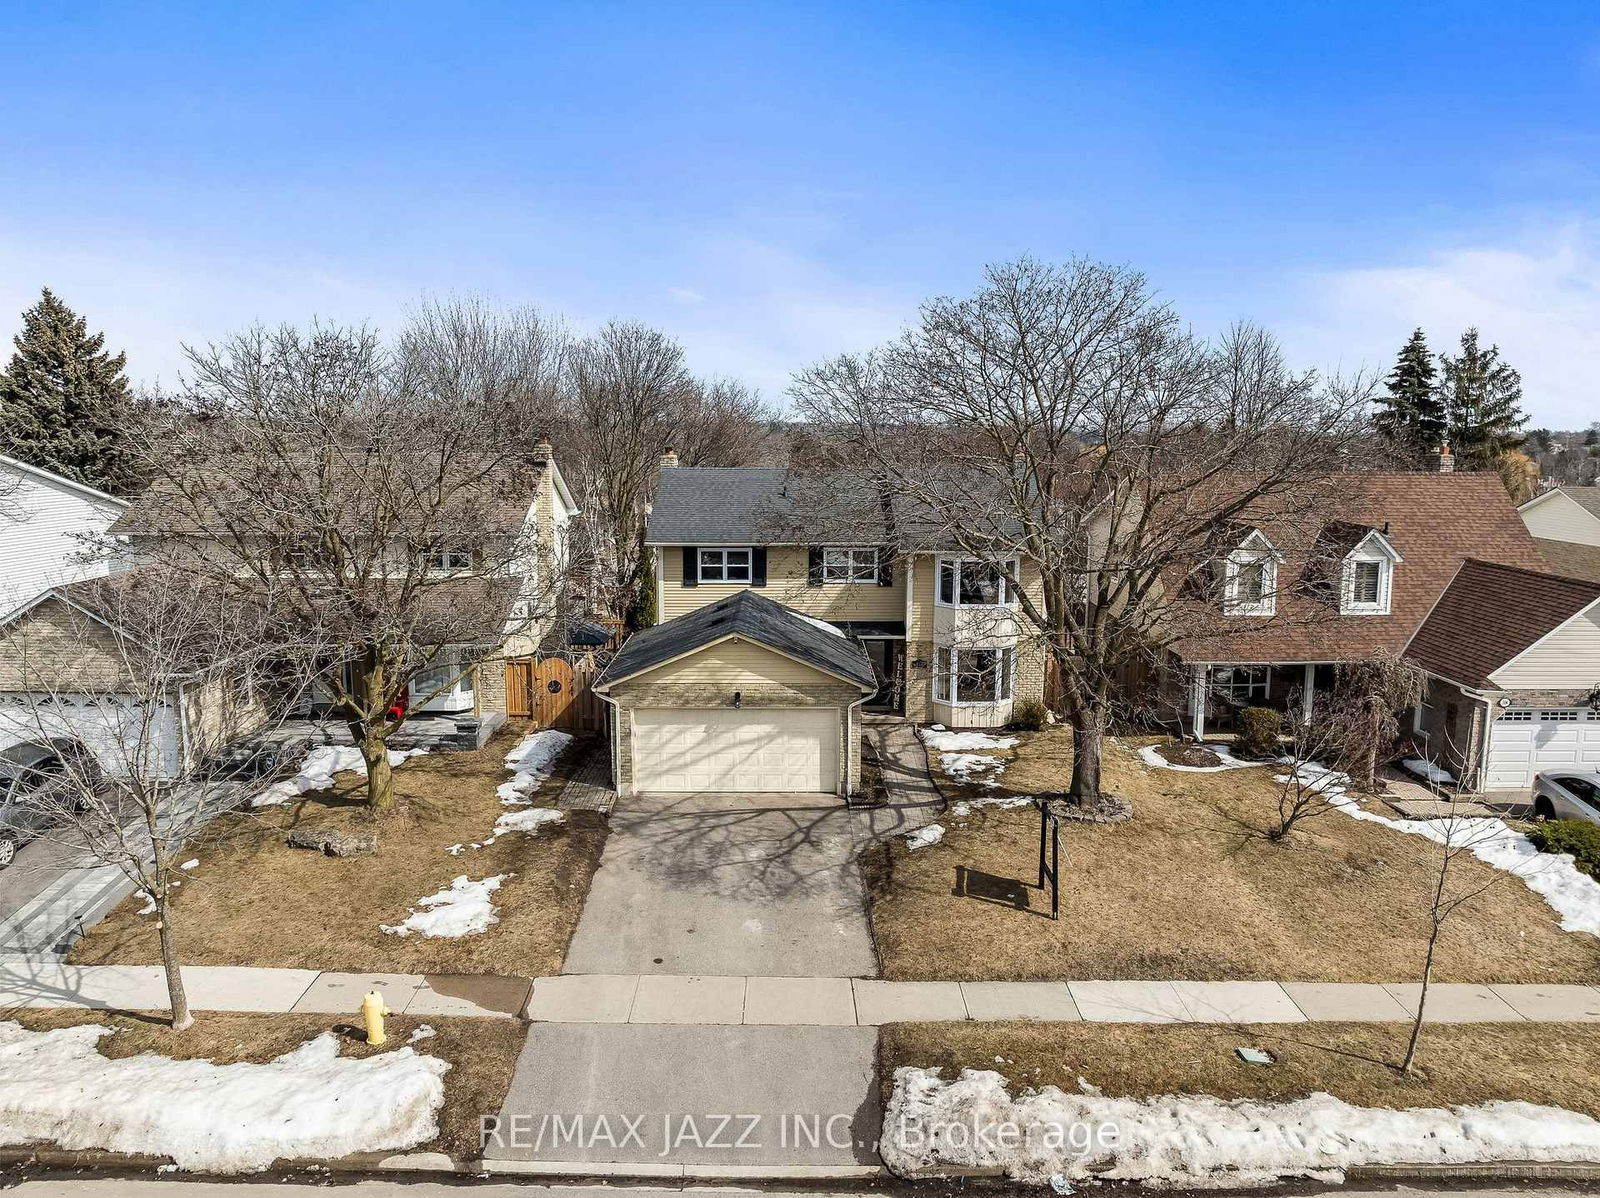
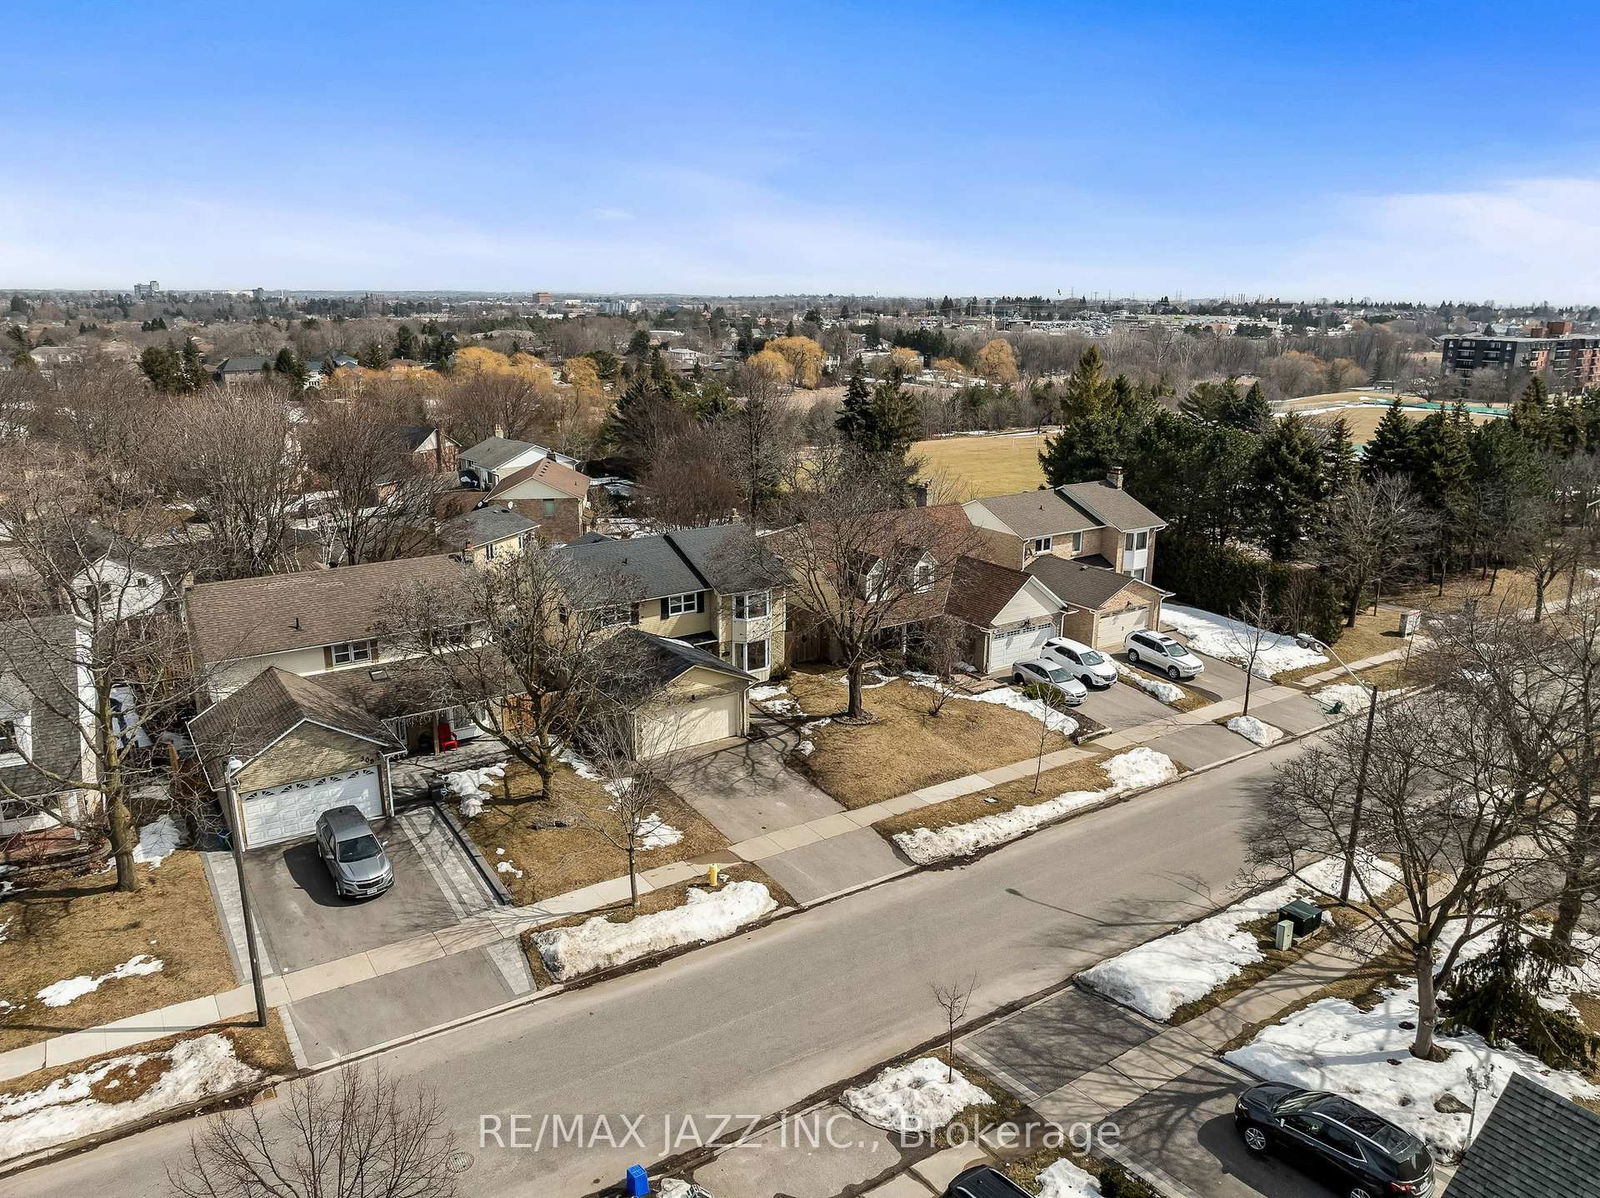
WELCOME HOME! You can feel the love! Nestled on a beautiful Whitby street, just steps away from rolling parkland and walking trails, is this wonderful, large and vibrant home, sat perfectly on a premium, walk-out, fully fenced lot with mature grounds, awaiting its next lovely family! Brimming with updates and offering a fantastic recently completed 1 bedroom + den walk-out basement in-law suite! 4 big bedrooms upstairs; a roomy, generous 2218 sqft above grade floor plan filled with sunlight from the copious windows; updated kitchen (2015) with massive center island and glass backsplash, quartz counters; updated bathrooms; brand new carpet; improvements galore! Brand new high-efficiency gas furnace (2025); handsome new front, basement and side doors (2022+2023); mostly new windows (2022+2023); walk-out basement remodel (2022); lavish 5pc ensuite with freestanding tub, quartz counters, shiplap walls, separate glass shower, heated ceramic floors (2016); shingles (2014); main bath new vanity with quartz counter (2025). In addition, the home offers direct entry to the double car garage, main floor laundry, wood burning fireplace in the main floor family room and a walk-out to a private balcony. Primary bedroom boasts walk-in closet. In the backyard, there's a newer deck and gazebo. Lots of storage space in the unfinished areas of the basement. Your search stops here!
All window coverings, all electric light fixtures, garage door opener and remote, central air, hot water tank (owned), 2 fridges, stove, built-in microwave, built-in dishwasher, washer, dryer, gazebo and washer/dryer combo unit in basement.
Living
Dining
Kitchen
Family
Primary
2nd Br
3rd Br
4th Br
5th Br
Office
Living
Kitchen
The graph below compares the average list price and average sale price of homes in this neighborhood by month for the last 24 months. When average sale price is greater than average list price, this may suggest a buyer's market. When average sale price is lower than the average list price this may suggest a seller's market.
The graph below illustrates the average days on market for homes in this neighborhood. The yellow area may indicate a buyer's market, the green area may indicate a balanced market and the red area may indicate a seller's market.
Sales Representative, Century 21 People’s Choice Realty Inc., Brokerage
(647) 576 - 2100
Whitby, Blue Grass Meadows, L1N 8J7
Whitby, Blue Grass Meadows, L1N 0C3
Whitby, Blue Grass Meadows, L1N 0C7