
Century 21 People’s Choice Realty Inc., Brokerage
120 MATHESON BLVD E #103
MISSISSAUGA, Ontario
L4Z 1X1
Welland, L3B 0G3
$699,000
Listed by Century 21 Realty Centre.
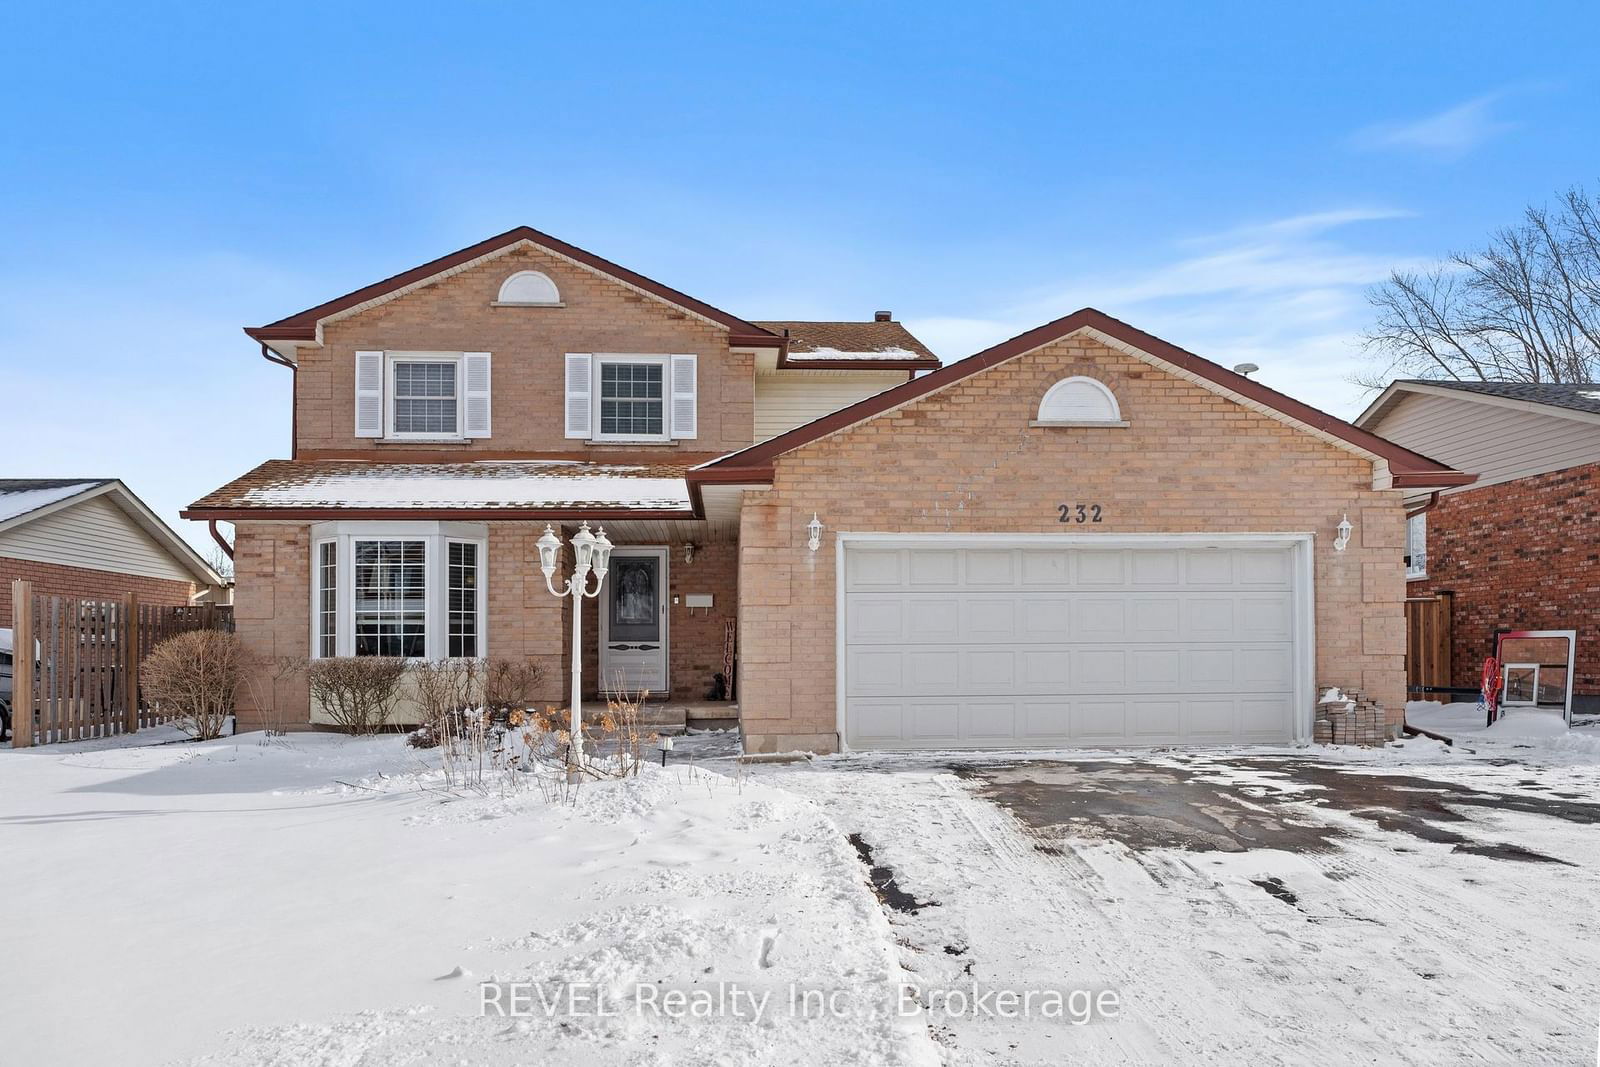
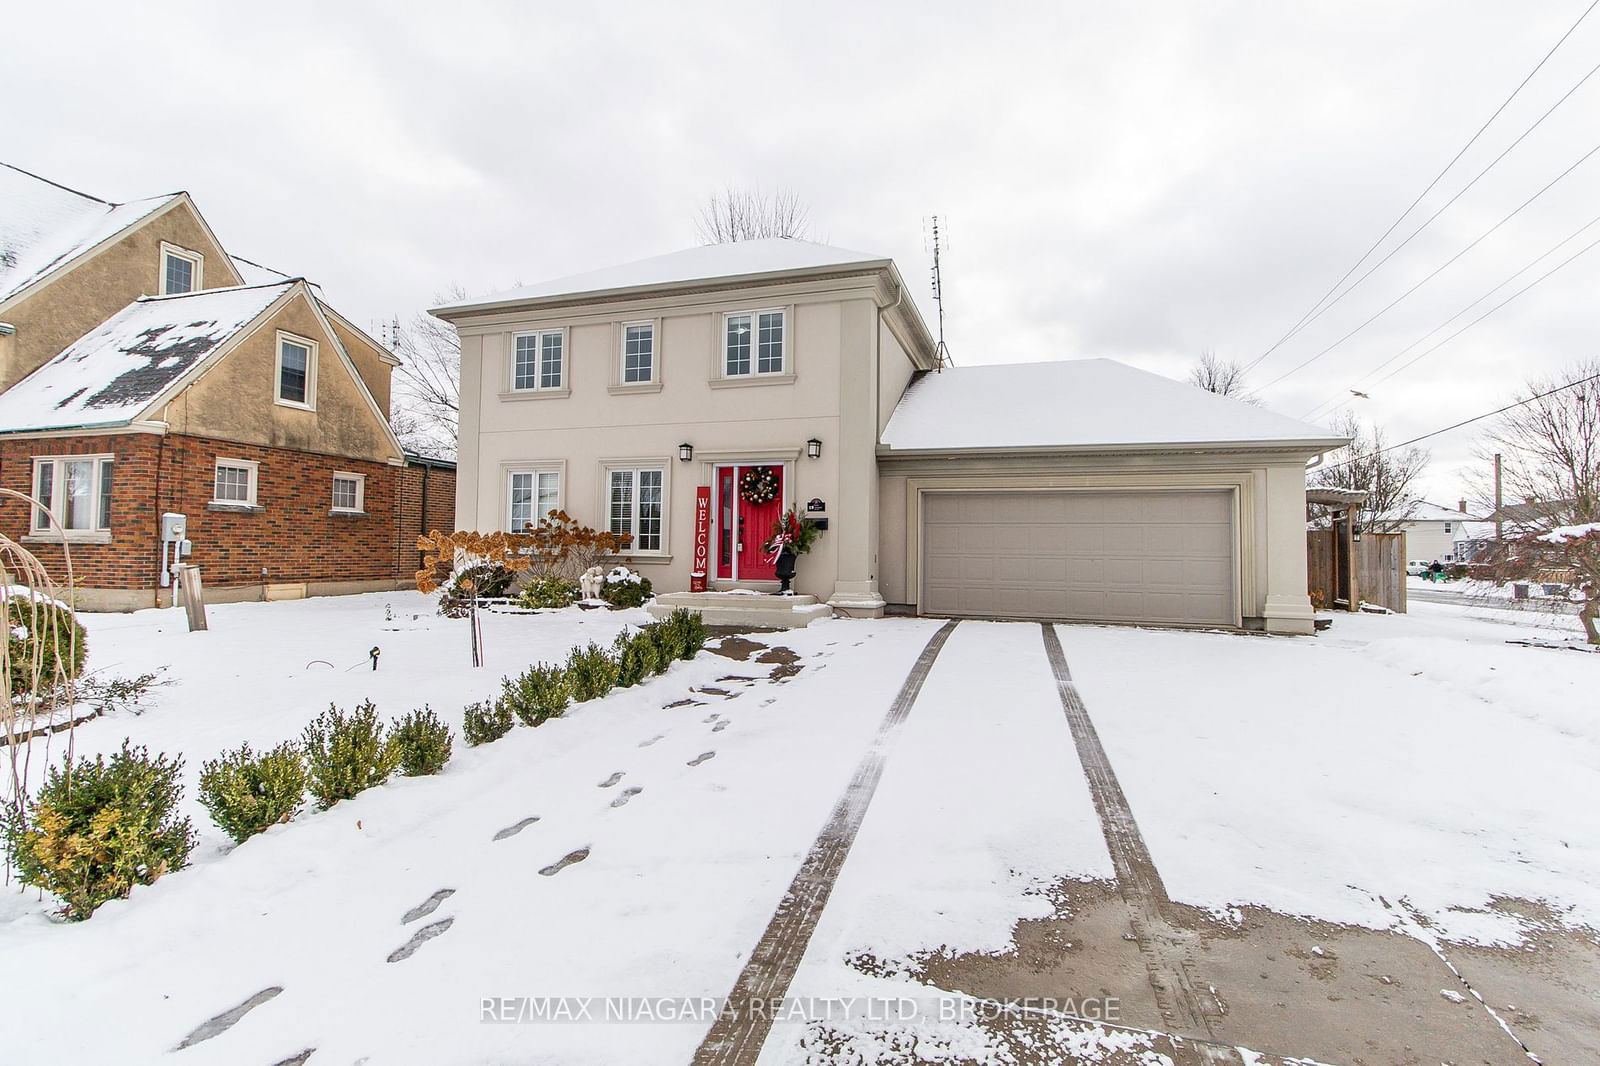
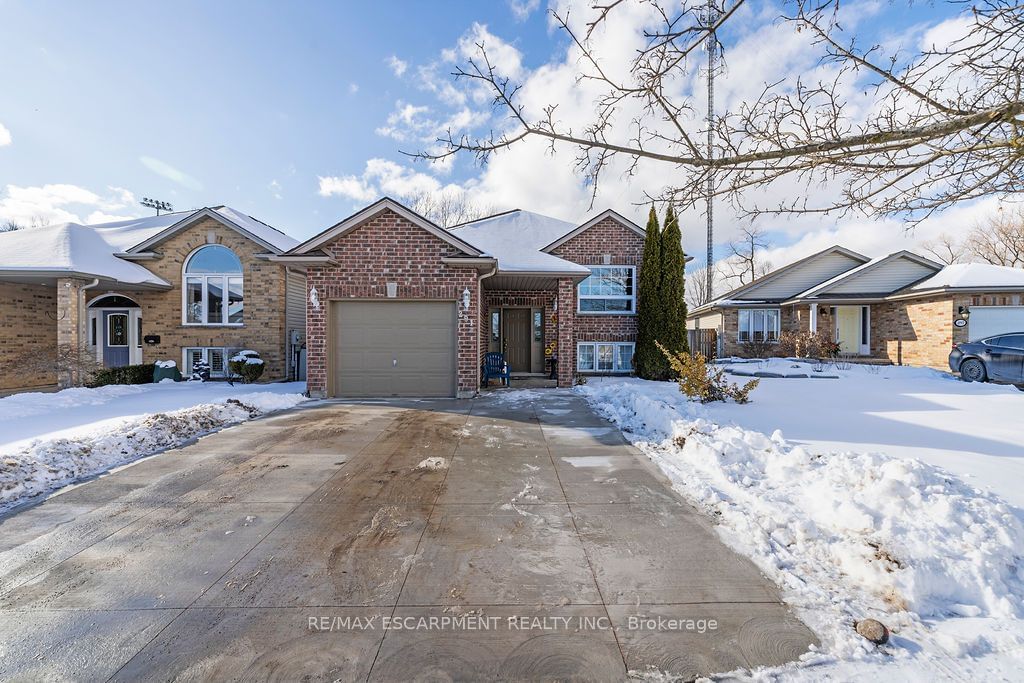
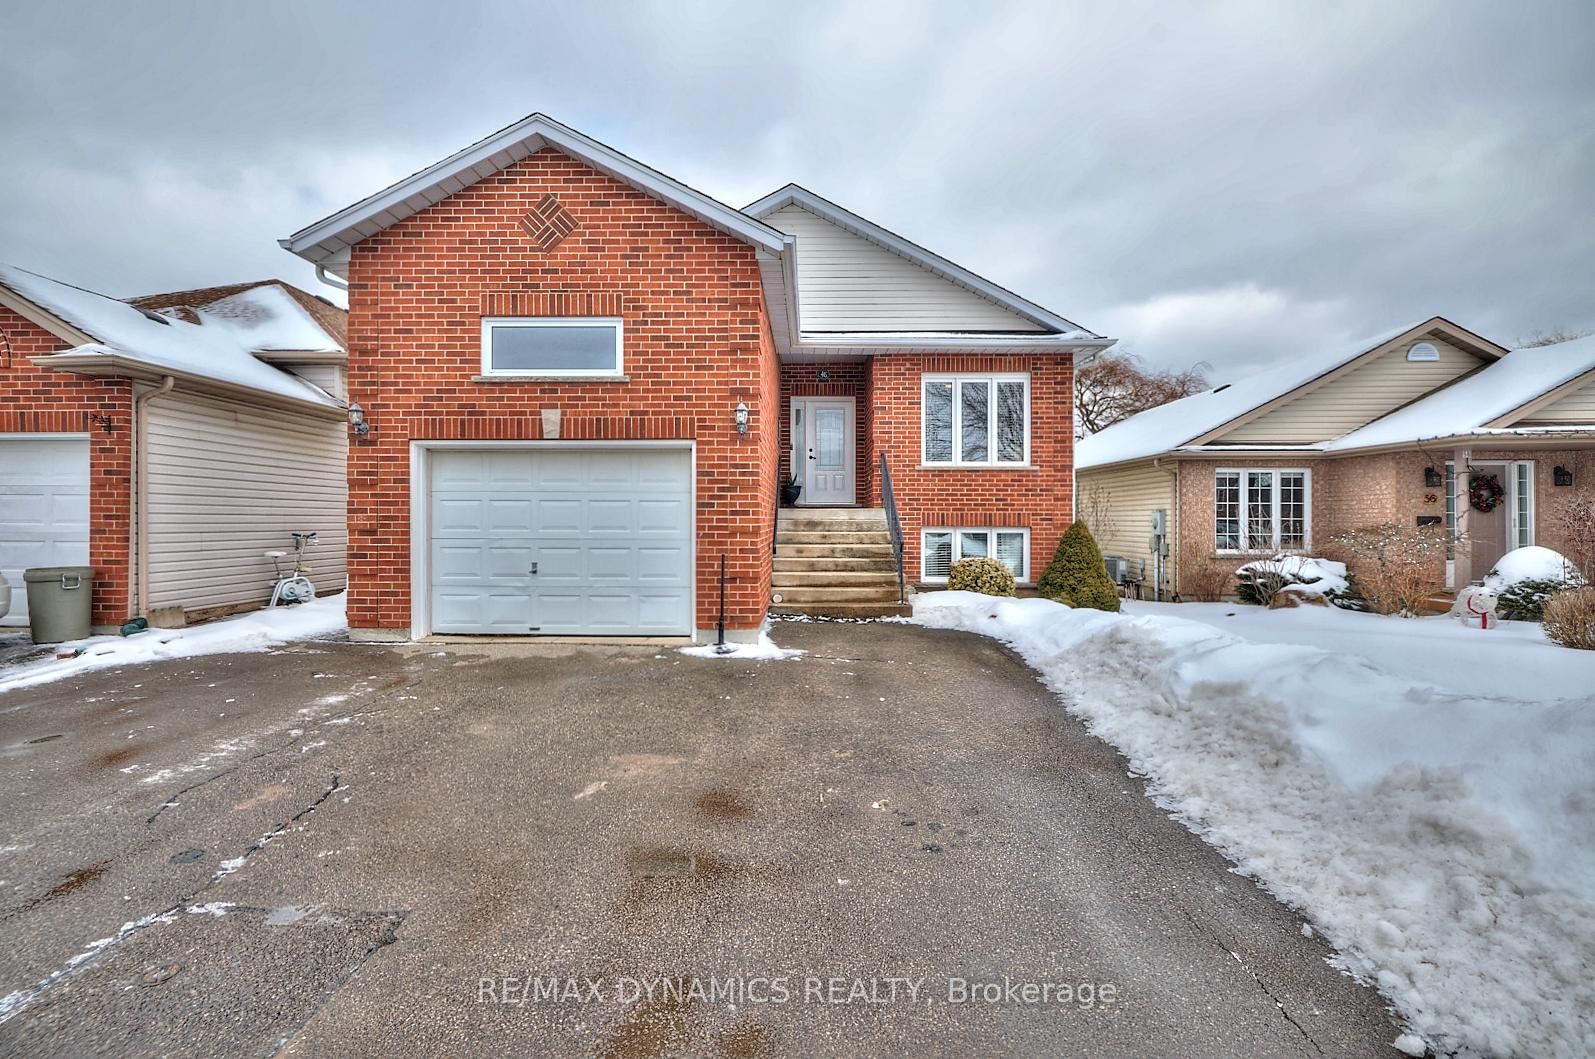
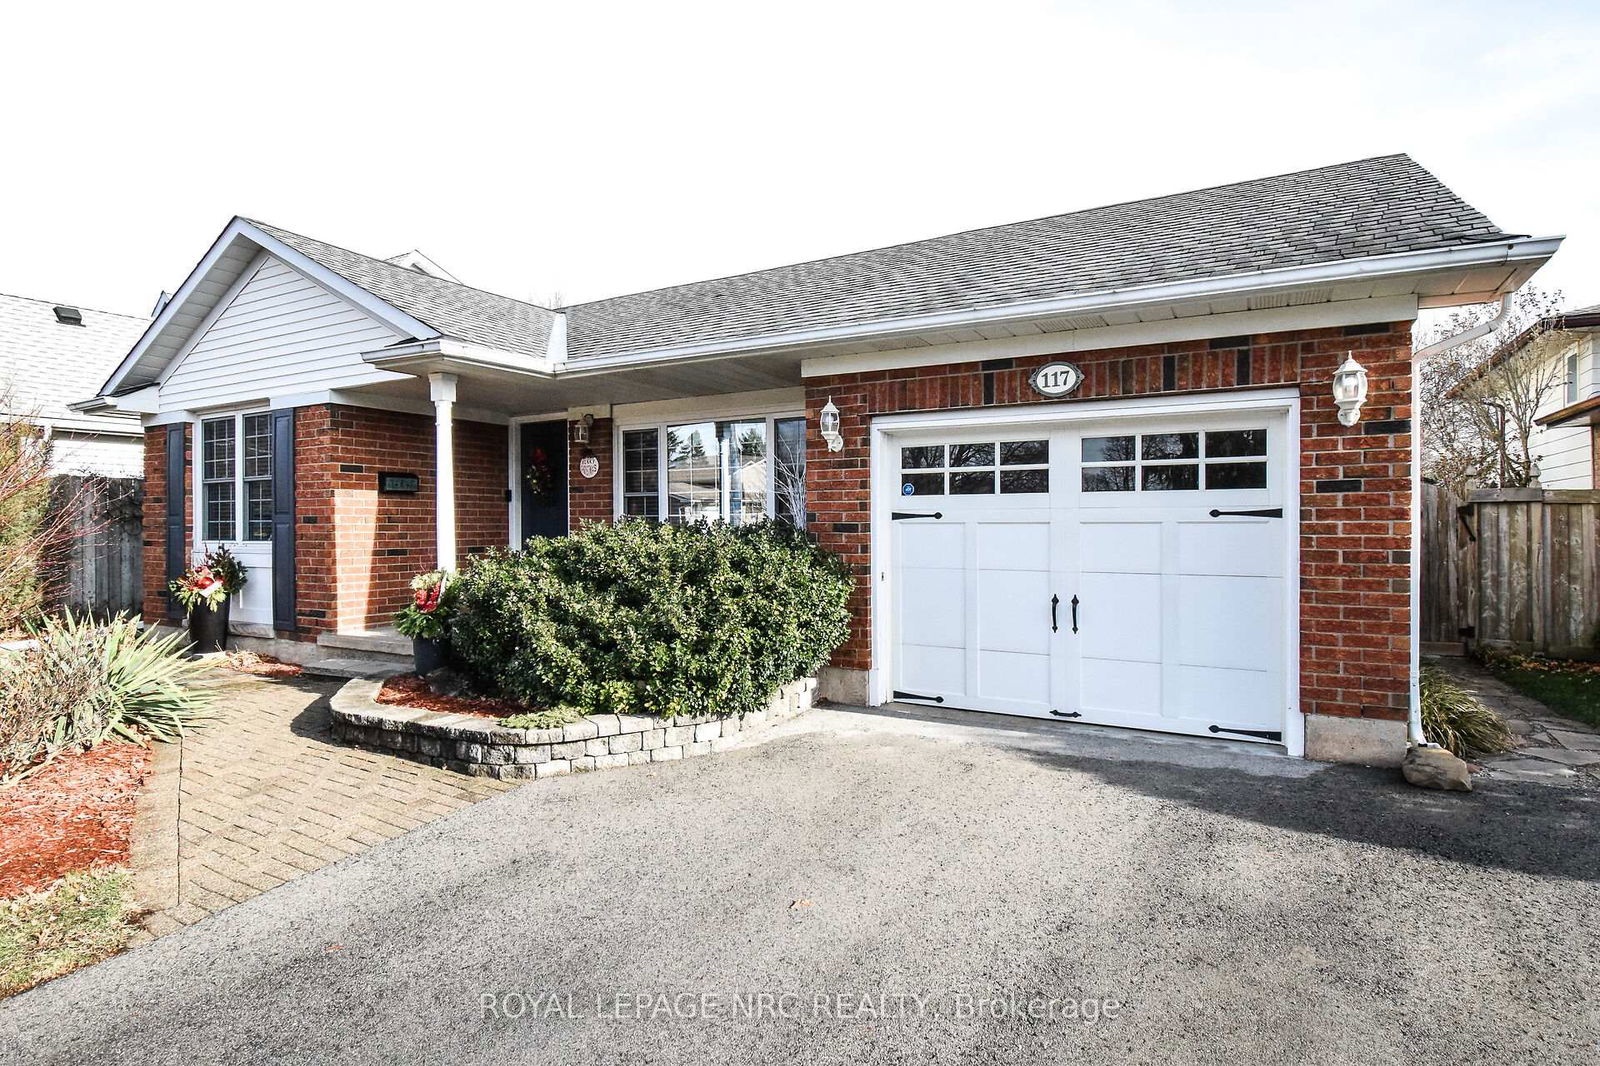
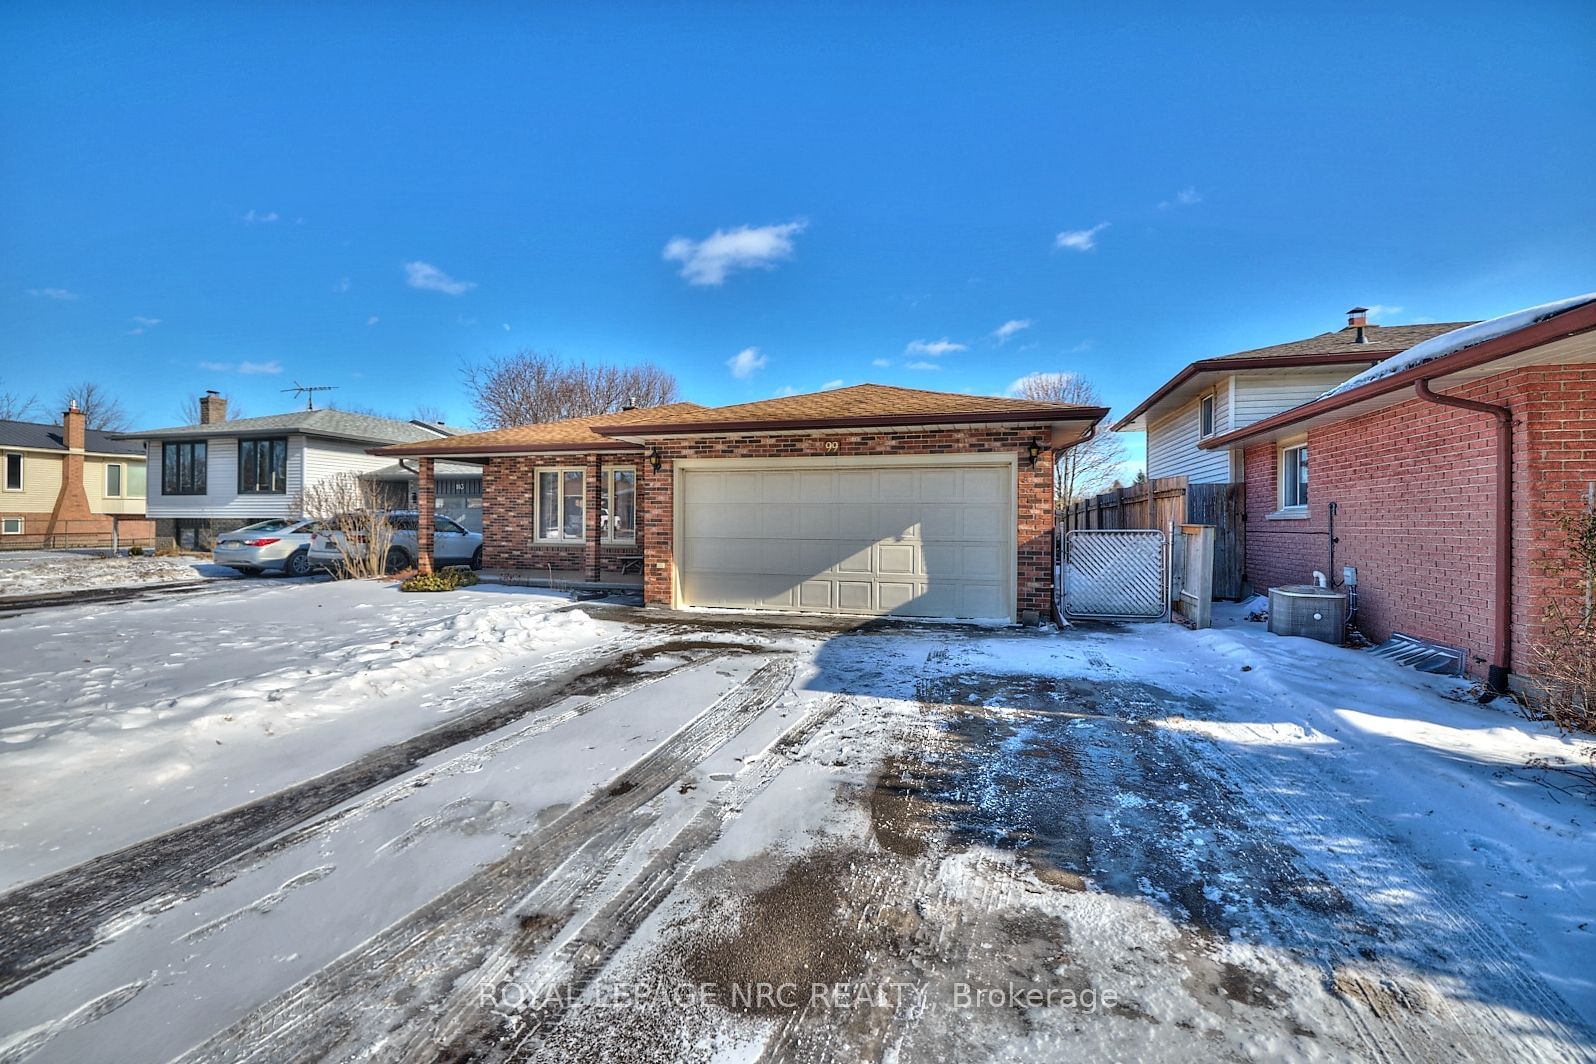
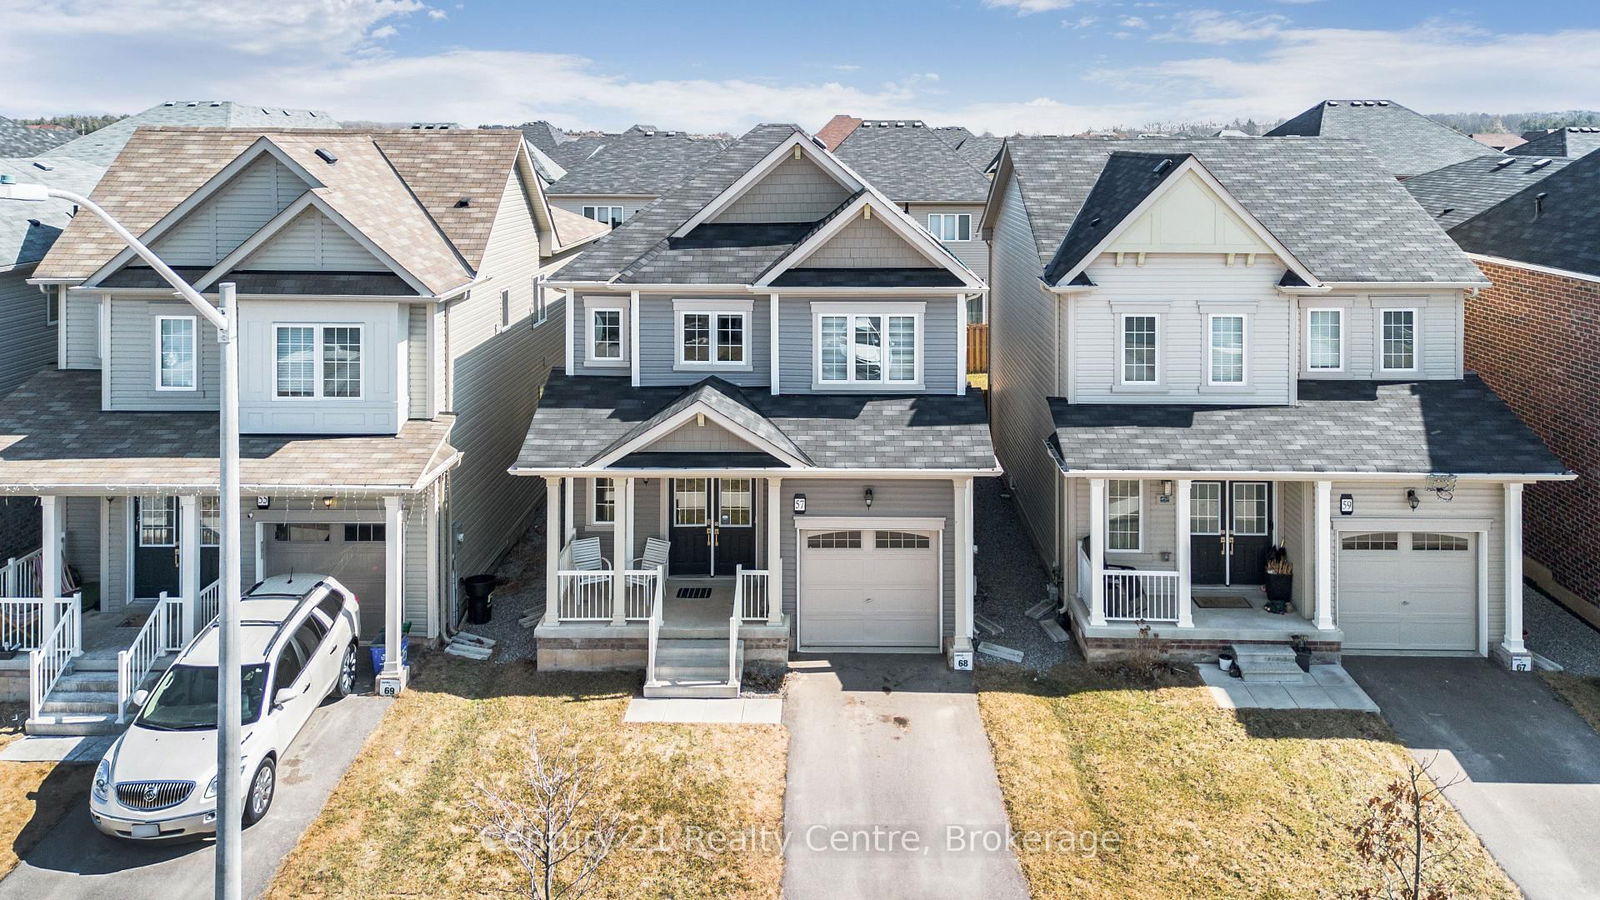
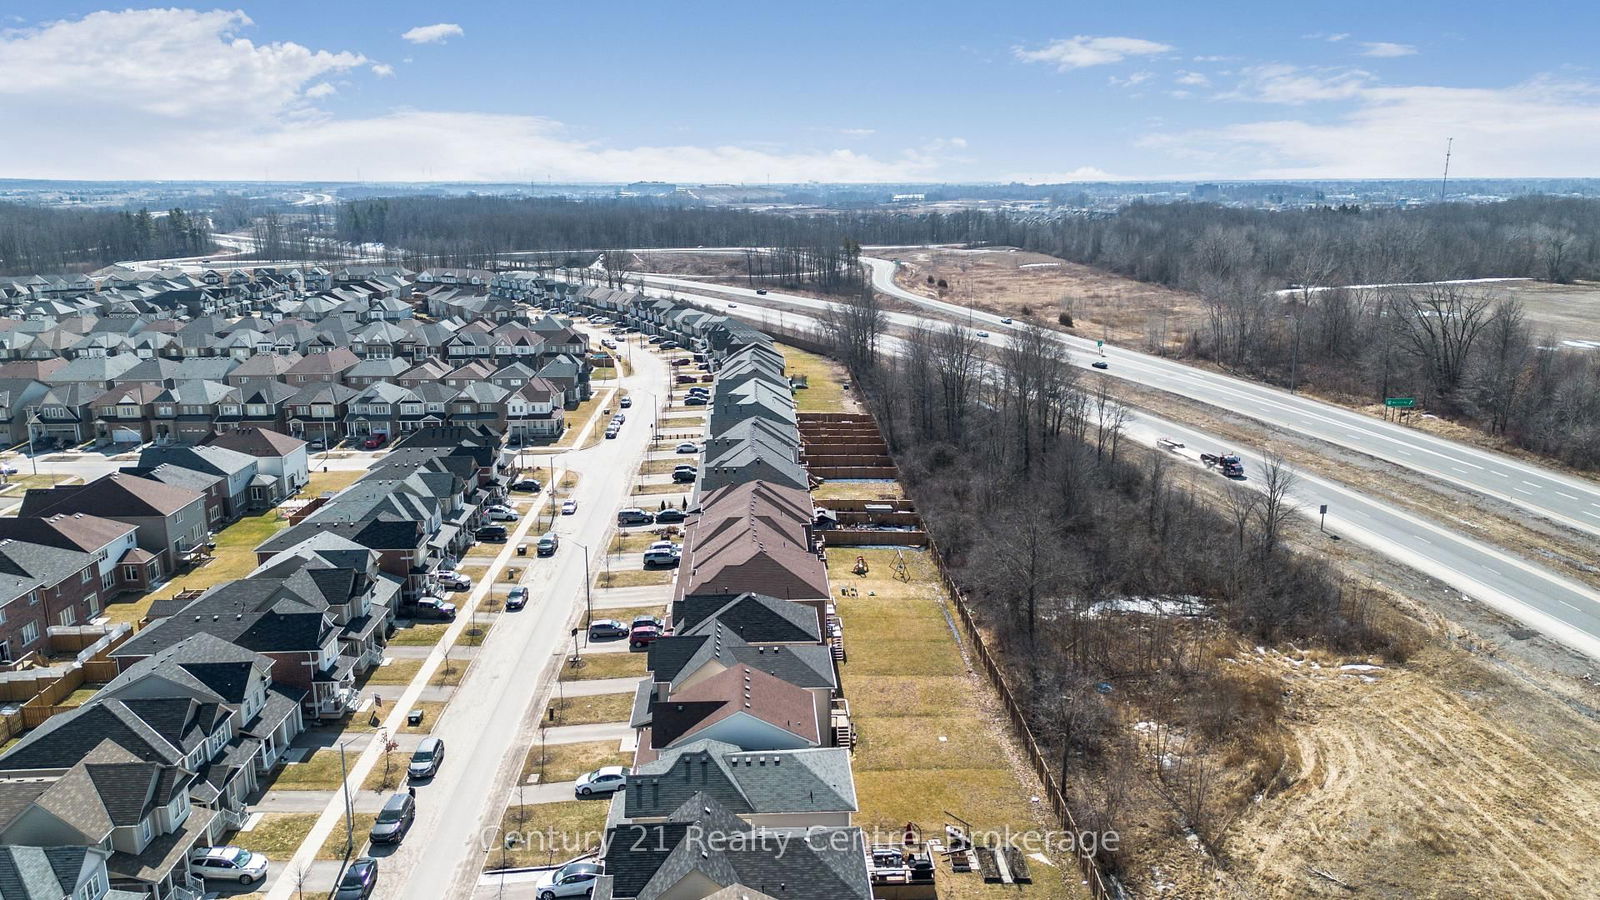
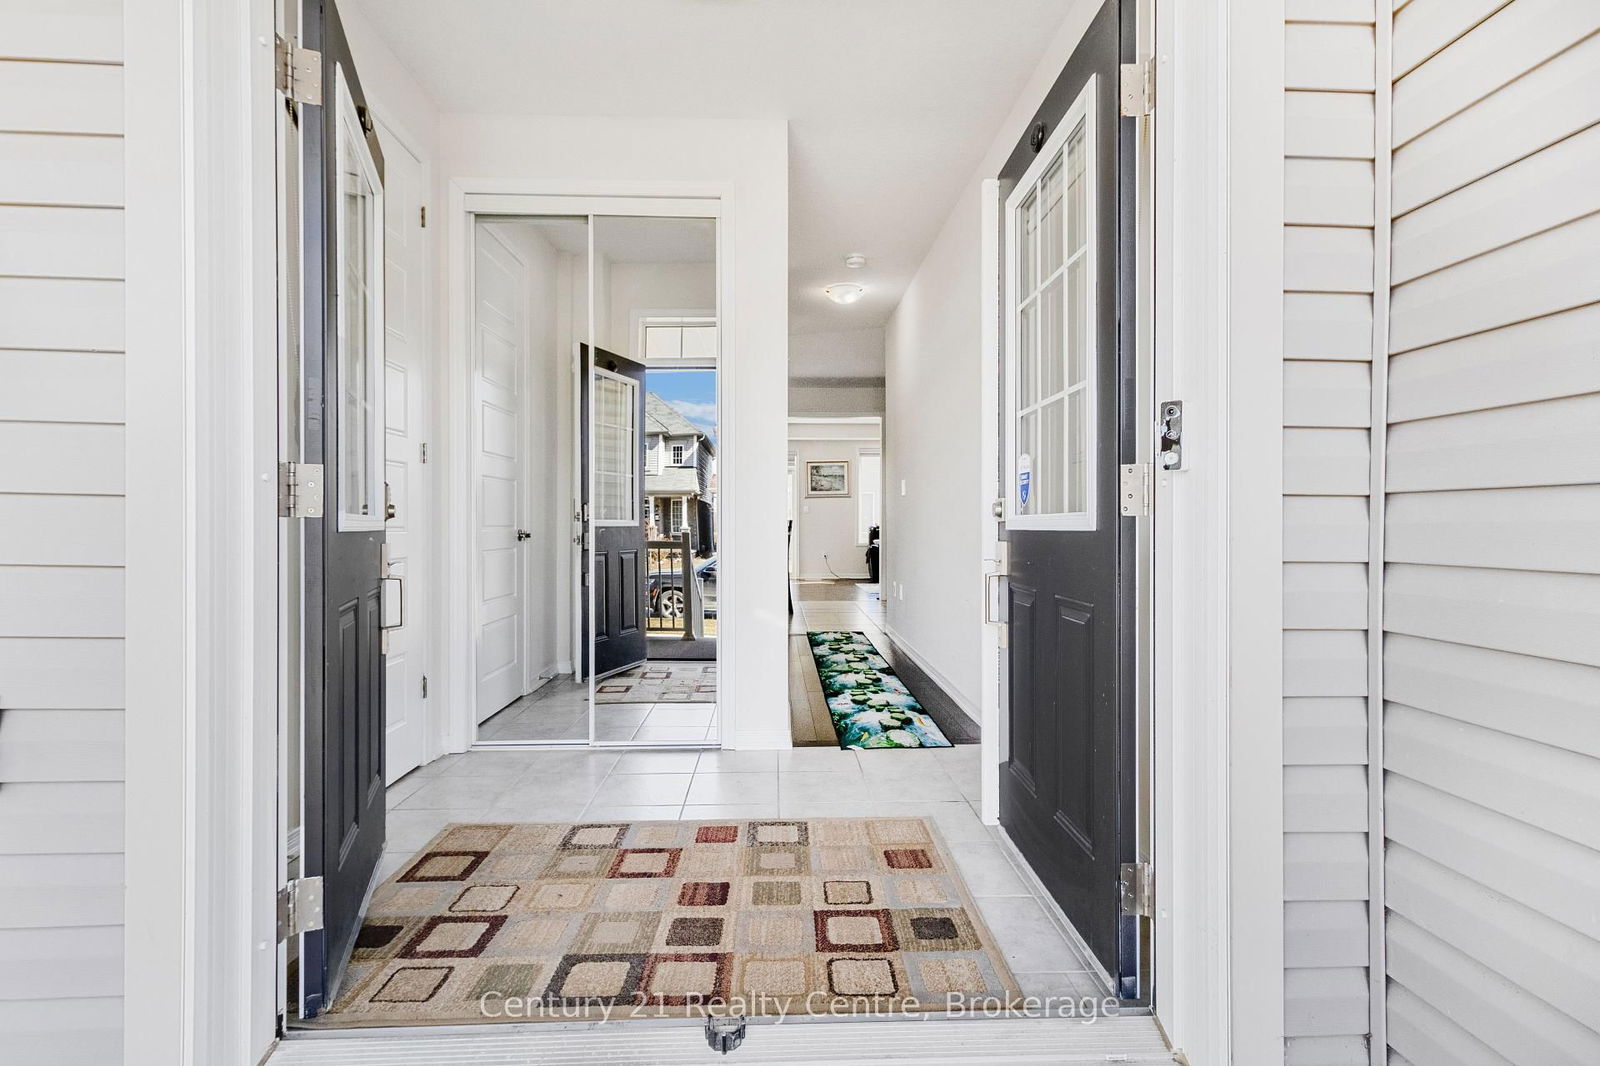
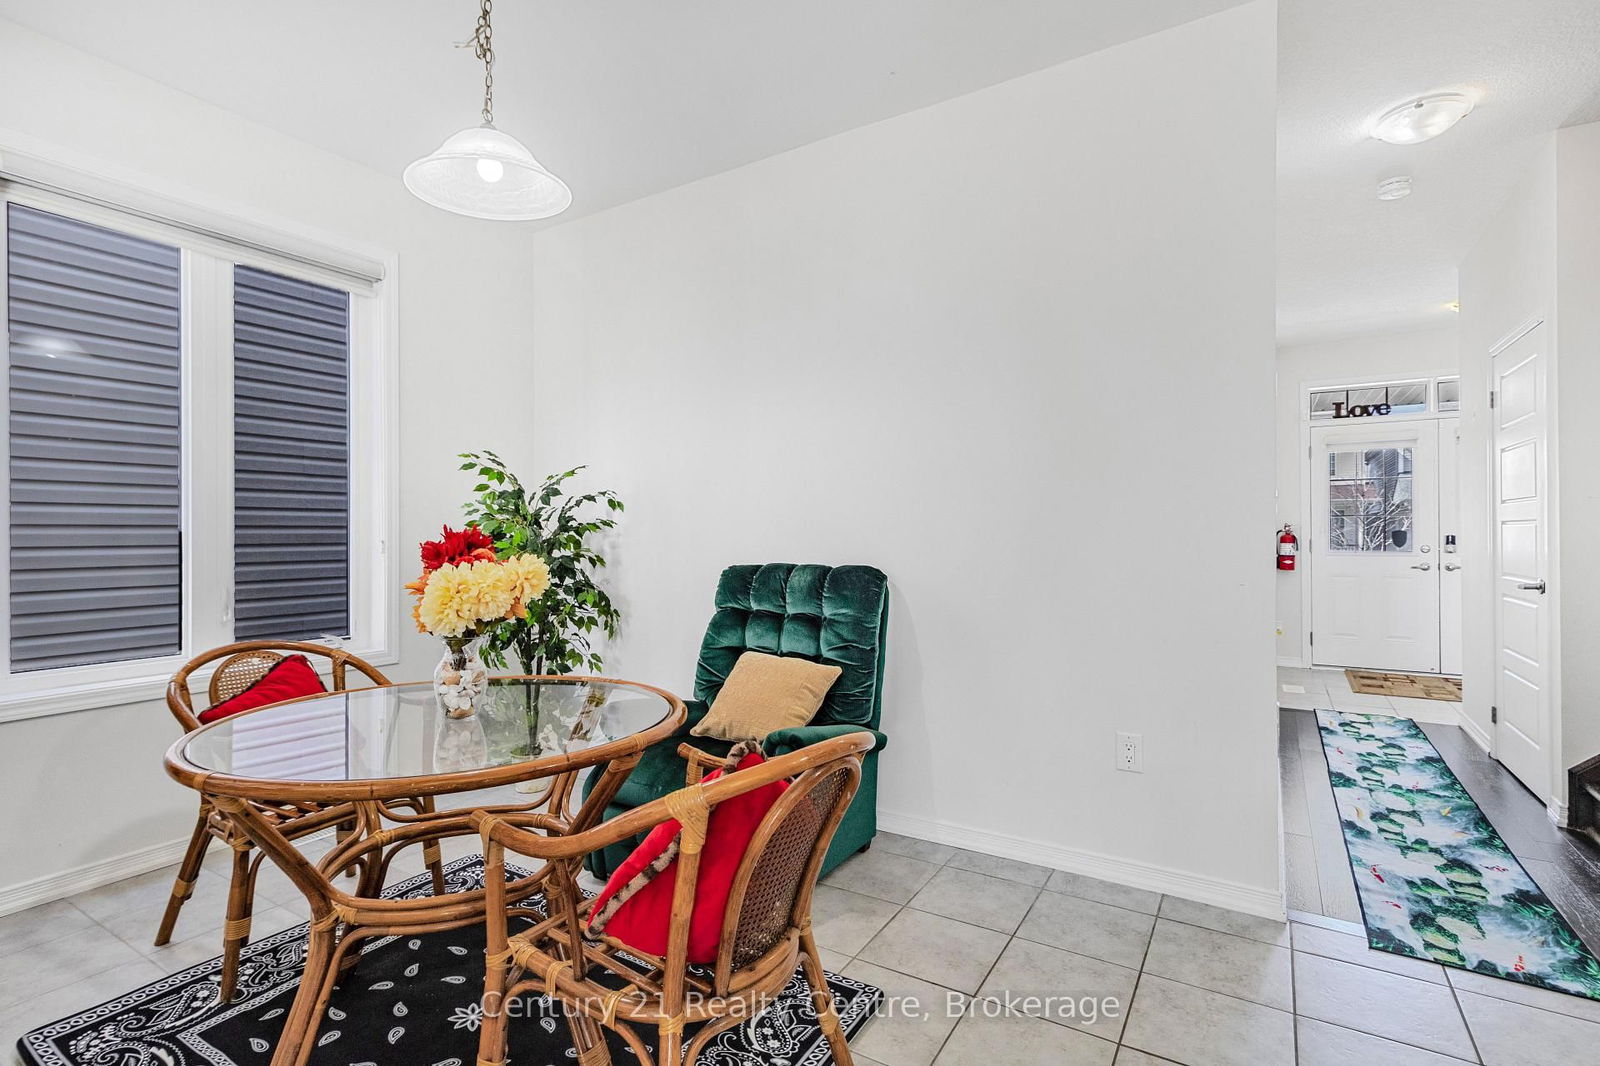
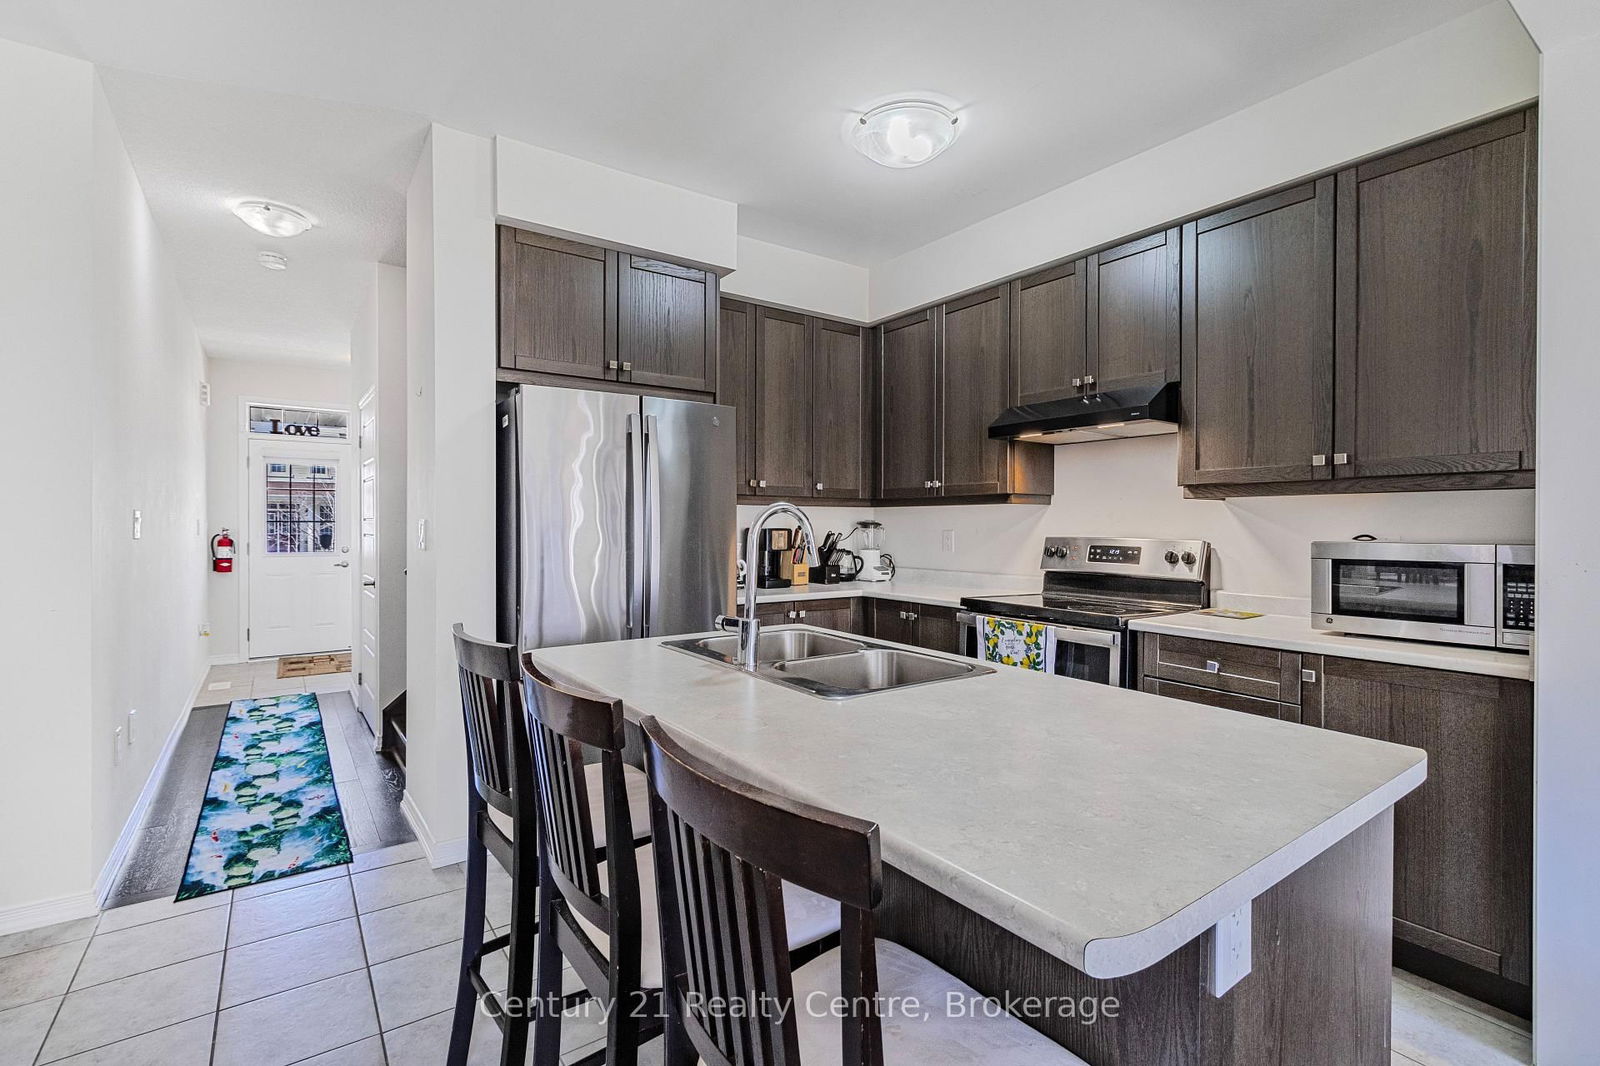
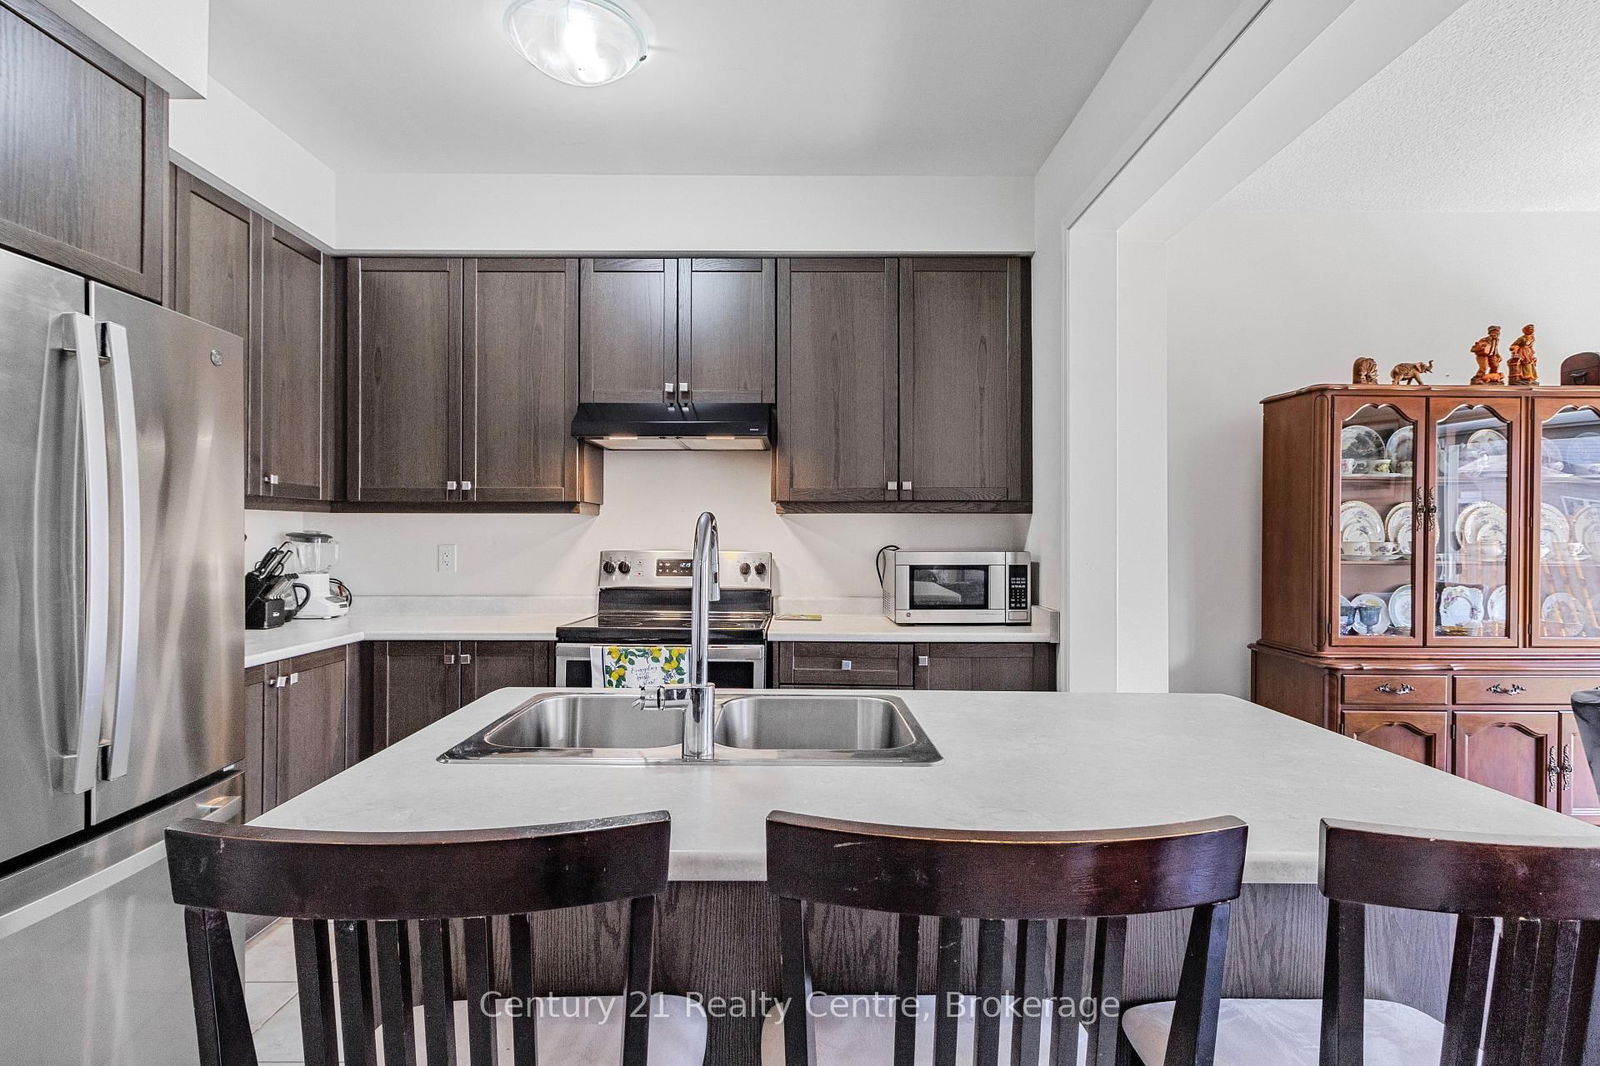
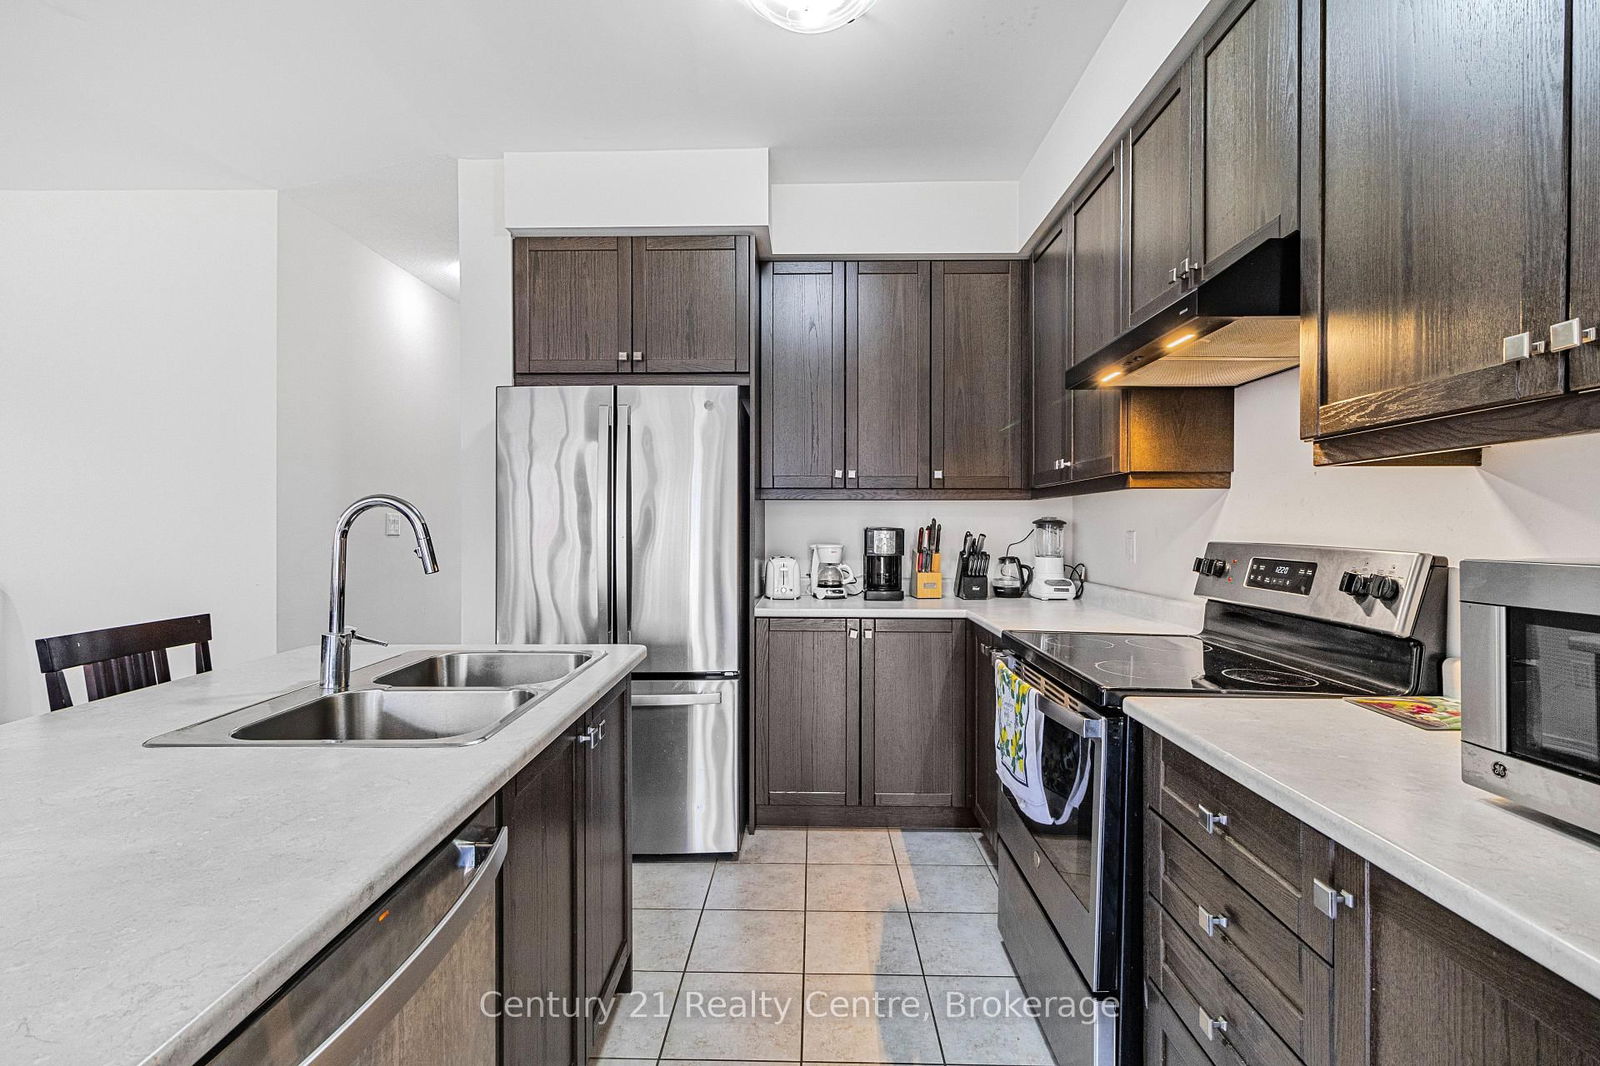
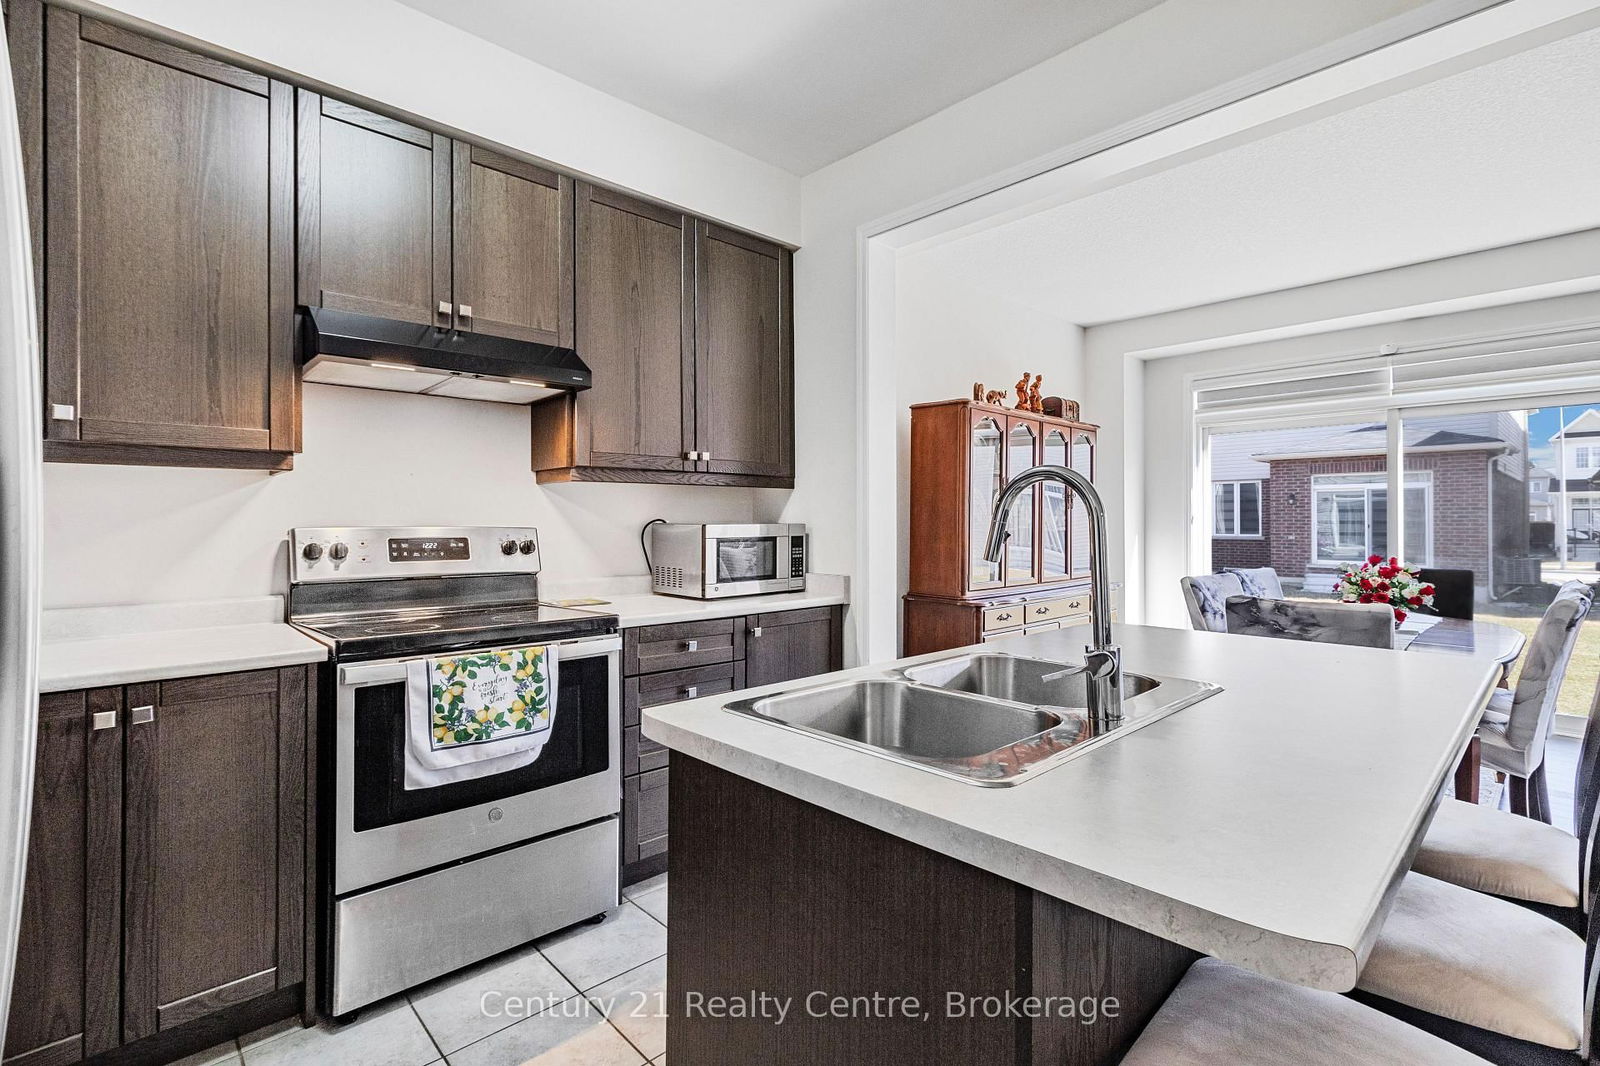
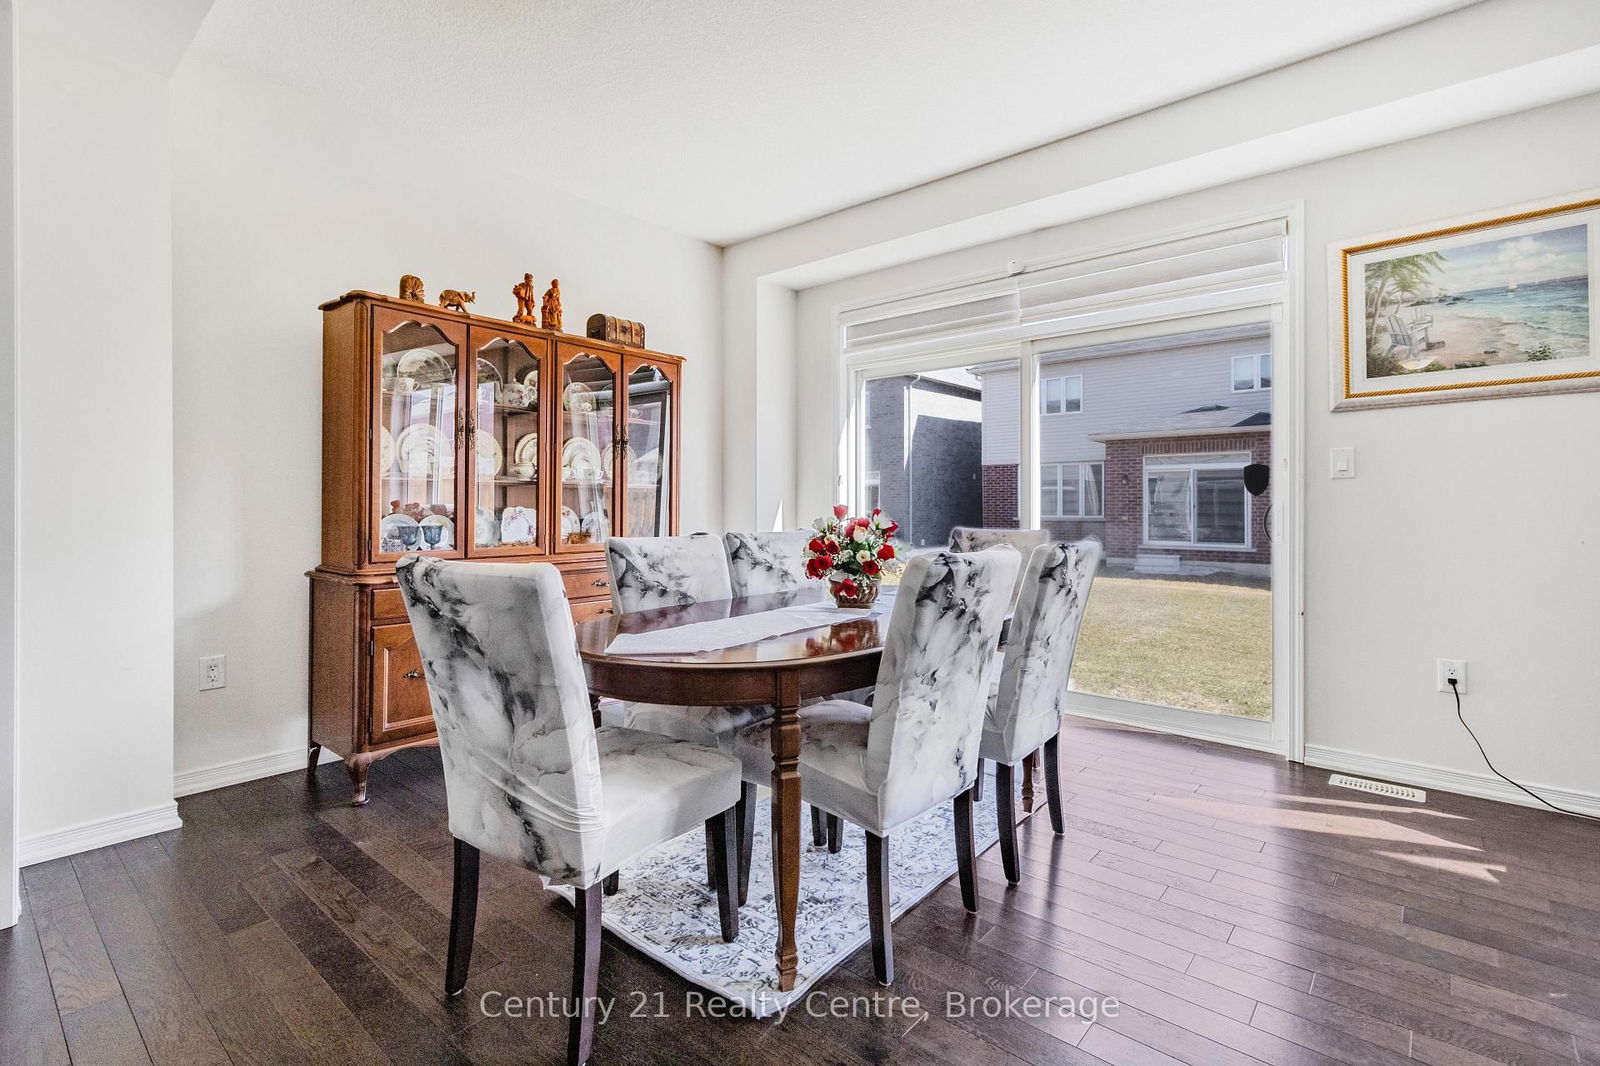
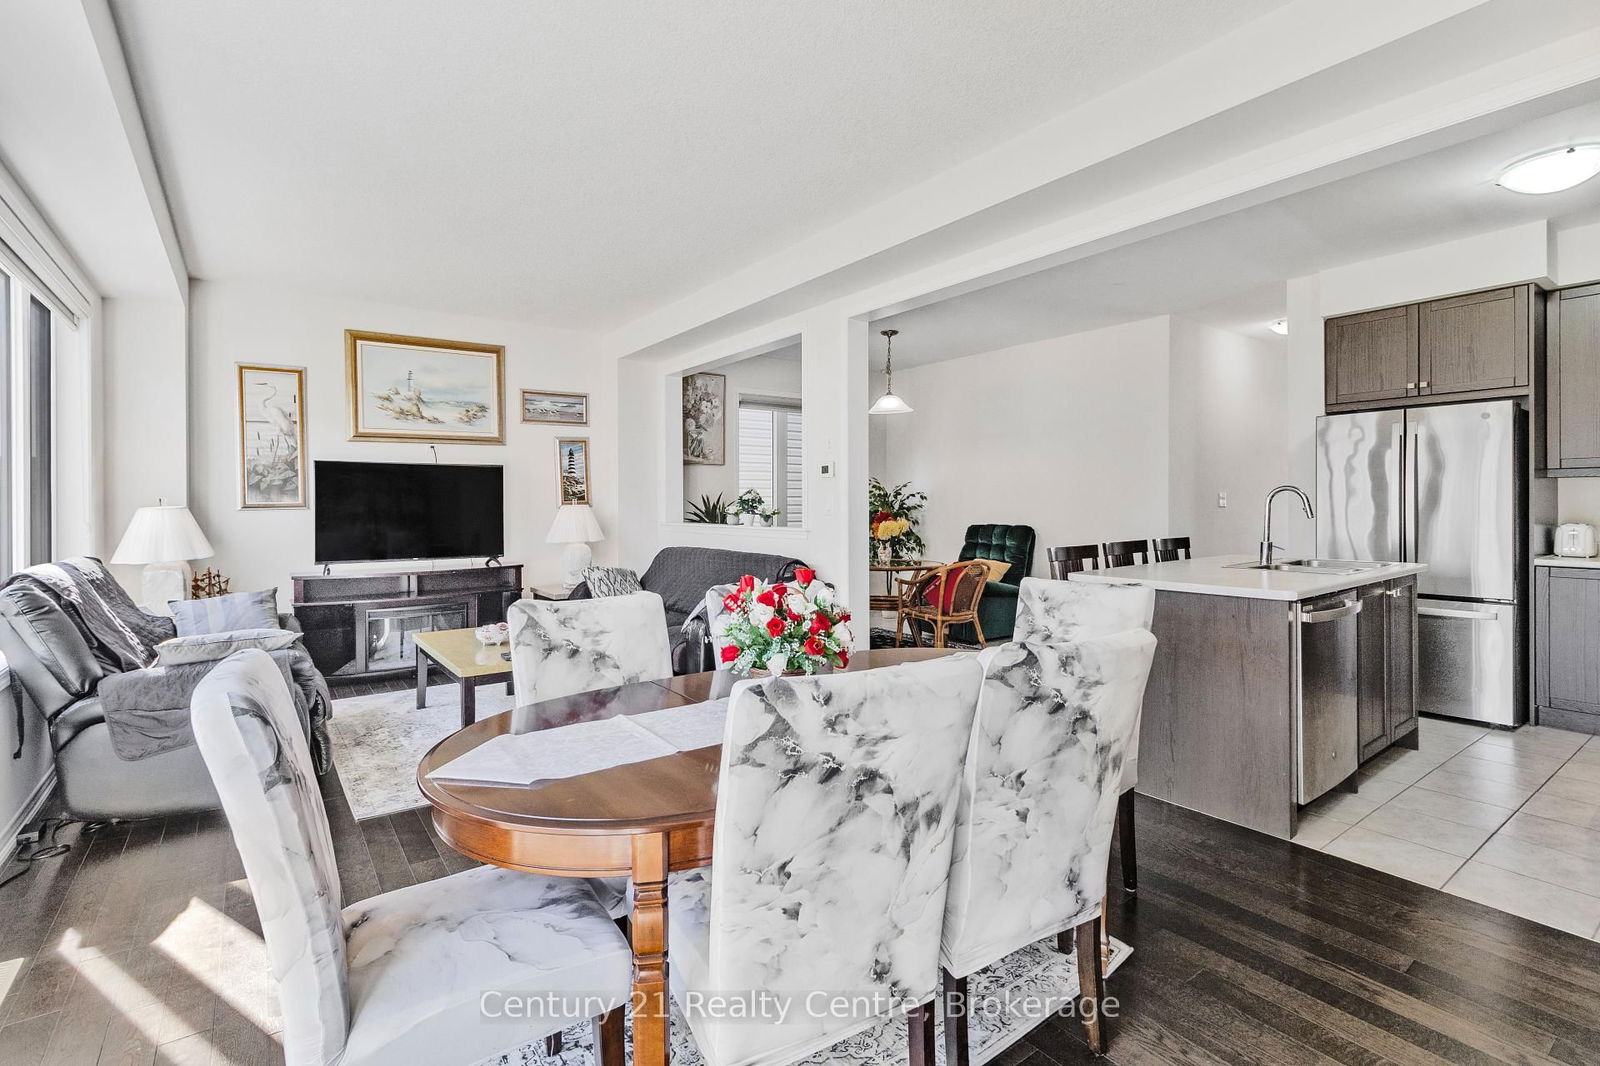
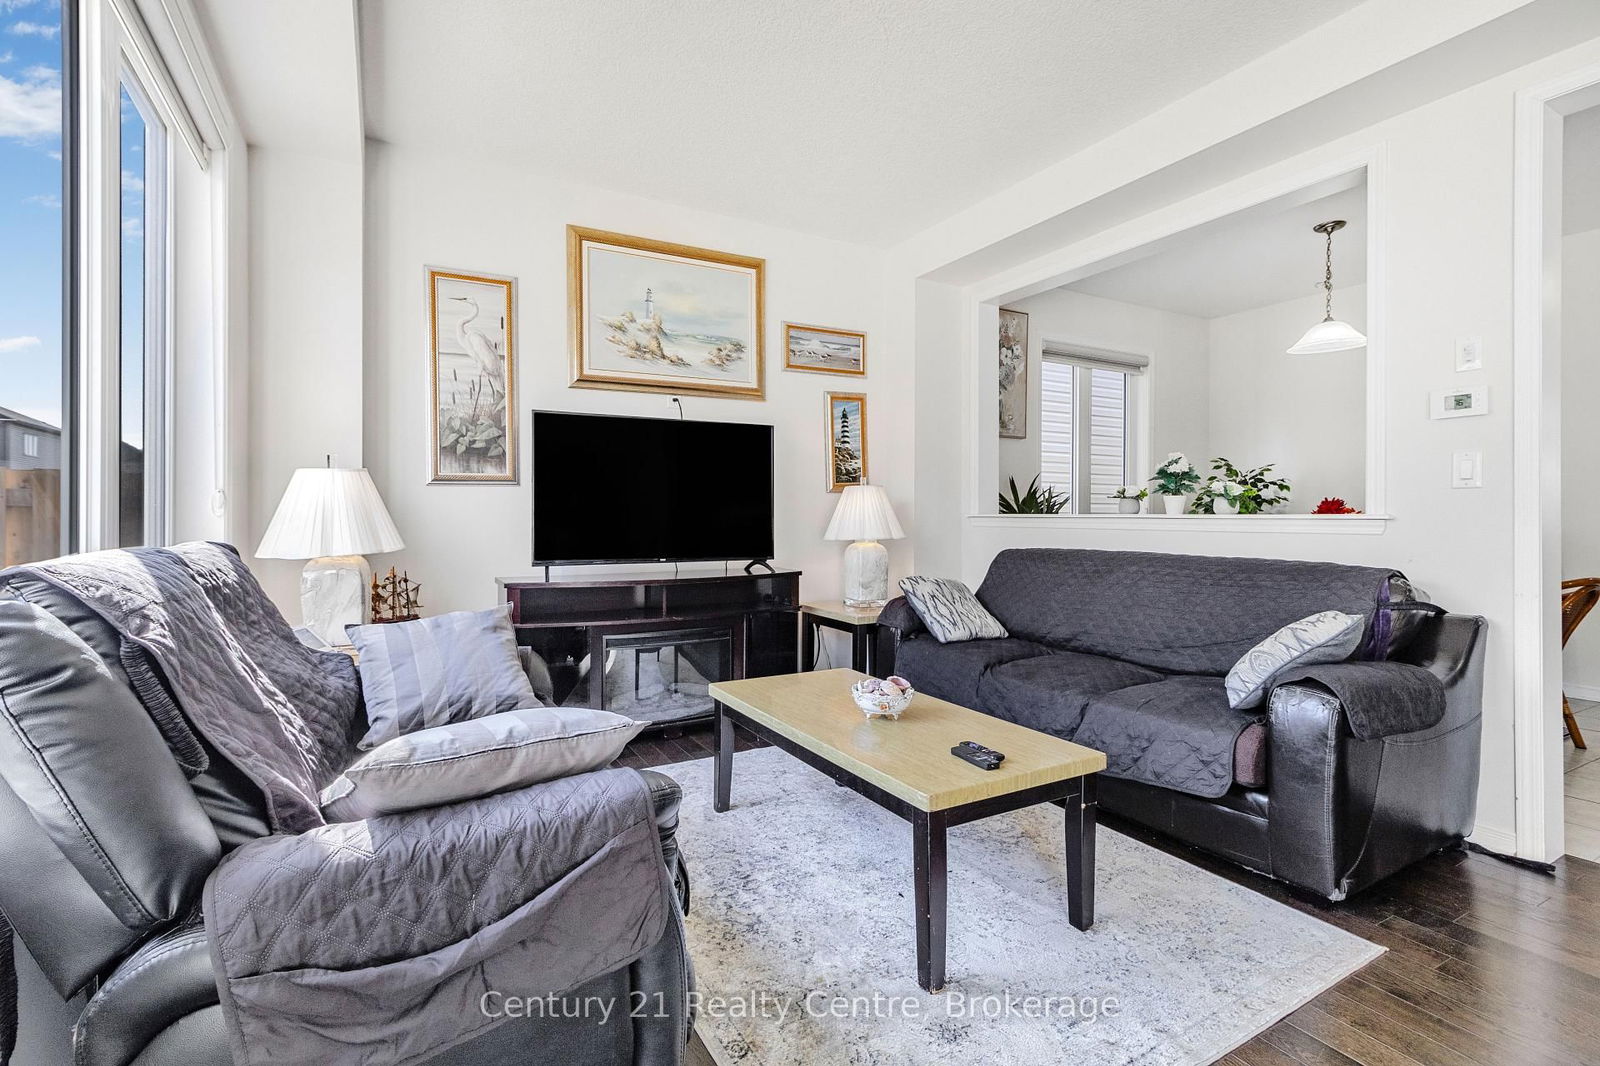
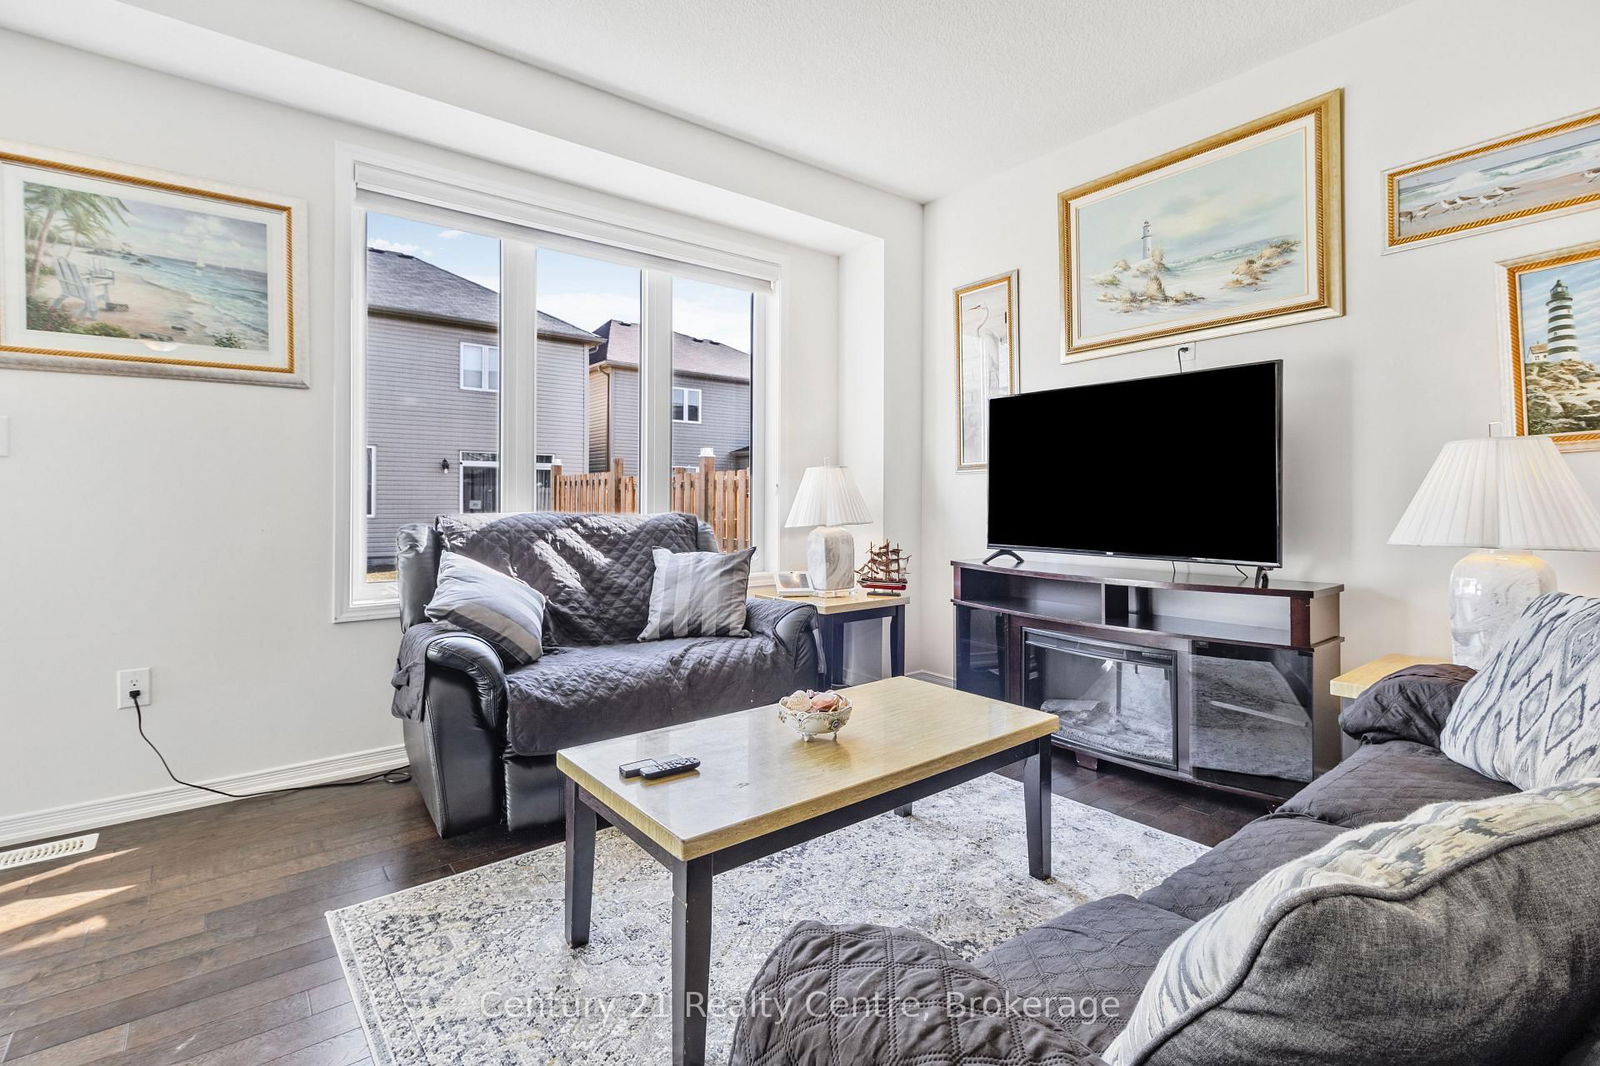
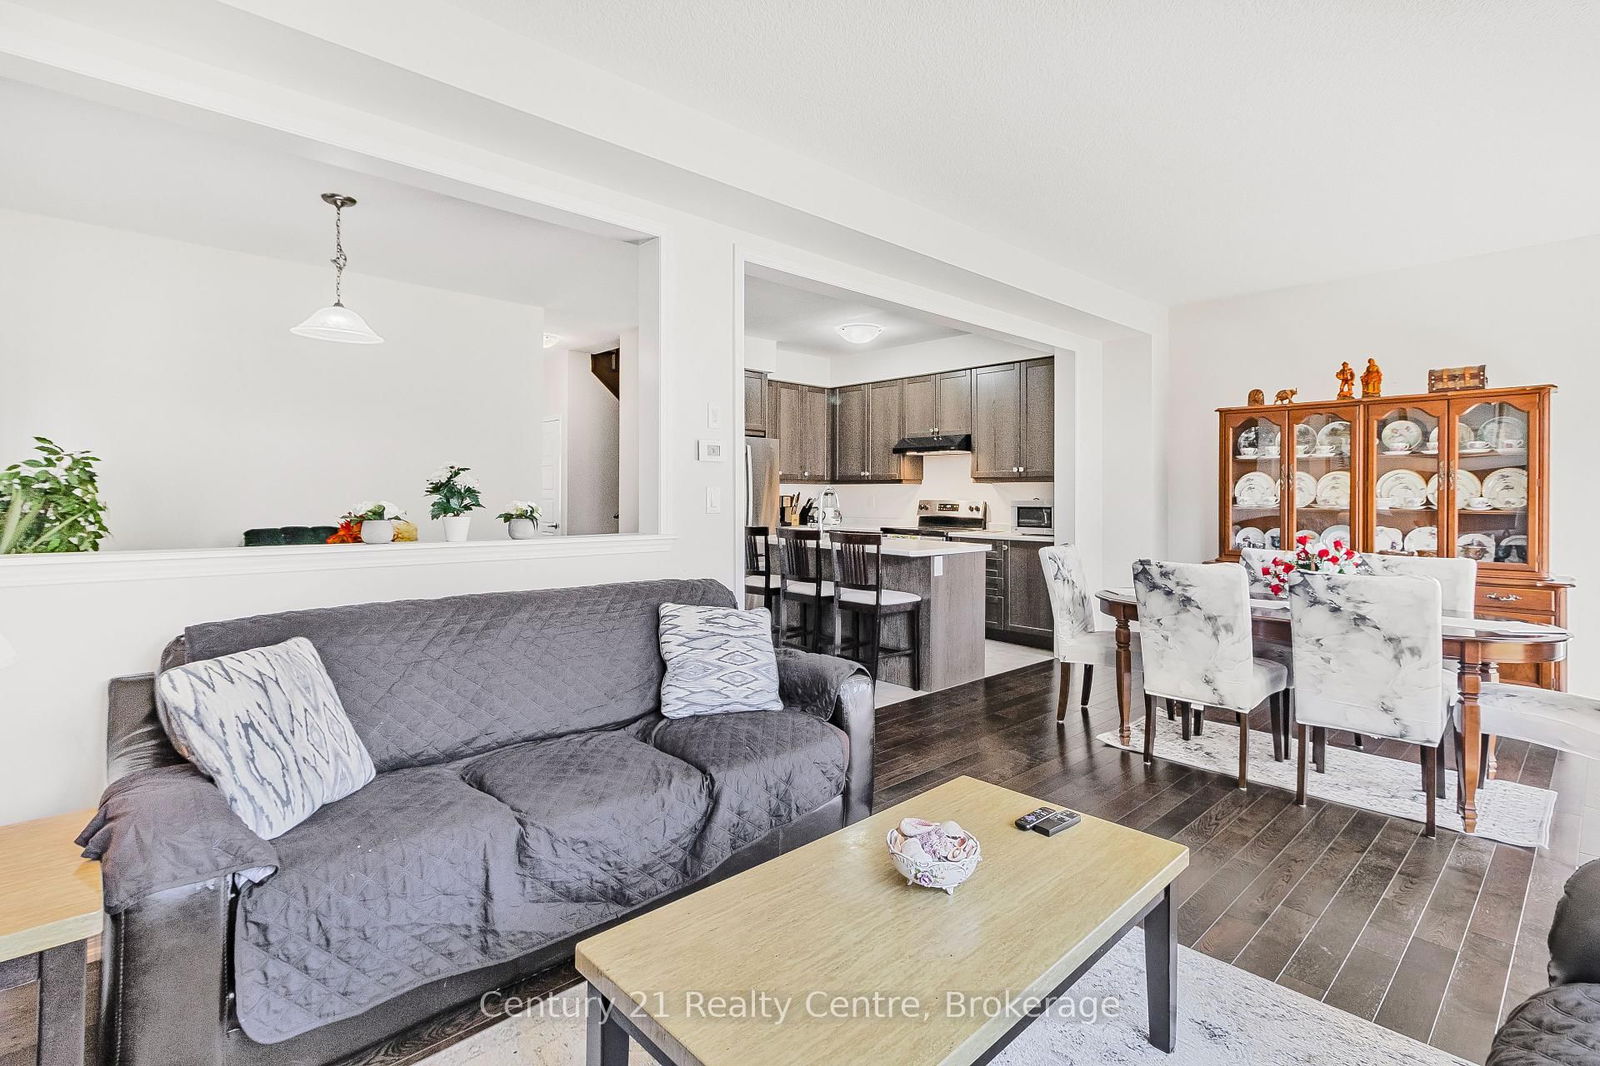
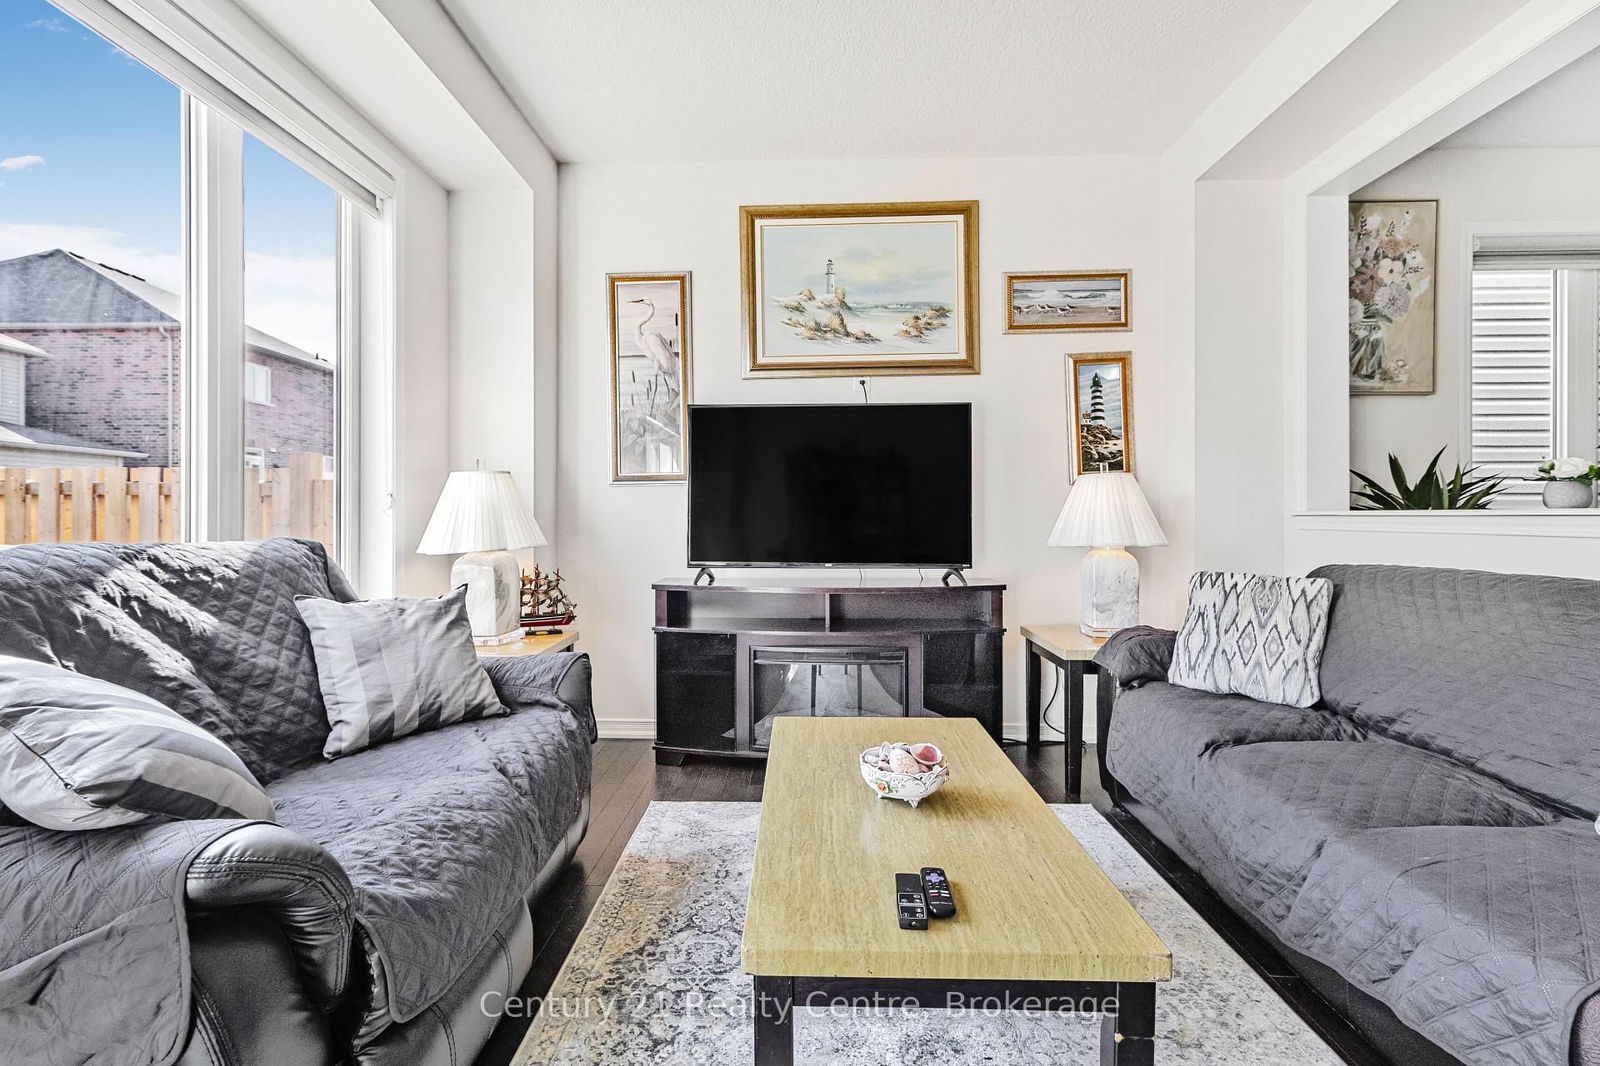
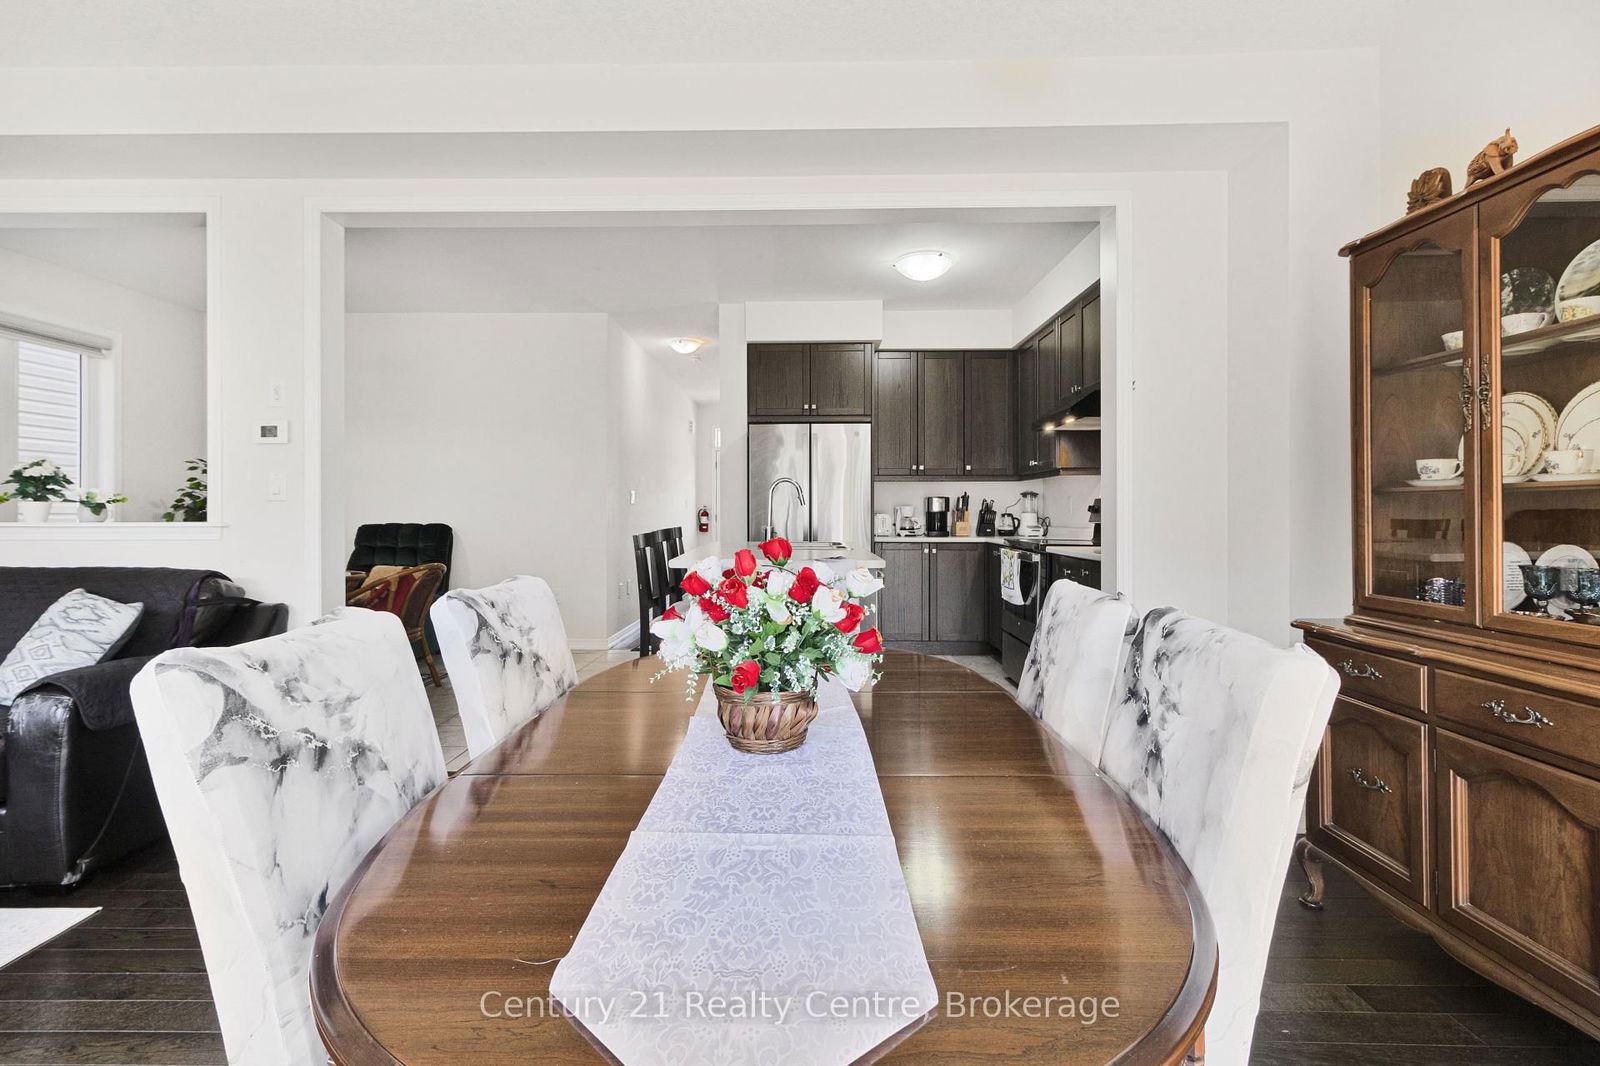
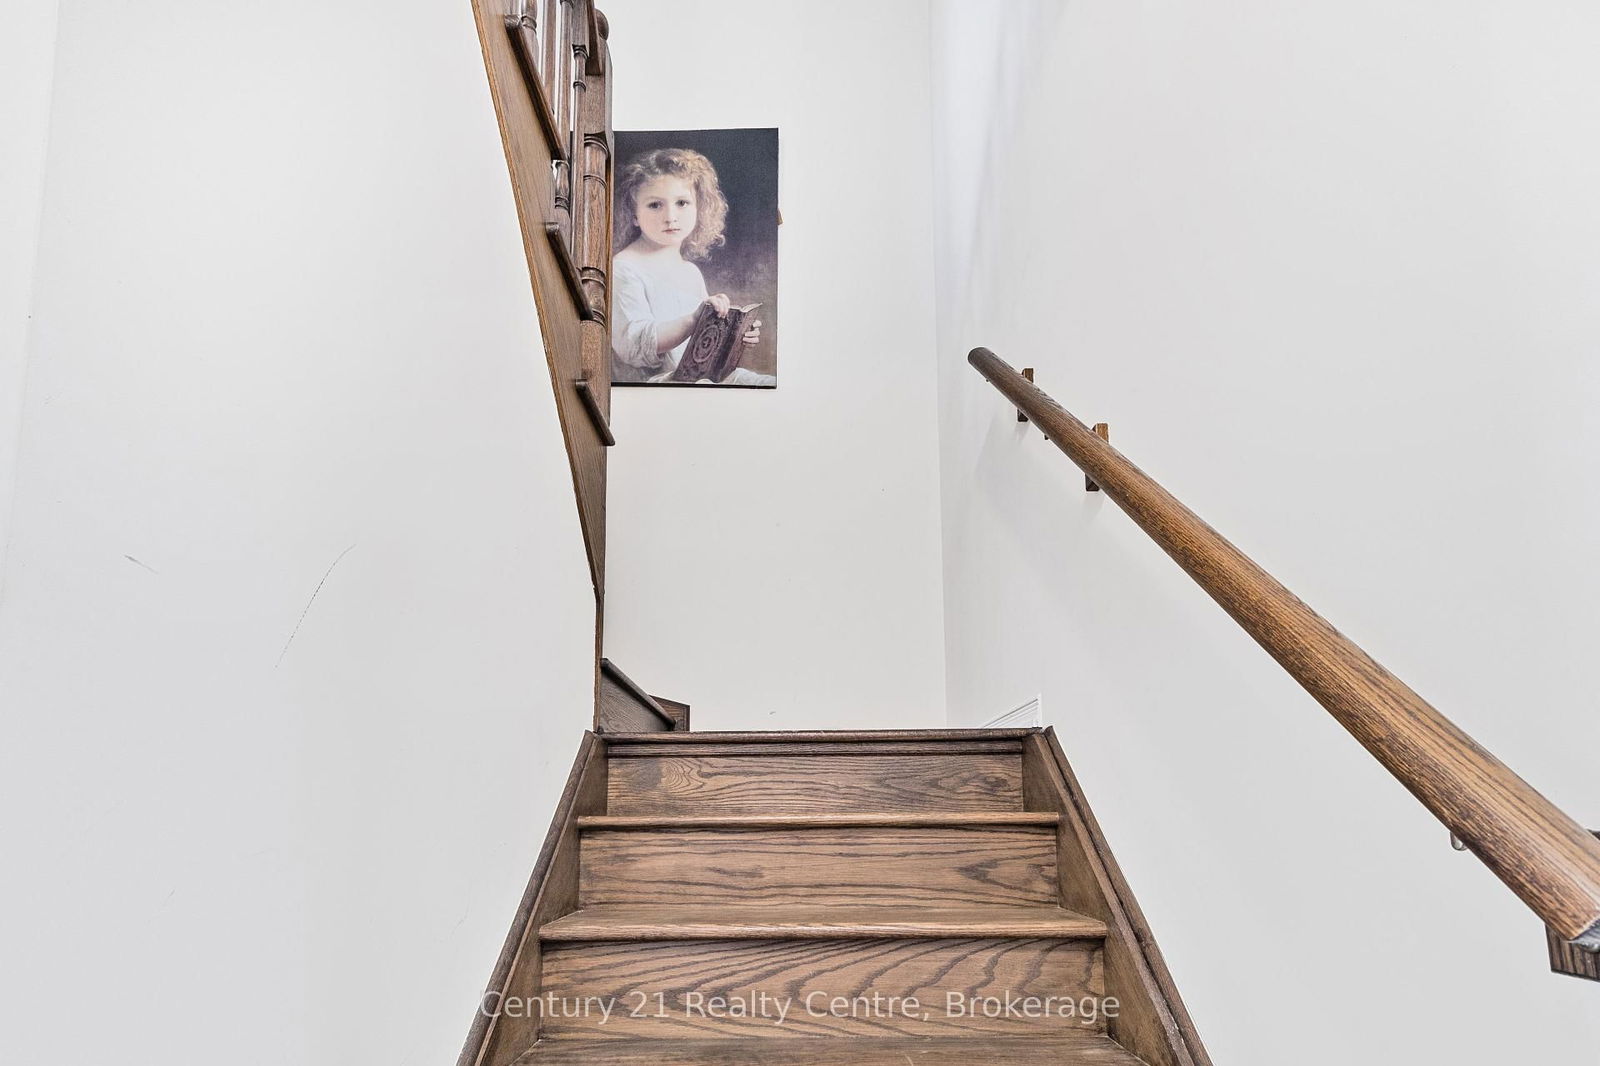
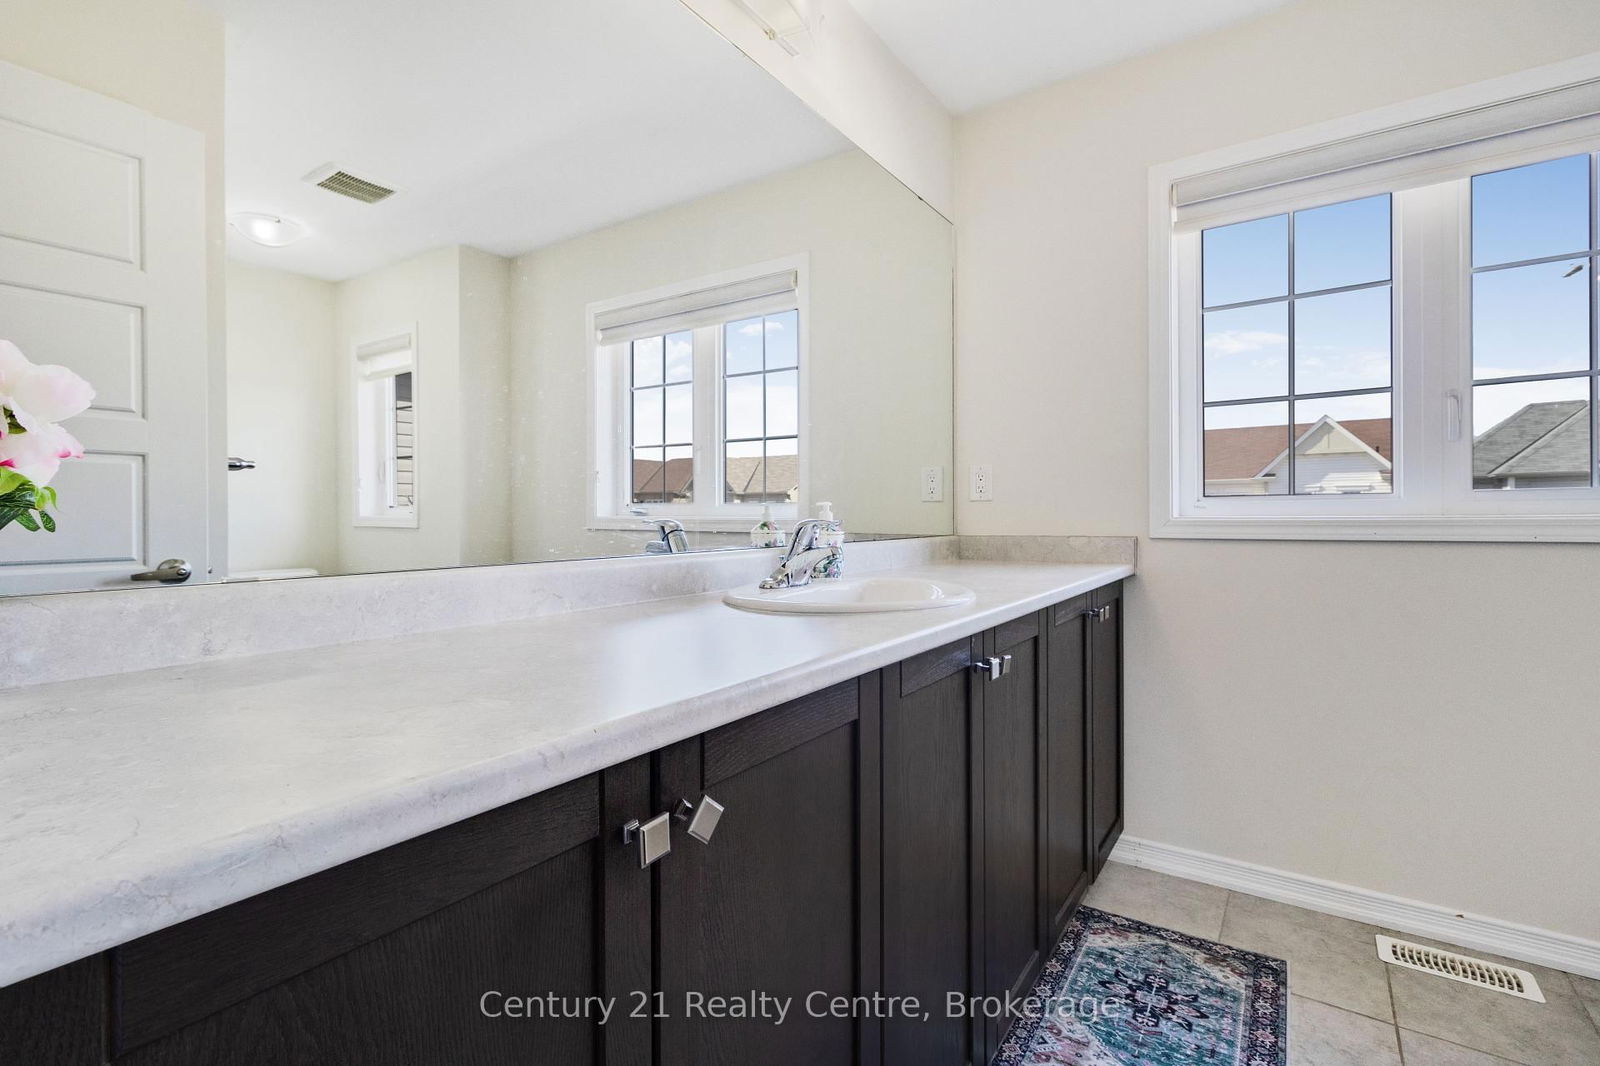
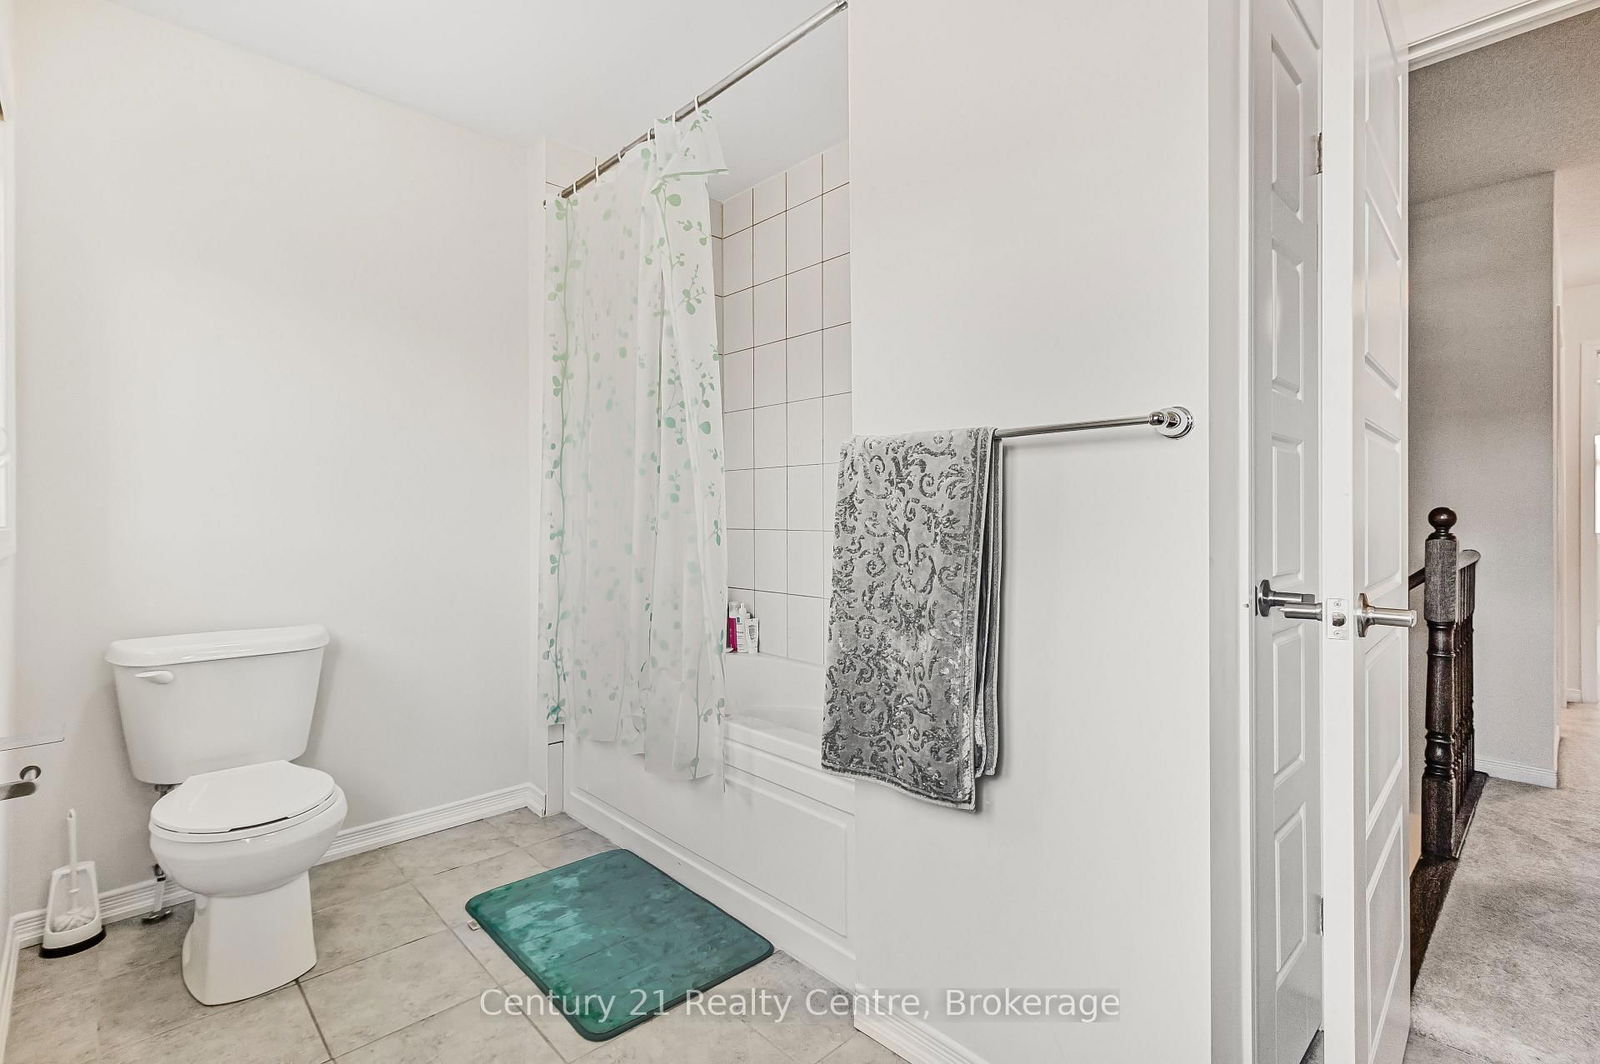
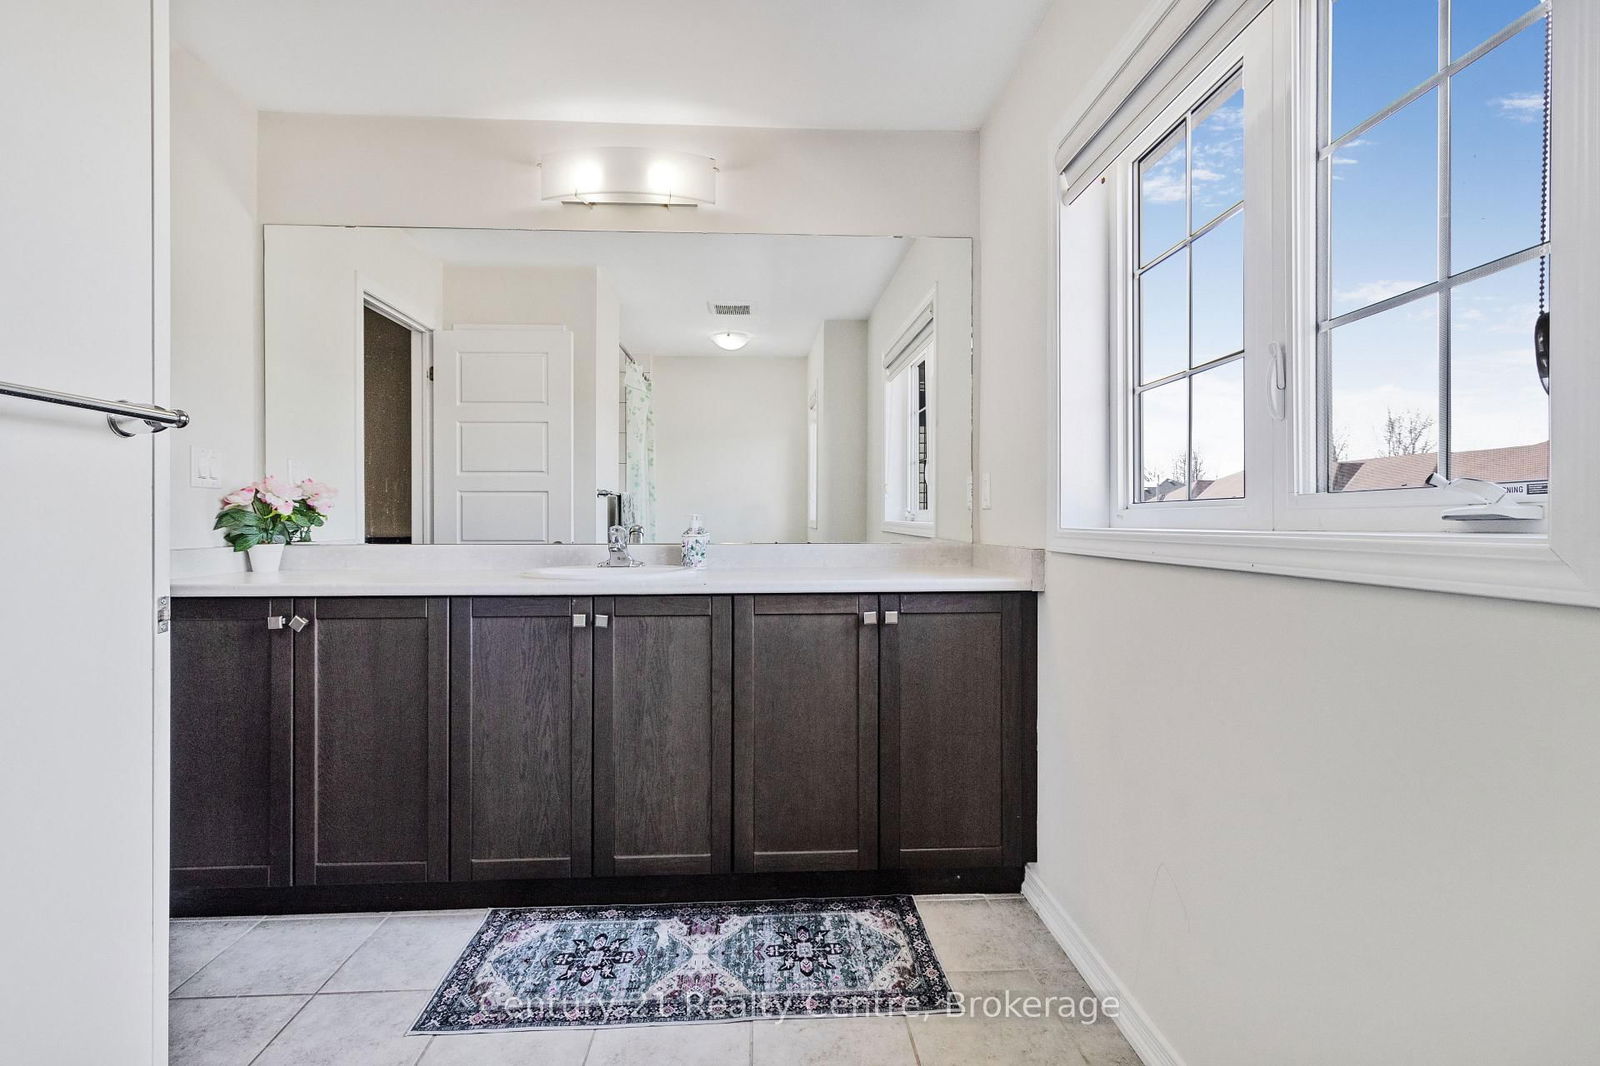
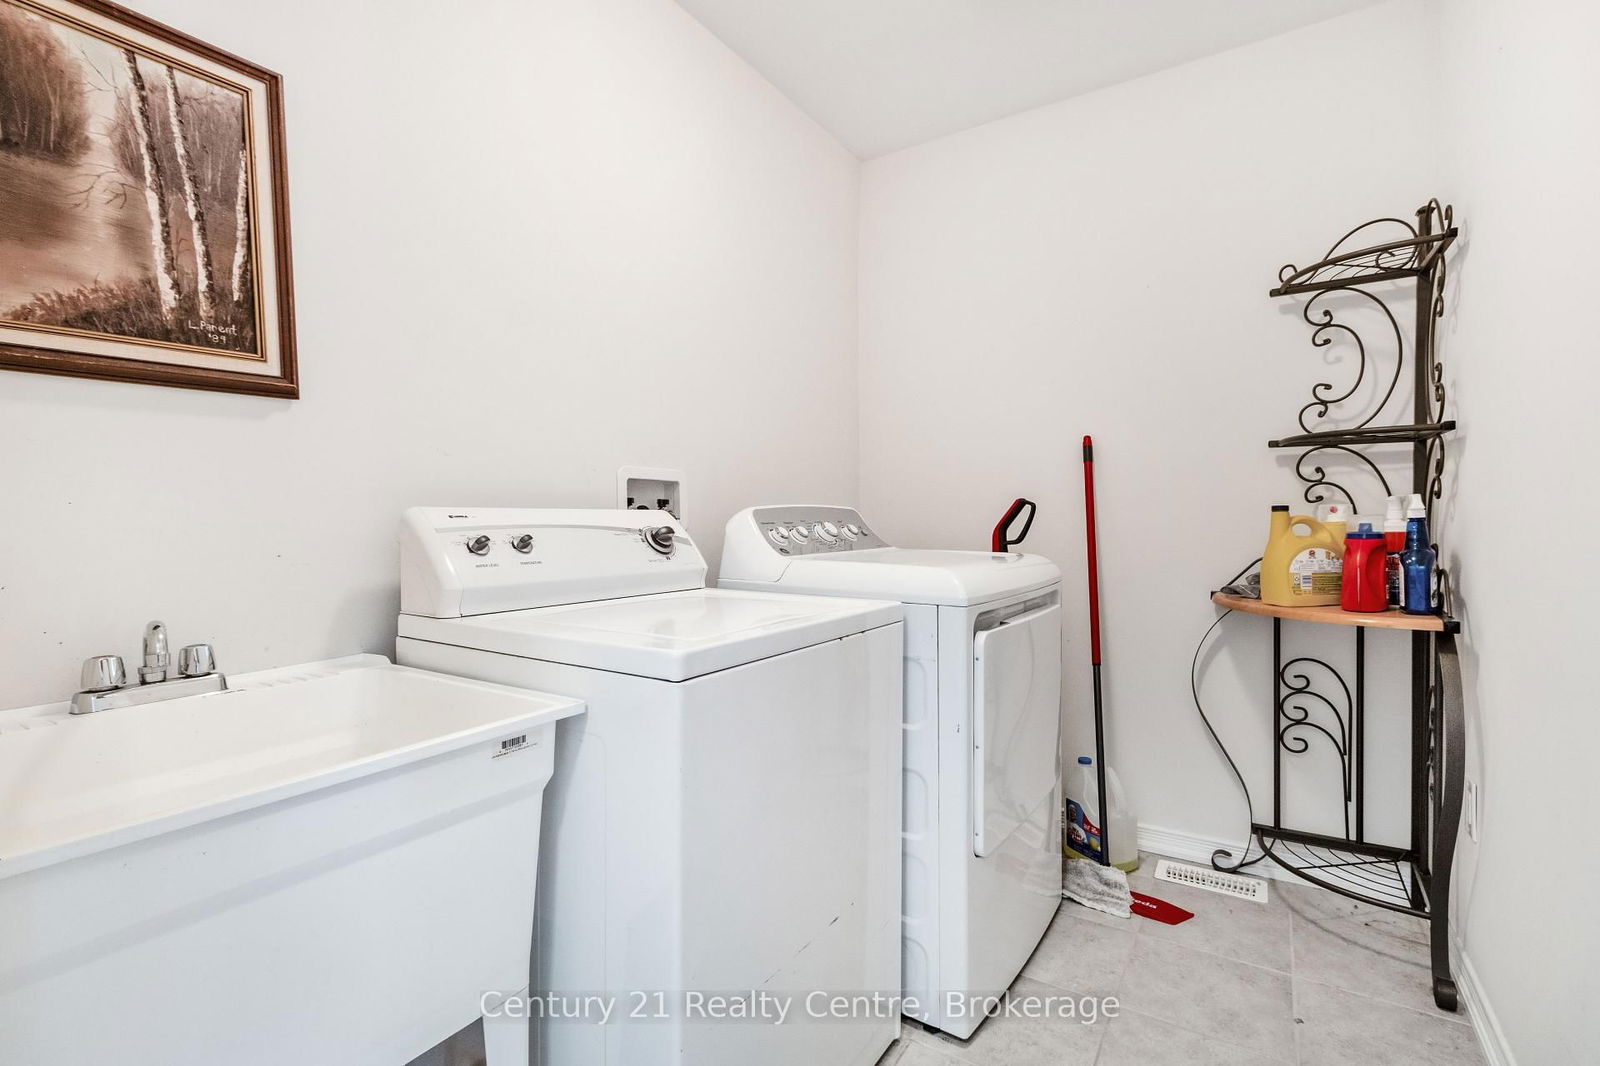
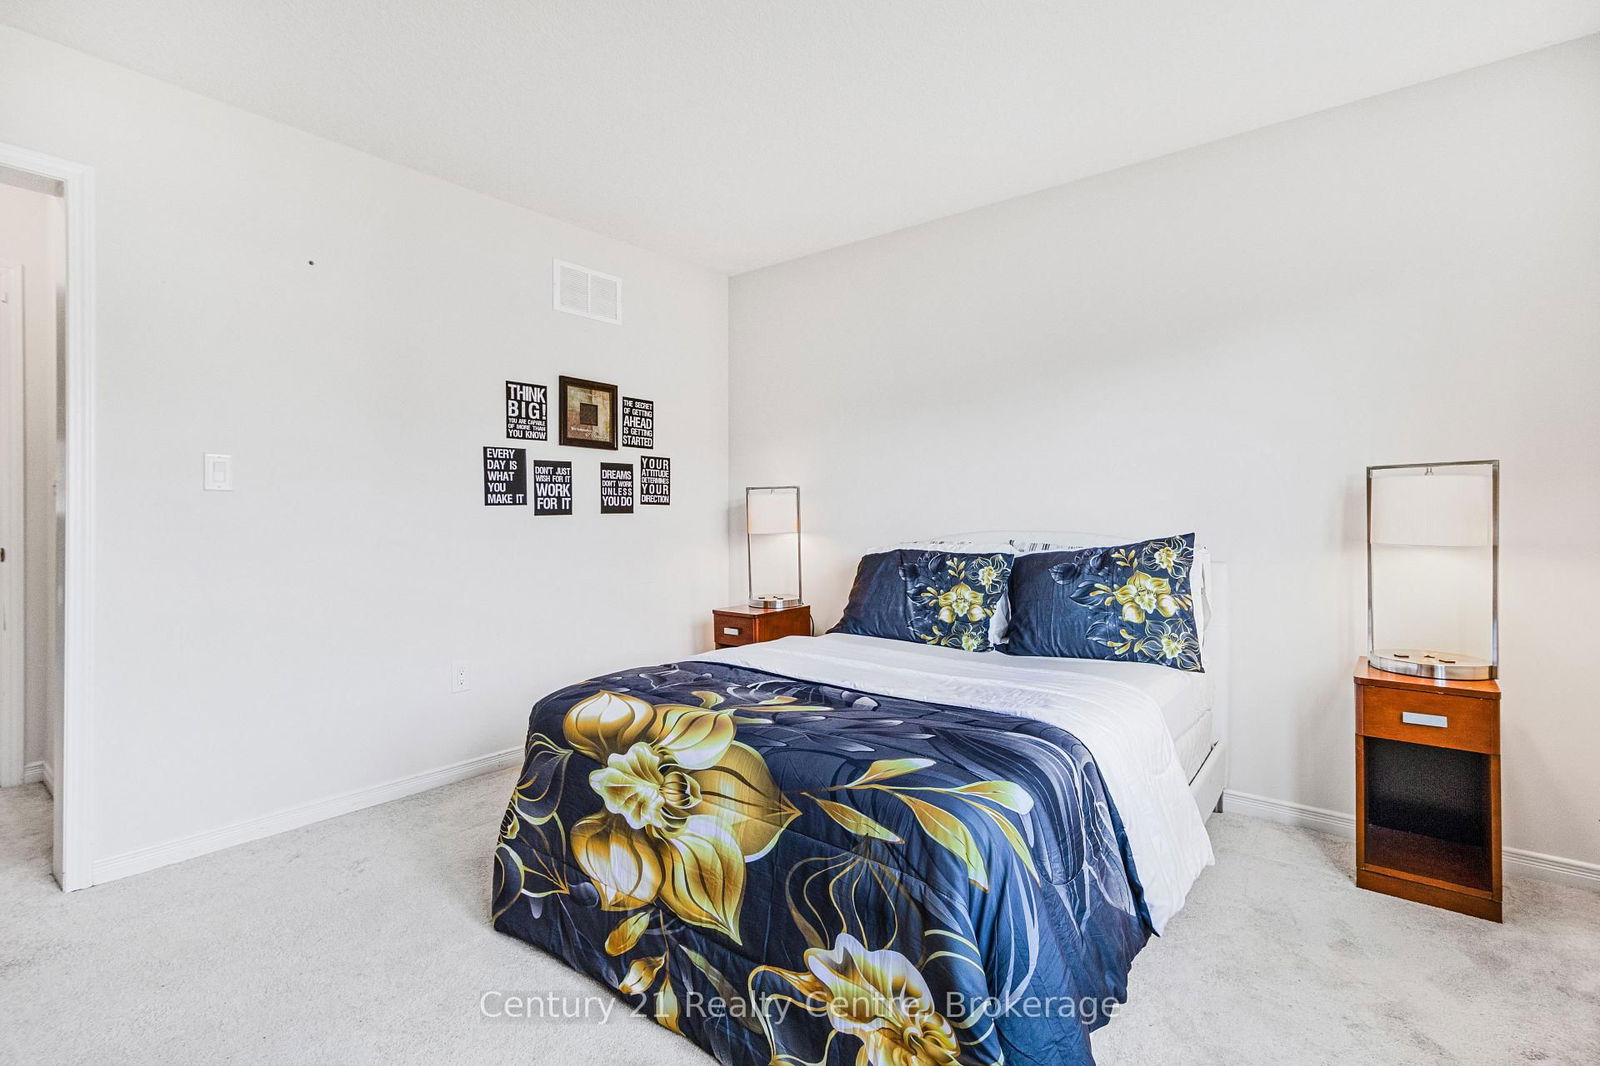
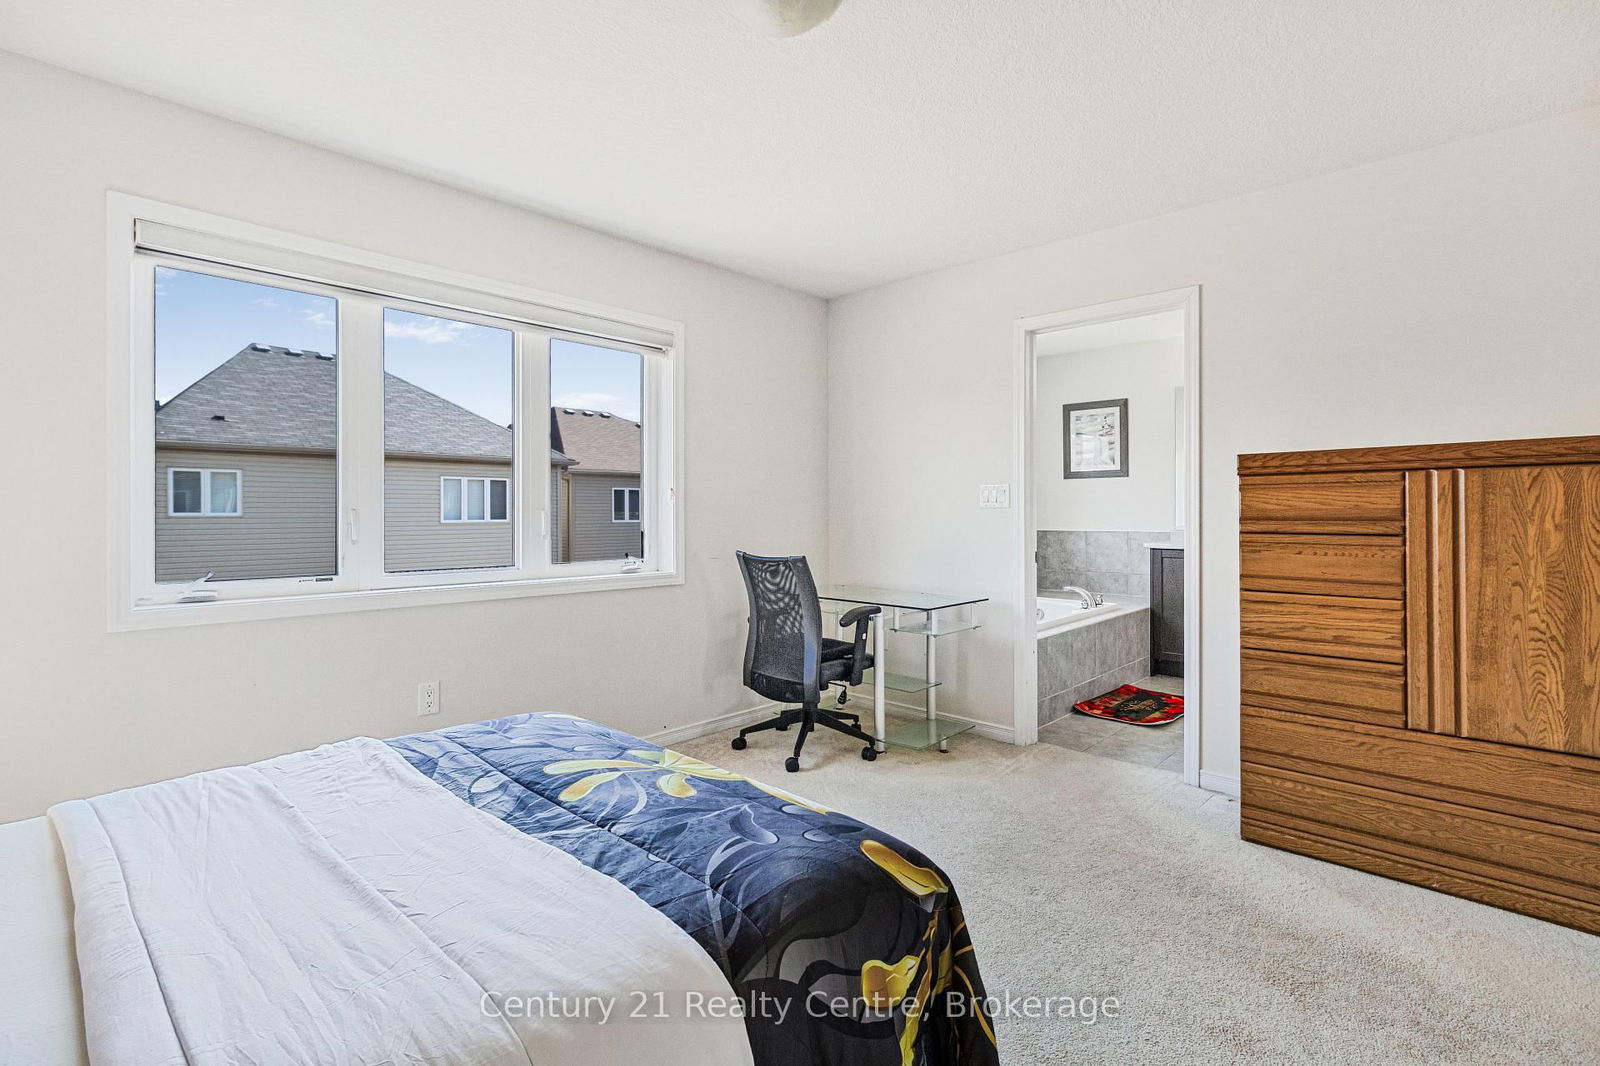
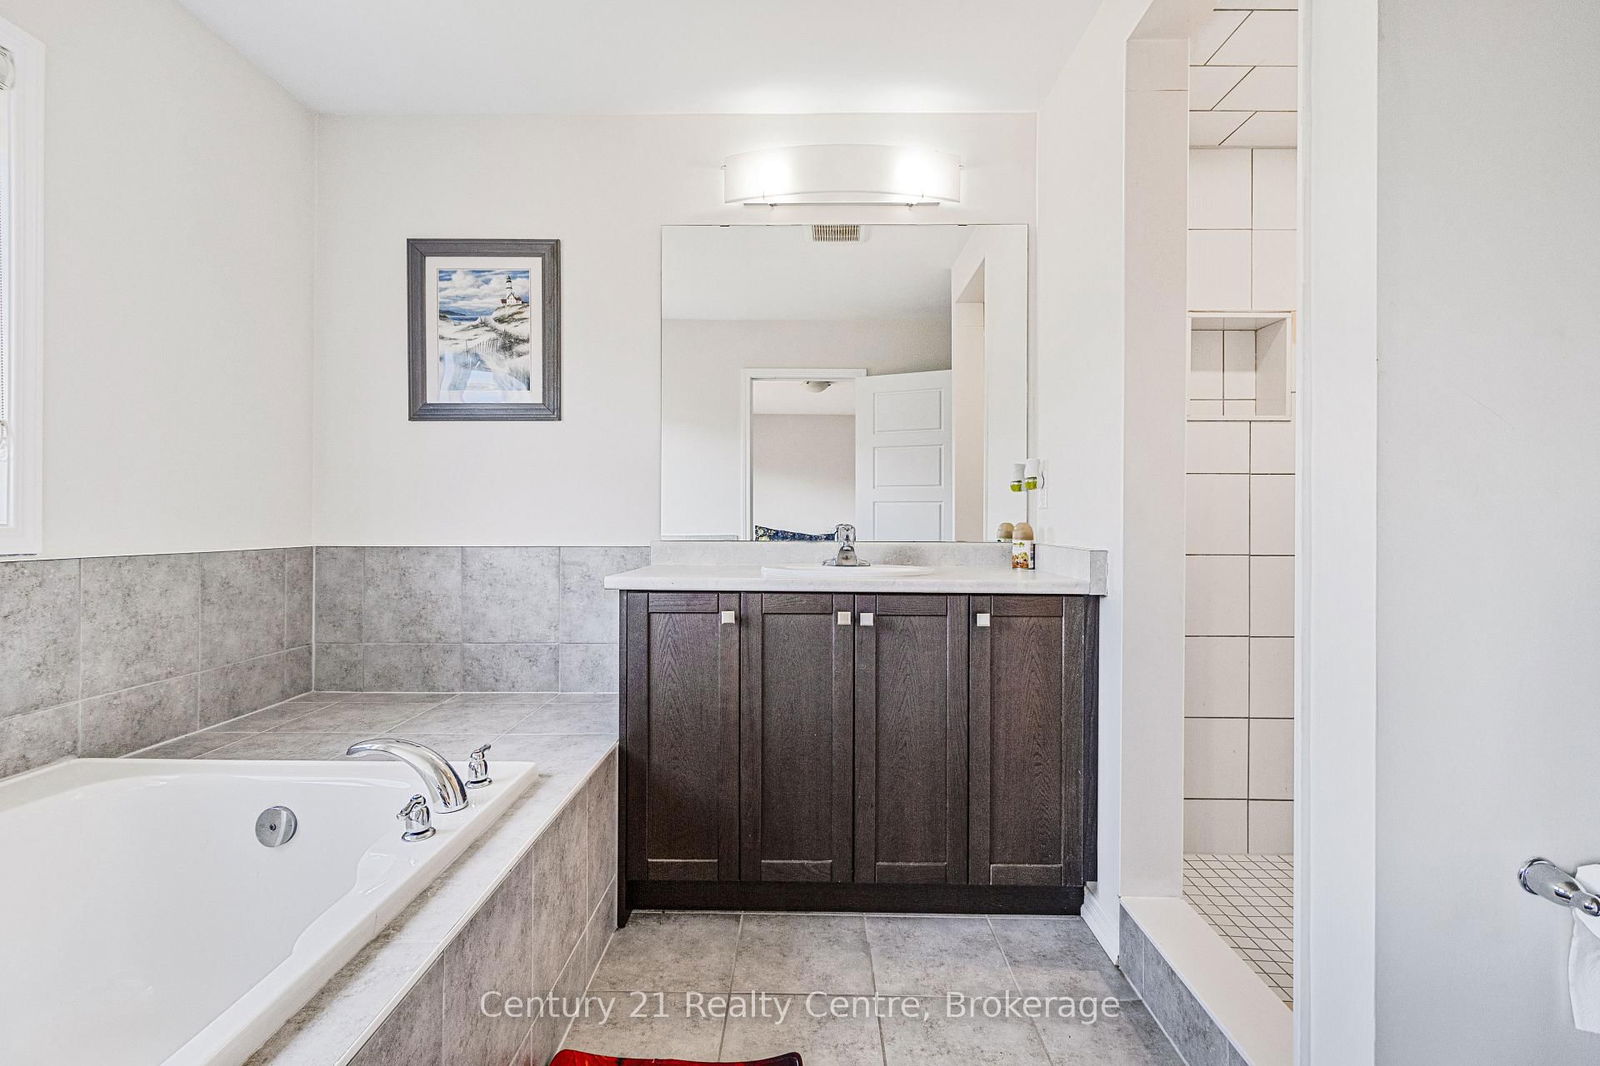
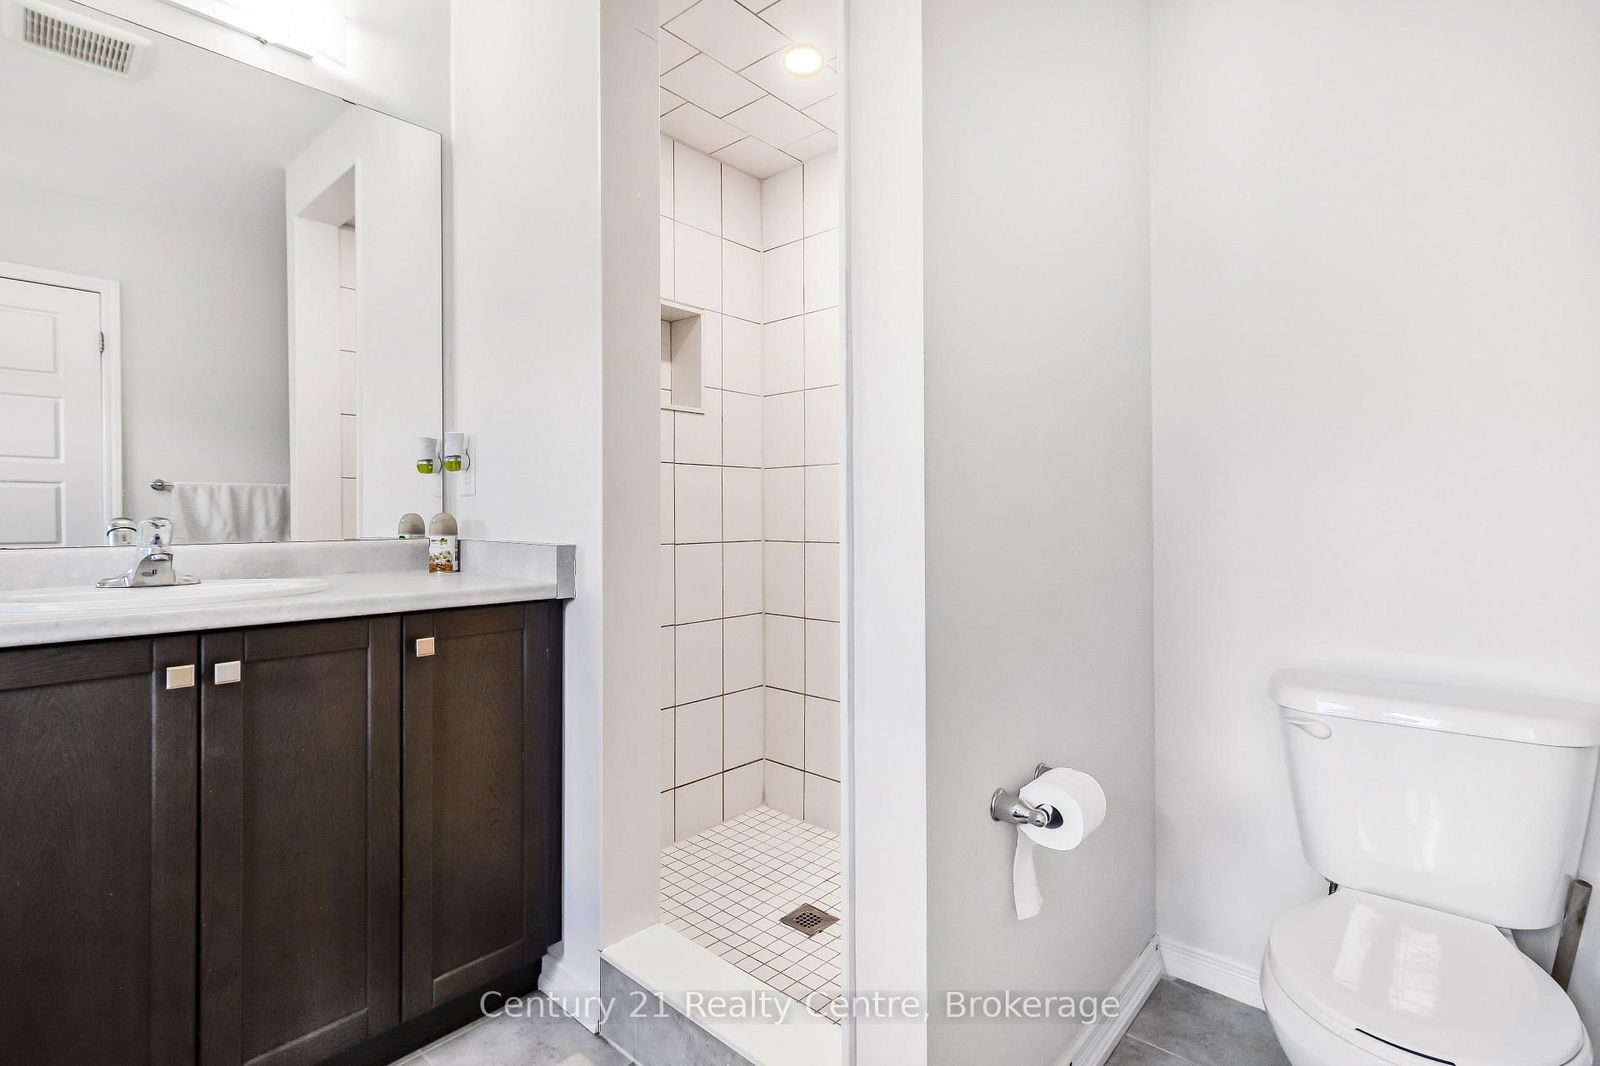
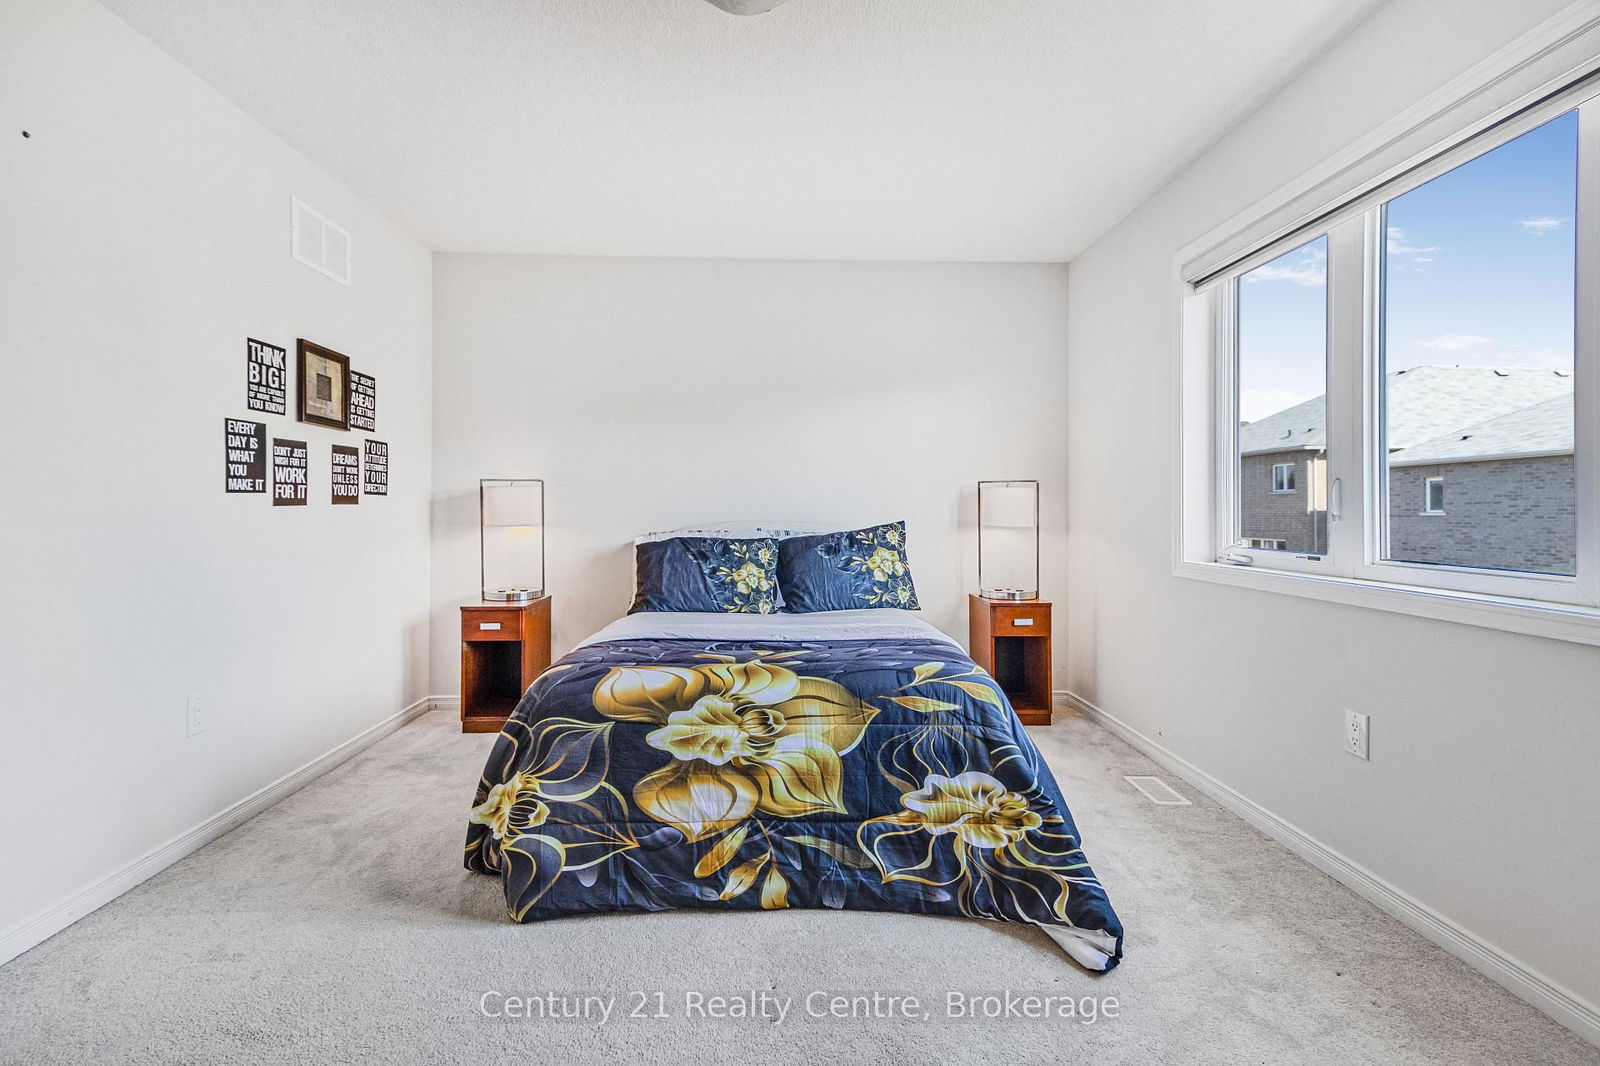
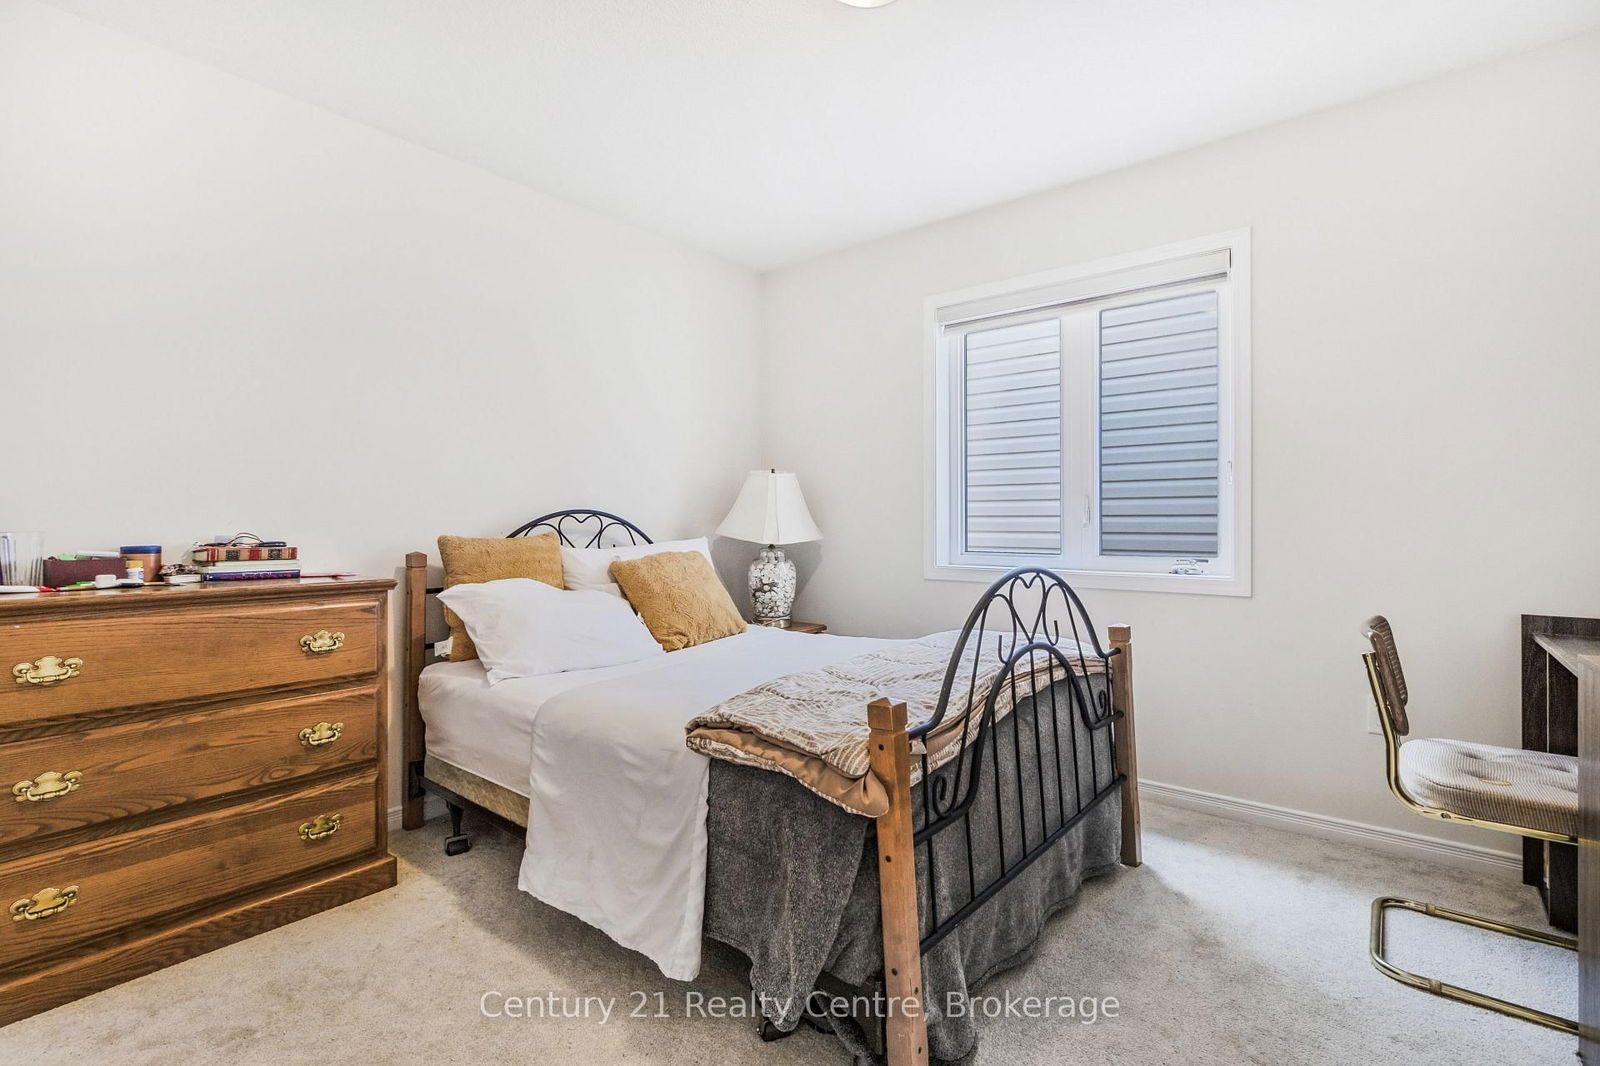
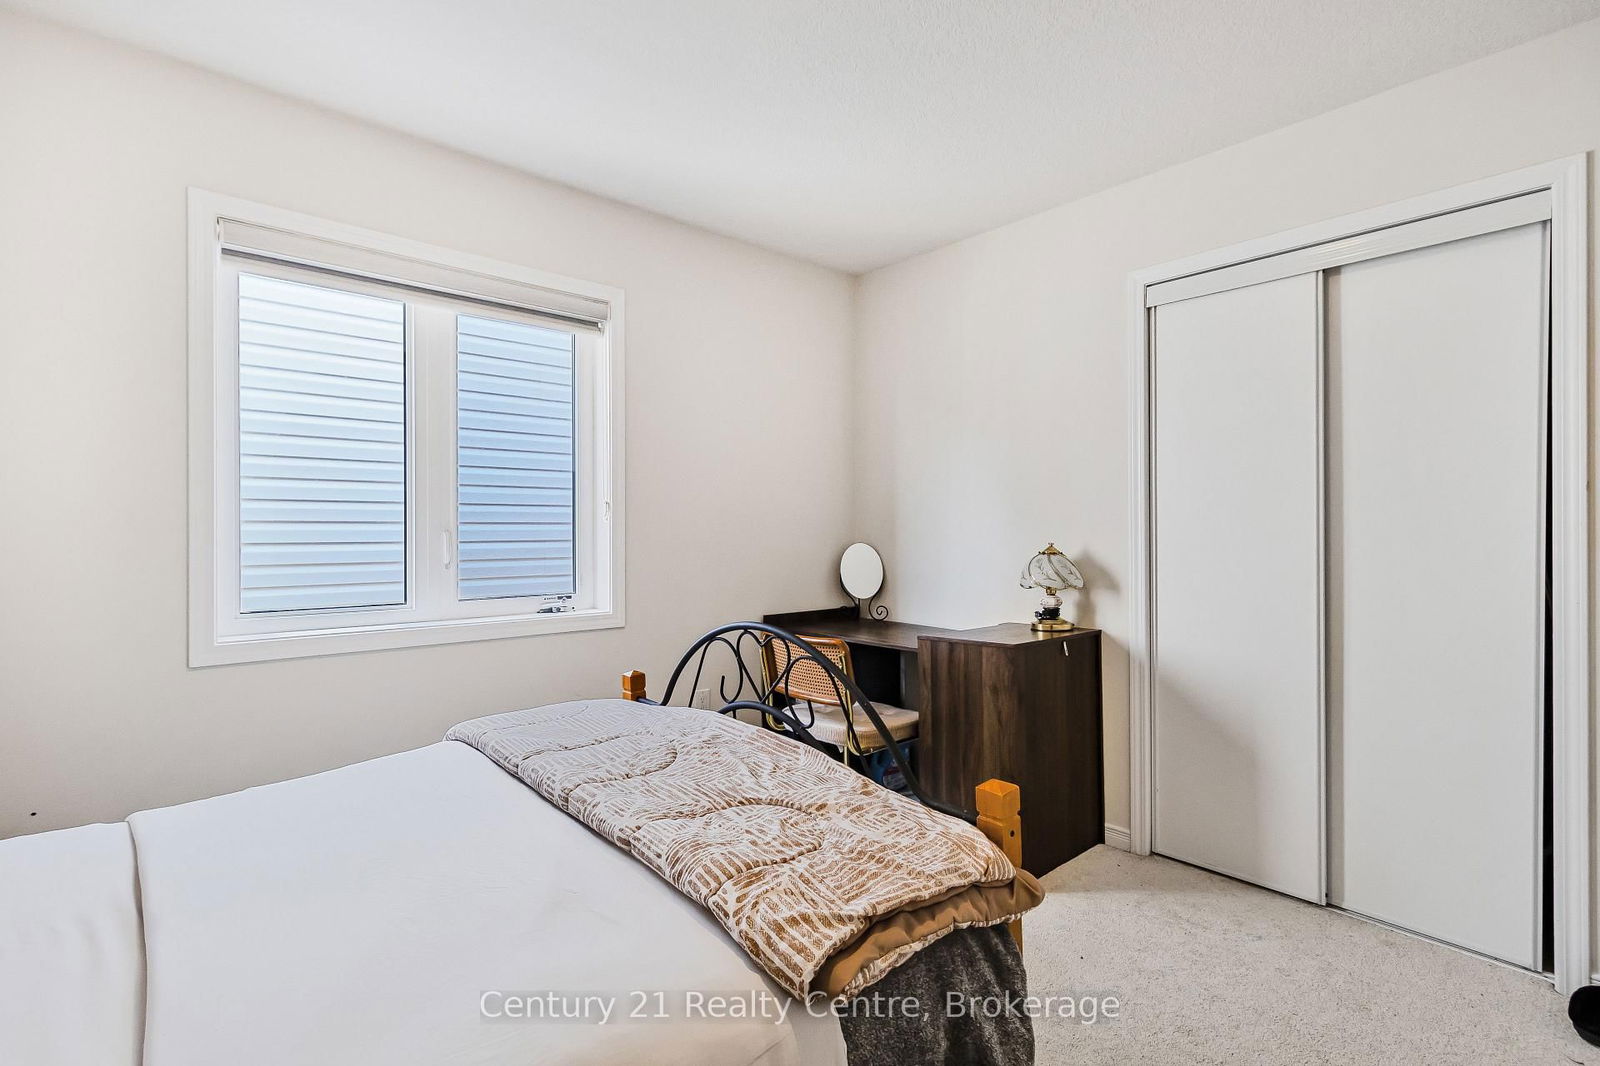
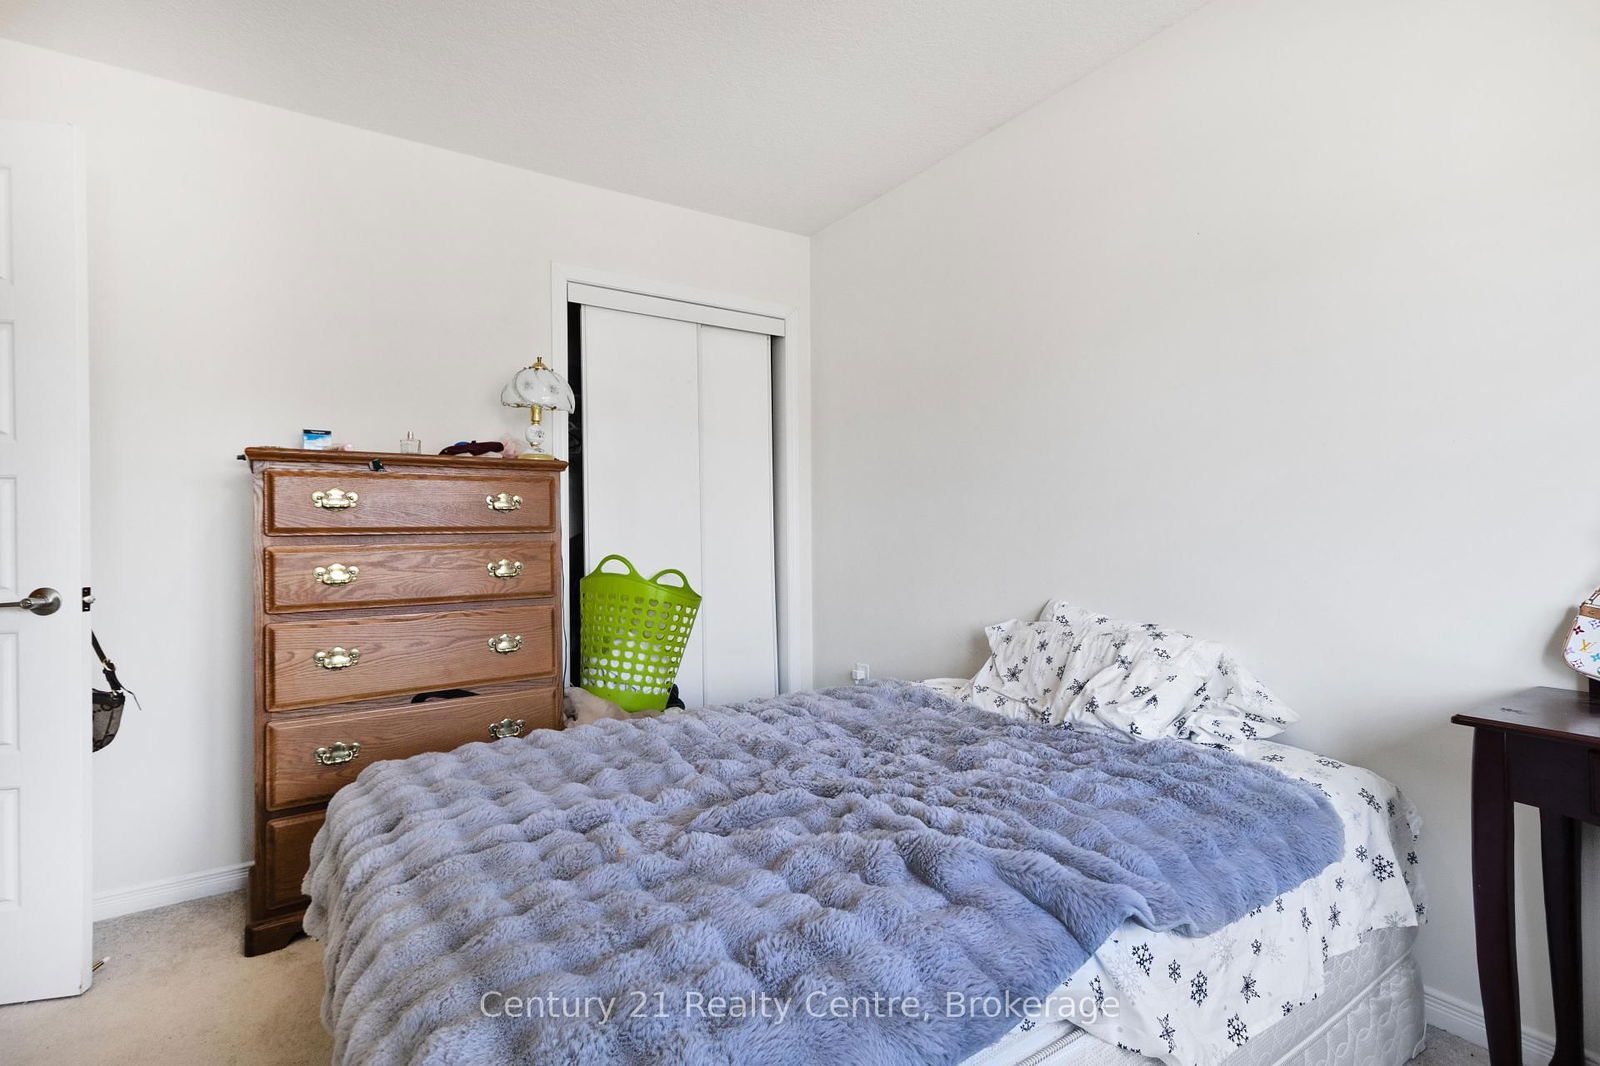
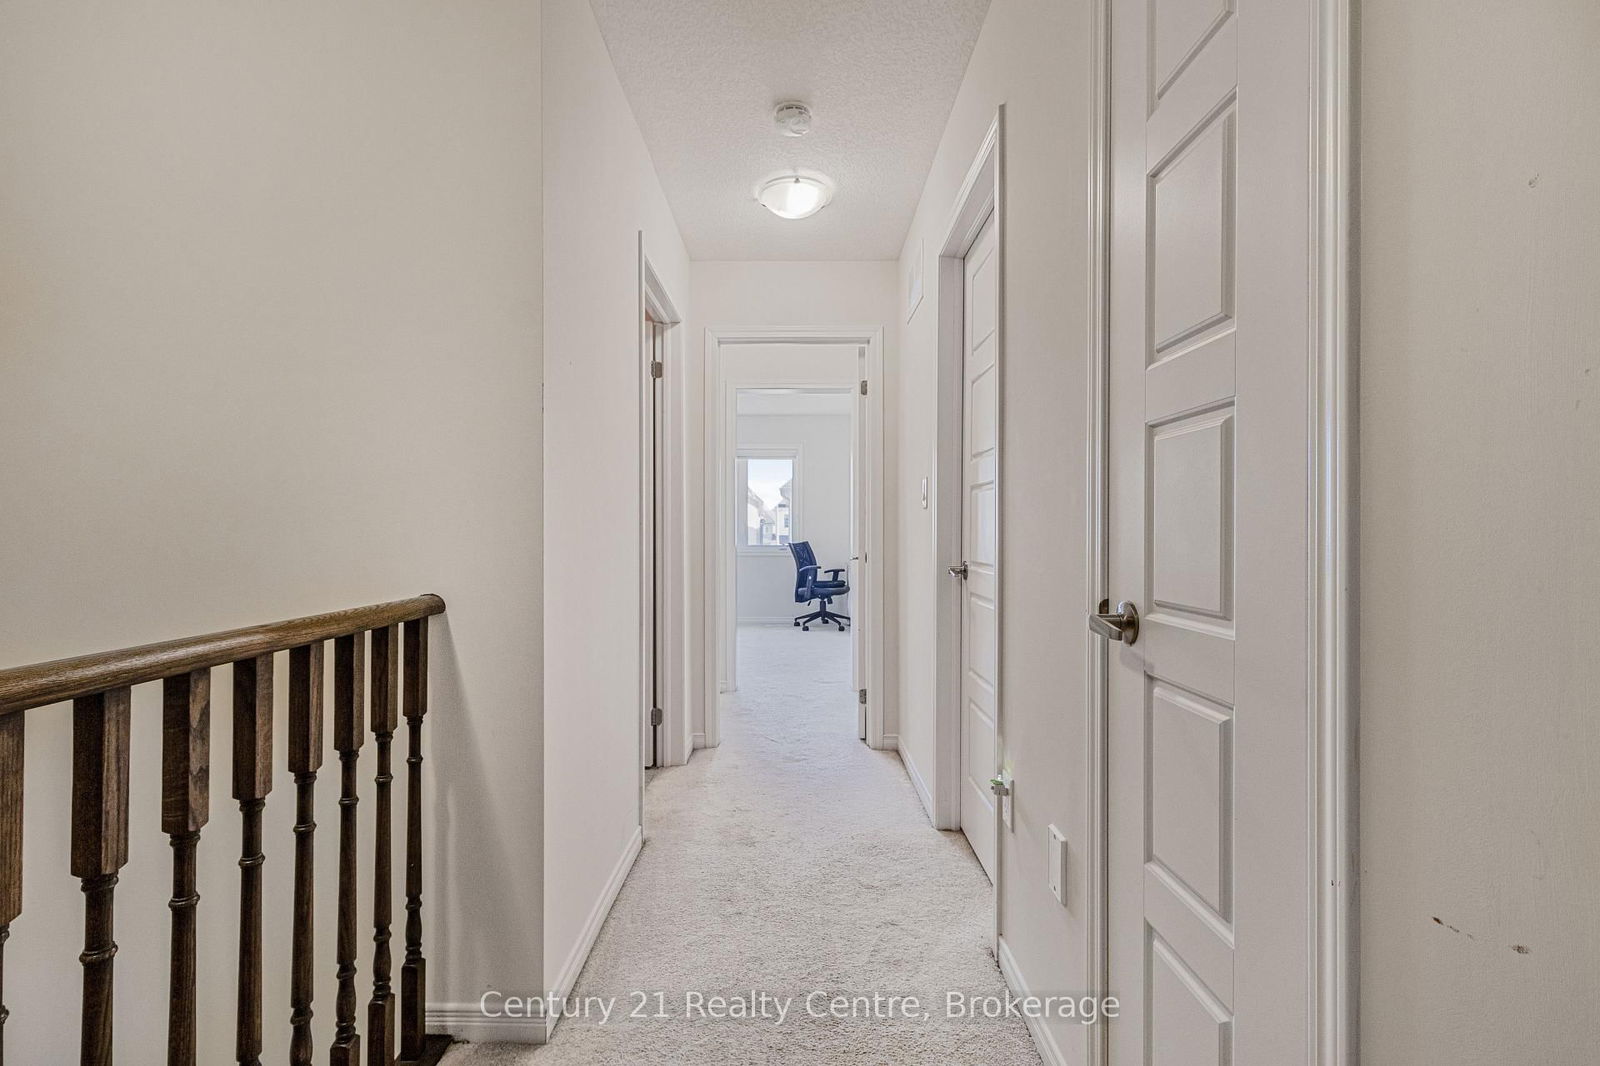
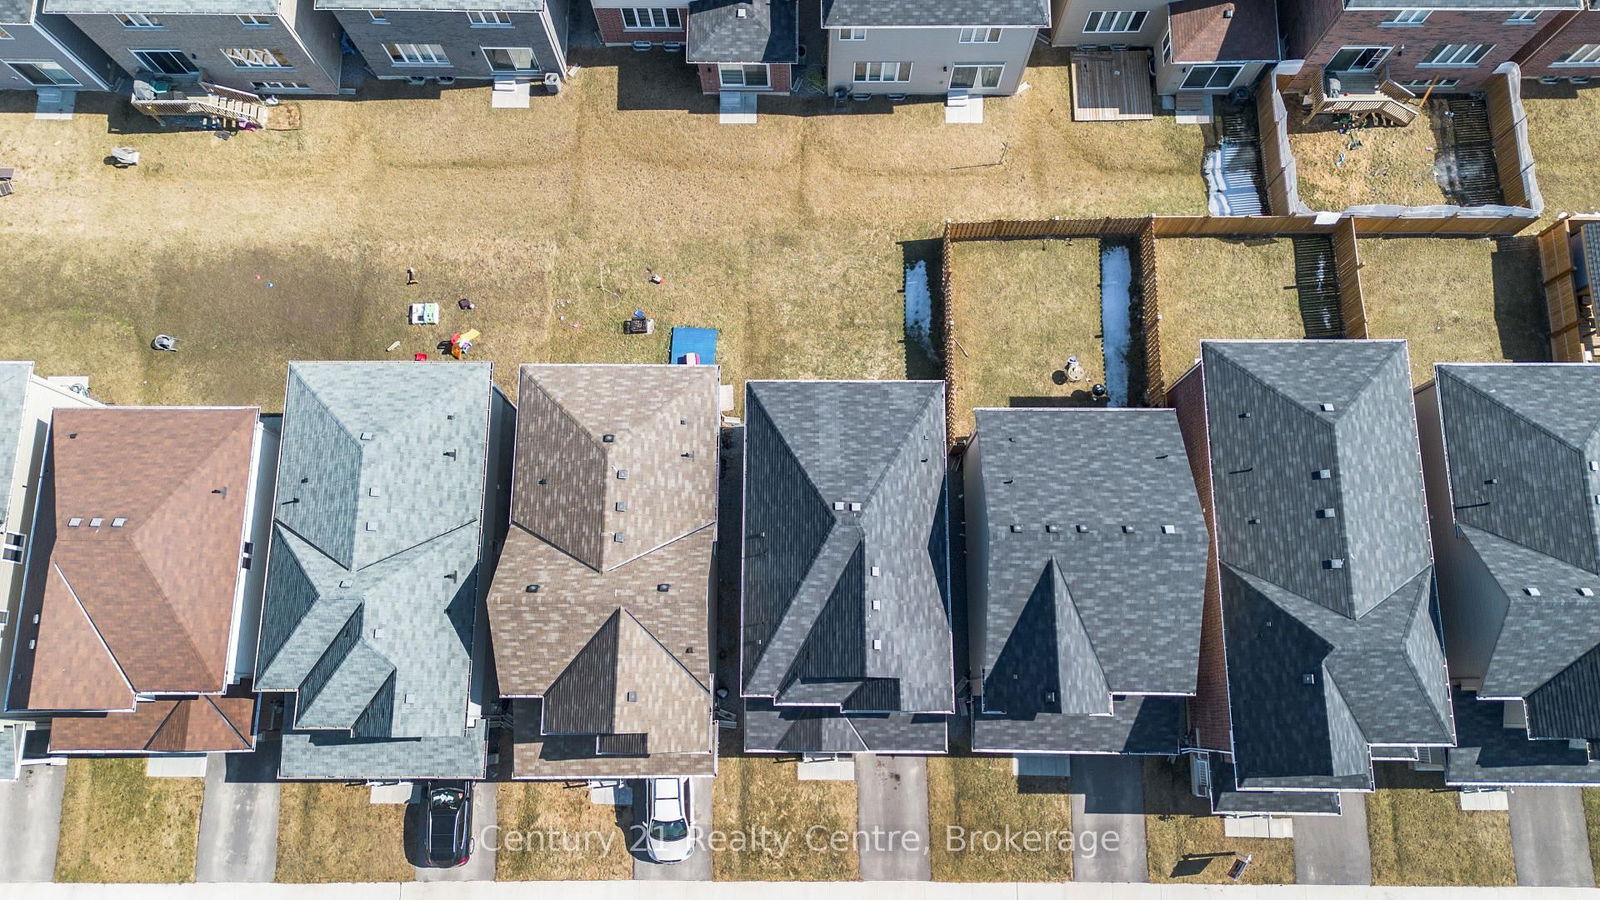
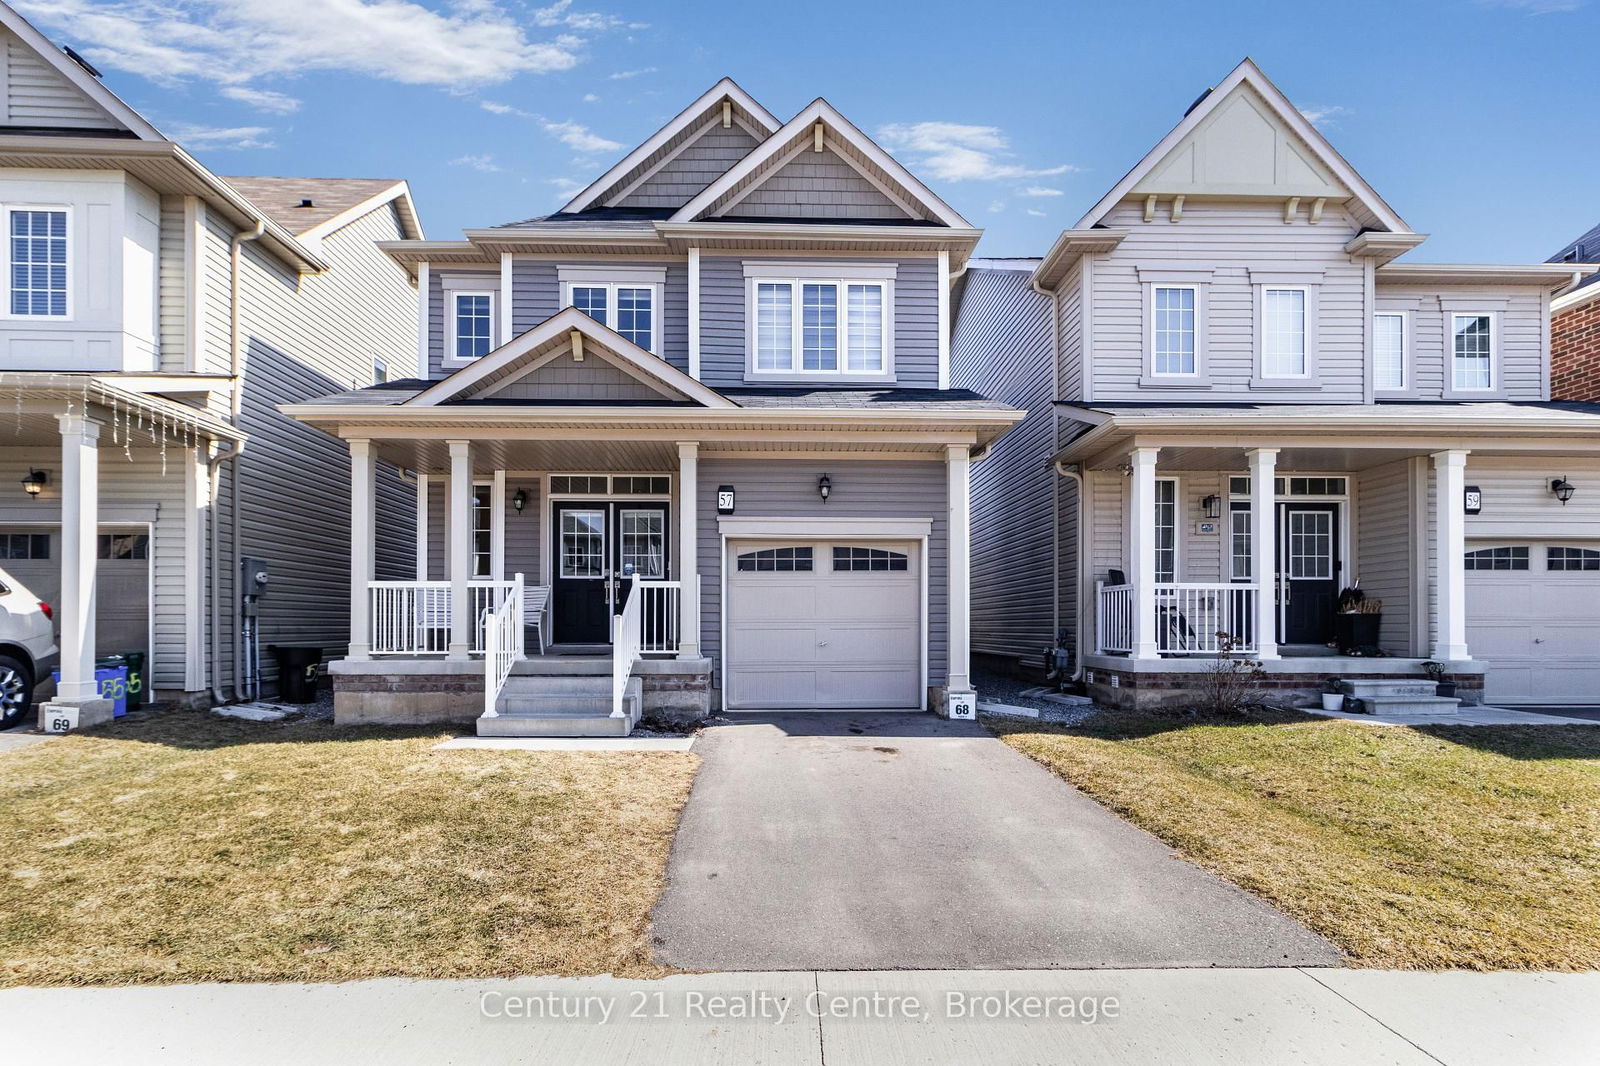
Welcome To This Fabulous DETACHED HOUSE 1754 Sq Ft Above Grade Built In 2021 In One Of The Welland's Most Desirable Neighborhoods. This Excellent Property Boasts 3 Spacious Bedrooms And 3 Bathrooms With An Open-Concept Floor Plan With Separate Living Room And Dining Room. This Home Has Been Meticulously Maintained And Is Presented In Pristine Condition, With FRESH PAINT Throughout And HARDWOOD FLOORING That Enhances Its Elegance And Charm. Every Detail Has Been Thoughtfully Attended To, Ensuring A Move-In-Ready Experience For The Discerning Buyer. Upon Entering, You Will Be Greeted By An Expansive Layout, Enhanced By Soaring Ceilings And Large Windows That Bathe The Space In Natural Light. The Convenient Upper-Floor Laundry Adds An Extra Layer Of Functionality. The Kitchen Is A Chef's Dream, Featuring Sleek Stainless Steel Appliances, Abundant Cabinetry, And A Great Size Breakfast Bar, Perfect For Casual Meals Or Entertaining Guests. The Luxurious Primary Suite On 2nd Floor Is A True Retreat, Offering A Walk-In Closet & 5 Pc Ensuite Washroom. The Additional Bedrooms Are Equally Spacious, Each Offering Ample Closet Space To Accommodate Family Members Or Guests. The House Is Located In A Peaceful, Family-Friendly Neighborhood, Offers The Best Of Both Worlds: Tranquility And Convenience. Ideally Located Just 5 Minutes From Seaway Mall, Walmart, And Canadian Tire, 10 Mins From Brock University & Niagara College. Don't Miss Your Chance To Own A Beautiful Piece Of Thorold, Schedule Your Private Showing Today!
Fridge, Stove, Dishwasher, Washer and Dryer, All Window Coverings and Blinds all existing light fixtures.
Great Rm
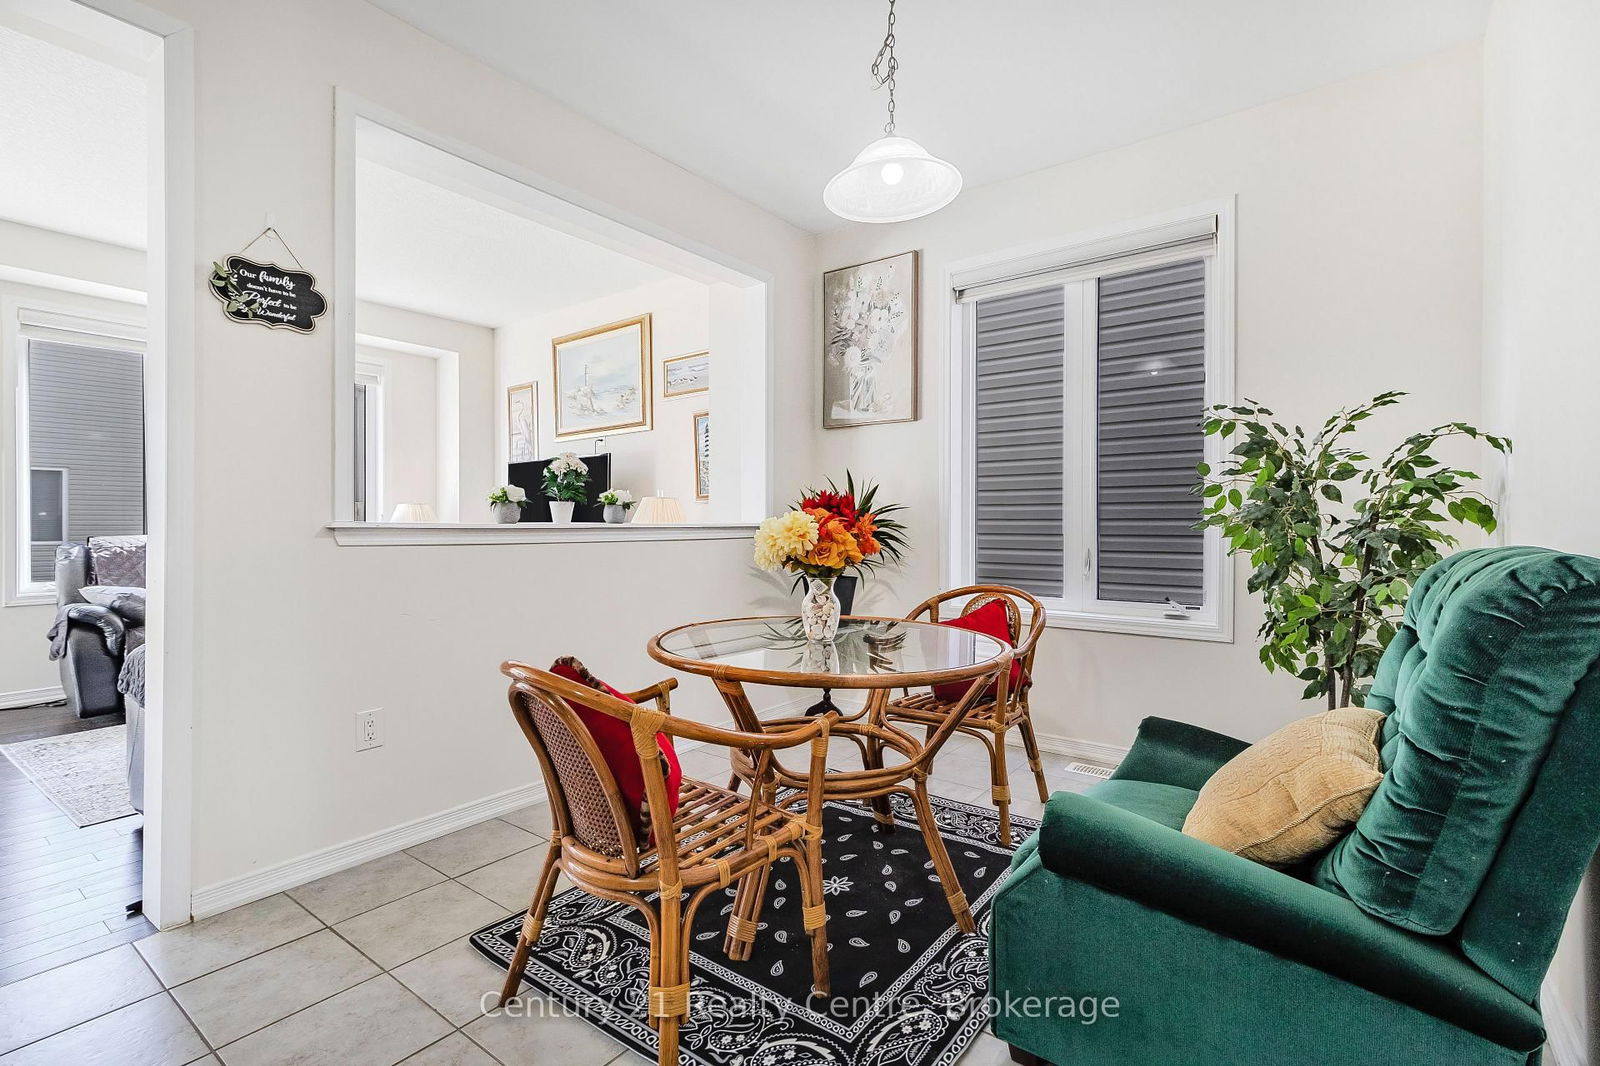
Breakfast
Kitchen
Primary
2nd Br
3rd Br
The graph below compares the average list price and average sale price of homes in this neighborhood by month for the last 24 months. When average sale price is greater than average list price, this may suggest a buyer's market. When average sale price is lower than the average list price this may suggest a seller's market.
The graph below illustrates the average days on market for homes in this neighborhood. The yellow area may indicate a buyer's market, the green area may indicate a balanced market and the red area may indicate a seller's market.
Sales Representative, Century 21 People’s Choice Realty Inc., Brokerage
(647) 576 - 2100