Century 21 People’s Choice Realty Inc., Brokerage
120 MATHESON BLVD E #103
MISSISSAUGA, Ontario
L4Z 1X1
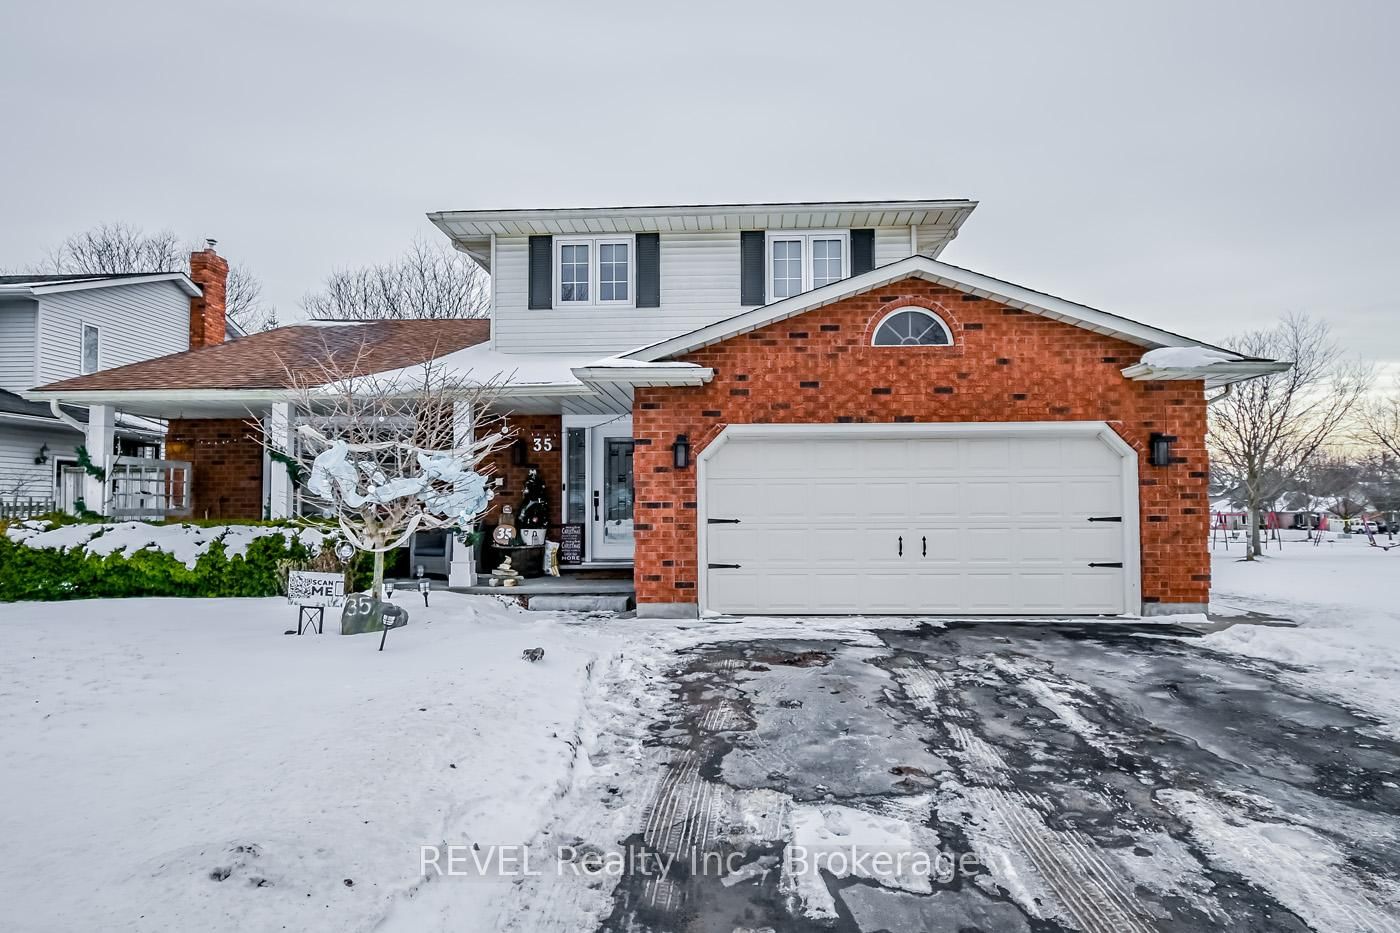
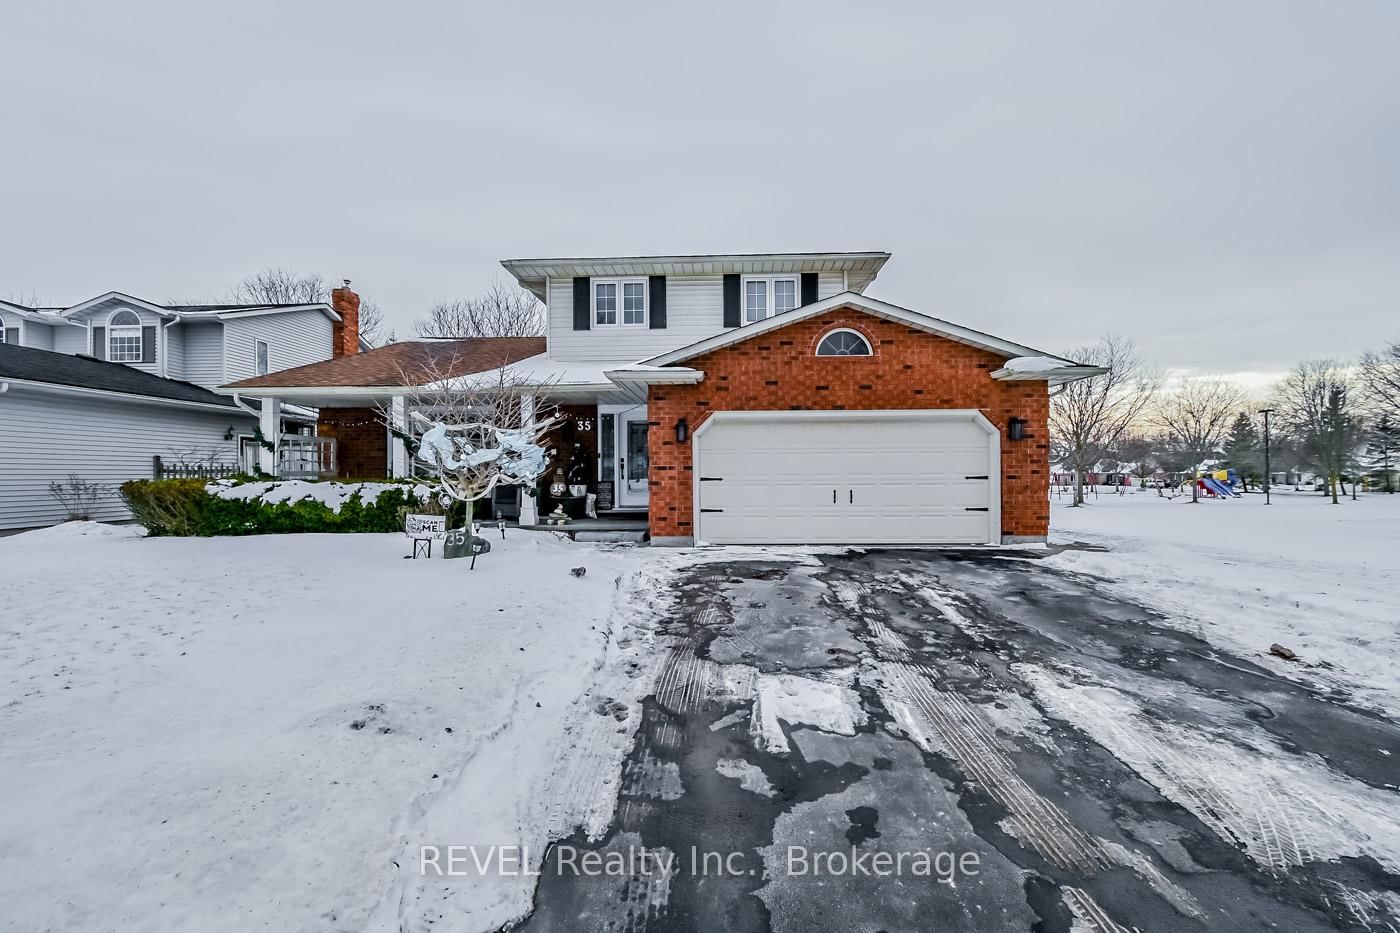
Welland, N. Welland, L3C 6Z2
$899,900$000000
Listed by REVEL Realty Inc., Brokerage.
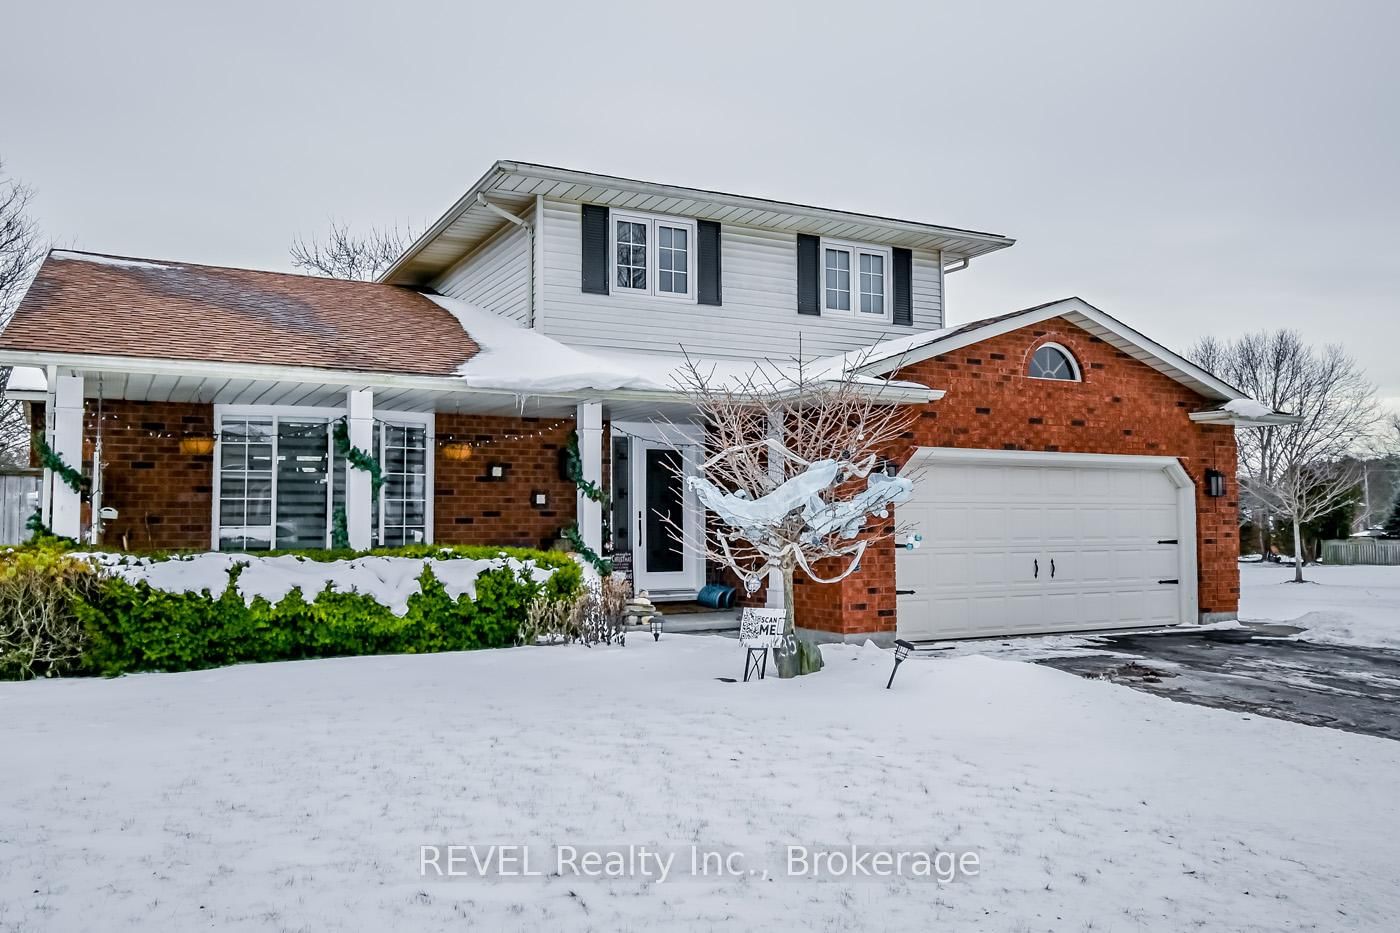
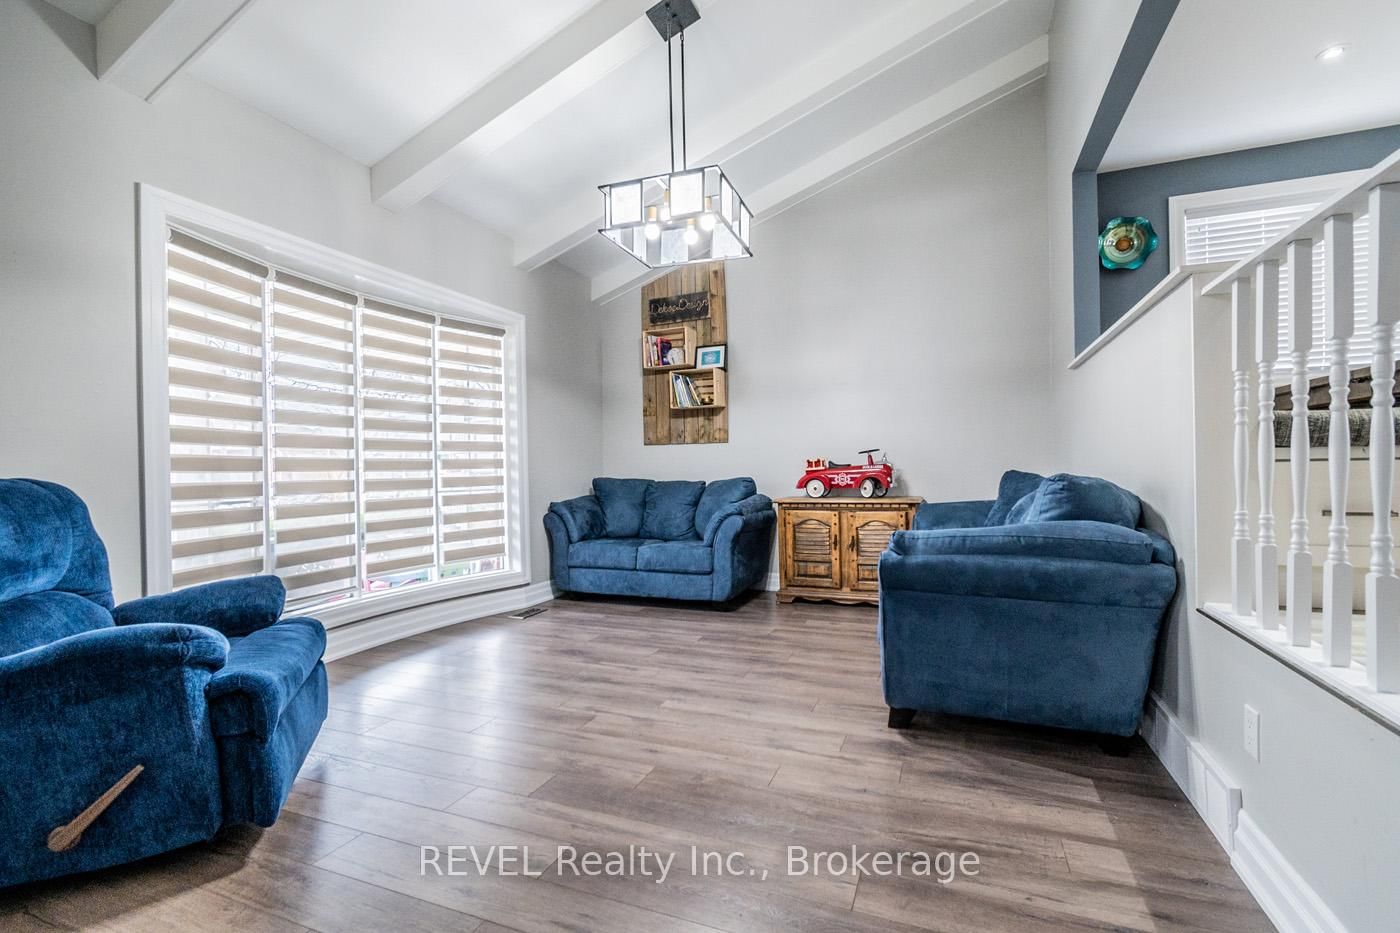
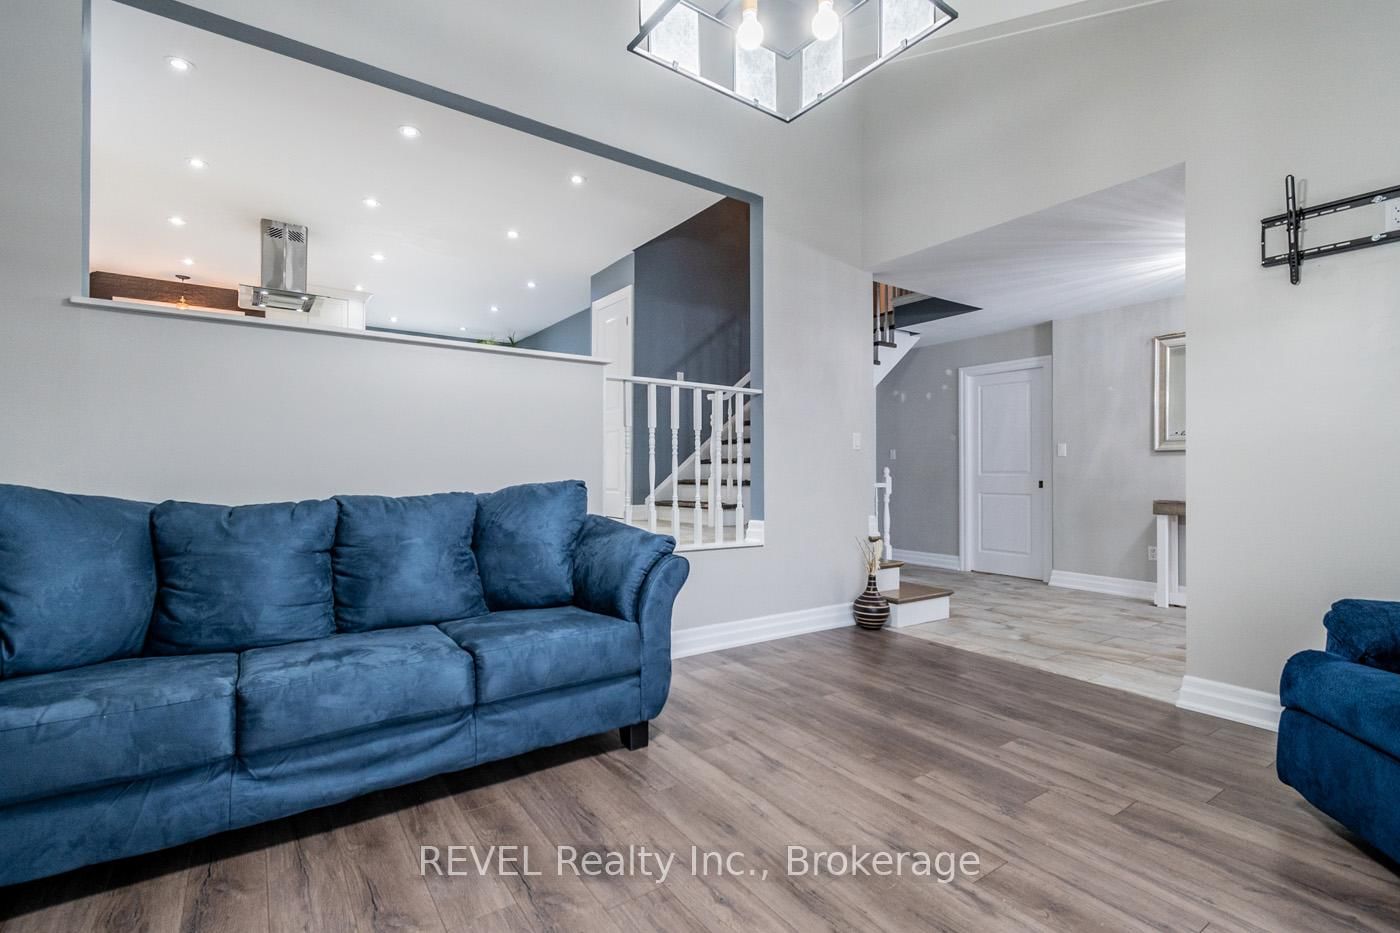
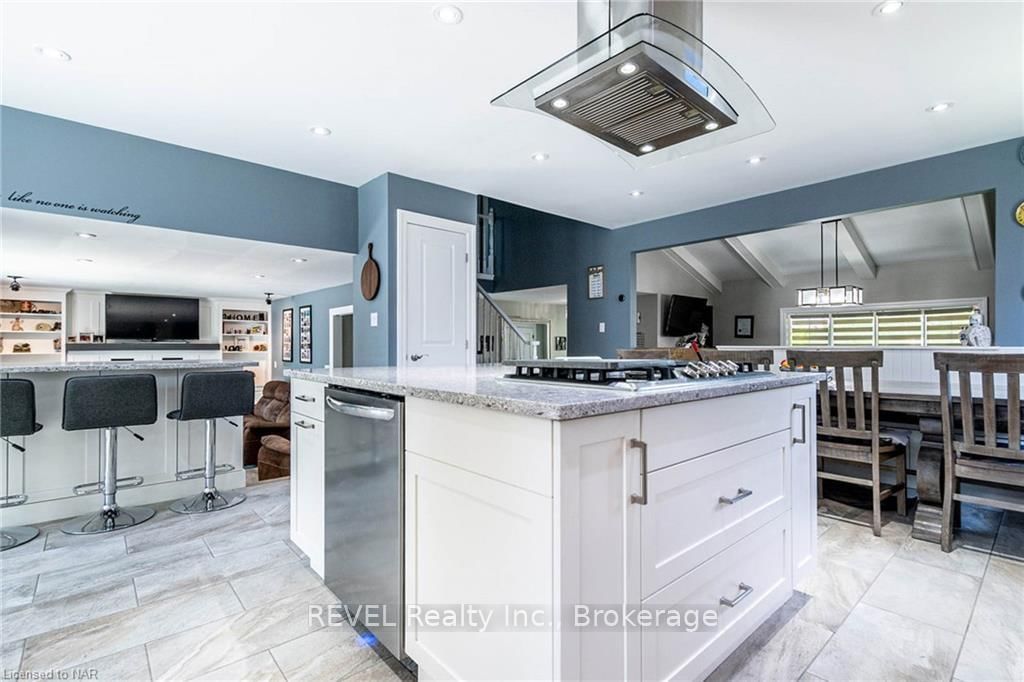
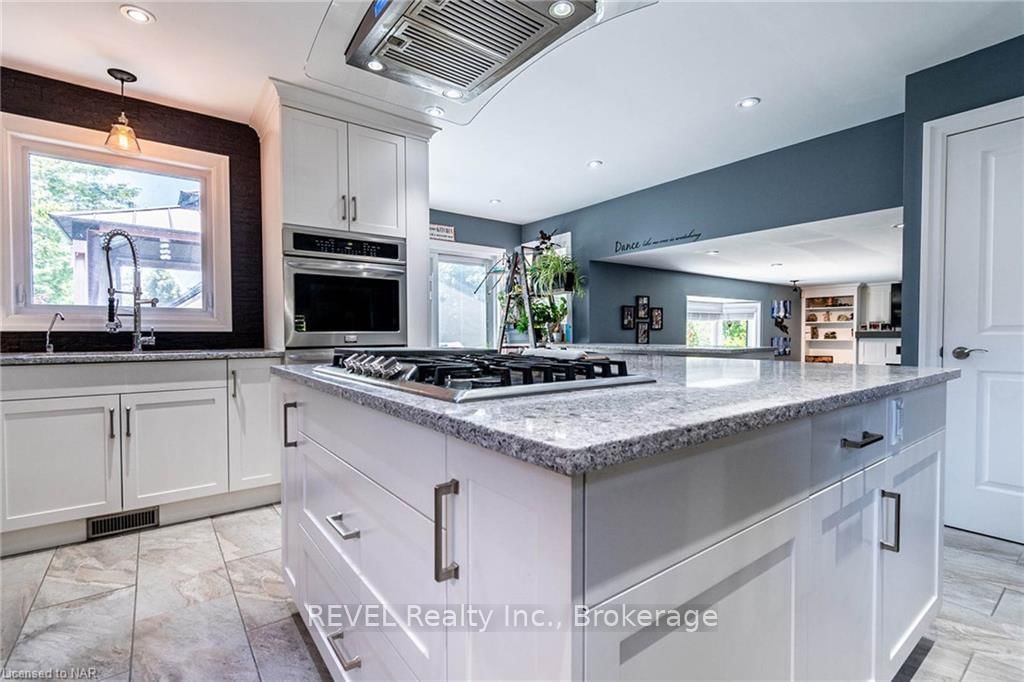
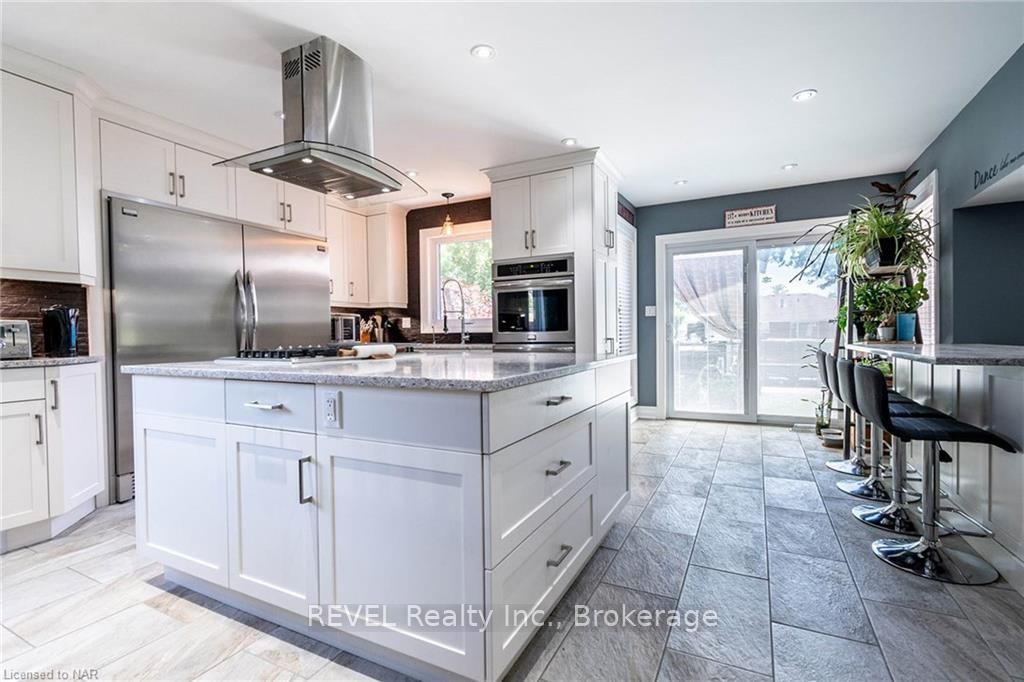
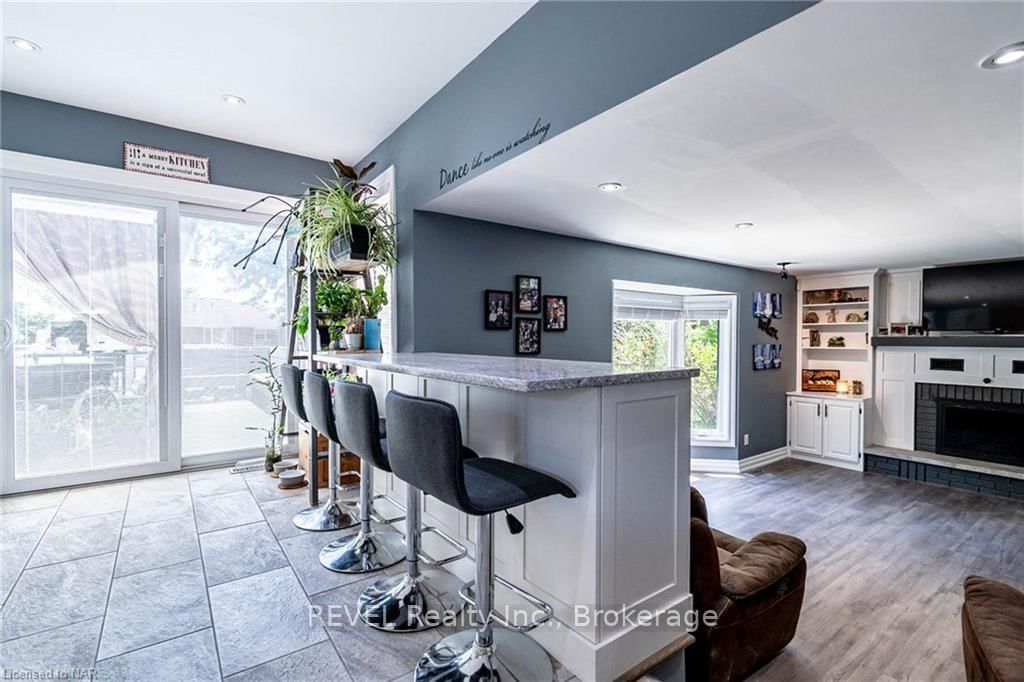
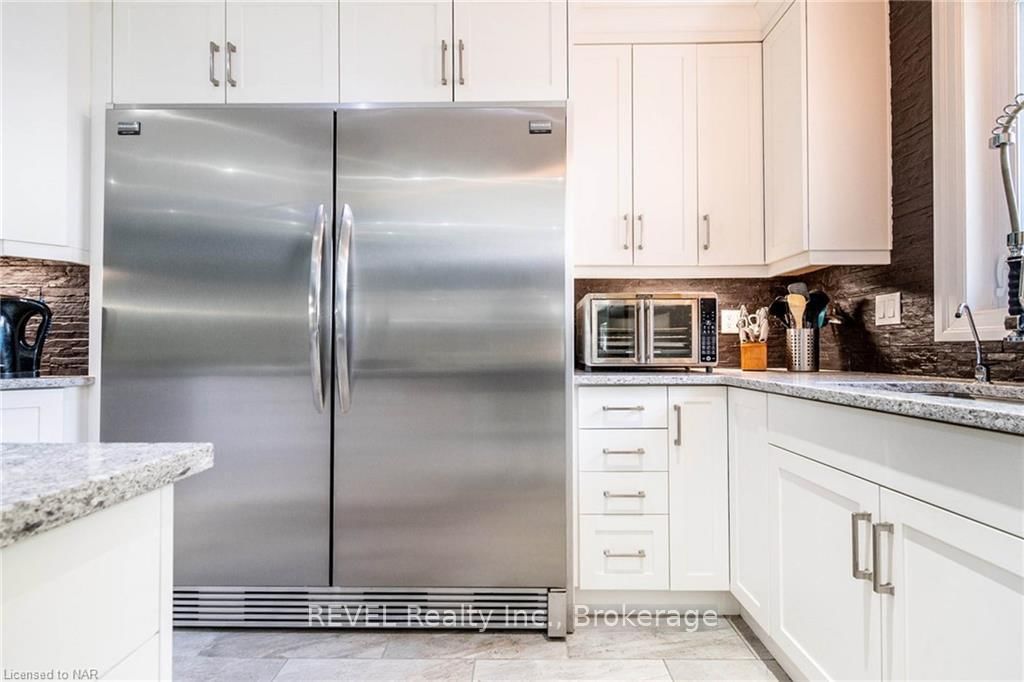
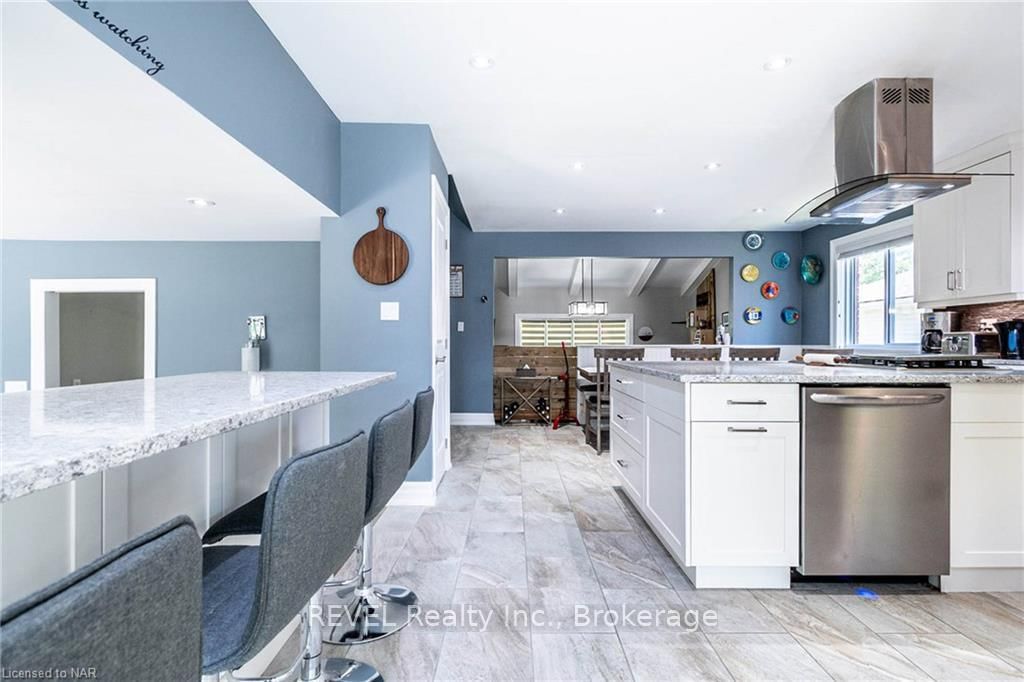
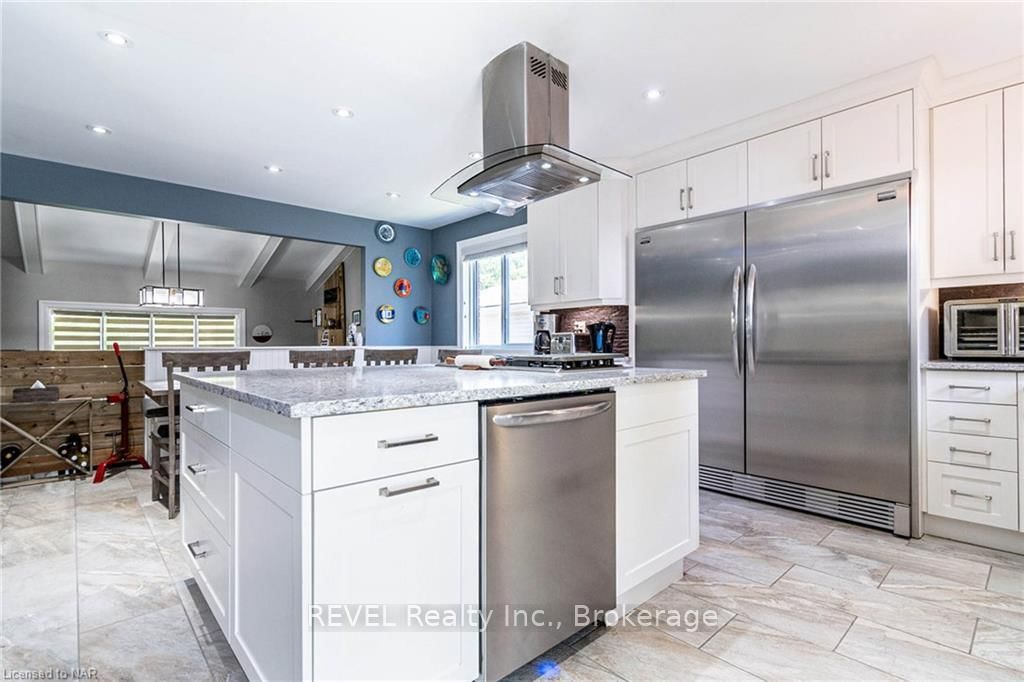
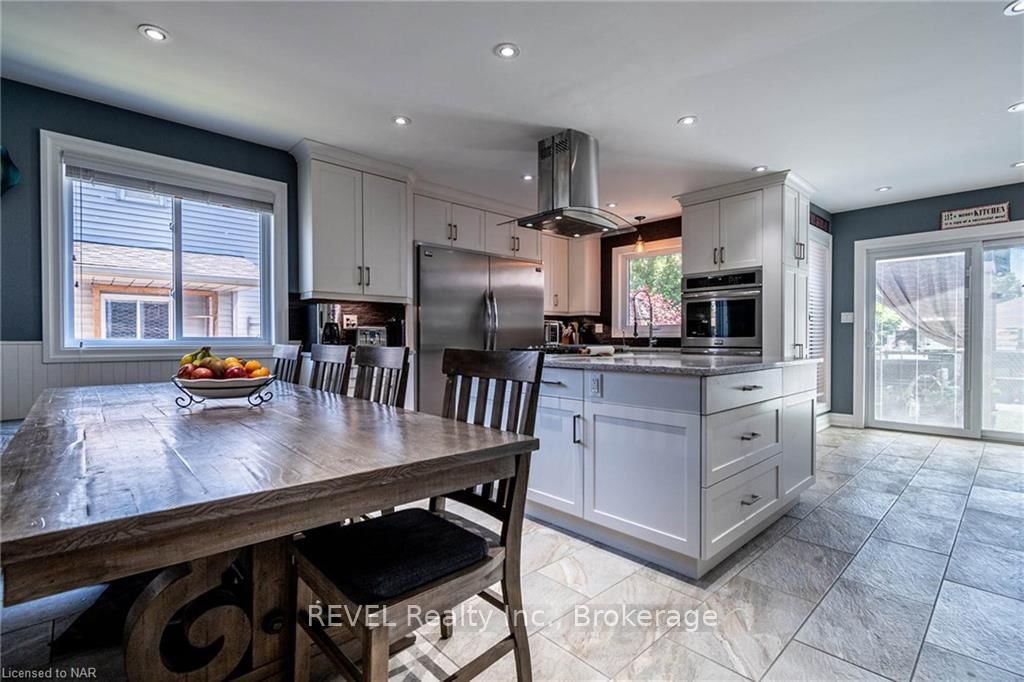
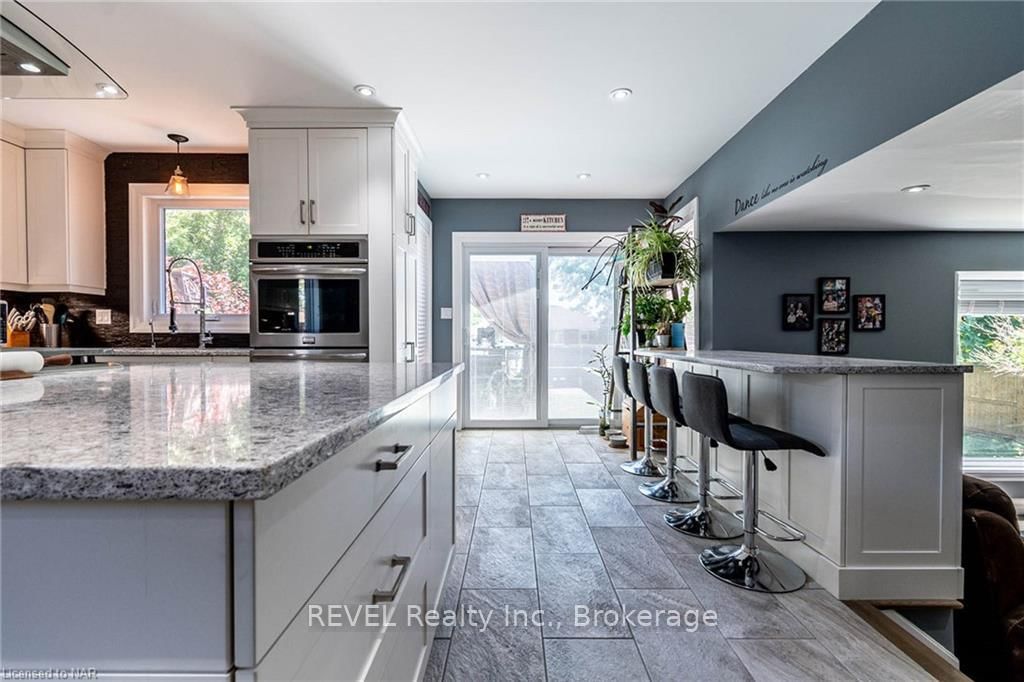
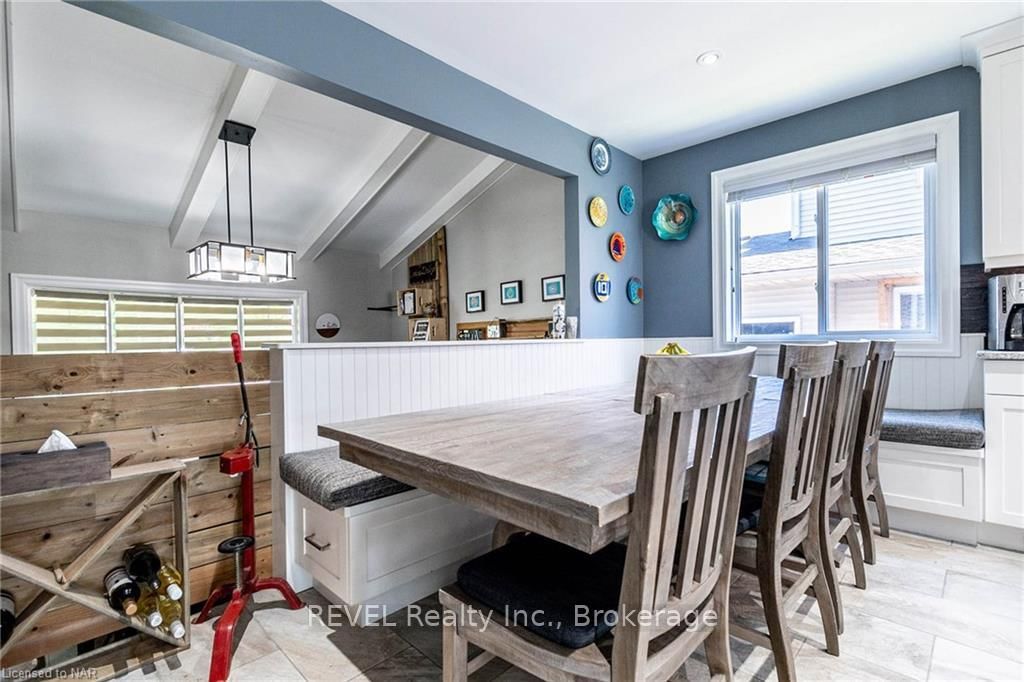
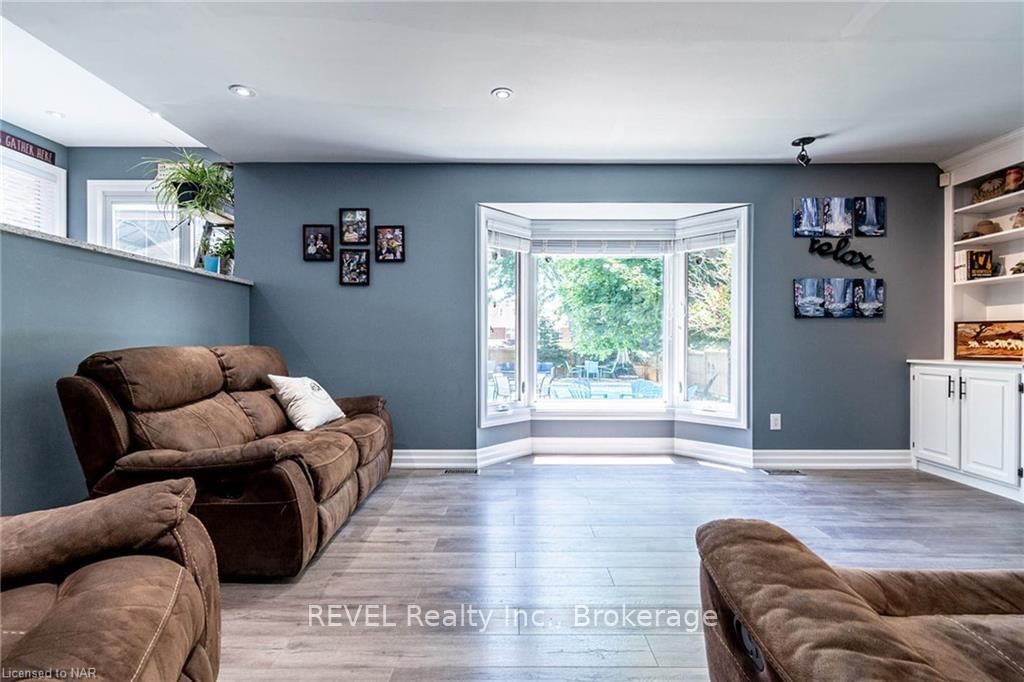
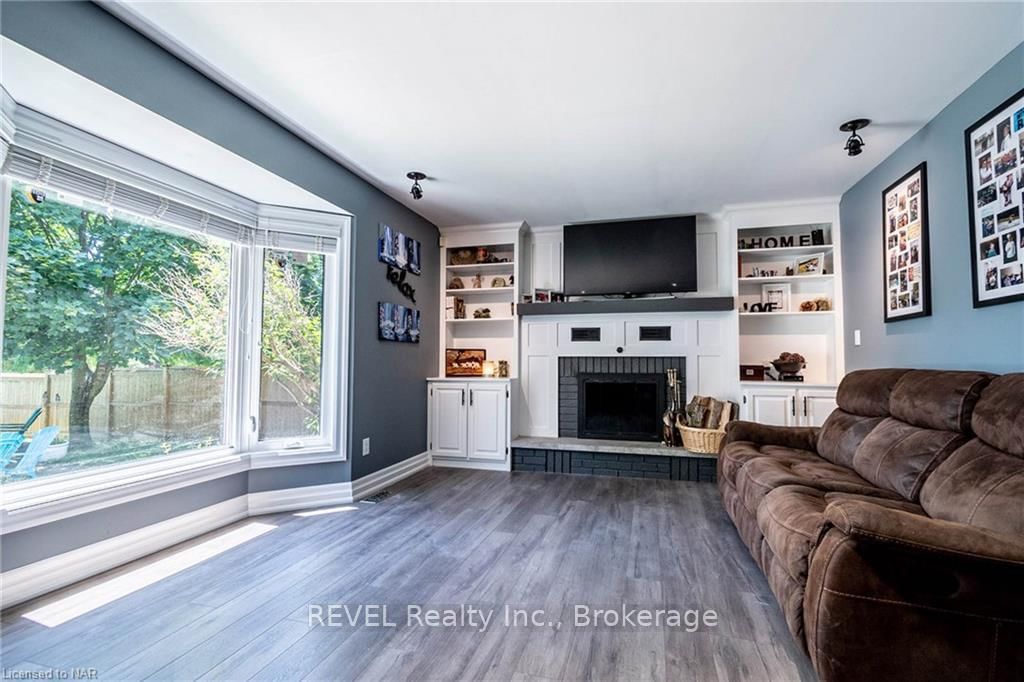
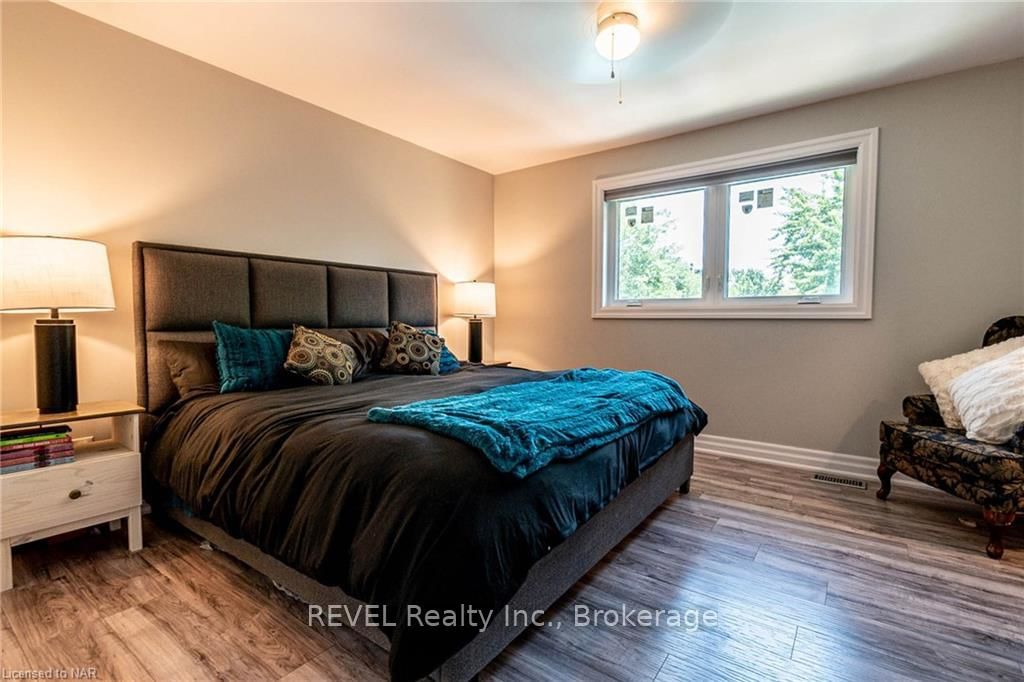
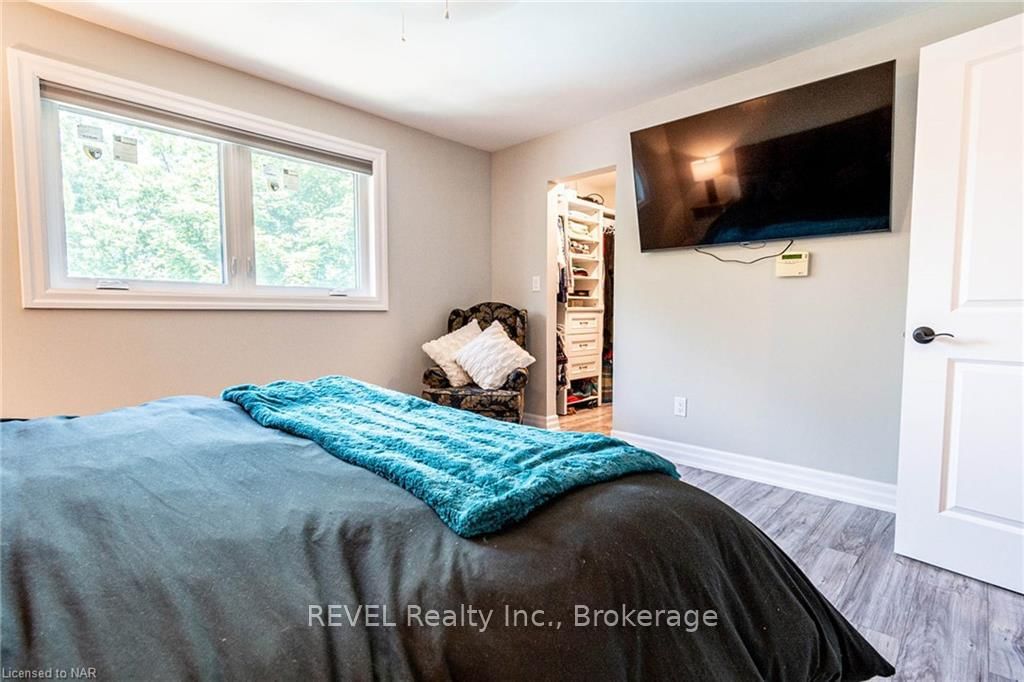
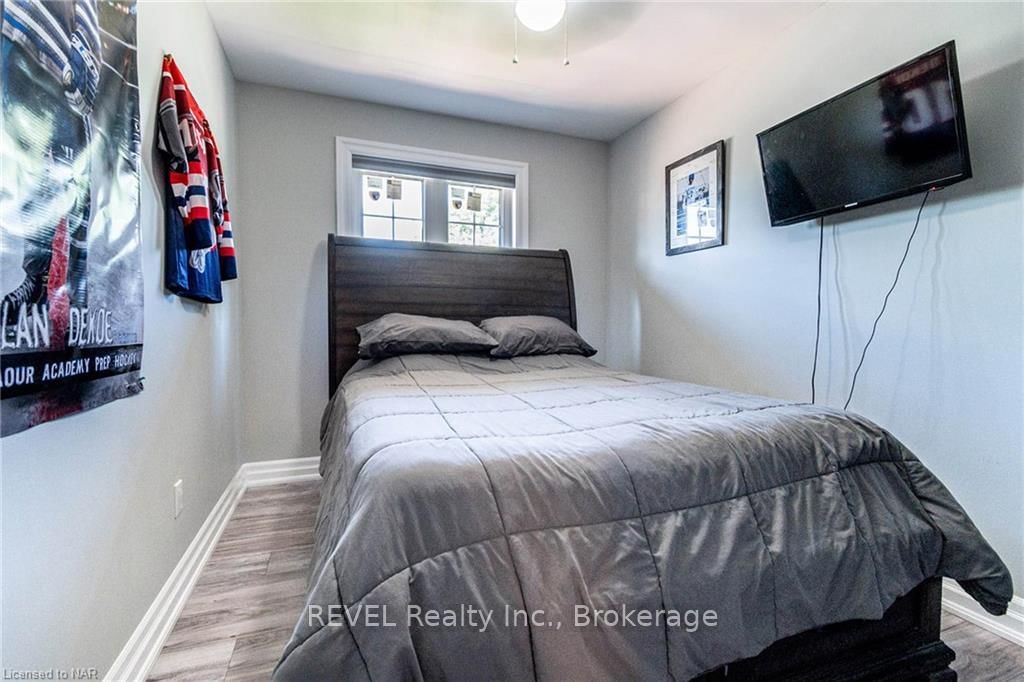
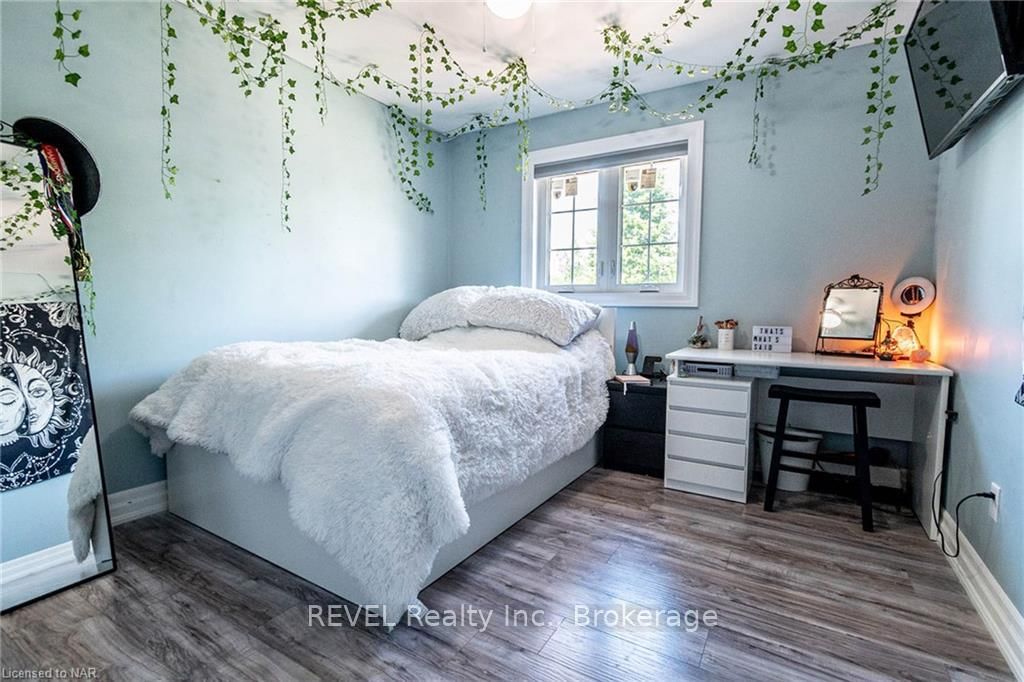
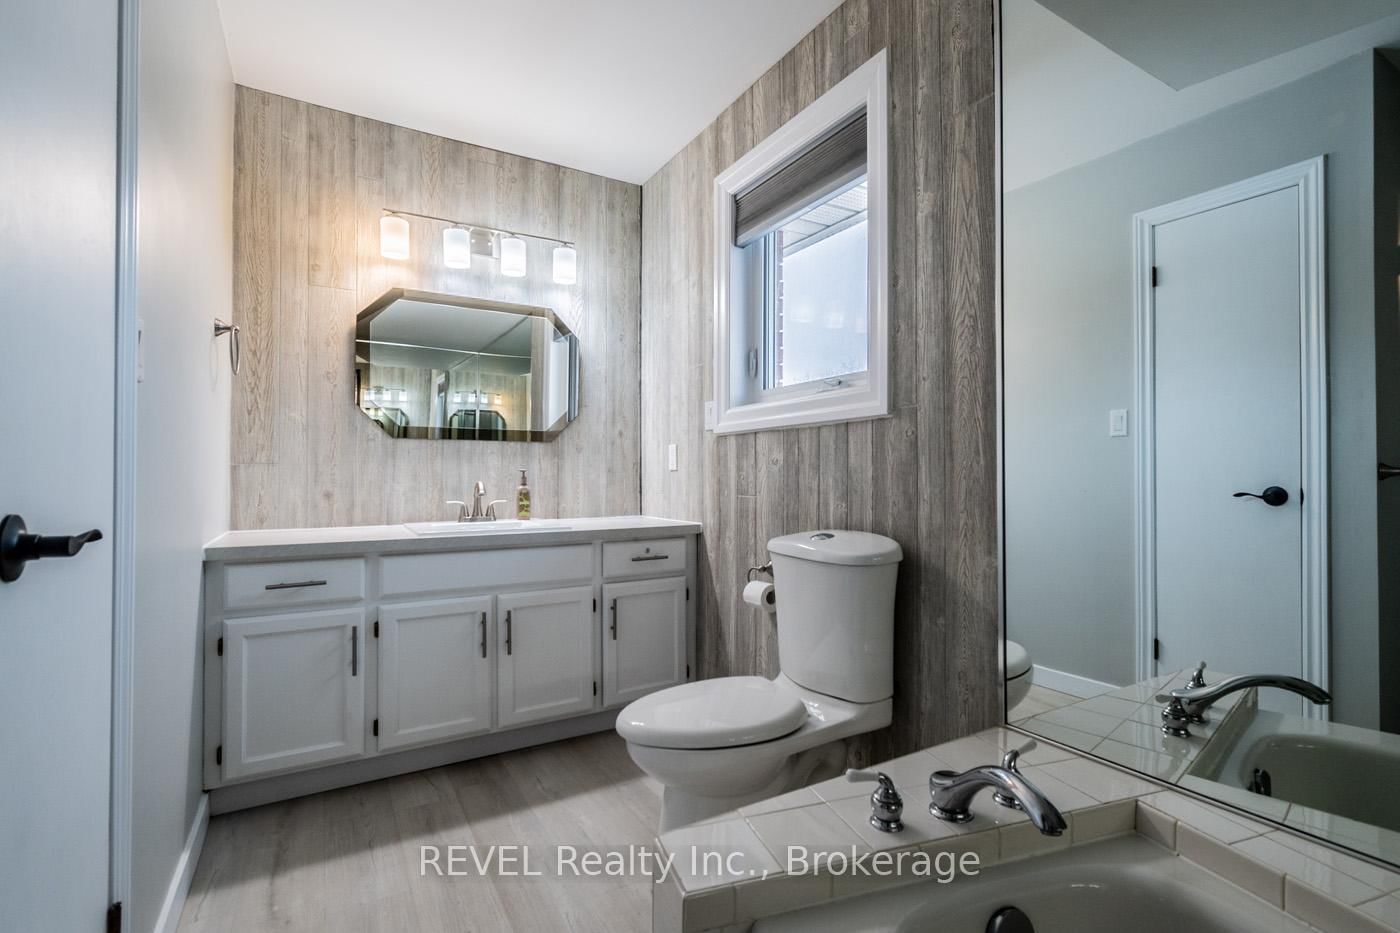
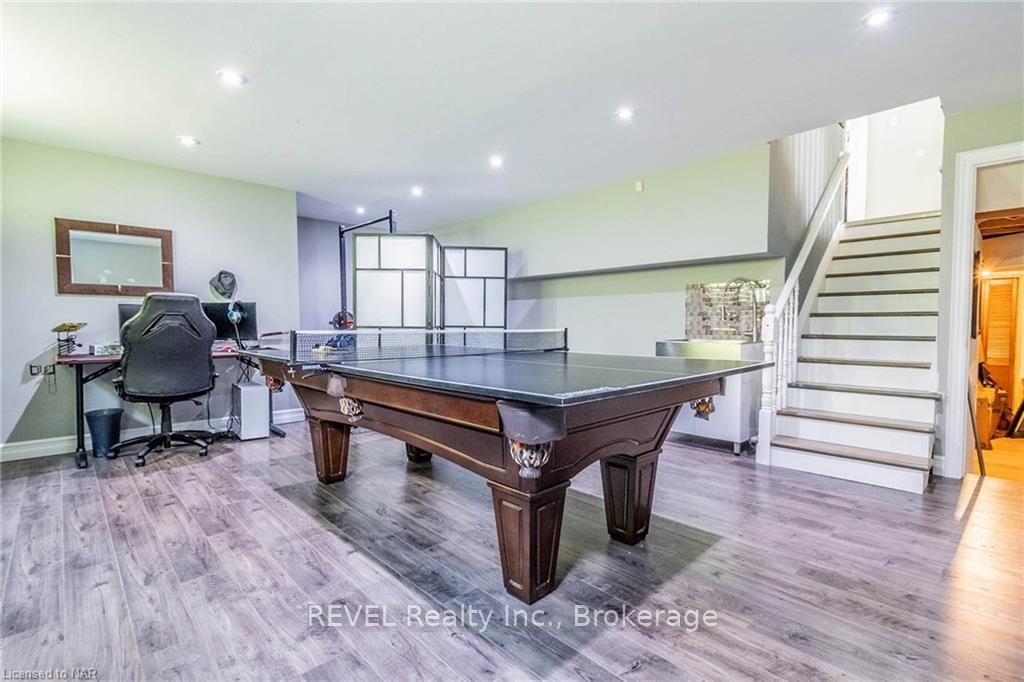
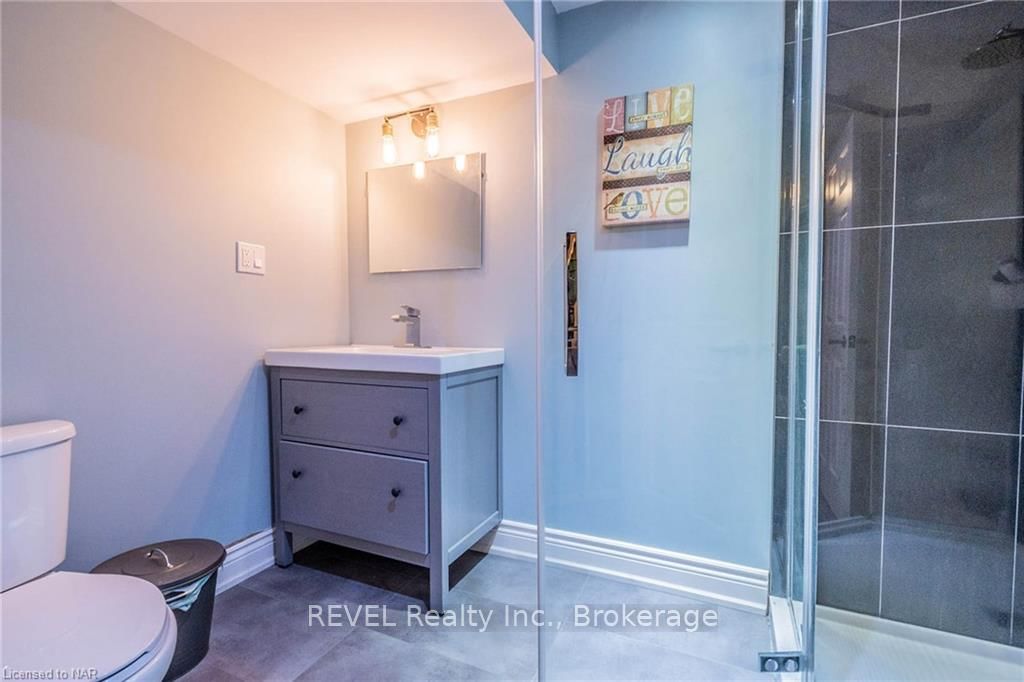
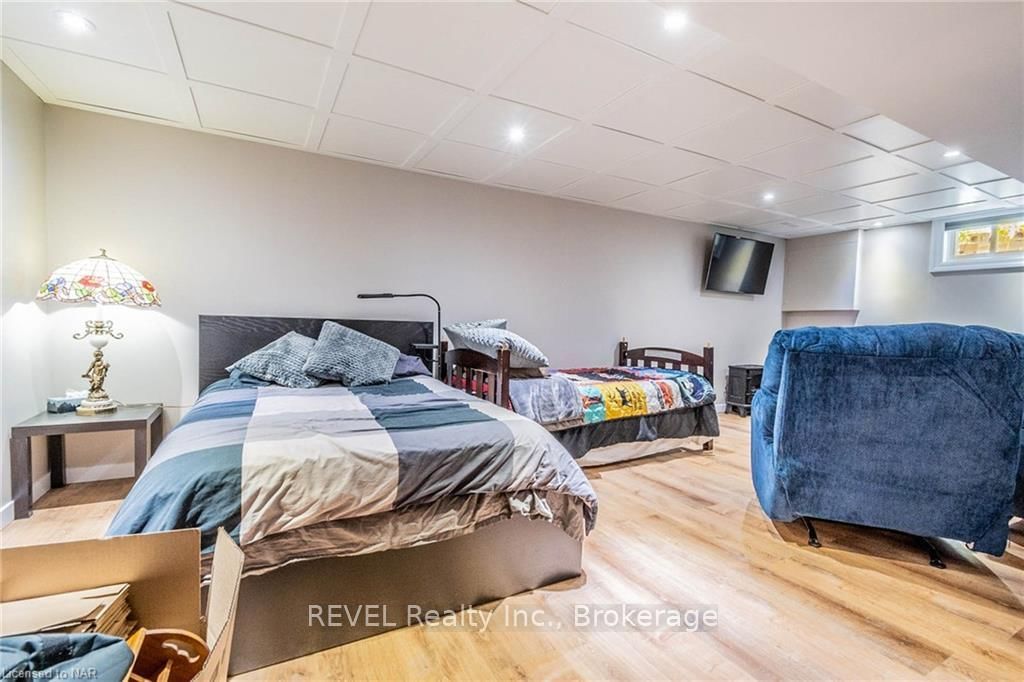
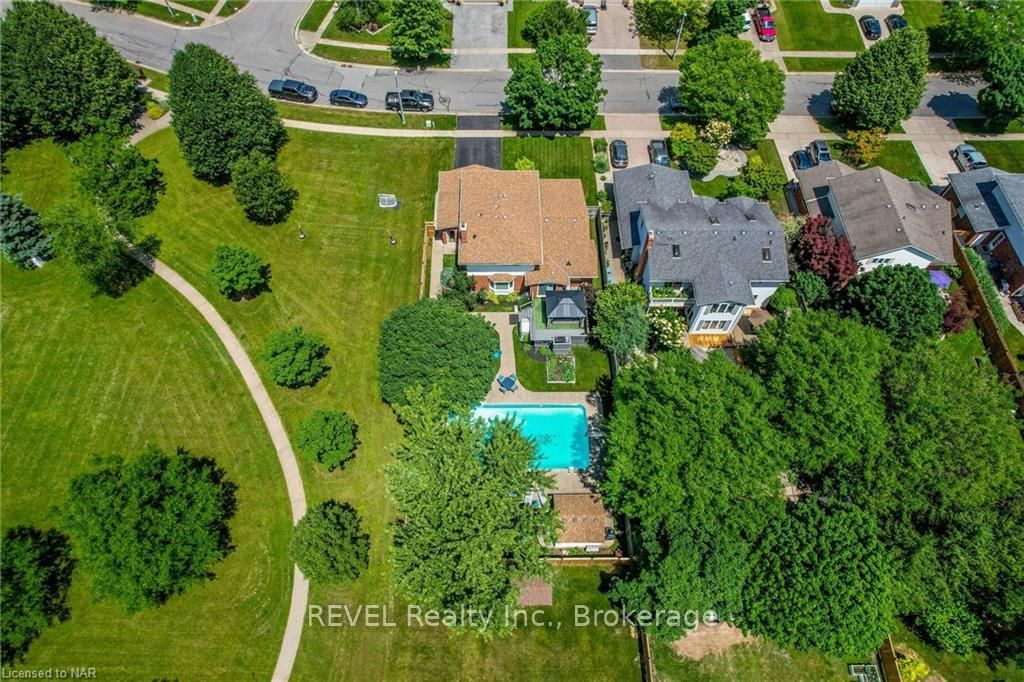
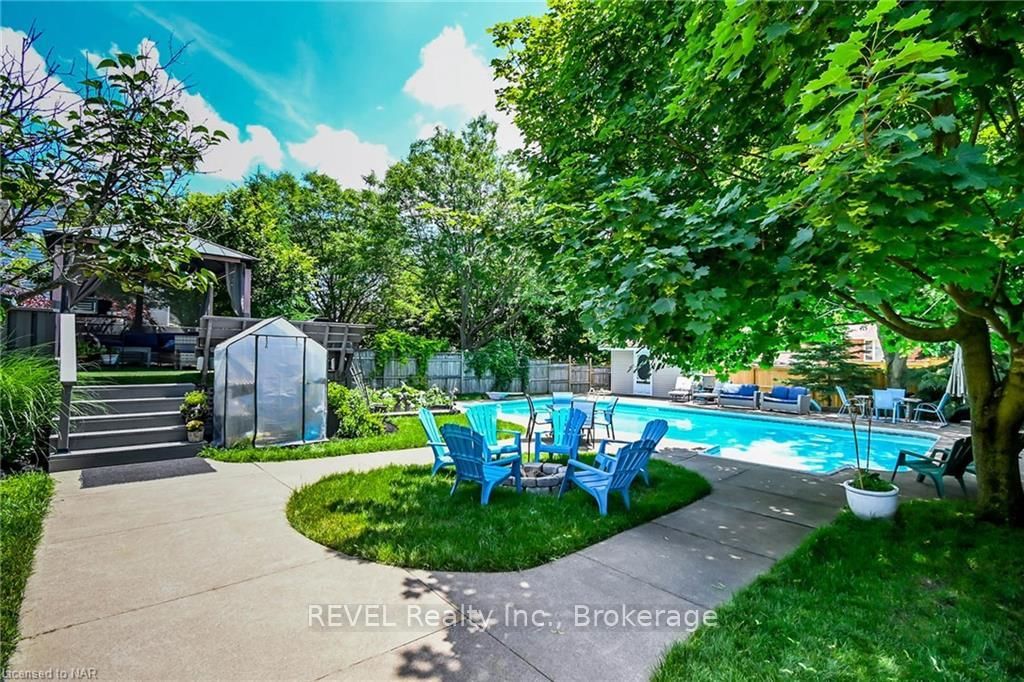
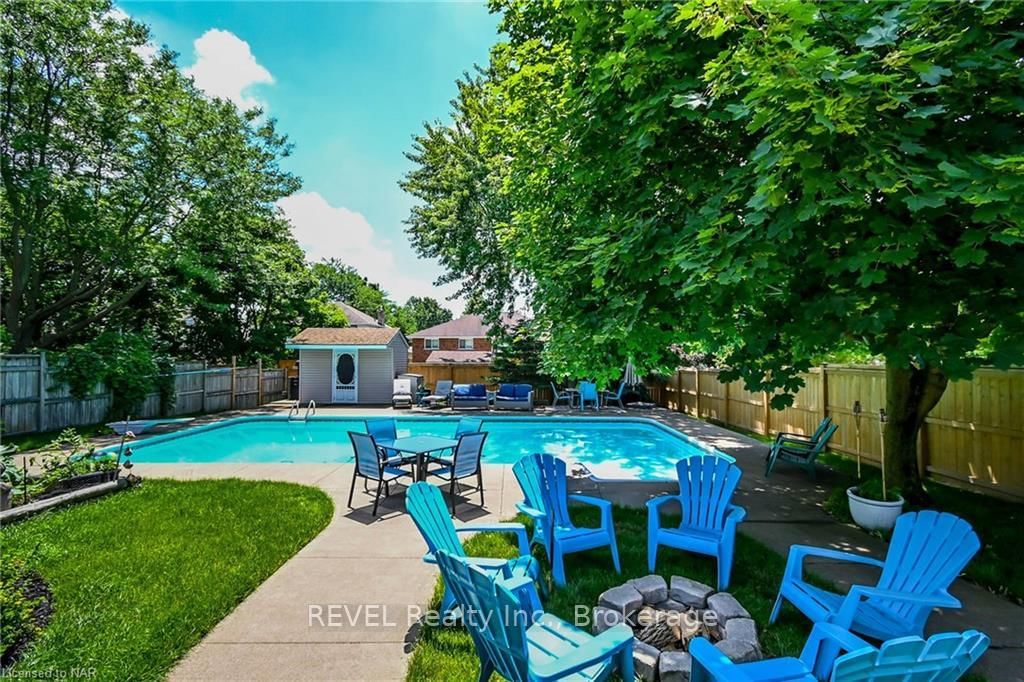
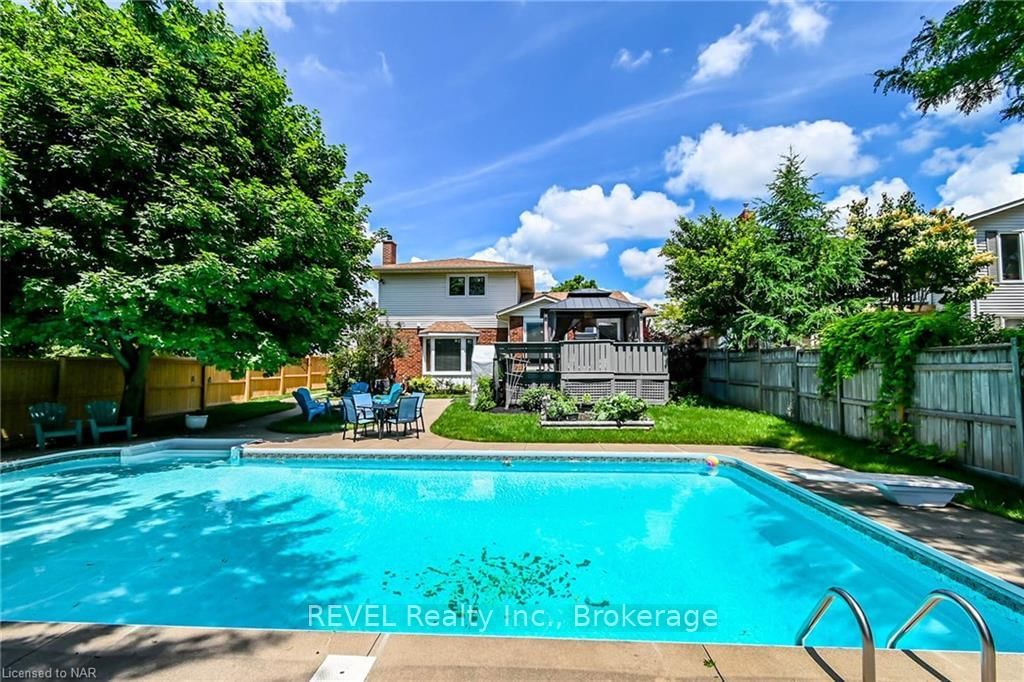
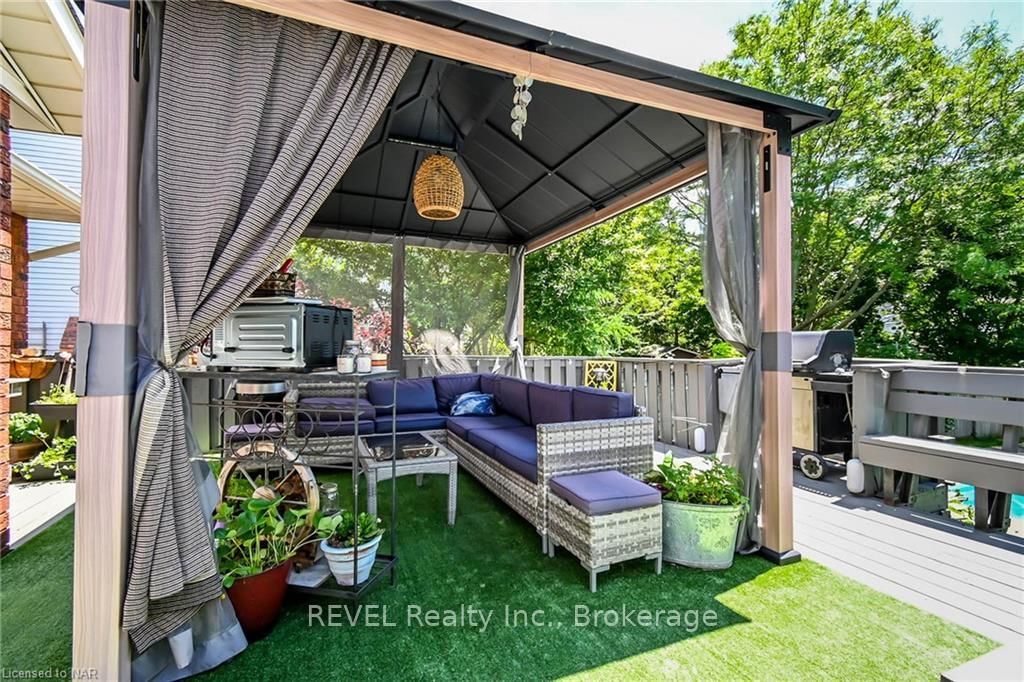
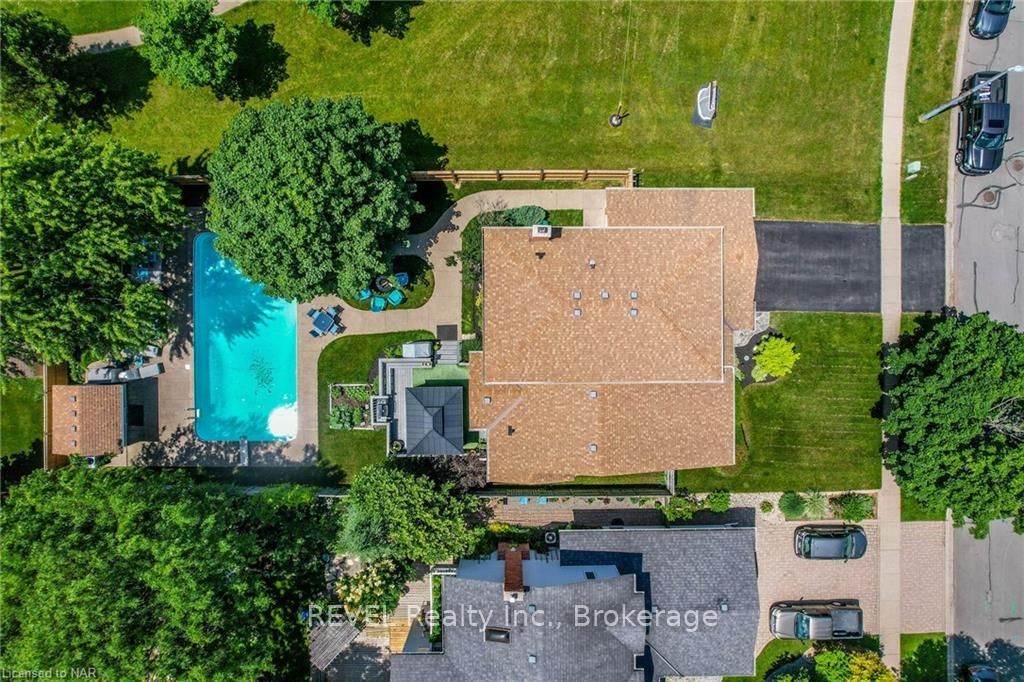
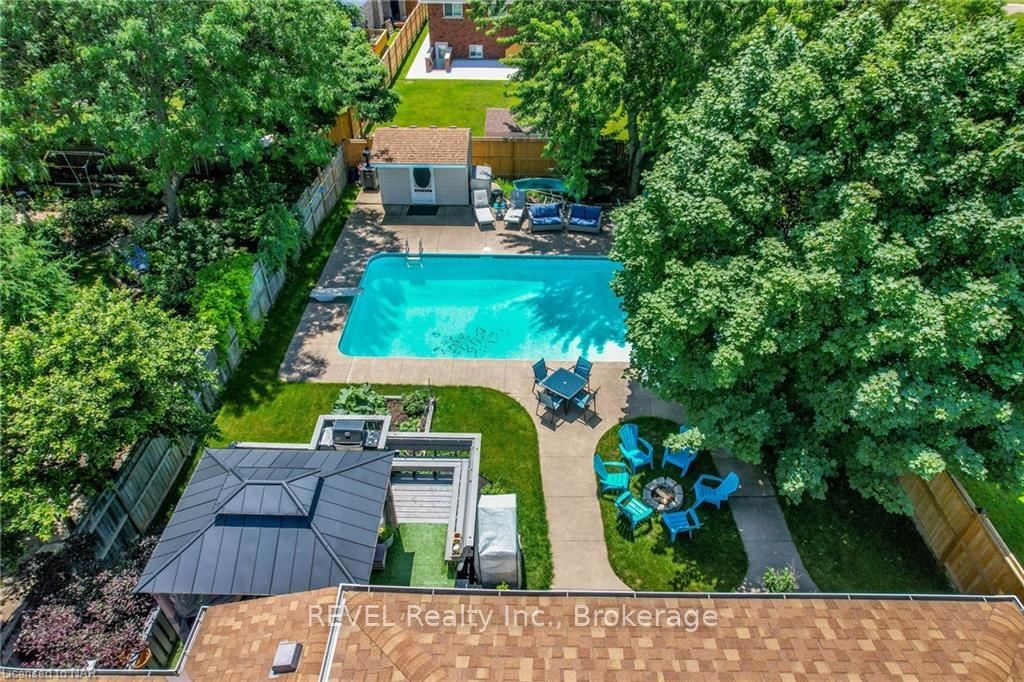
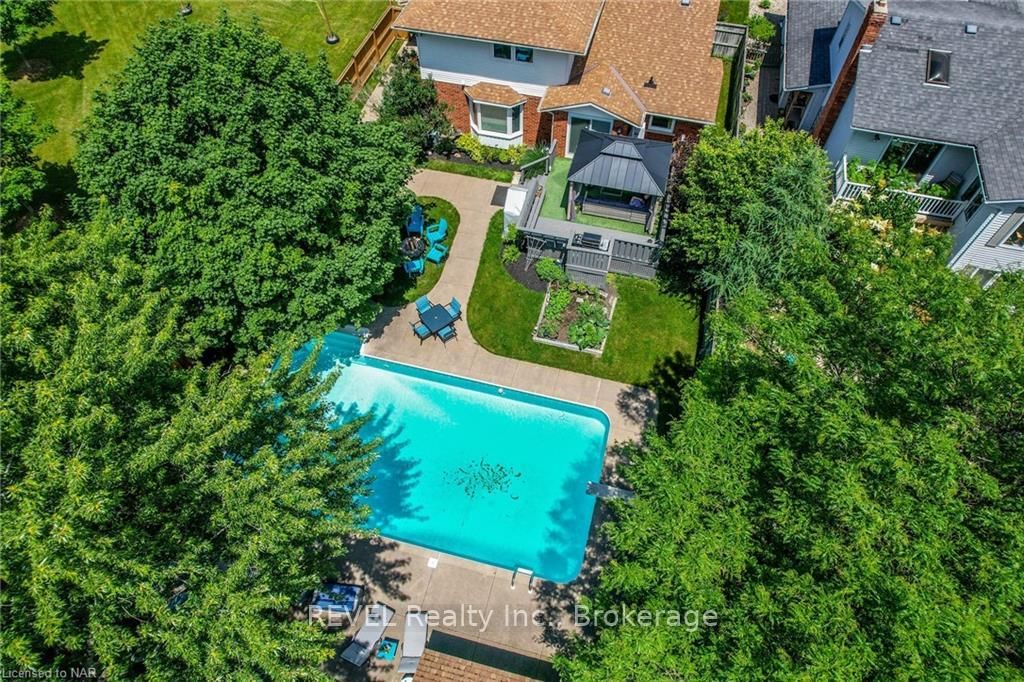
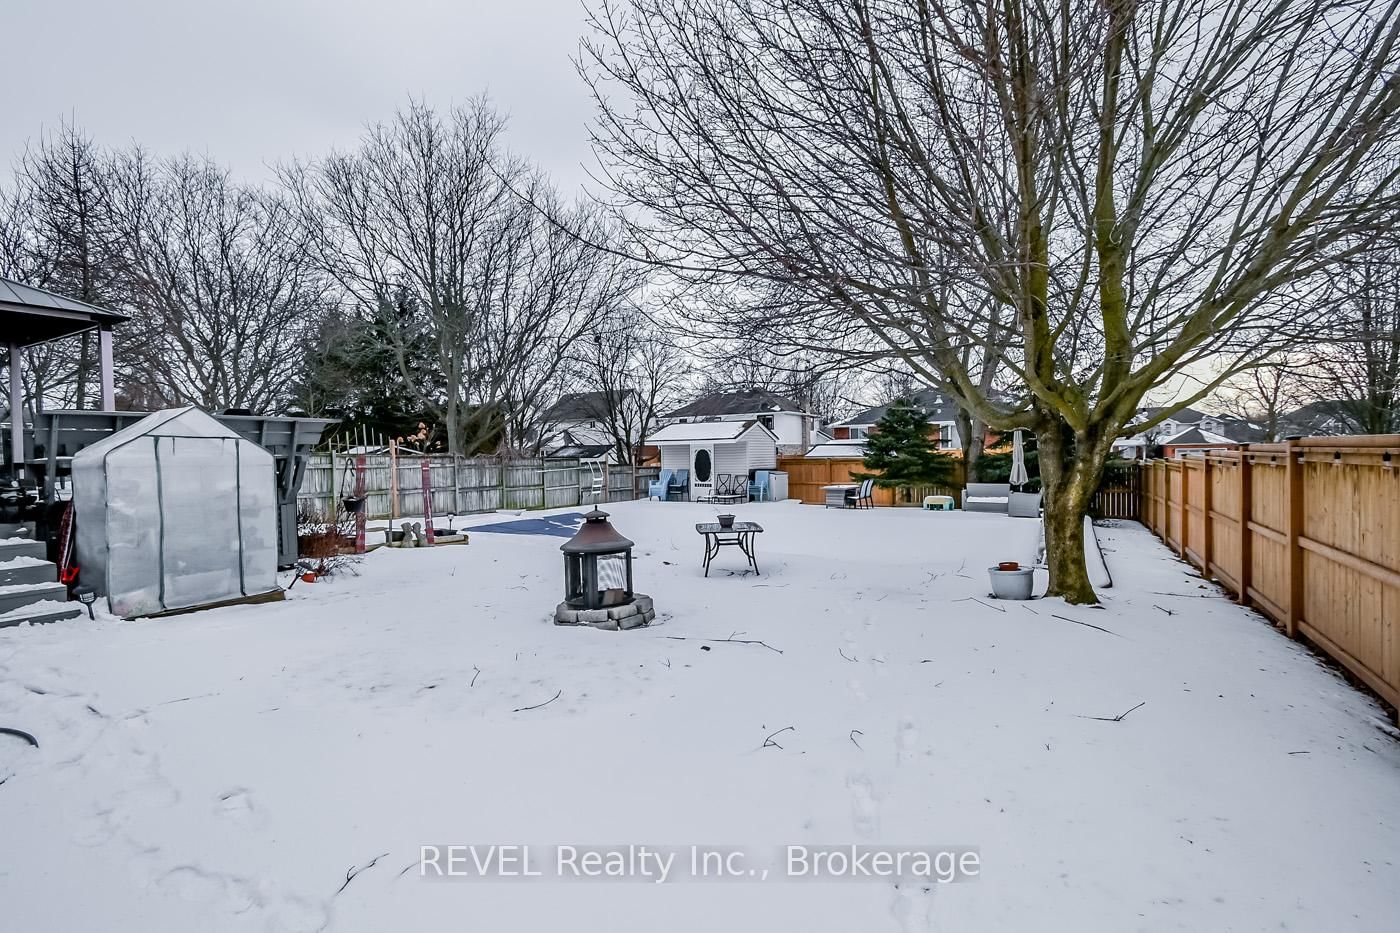
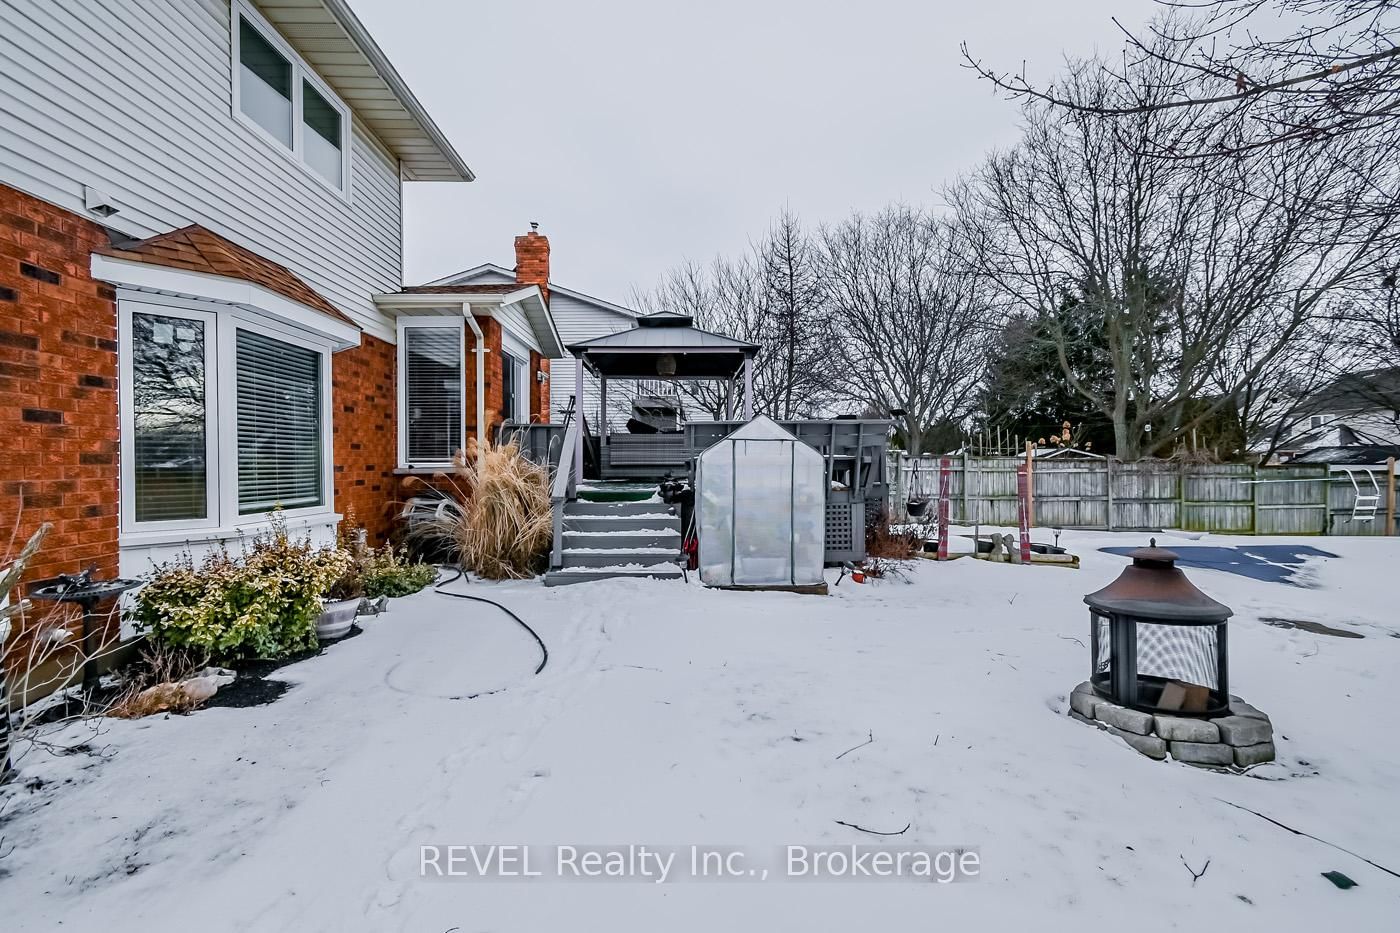
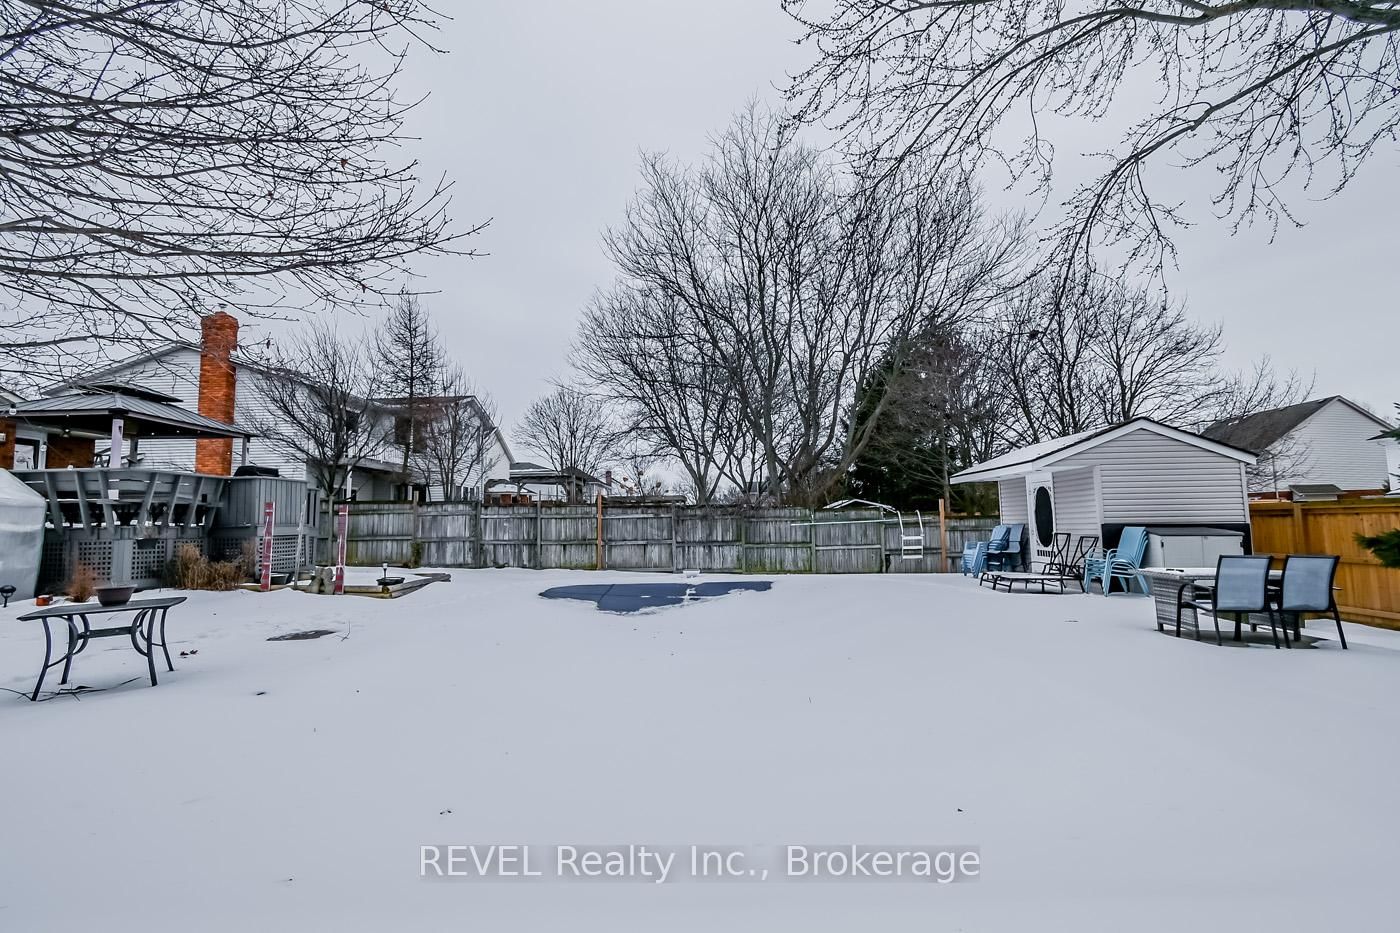
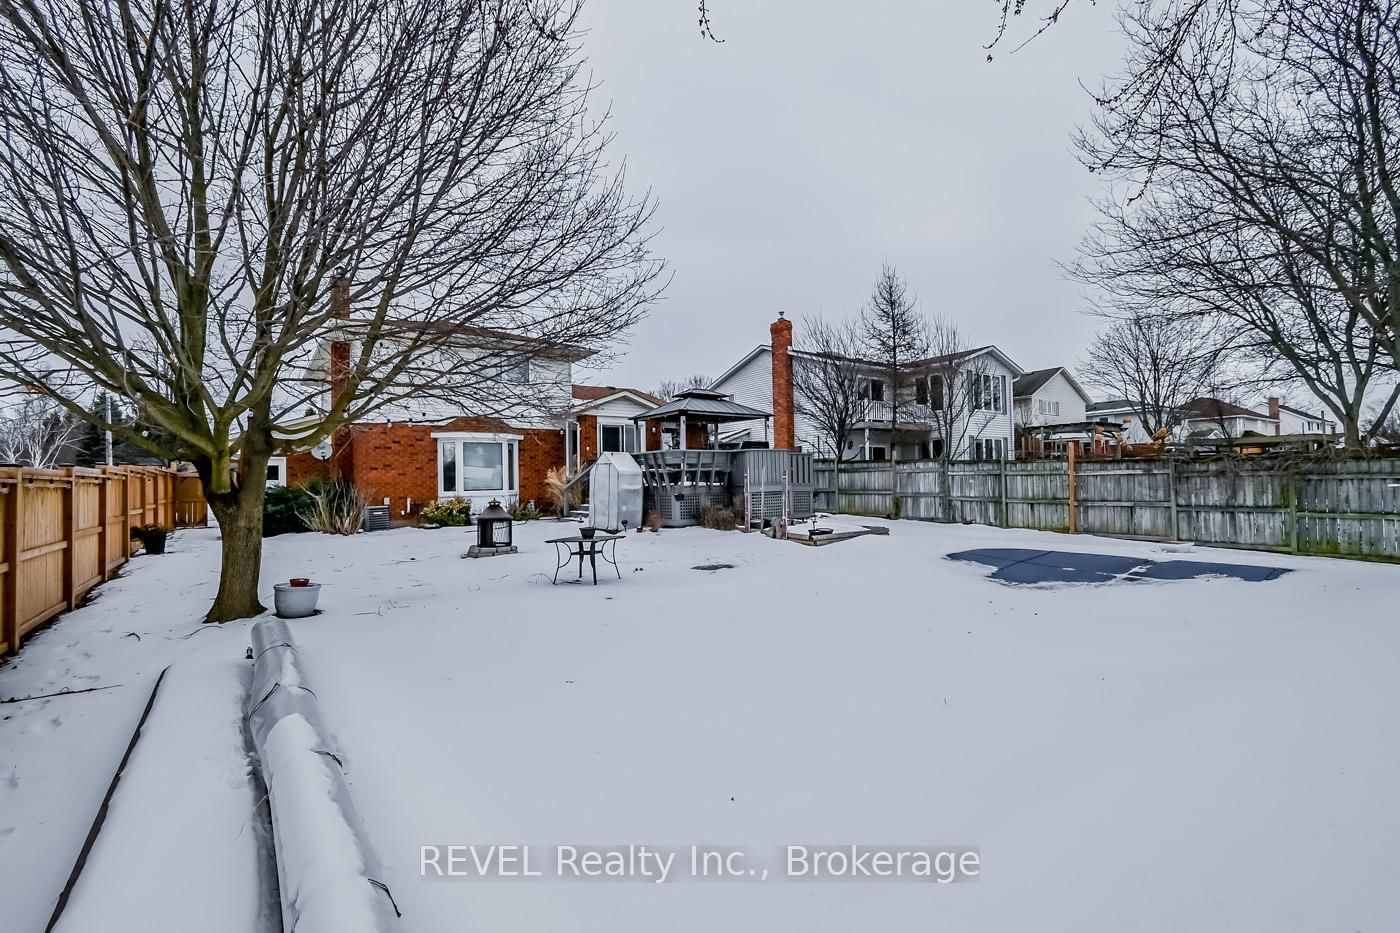
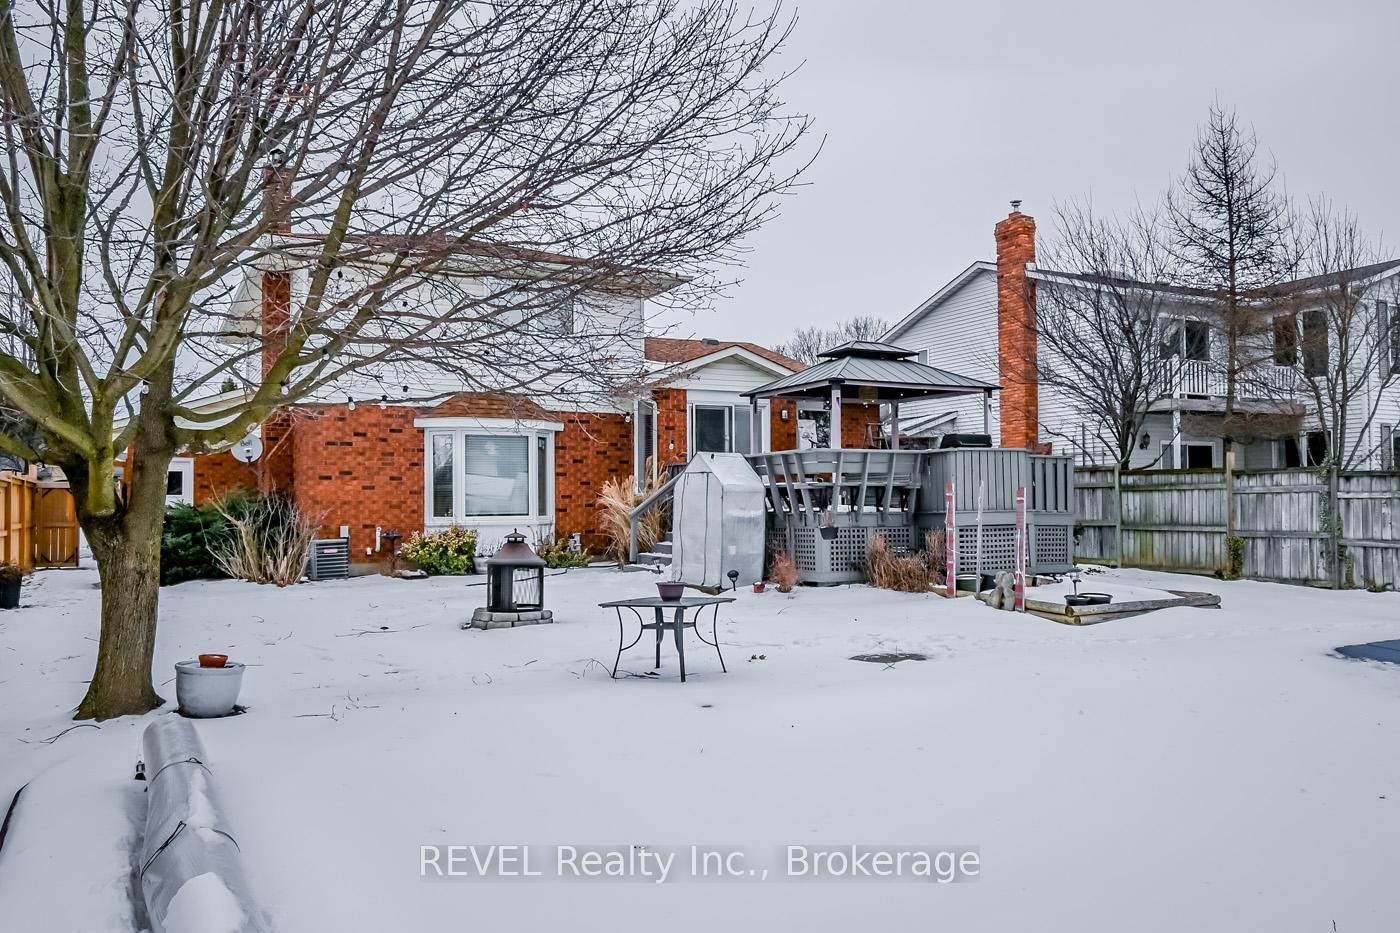
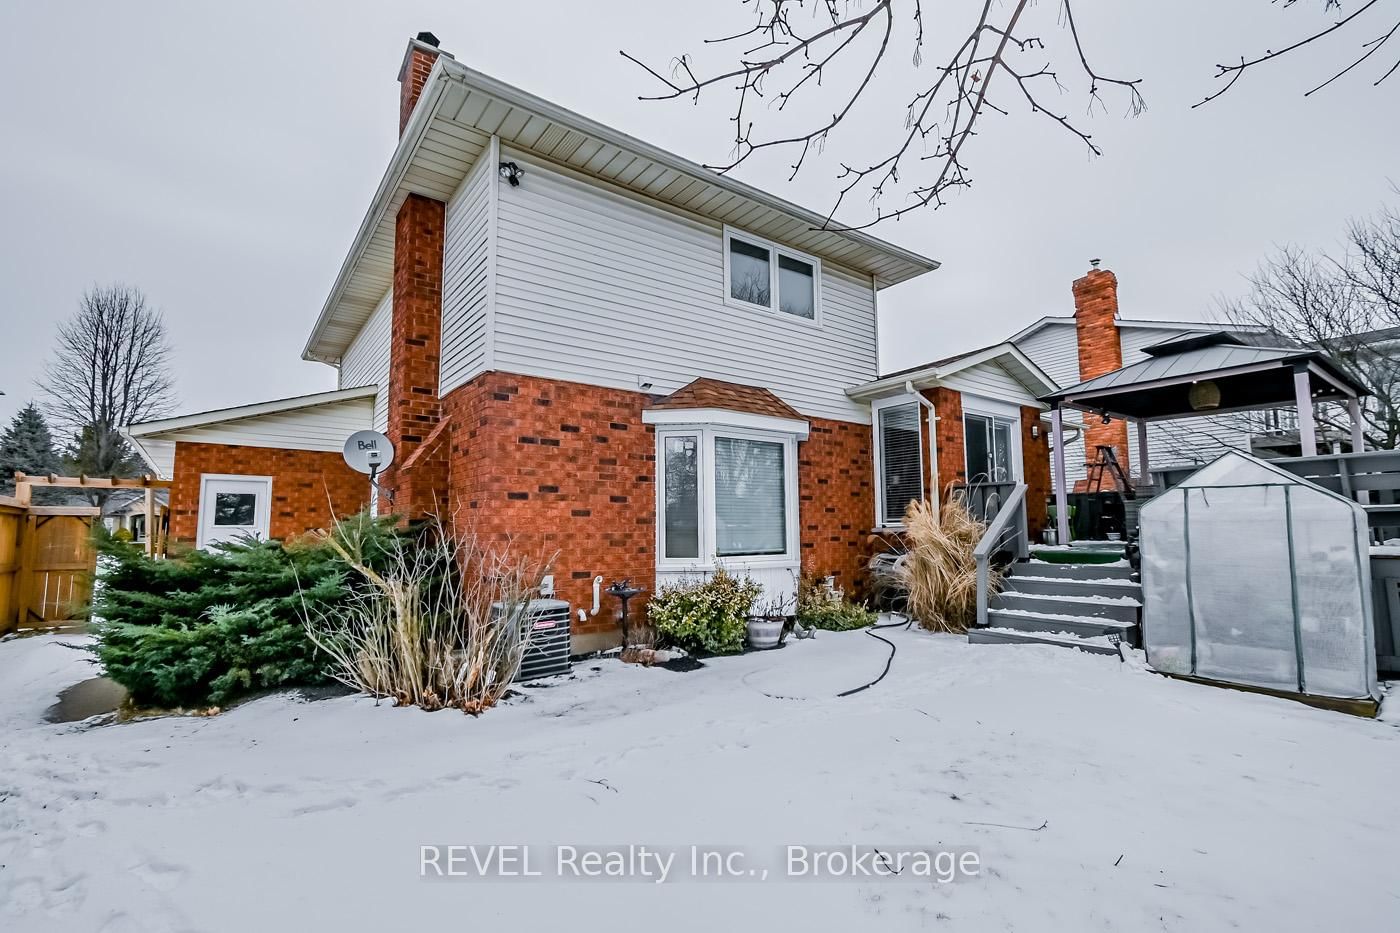
This beautifully remodeled home boasts high-end finishes, including laminate flooring throughout (no carpet), custom trim and doors, and a custom kitchen large enough to host a 12-foot dining table. The kitchen also features a 6'x6' island and a double wall oven, industrial sized double unit fridge/freezer and offers a large beautiful space for family gatherings. The main floor includes the kitchen, den, a cozy room with a natural wood fireplace, a 2-piece bathroom, and a laundry room with plenty of storage. Upstairs, you'll find 3 bedrooms, including a spacious master with a walk-in closet, plus a 4-piece bathroom.The basement offers additional space, starting with a pool table/rec room, an exercise area, and room for family fun. A lower level provides room for an in-law suite set up or a 4th bedroom with an updated 3-piece bathroom. Custom built in 1987, this home has only had two owners. Step out from the kitchen to your private backyard oasis, featuring a 20x40 inground pool (9 feet deep), a beautiful change room/pool house, and recent updates to the pool pump, sand filter, and heater (2022). The backyard is surrounded by mature trees, perfect for relaxing or enjoying a picnic under the shade of a gorgeous maple. A new 6.5' fence, also installed in 2022, offers added privacy.The 2-car garage includes a central vacuum outlet, and there are plug-ins throughout the home for added convenience. Located just 5 minutes from Fonthill, 15 minutes from Welland, and 22 minutes from Port Colborne, with easy access to St. Catharines, Niagara Falls, and Toronto (only 1hr 11mins away). Updates include HWT (2024), furnace (2010), windows (2022), new doors (2022), and a fully renovated basement and kitchen (2020). This home is a must see. Shows beautifully with too many updates to list!
Dishwasher, Dryer, Other, Pool Equipment, Refrigerator, Stove, Washer
Living
Foyer
Mudroom
Den
Kitchen
Primary
Br
Br
Br
Family
Utility
The graph below compares the average list price and average sale price of homes in this neighborhood by month for the last 24 months. When average sale price is greater than average list price, this may suggest a buyer's market. When average sale price is lower than the average list price this may suggest a seller's market.
The graph below illustrates the average days on market for homes in this neighborhood. The yellow area may indicate a buyer's market, the green area may indicate a balanced market and the red area may indicate a seller's market.
Sales Representative, Century 21 People’s Choice Realty Inc., Brokerage
(647) 576 - 2100