Century 21 People’s Choice Realty Inc., Brokerage
120 MATHESON BLVD E #103
MISSISSAUGA, Ontario
L4Z 1X1
Toronto, Willowdale East, M2N 6W2
$1,799,000$000000
Listed by LANDPOWER REAL ESTATE LTD..
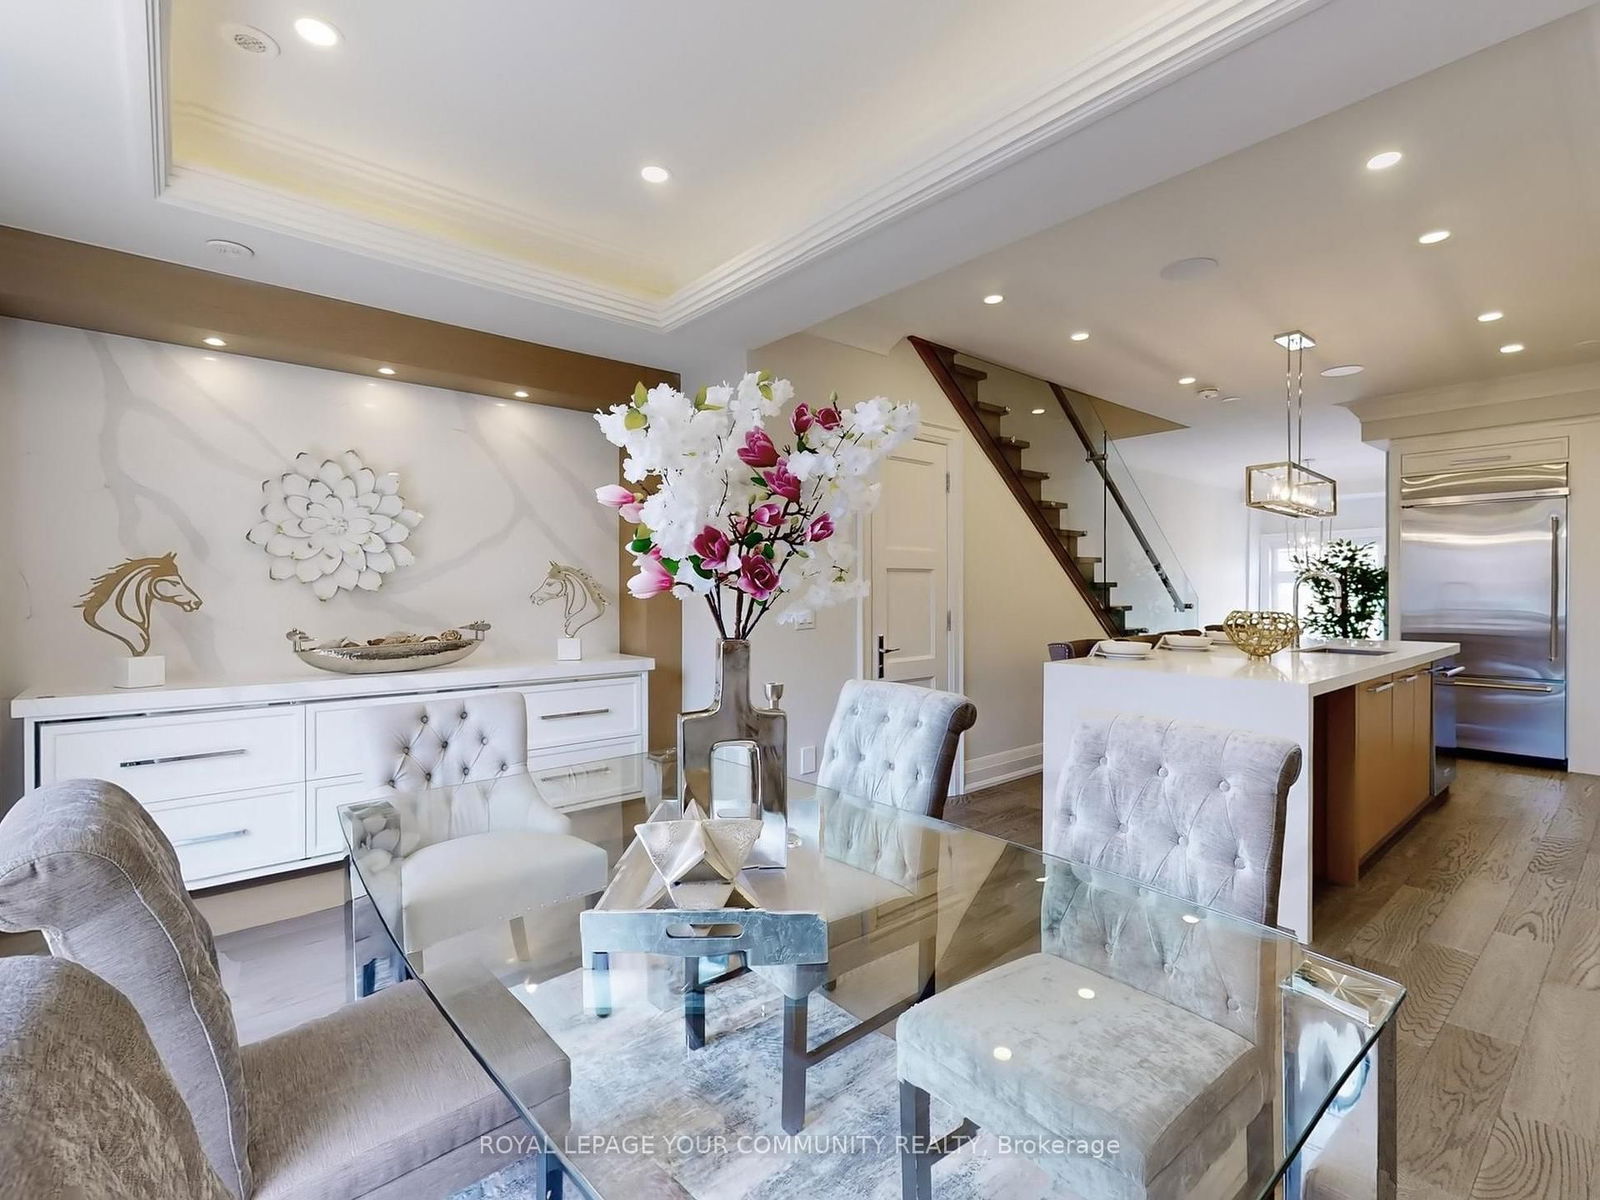
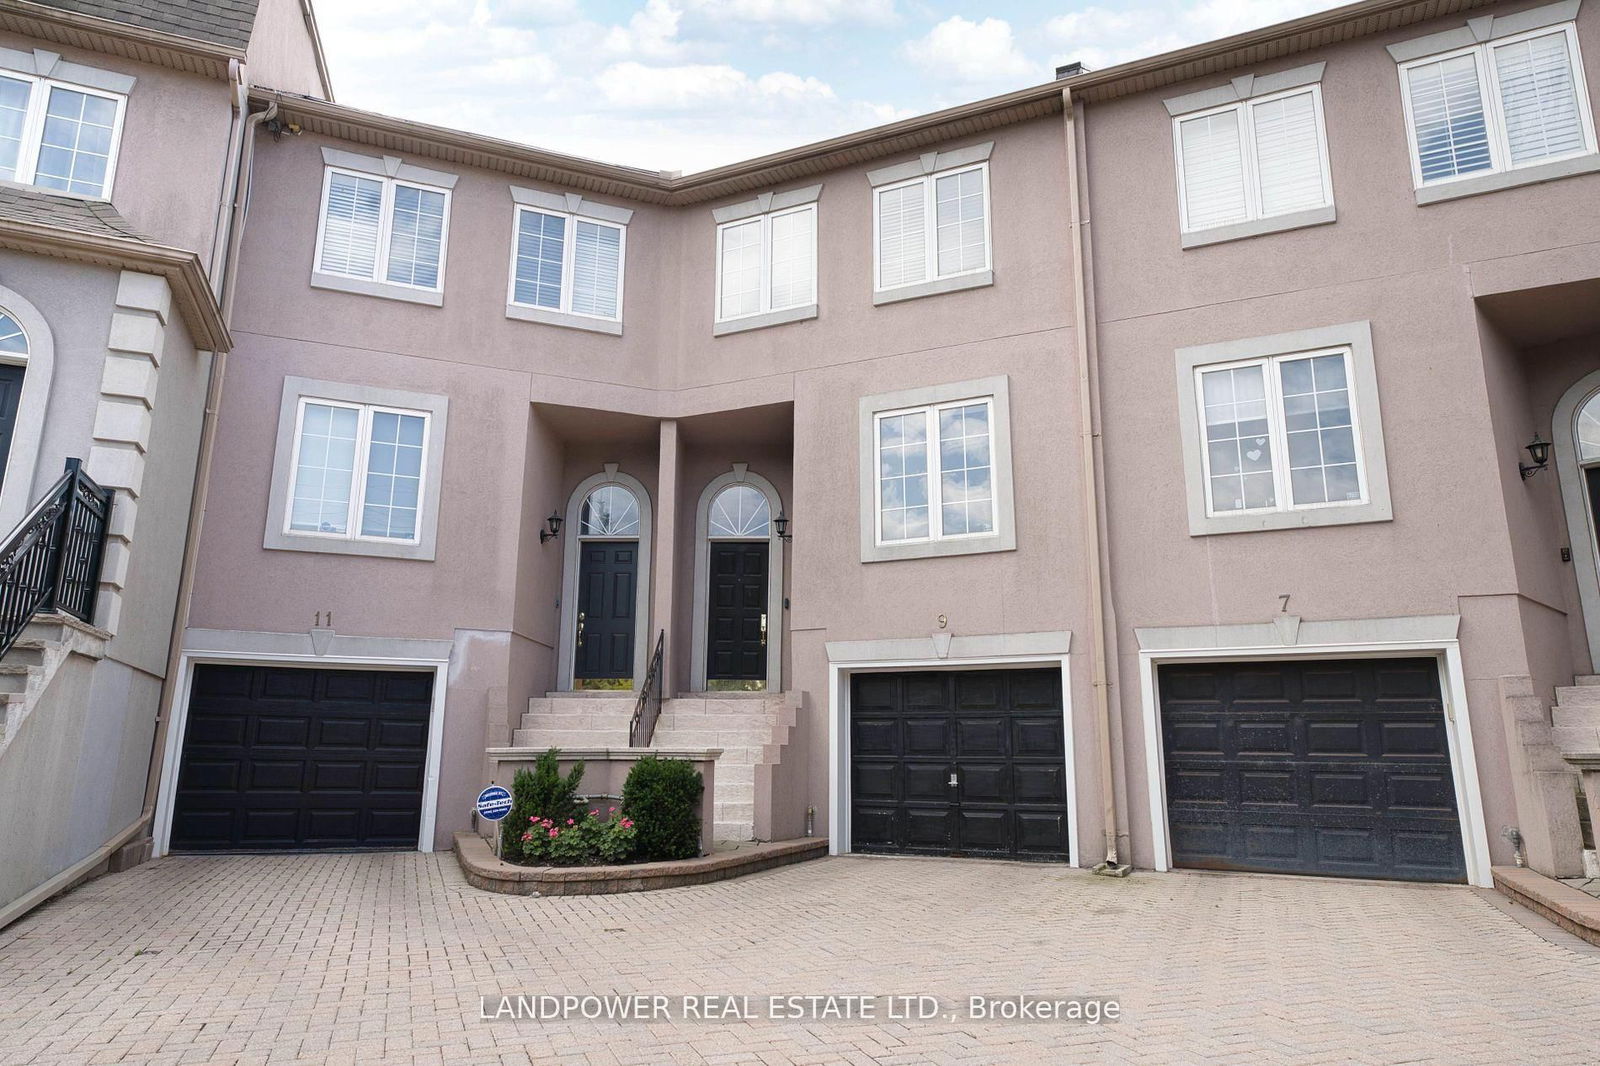
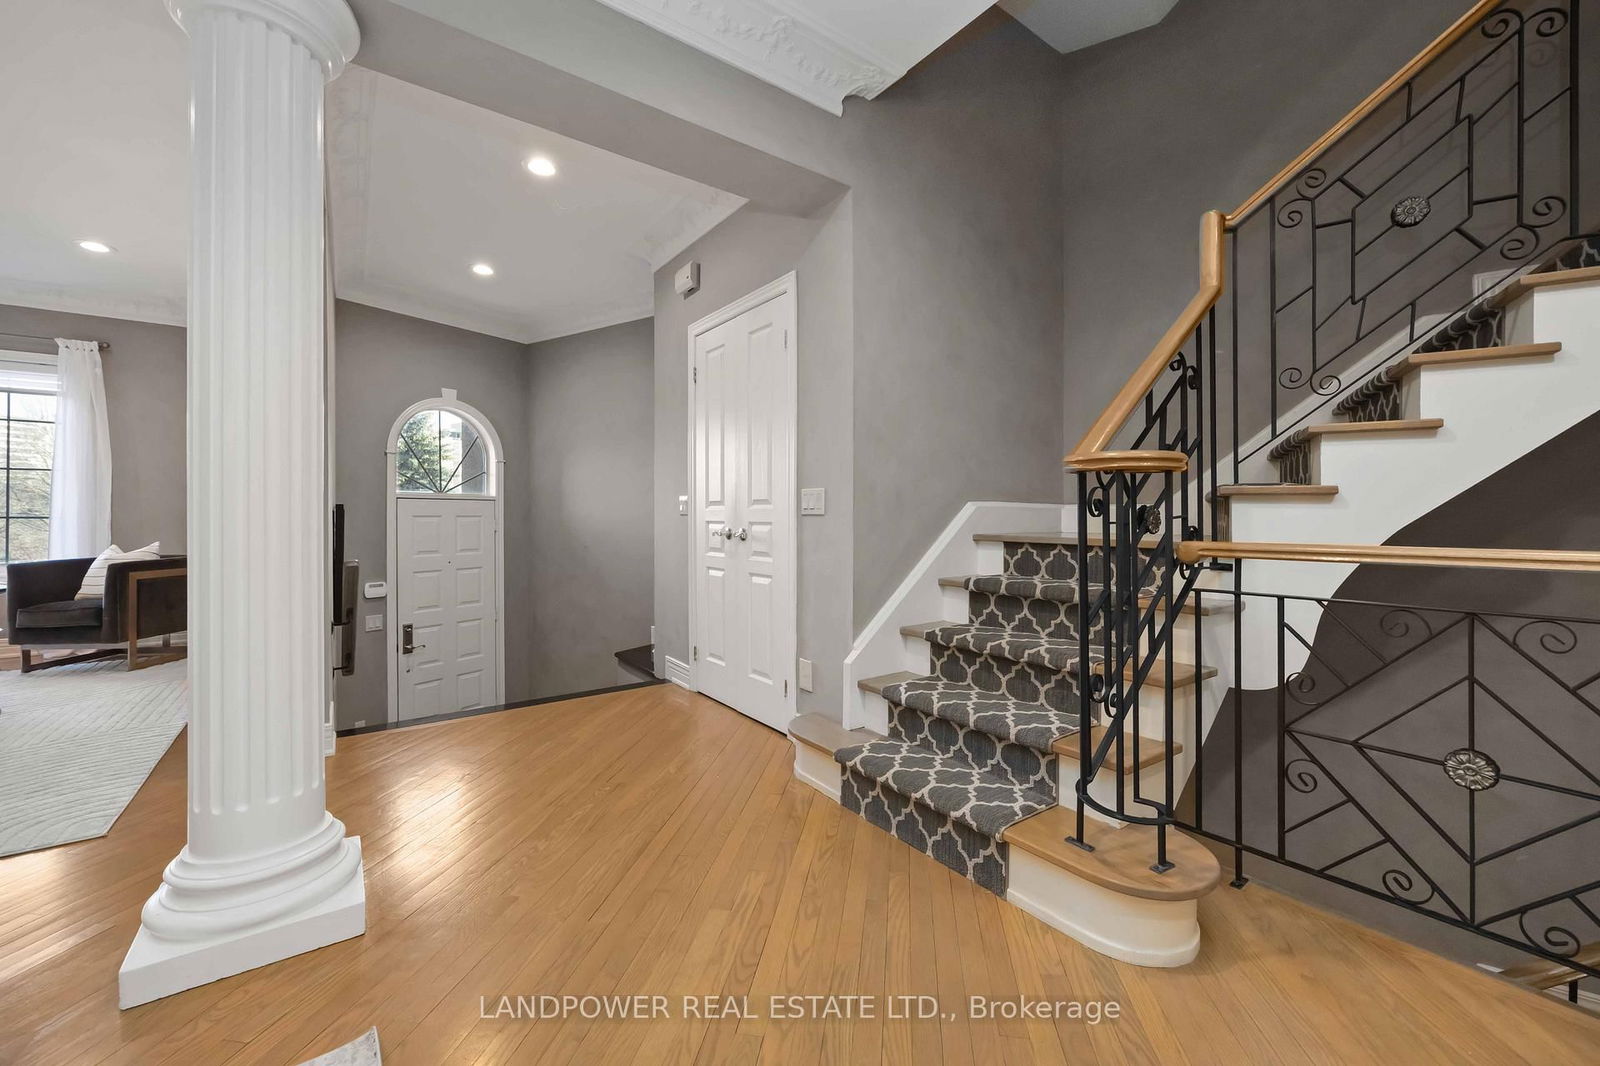
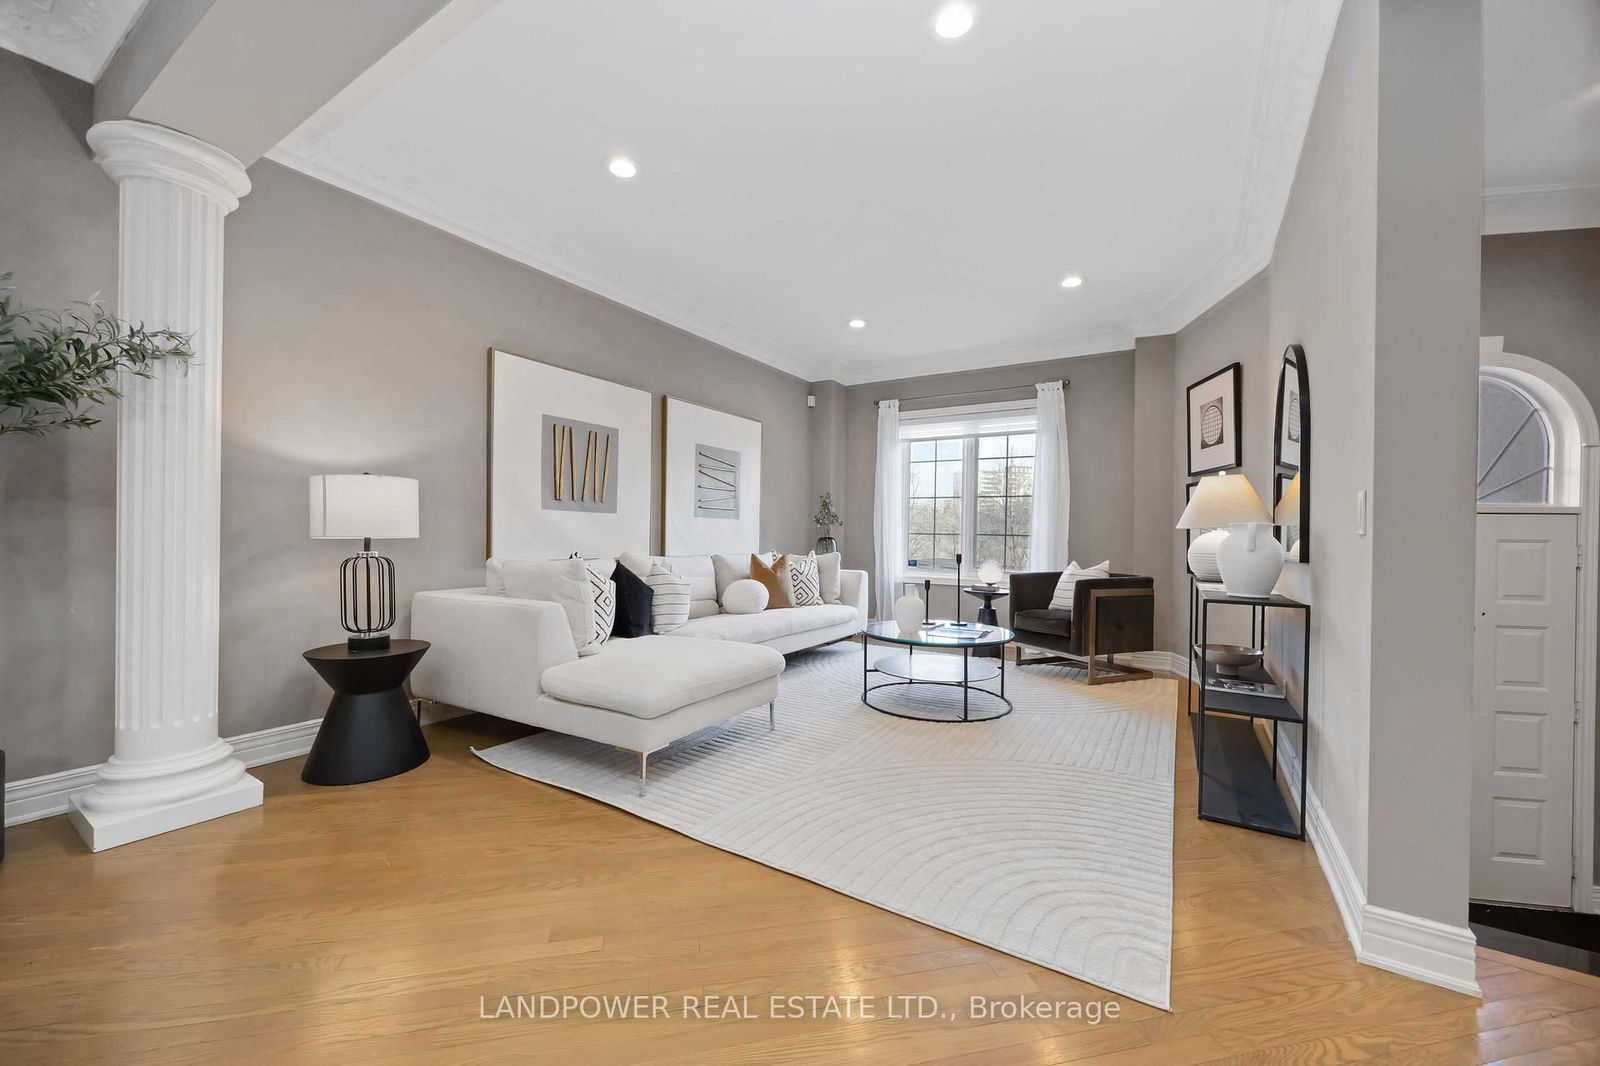
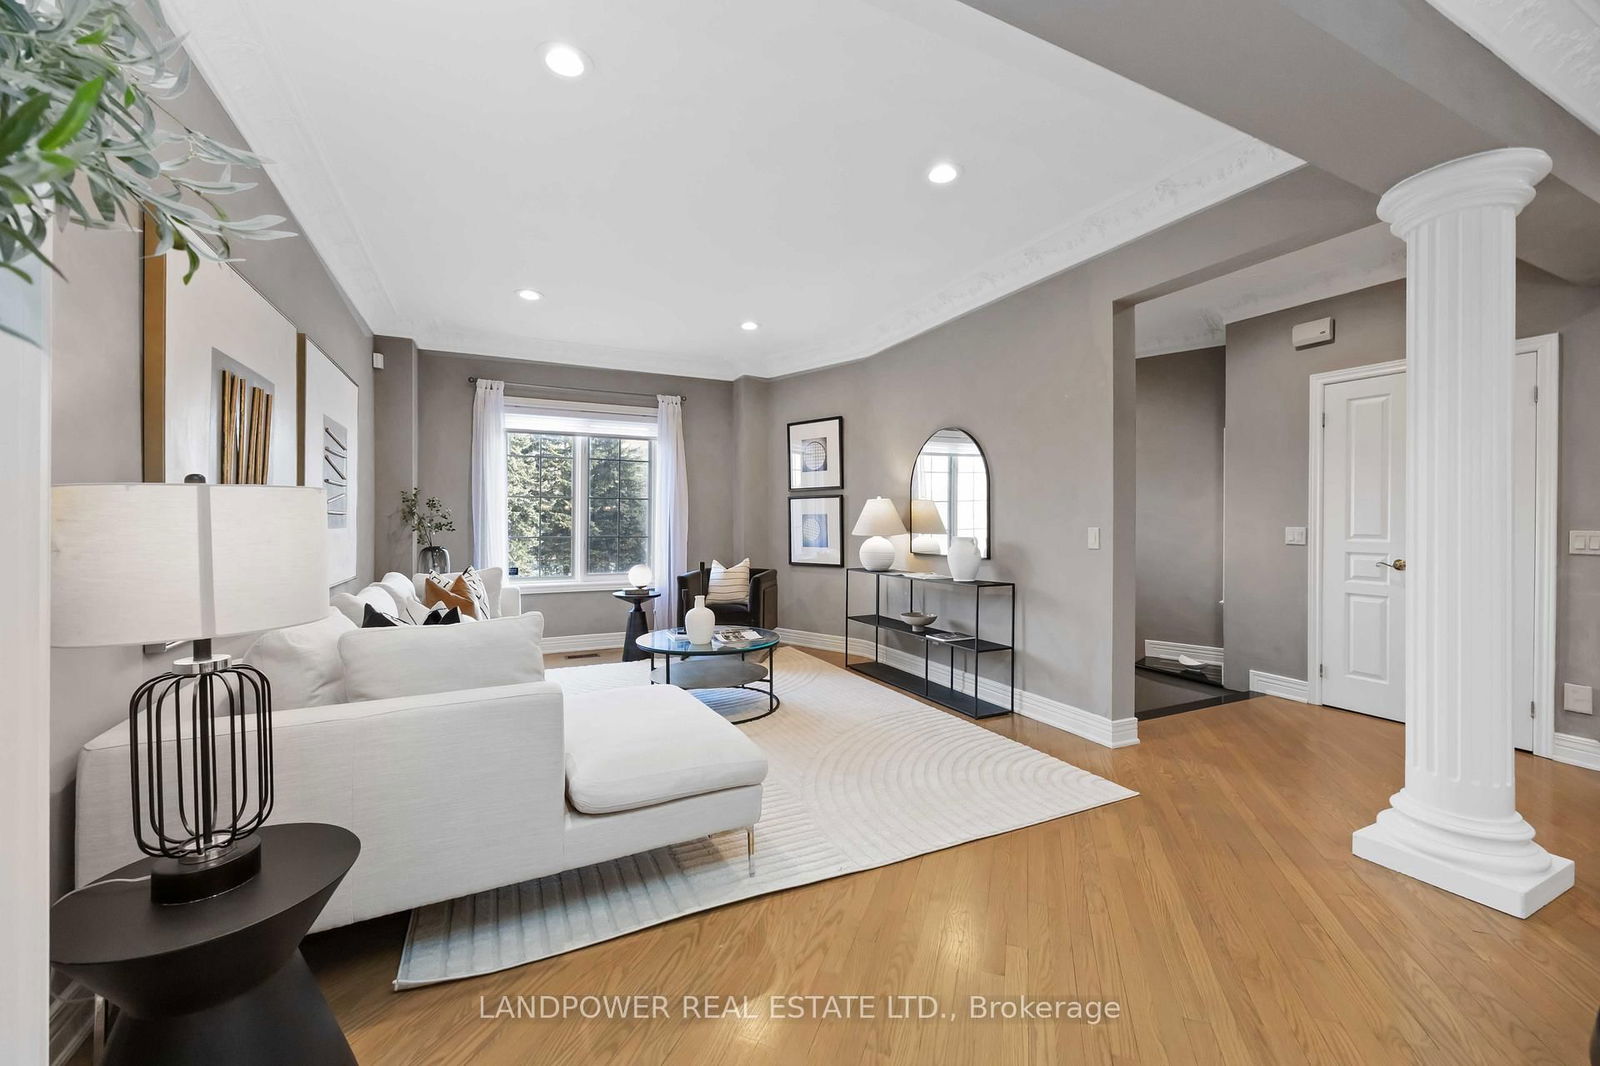
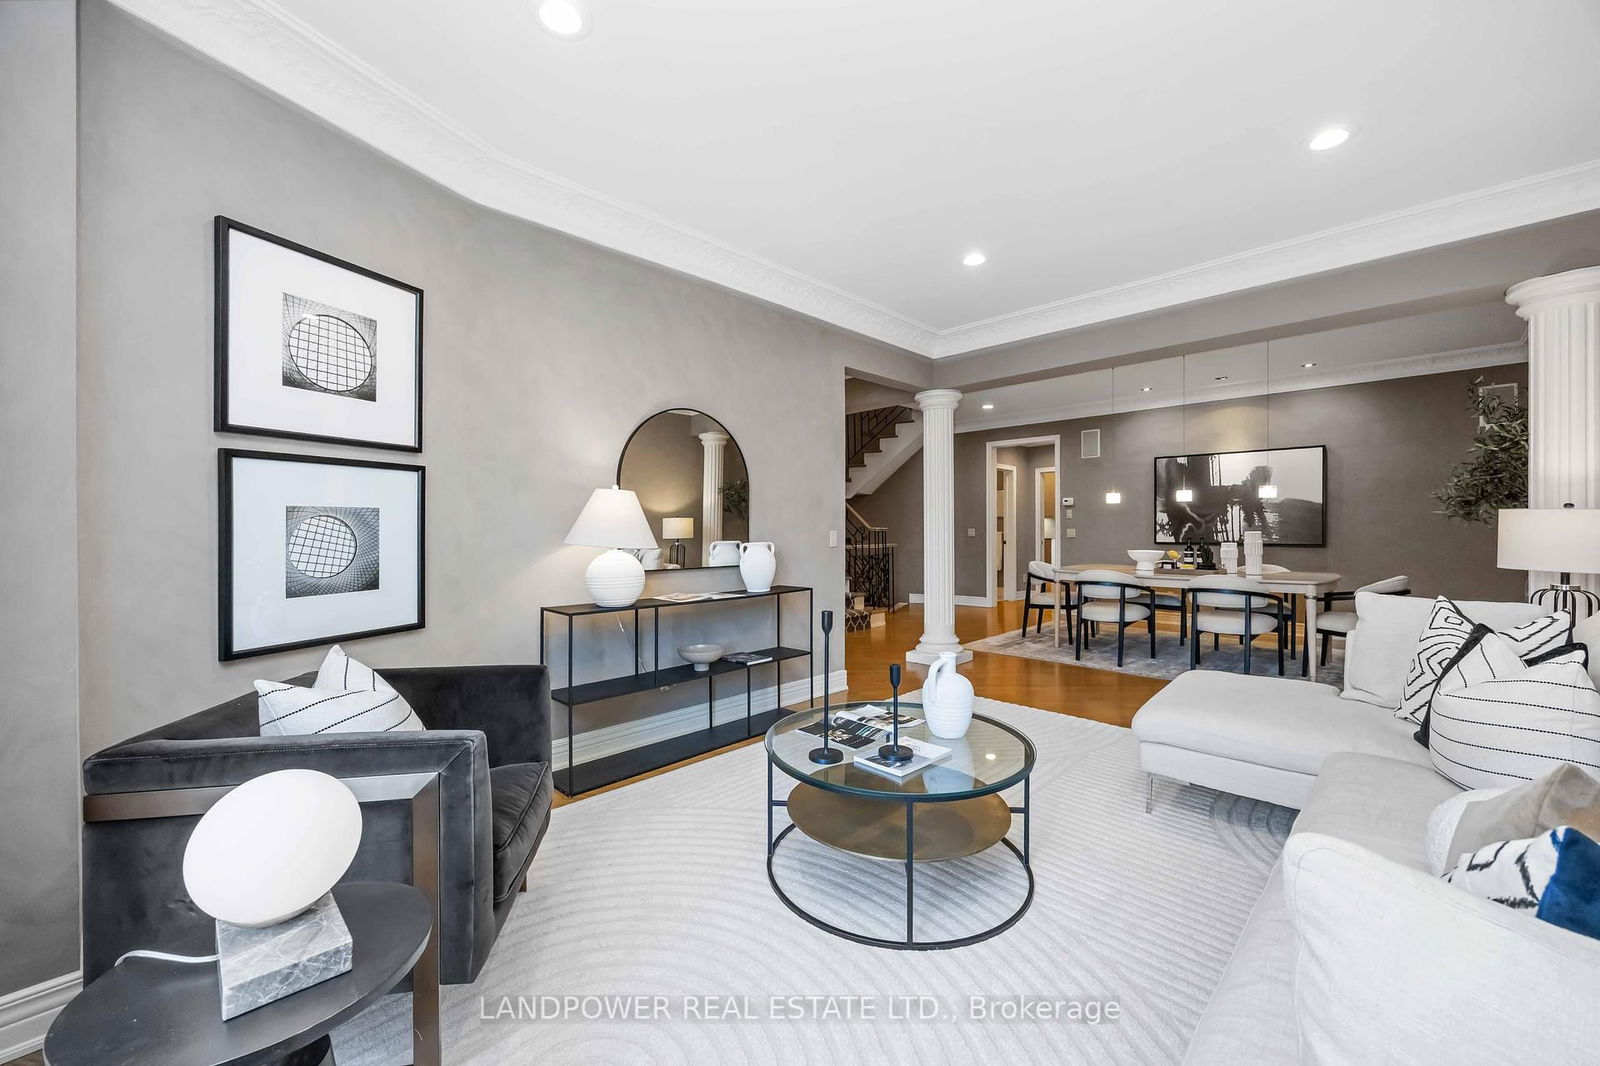
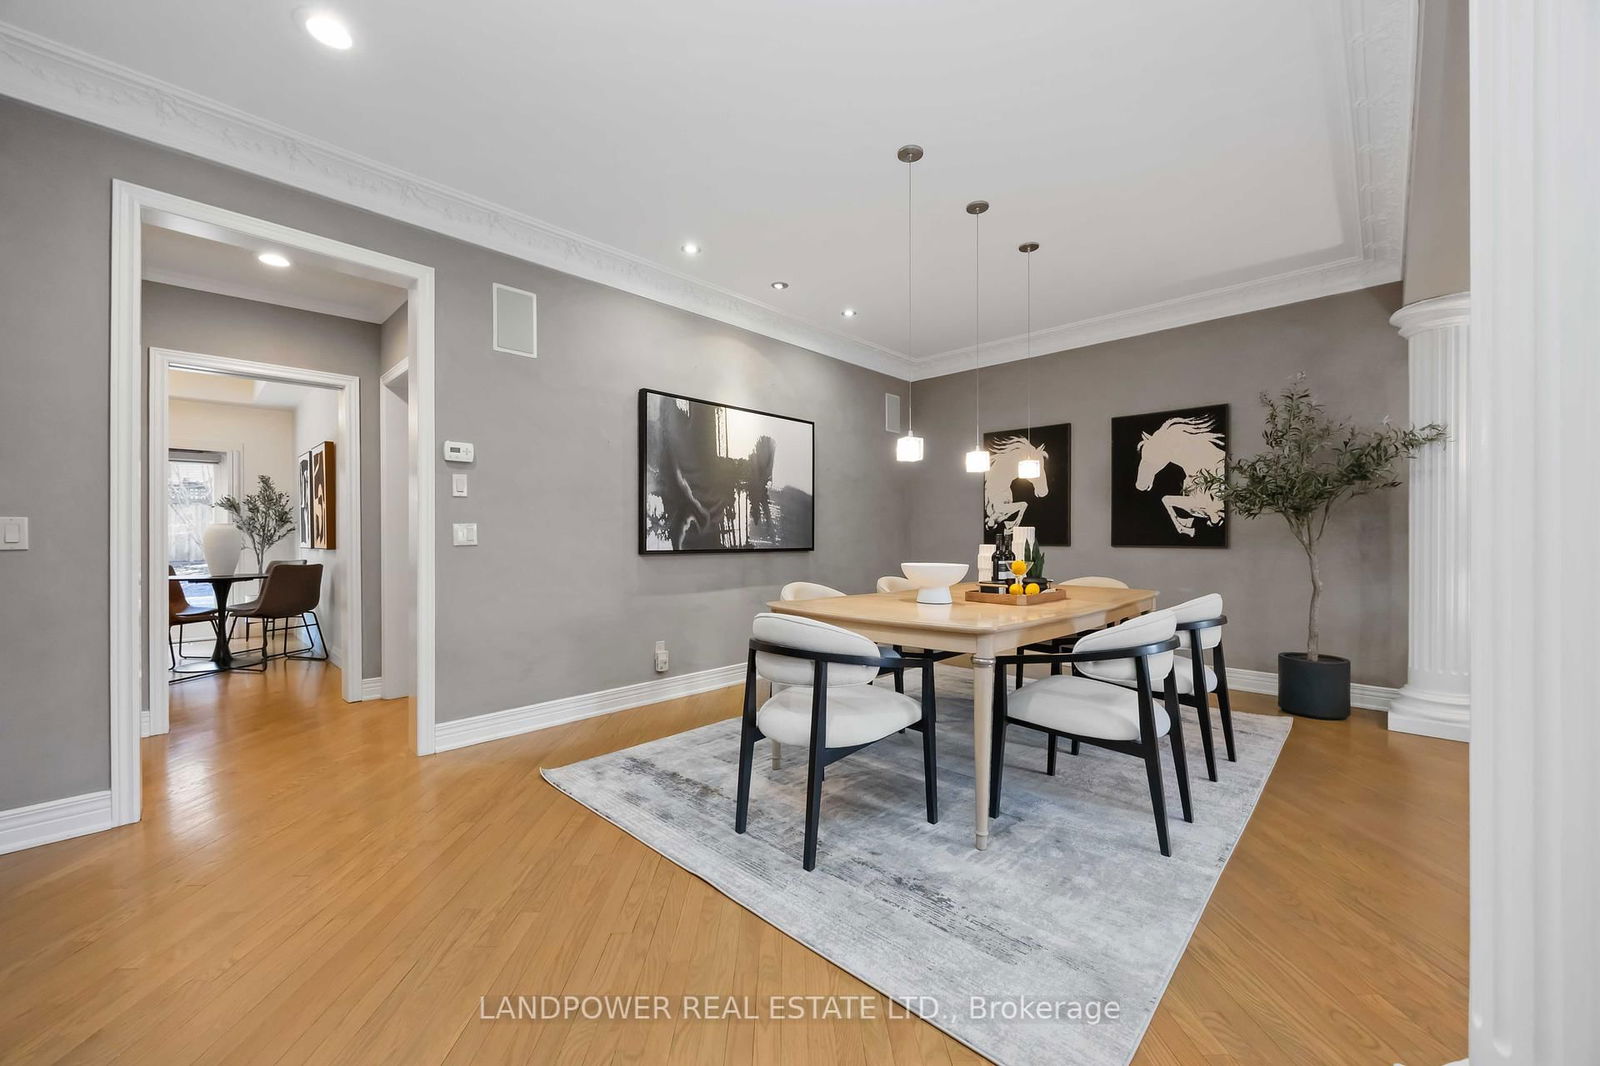
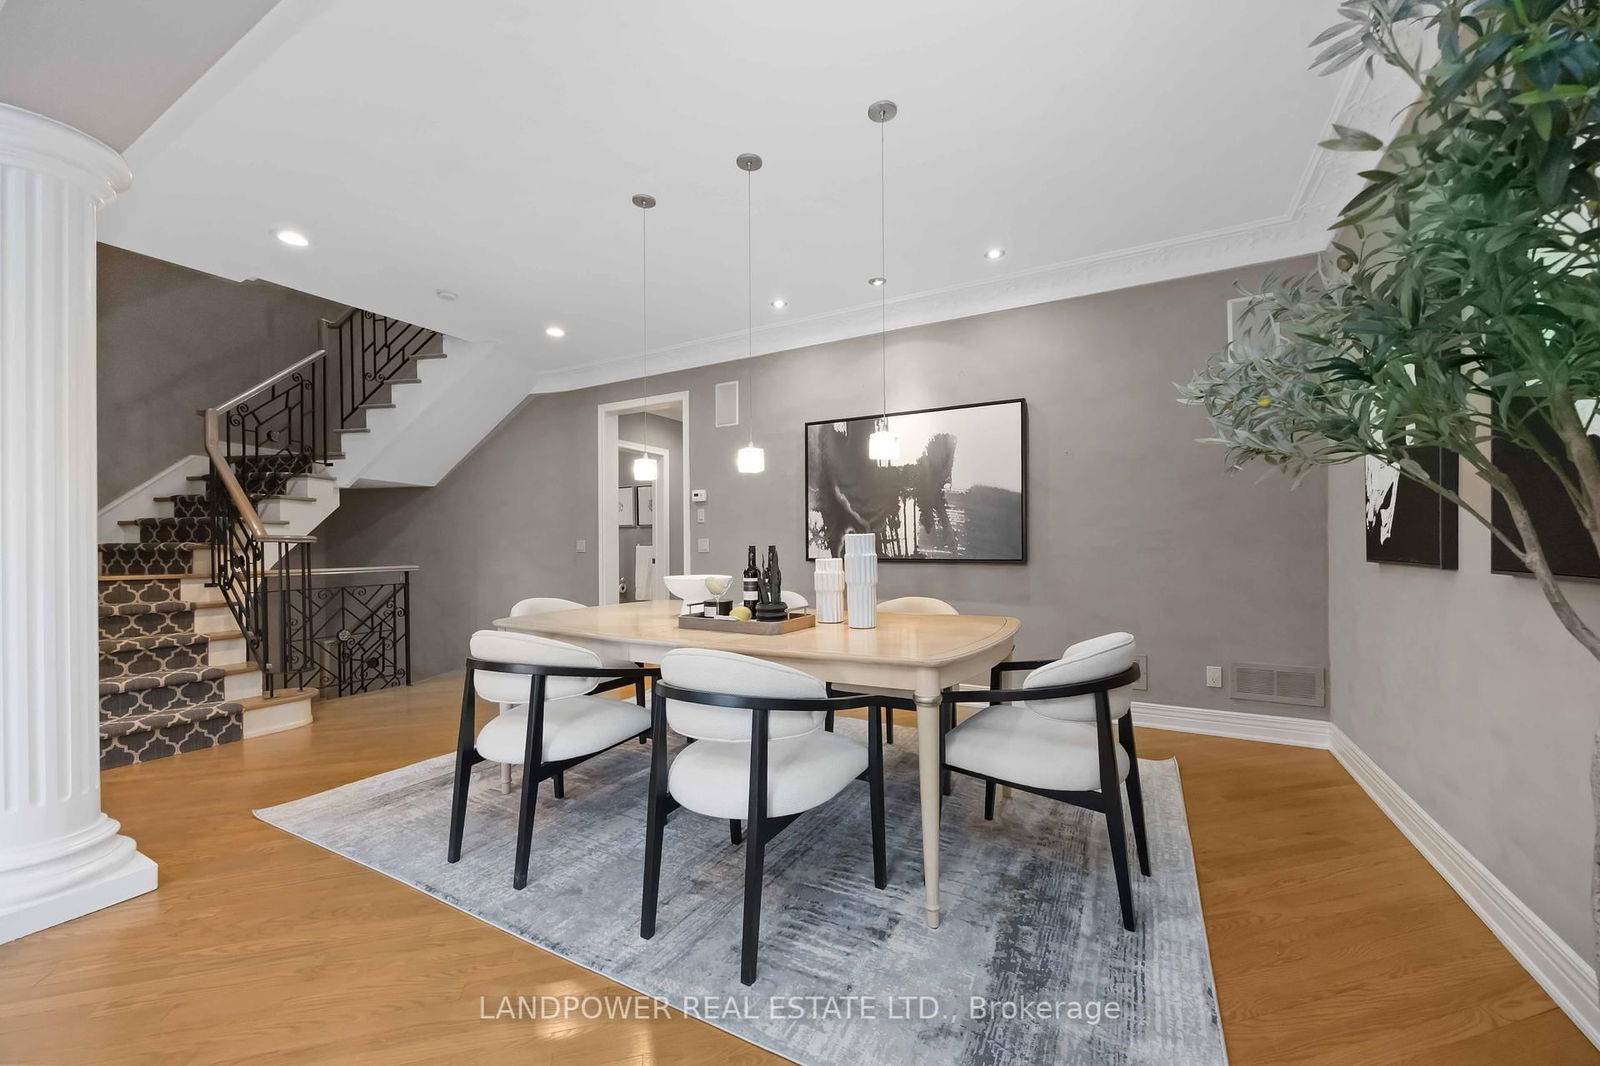
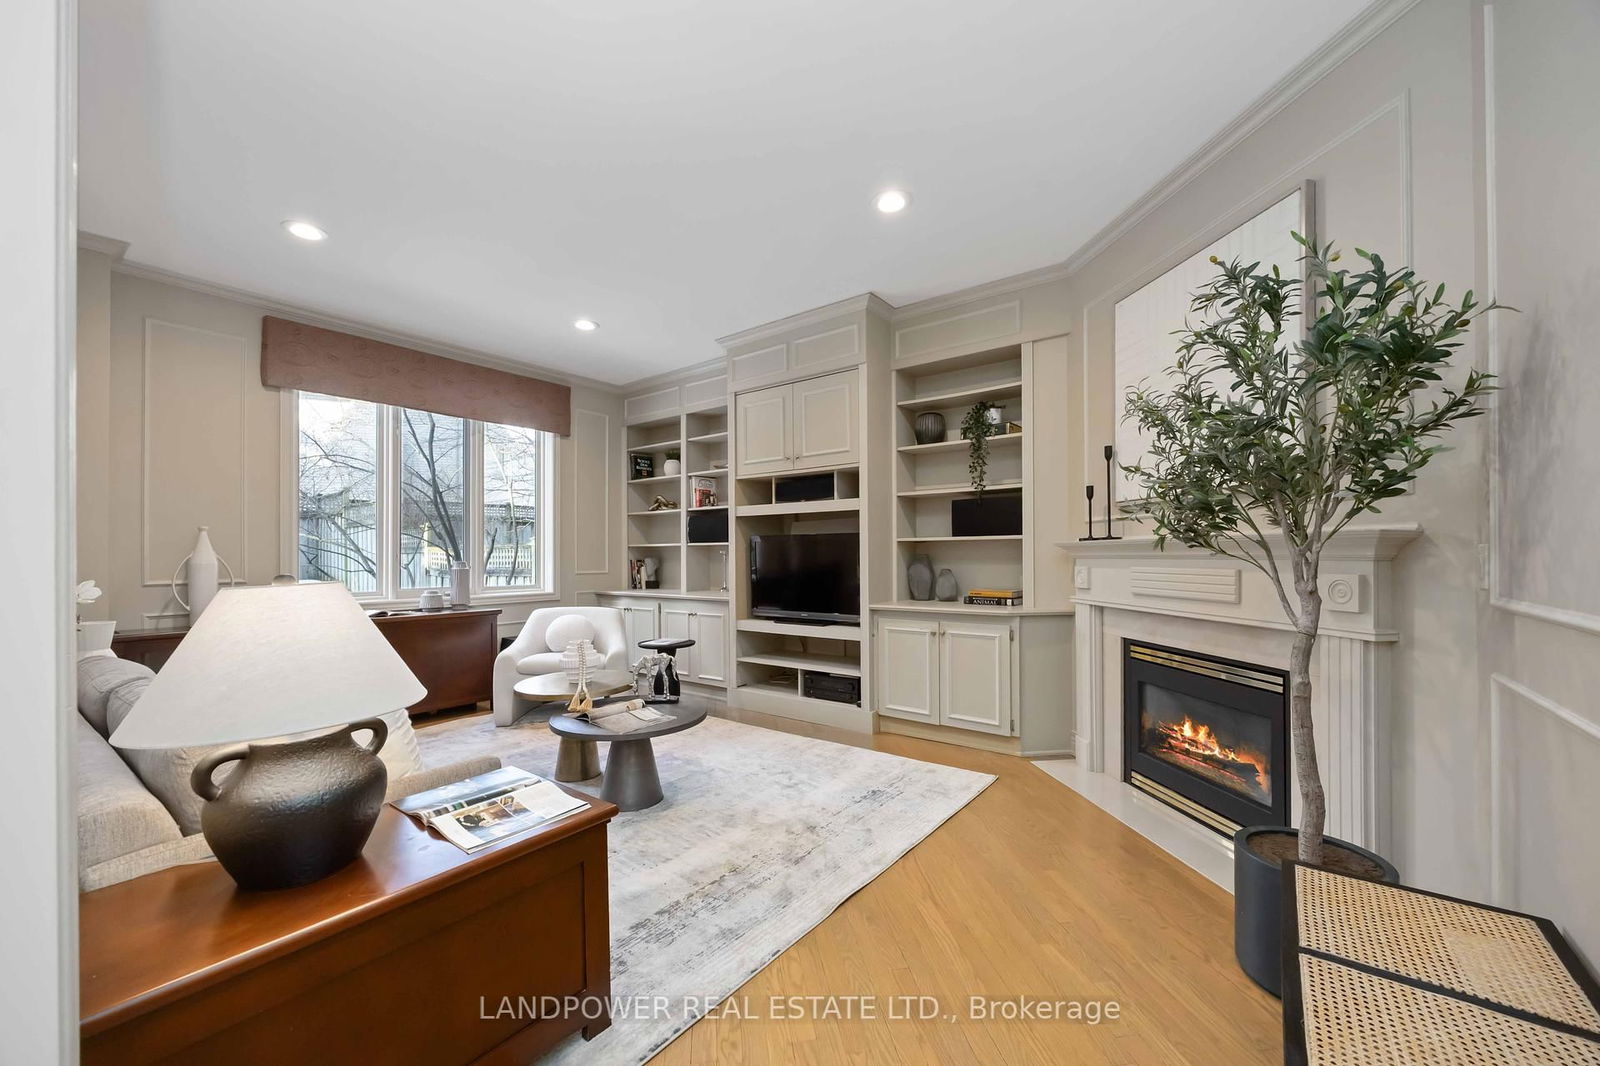
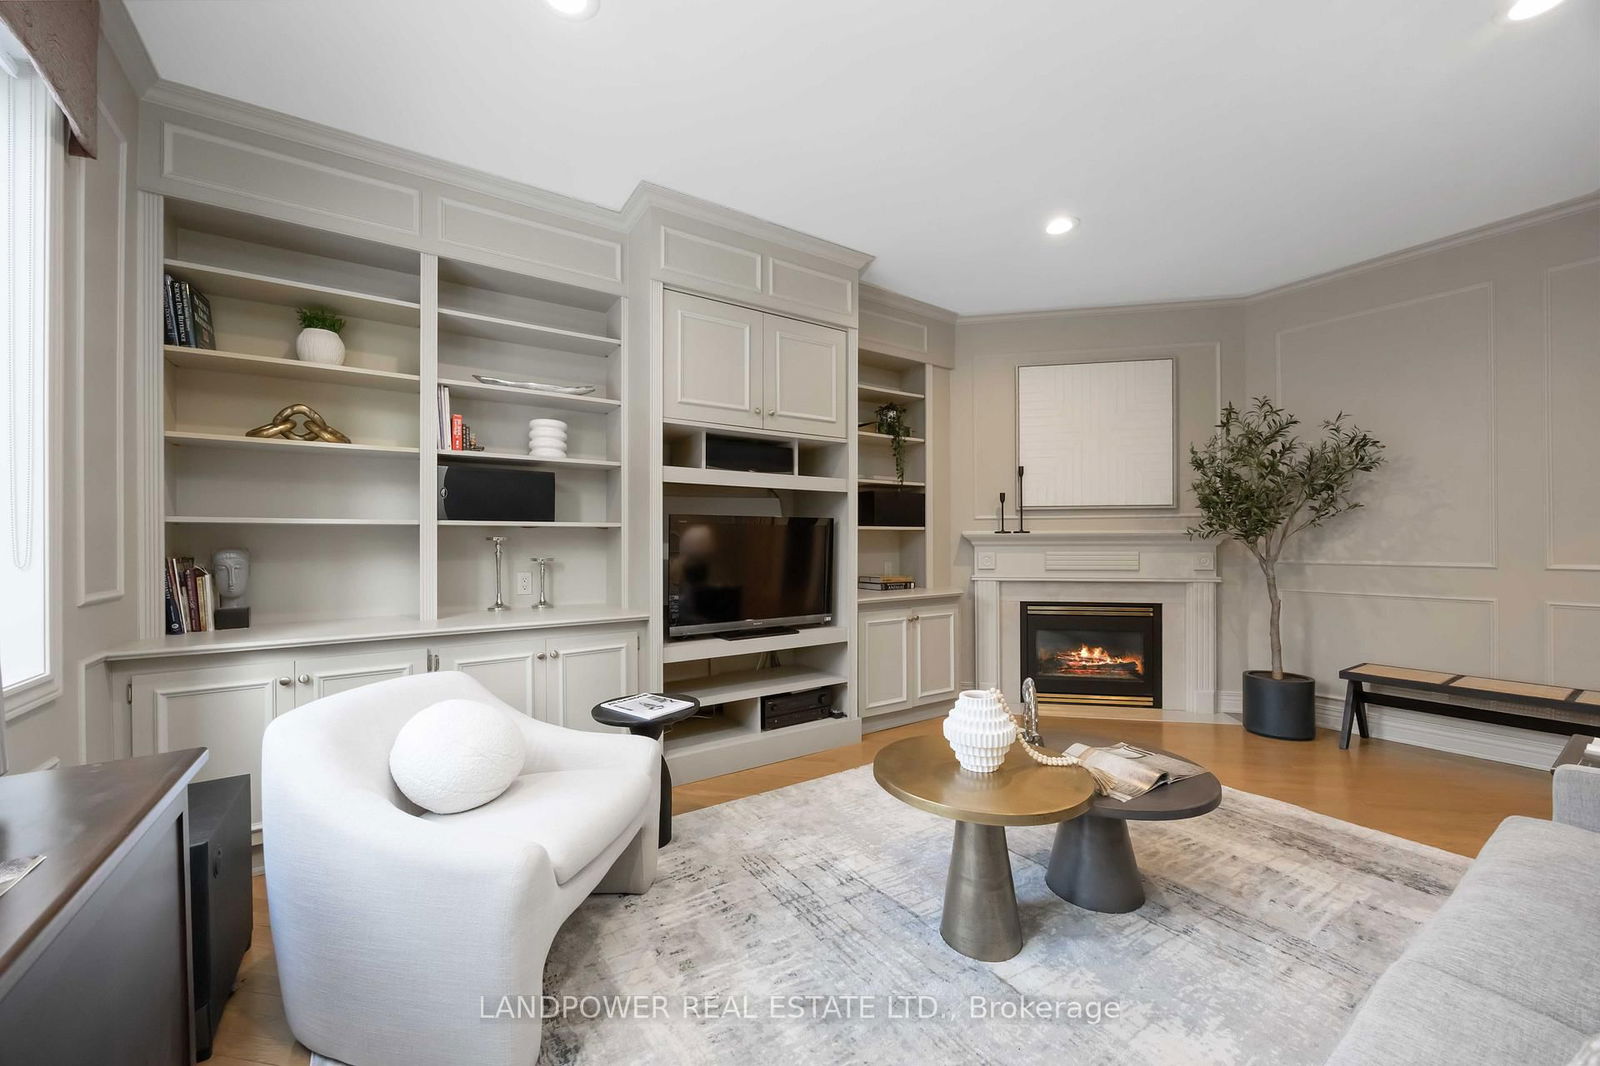
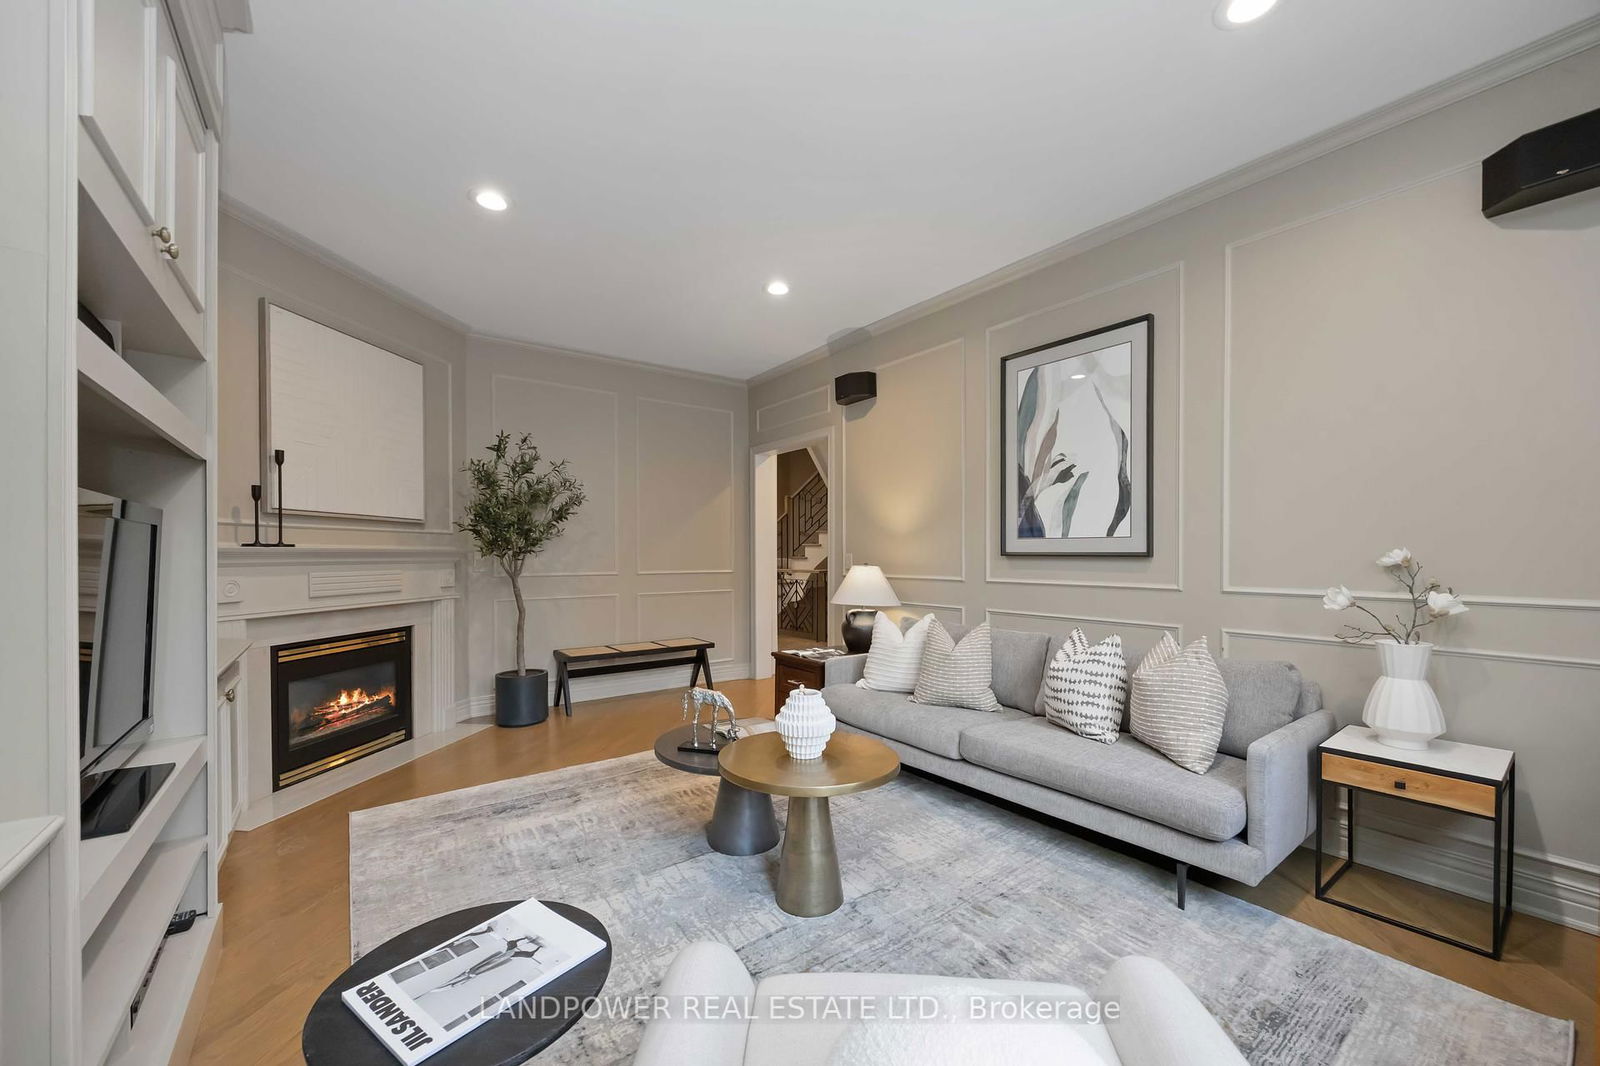
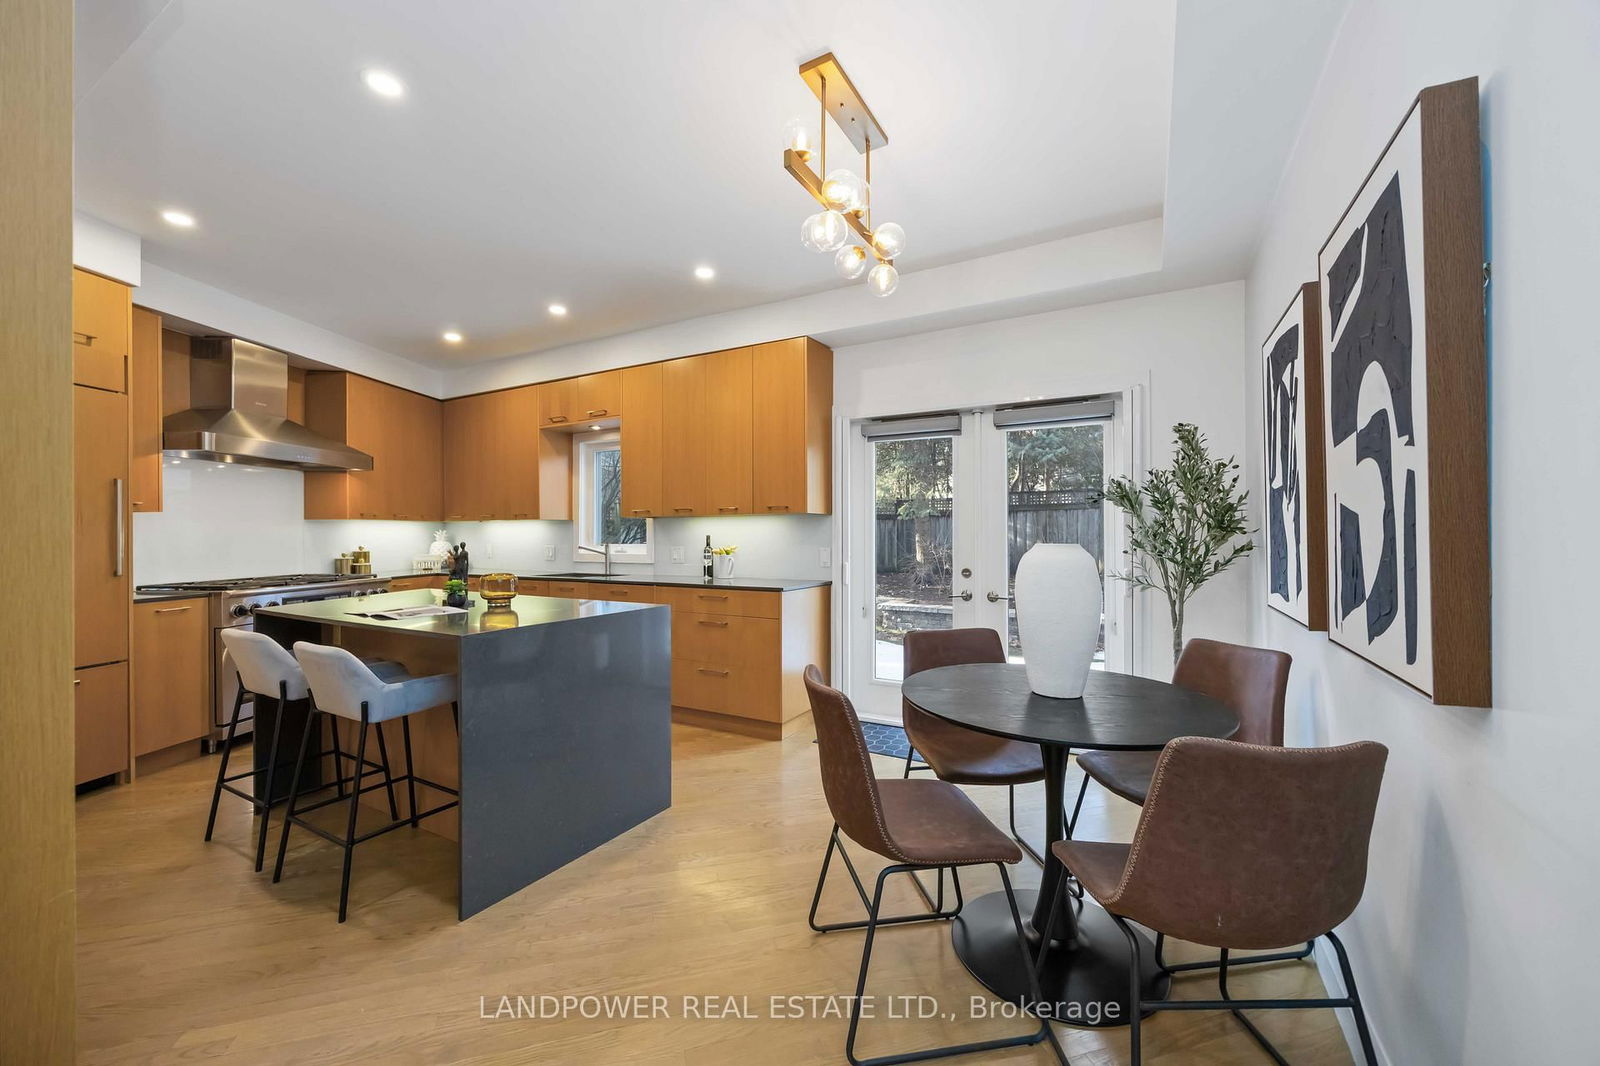
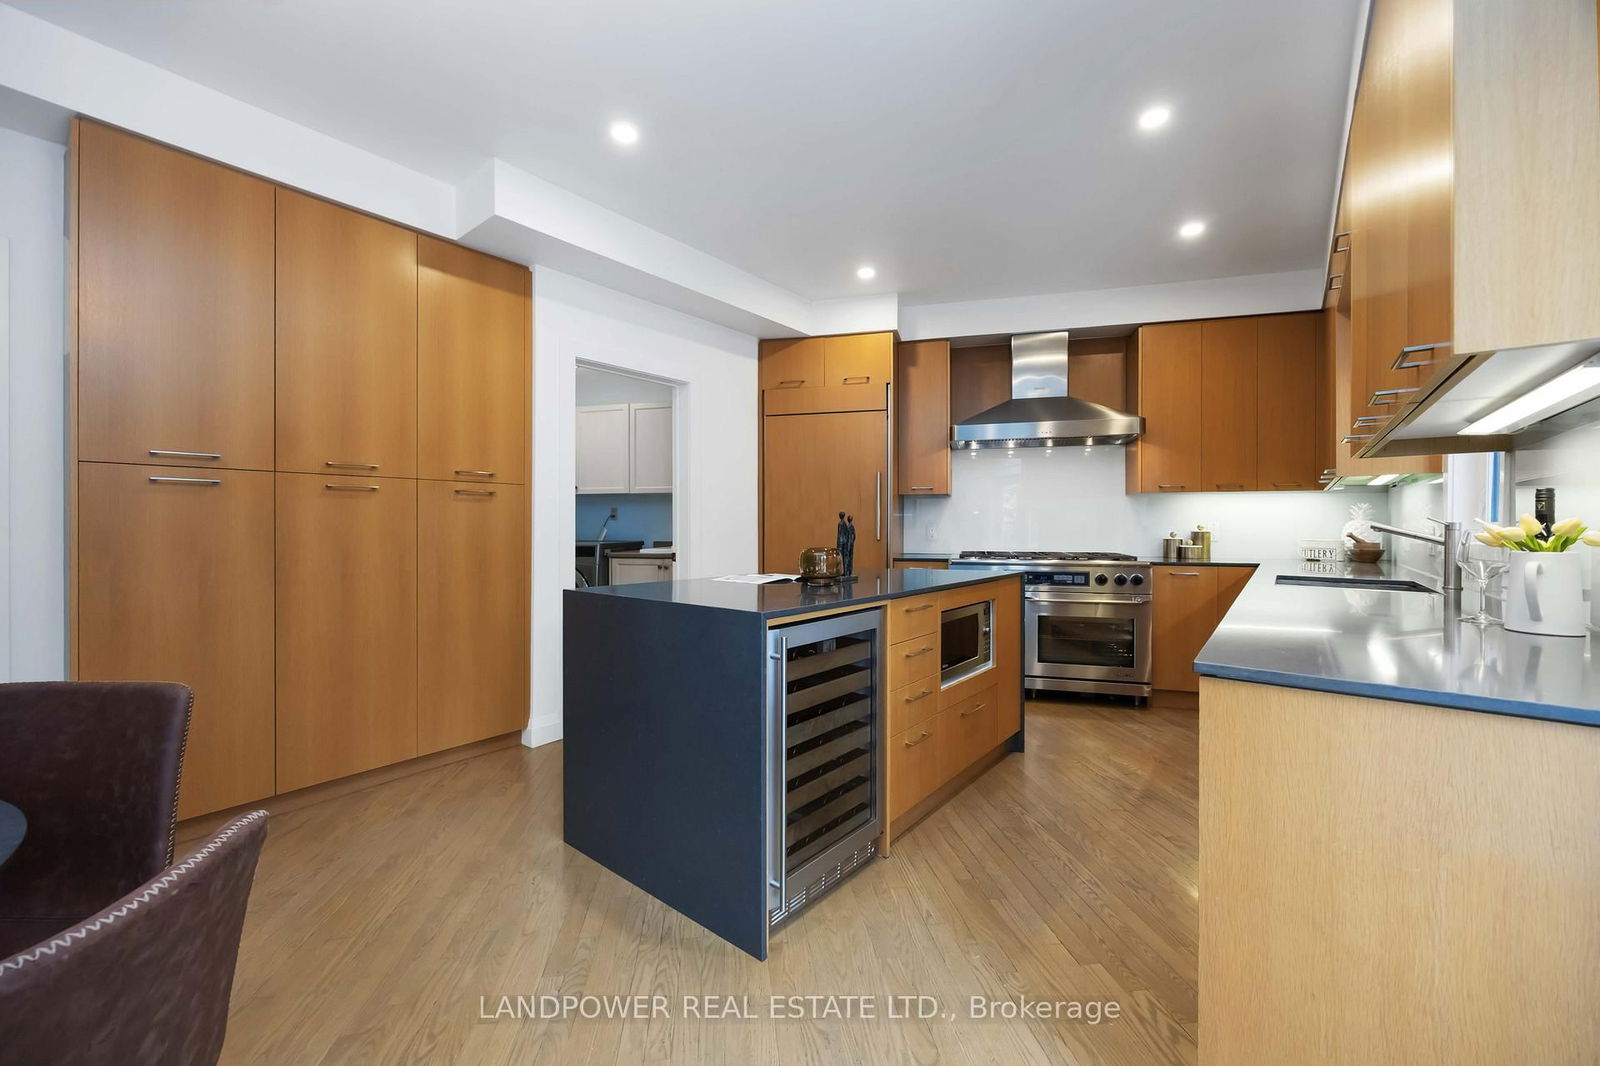
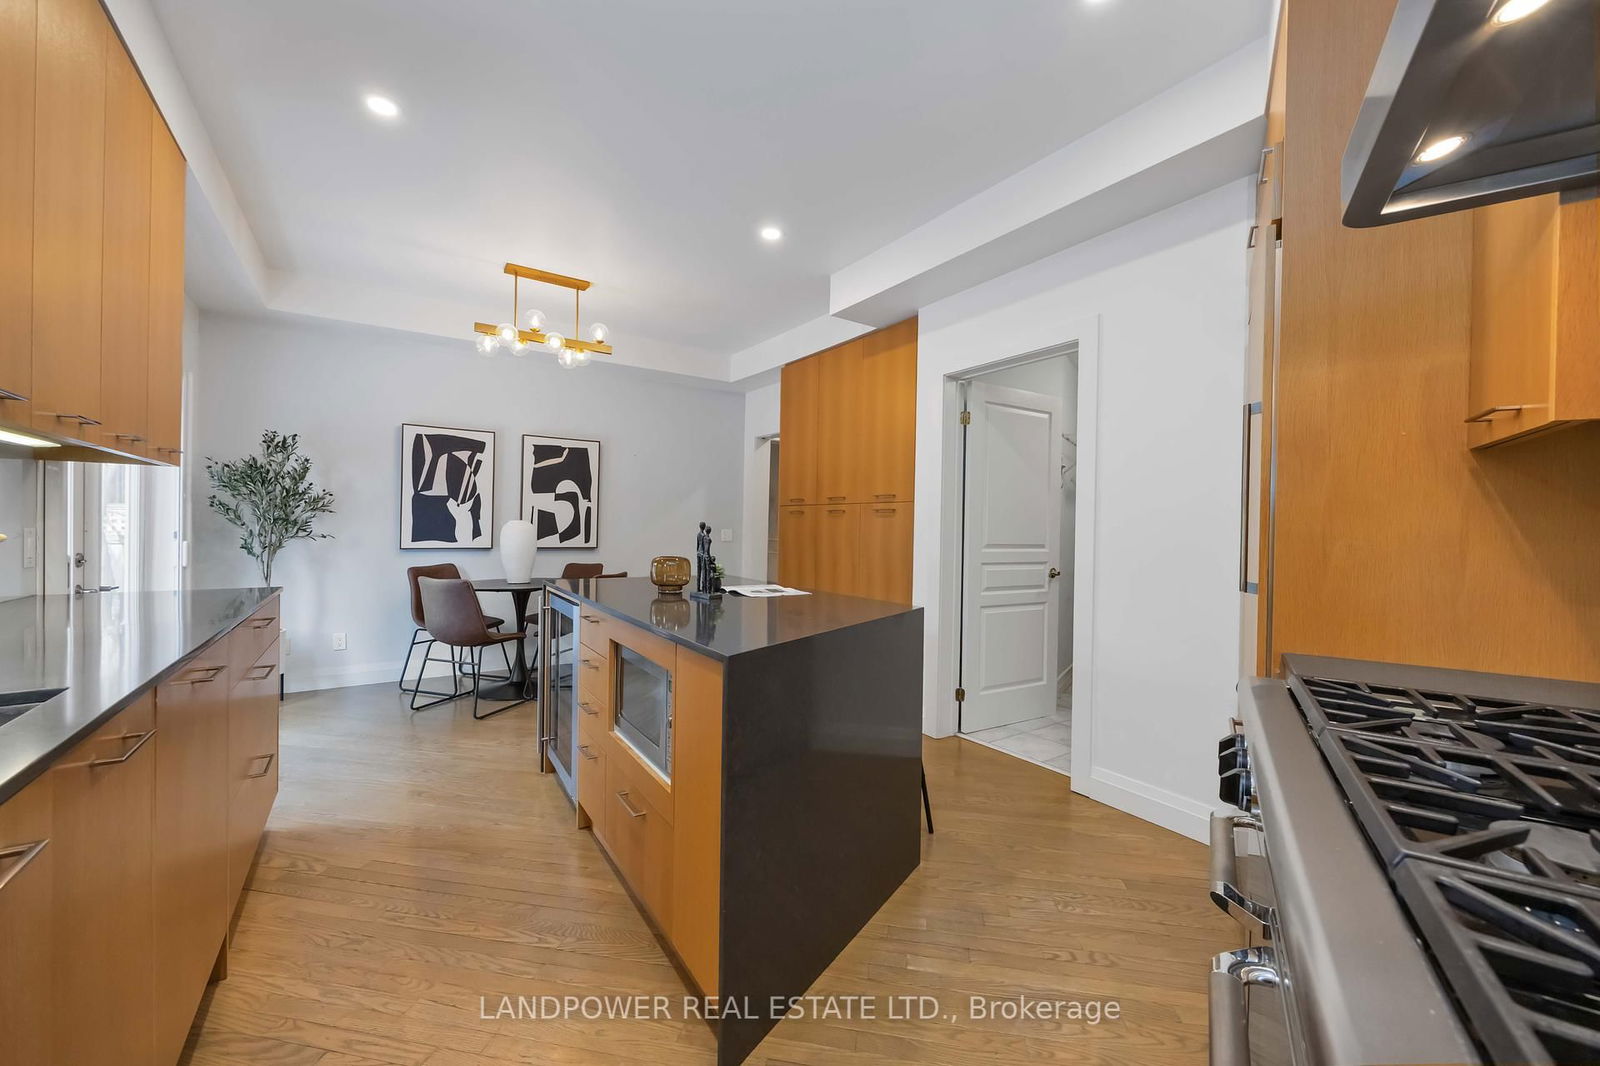
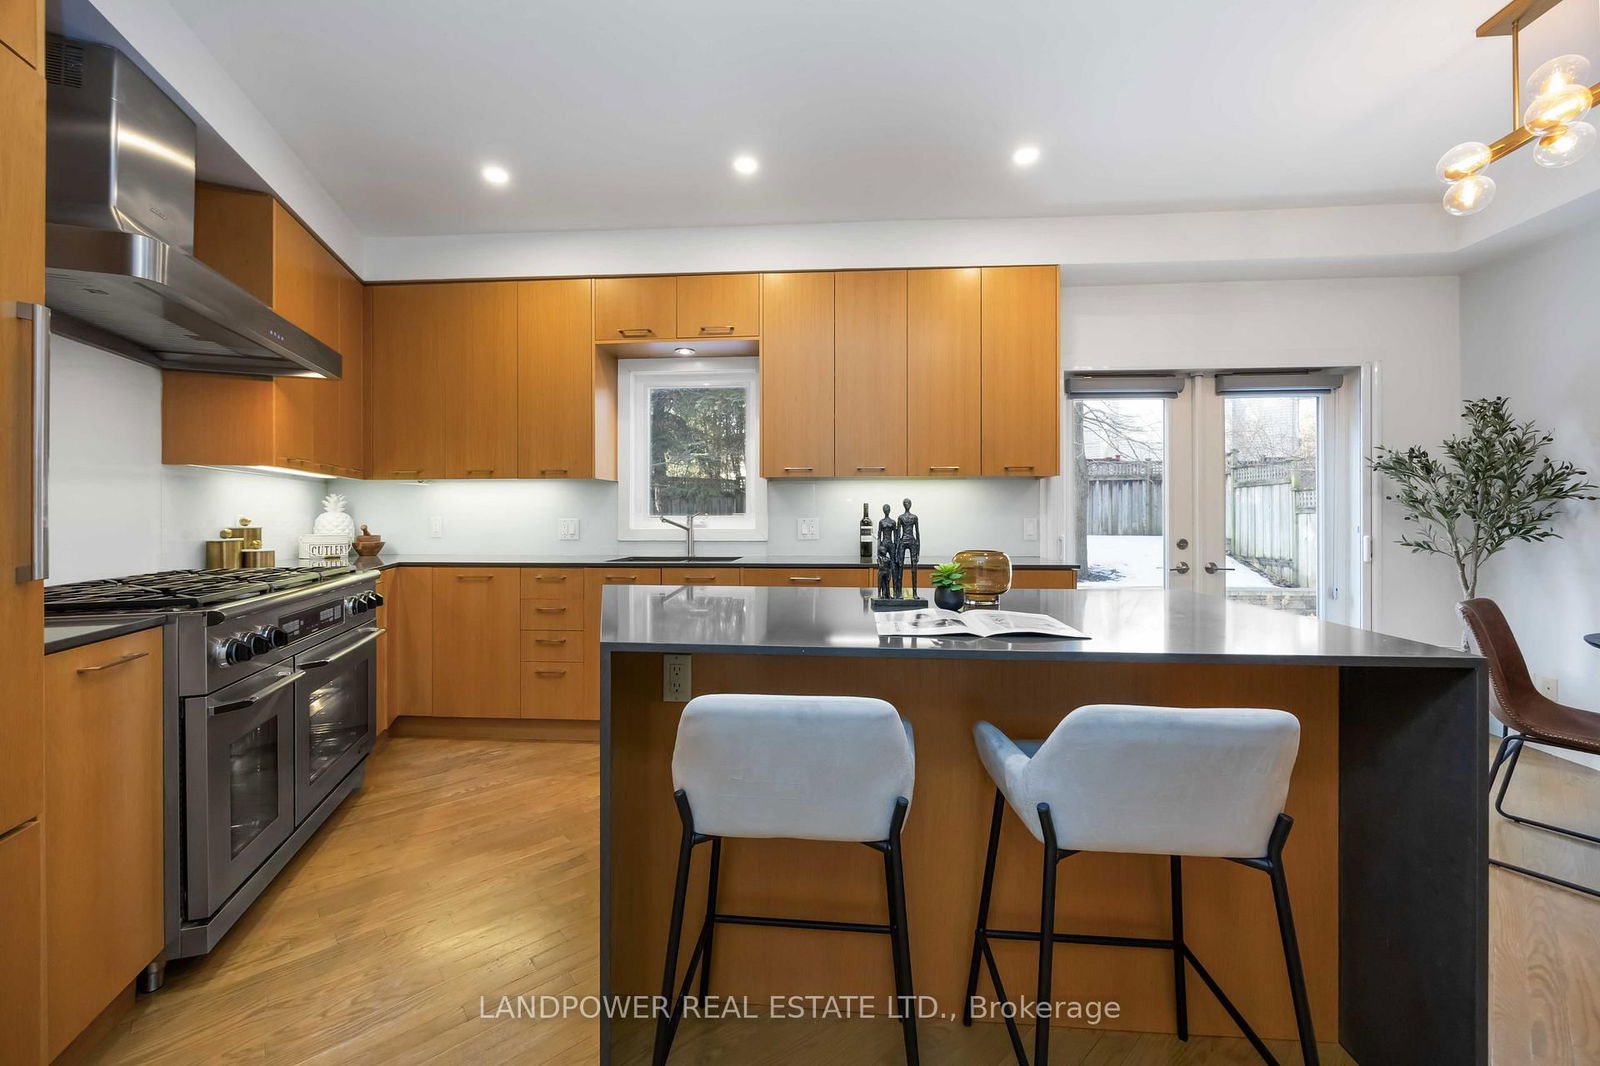
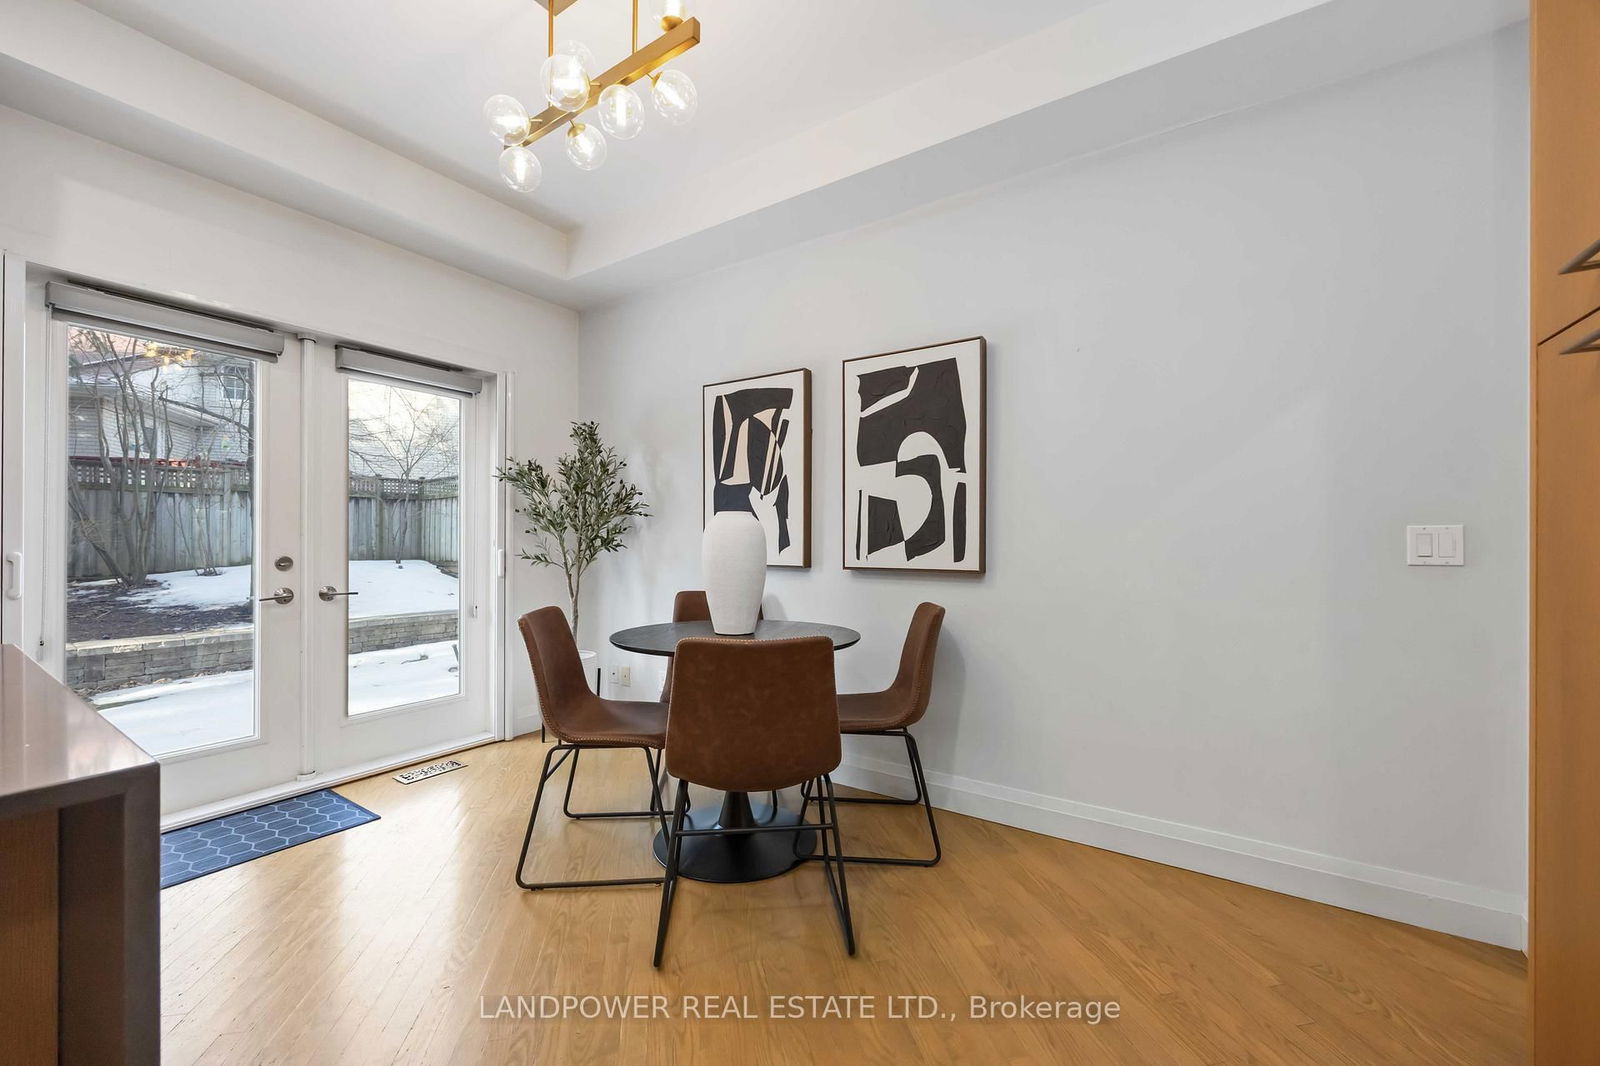
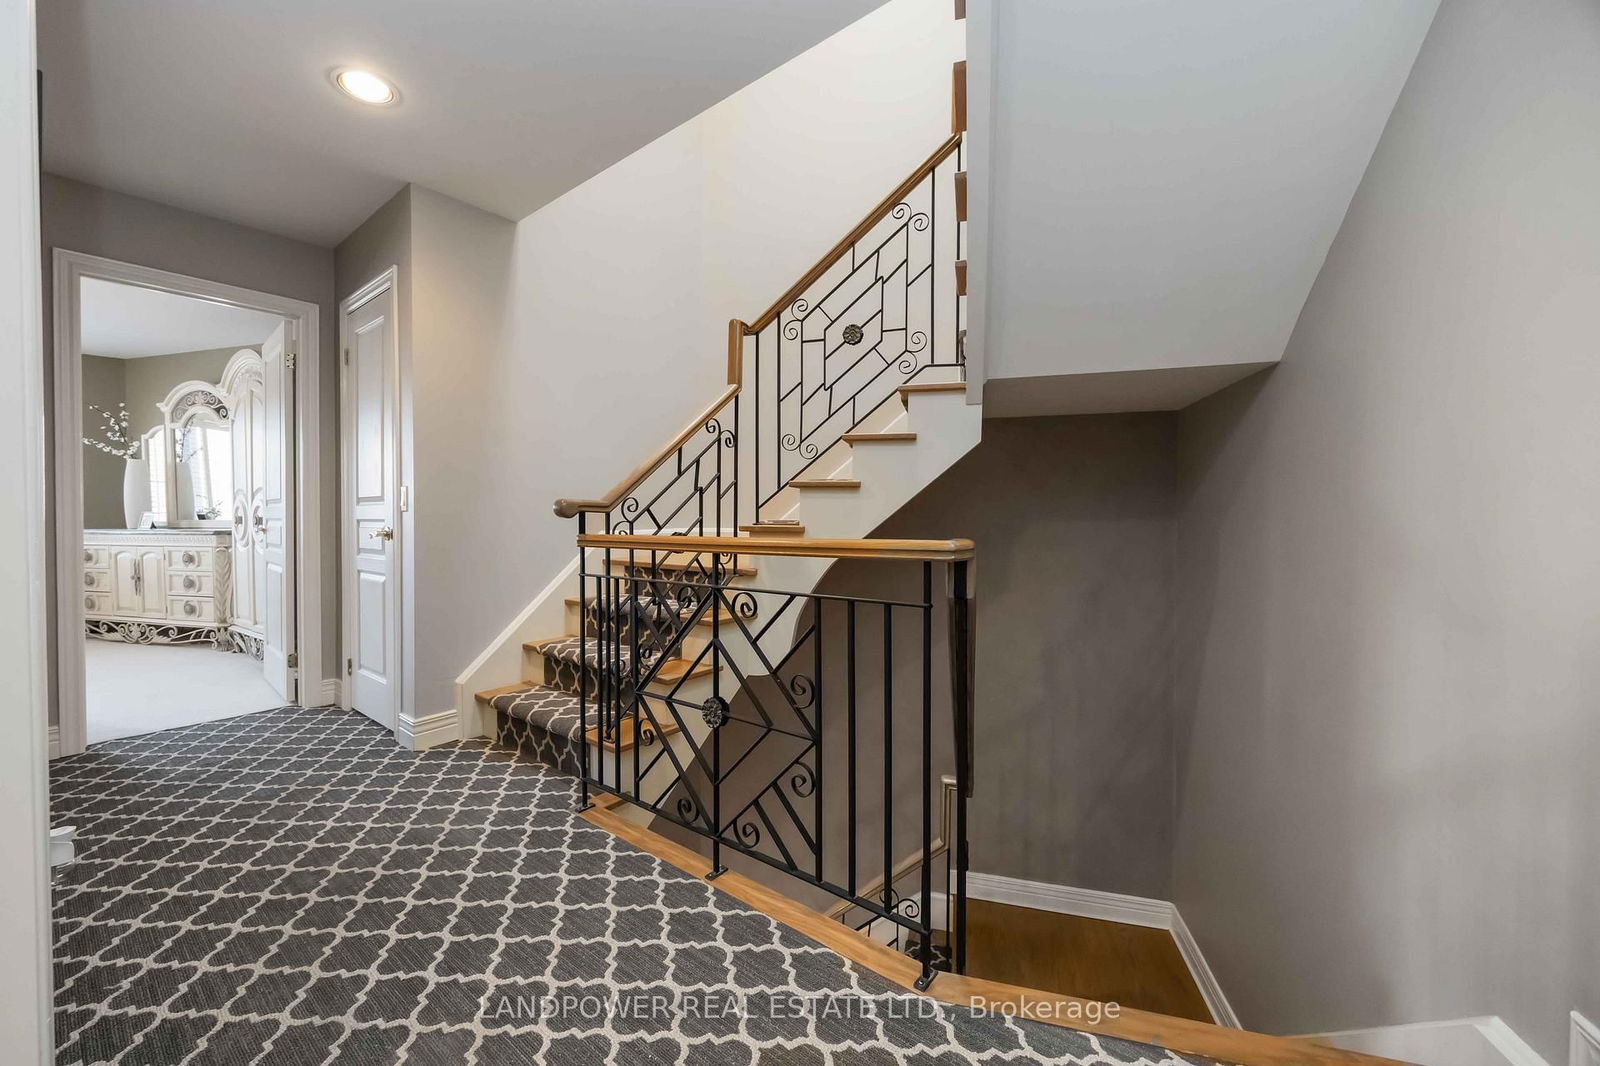
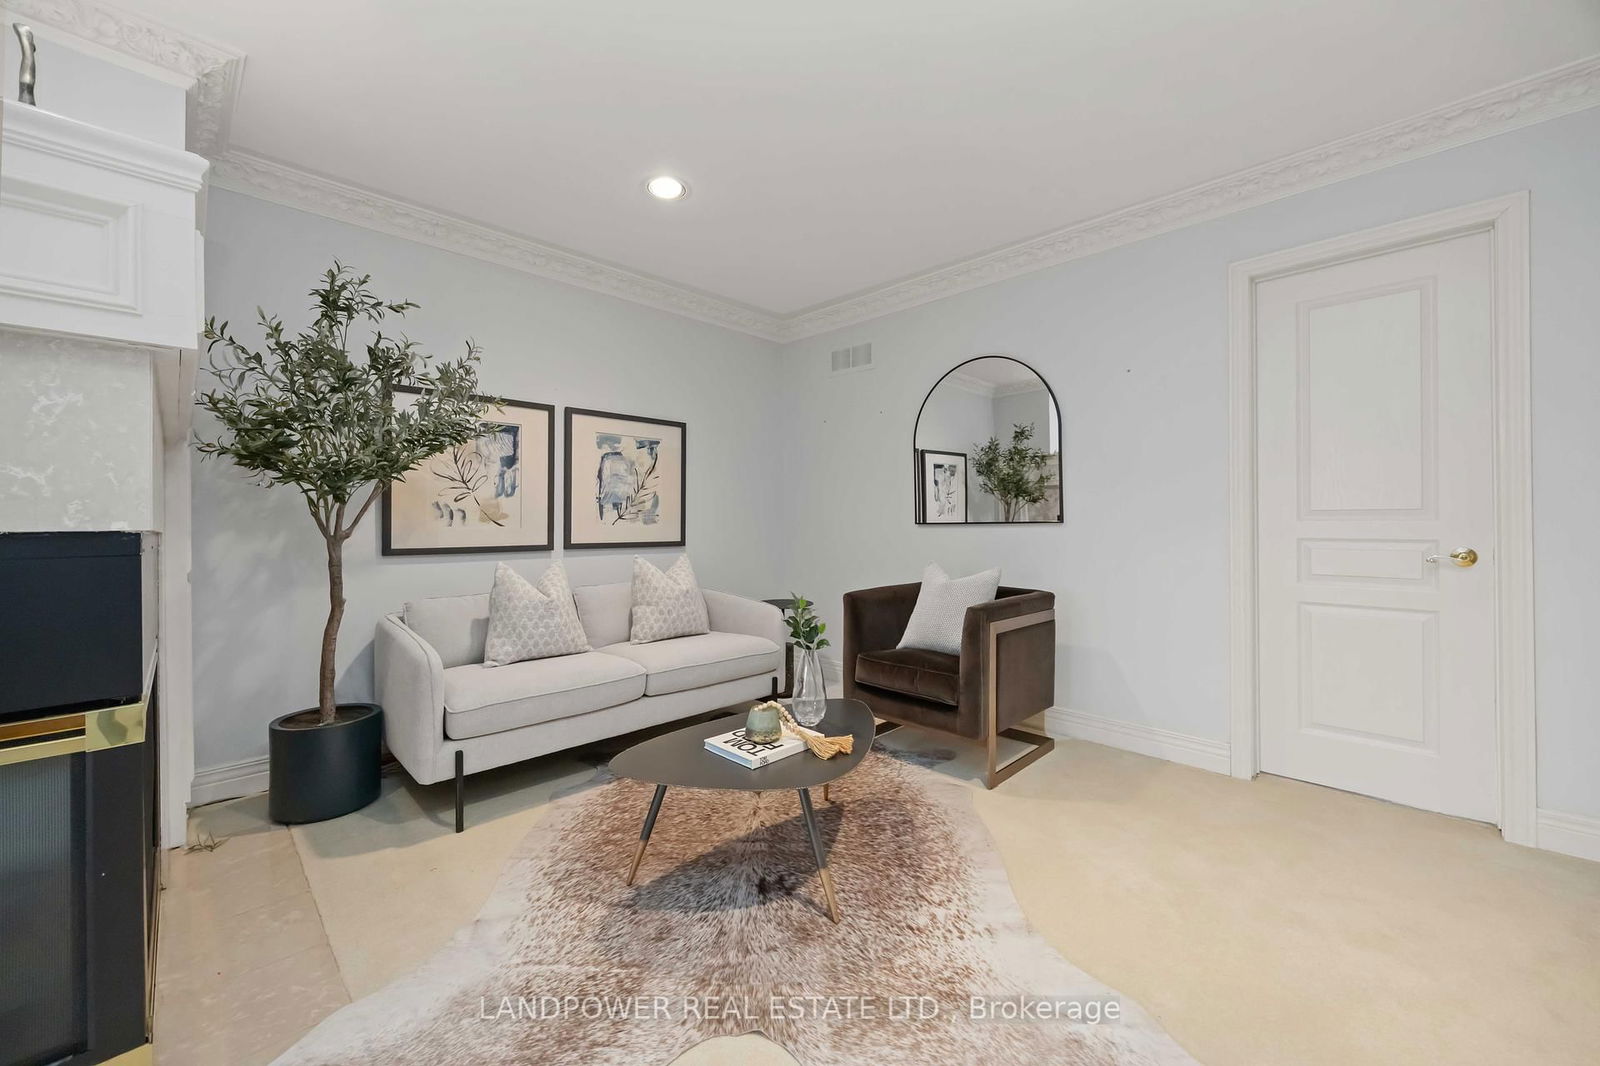
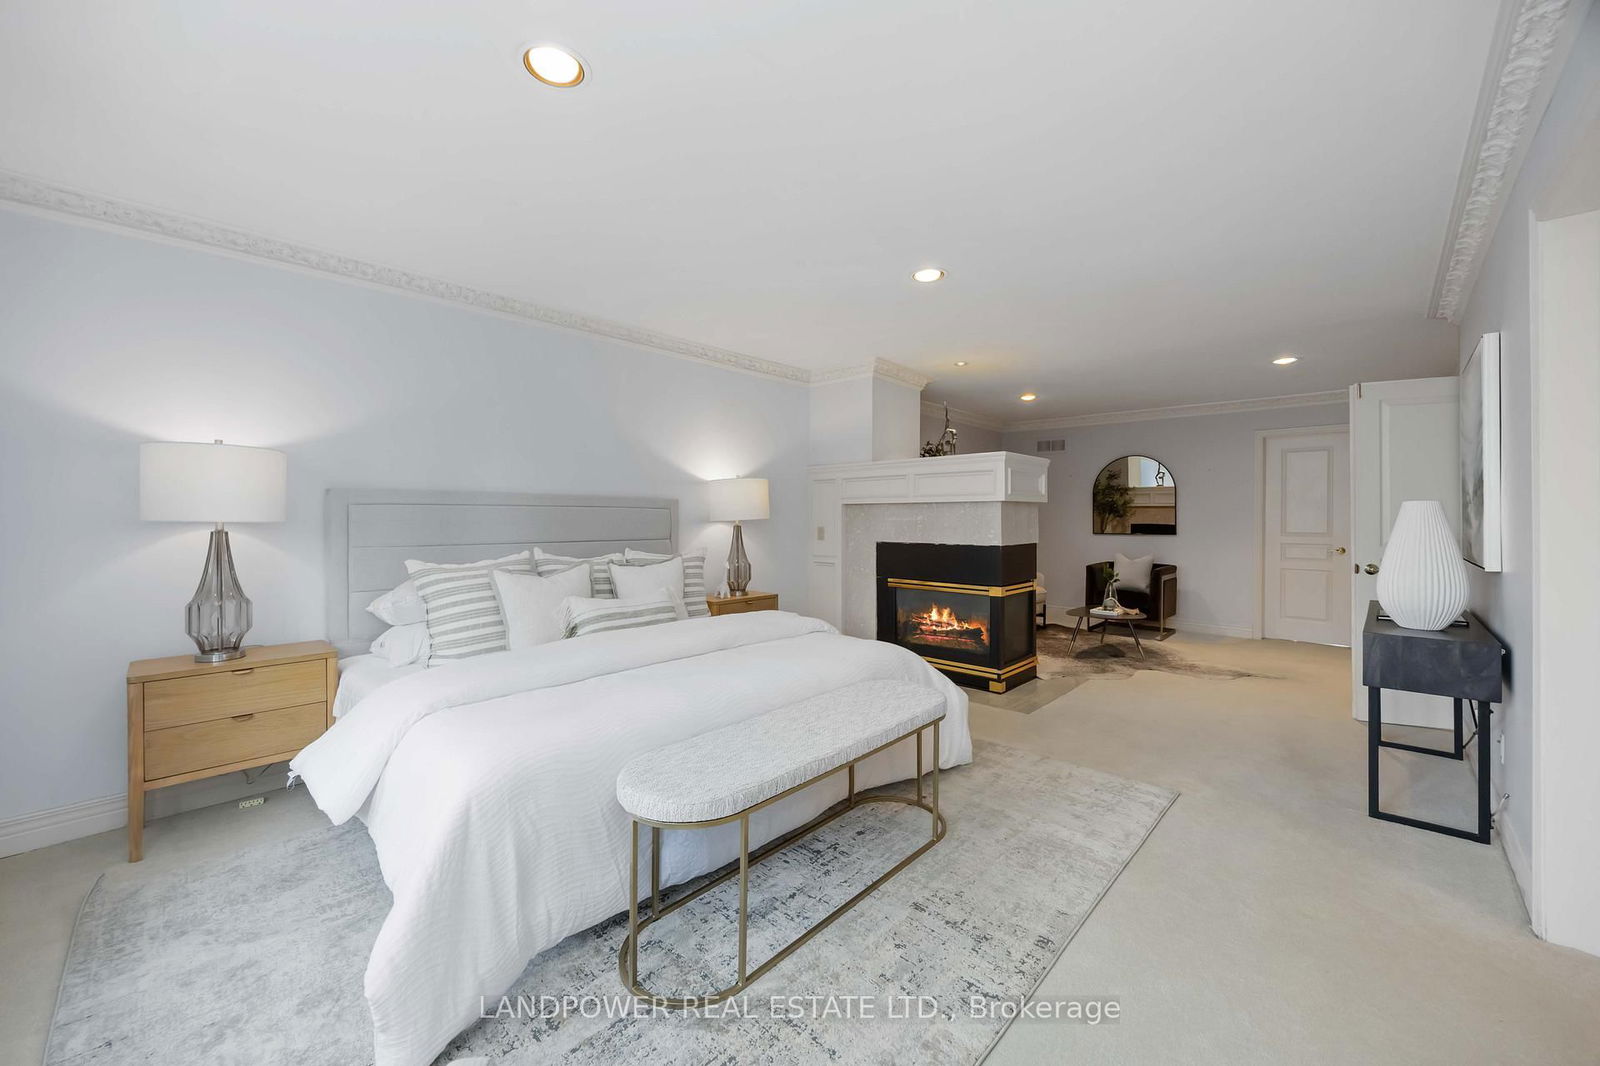
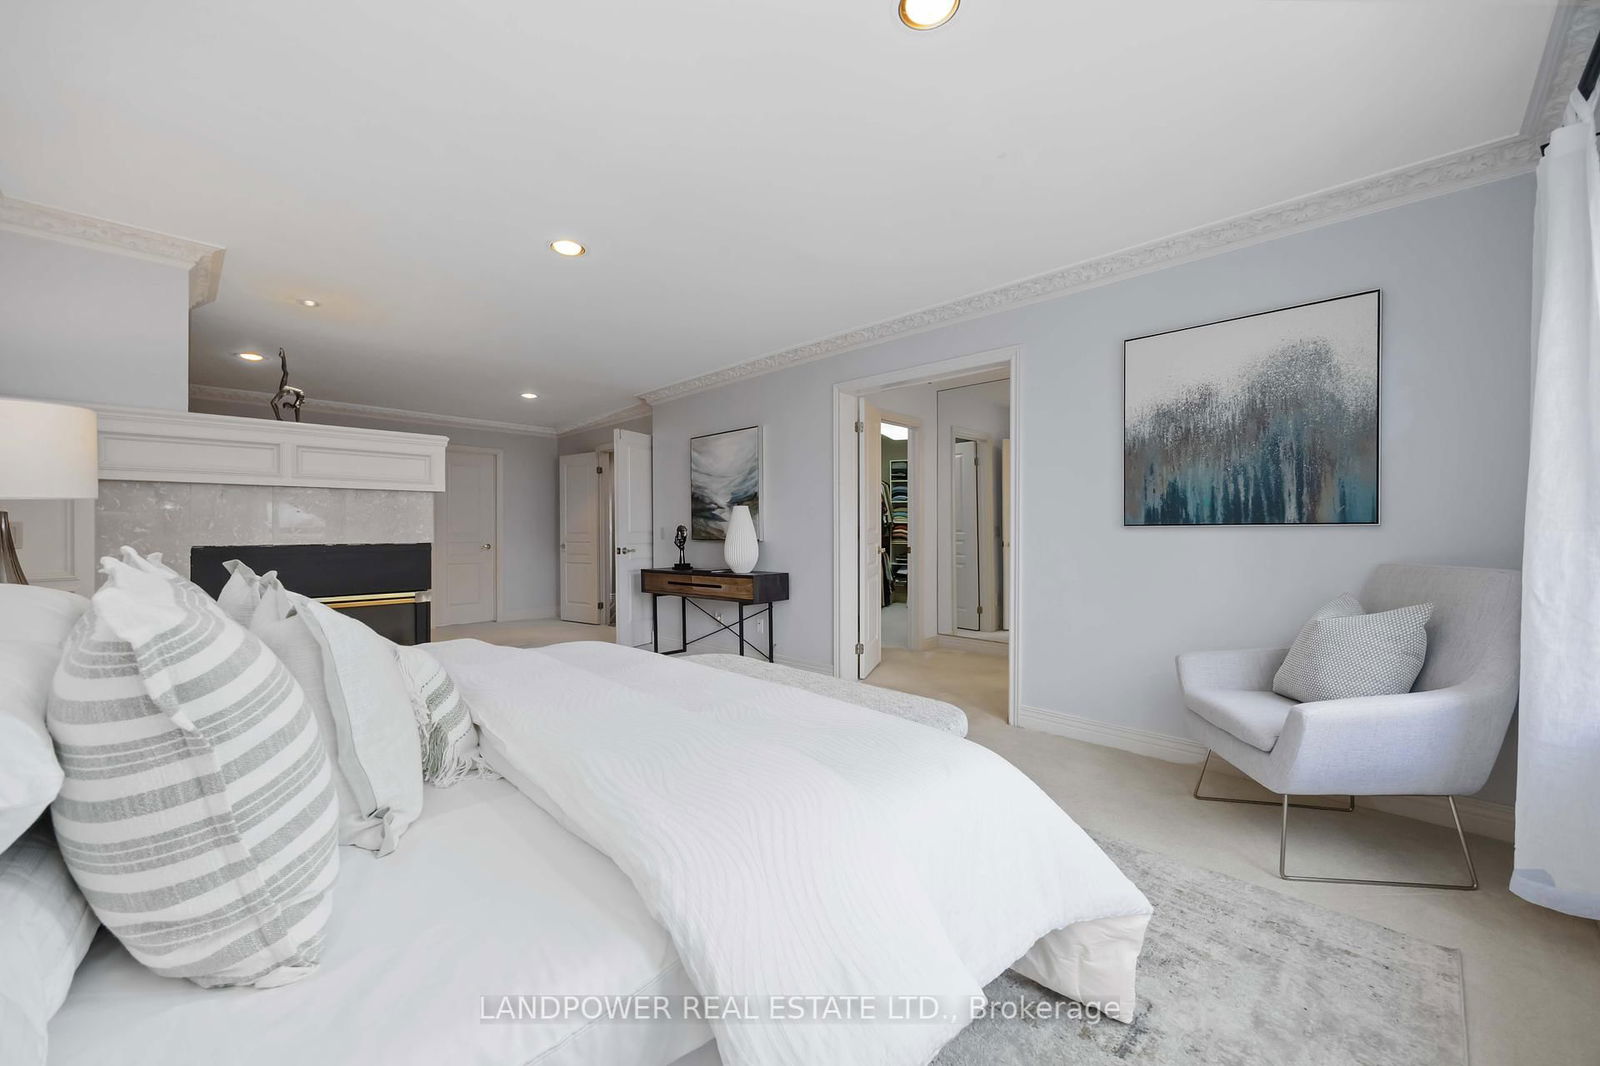
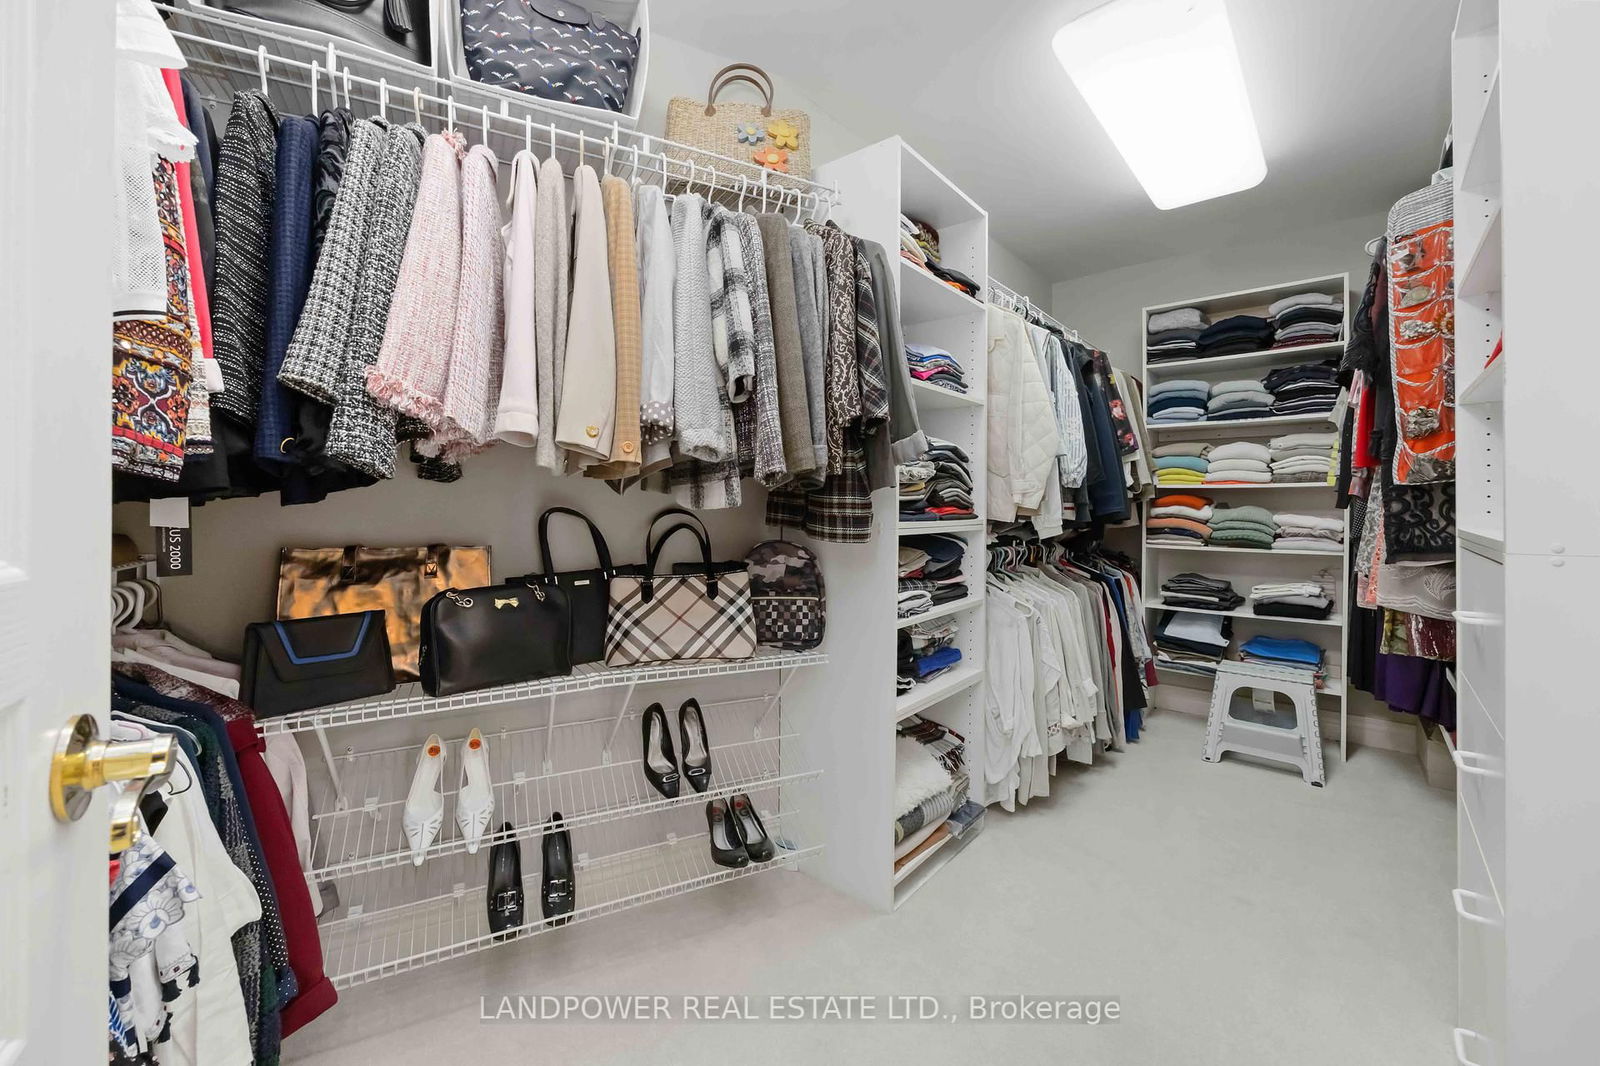
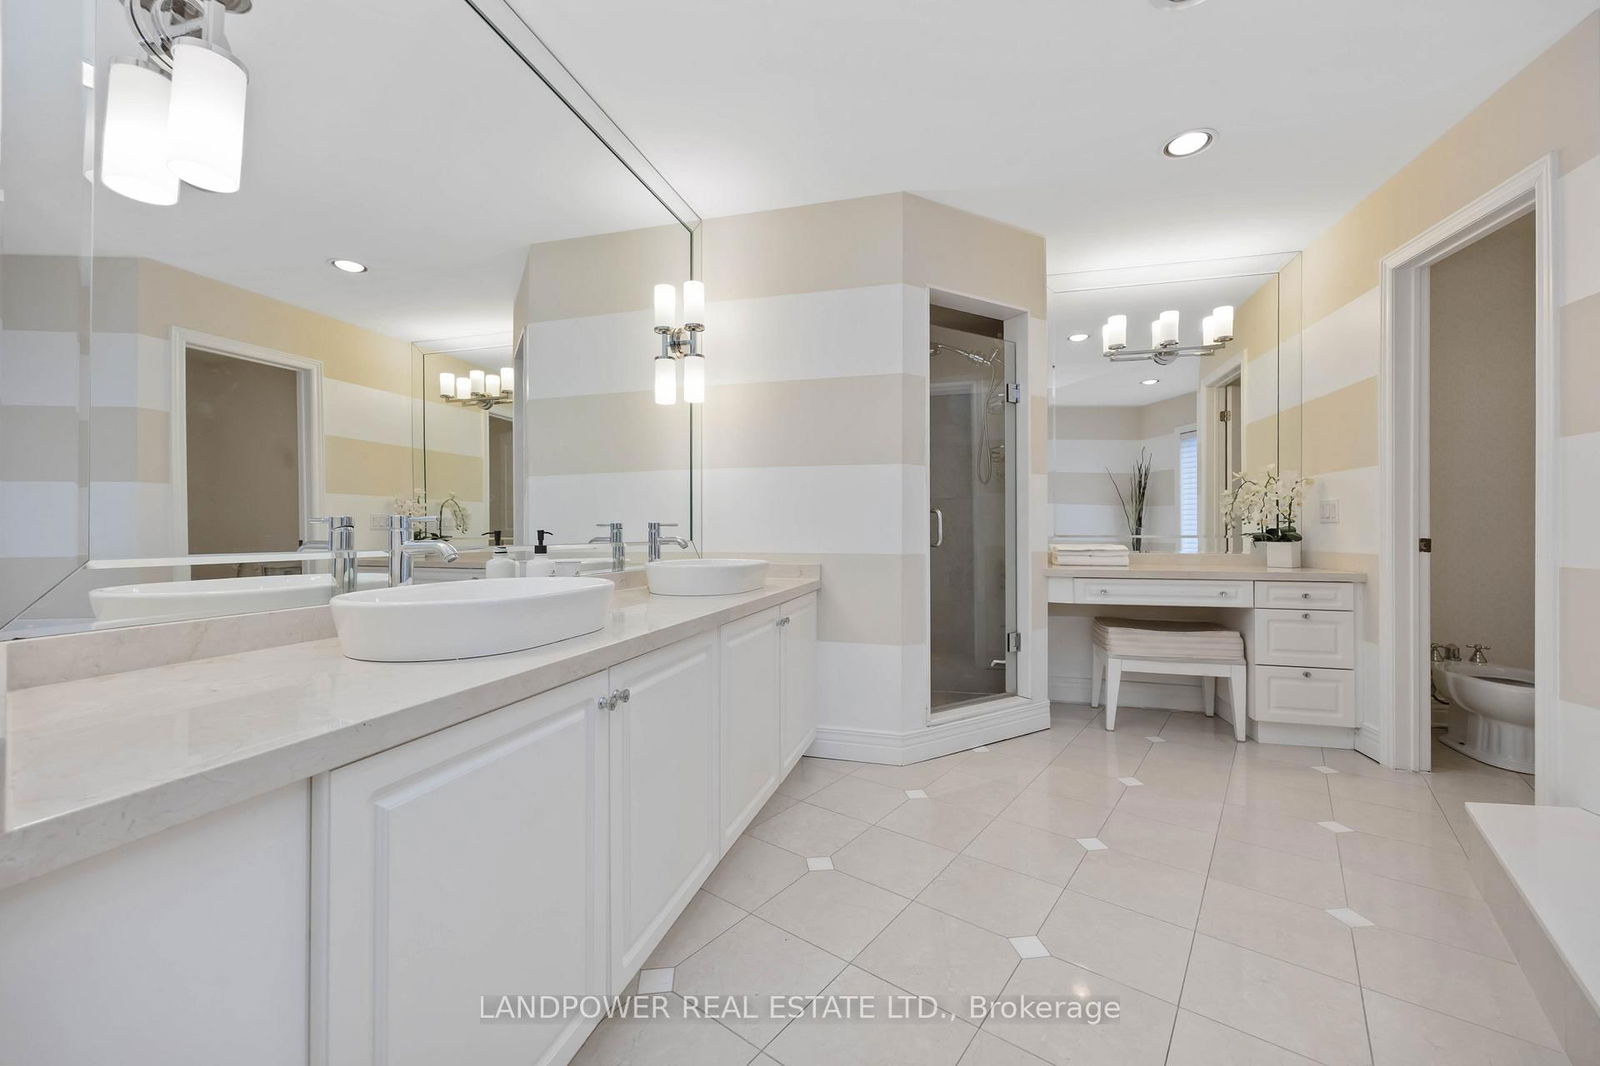
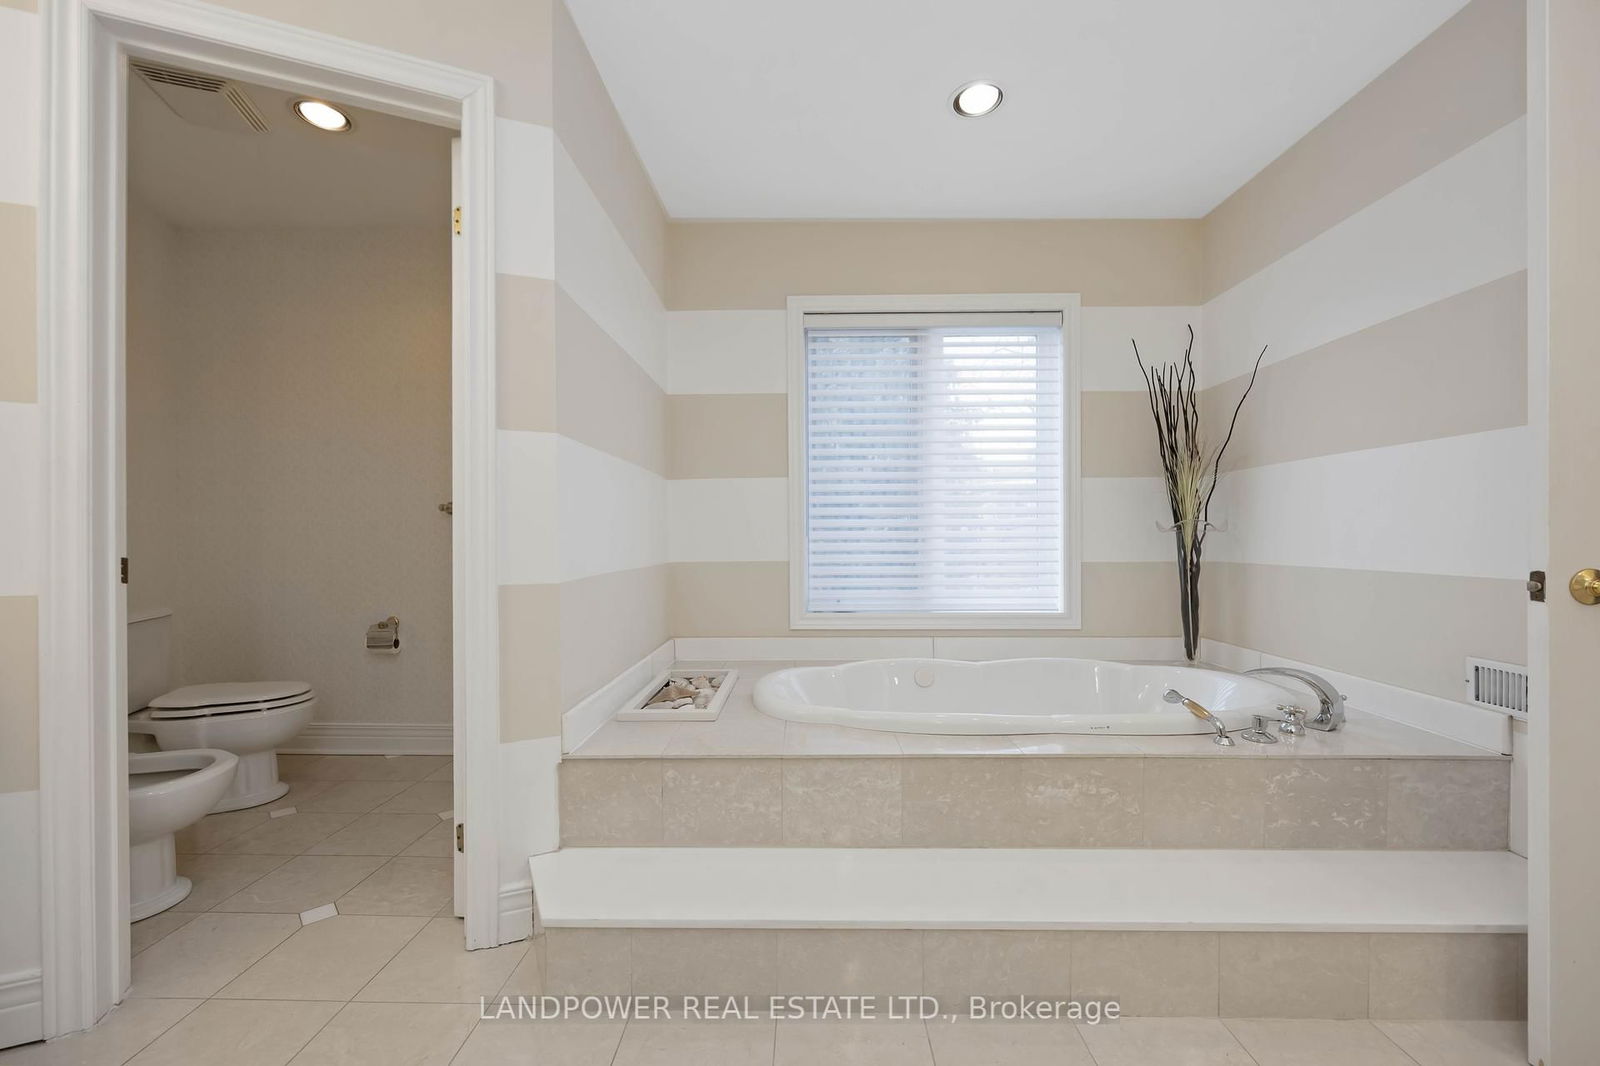
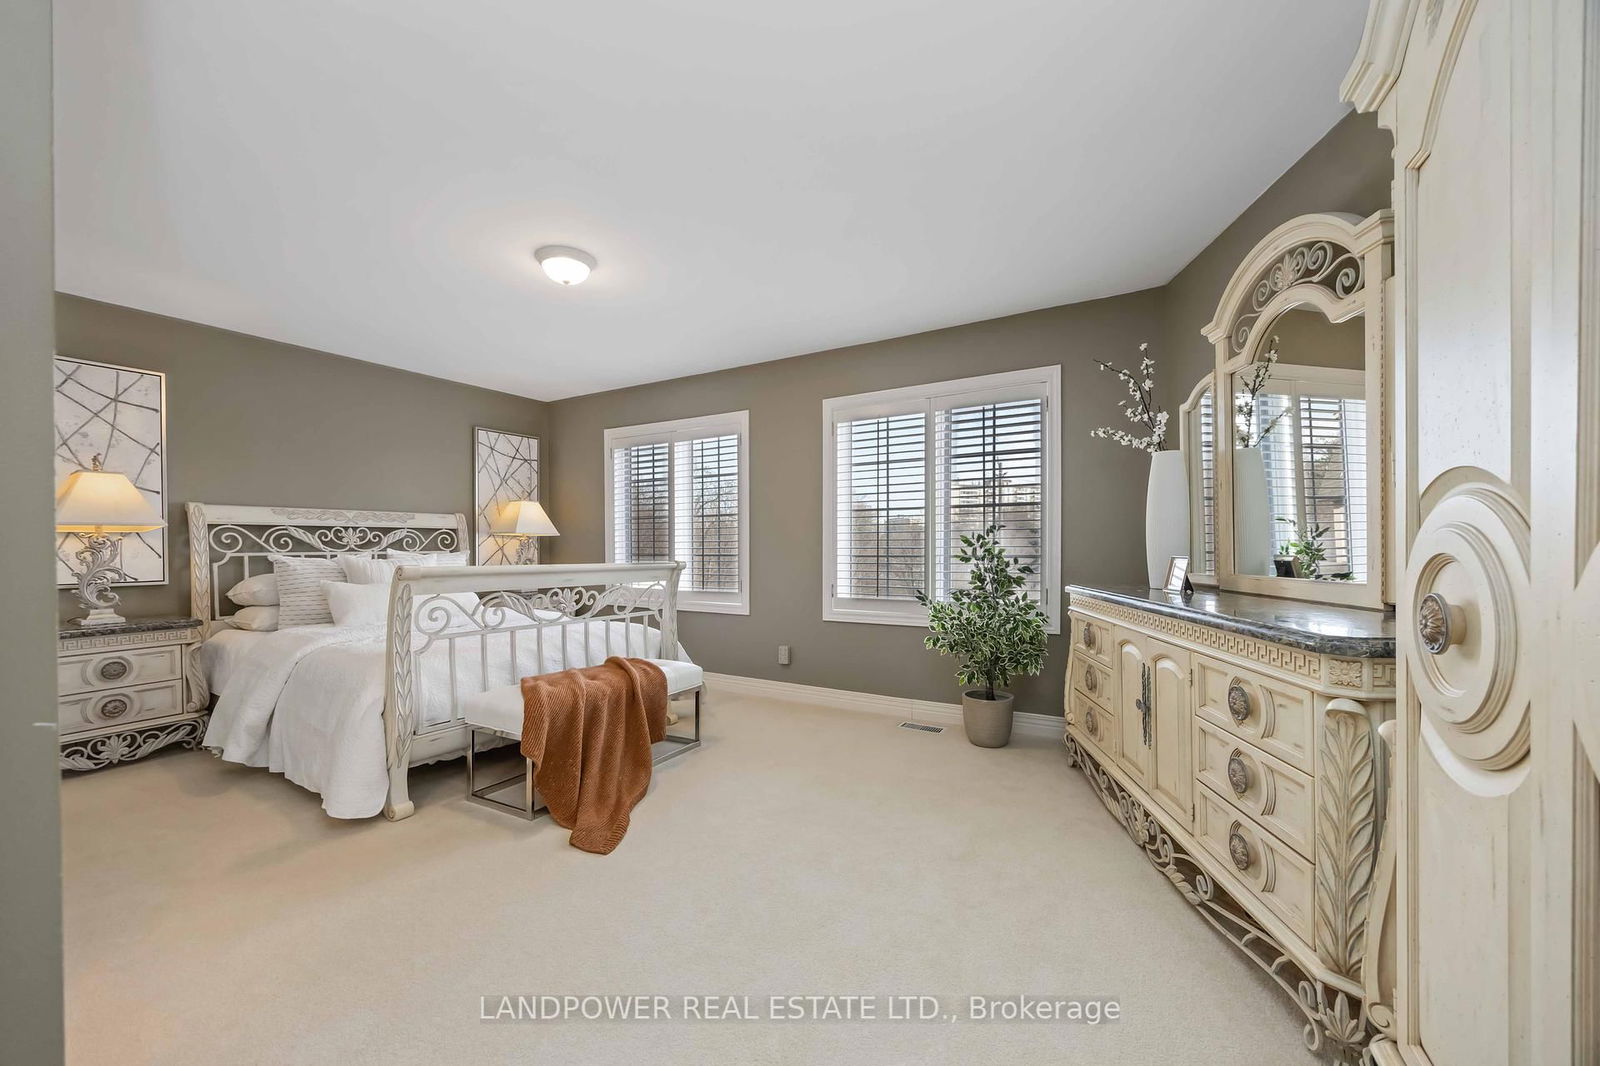
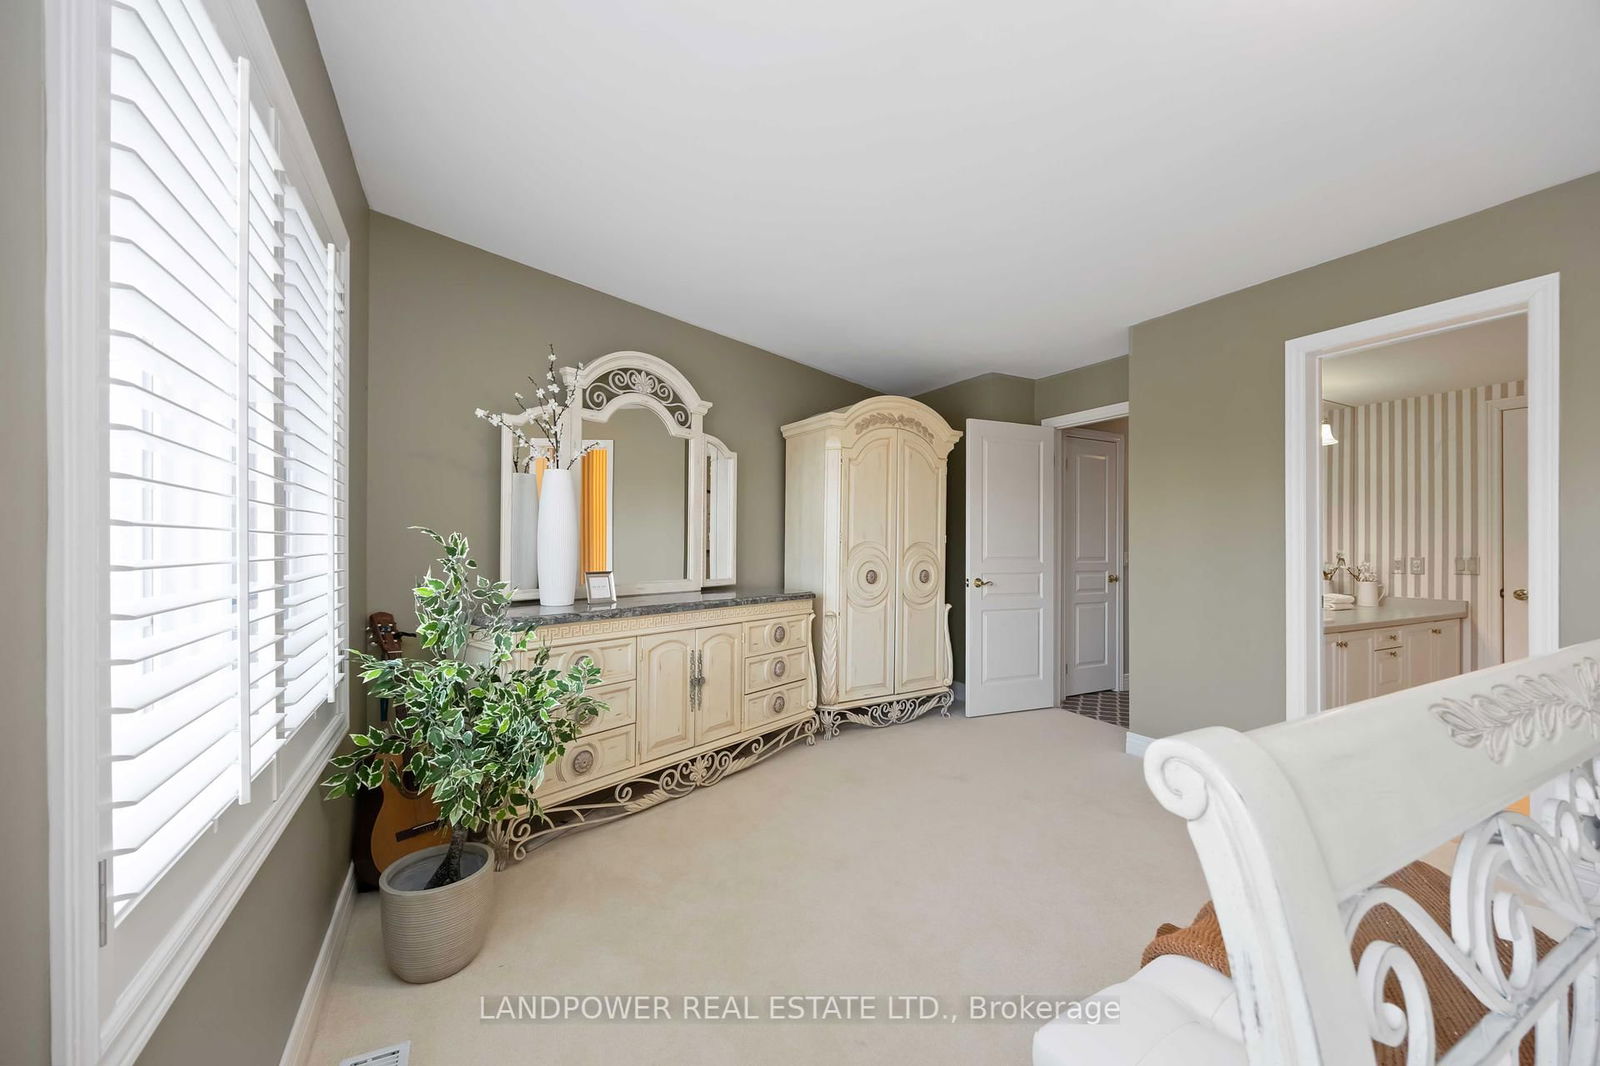
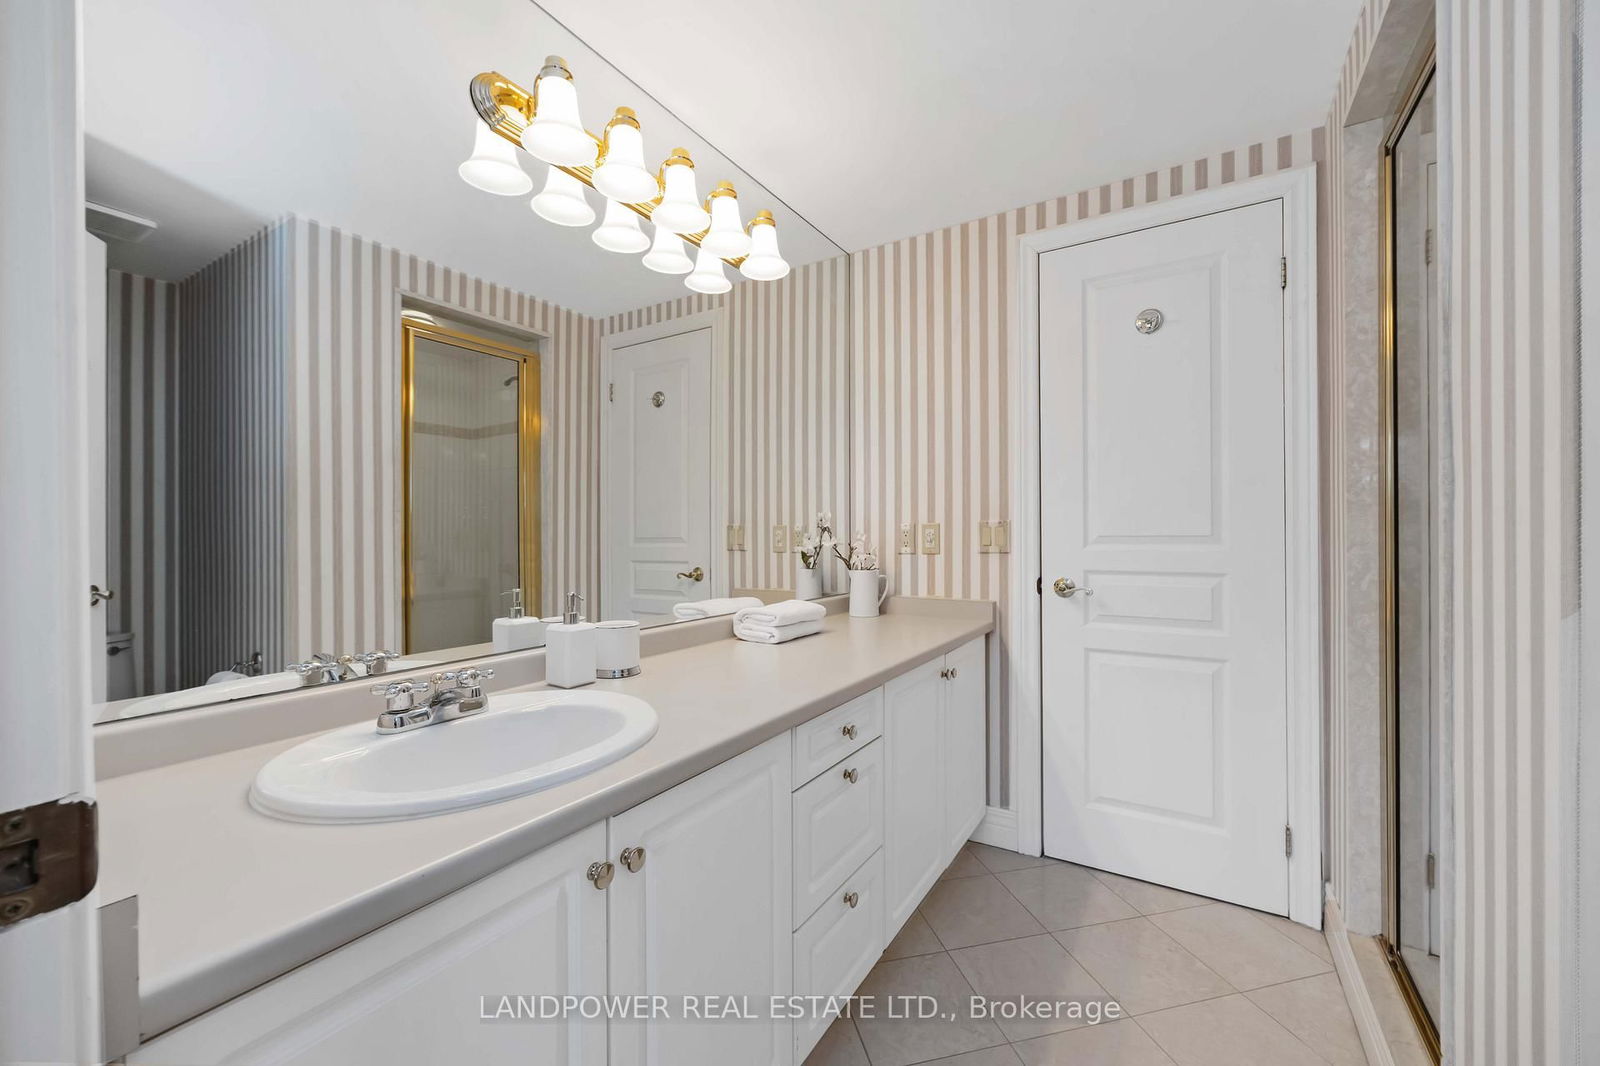
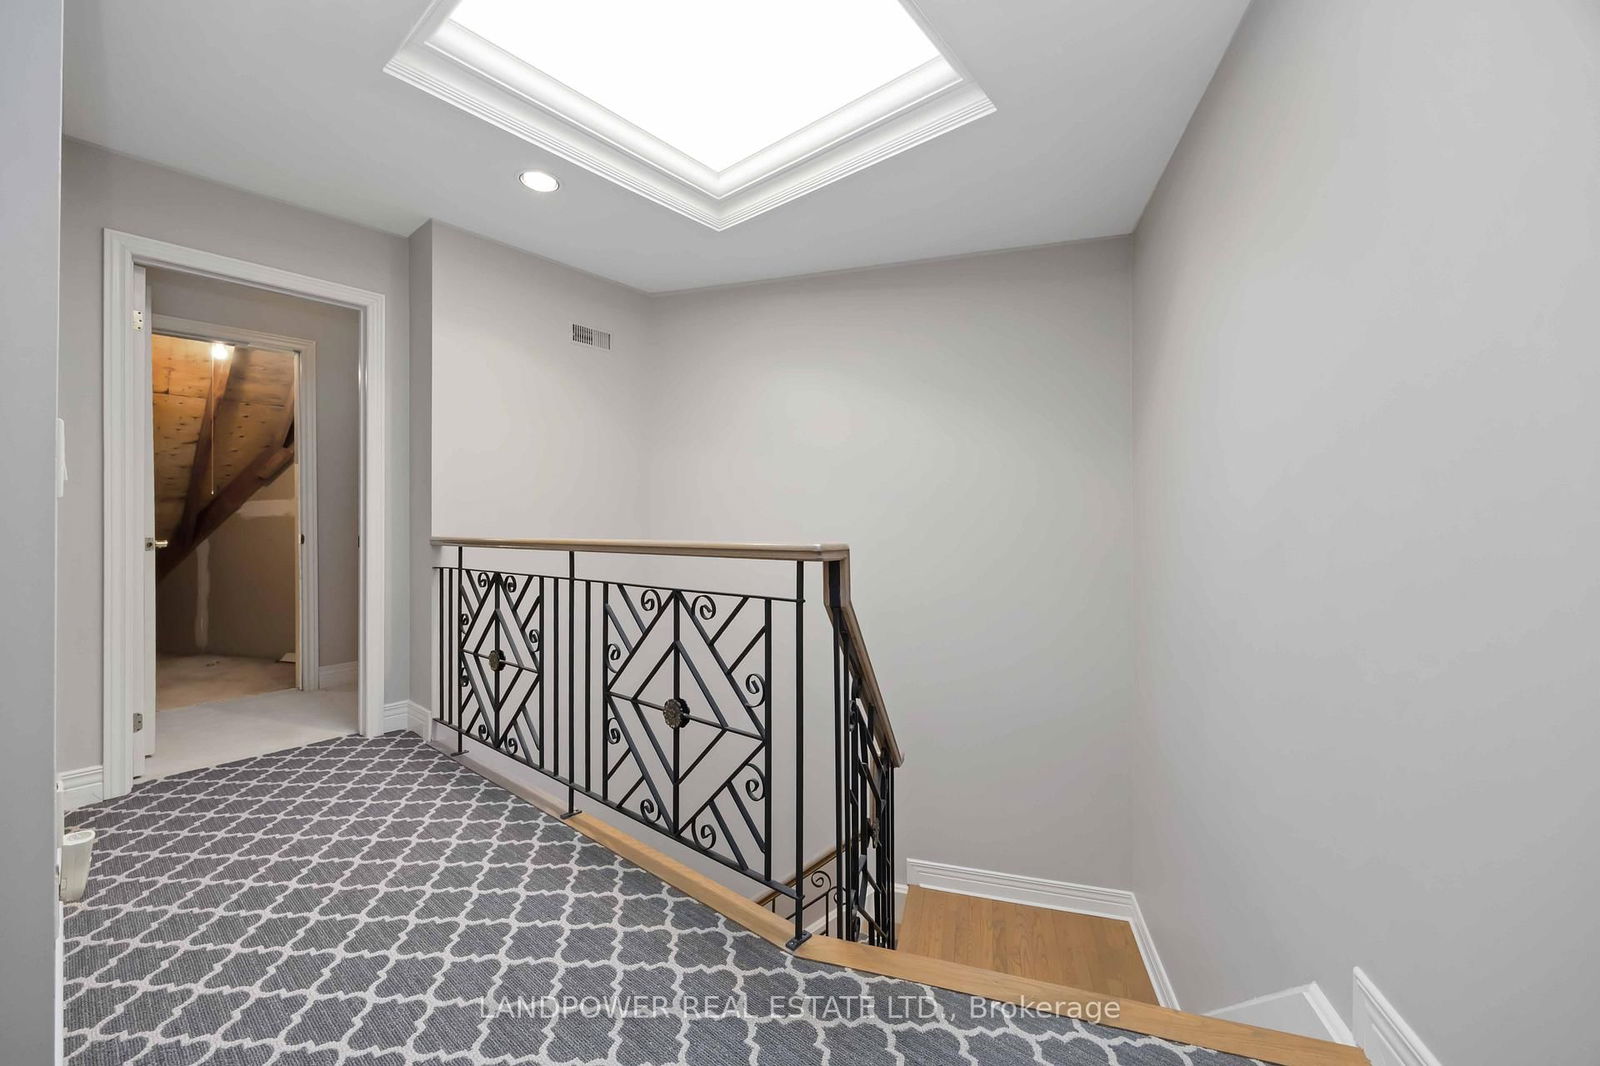
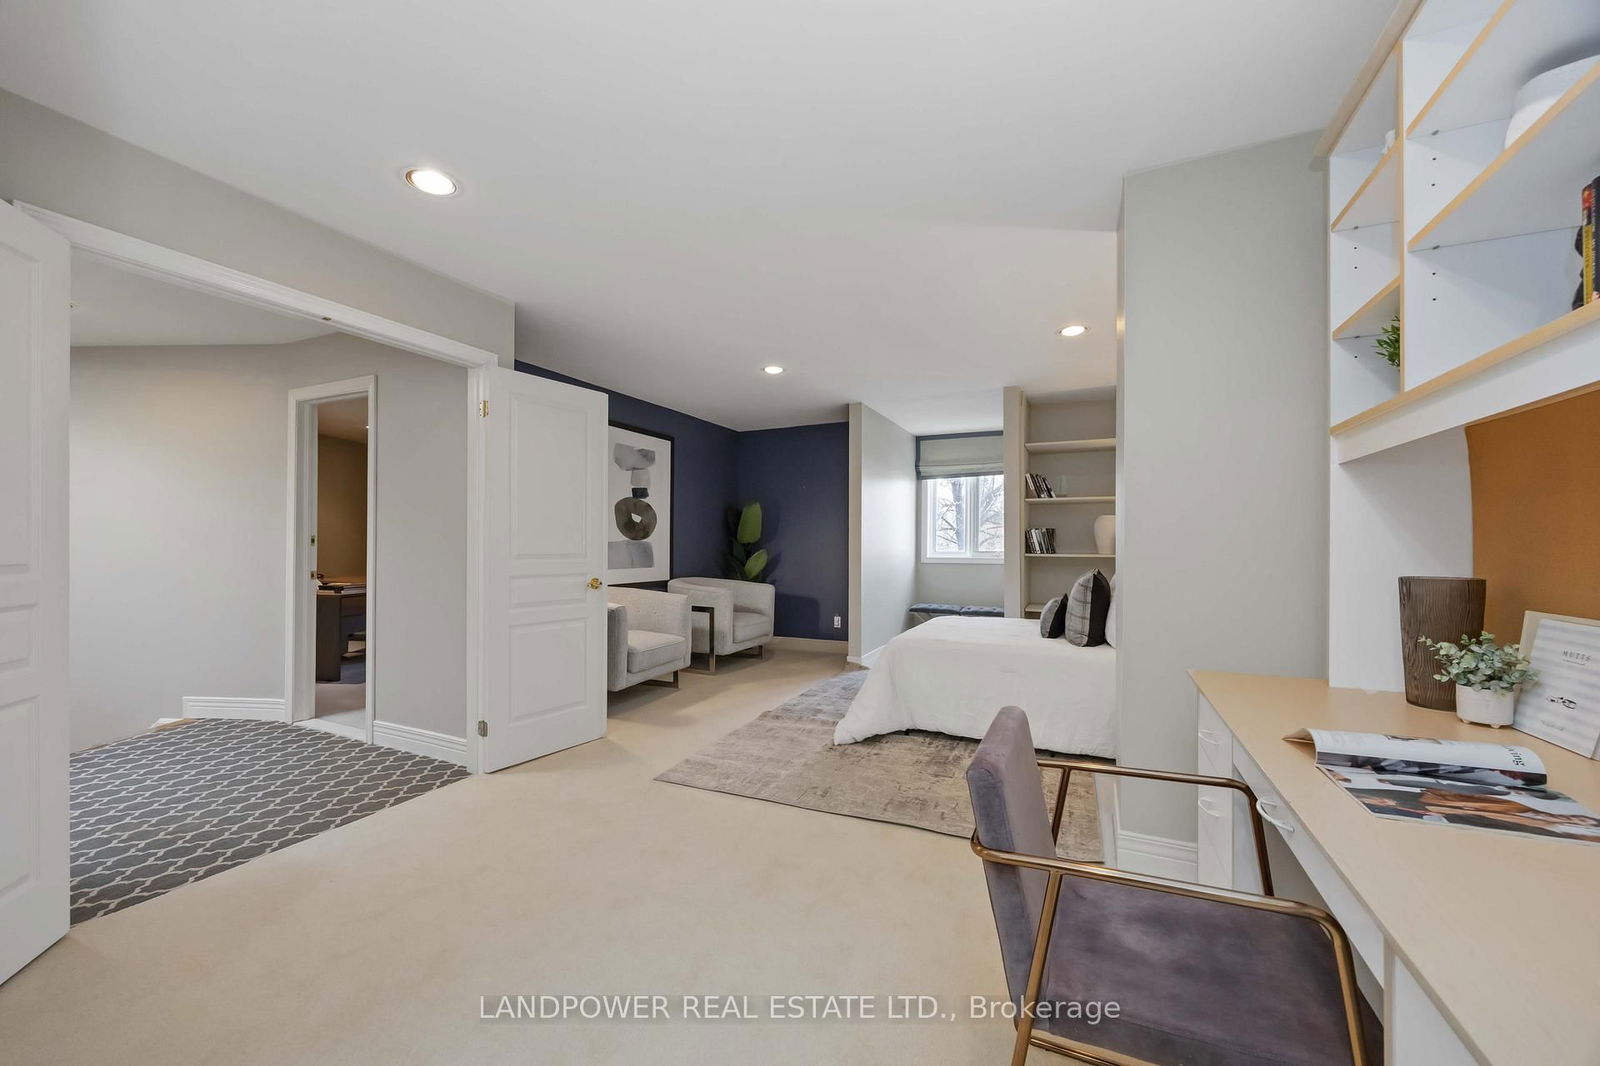
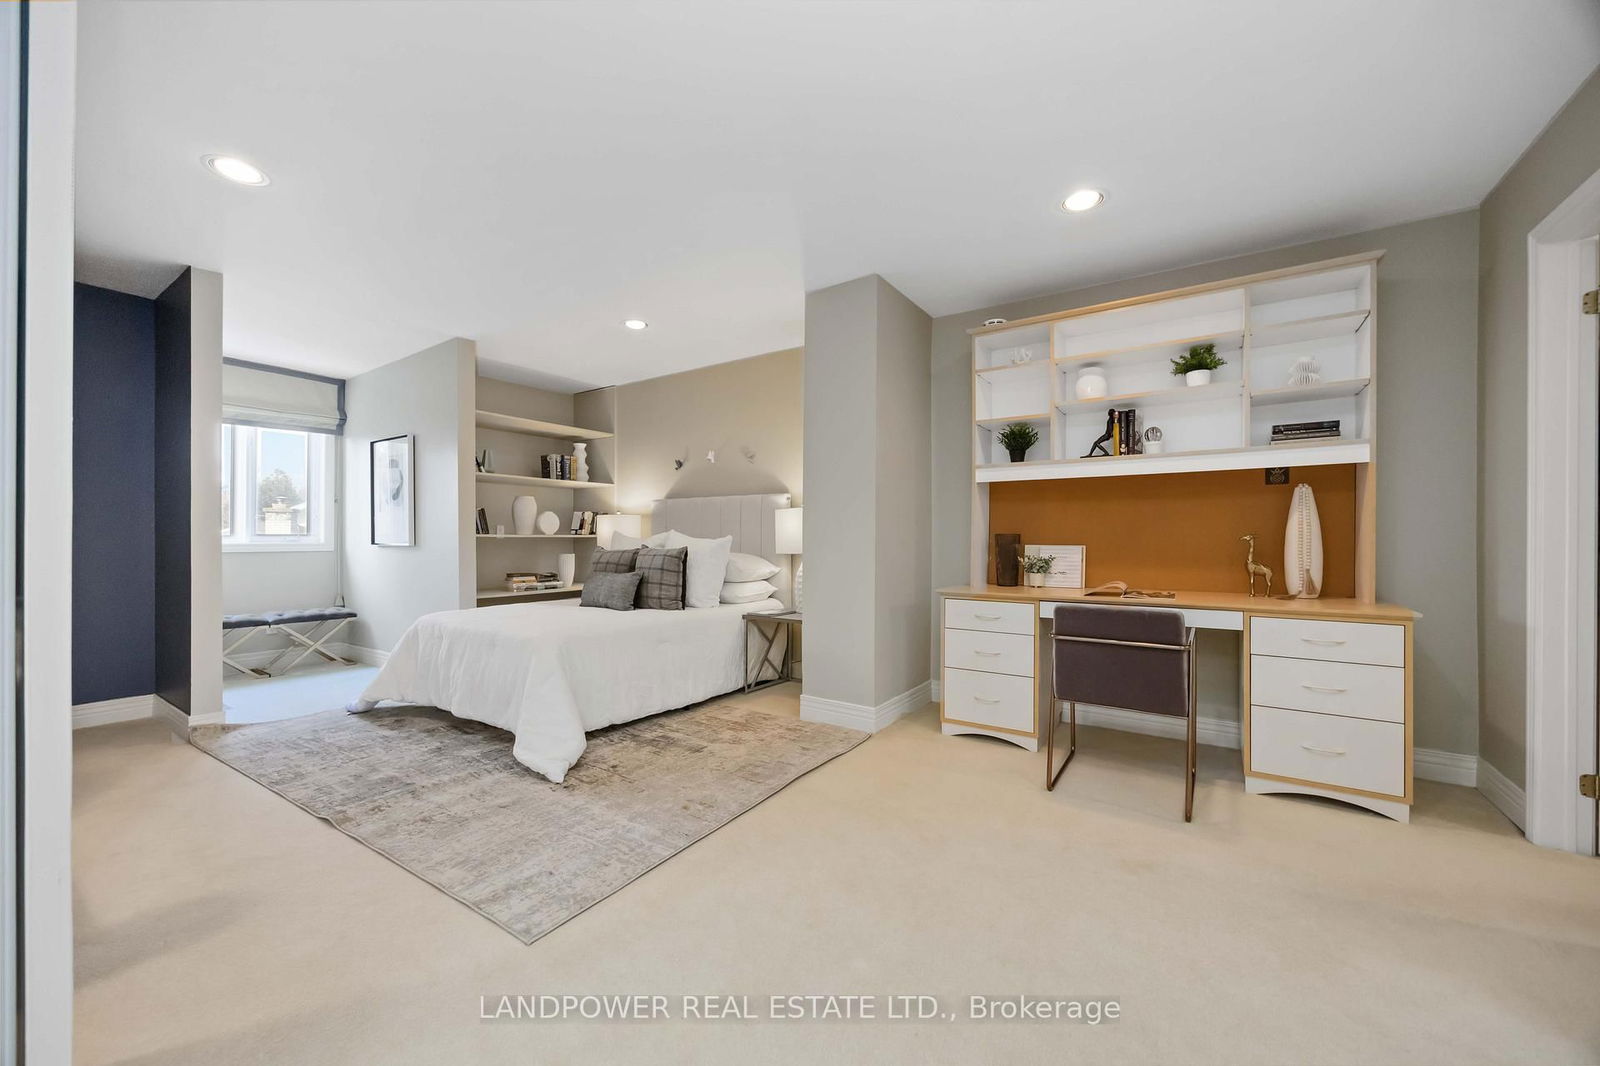
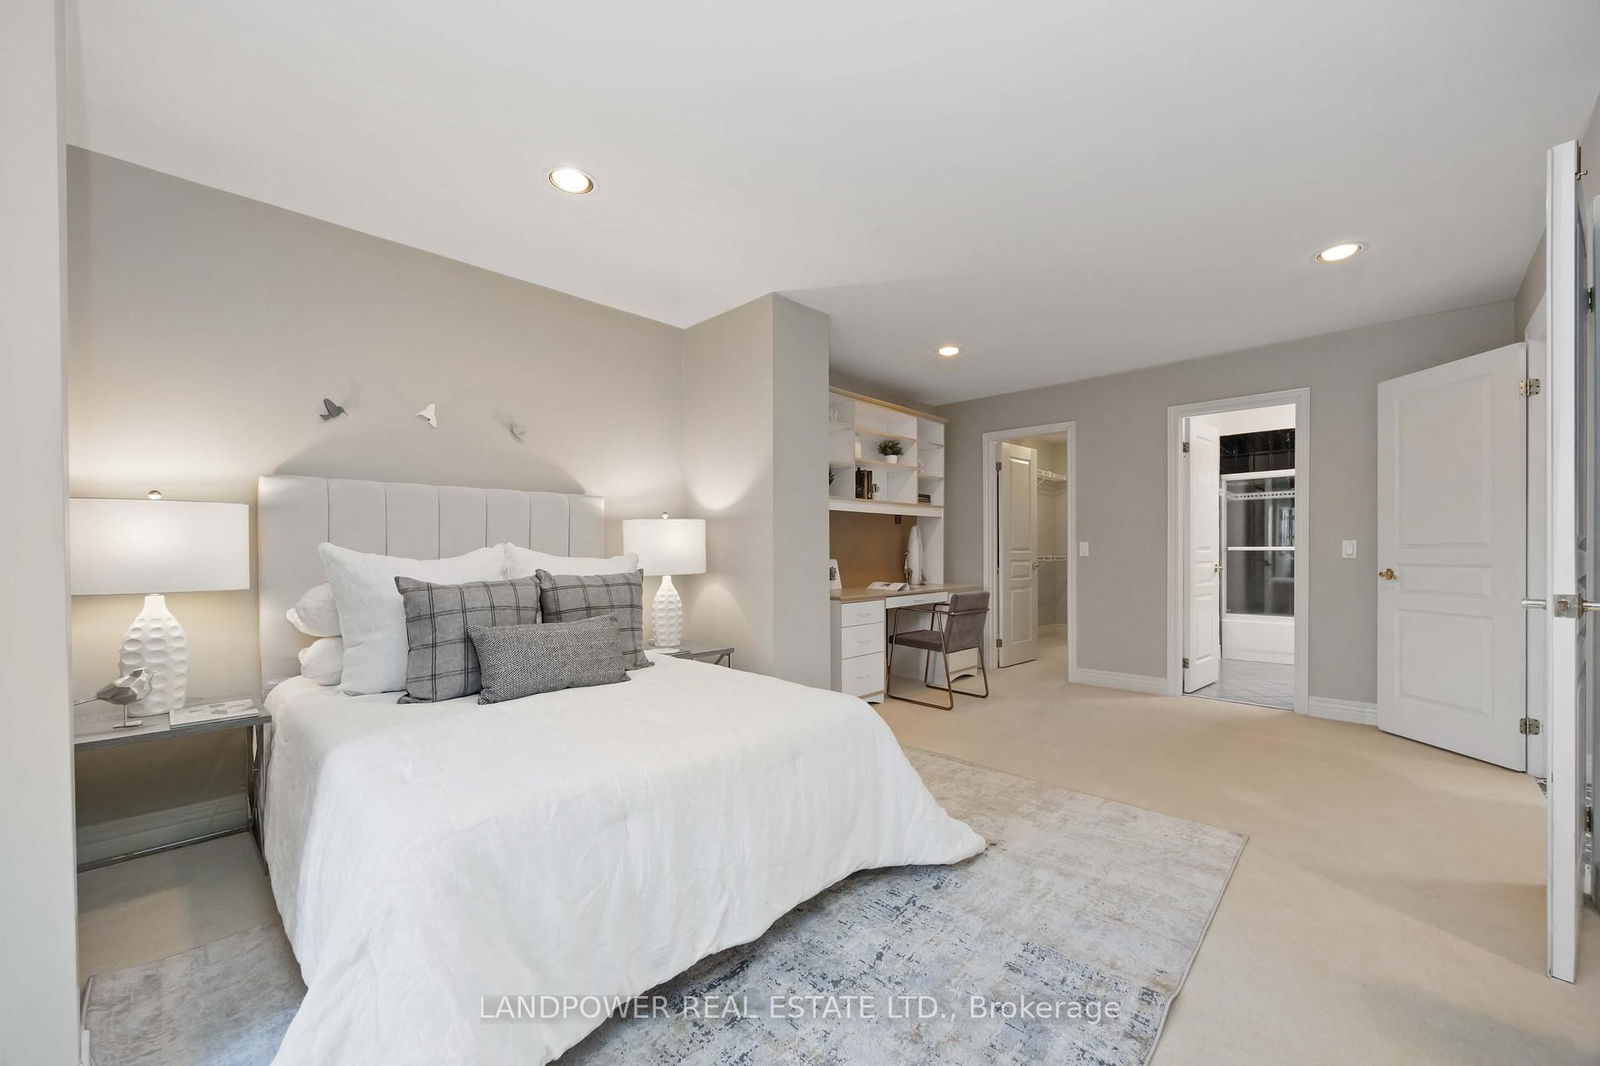
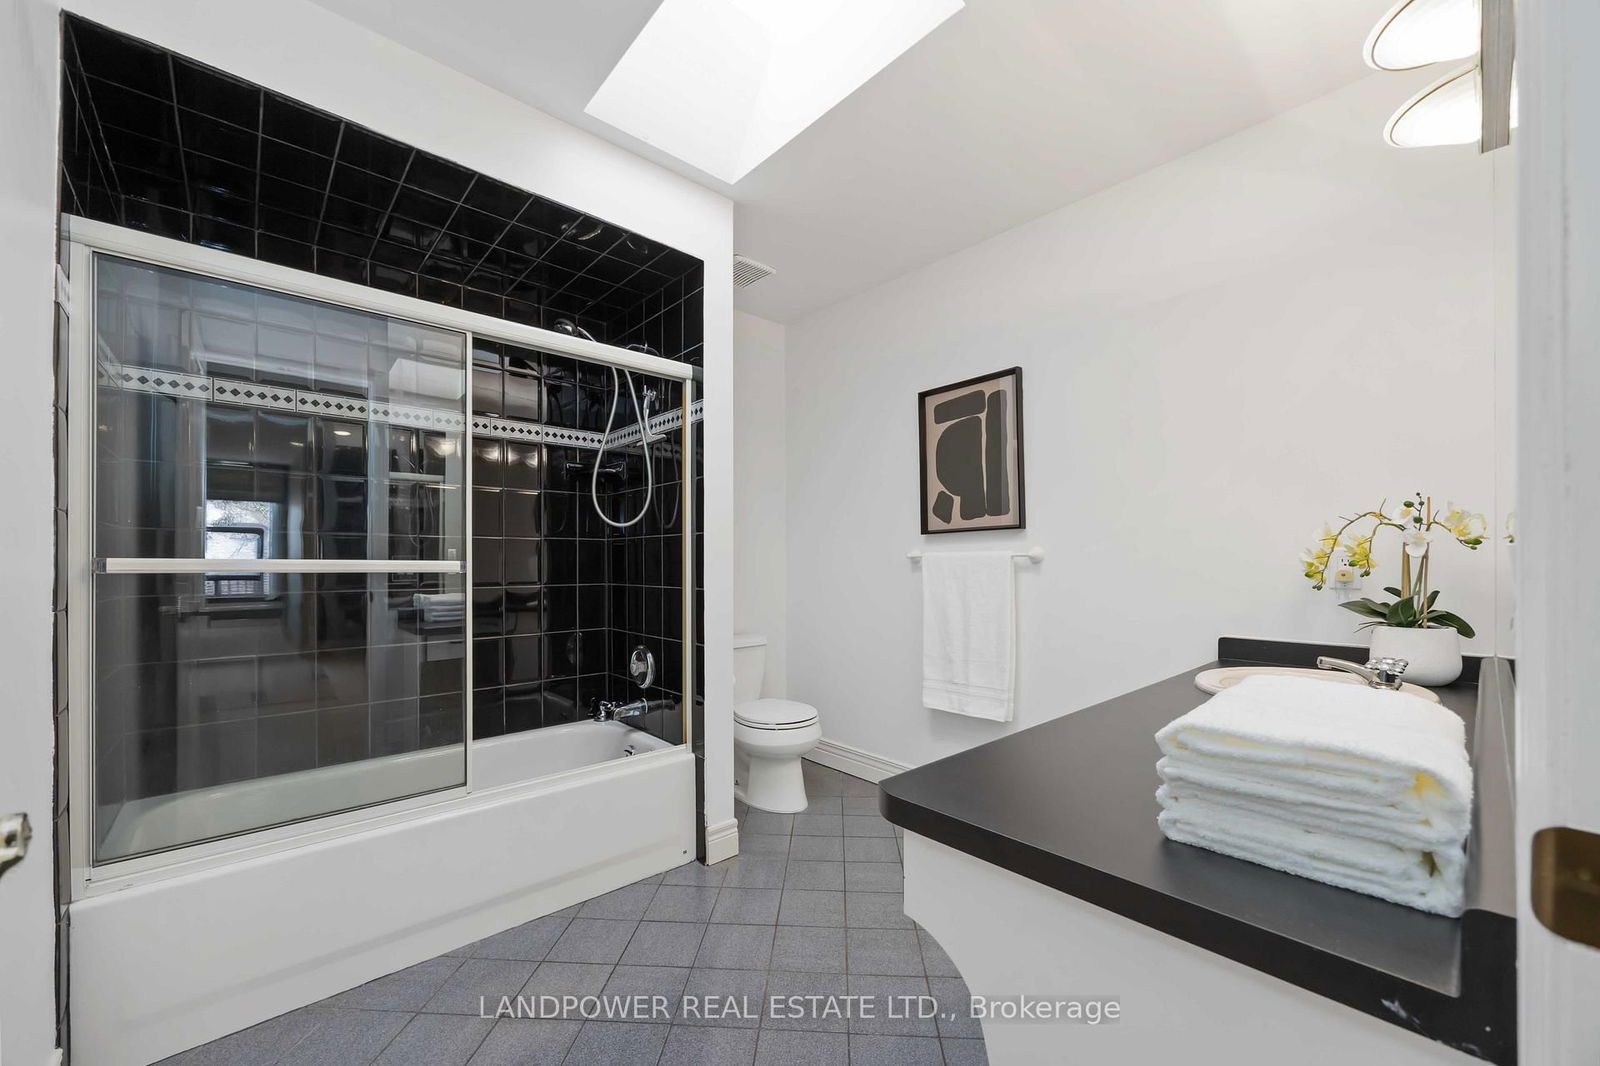
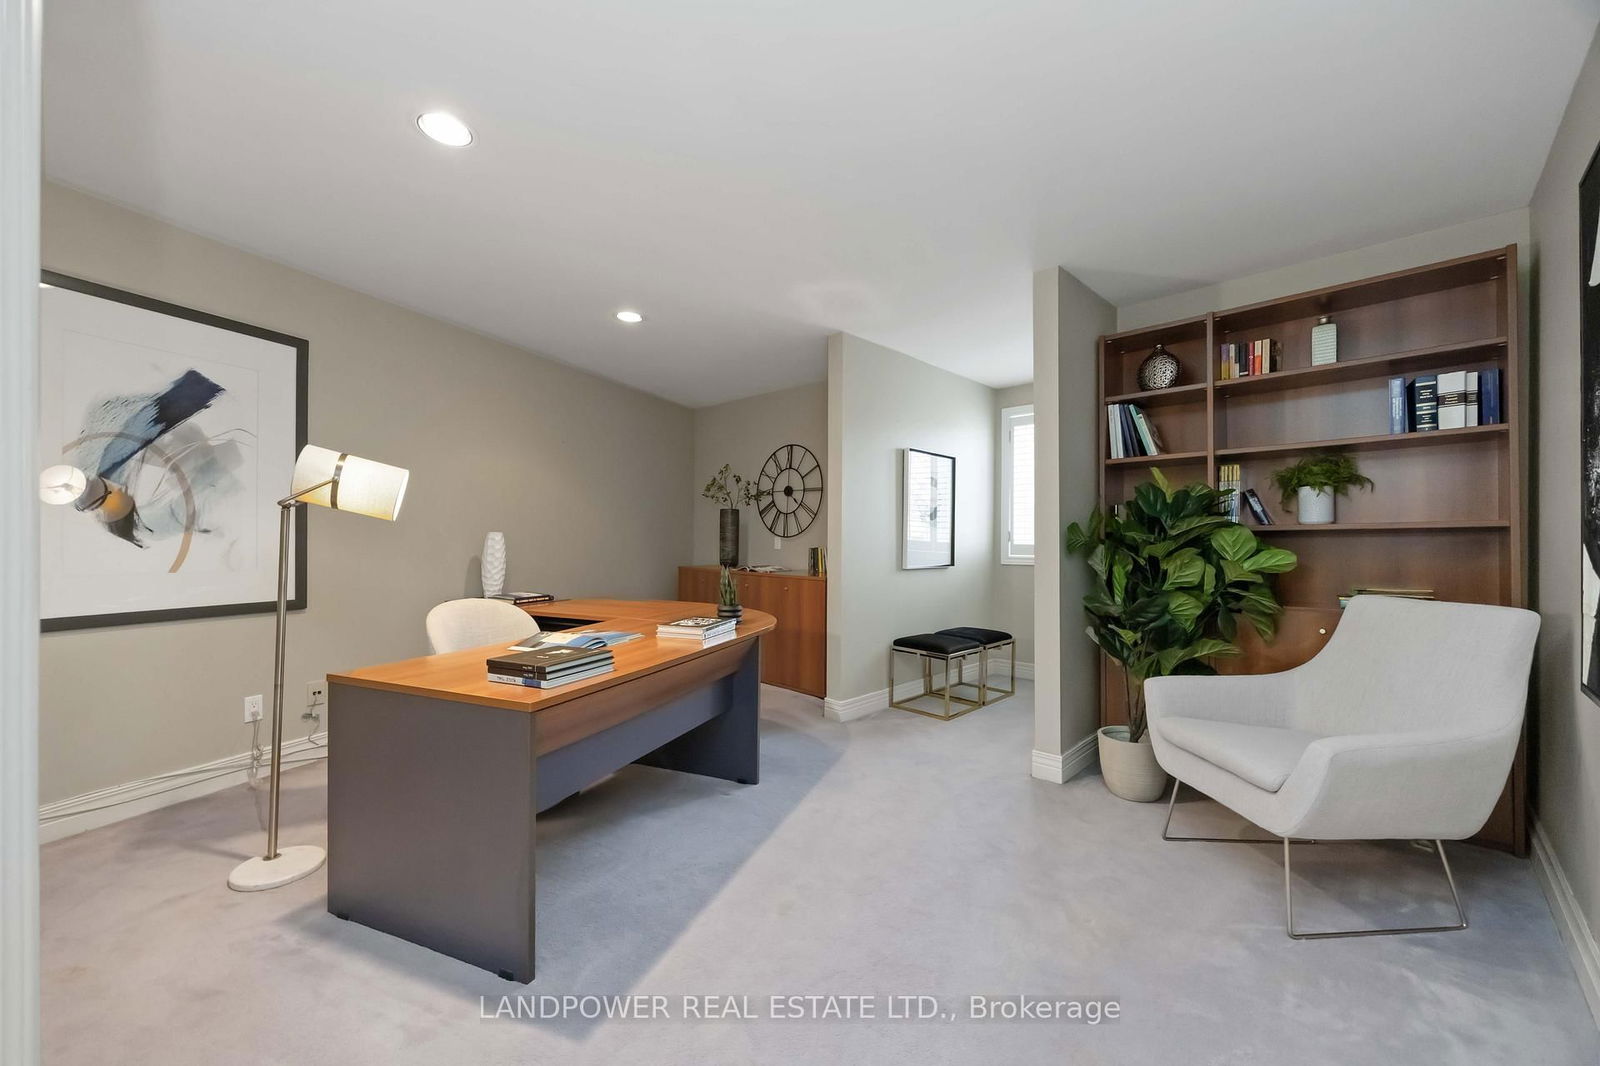
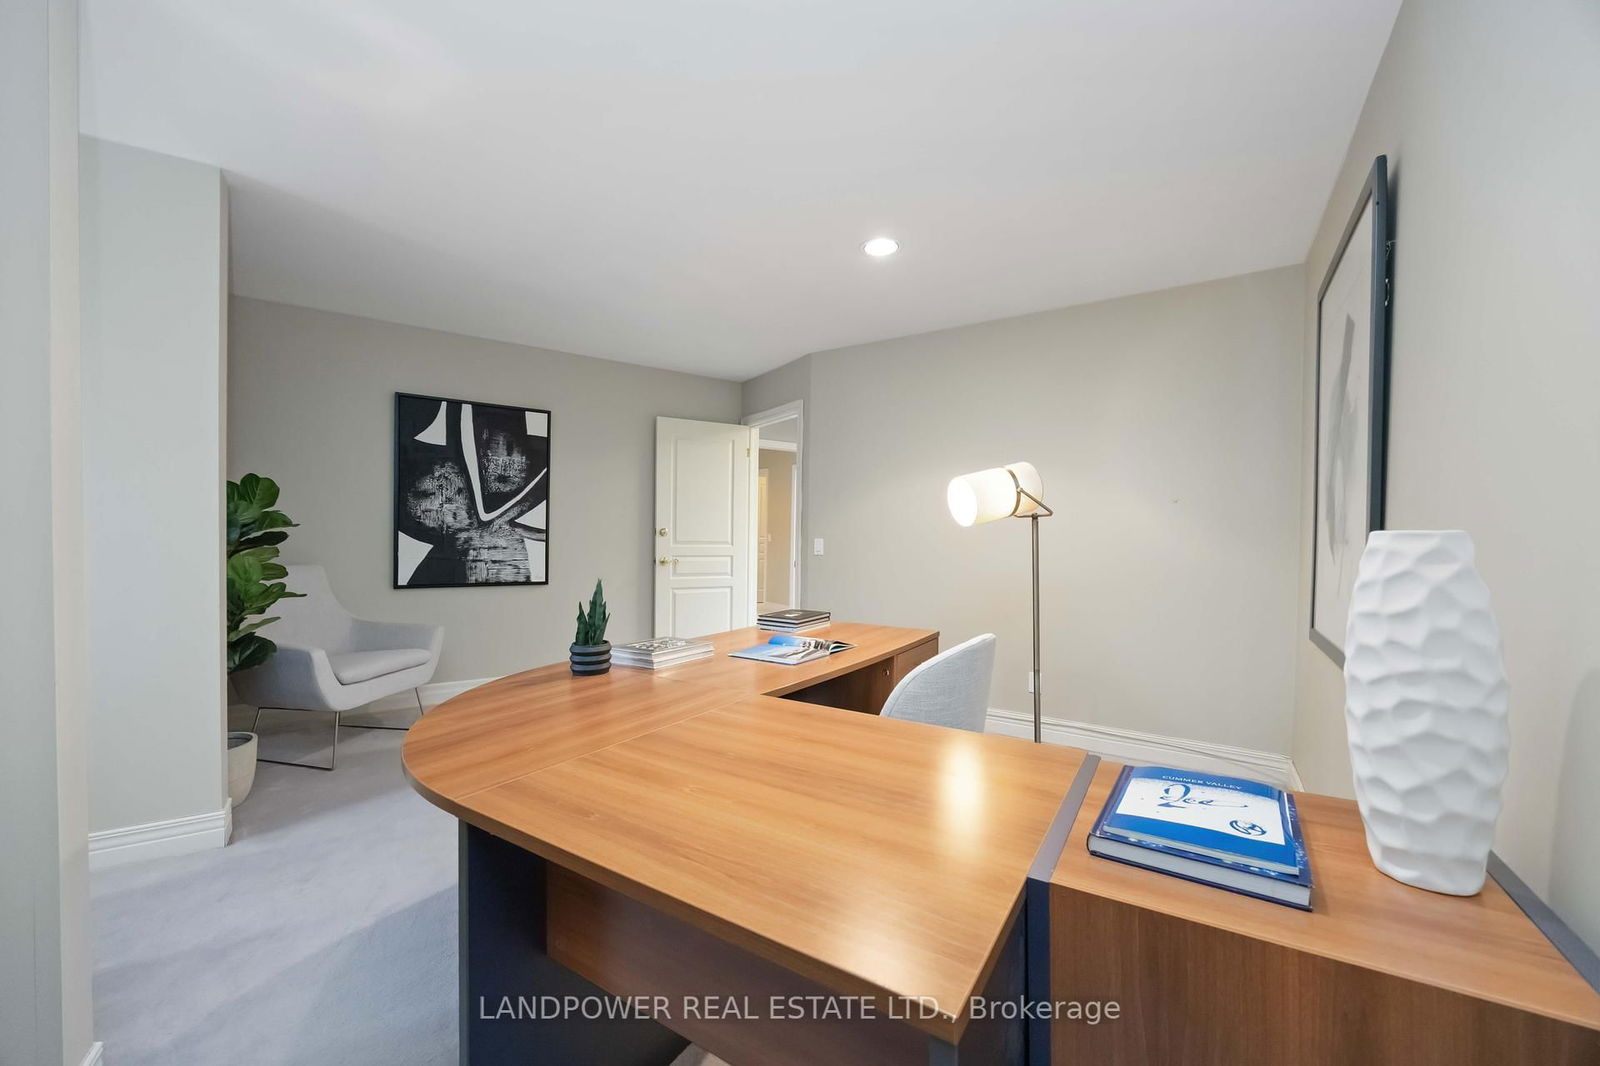
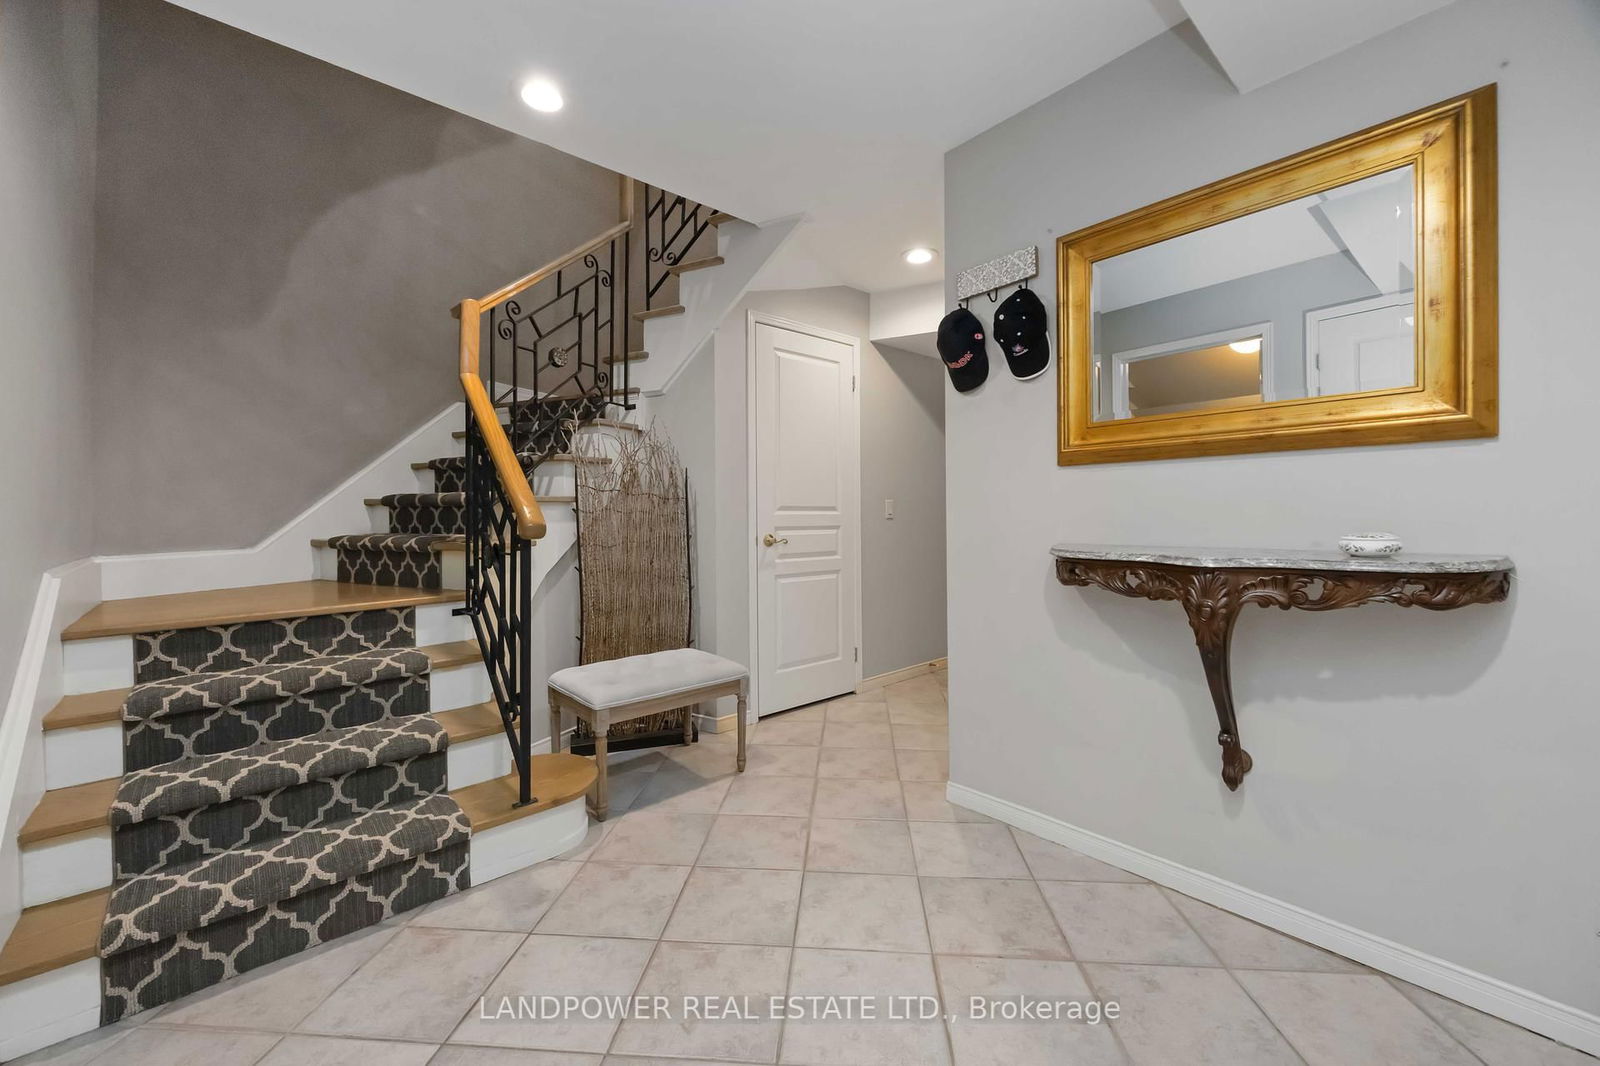
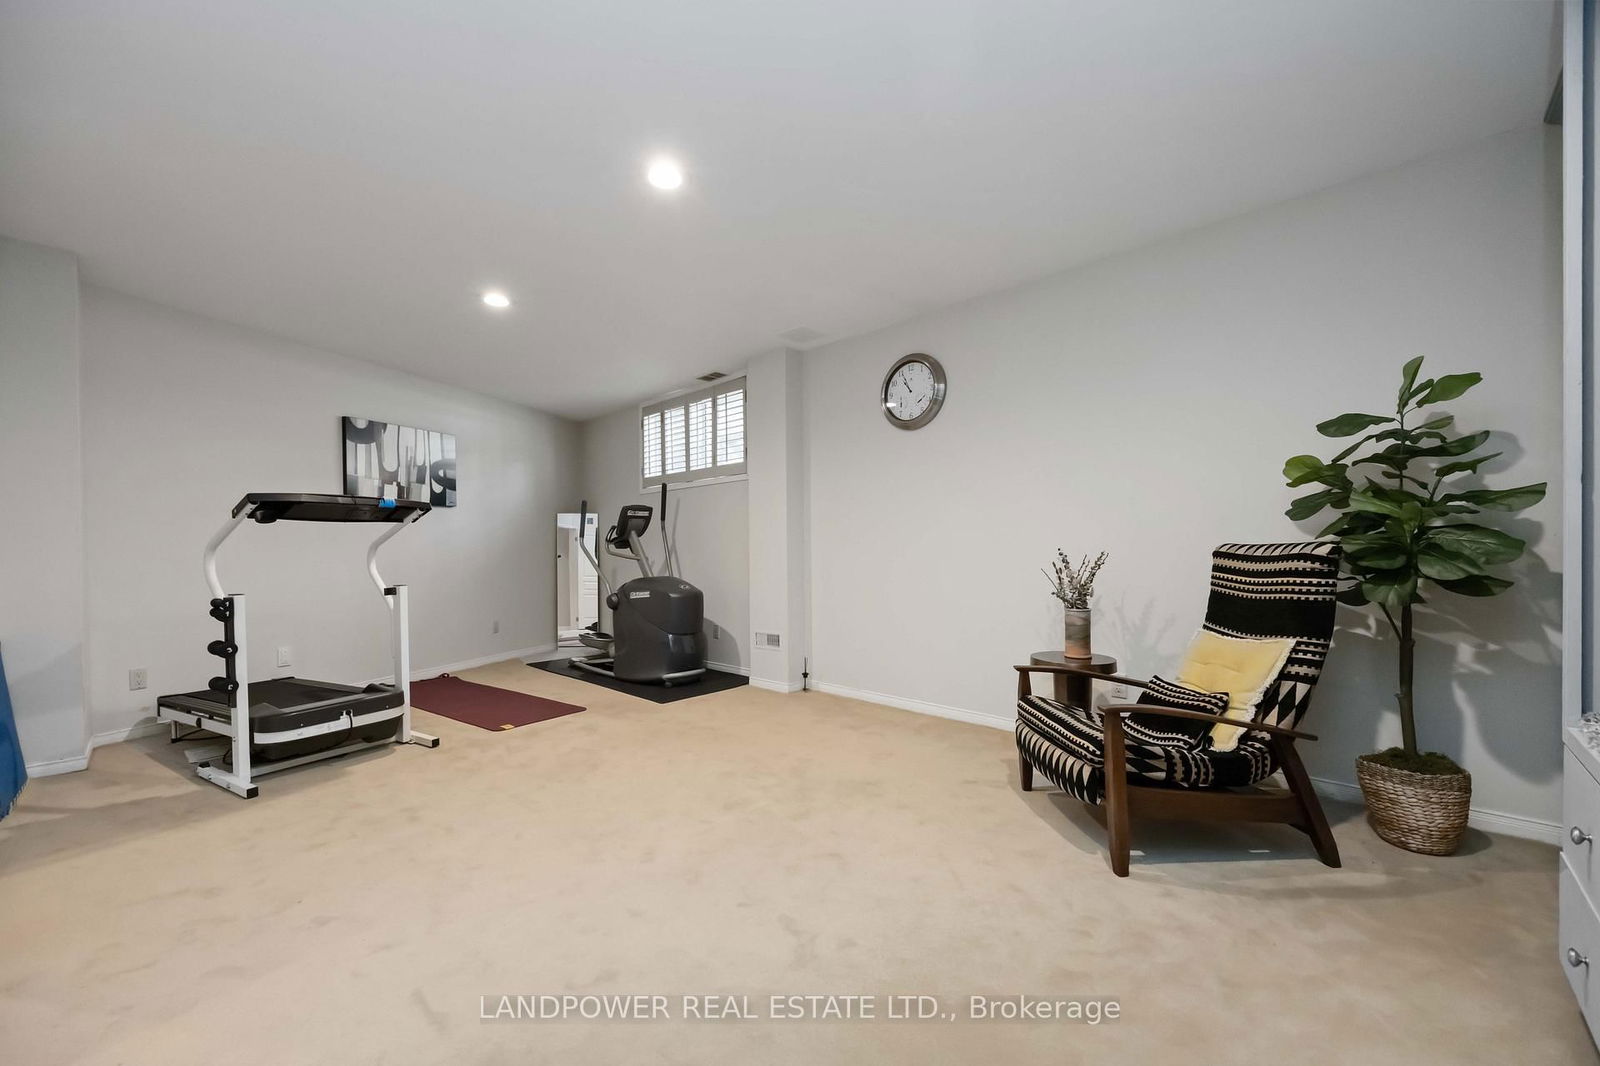
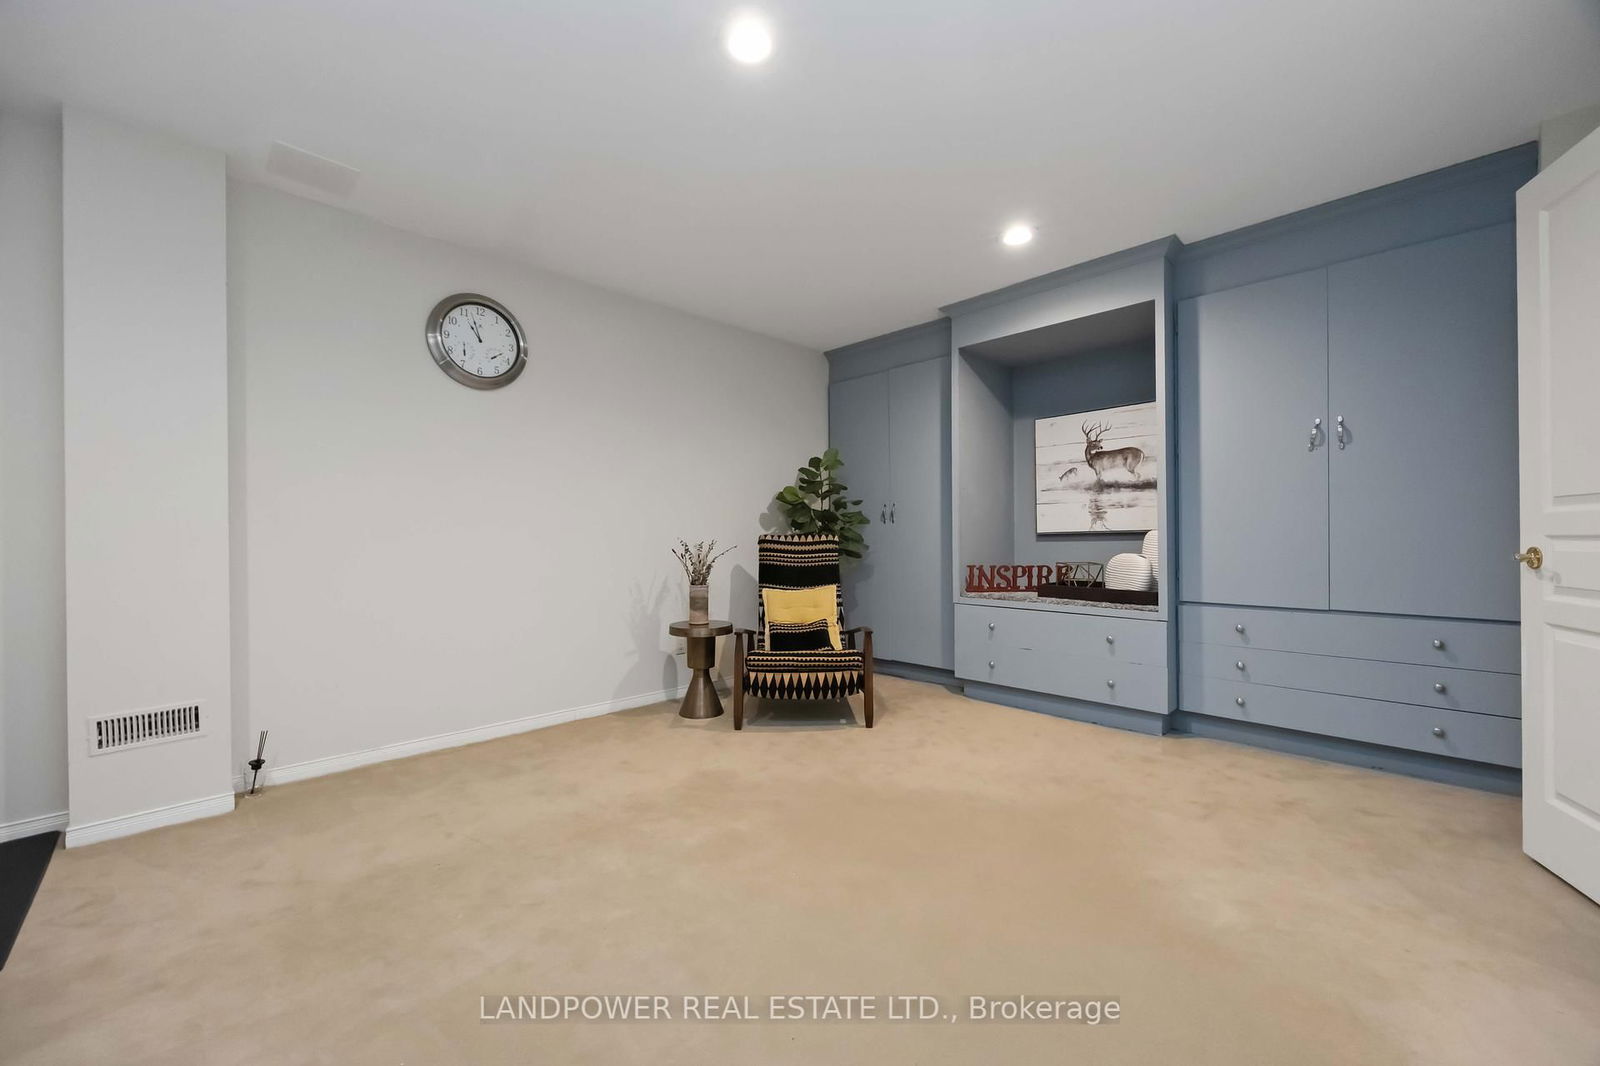
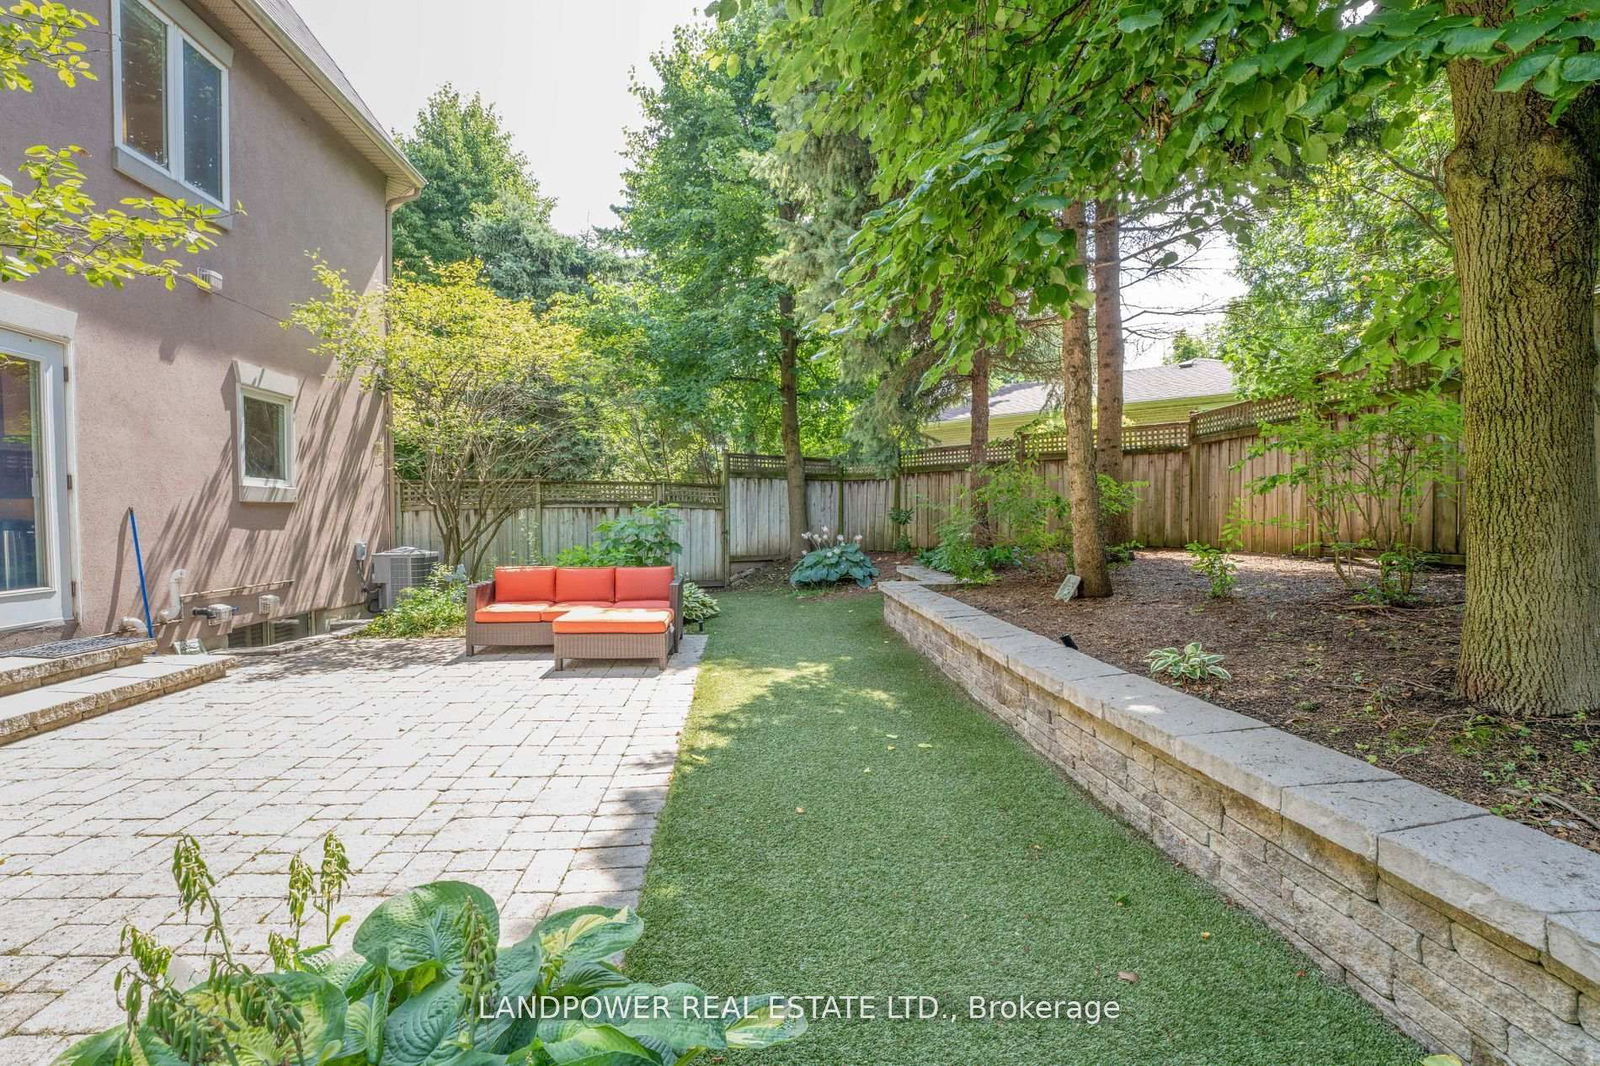
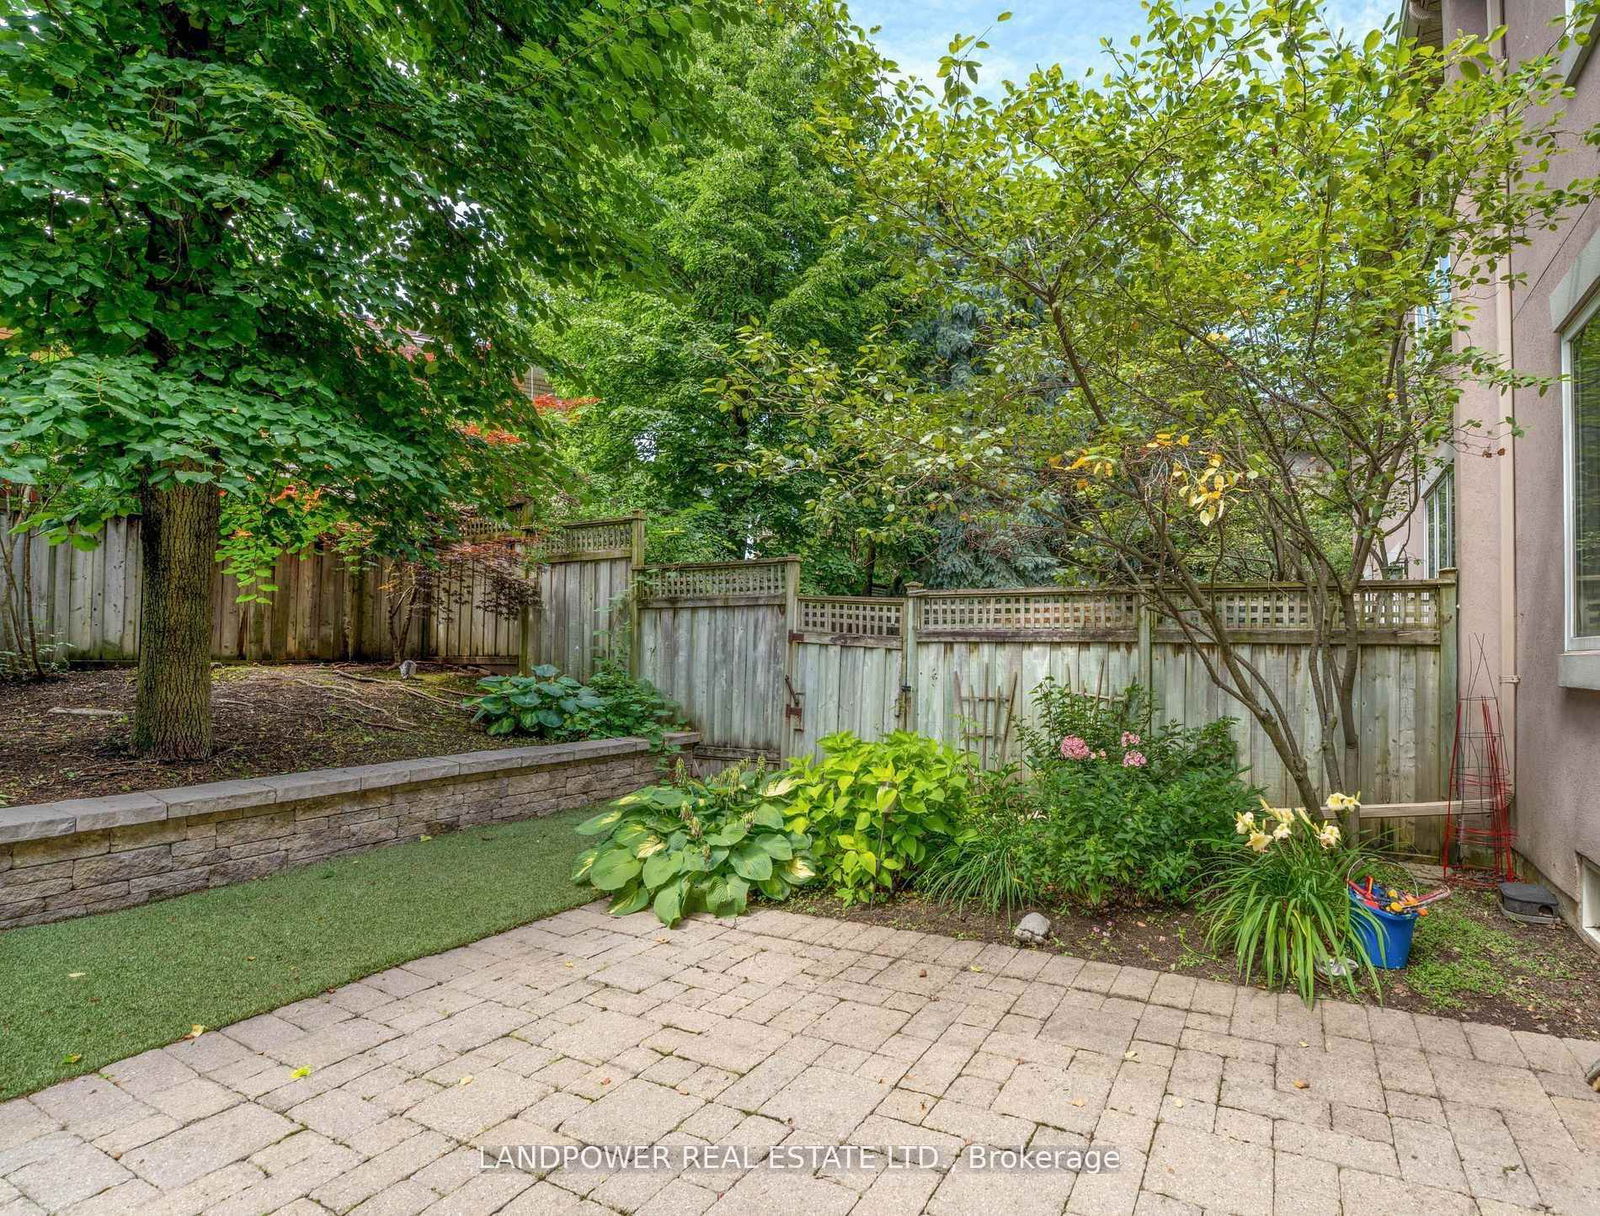
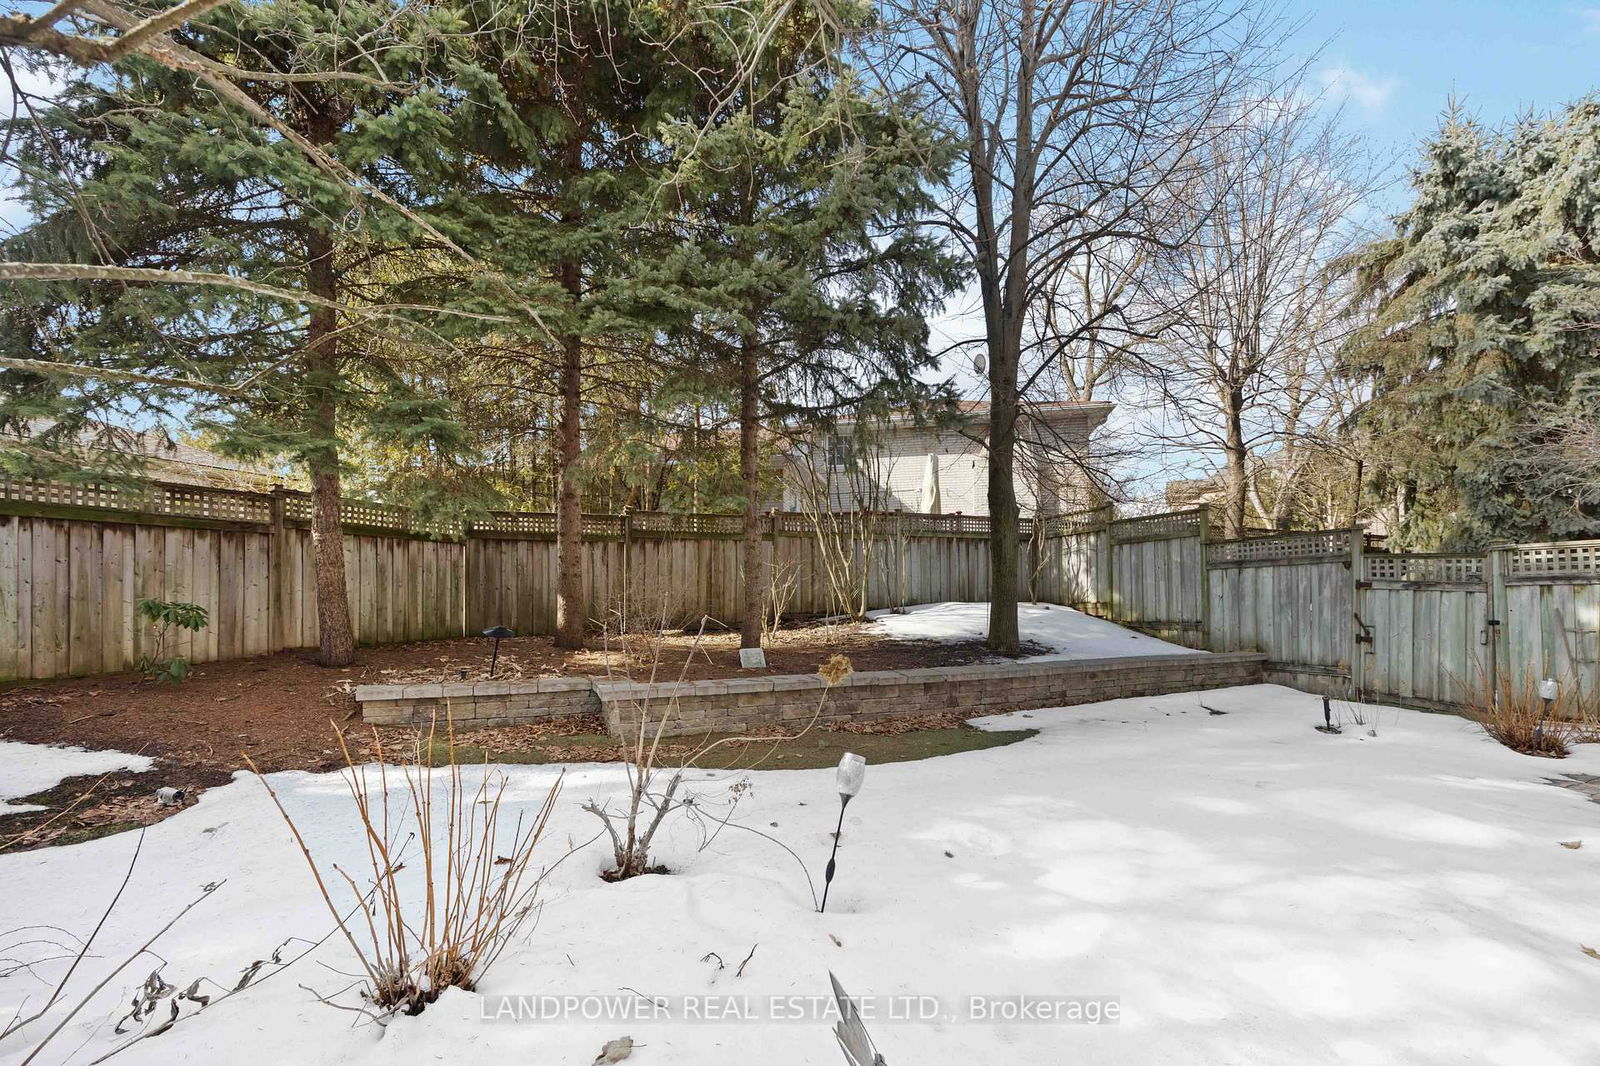
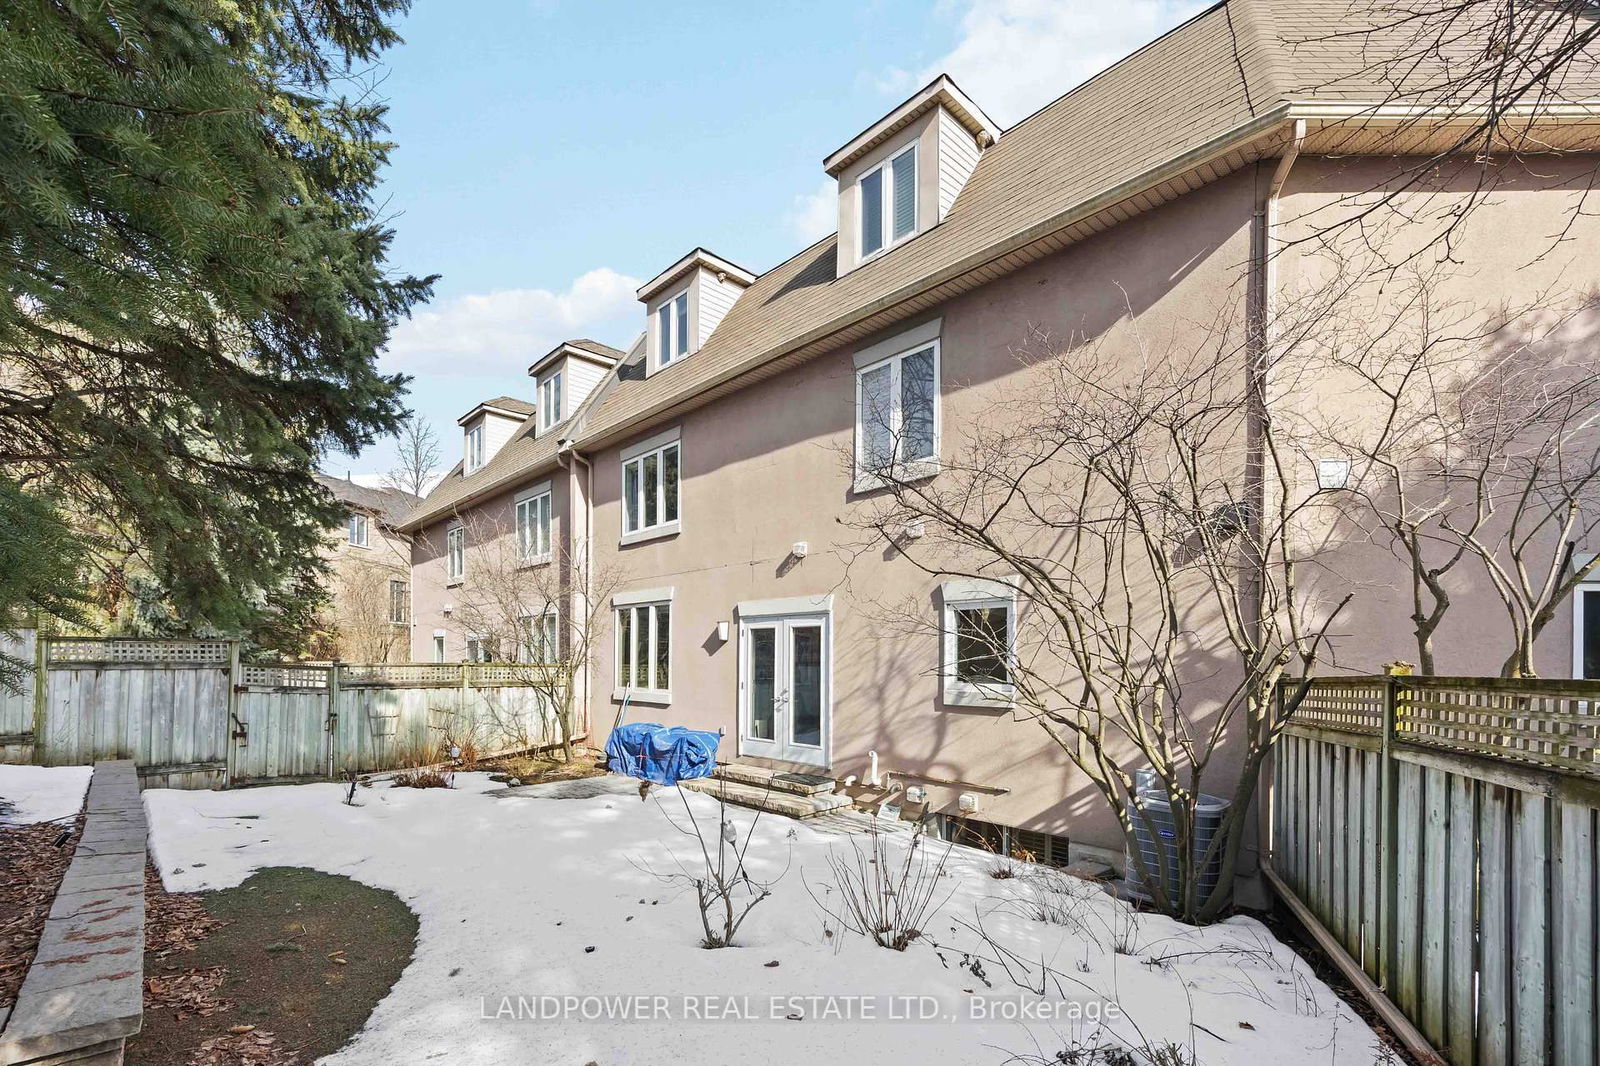
One-of-a-Kind Beautiful Freehold Townhouse larger than many detached! Shane Baghai built, boasting 4,200 sf living space. Enjoy the luxury of a detached but with much less work! Biggest lot in the complex which is conveniently located with a bus stop right at entrance. The unit is tucked away from traffic. Quiet, spacious, elegant and sun-filled with 2 skylights in superb condition. Showcase of refined workmanship. Custom designed gourmet kitchen is a surprising delight to all chefs. High-end appliances including Dacor 6 burner stove, 2 ovens, powerful range hood, wood paneled Kitchen Aid fridge & Miele super quiet dishwasher, built-in wine fridge, large quartz waterfall centre Island & breakfast area overlooking the big, low-maintenance year-round perennial garden w/custom turf. Master Br comes with a cozy sitting room and a 2-way fireplace. The Her's walk-in closet is huge! All Bedrooms are extra large and have ensuite bath and walk-in closets. The office can be 4th Br. The large 5th Br w/ensuite bath in the basement can be a gym/rec room. Too much to list! Excellent school zone: Finch P.S., Cummer Valley M.S. & Earl Haig S.S. Minutes to Bayview Village & 401.
Dacor 6 gas burner stove with 2 ovens, extra large & powerful range hood, paneled Kitchen Aid fridge, wine cooler, Miele B/I Dishwasher, large size front-loading washer & dryer, shades & window coverings, 2 skylights, Cvac, all electrical light fixtures, $457/m for water, garbage, landscape, snow removal & common area maintenance . Large tandem garage + 1 parking on private driveway. B/I bookcases, office furniture, desk & bookcase in Br. 3.
Living
Dining
Kitchen
Breakfast
Family
Primary
Sitting
2nd Br
3rd Br
Office
Br
The graph below compares the average list price and average sale price of homes in this neighborhood by month for the last 24 months. When average sale price is greater than average list price, this may suggest a buyer's market. When average sale price is lower than the average list price this may suggest a seller's market.
The graph below illustrates the average days on market for homes in this neighborhood. The yellow area may indicate a buyer's market, the green area may indicate a balanced market and the red area may indicate a seller's market.
Sales Representative, Century 21 People’s Choice Realty Inc., Brokerage
(647) 576 - 2100