Century 21 People’s Choice Realty Inc., Brokerage
120 MATHESON BLVD E #103
MISSISSAUGA, Ontario
L4K 0A4

Toronto, West Hill, M1E 2K6
$899,000
Listed by KAMALI GROUP REALTY.
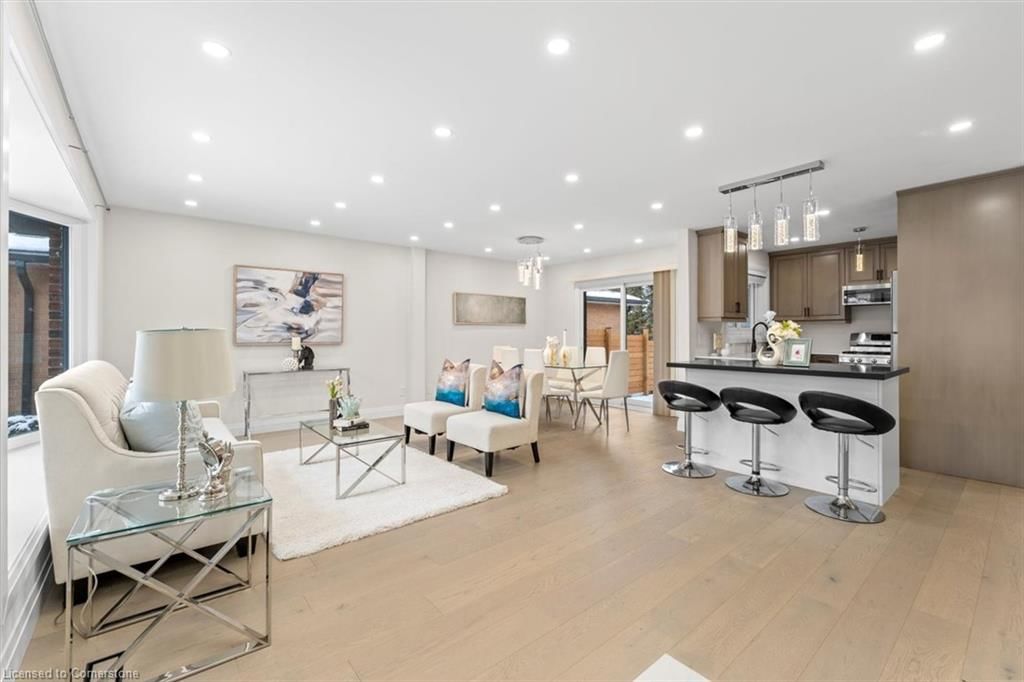
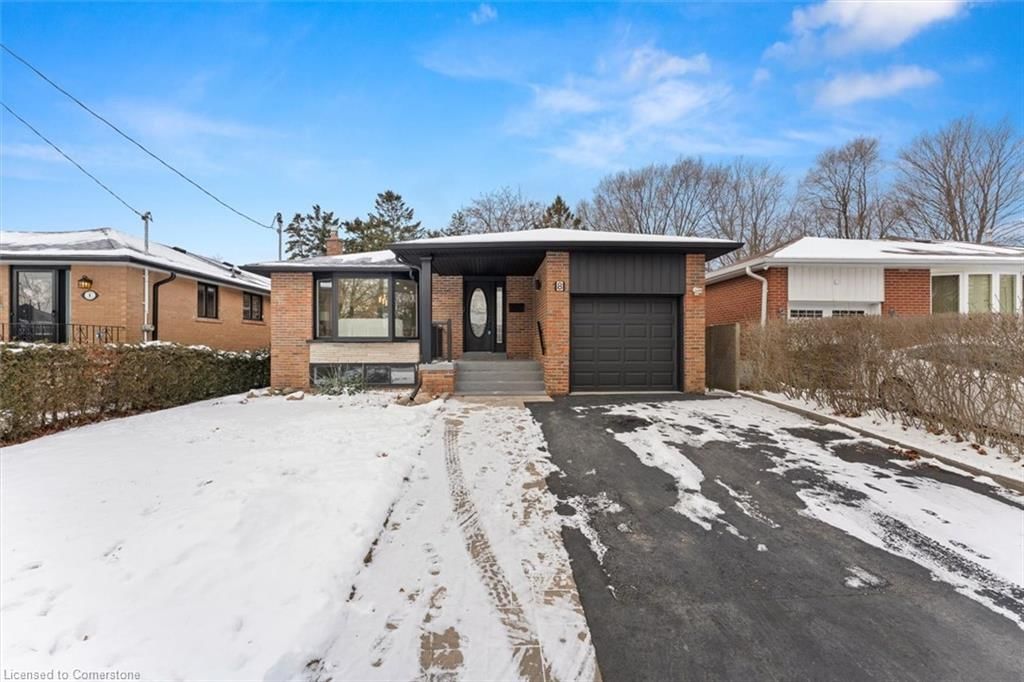
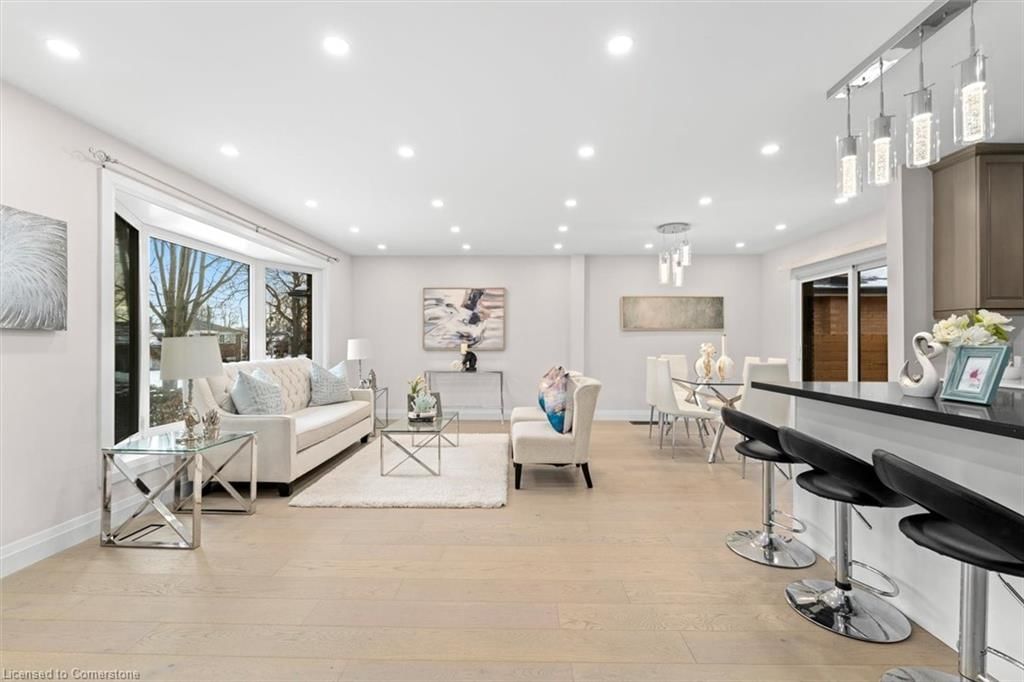
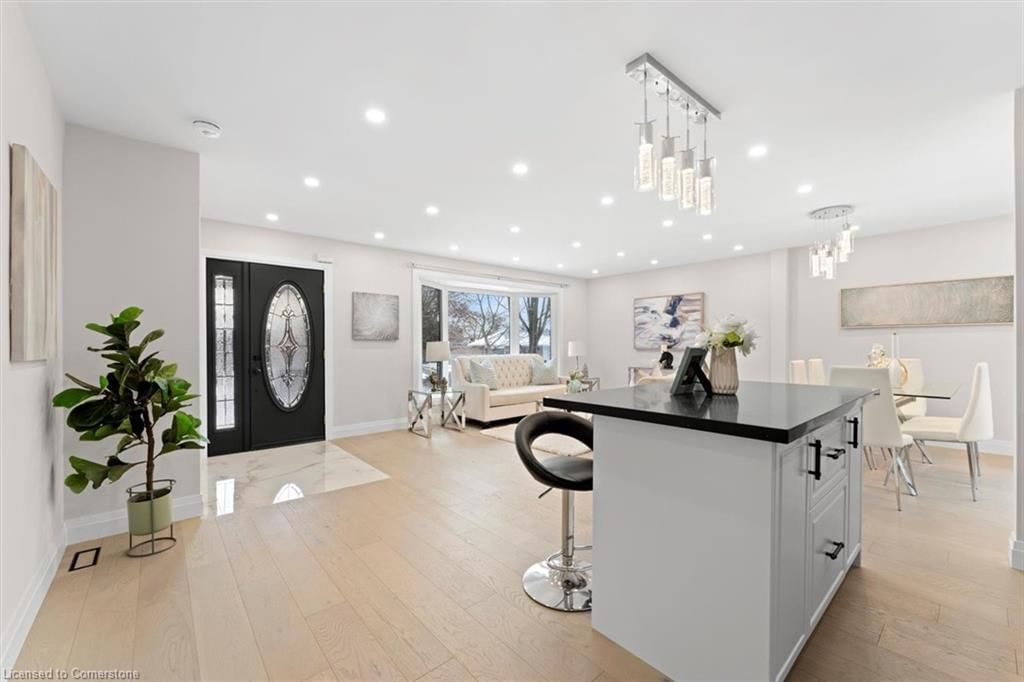
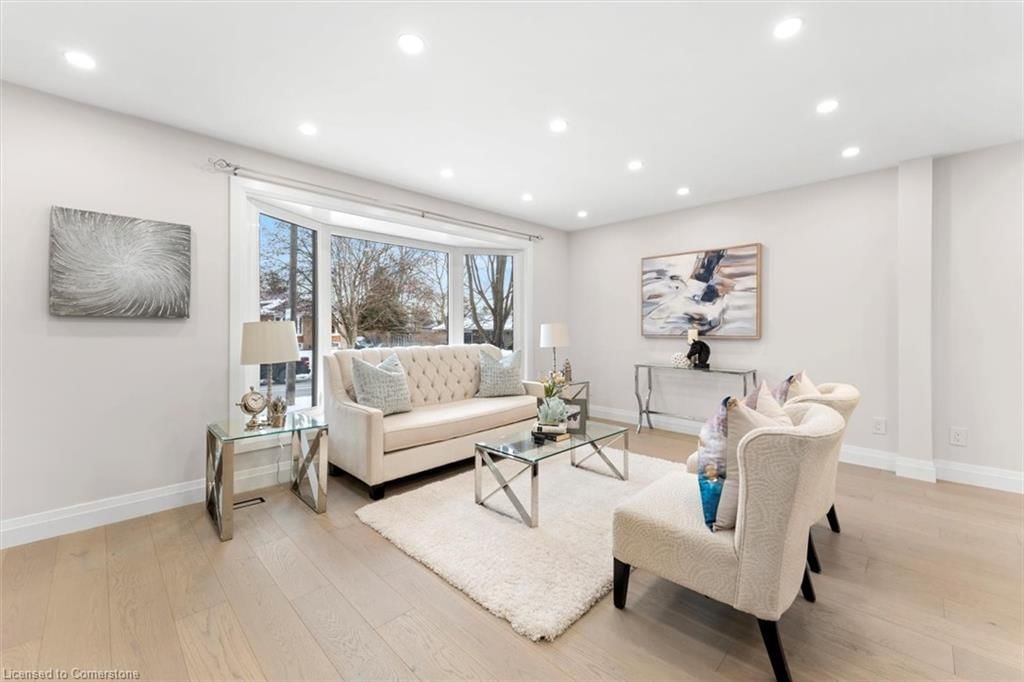
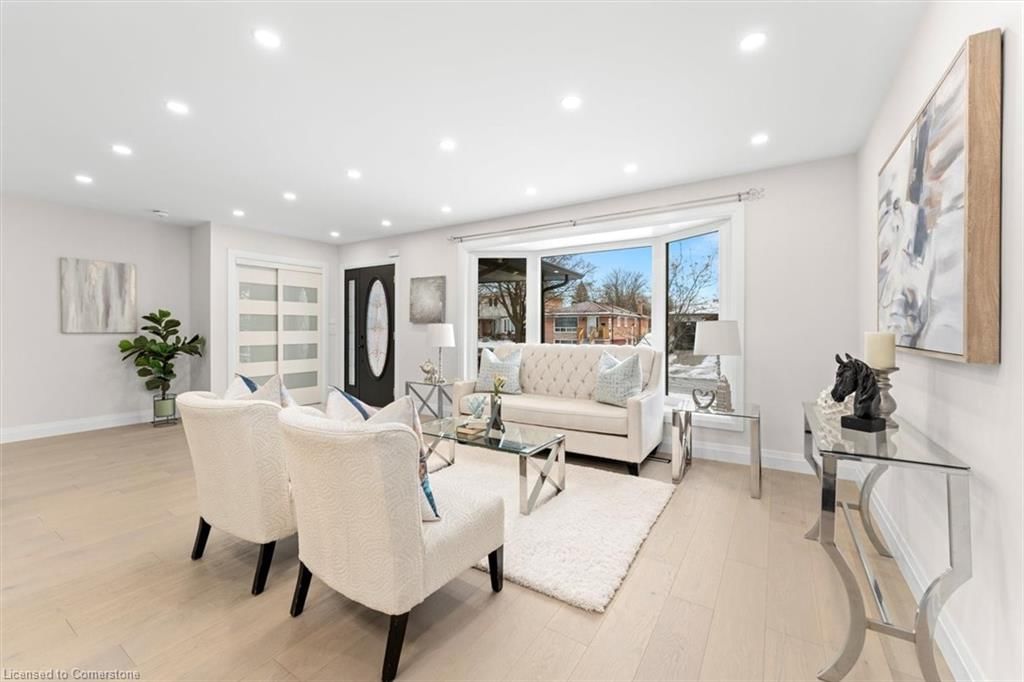
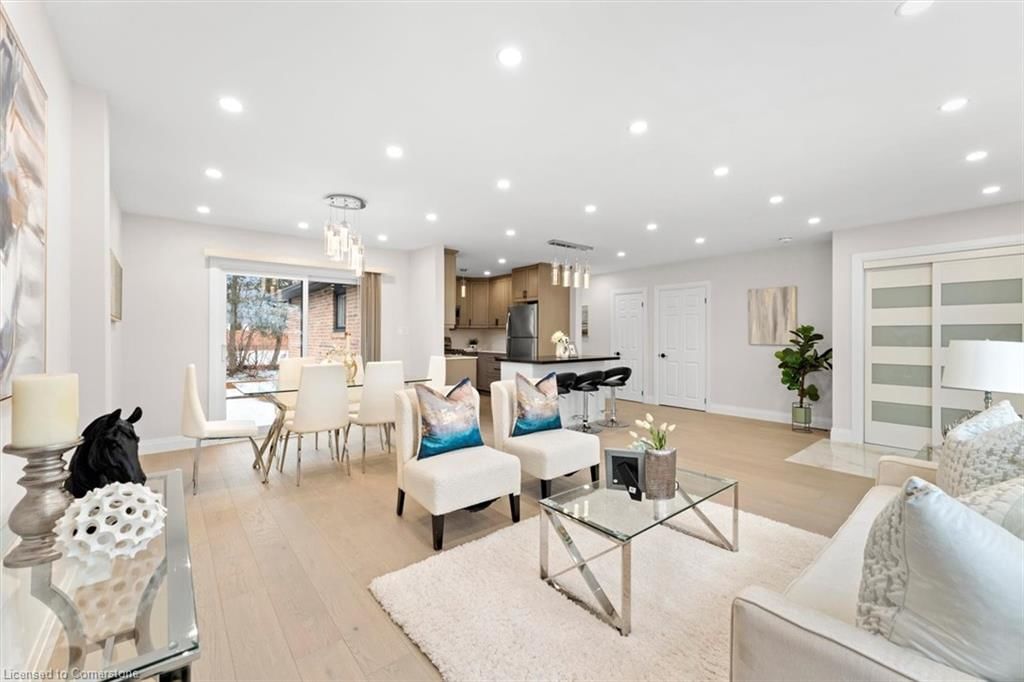
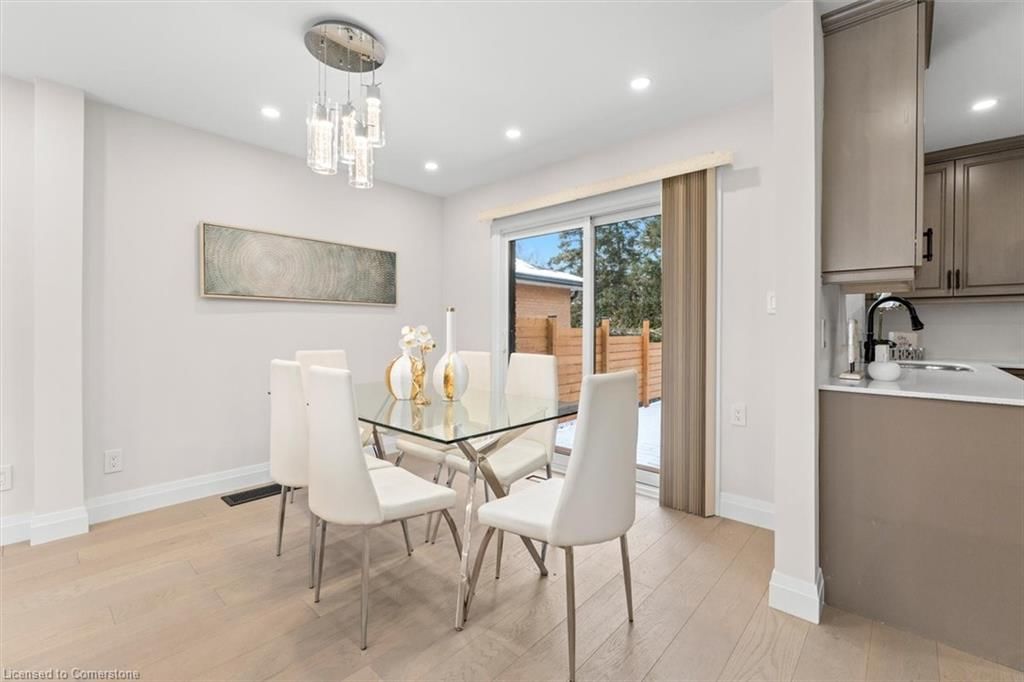
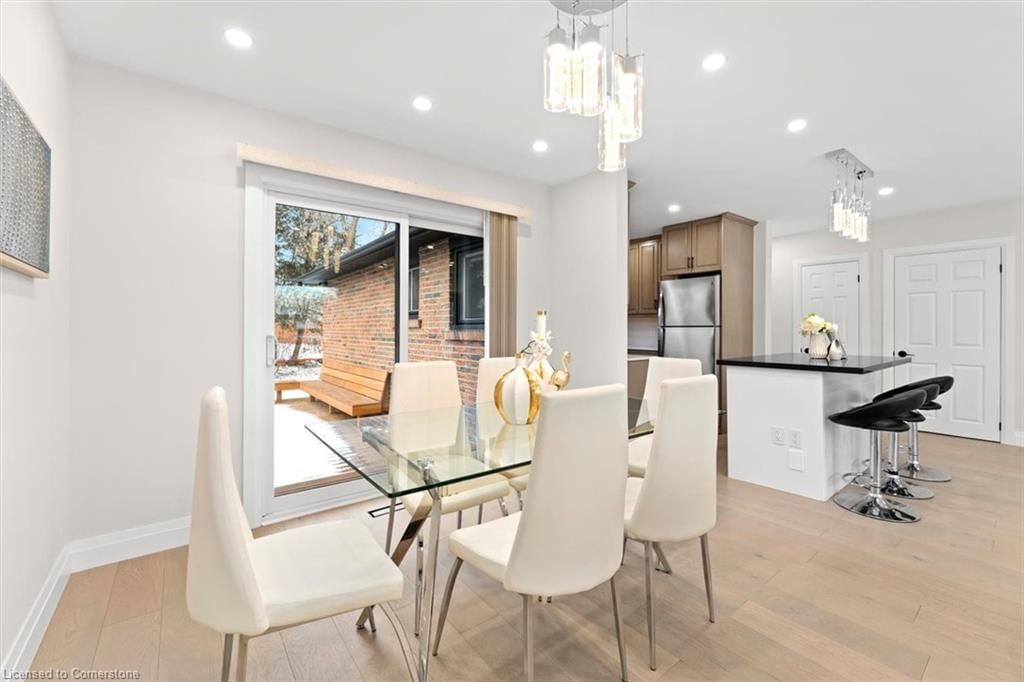
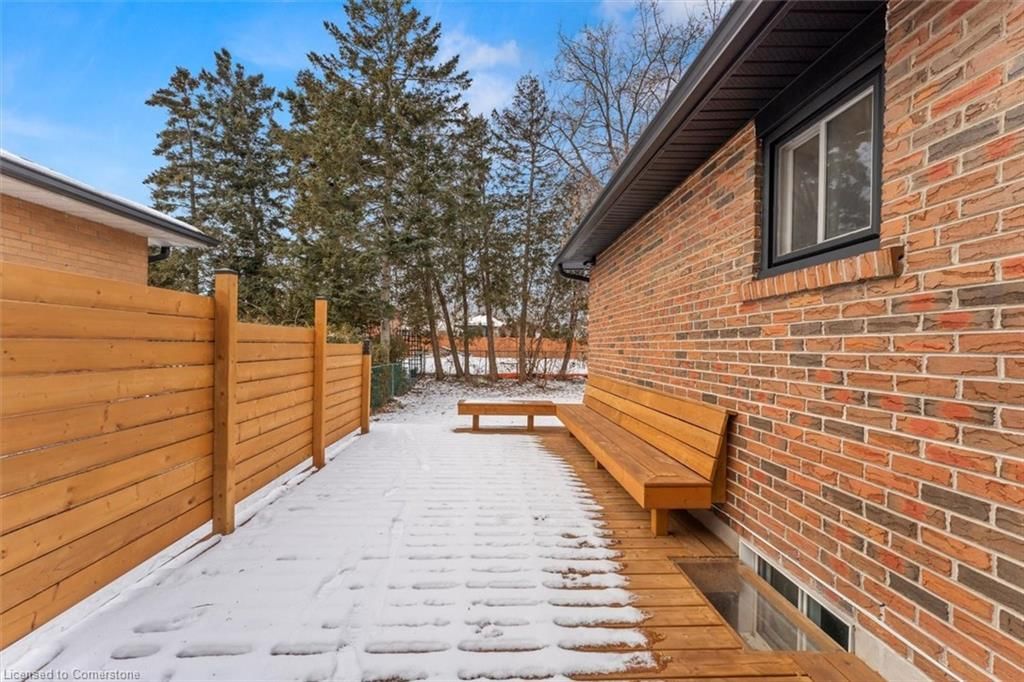
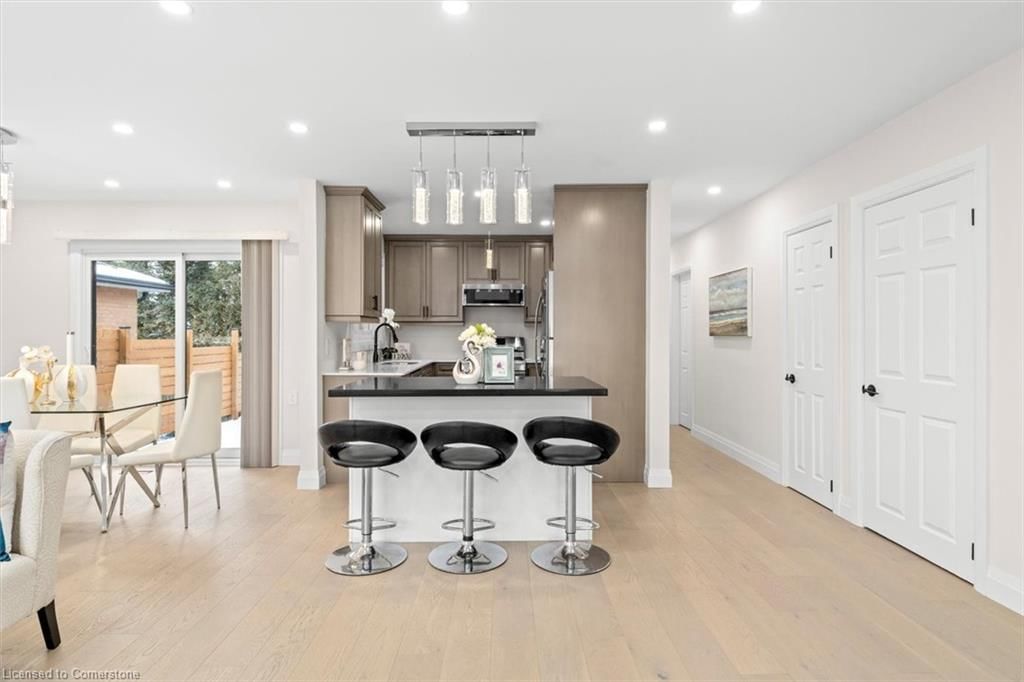
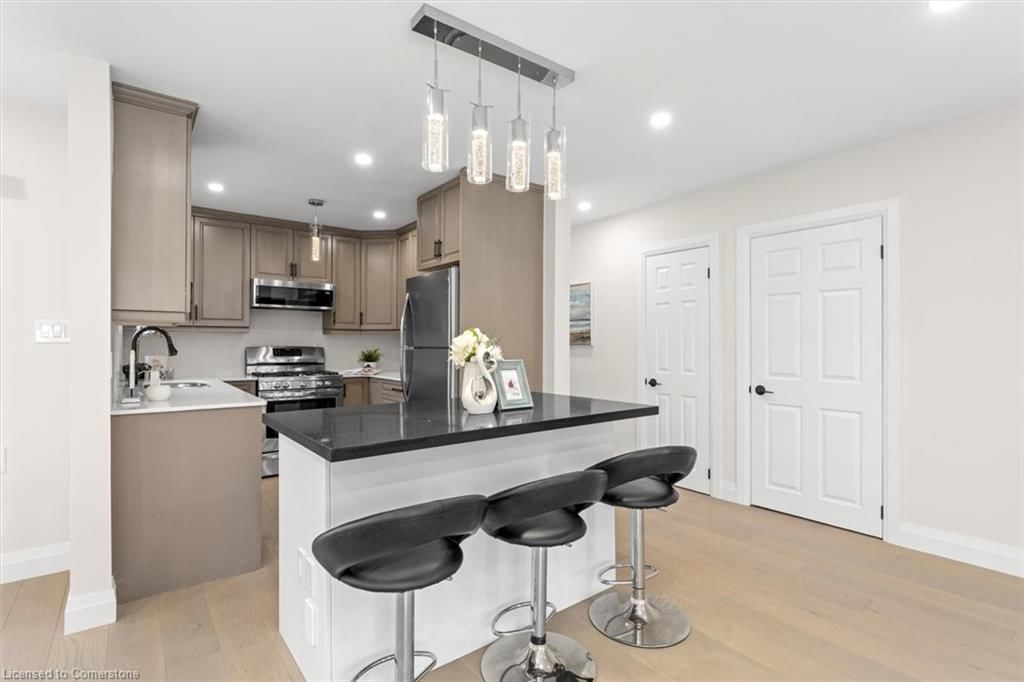
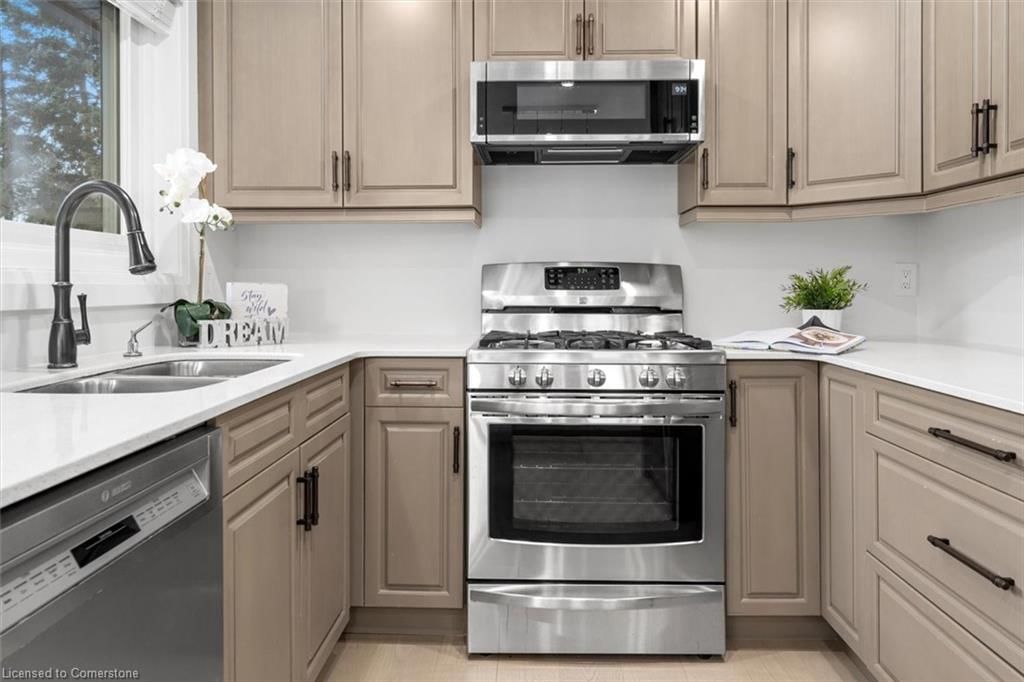
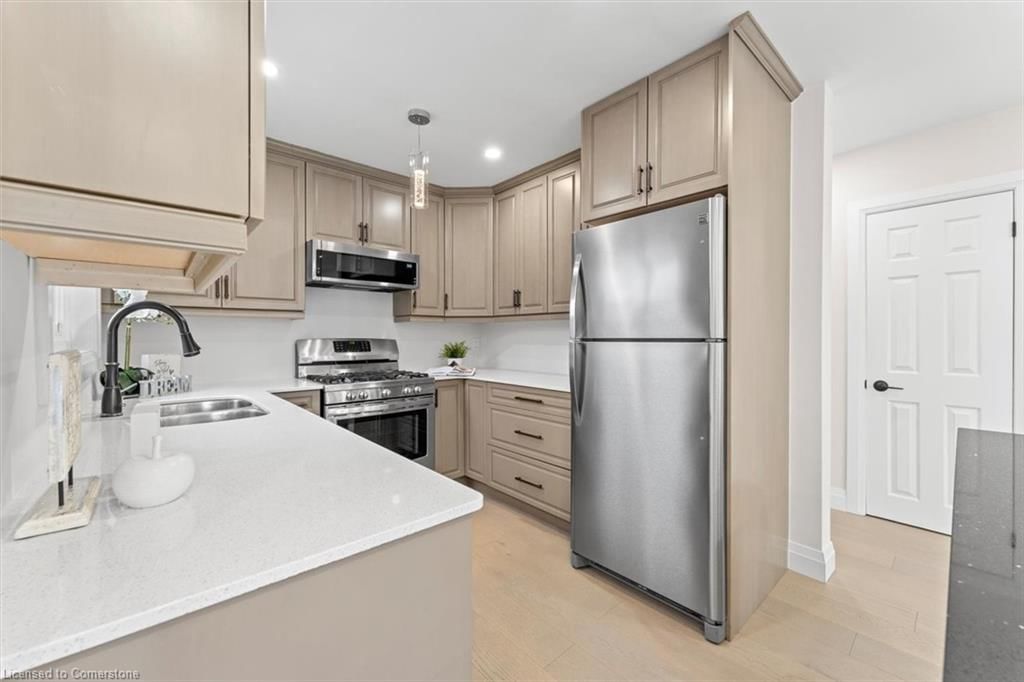
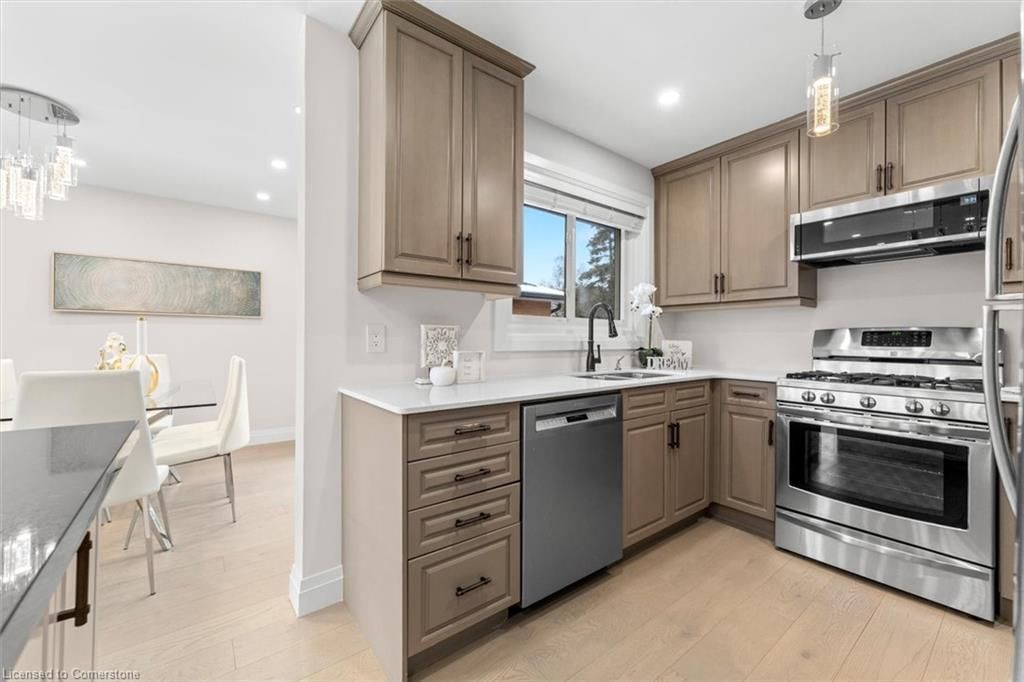
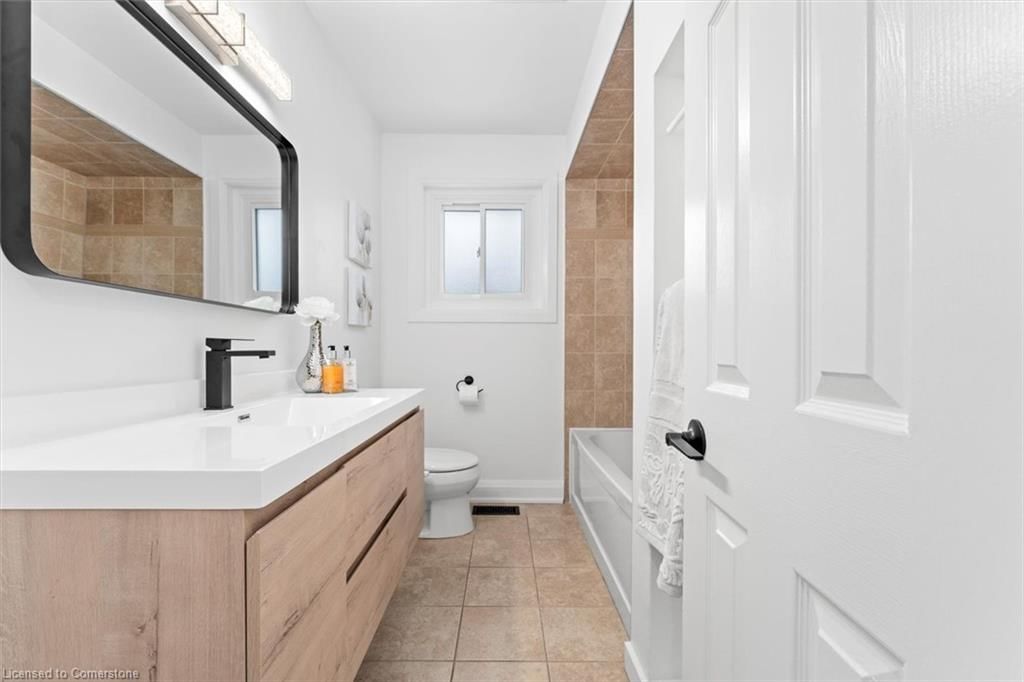
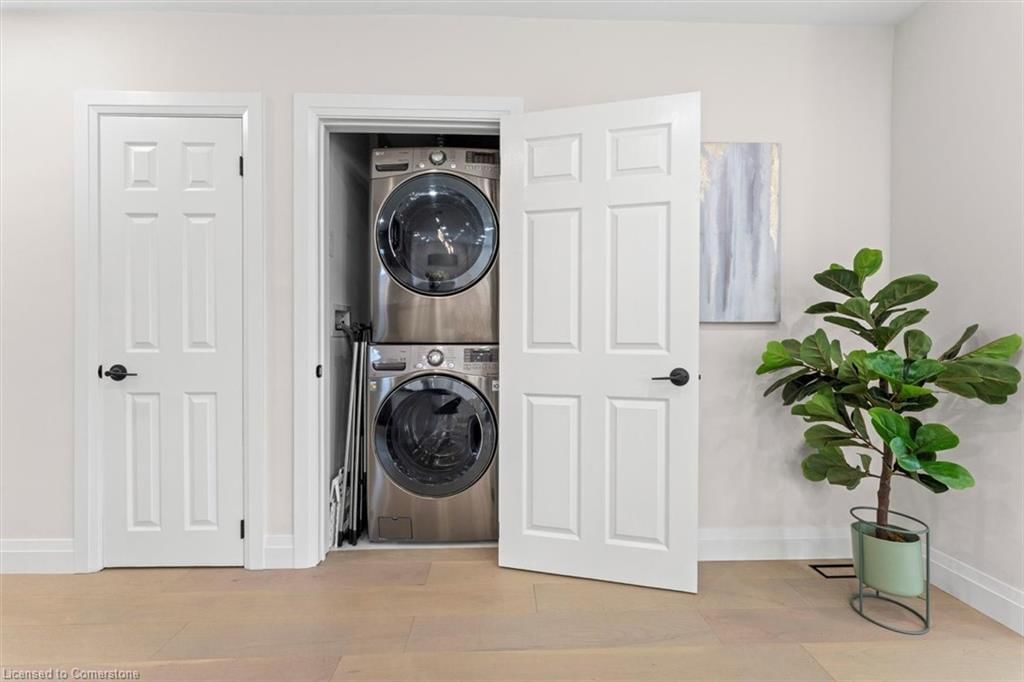
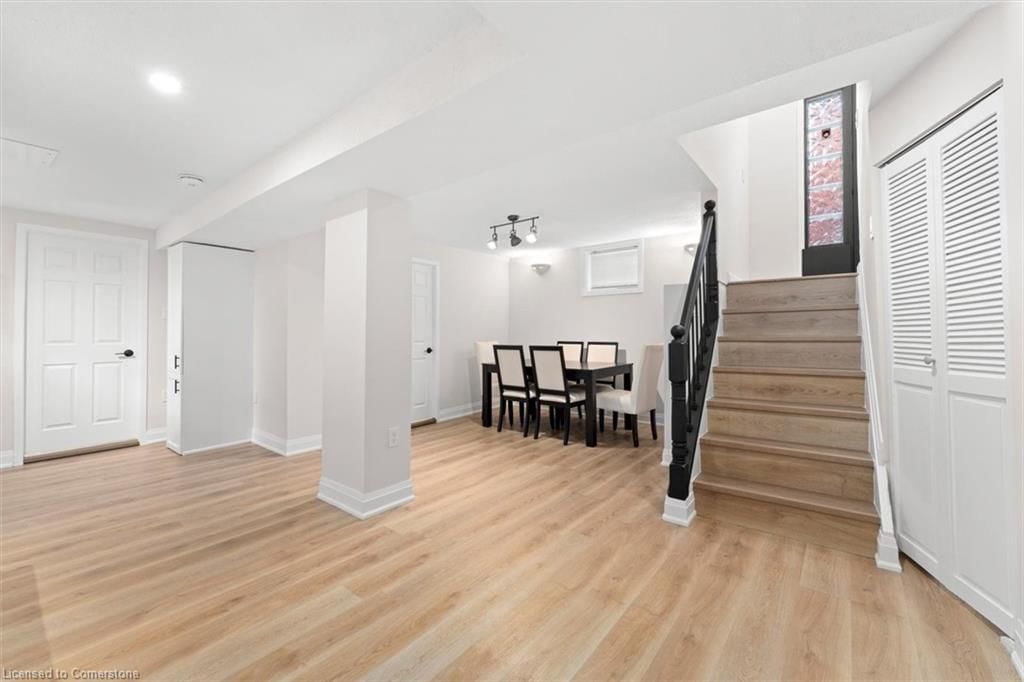
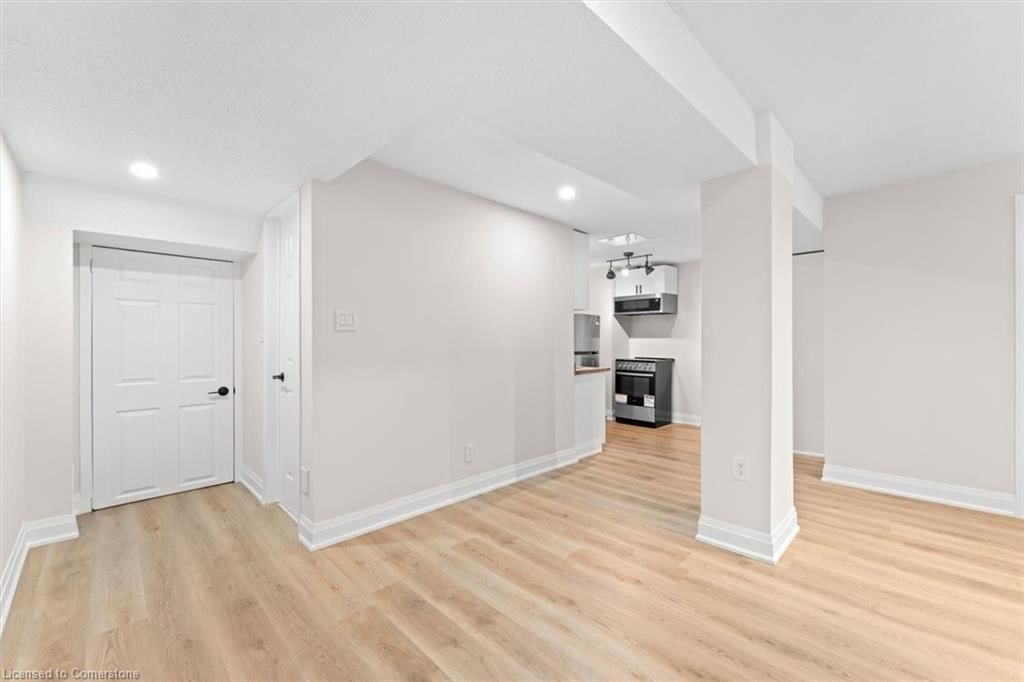
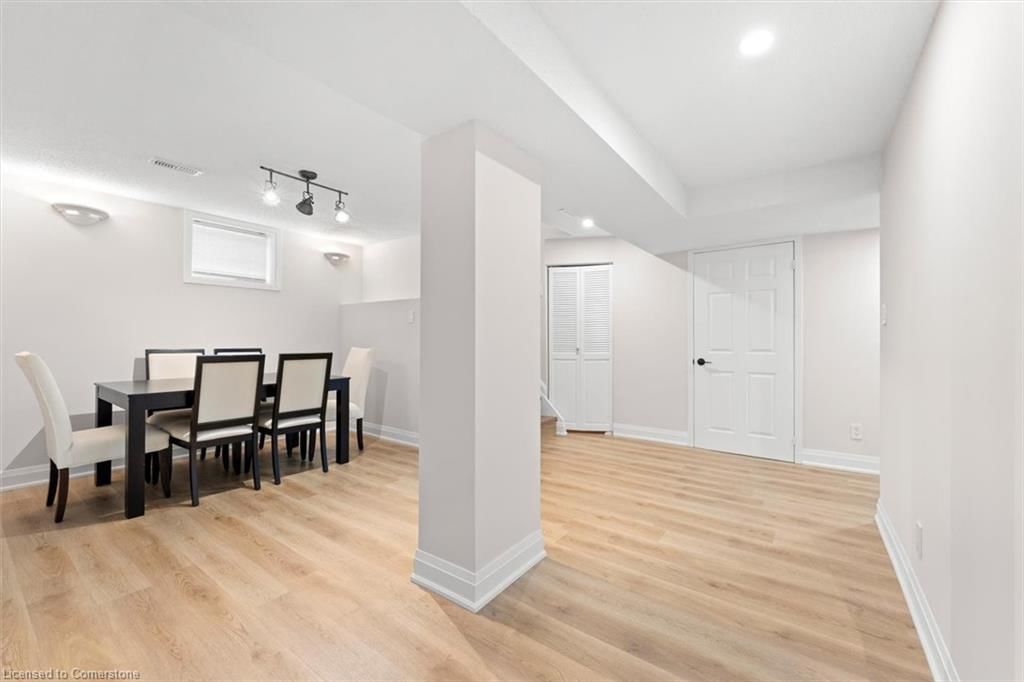
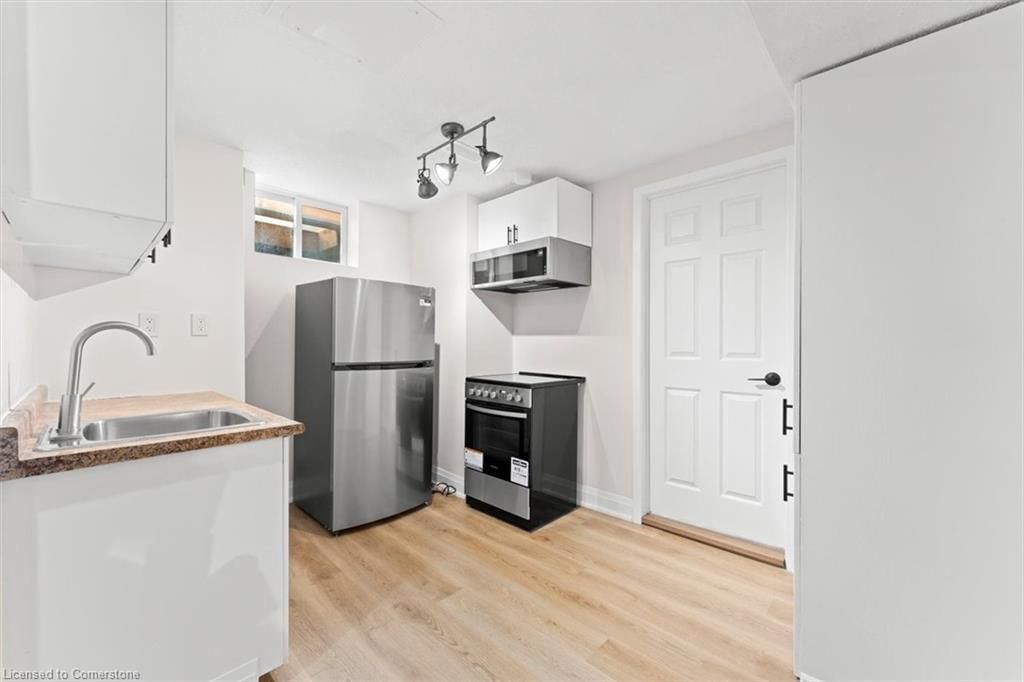
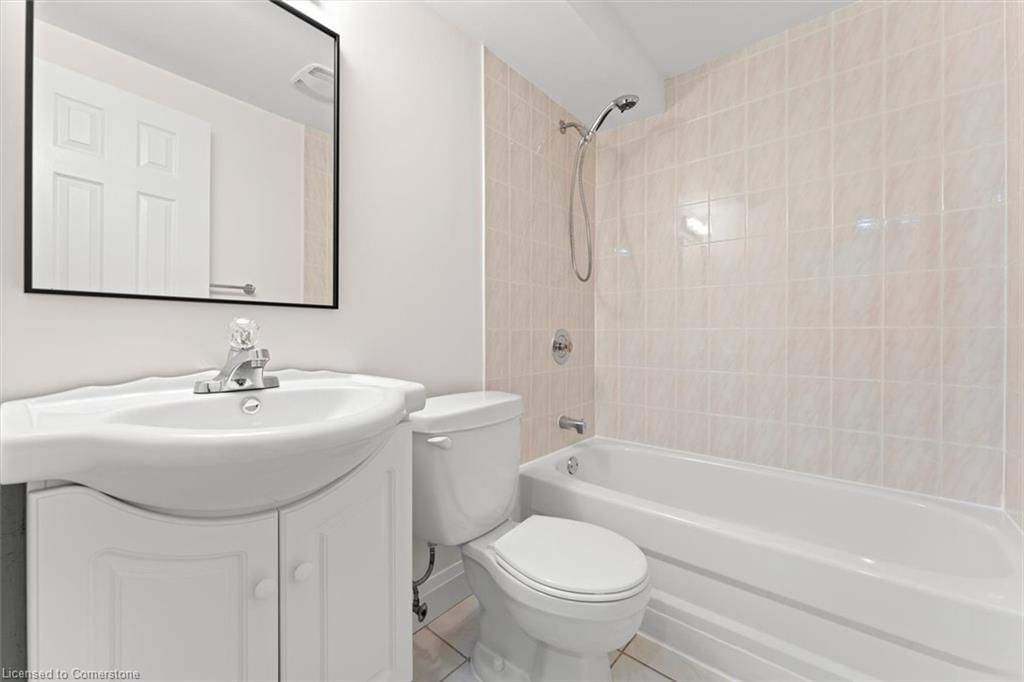
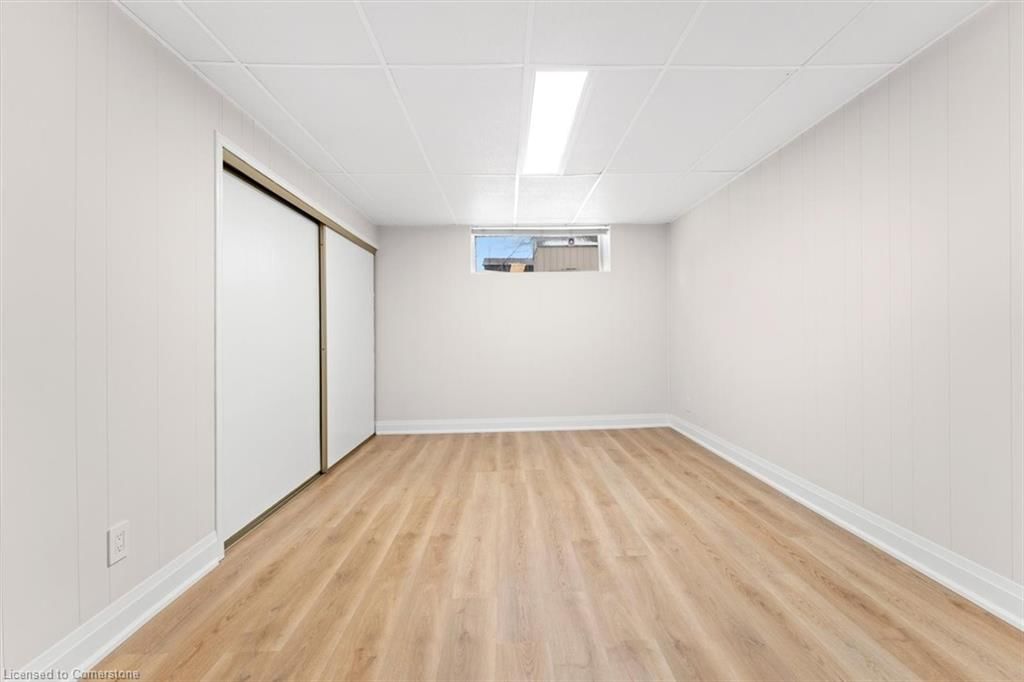
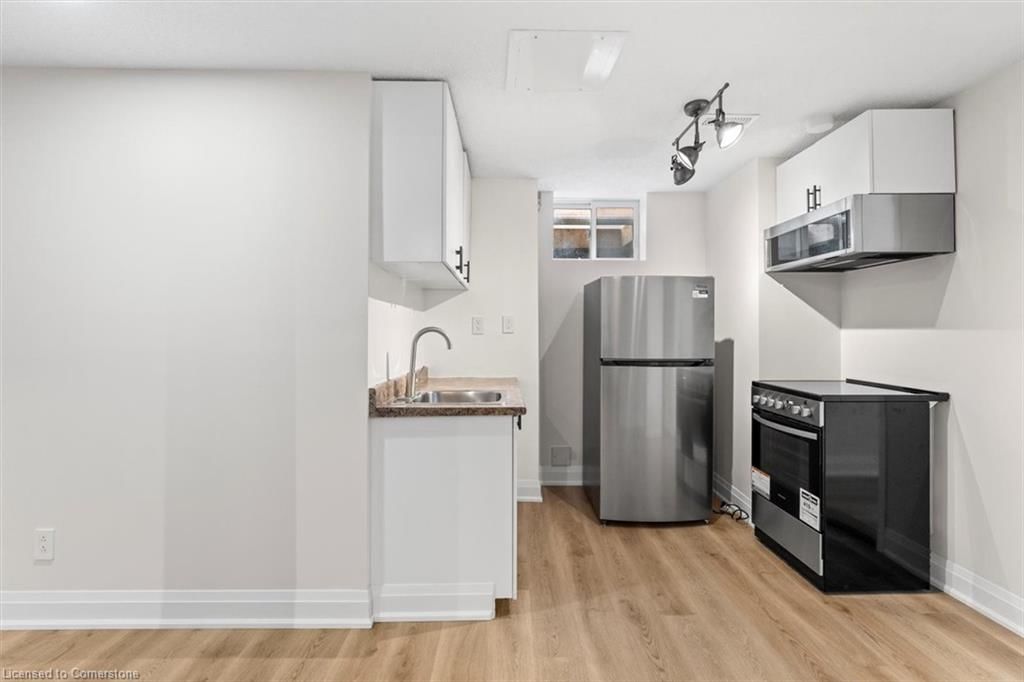
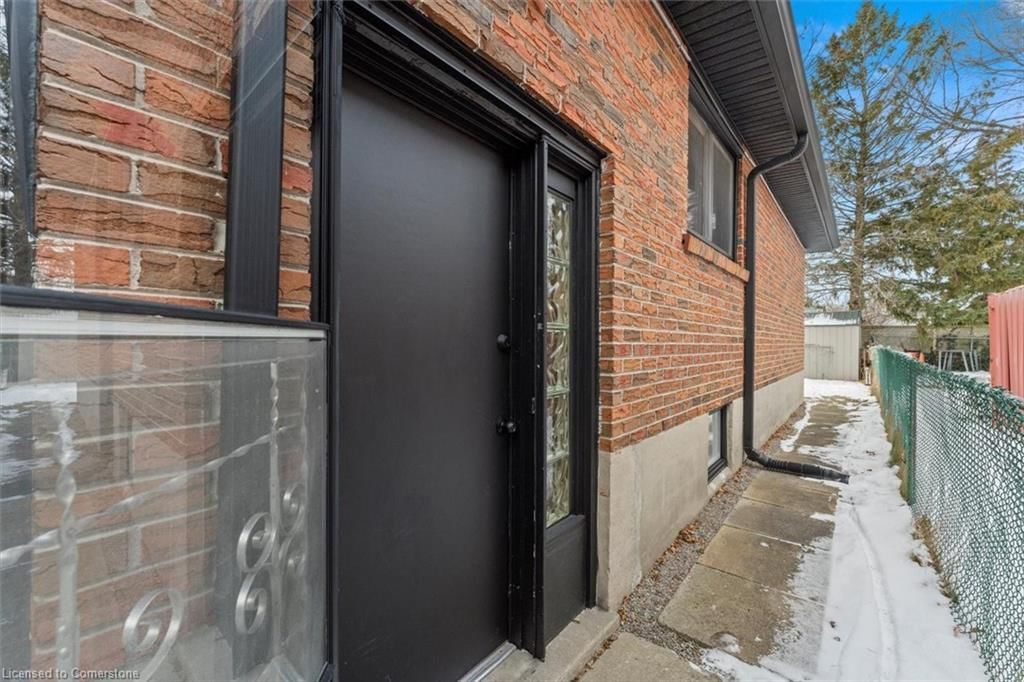
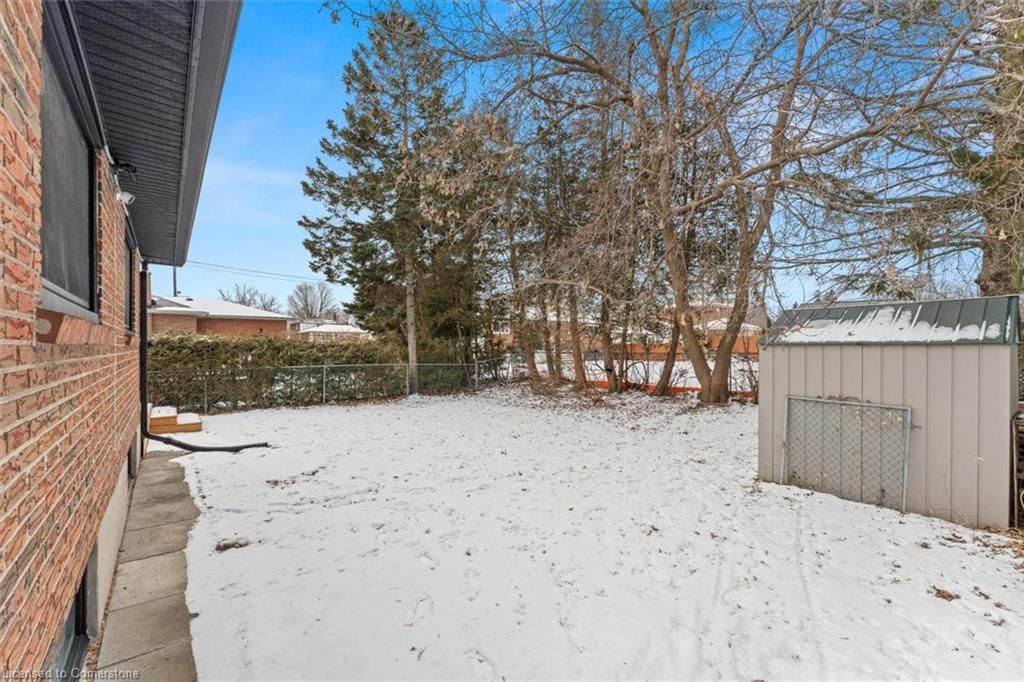
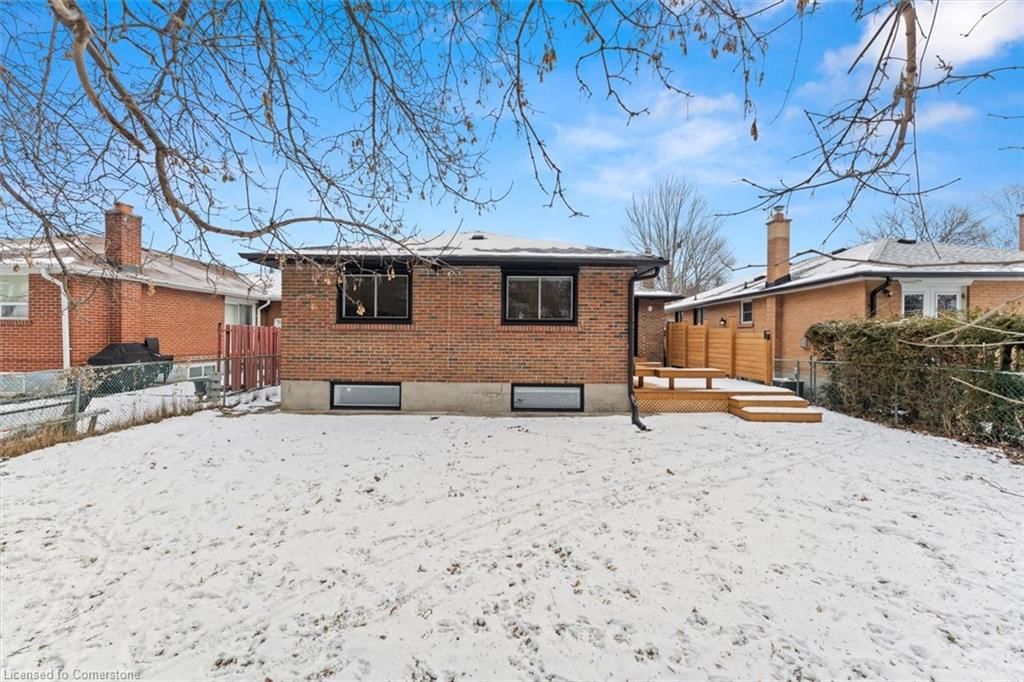
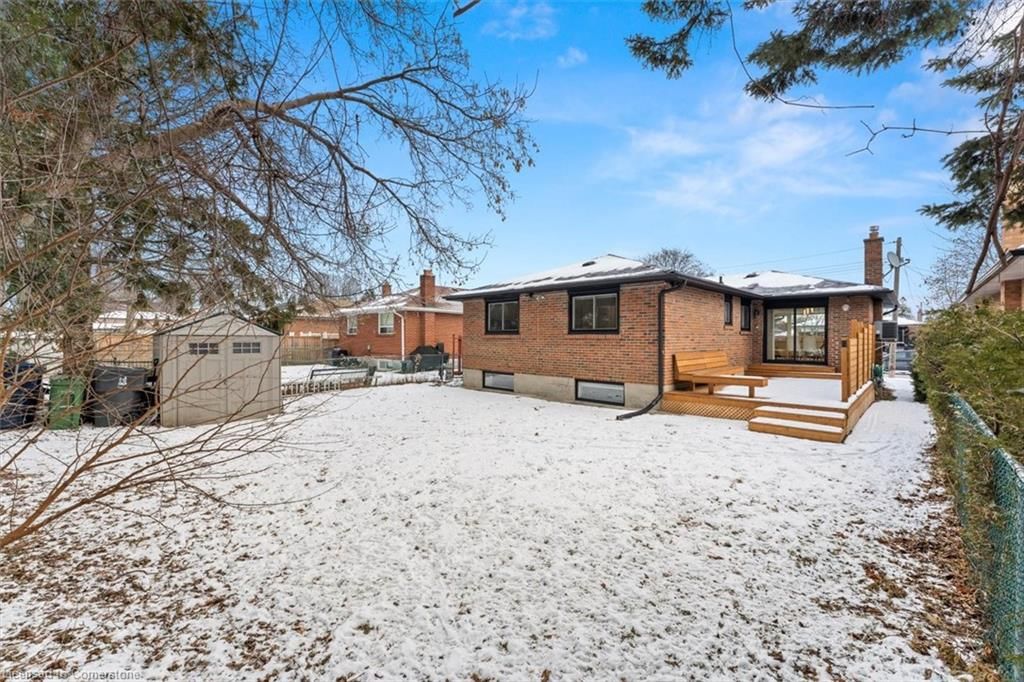
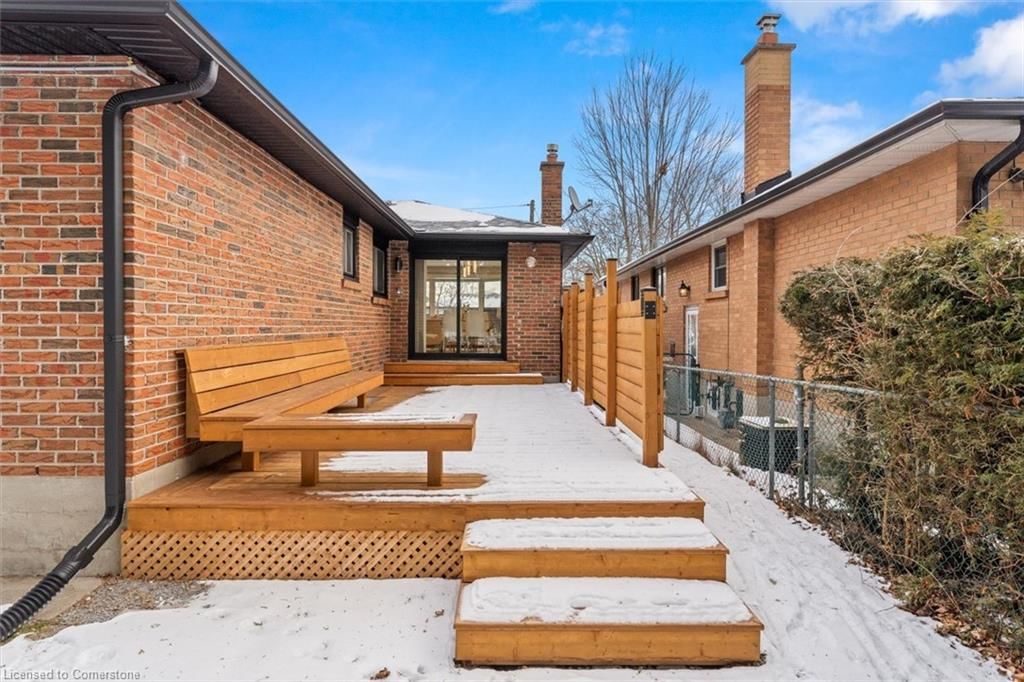
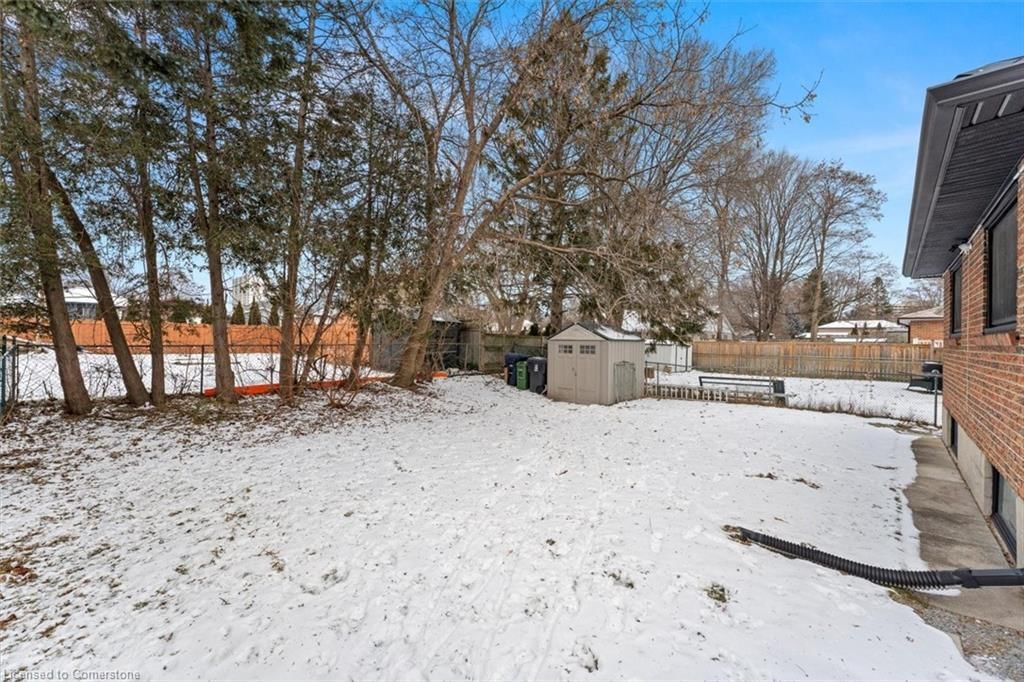
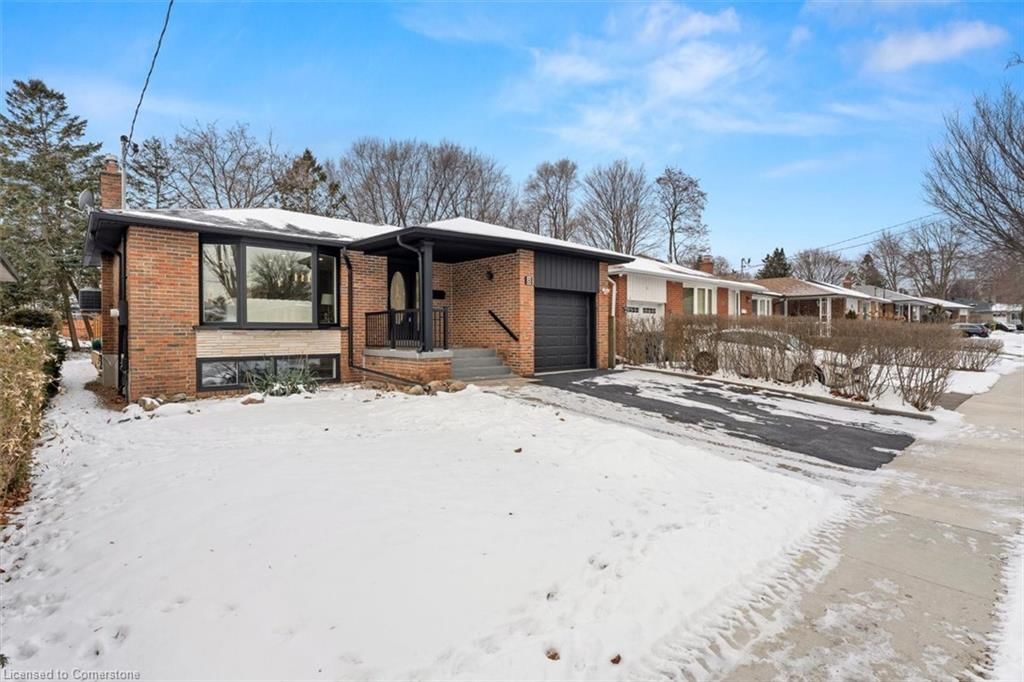
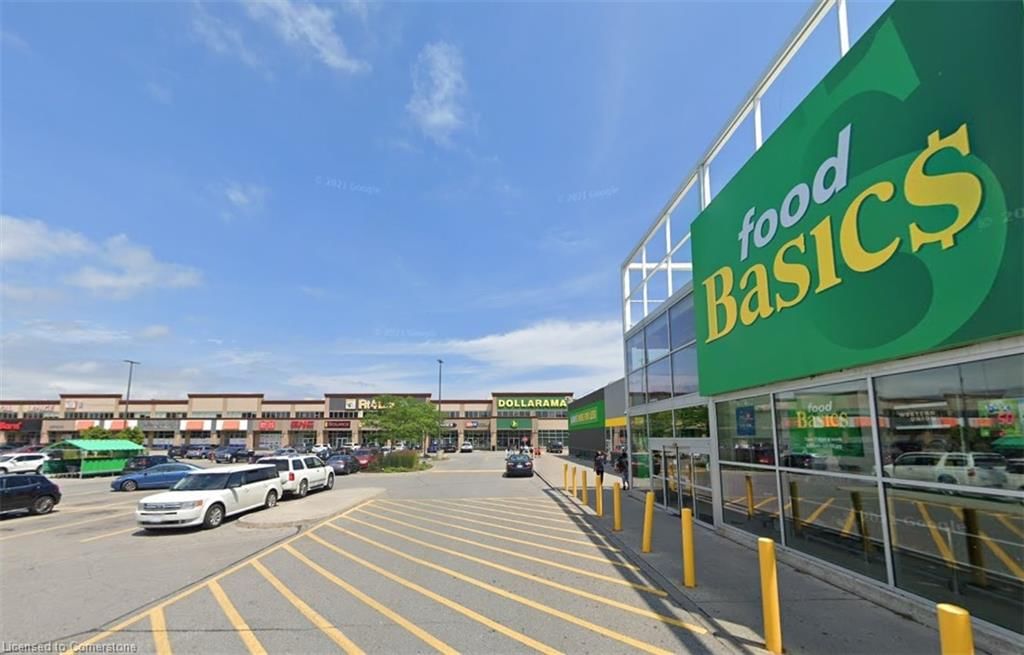
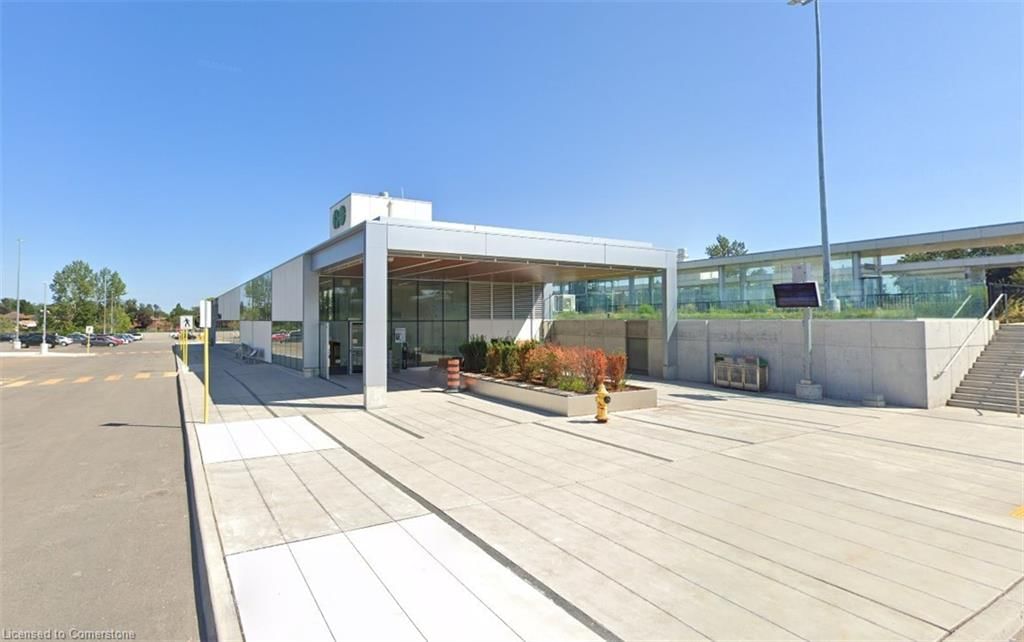
2024 Renovated & Remodeled!! Loads Of Upgrades! Detached Bungalow With Separate Entrance To Basement Apartment! 3+3 Bedrooms! Vacant, Move-In or Rent-Potential Rental Income Of $3,000 + $1,900 + Utilities! Featuring Renovated Eat-In Kitchen With Large Centre Island, Quartz Countertop & Gas Stove, 2024 Remodeled-Open Concept Living & Dining Room With Pot Lights & Walkout To 2024 Re-Built Backyard Deck, Renovated 4pc Bathrooms, Separate Entrance To 3 Bedroom Self-Contained Basement Apartment With Soaring ~7.5ft High Ceiling & Large Above Grade Windows, 2 Sets Of Separate Washers & Dryers, Central Vacuum, 200 Amp Electrical Panel, Attached Garage, 2-Car Wide Driveway With Stone Interlock Extension, Covered Front Porch, Backyard With Loads of Privacy, Minutes To Guildwood Park & Gardens With Waterfront Views, U Of T Scarborough, Centennial College, Kingston Square Shopping Mall, Guildwood GO-Station & Hwy 401, Public-In-Person Open House Sat & Sun, January 25th & 26th, 1-4P.M.
Built-in Microwave,Dishwasher,Dryer,Refrigerator,Stove,Washer,2024 Renovated! 2xrenovated Kitchens 2024,2 Xrenovated Bathrooms24,Interlock Driveway 24,Tankless Hot Water Heater21,Furnace 21,Paint24,Hardwd&vinyl Flring24,200amp Electrical Panel21,Upgraded Attic Insulation21,2nd Laundry21,Central Ac20,Central Vac
Copyright 2025 Information Technology Systems Ontario, Inc. The information provided herein must only be used by consumers that have a bona fide interest in the purchase, sale, or lease of real estate and may not be used for any commercial purpose or any other purpose.
Living Room
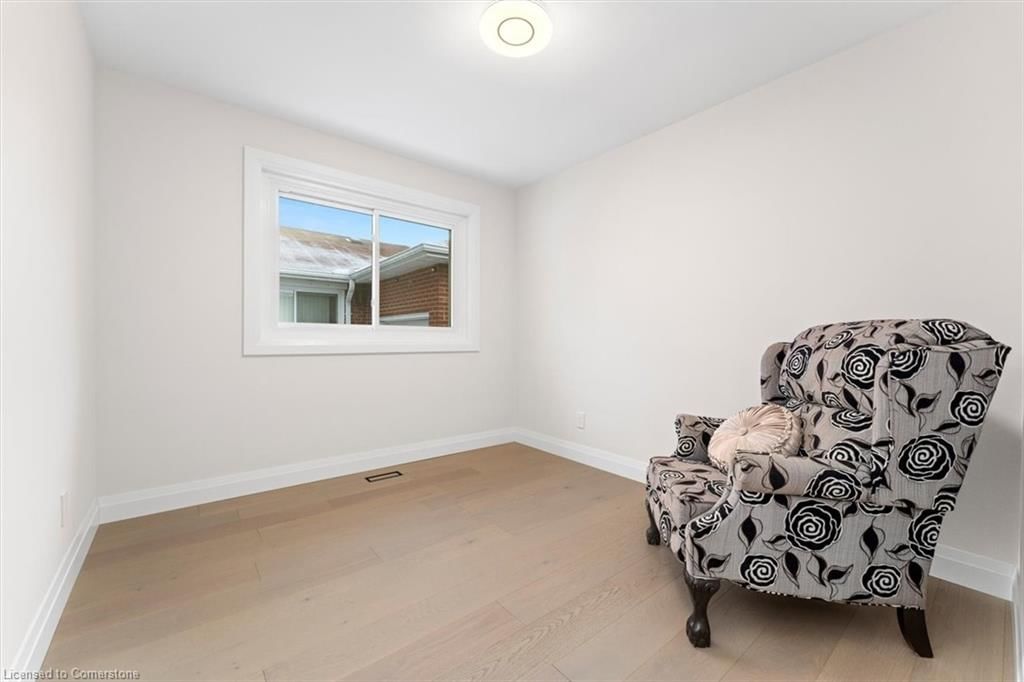
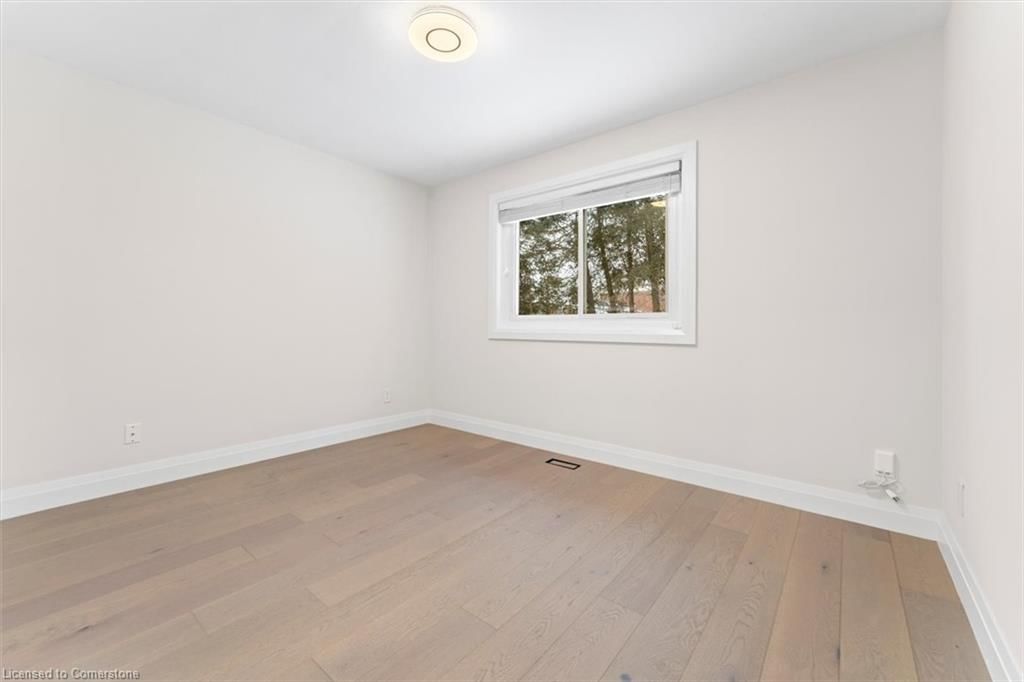
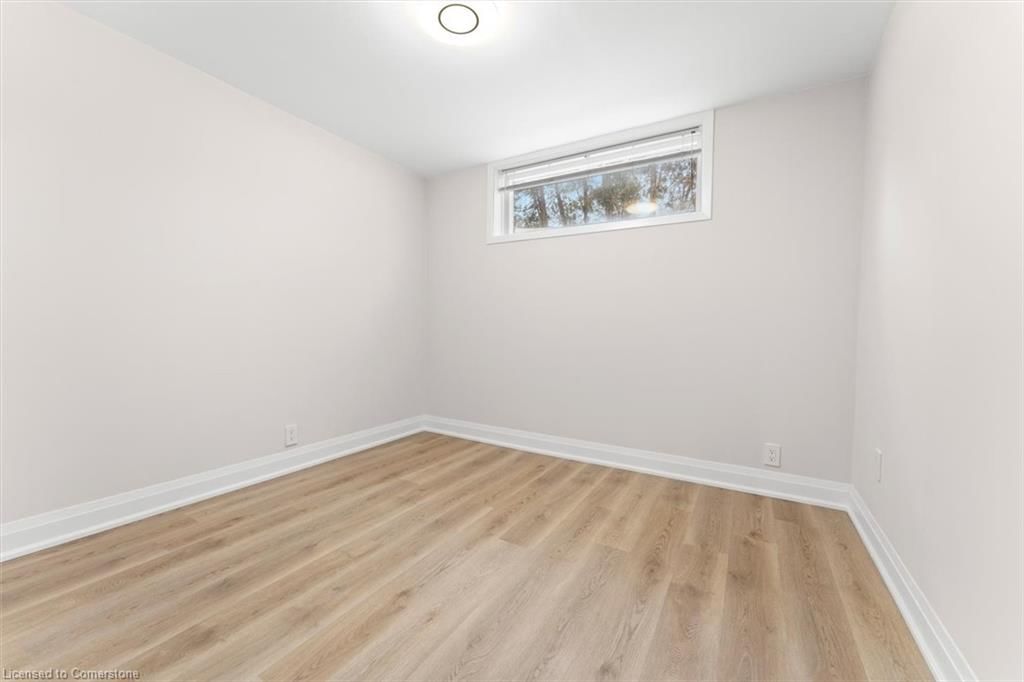
Bedroom
Kitchen
Dining Room
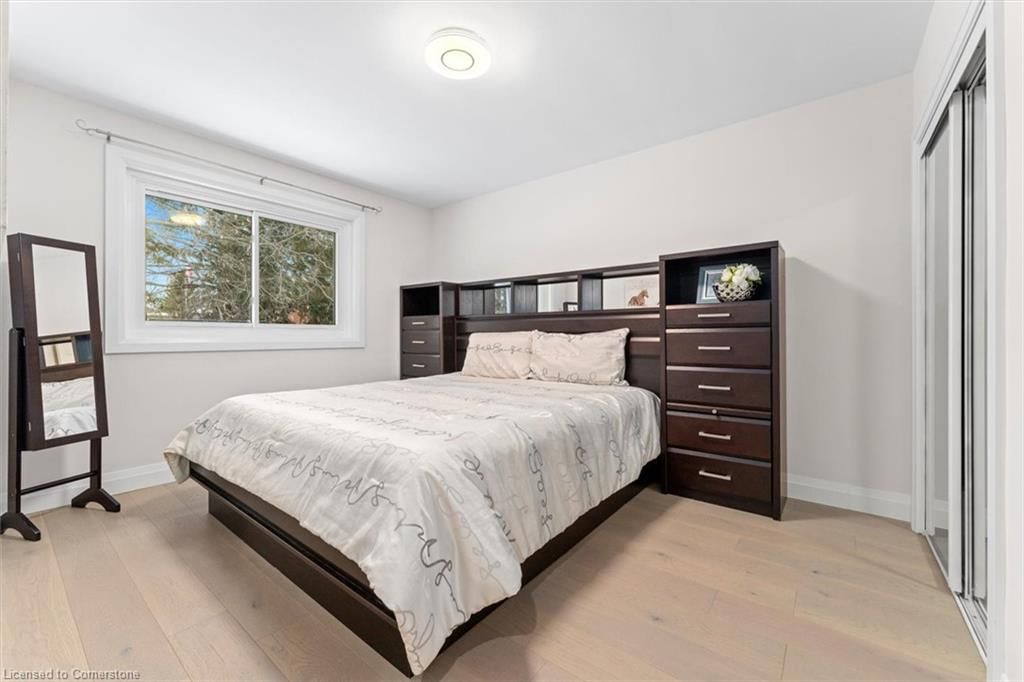
Bedroom Primary
Bedroom
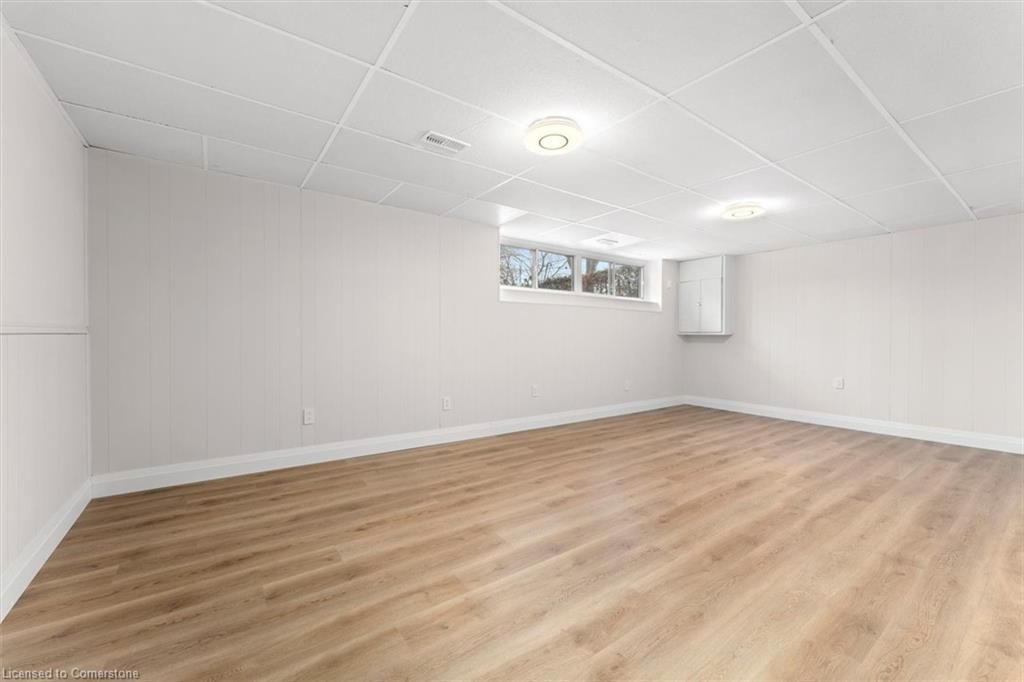
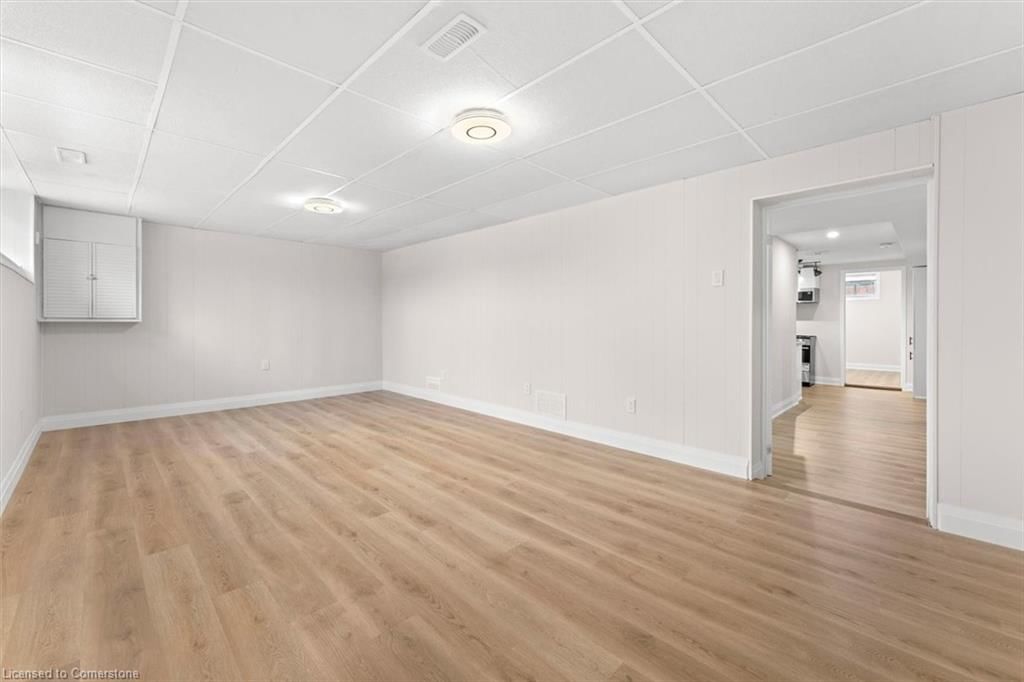
Recreation Room
Kitchen
Bedroom
Bedroom
Bedroom
The graph below compares the average list price and average sale price of homes in this neighborhood by month for the last 24 months. When average sale price is greater than average list price, this may suggest a buyer's market. When average sale price is lower than the average list price this may suggest a seller's market.
The graph below illustrates the average days on market for homes in this neighborhood. The yellow area may indicate a buyer's market, the green area may indicate a balanced market and the red area may indicate a seller's market.
Sales Representative, Century 21 People’s Choice Realty Inc., Brokerage
(647) 576 - 2100