
Century 21 People’s Choice Realty Inc., Brokerage
120 MATHESON BLVD E #103
MISSISSAUGA, Ontario
L4Z 1X1
Toronto, St. Andrew-Windfields, M2L 2E1
$3,488,800
Listed by RE/MAX REALTRON REALTY INC..
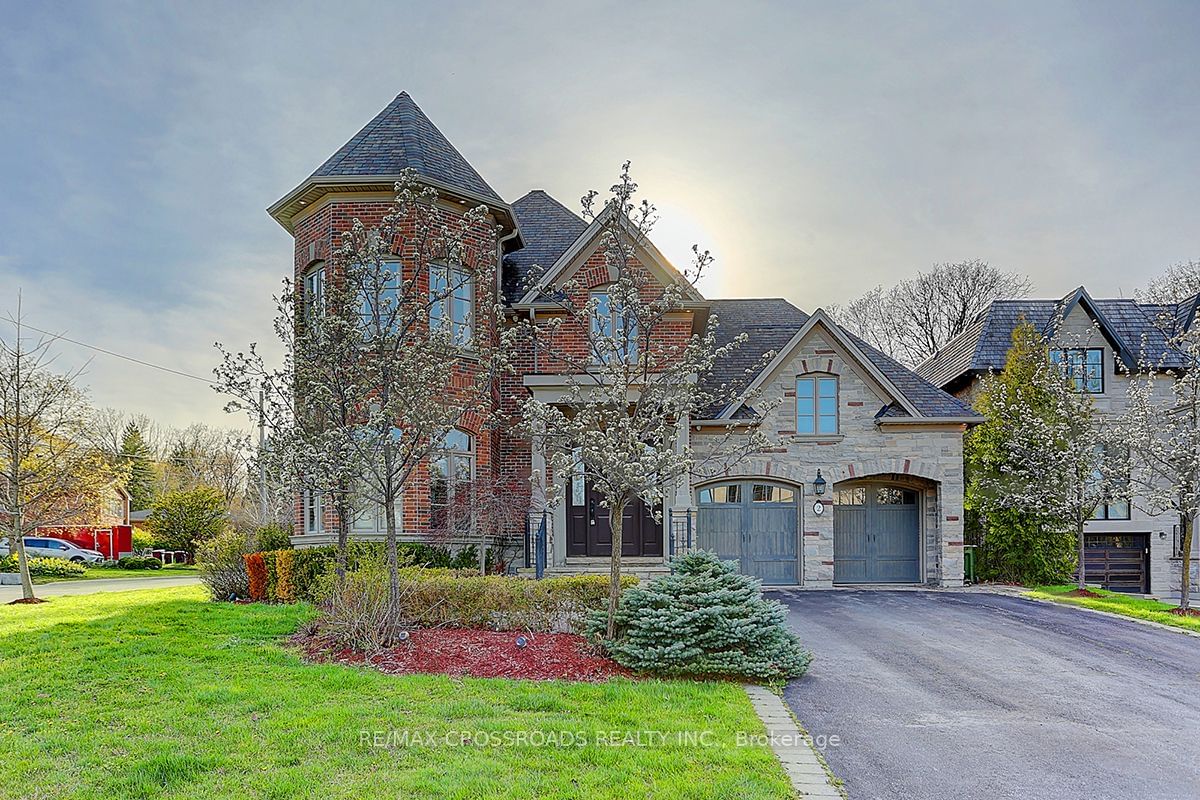
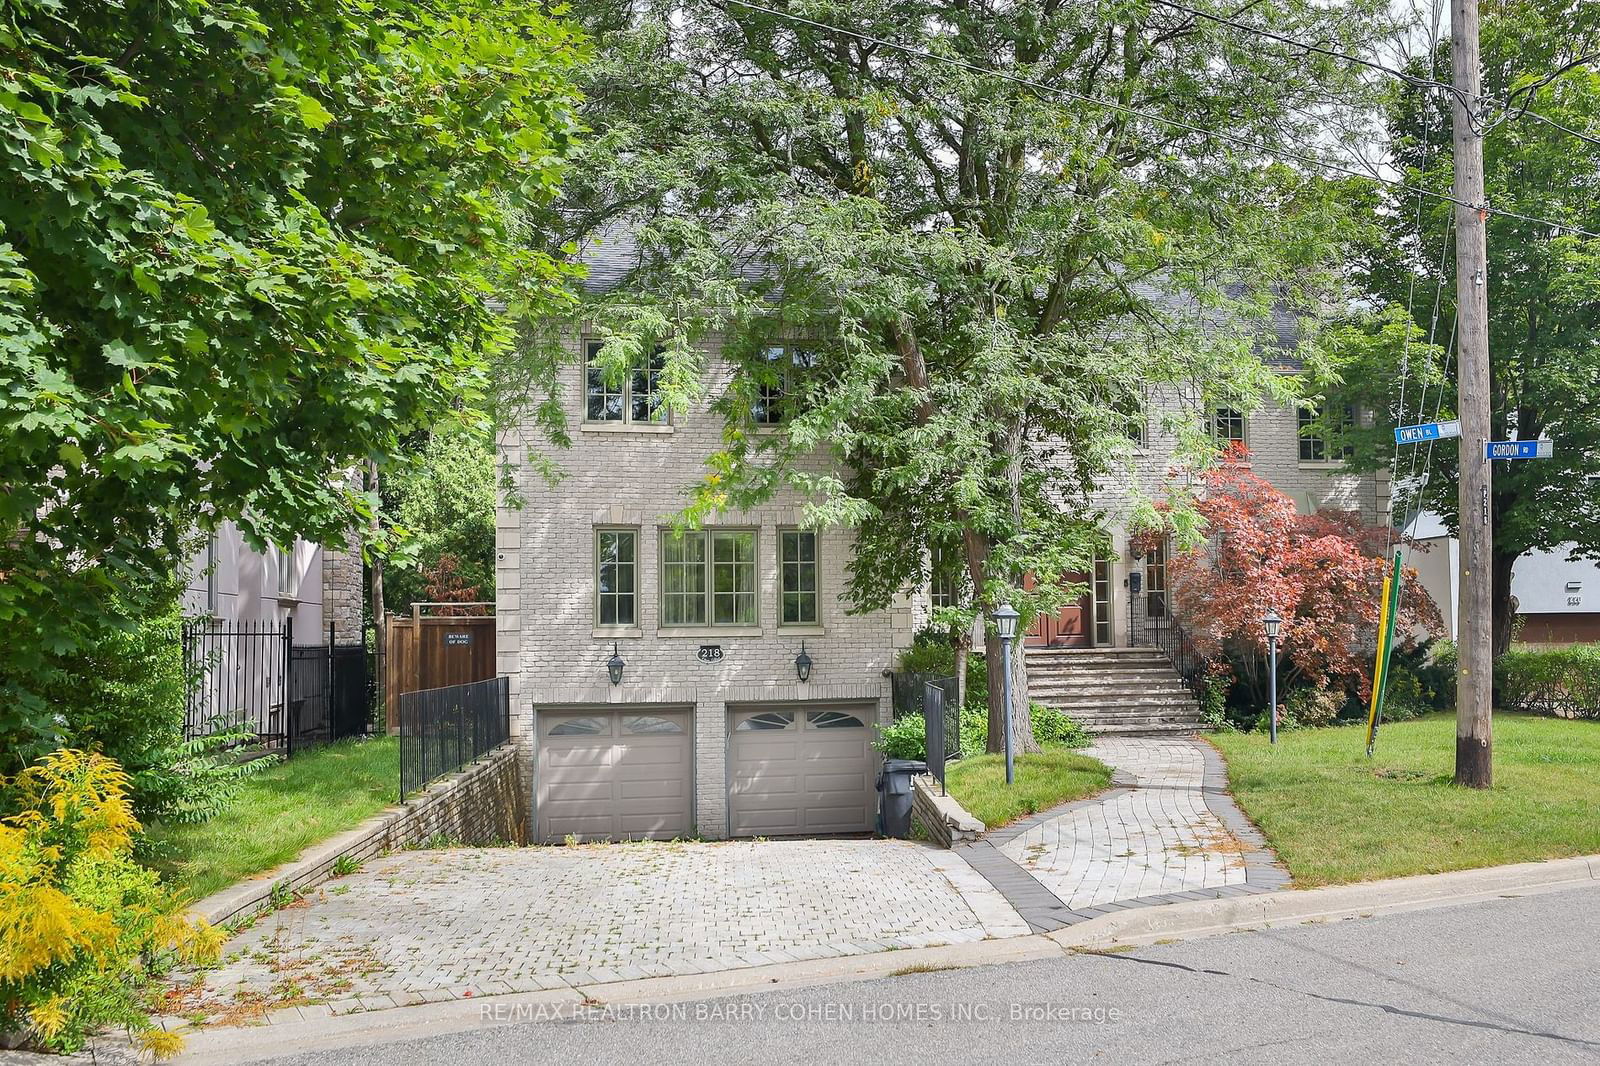
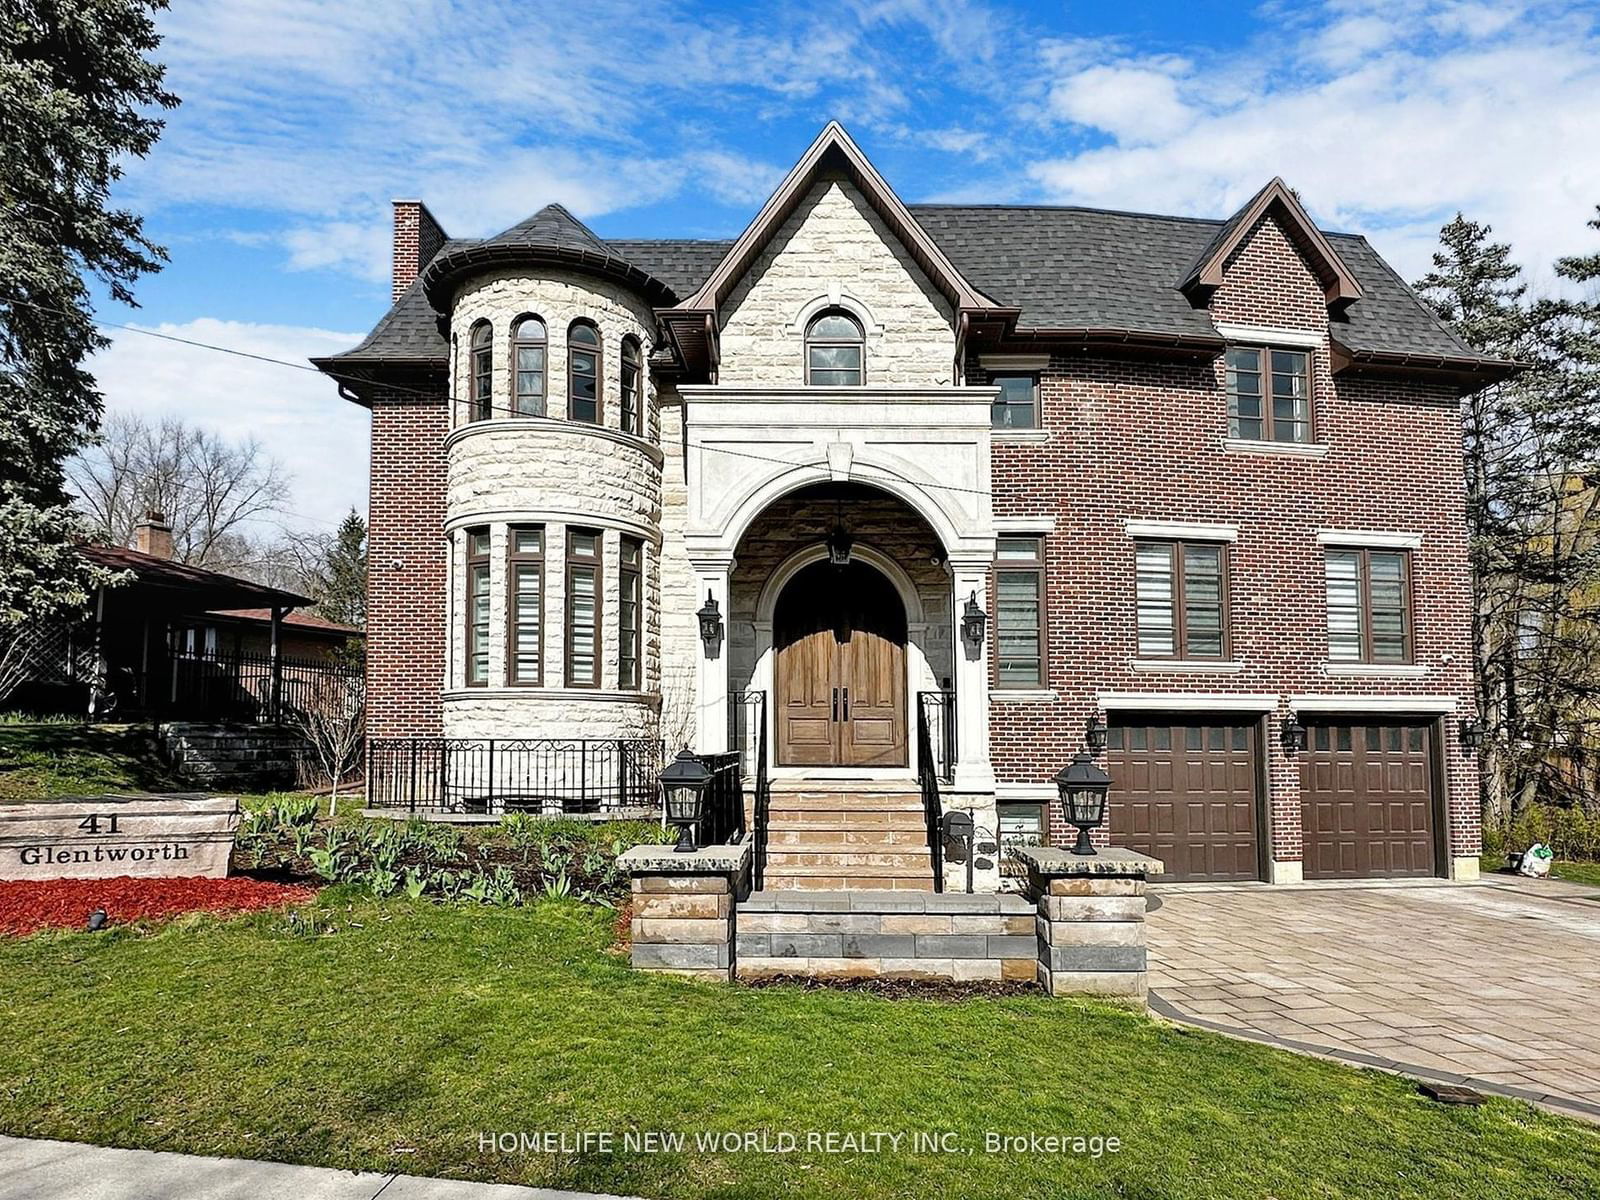
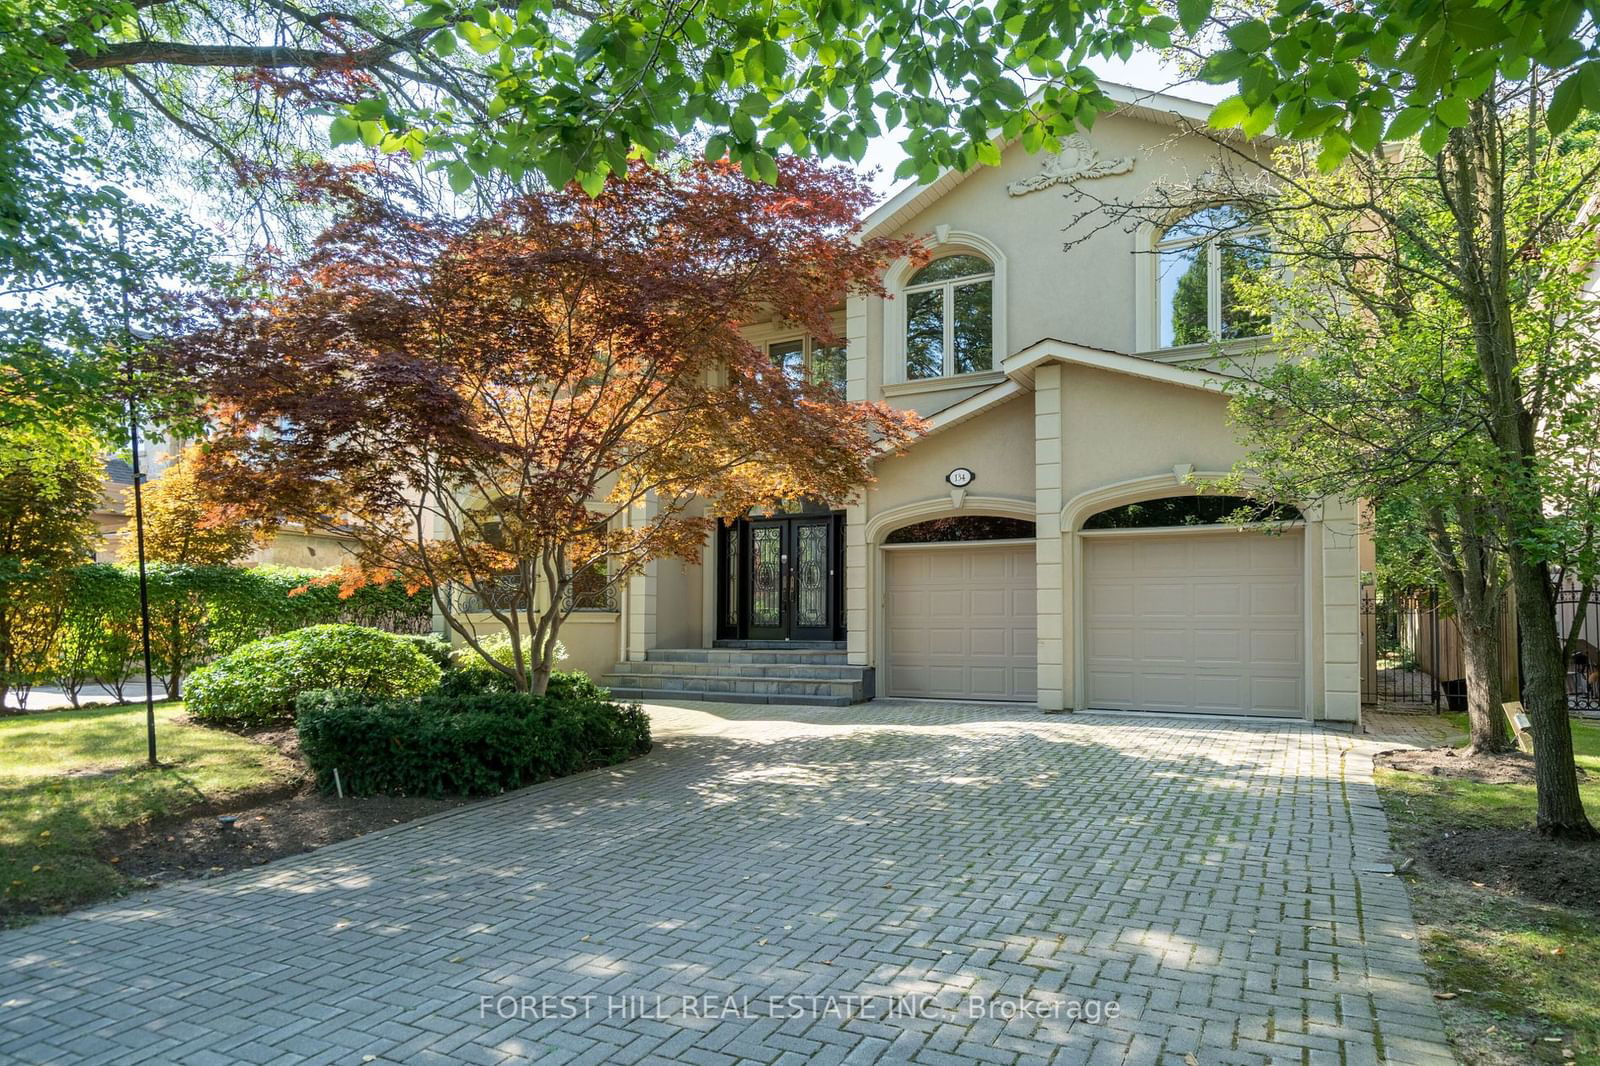
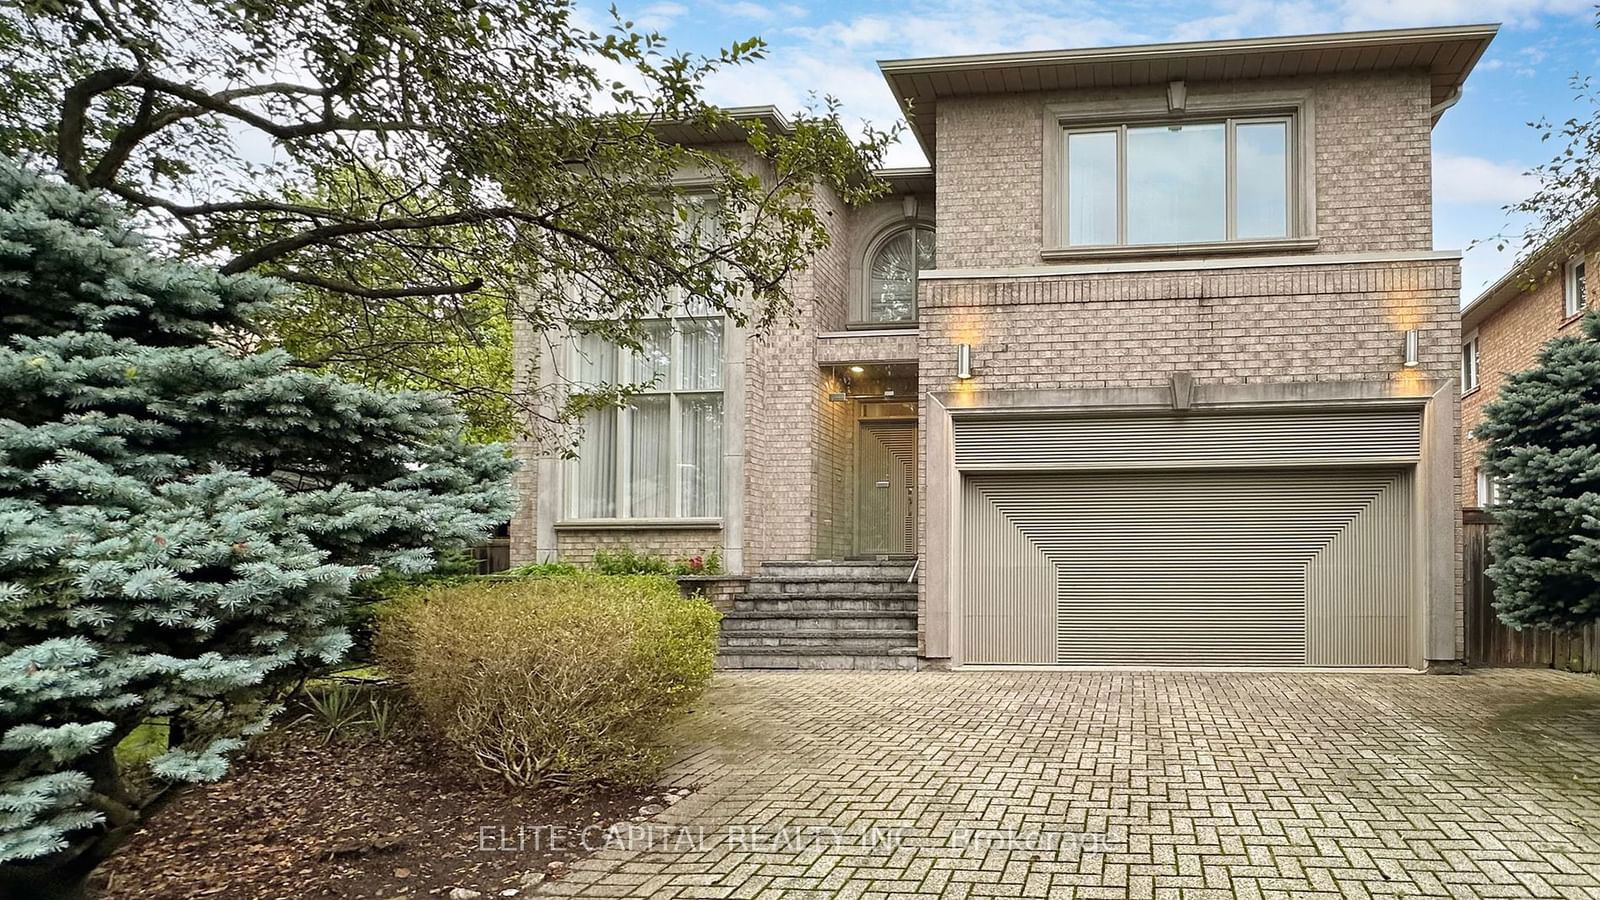
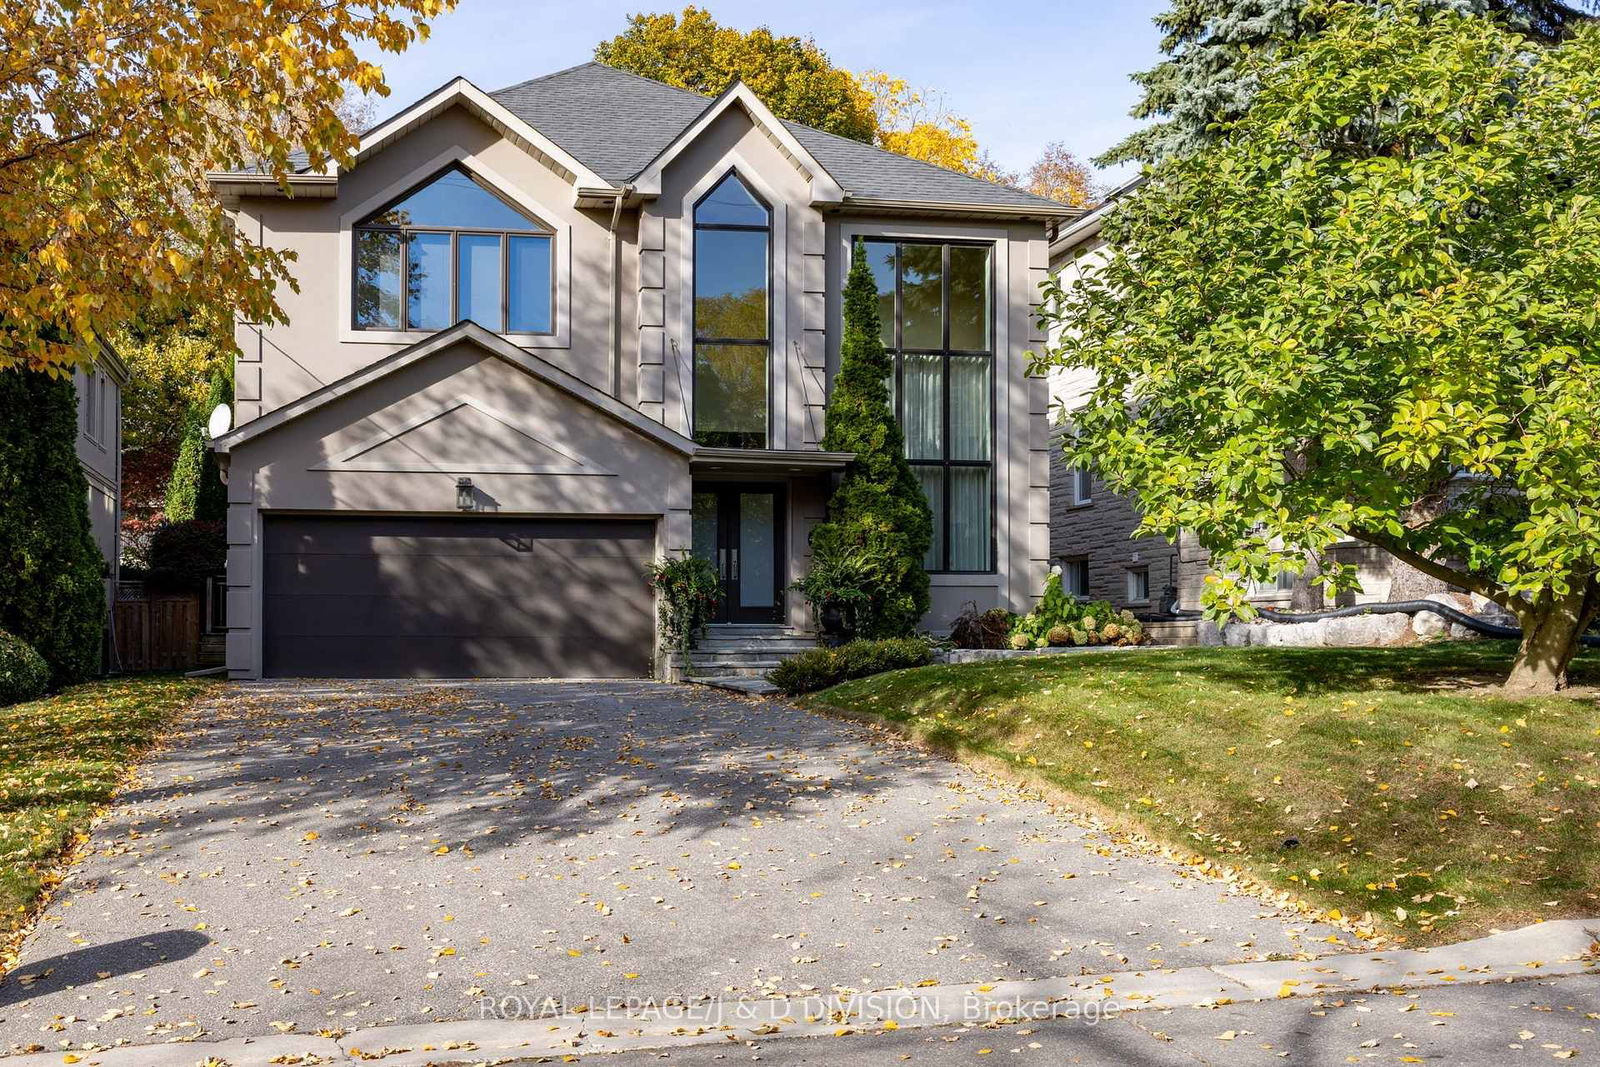
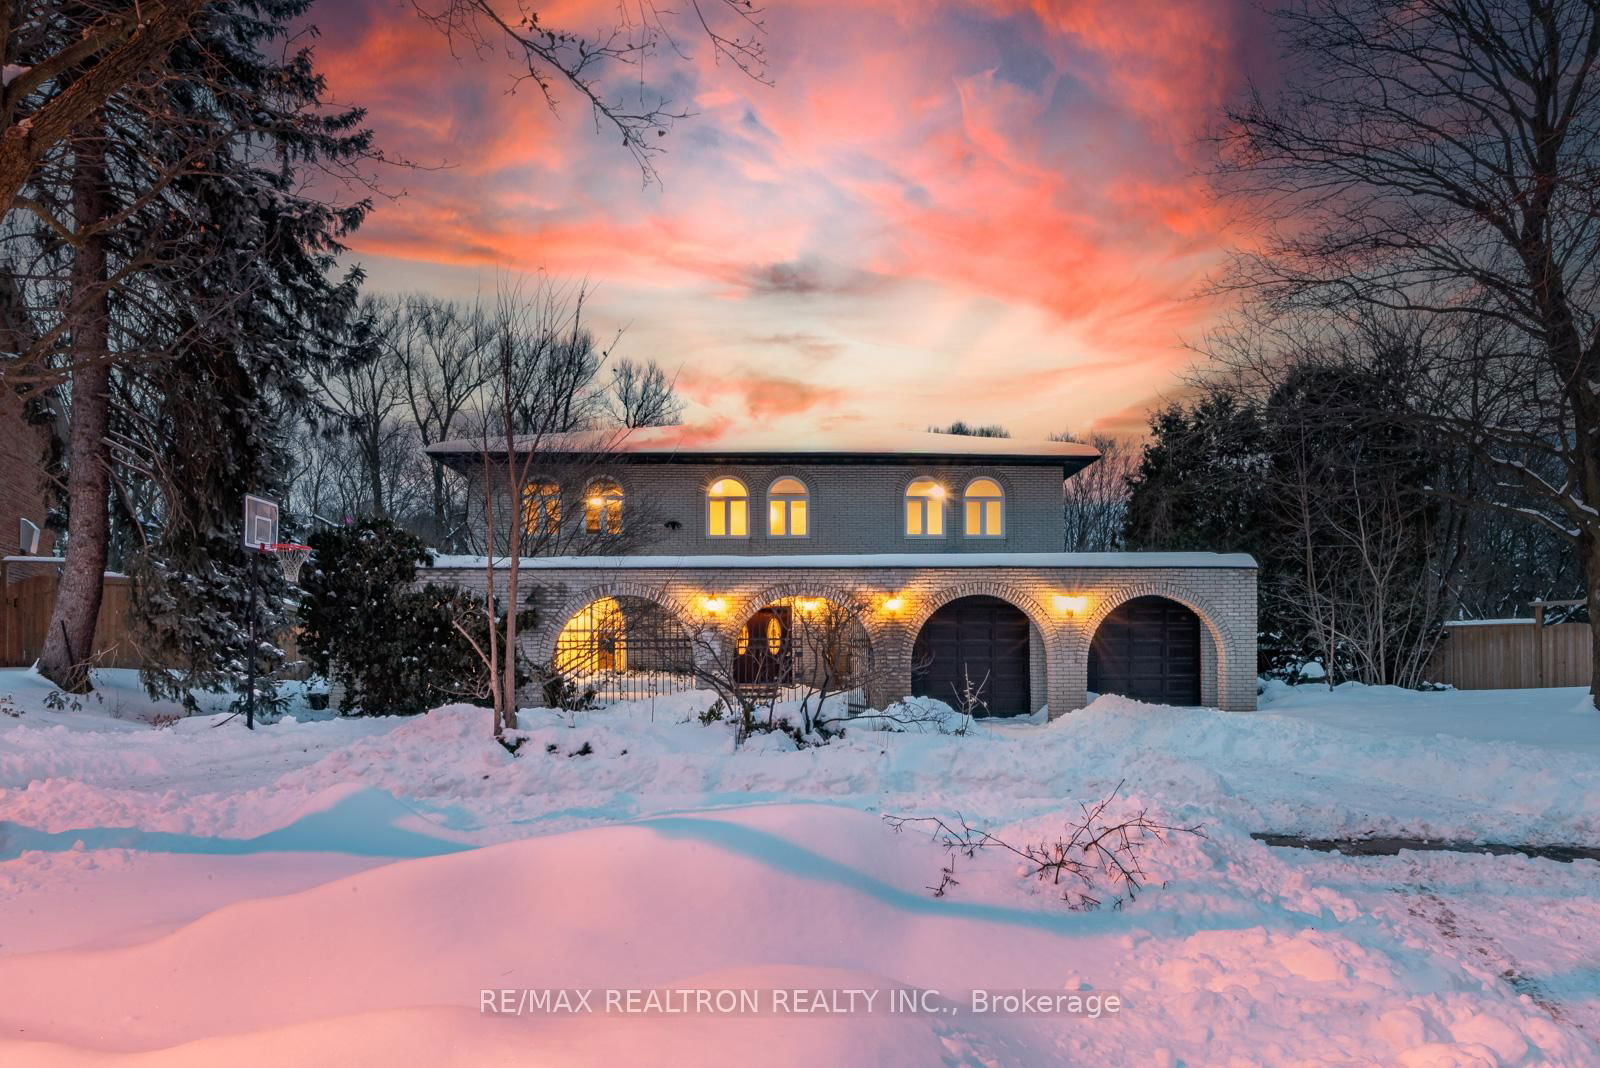
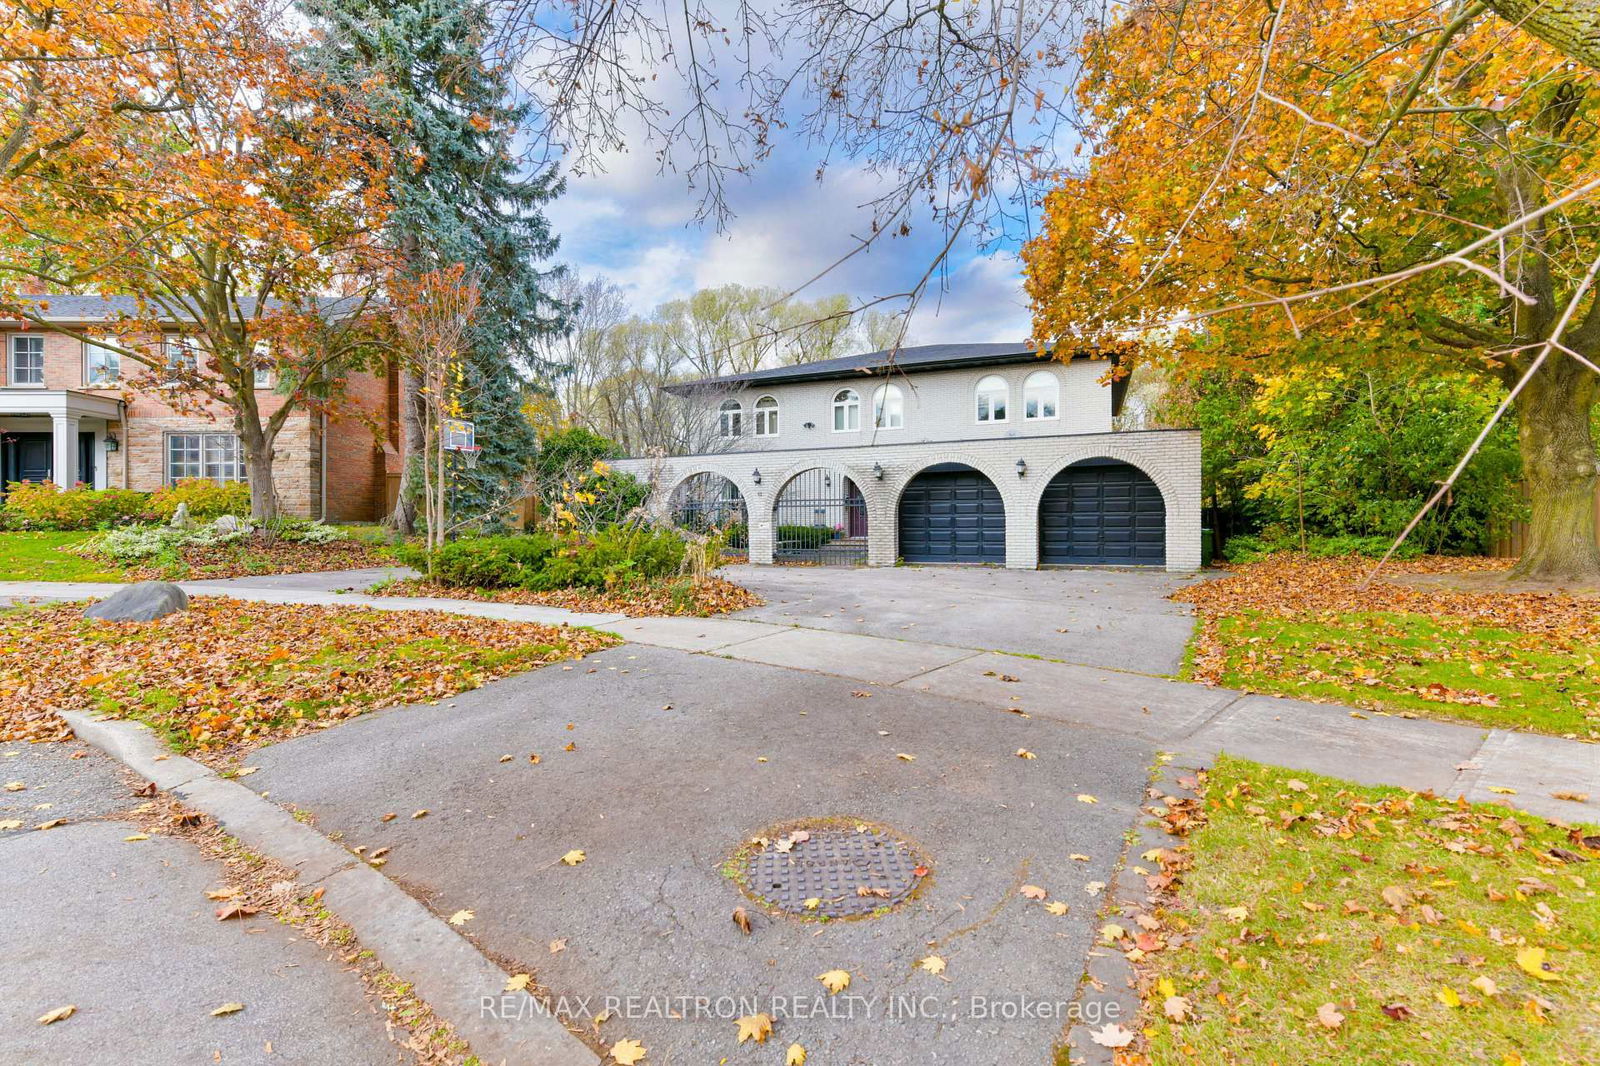
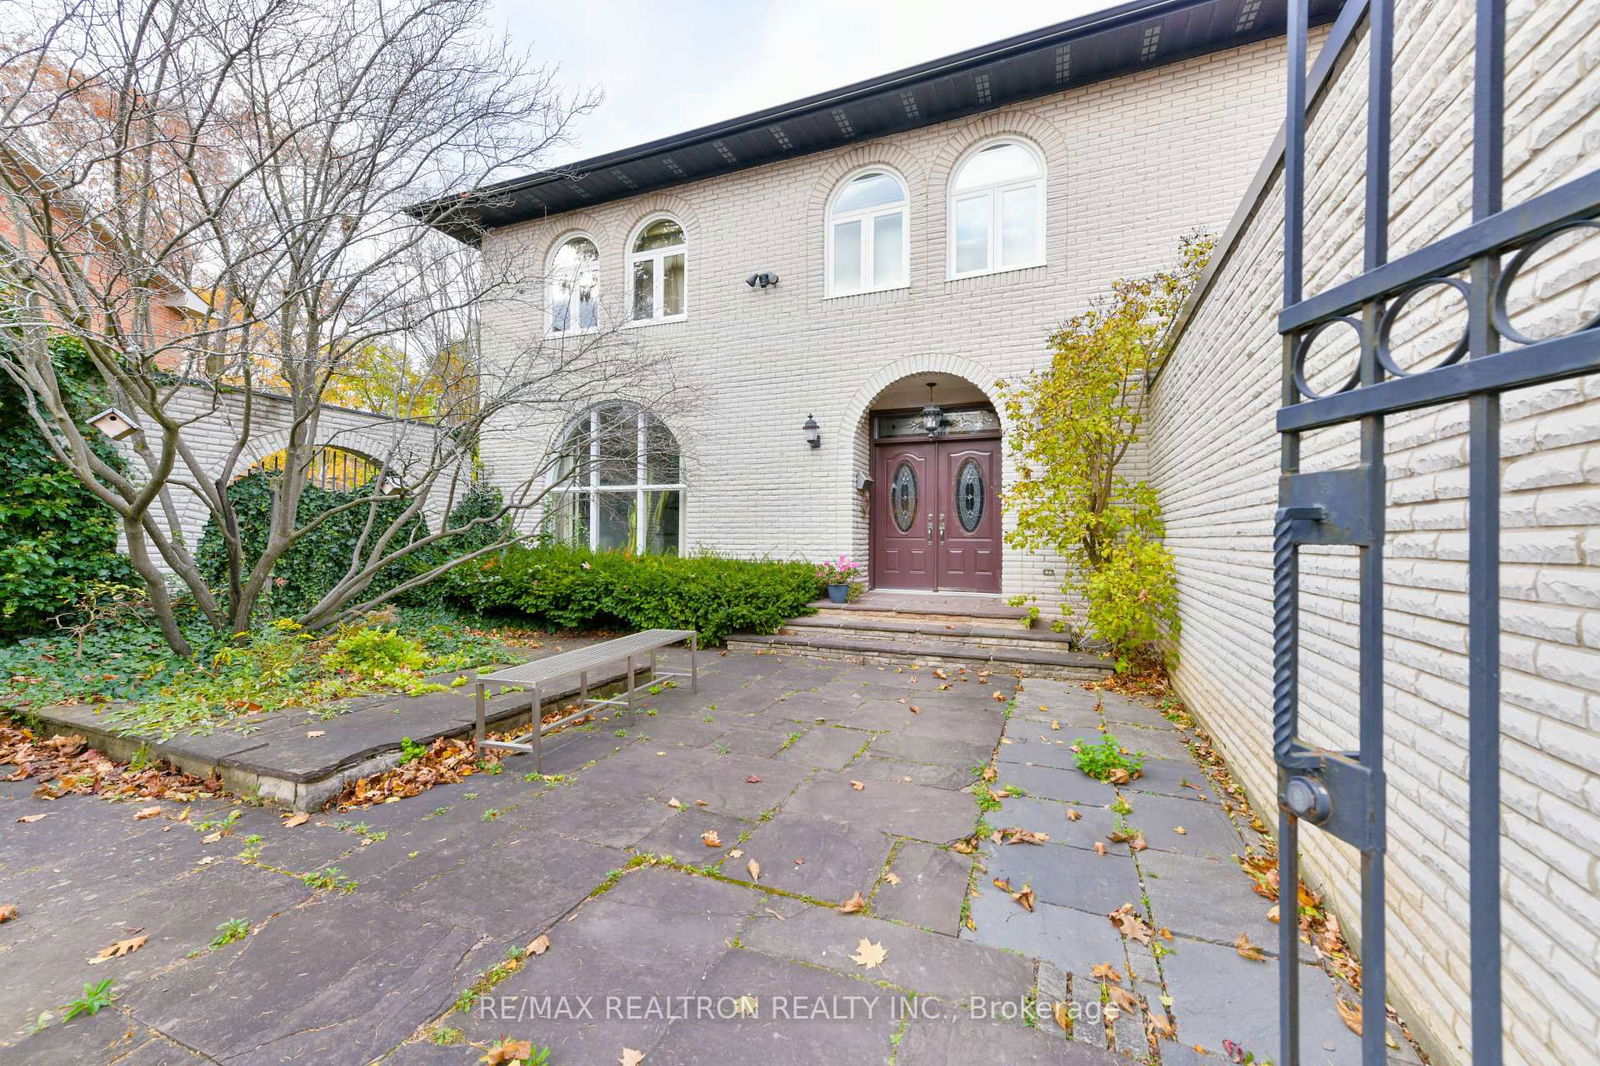
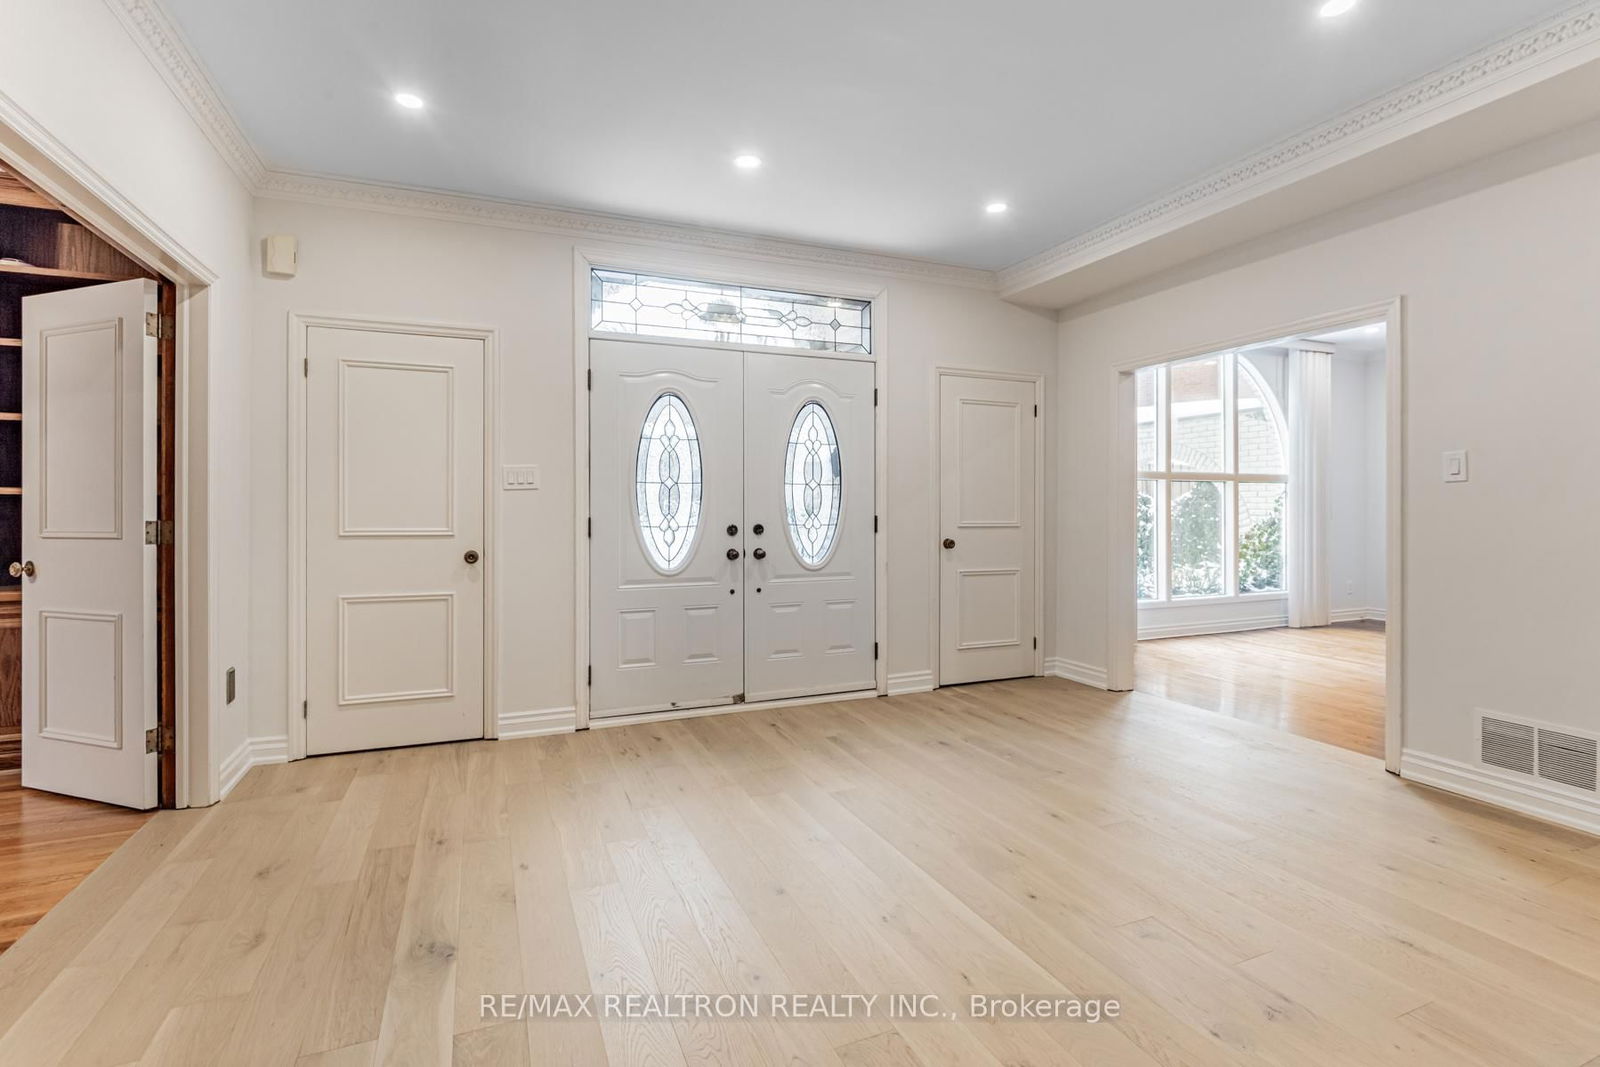
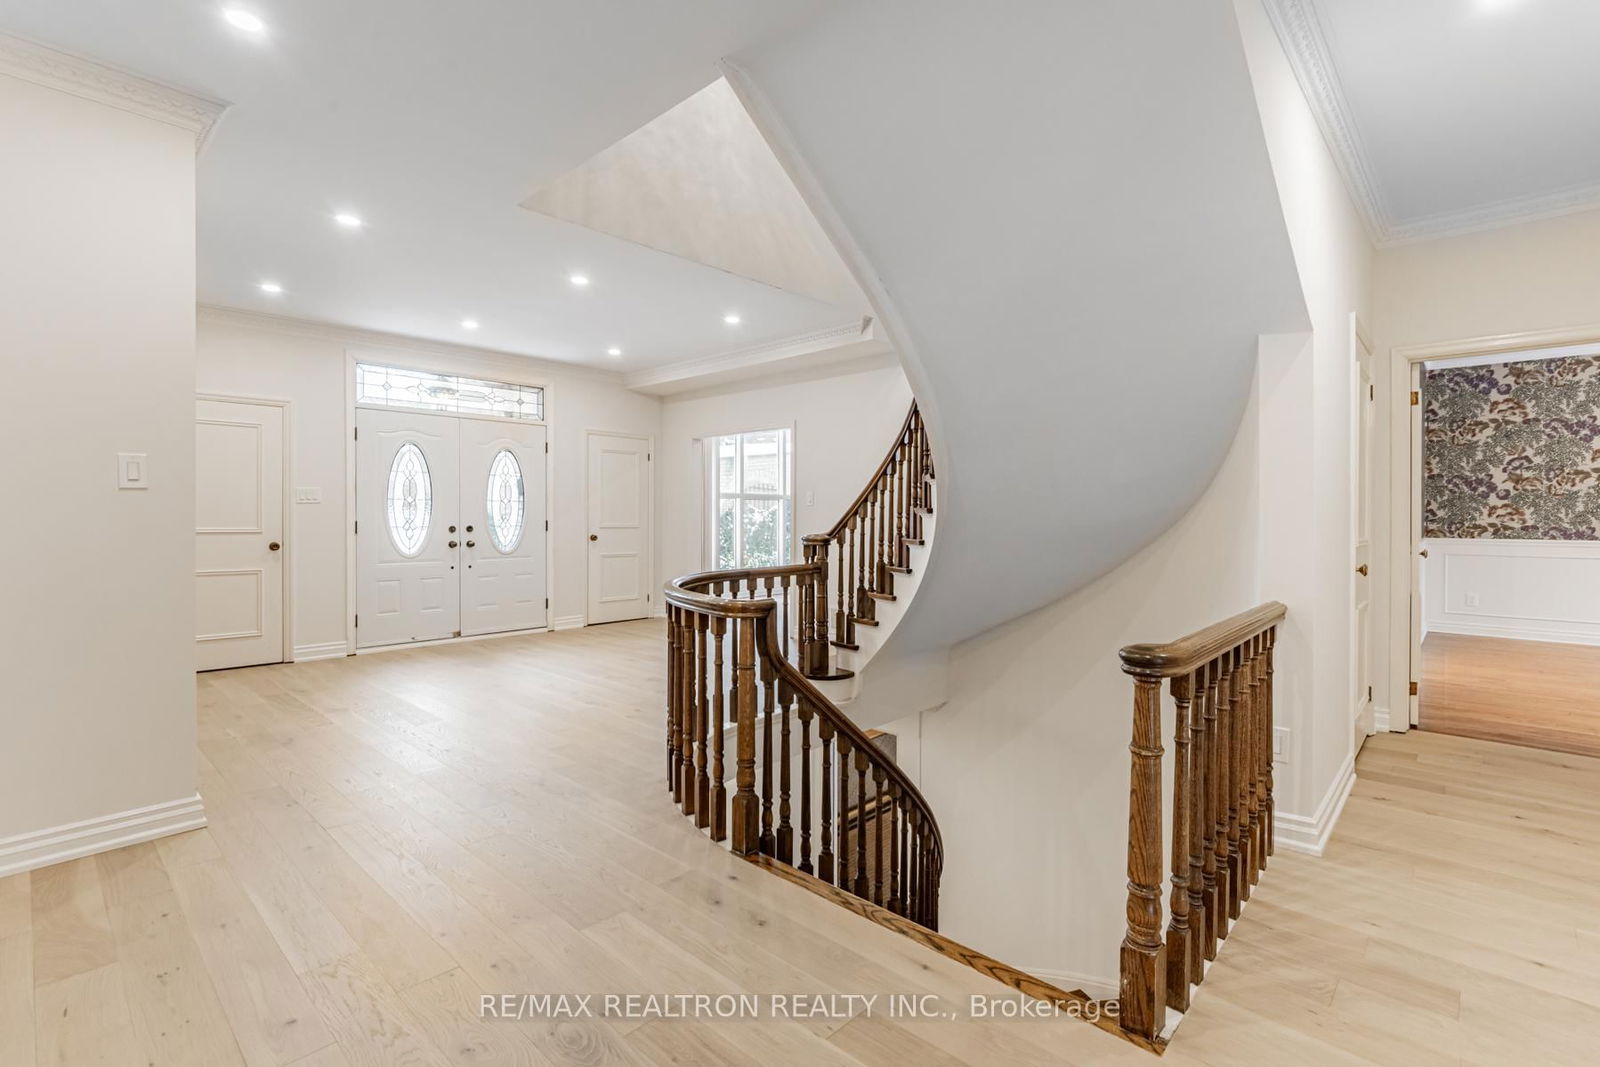
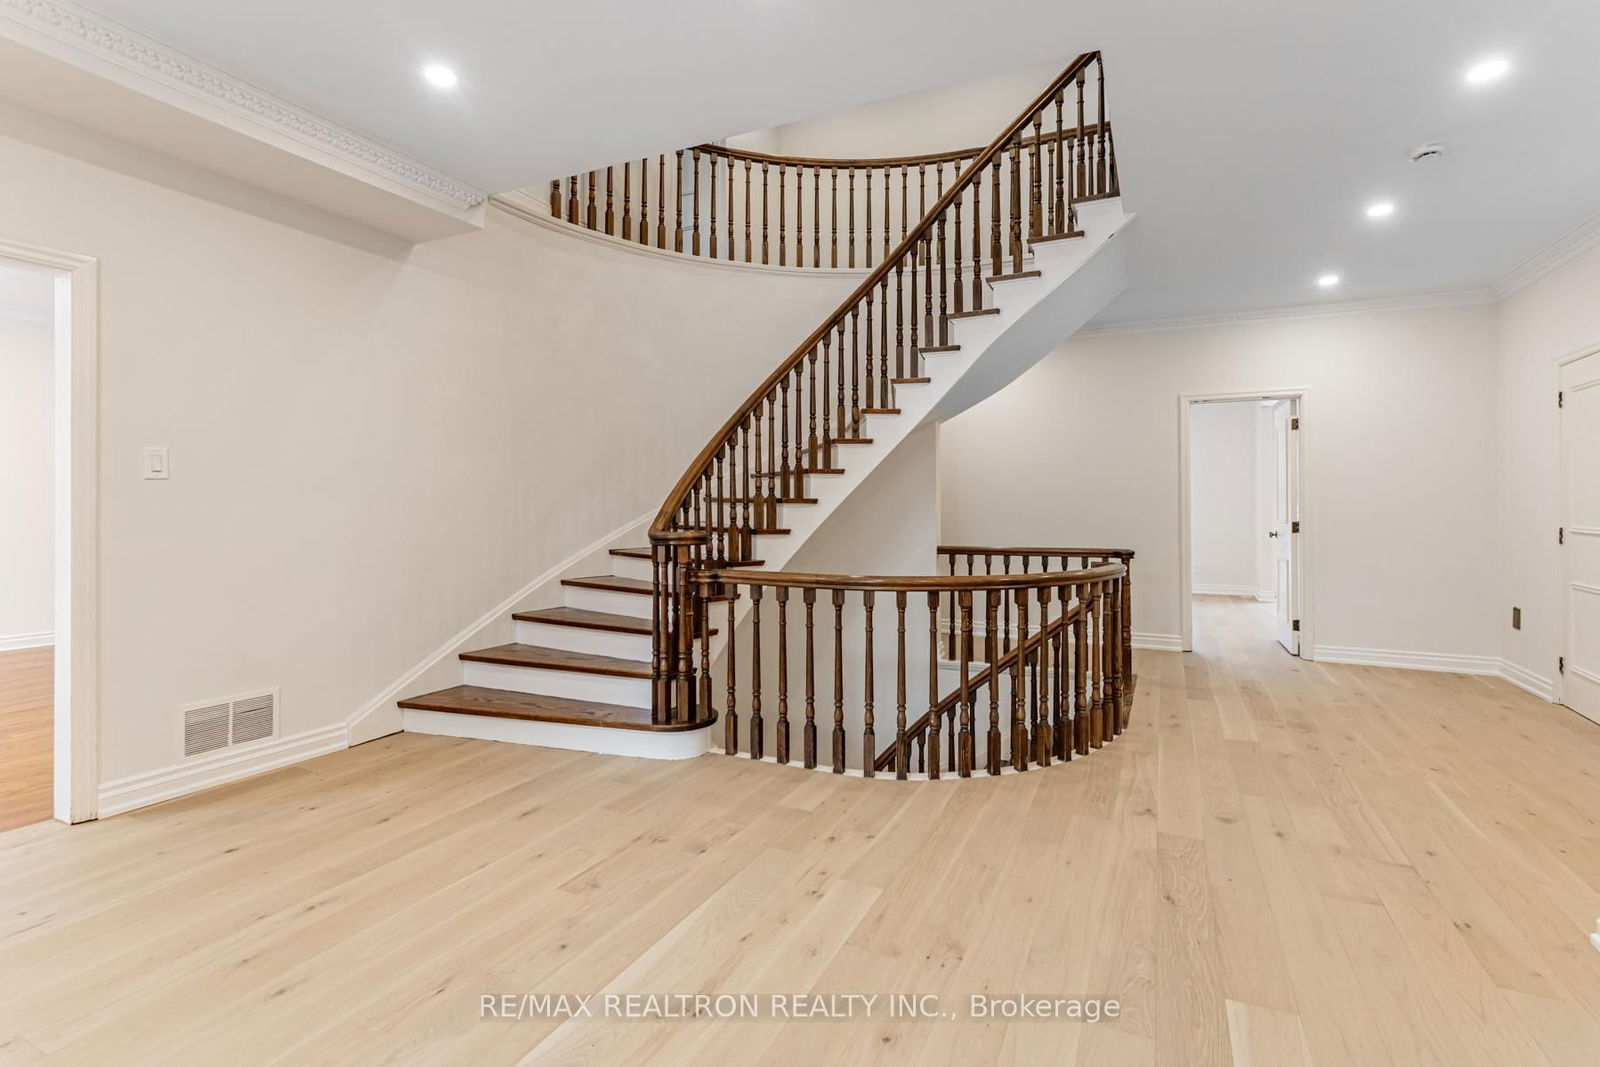
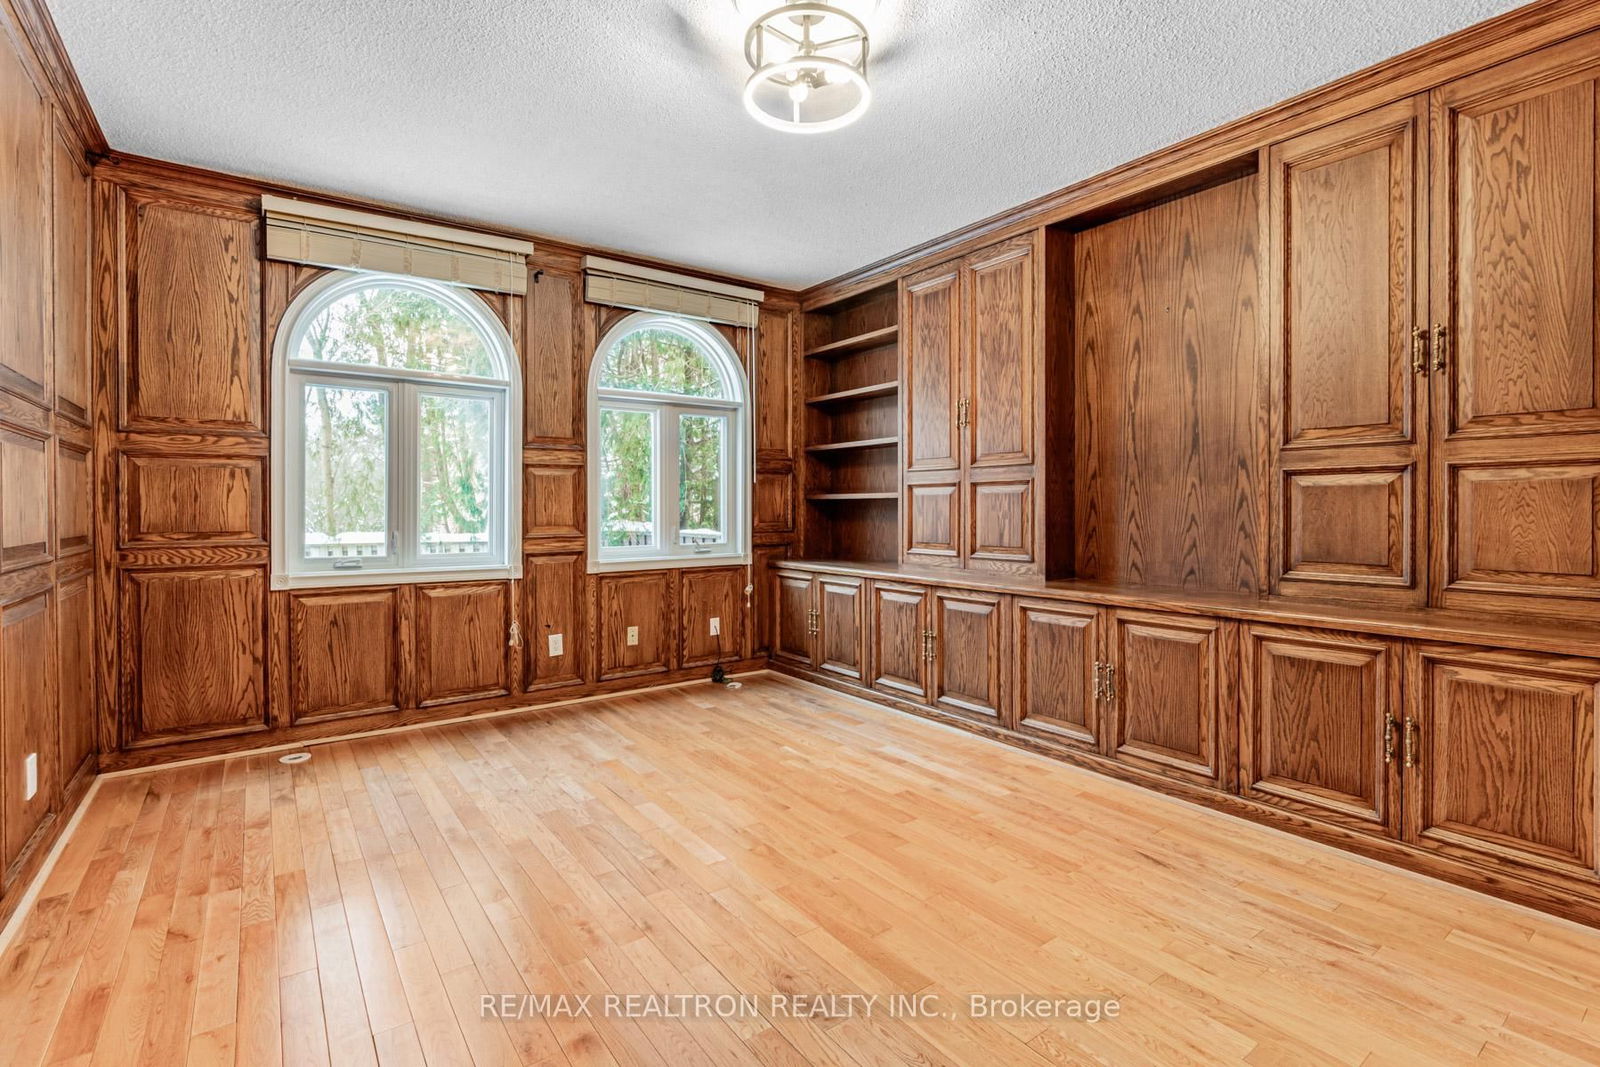
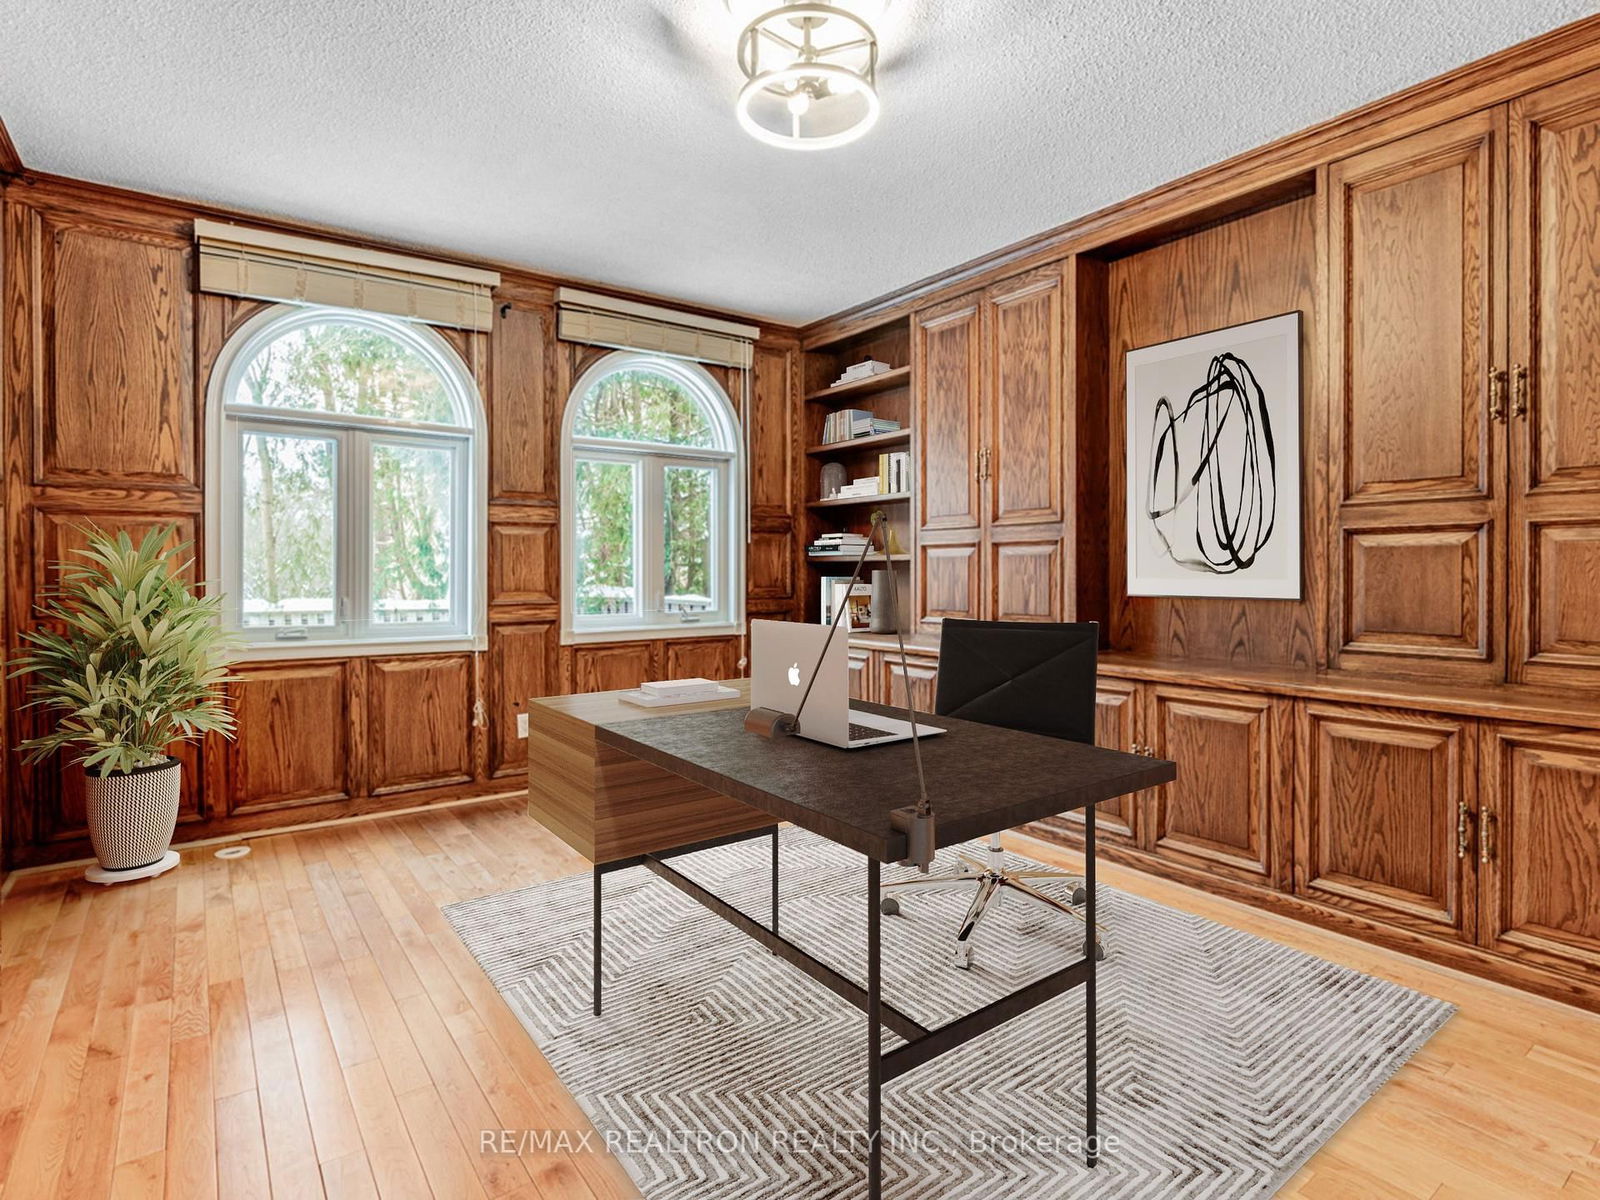
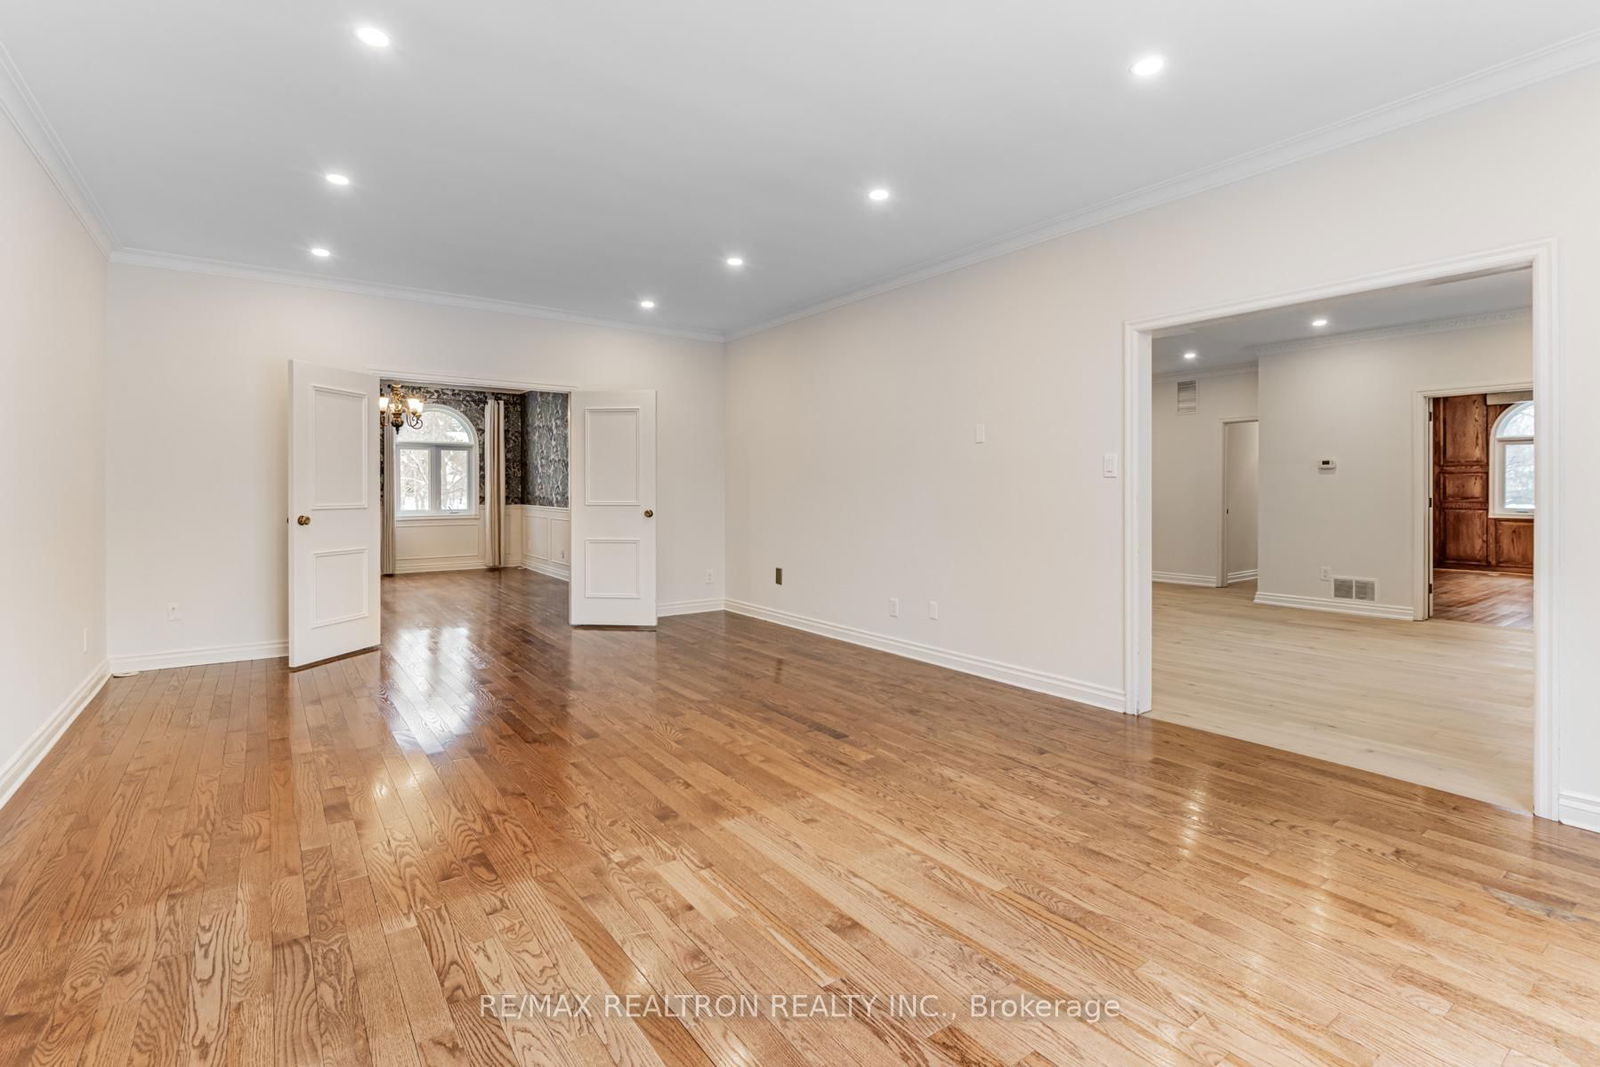
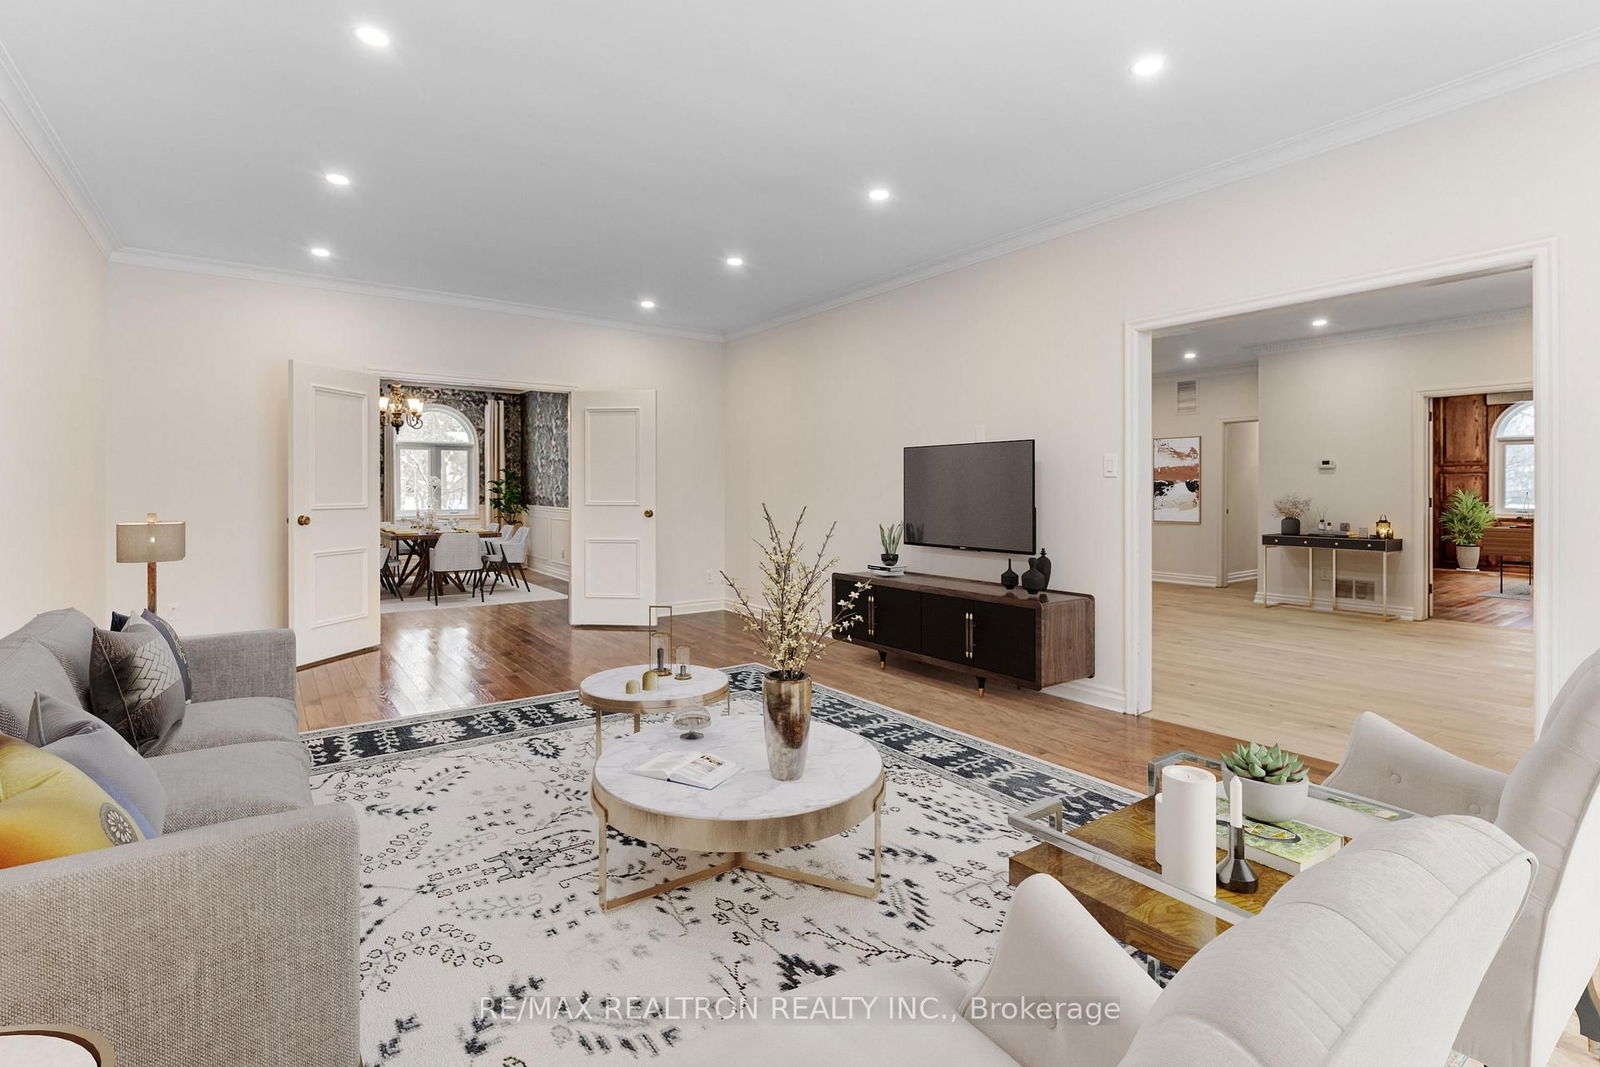
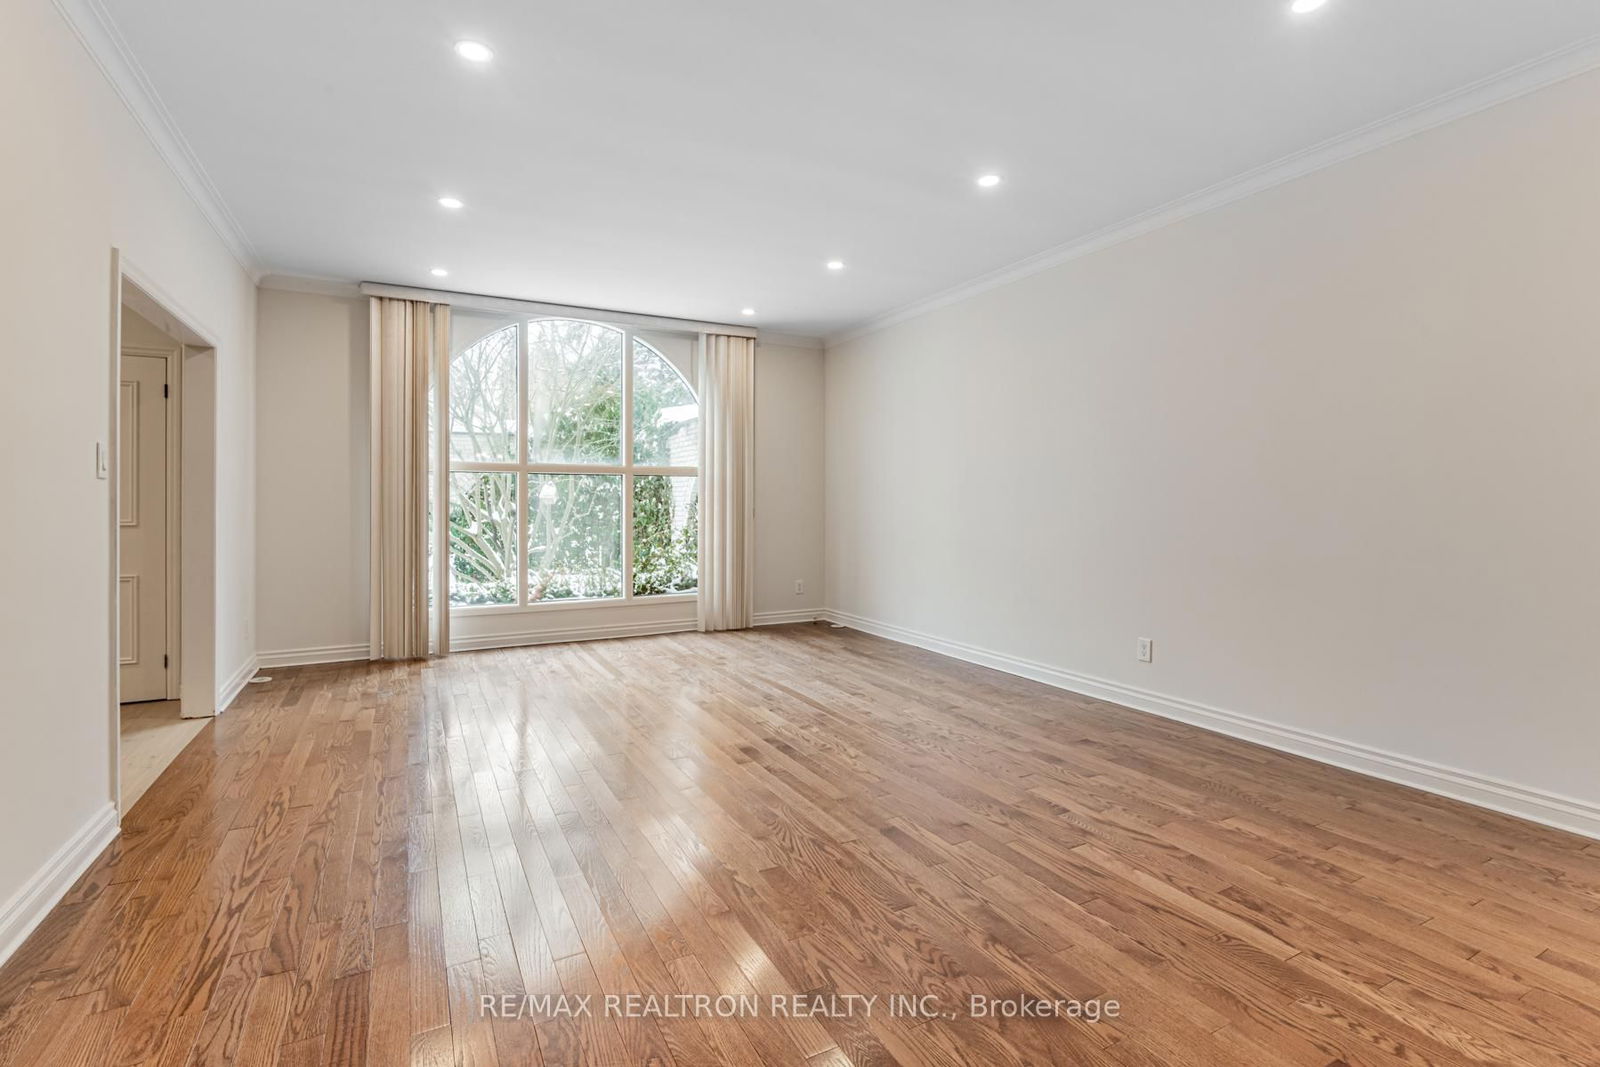
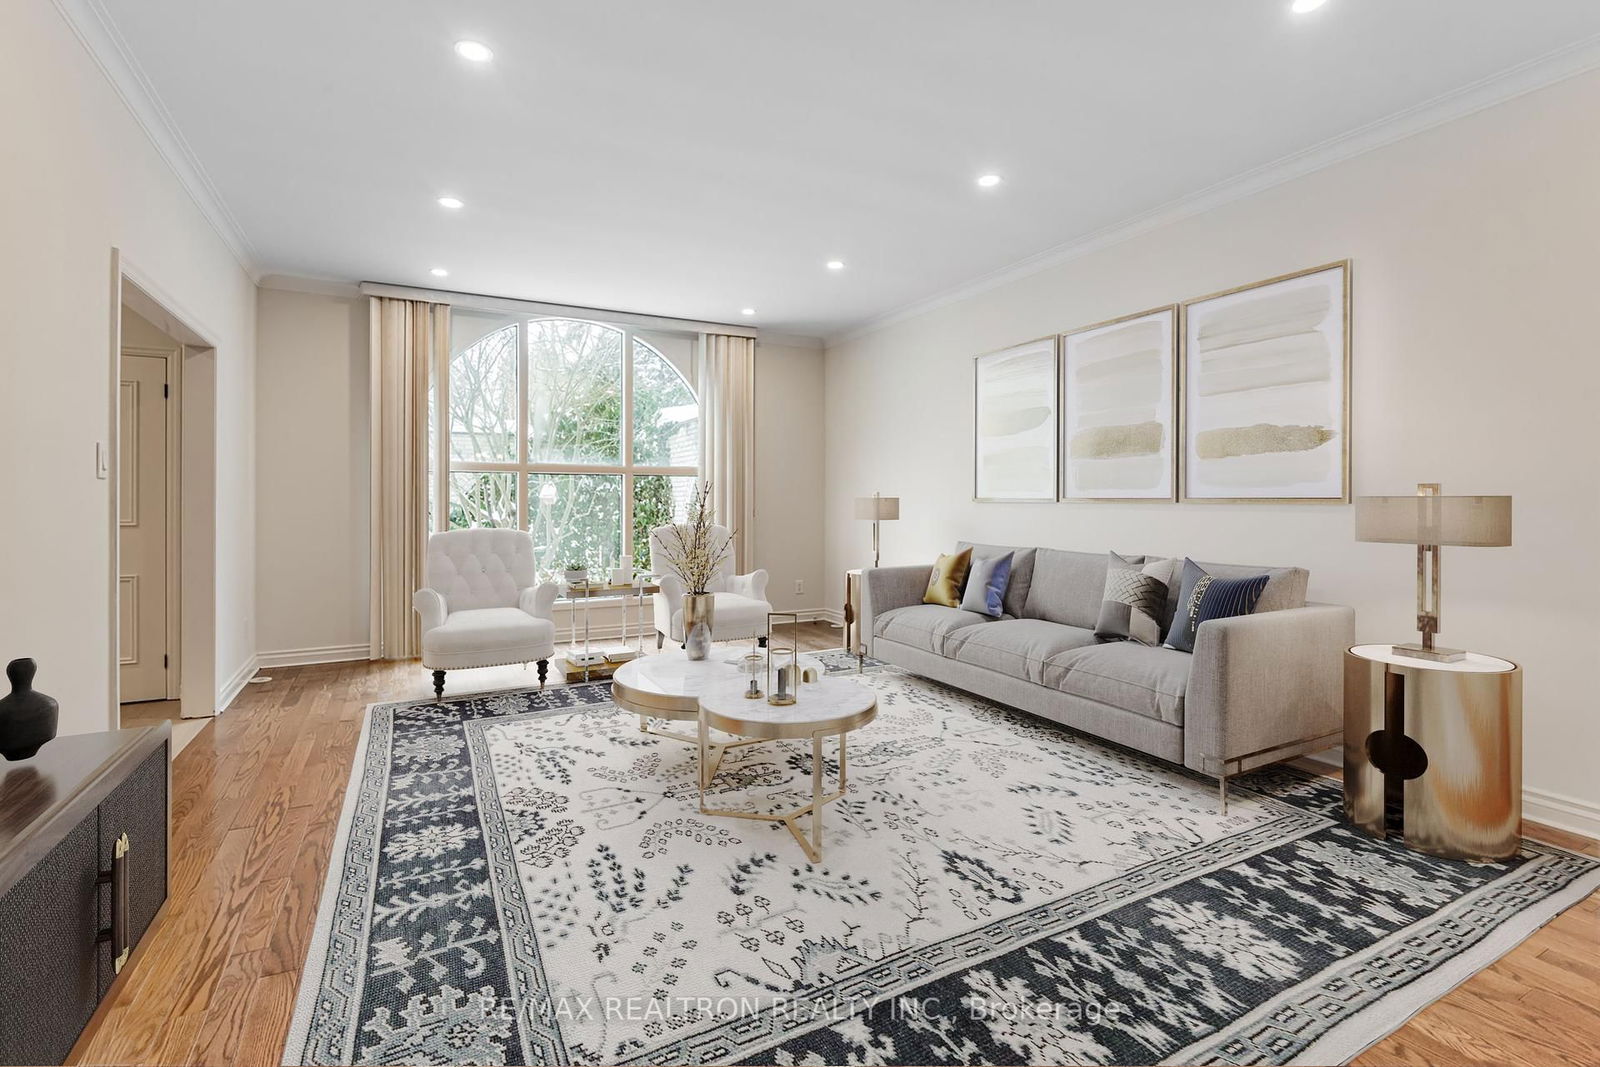
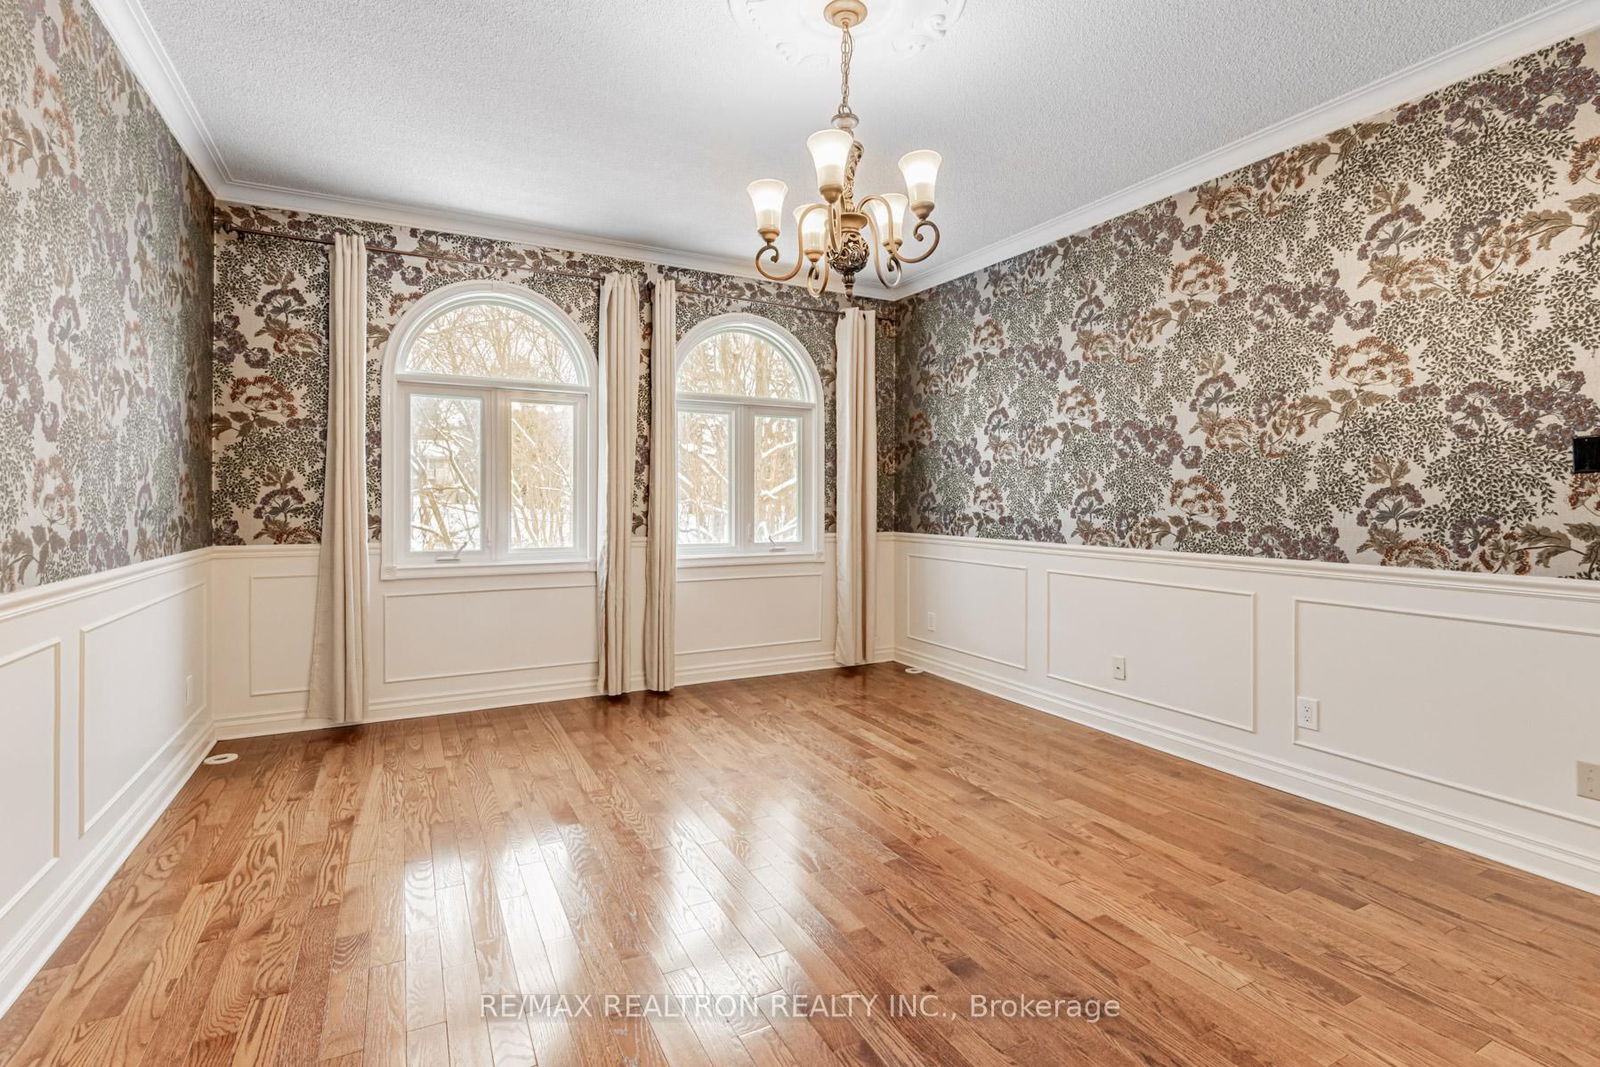
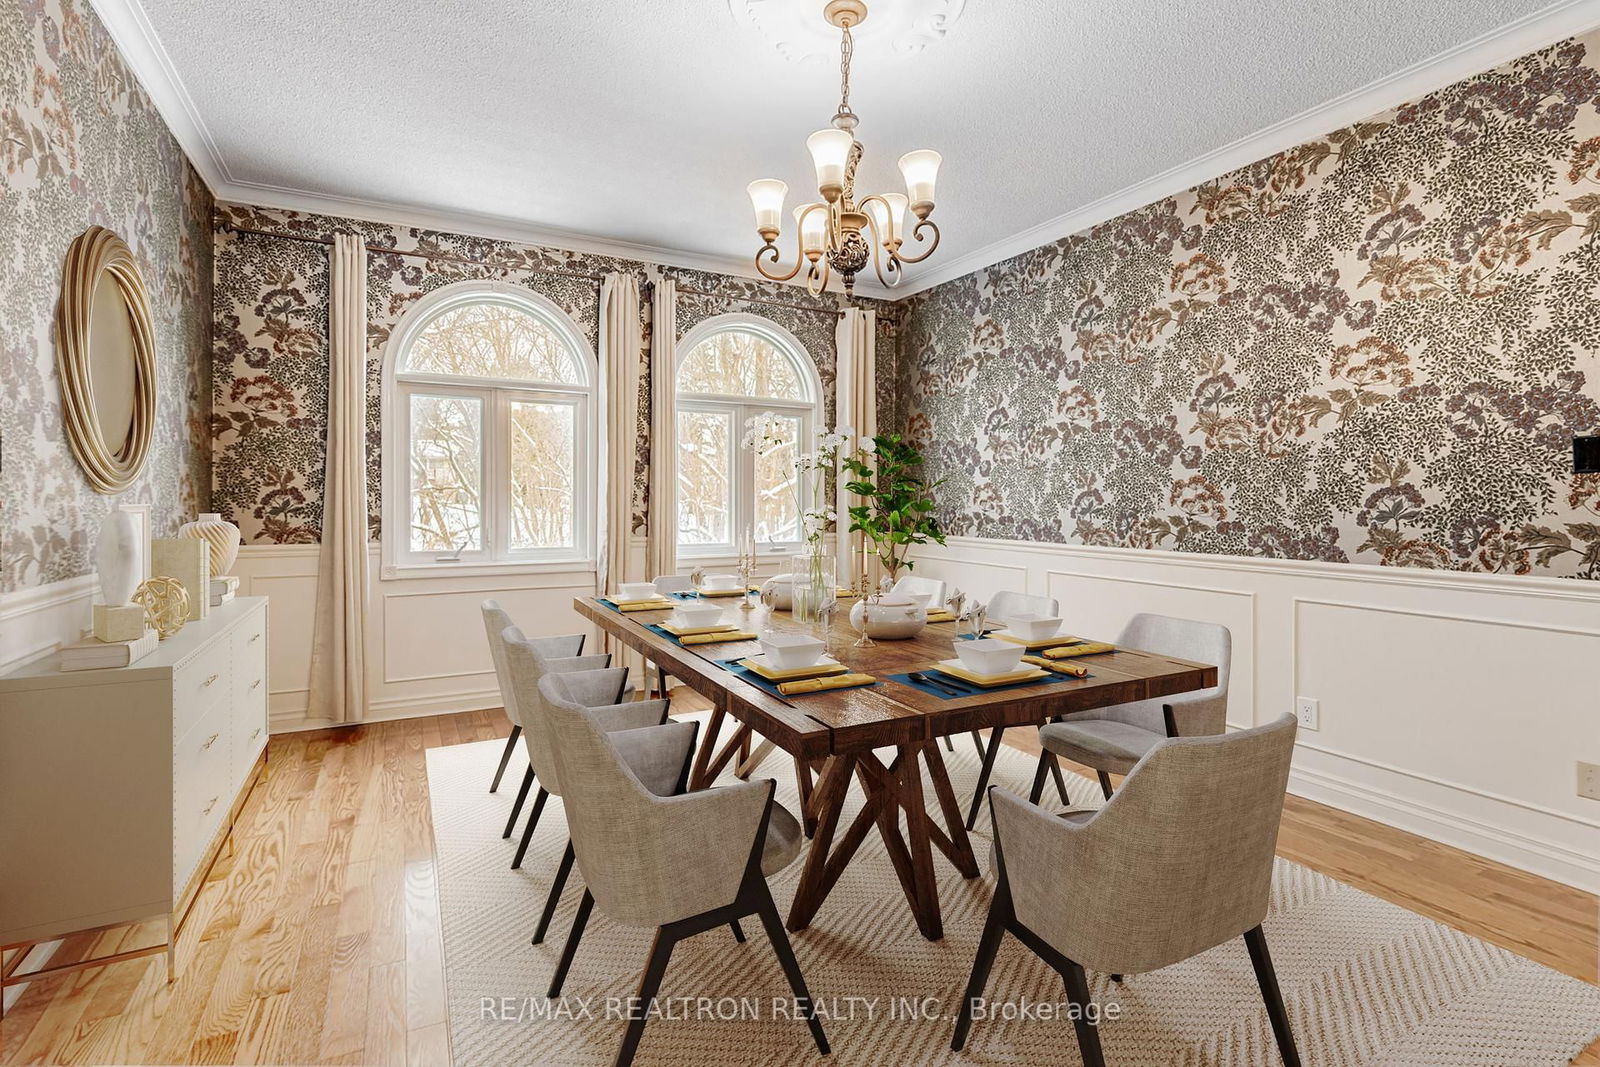
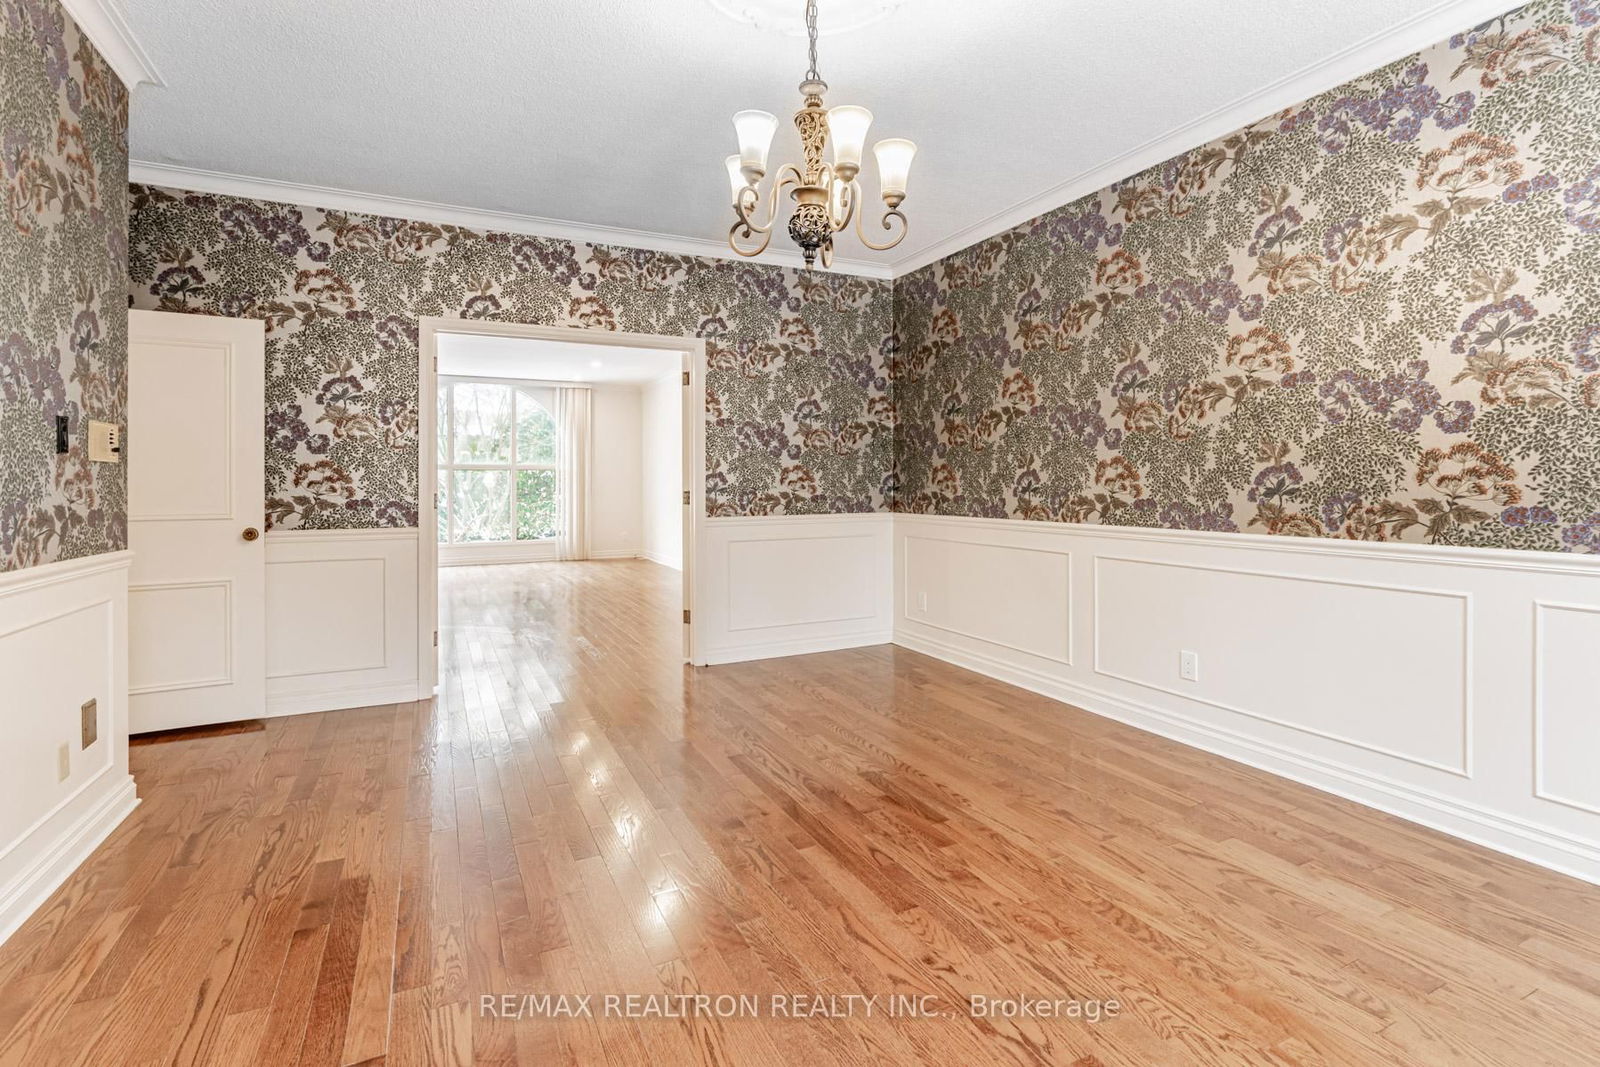
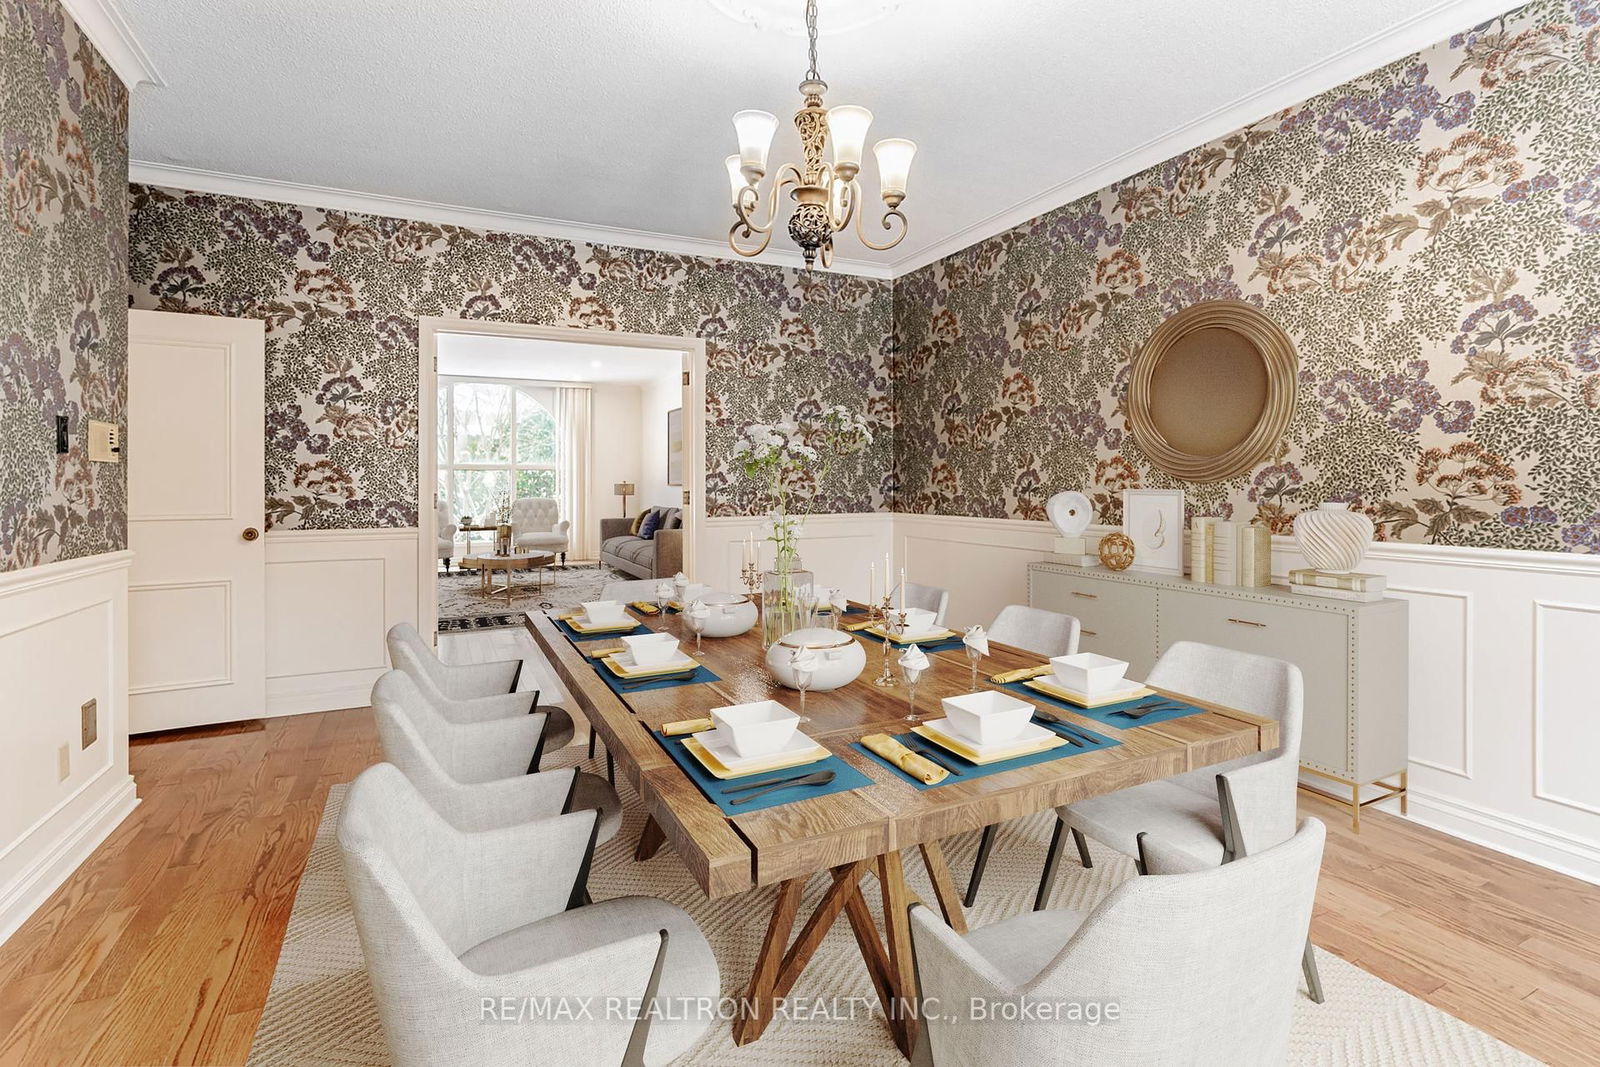
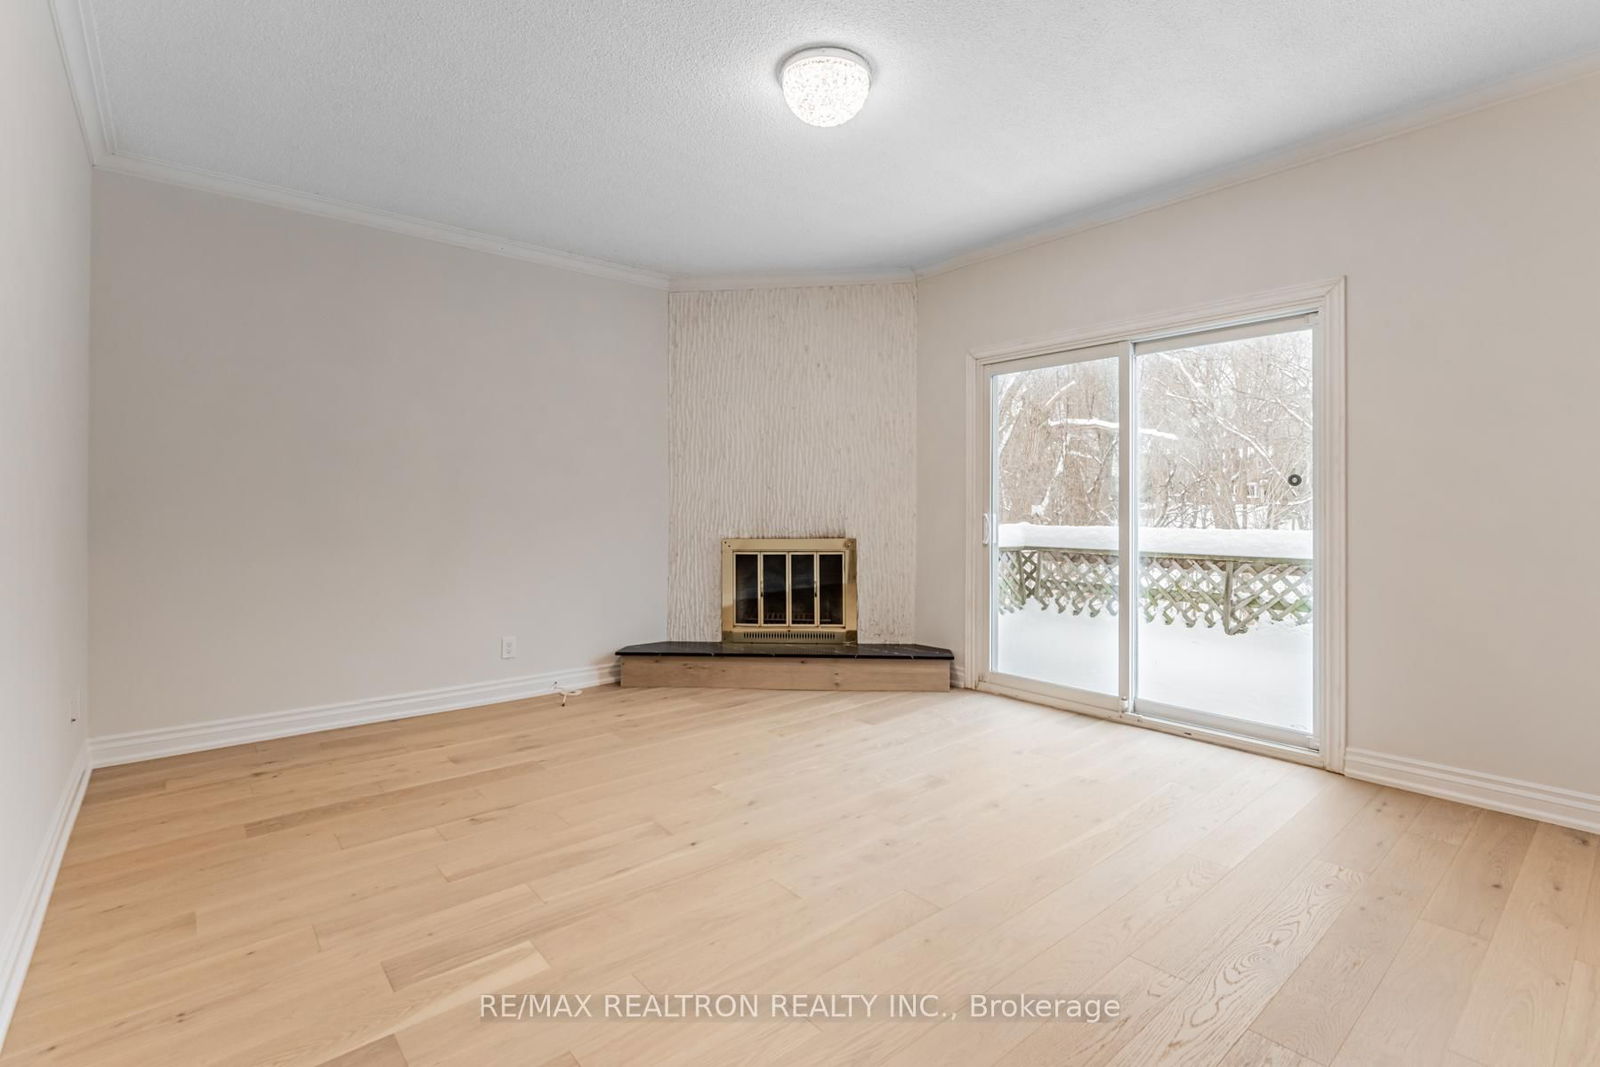
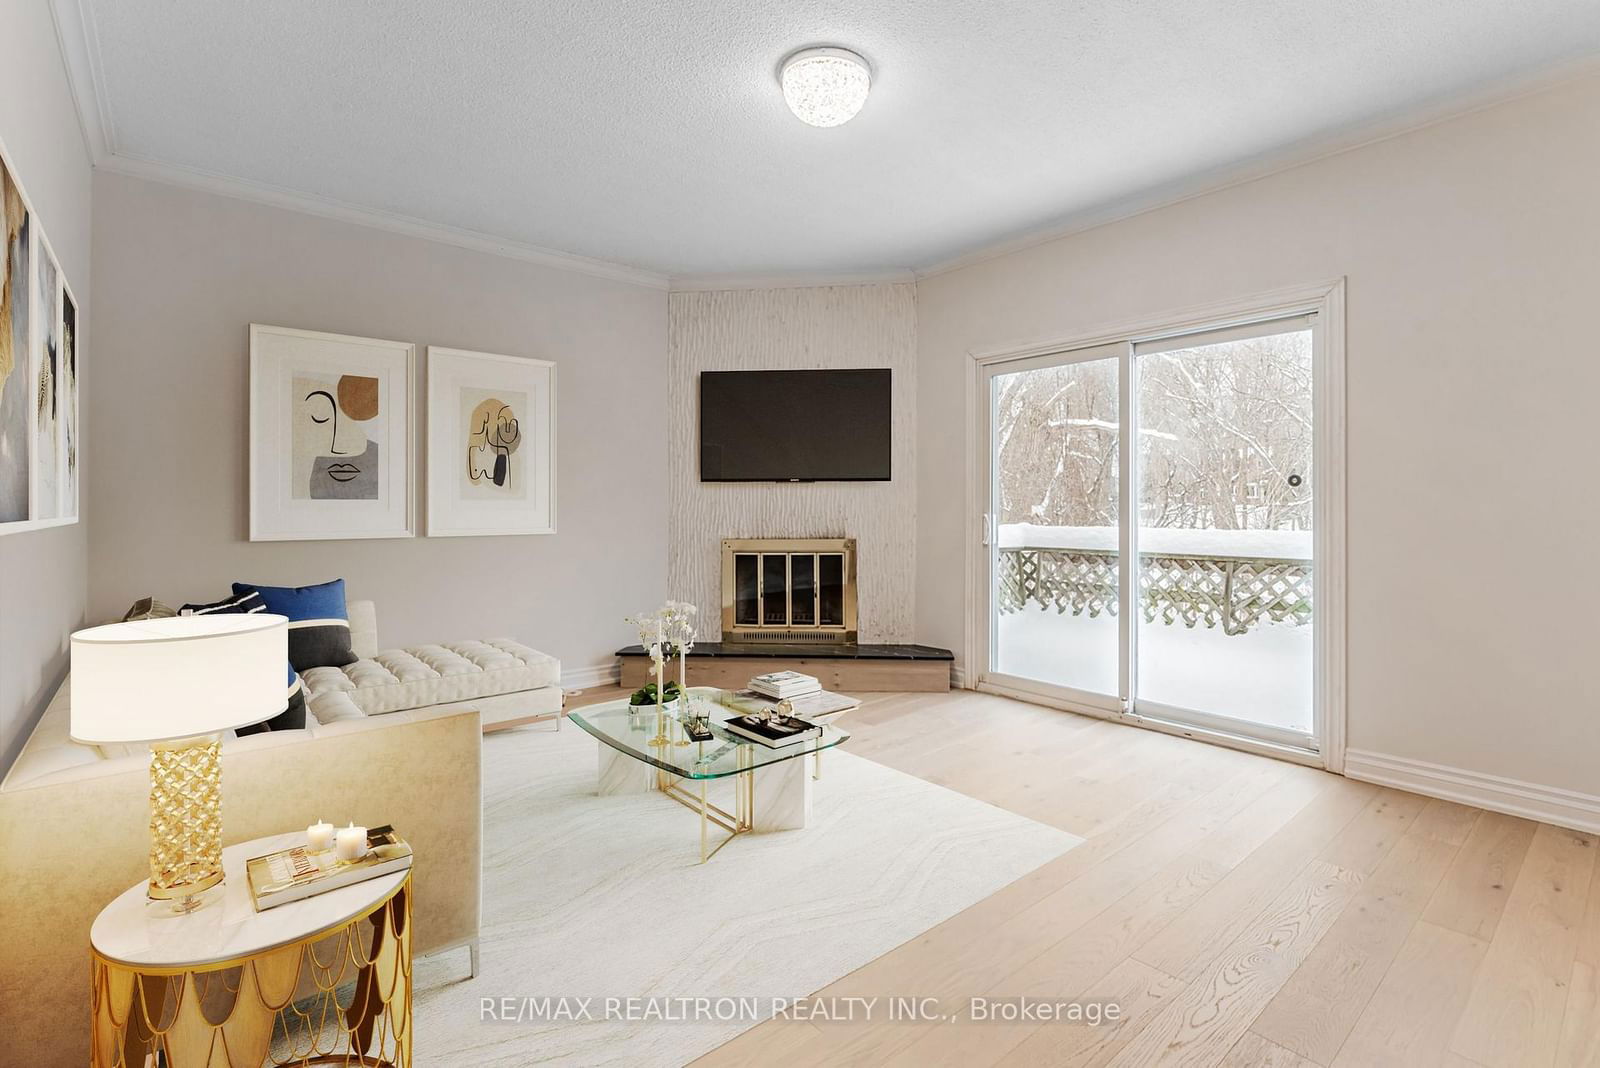
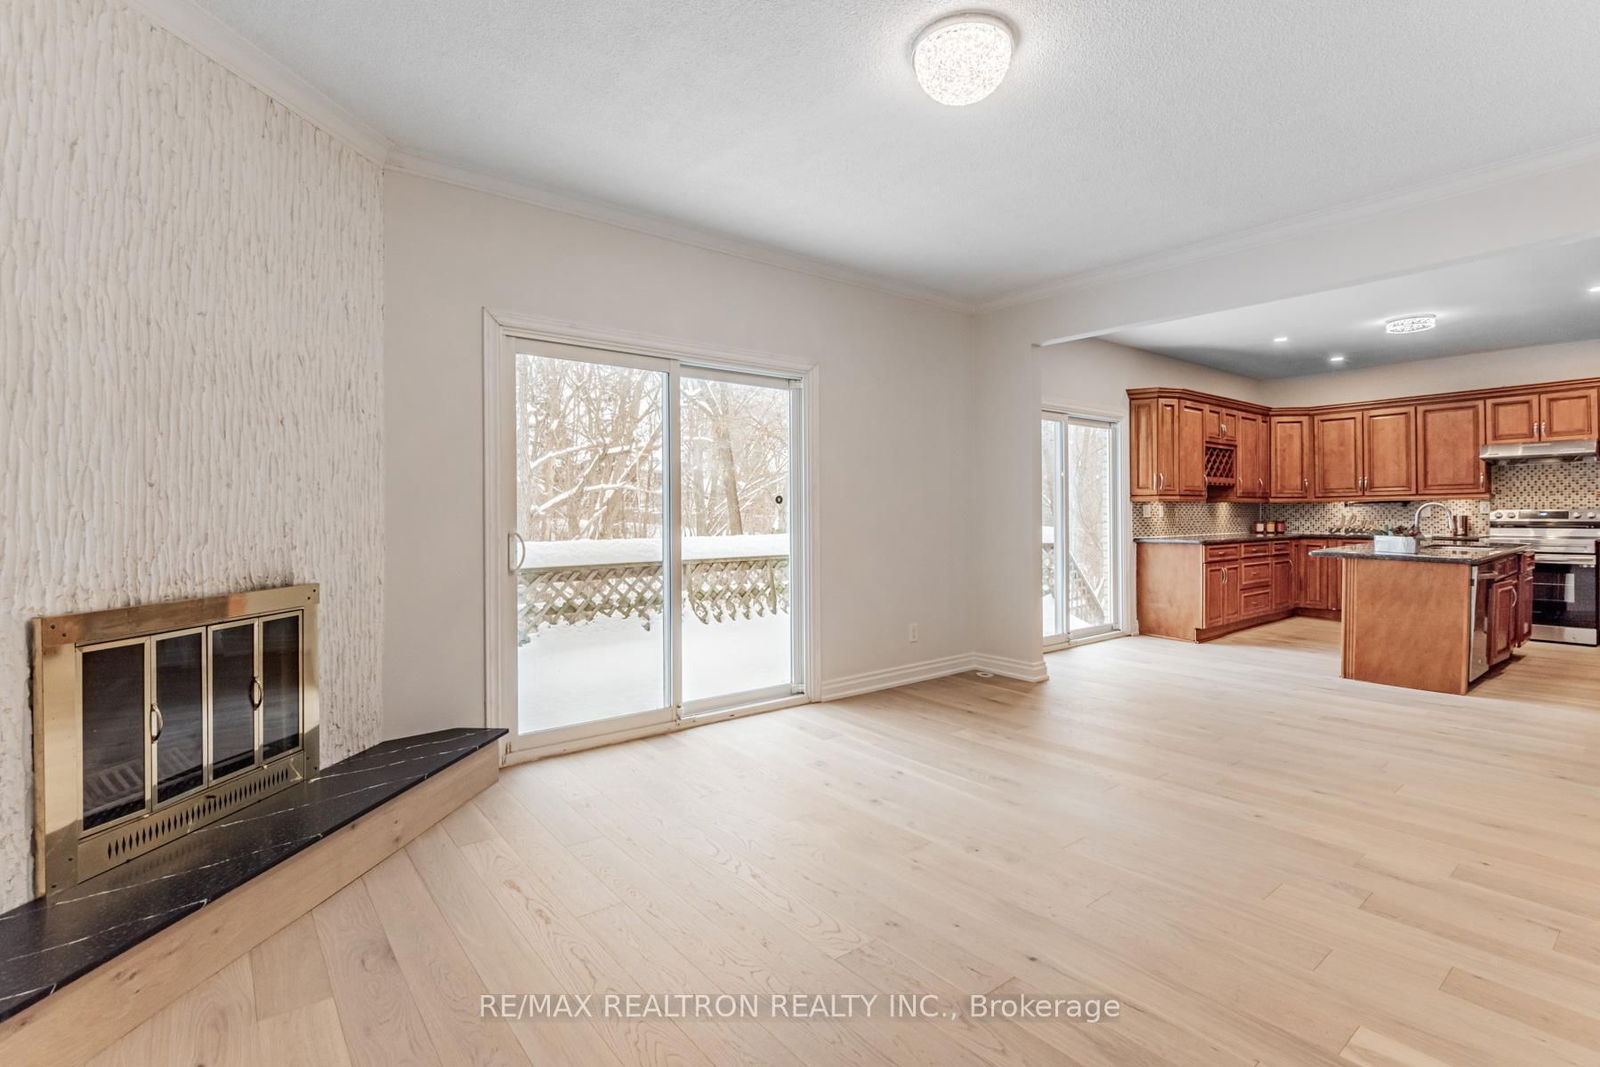
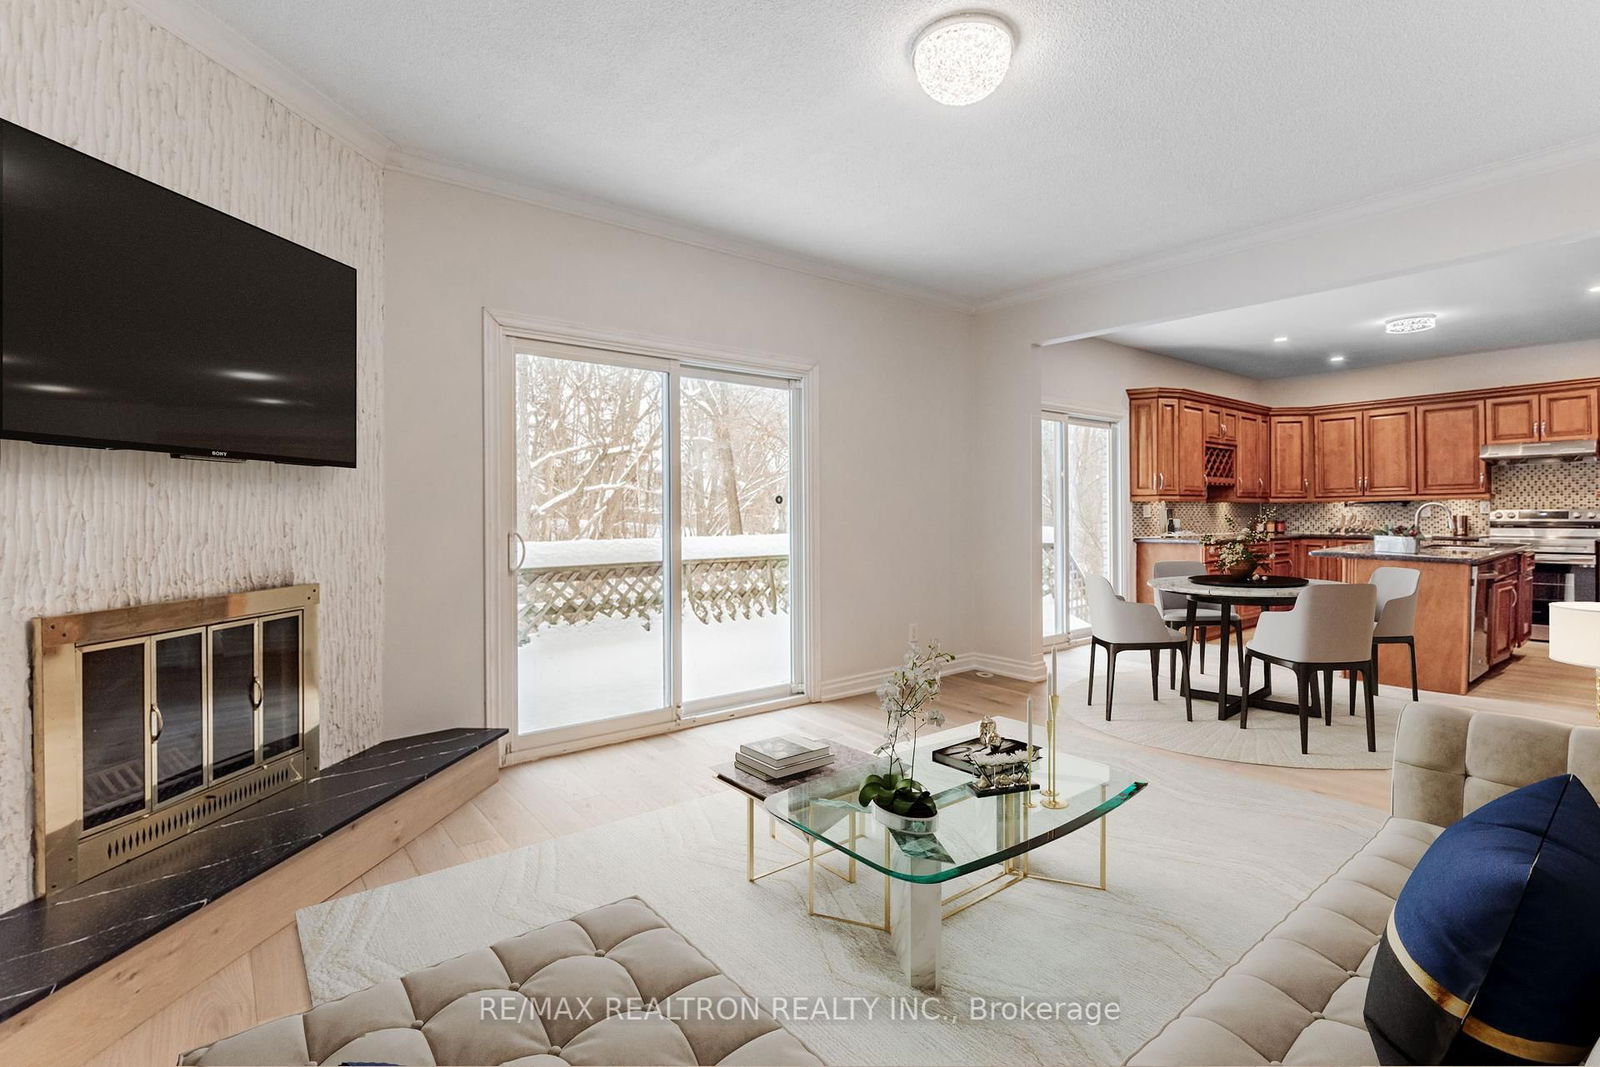
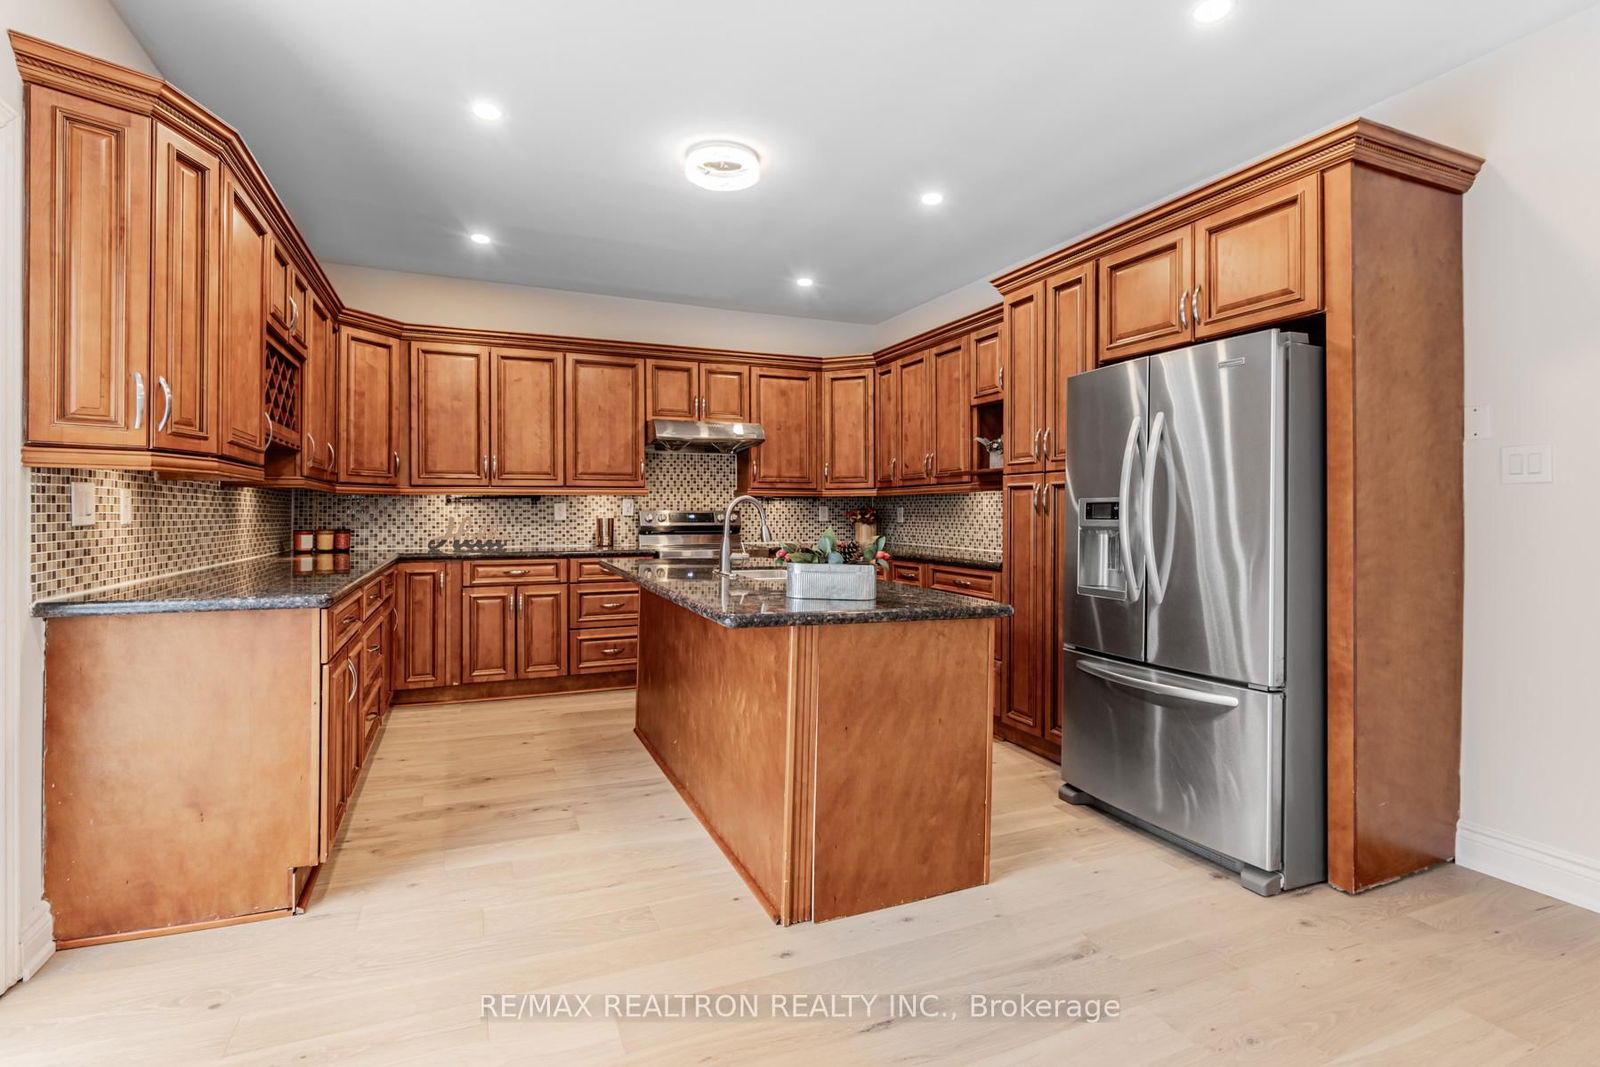
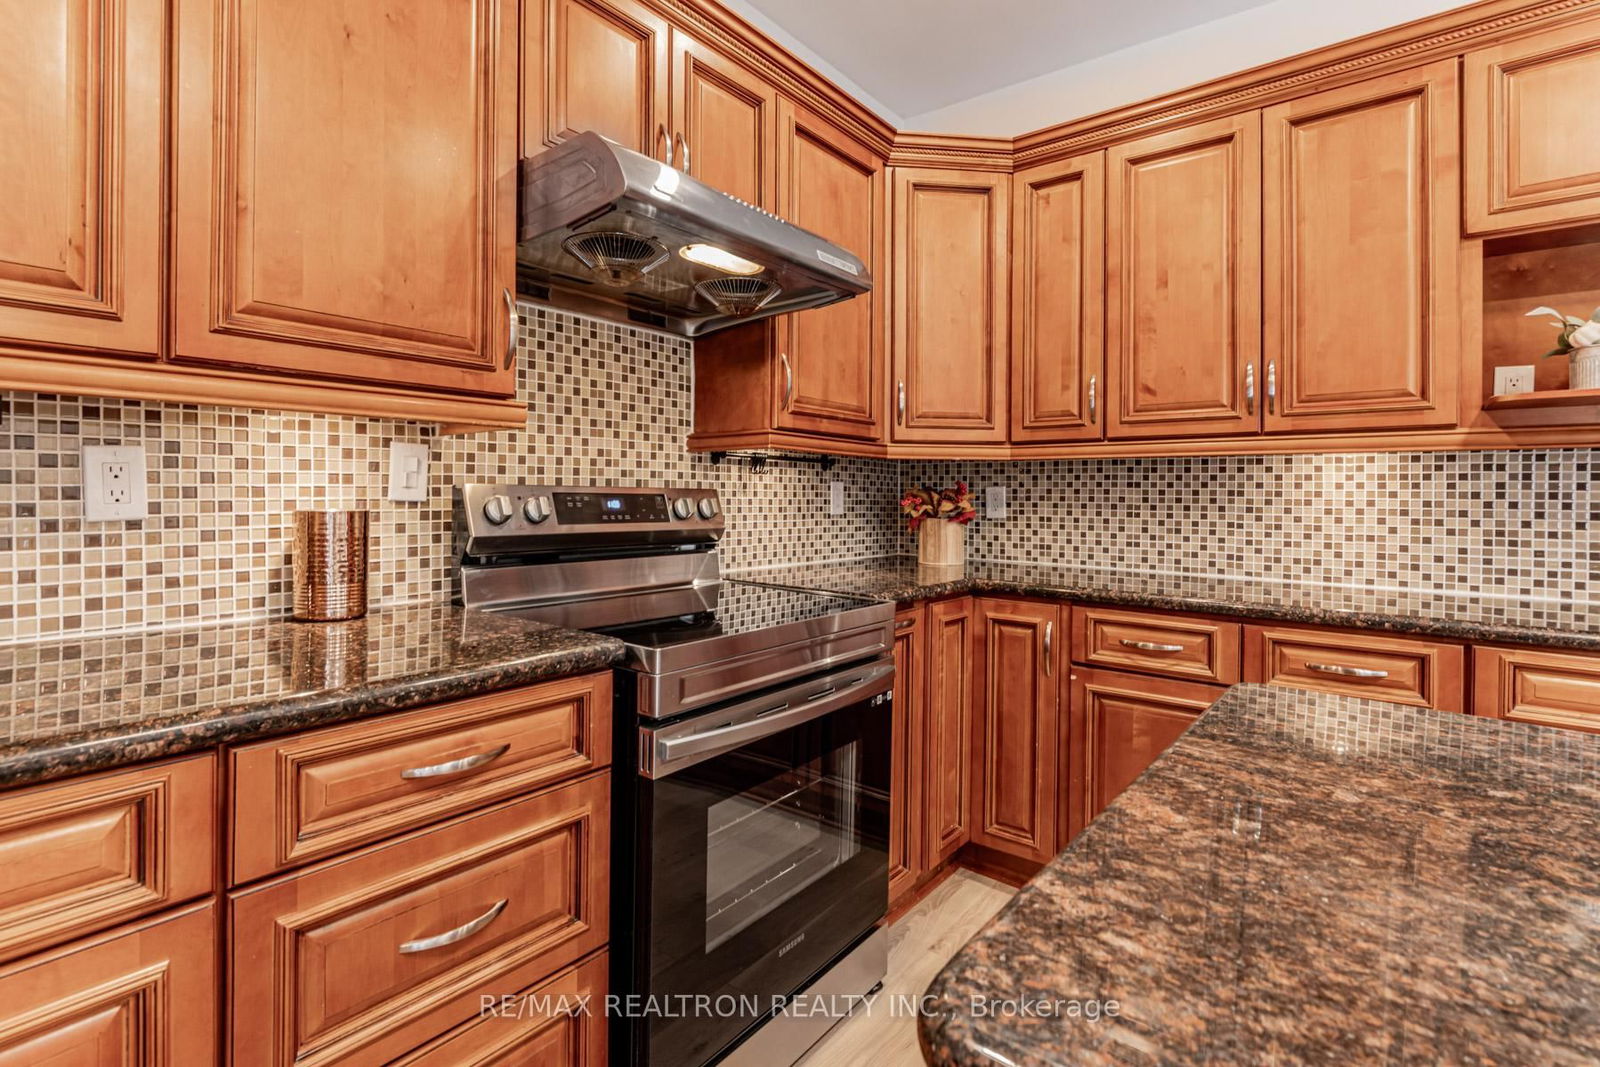
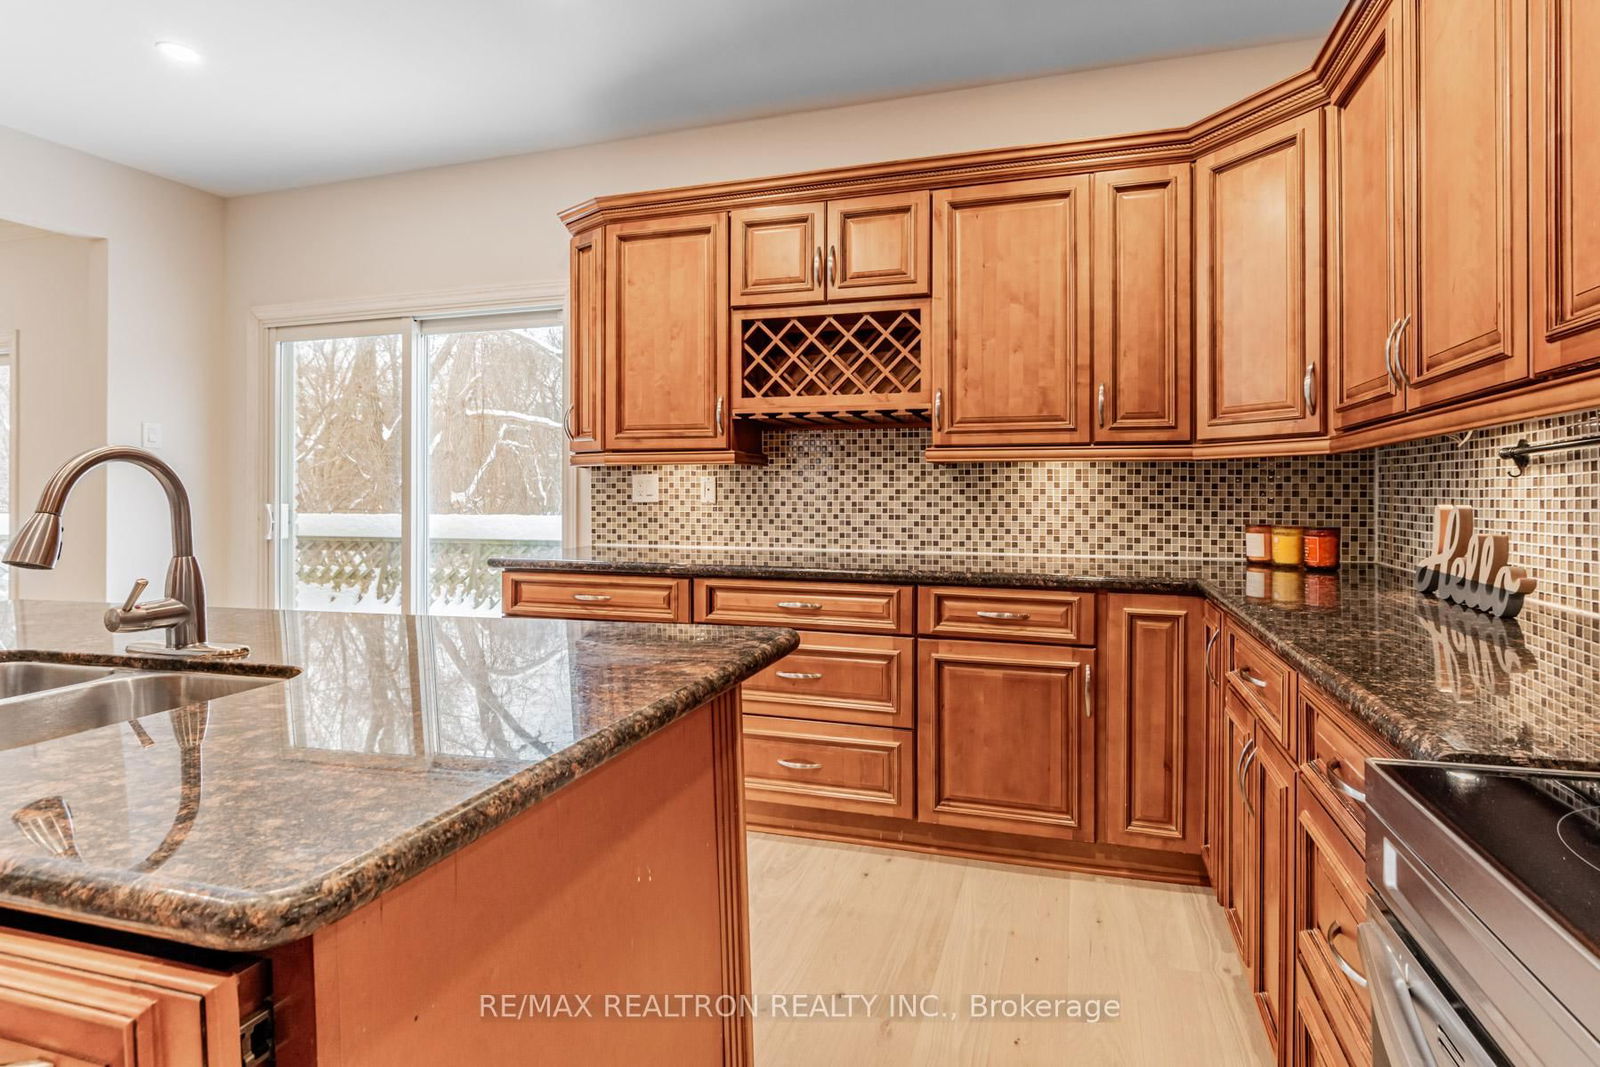
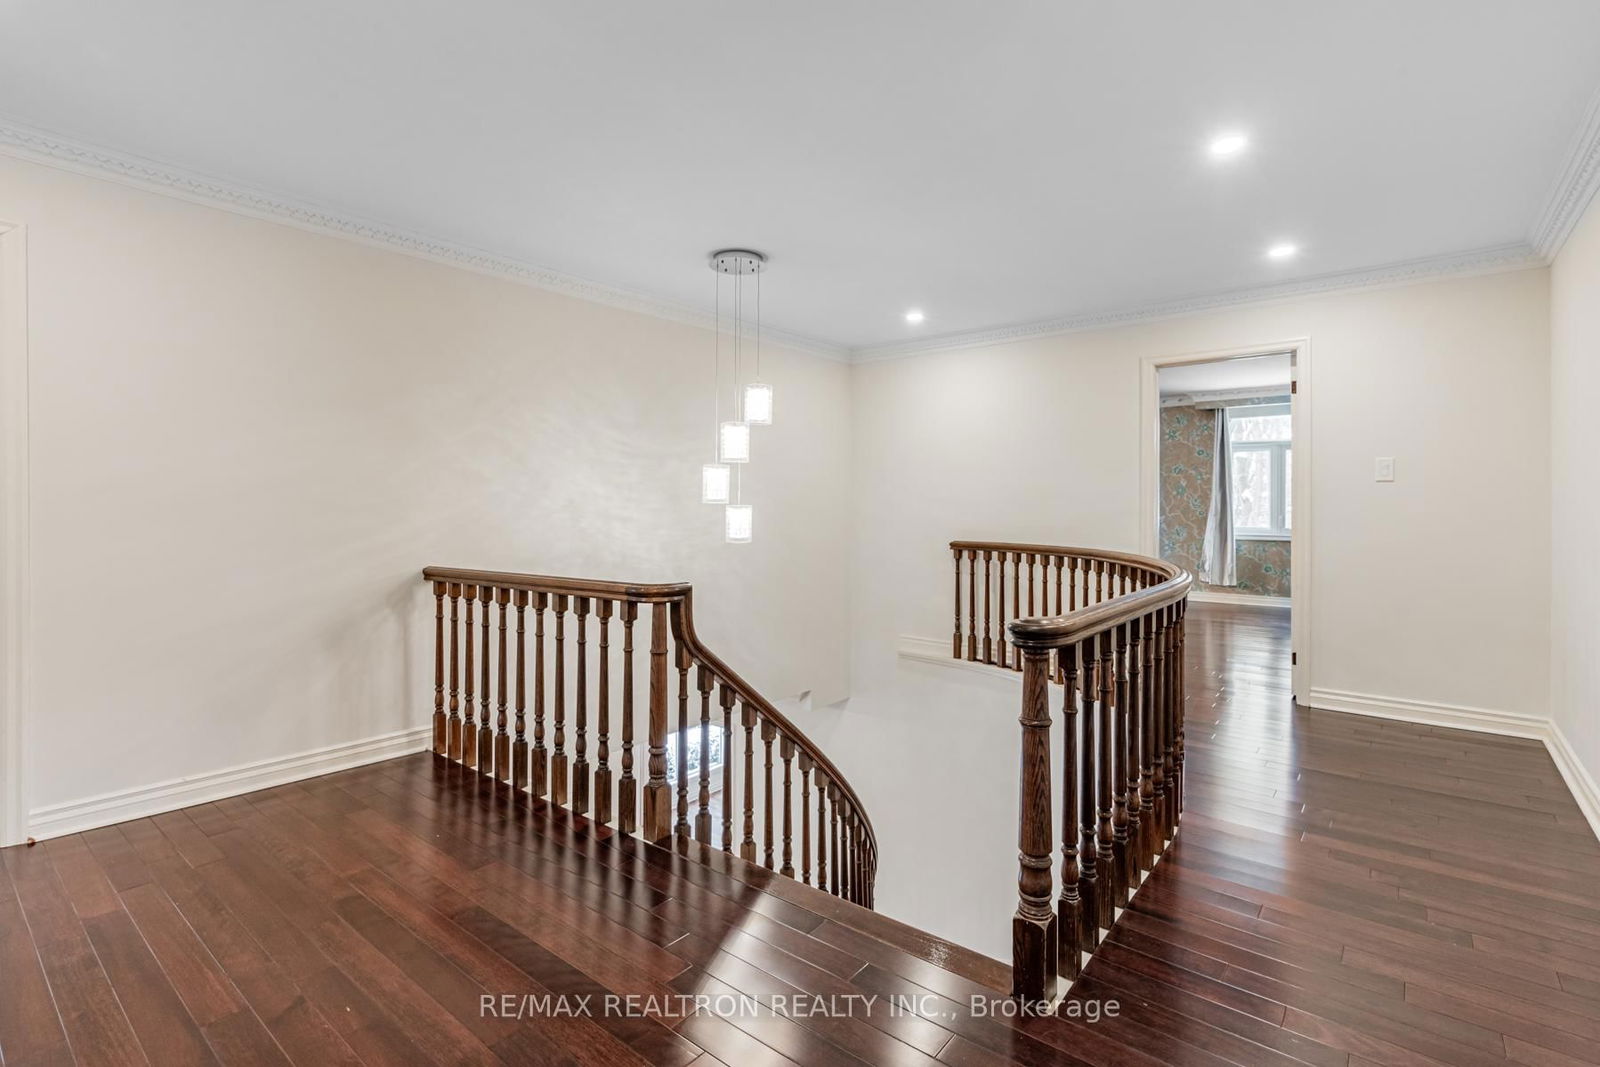
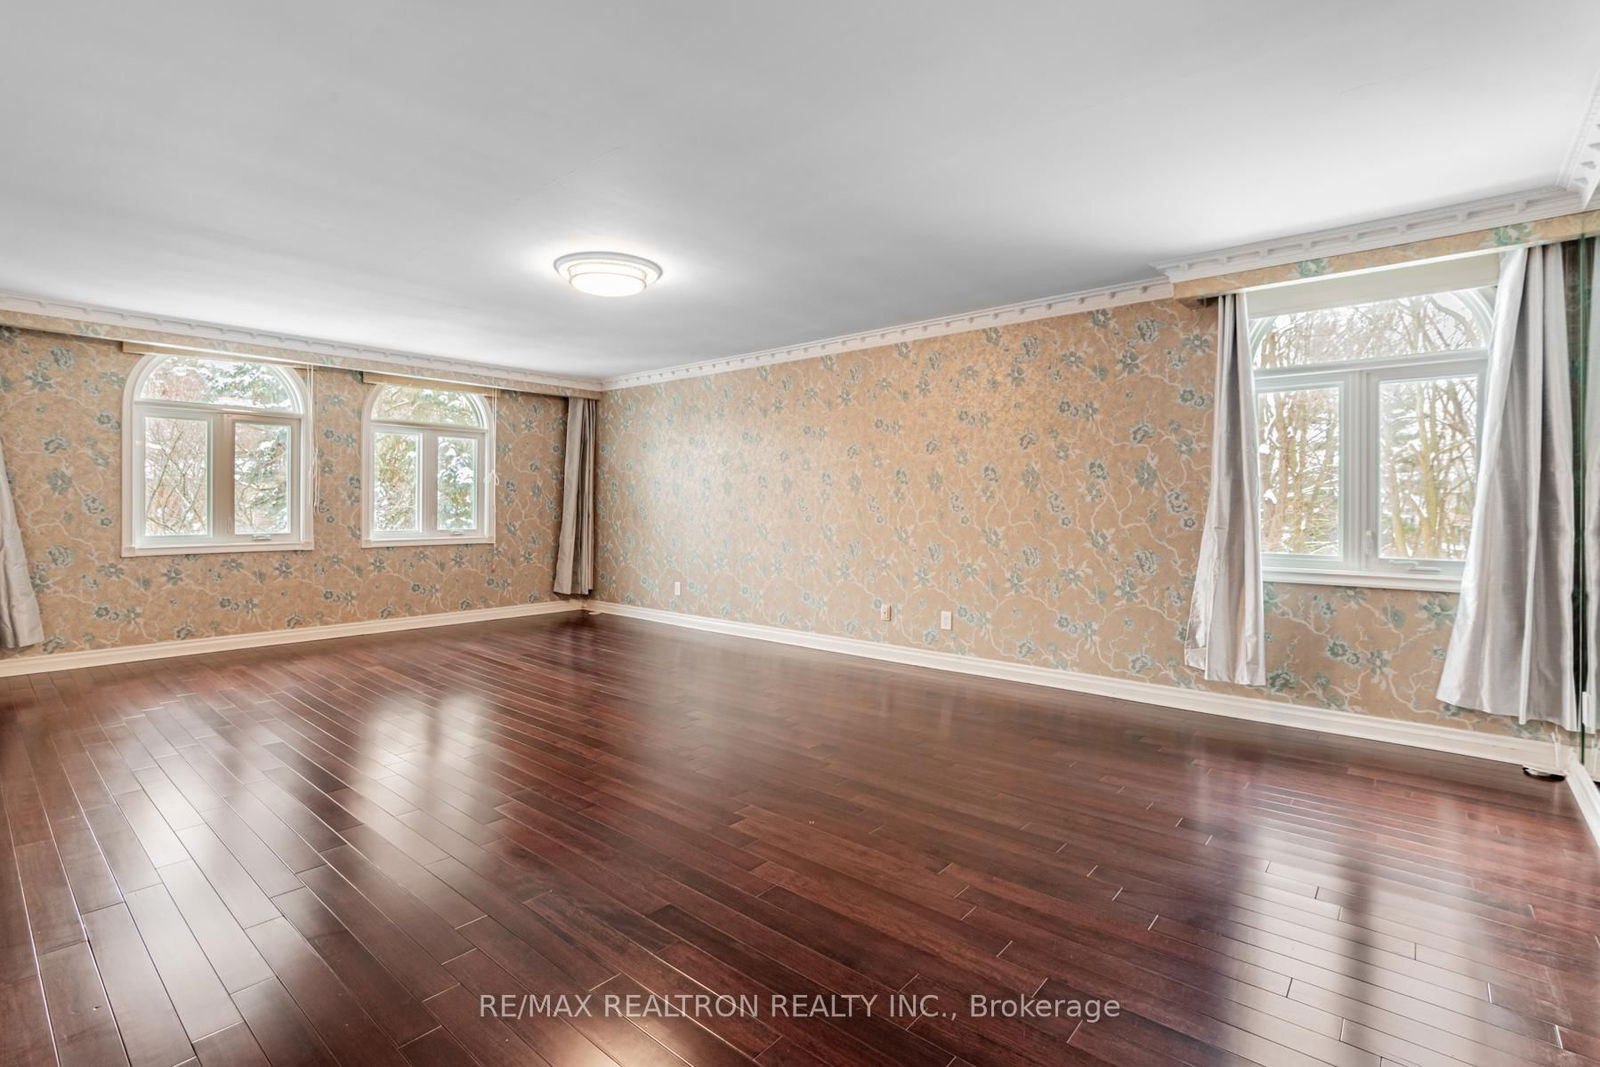
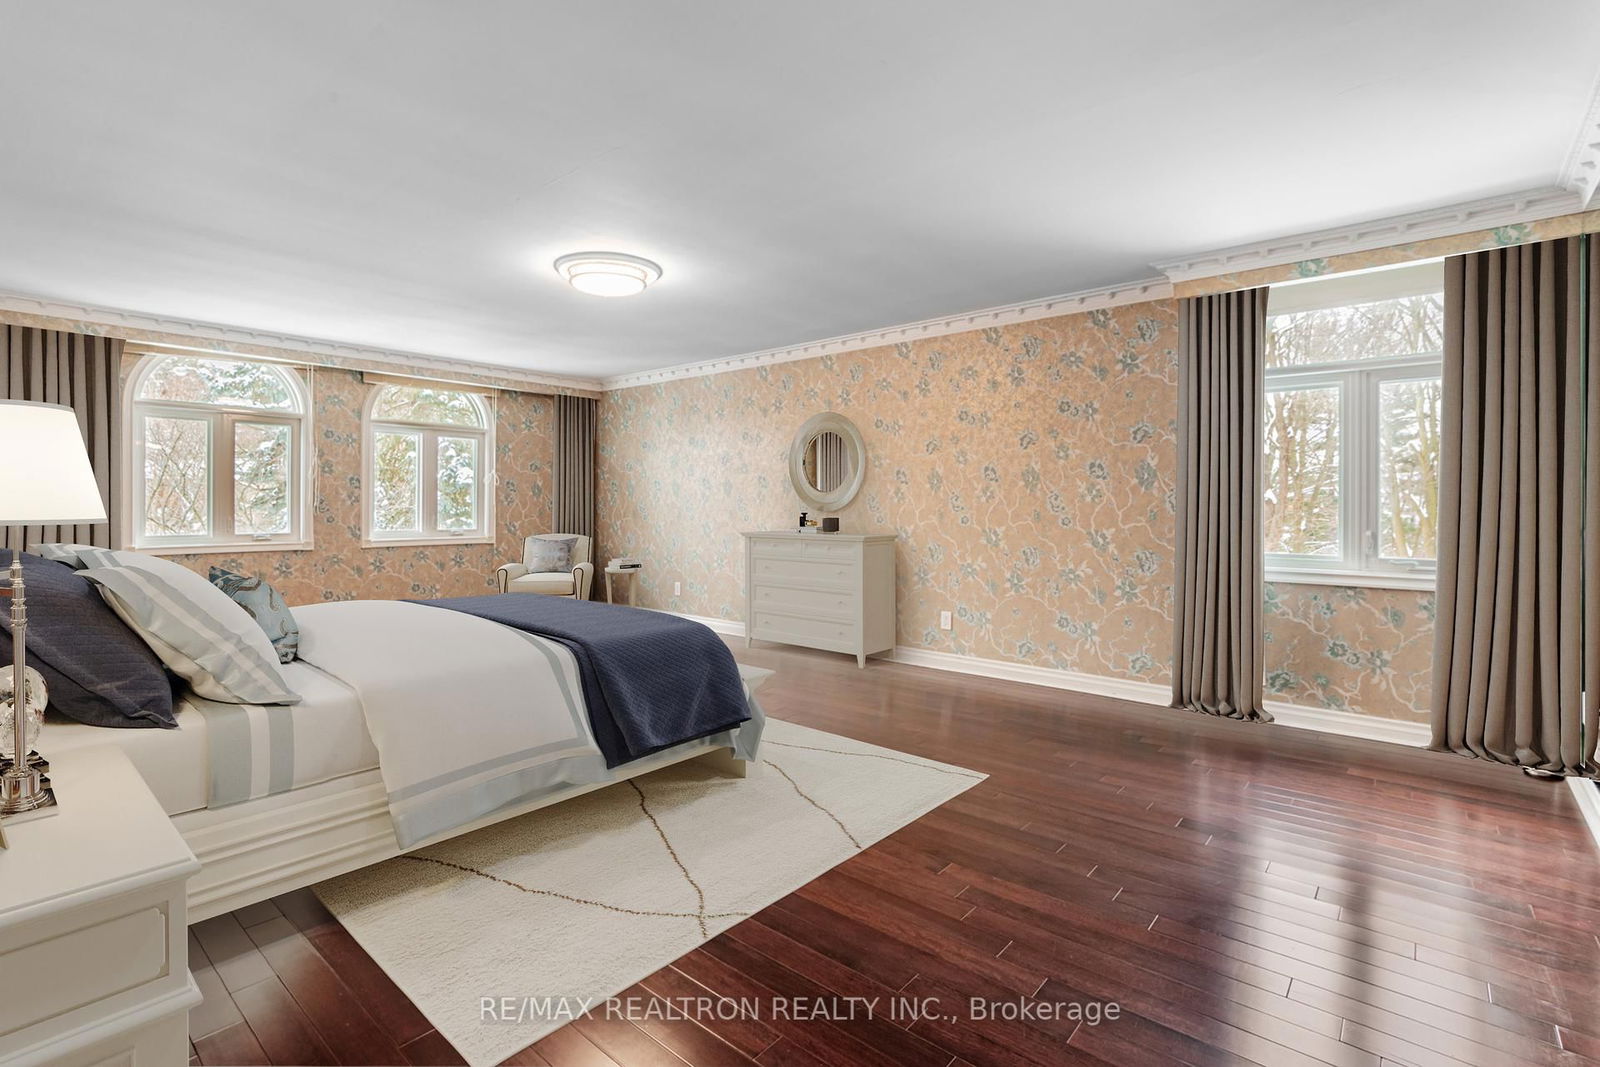
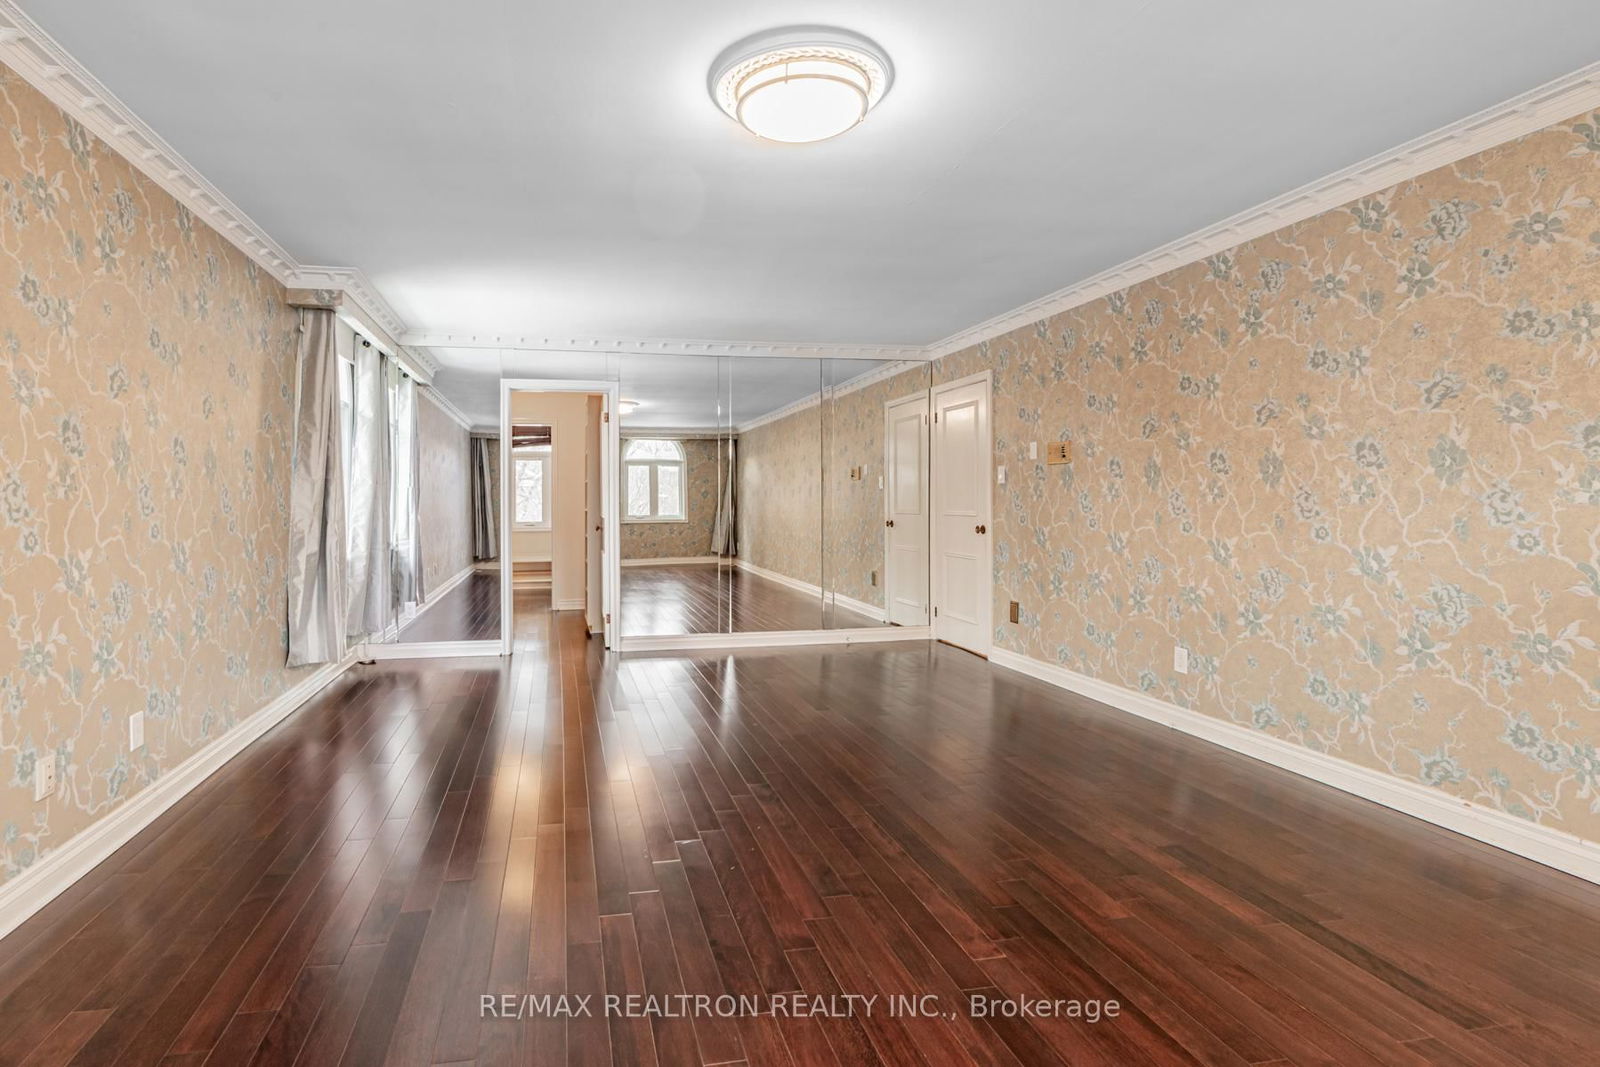
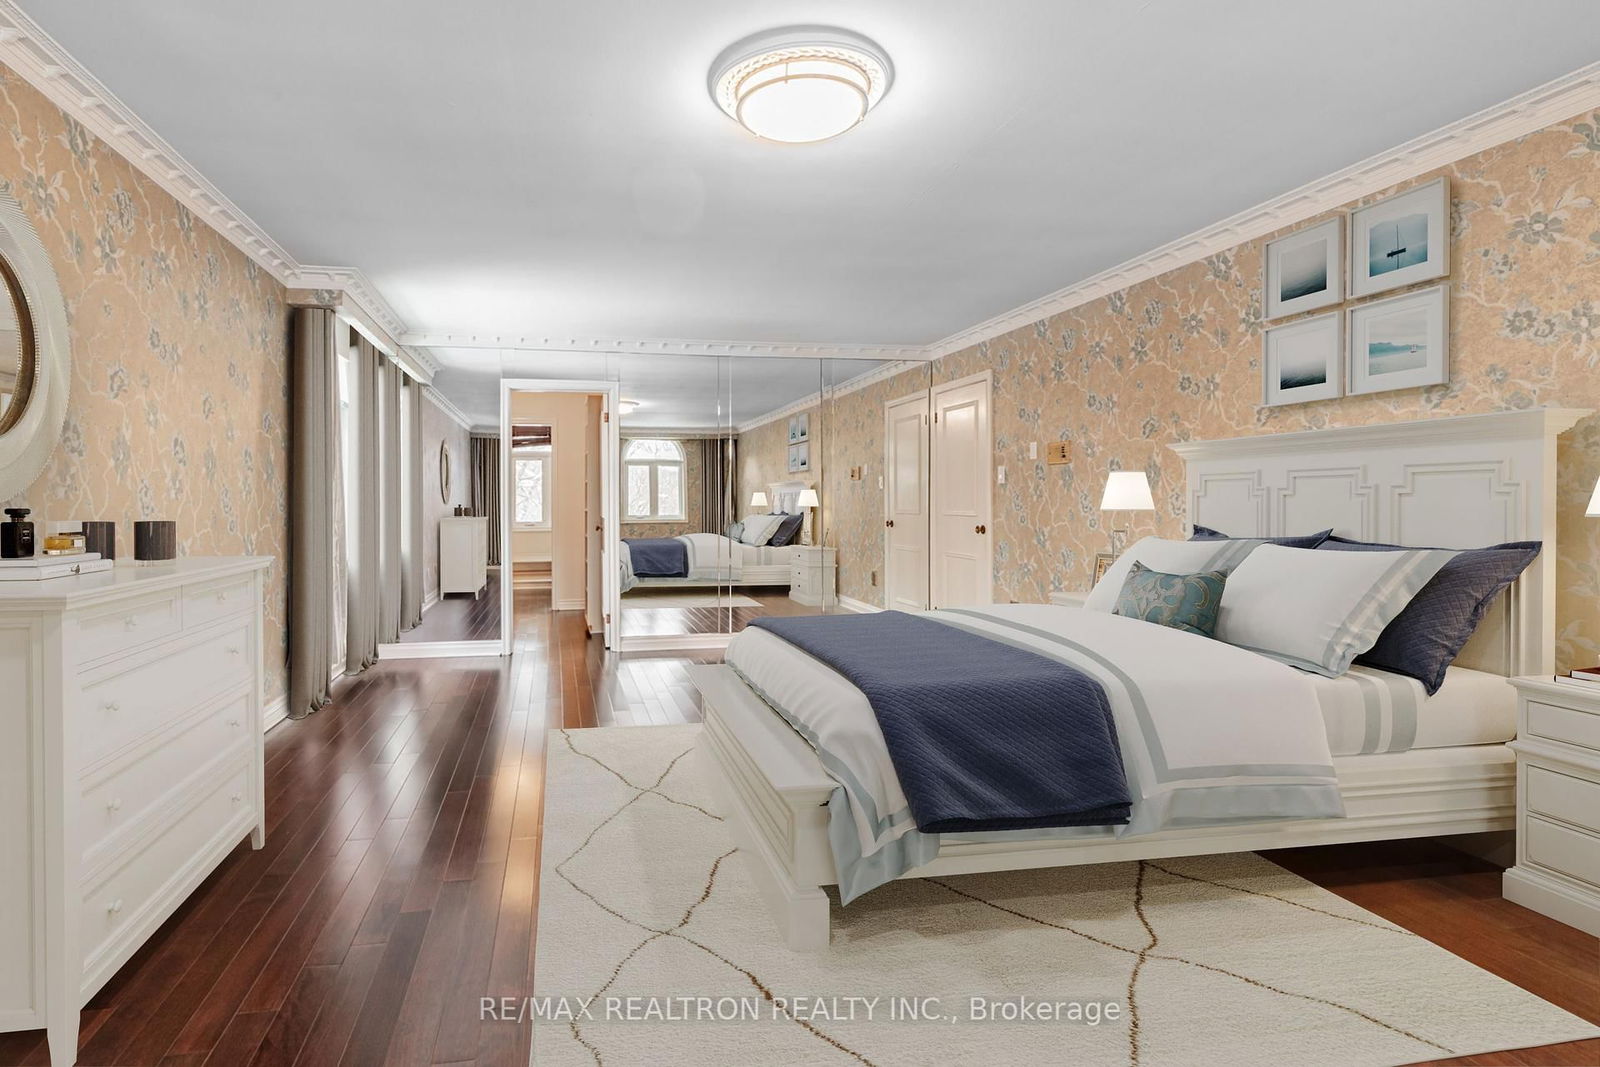
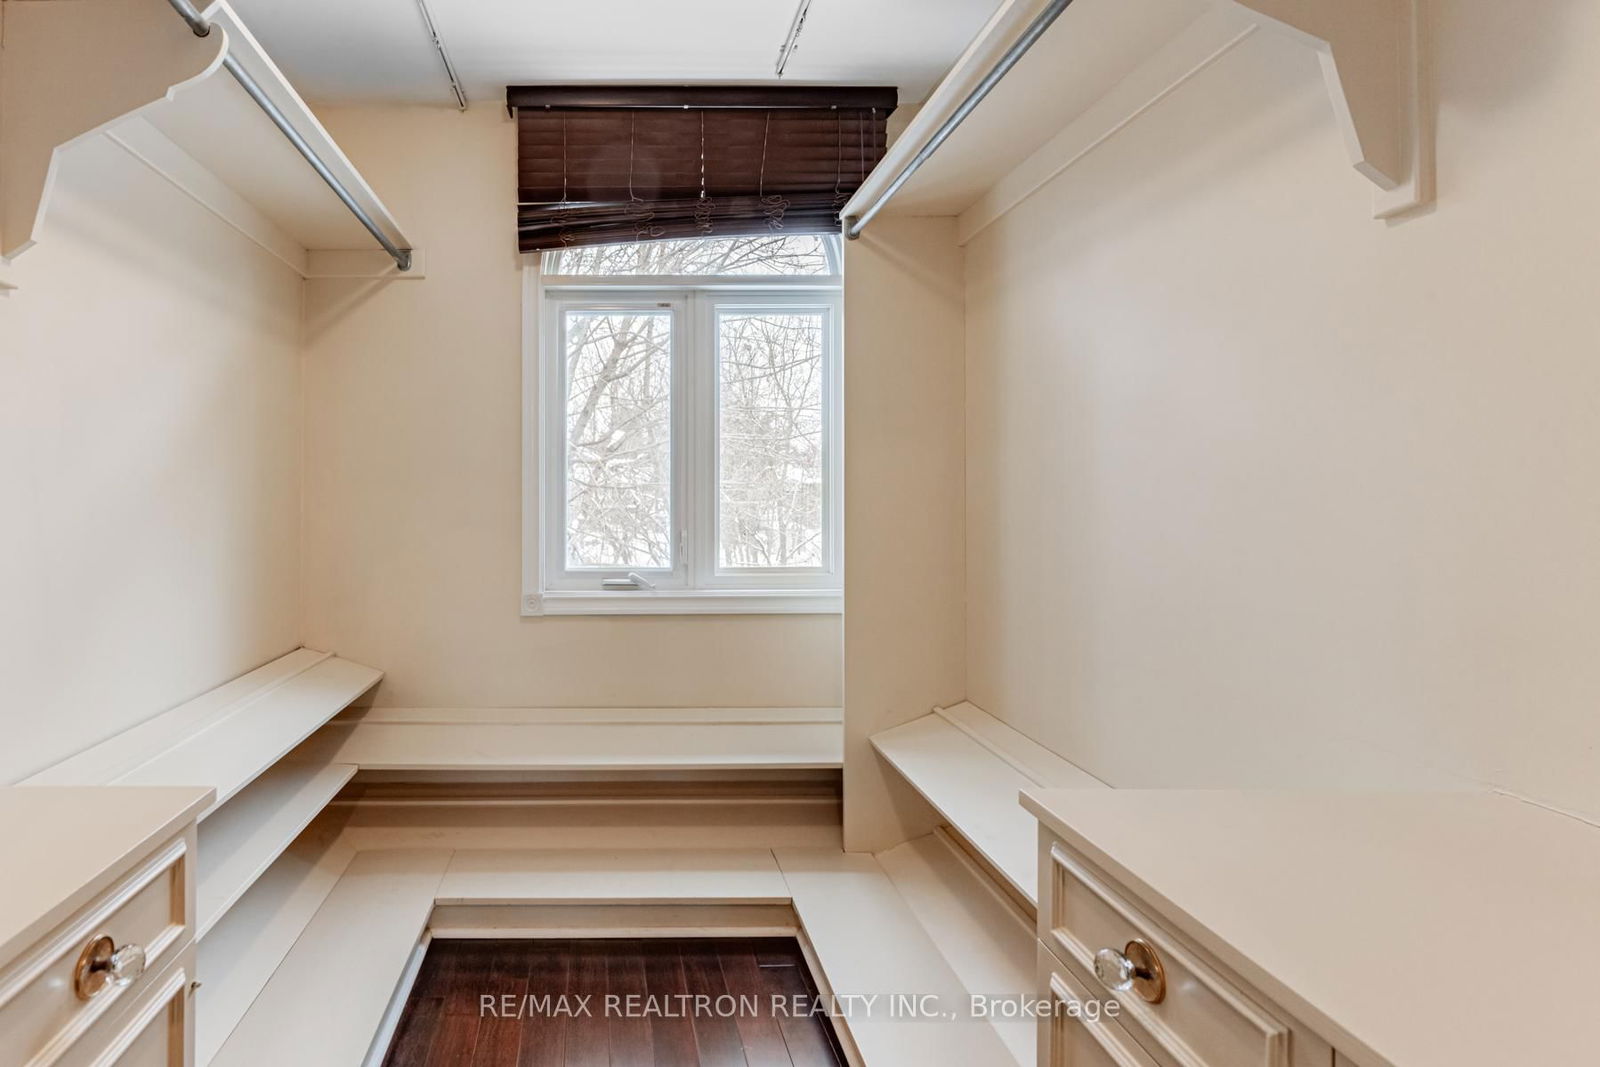
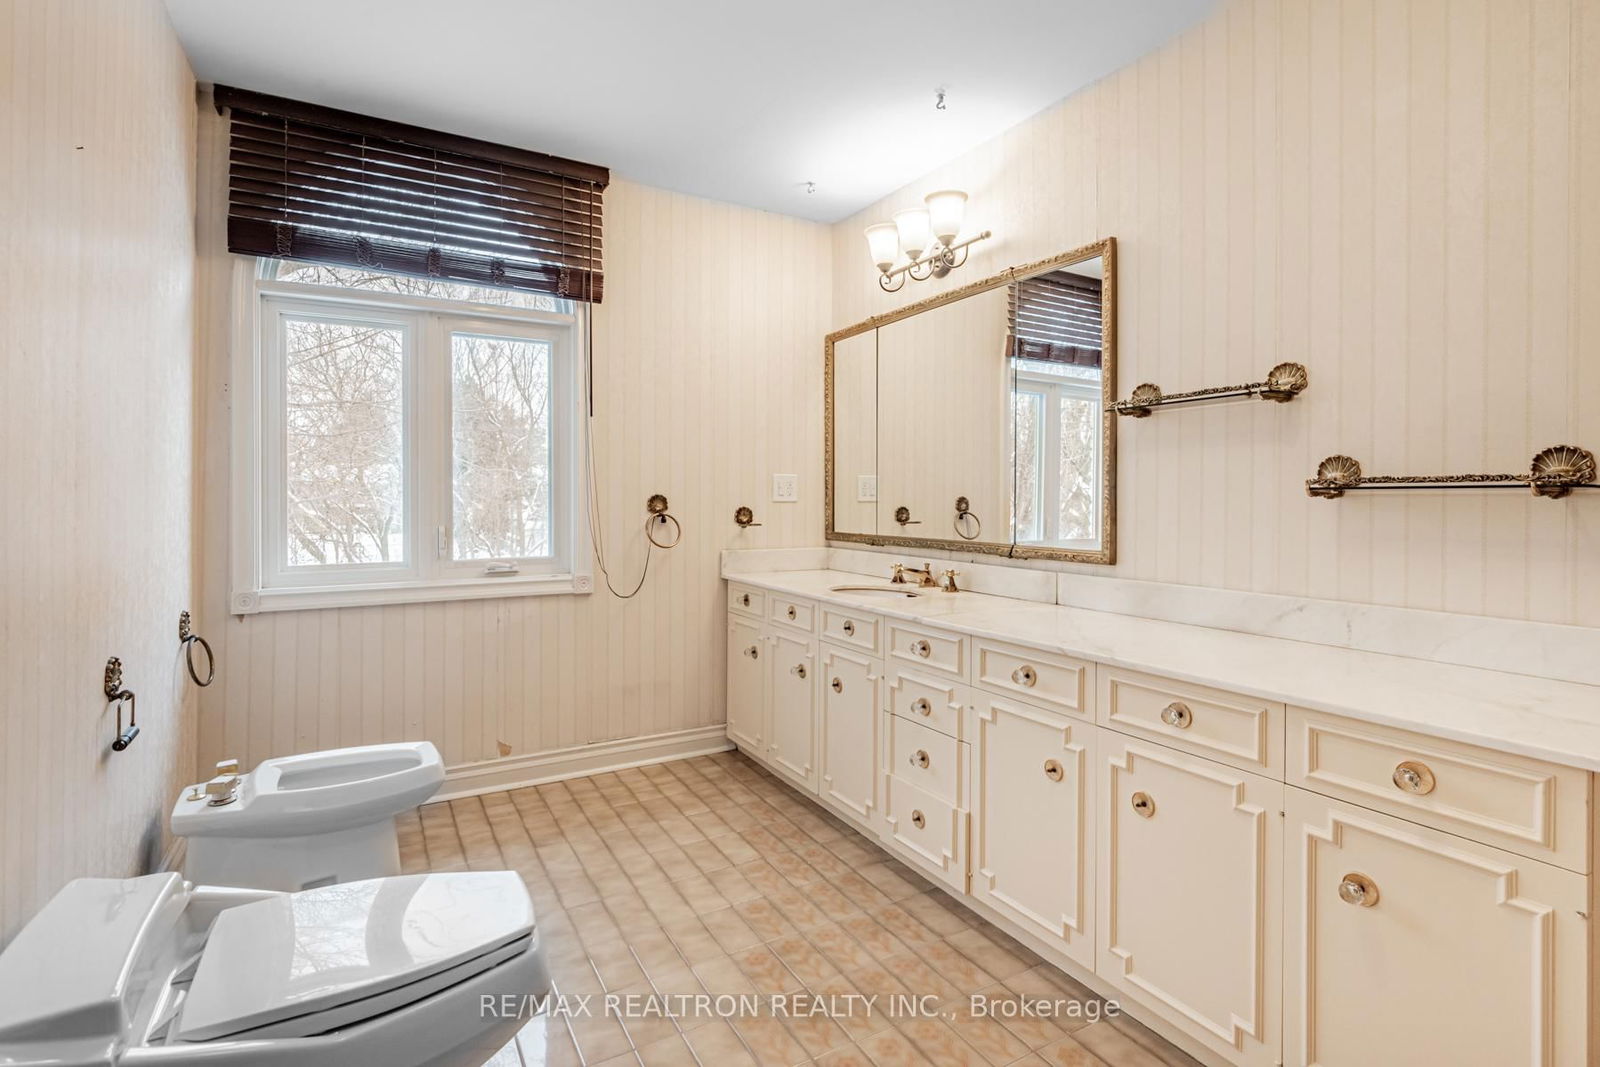
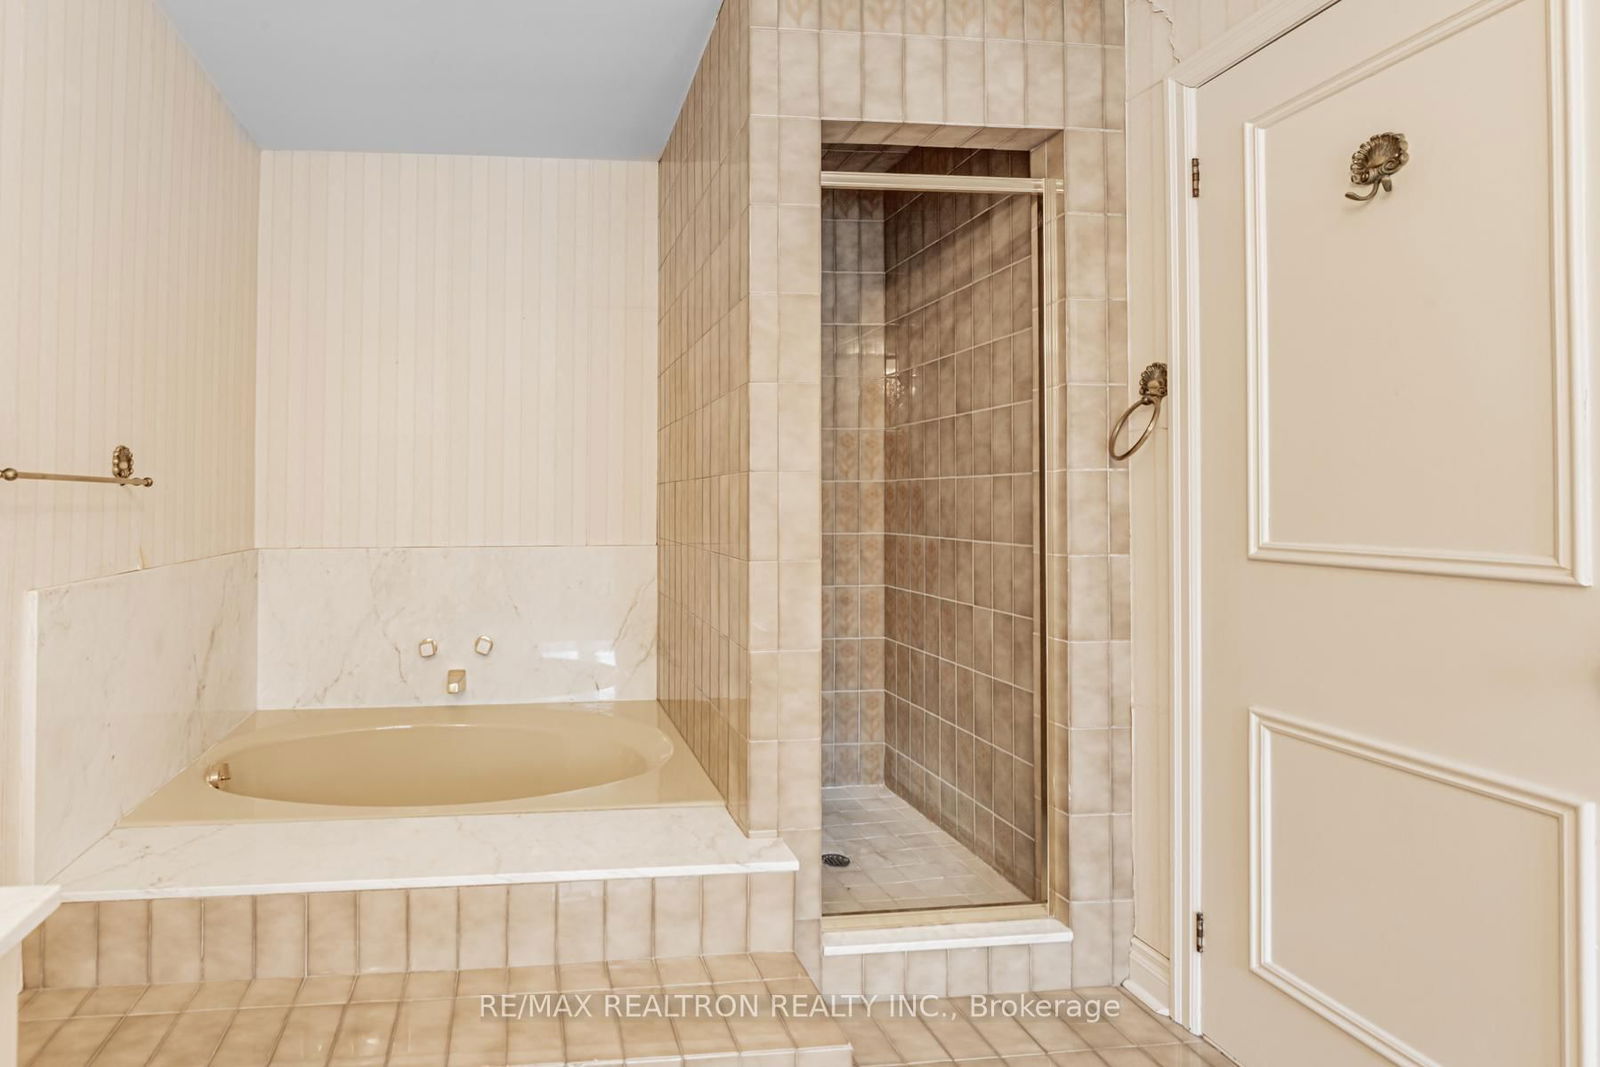
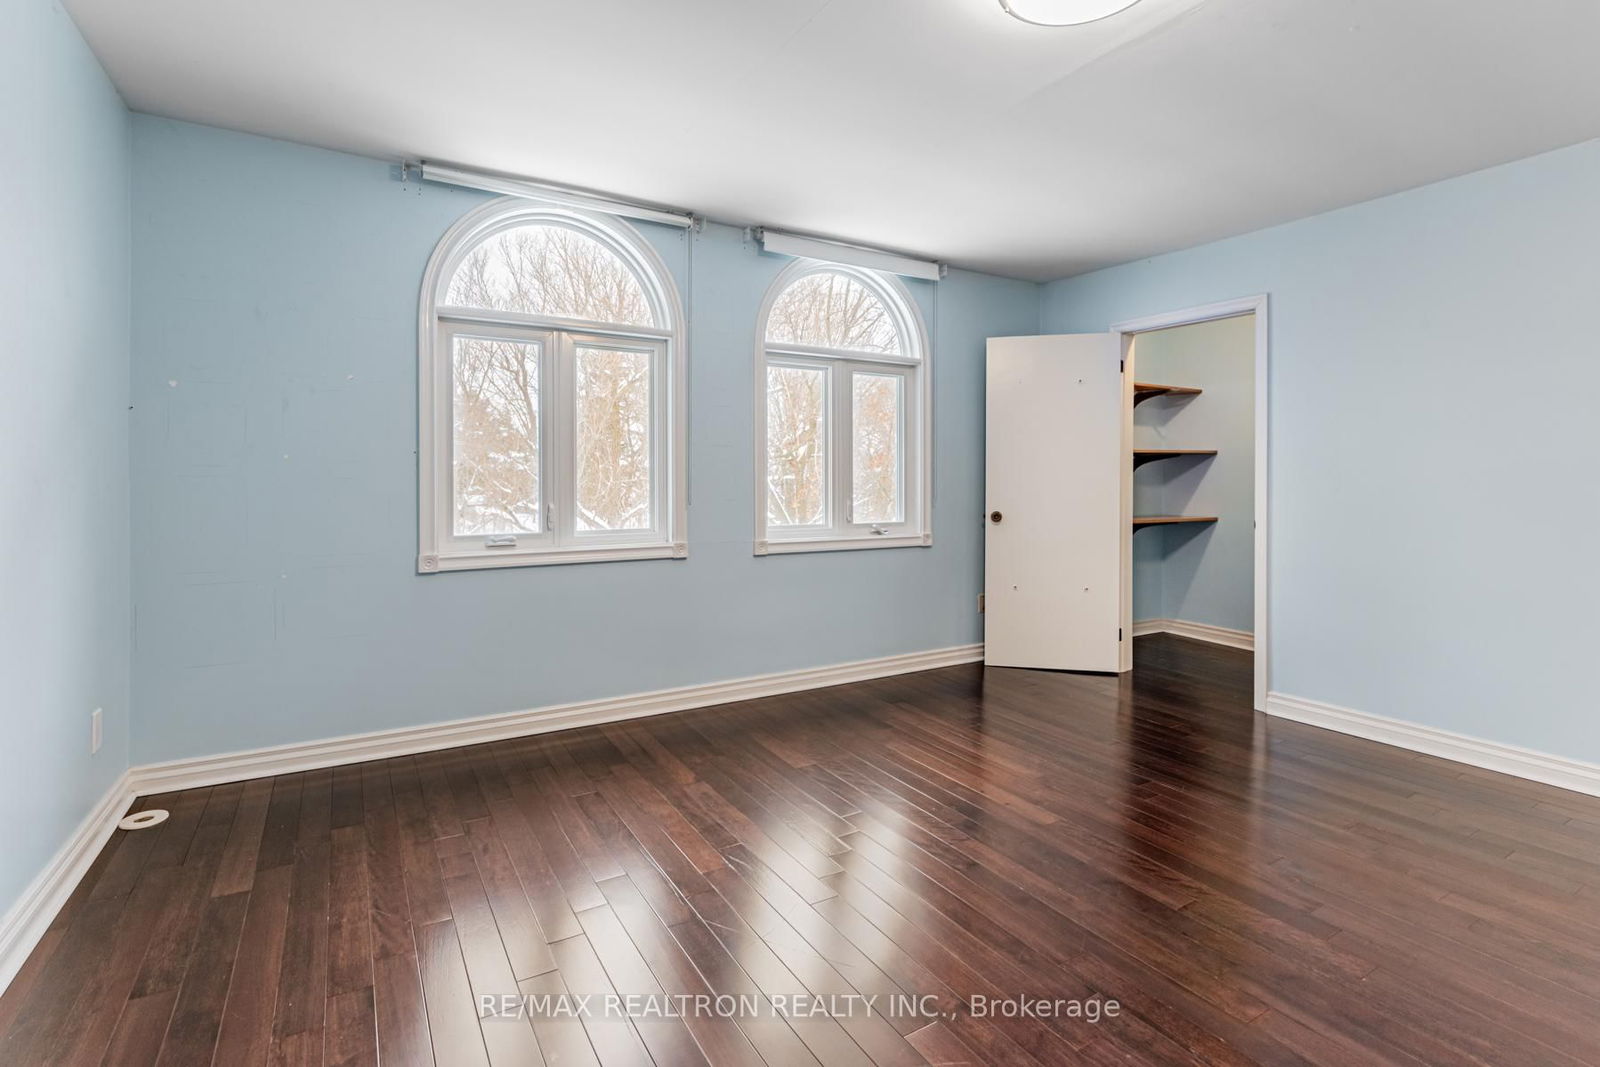
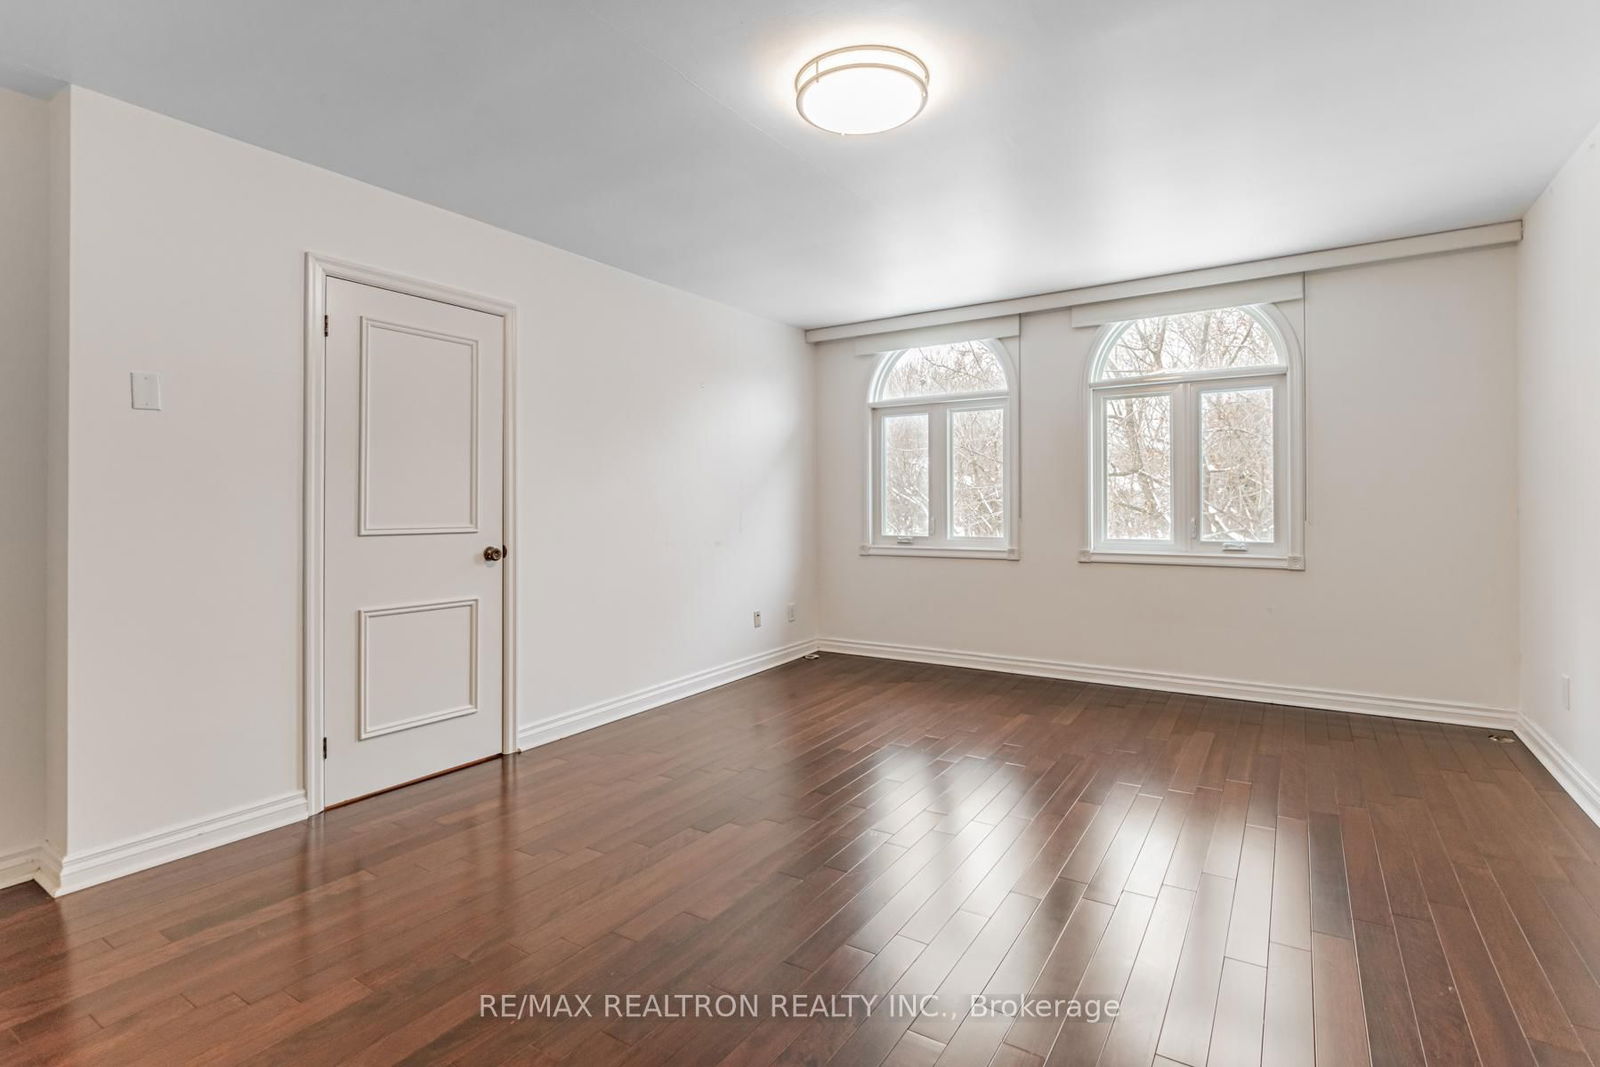
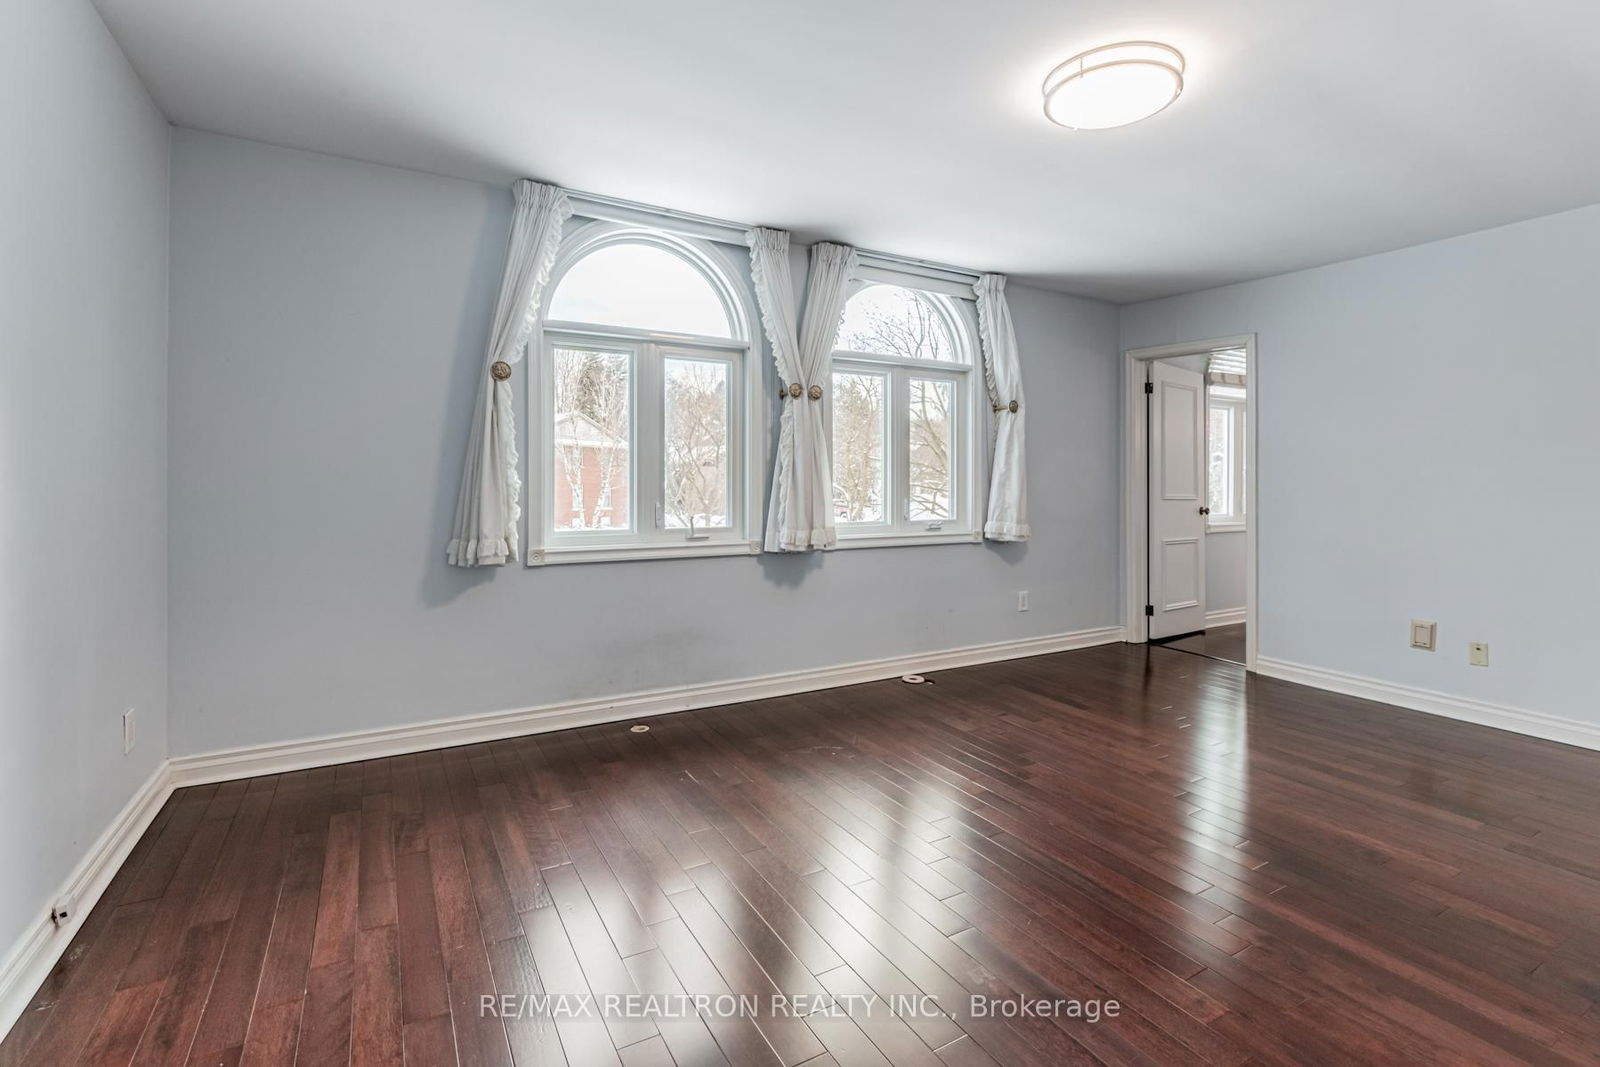
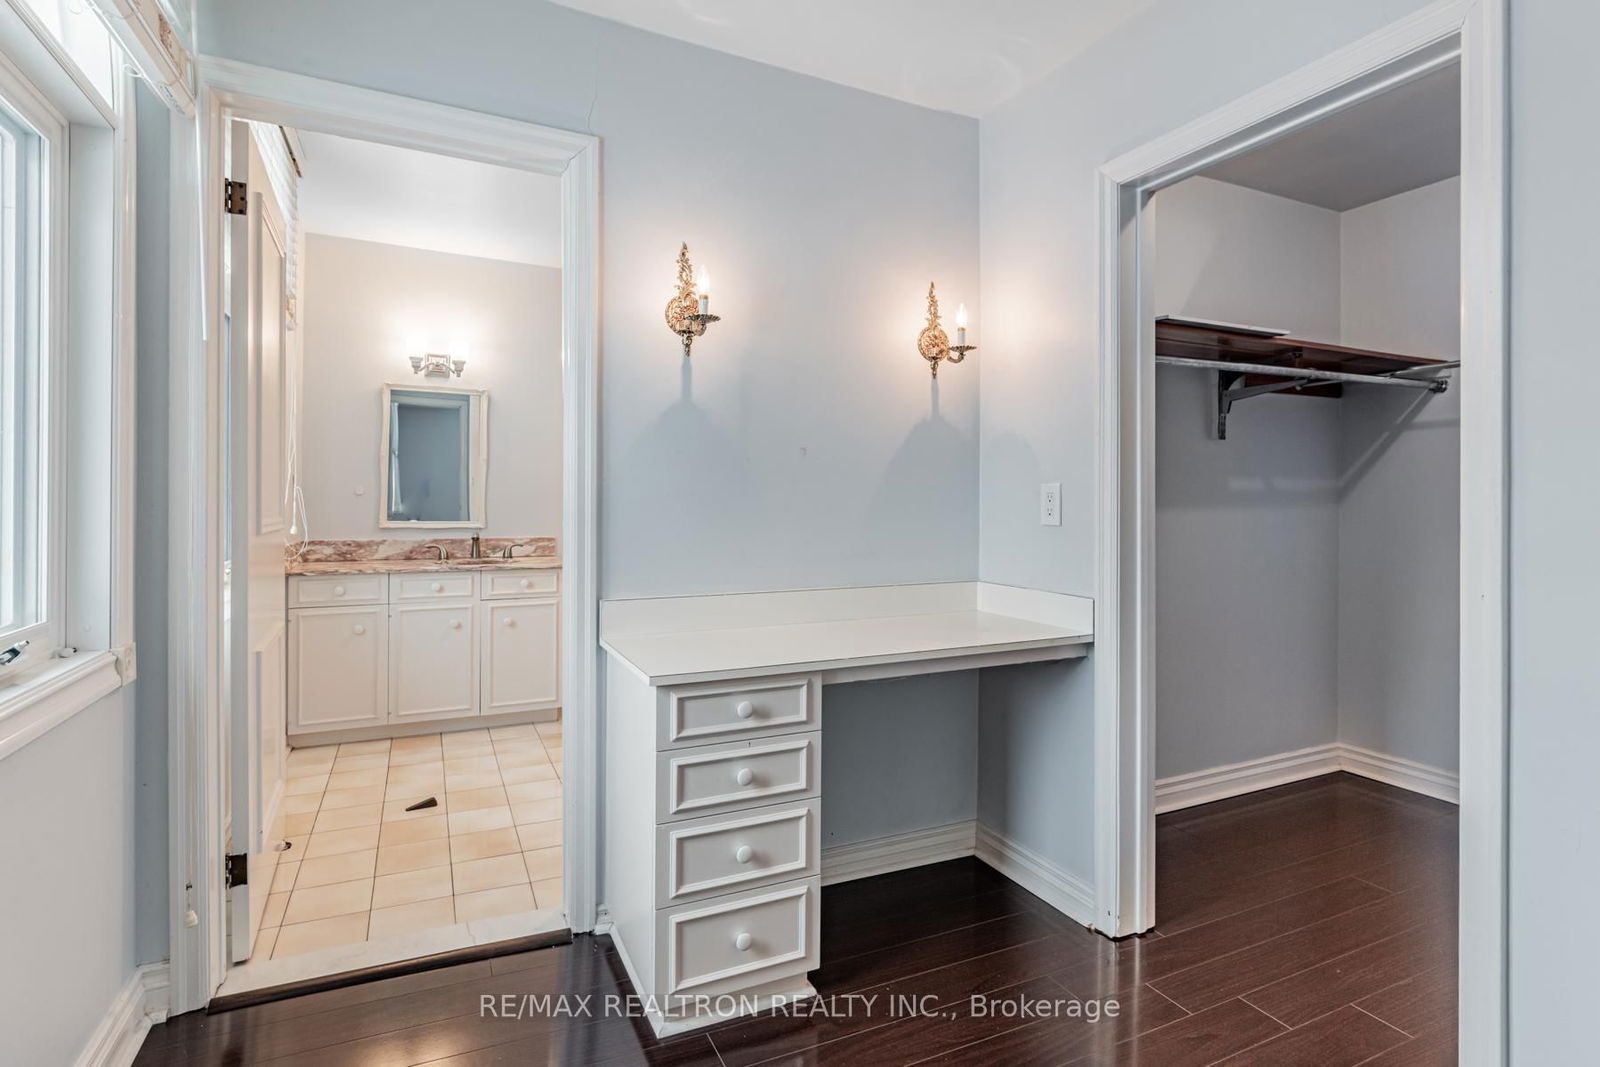
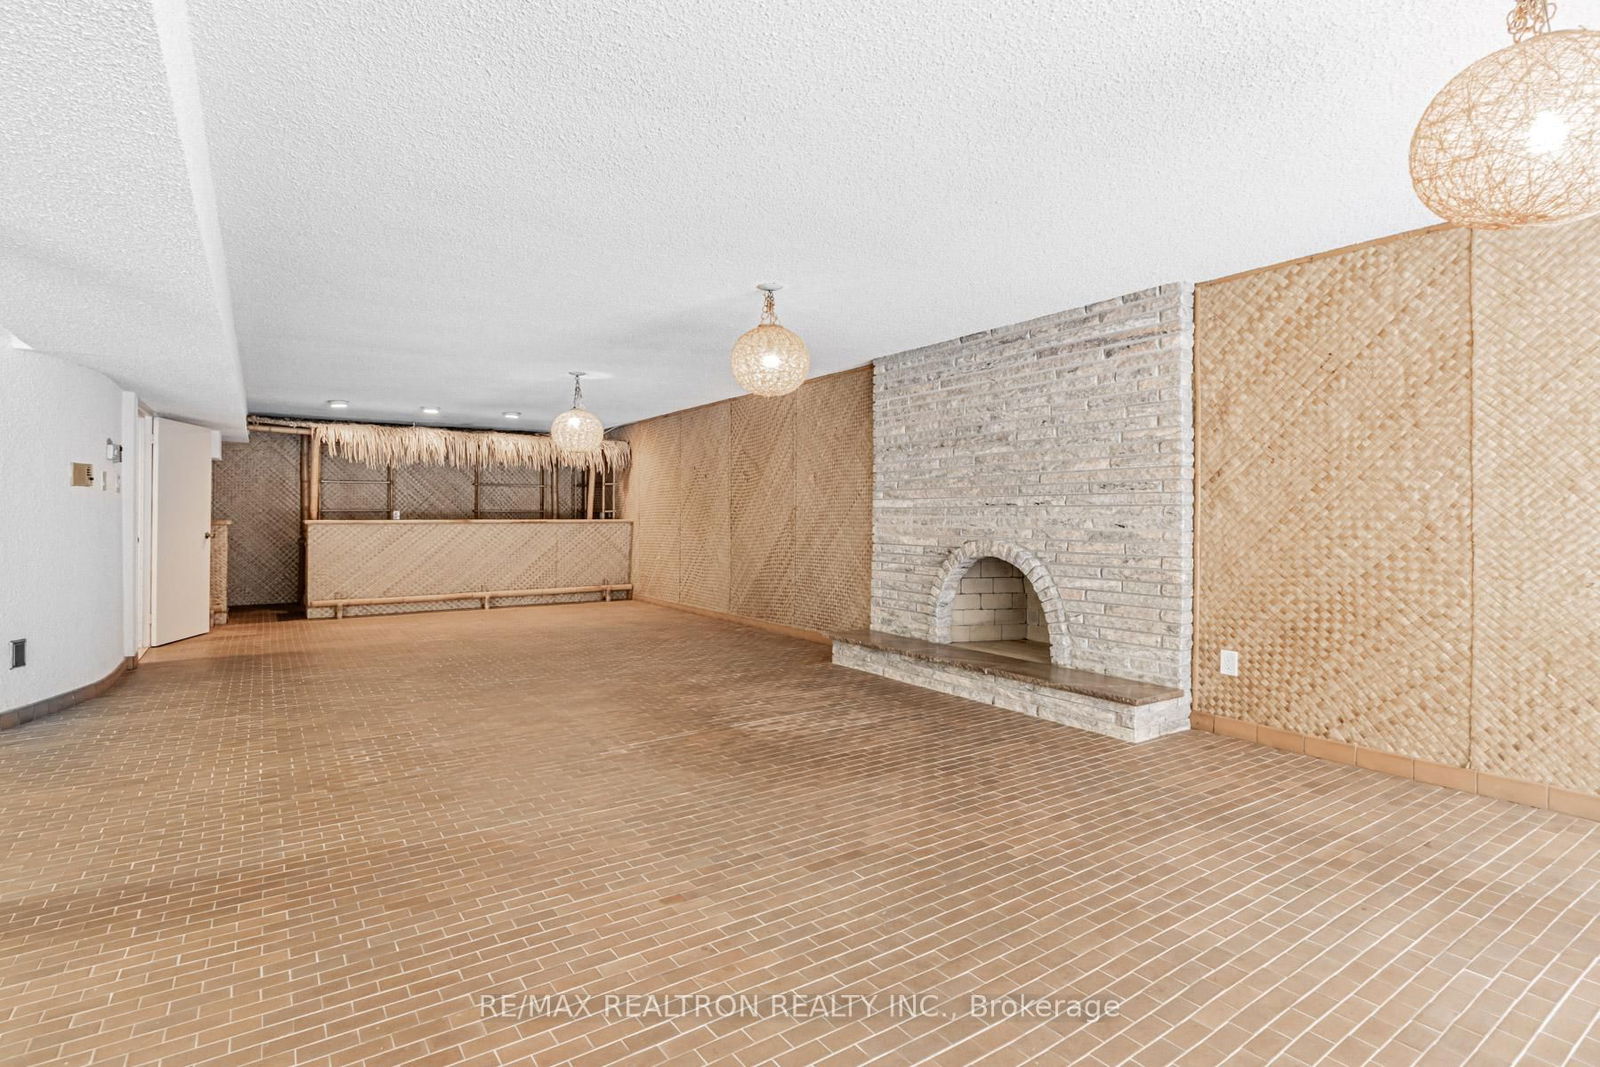
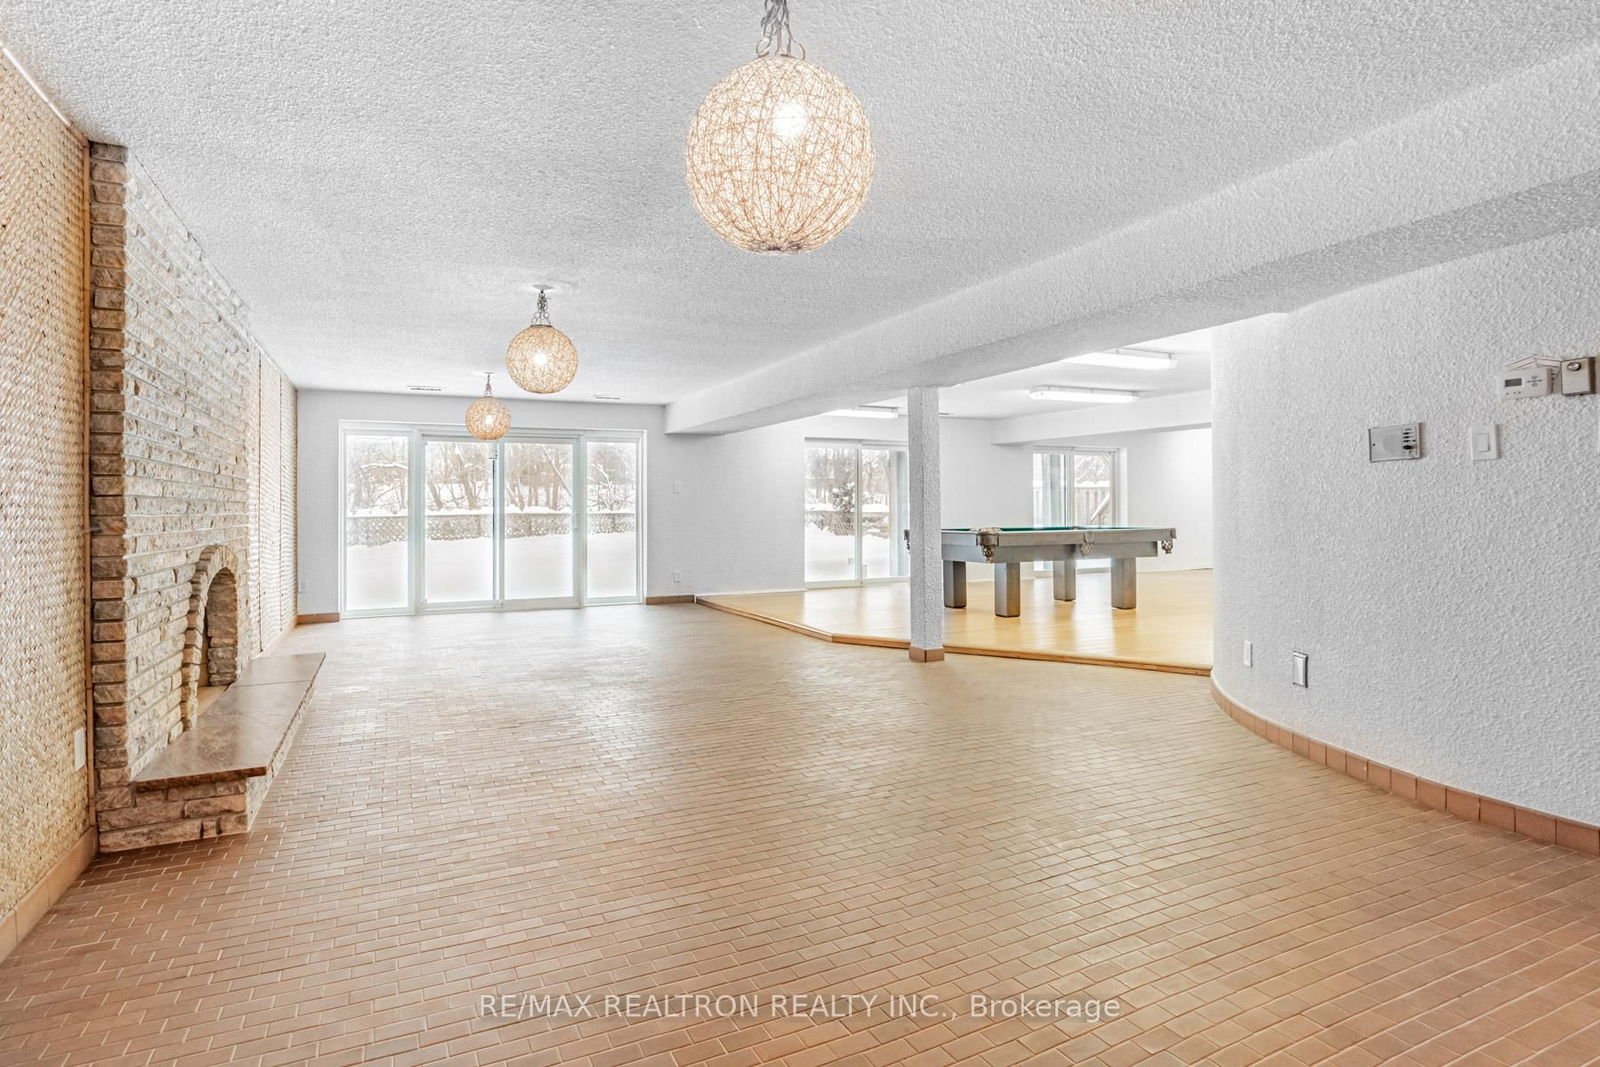
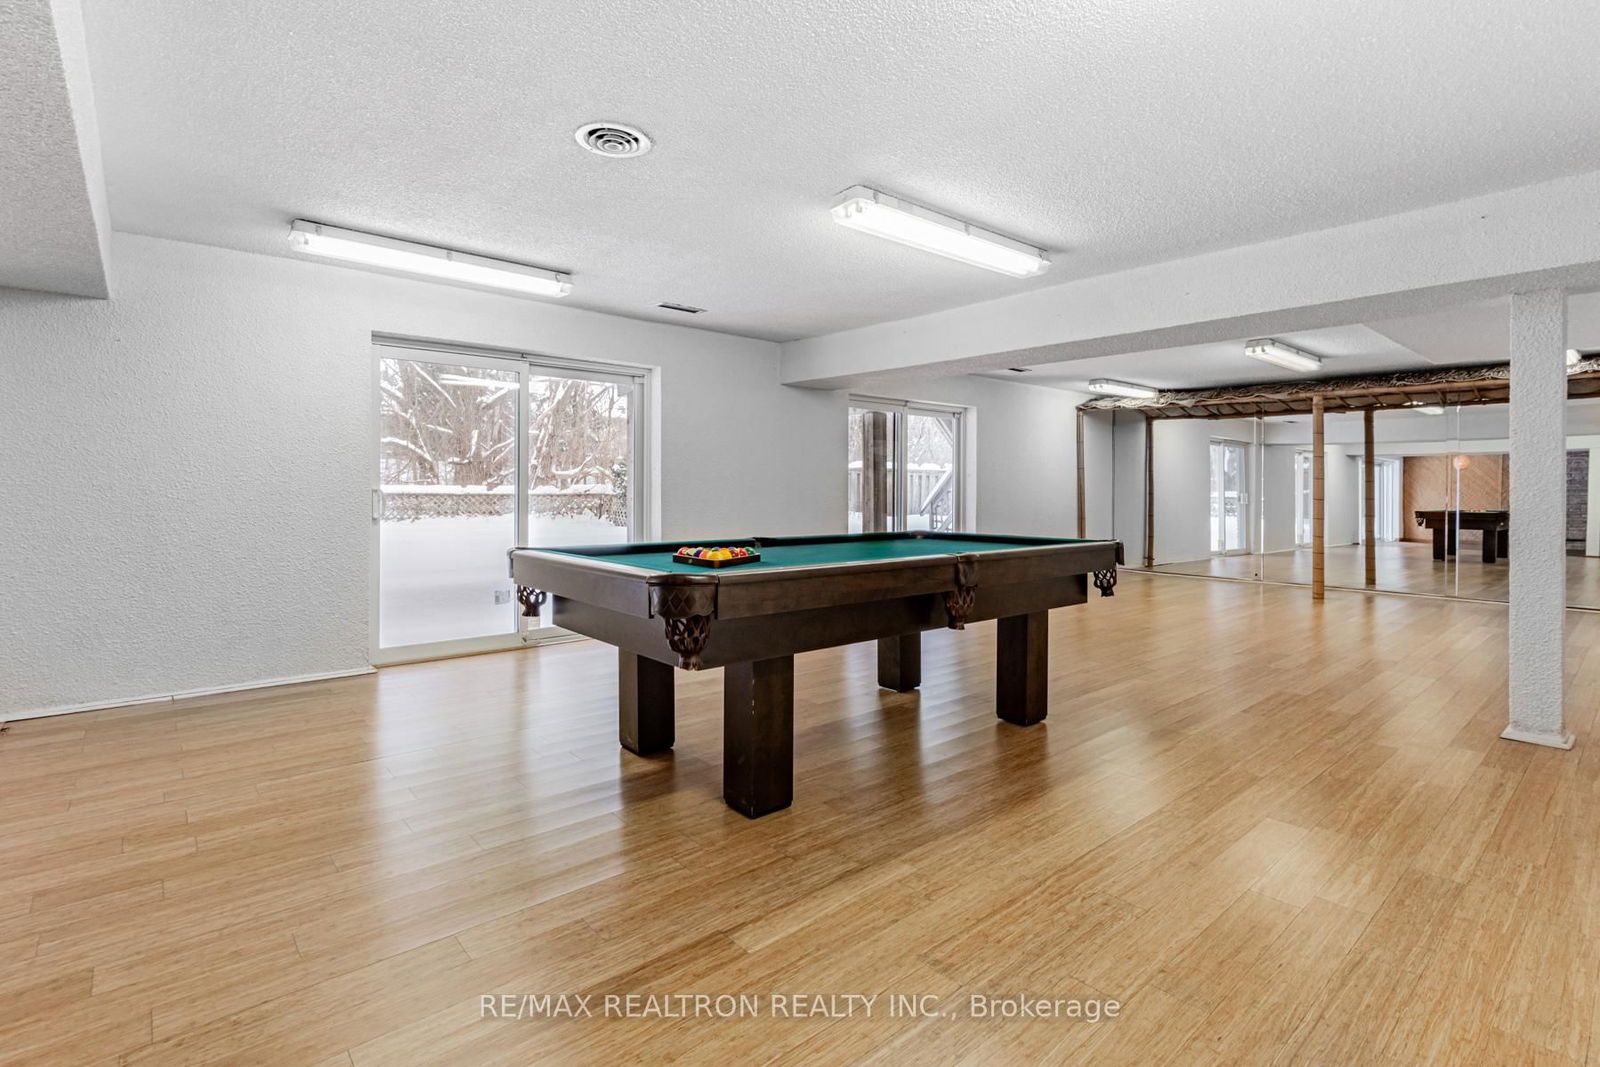
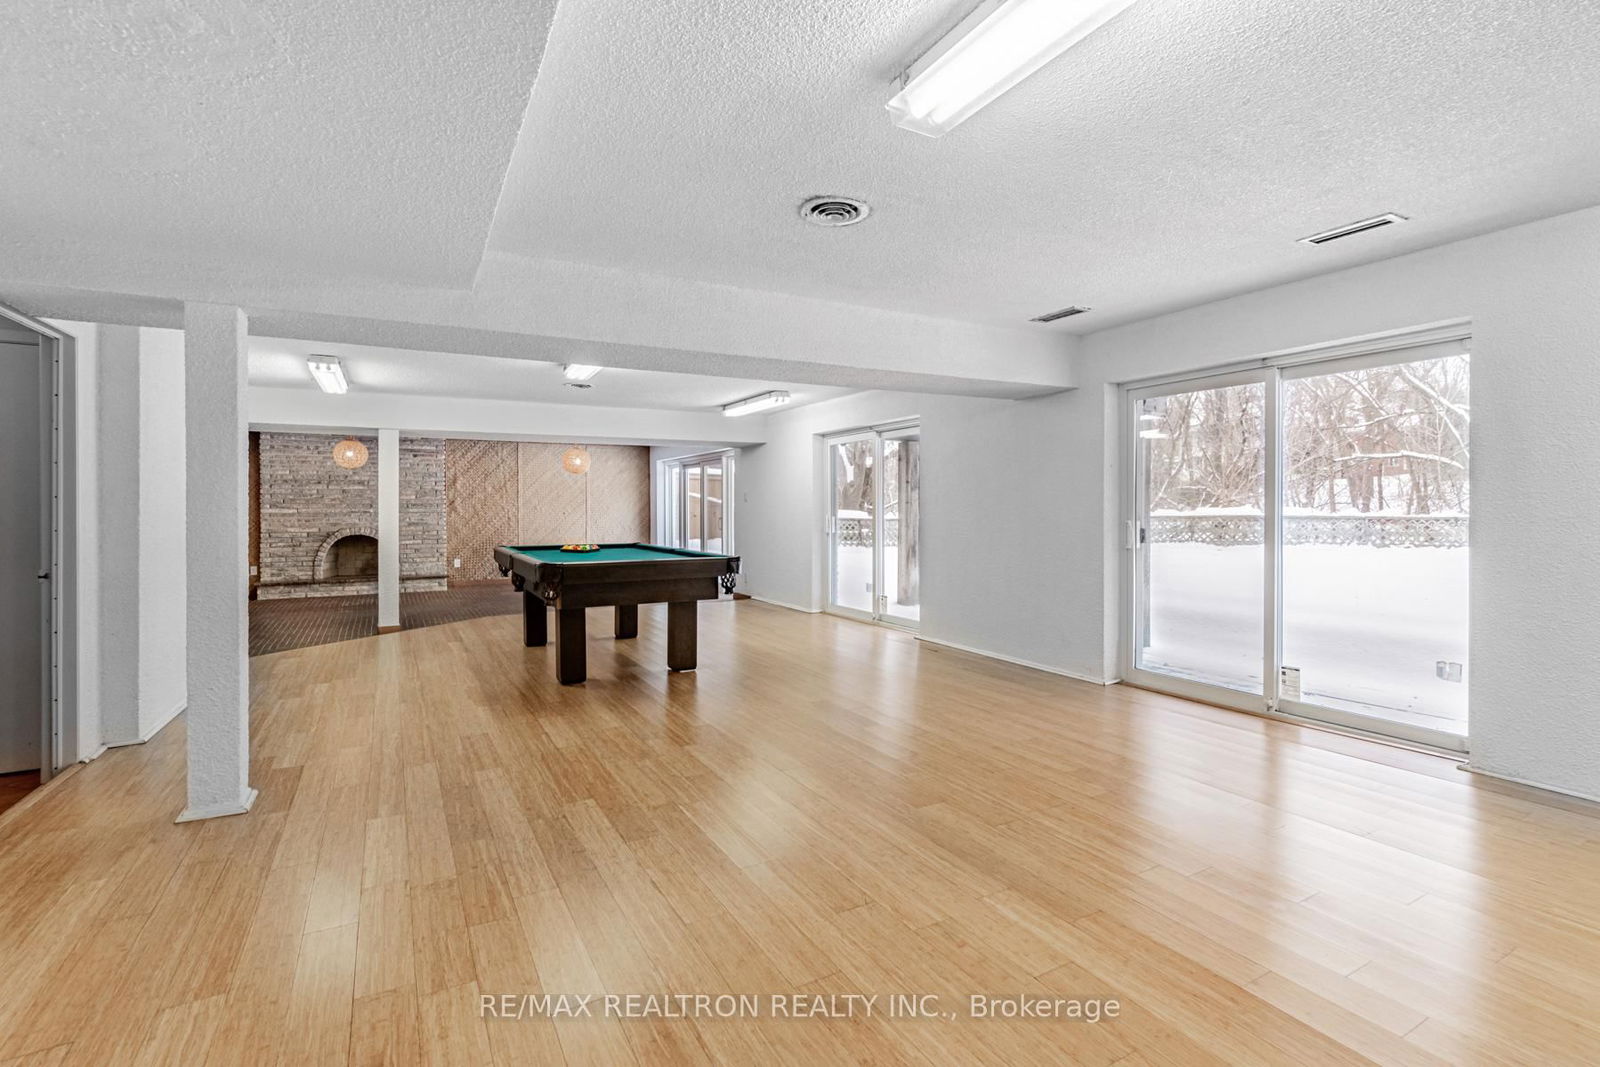
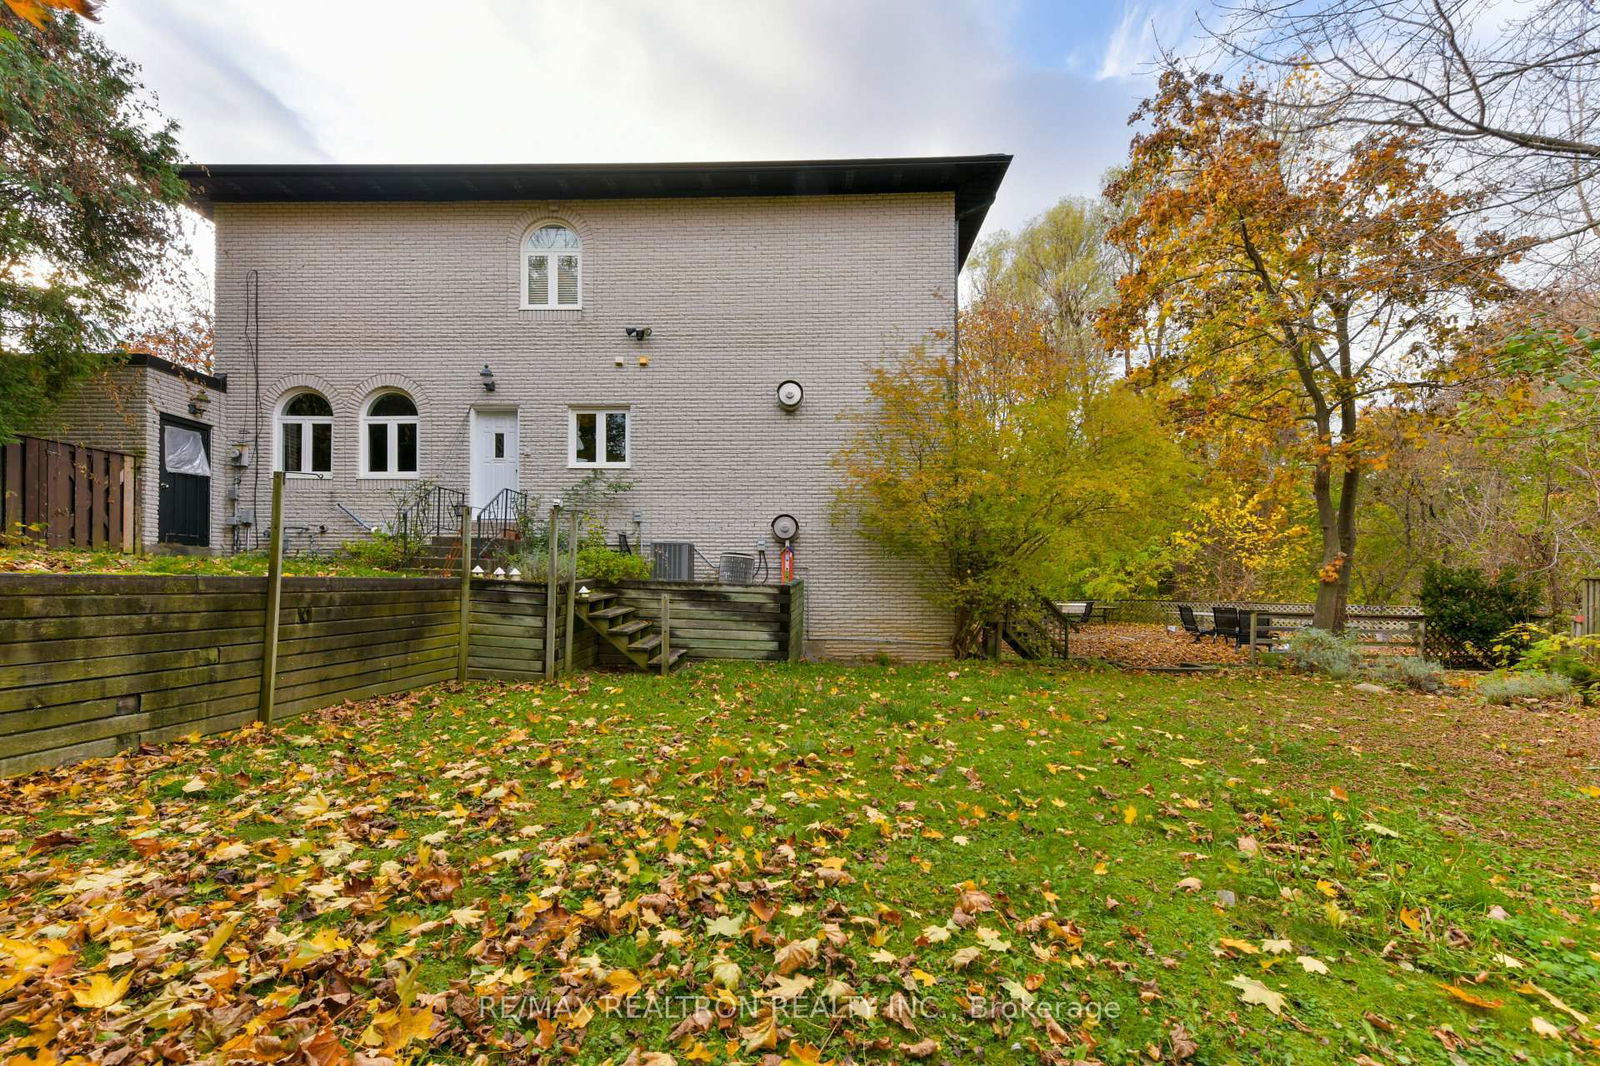
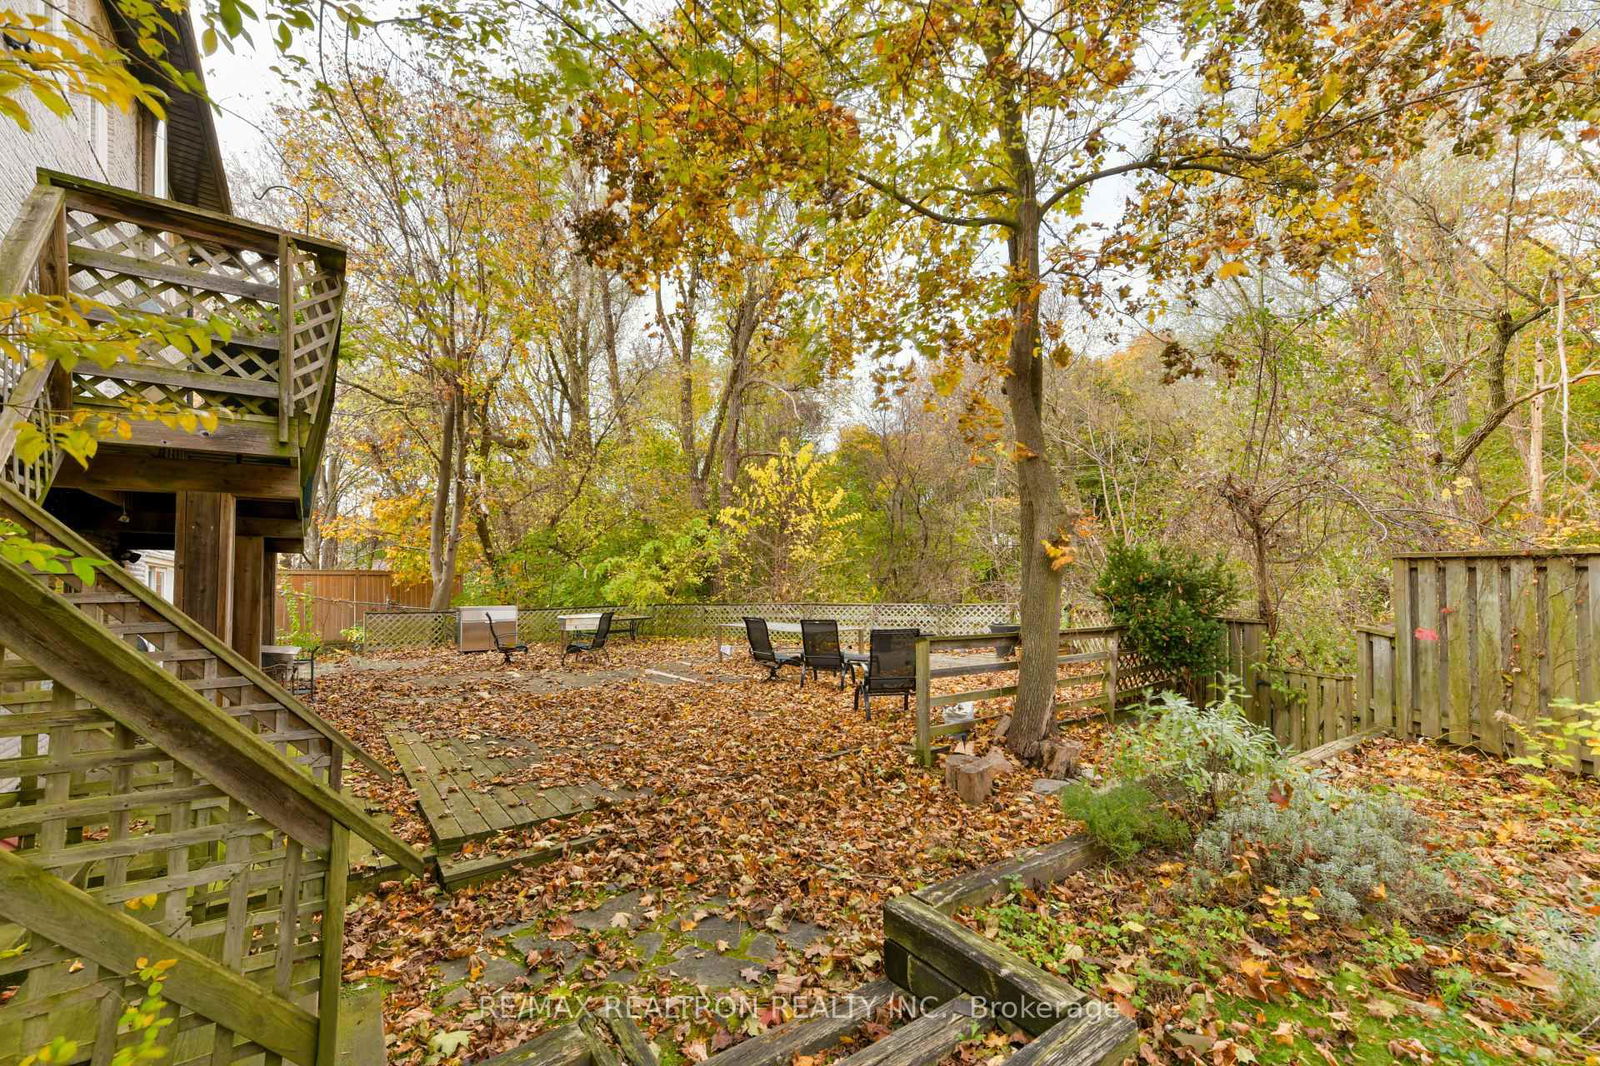
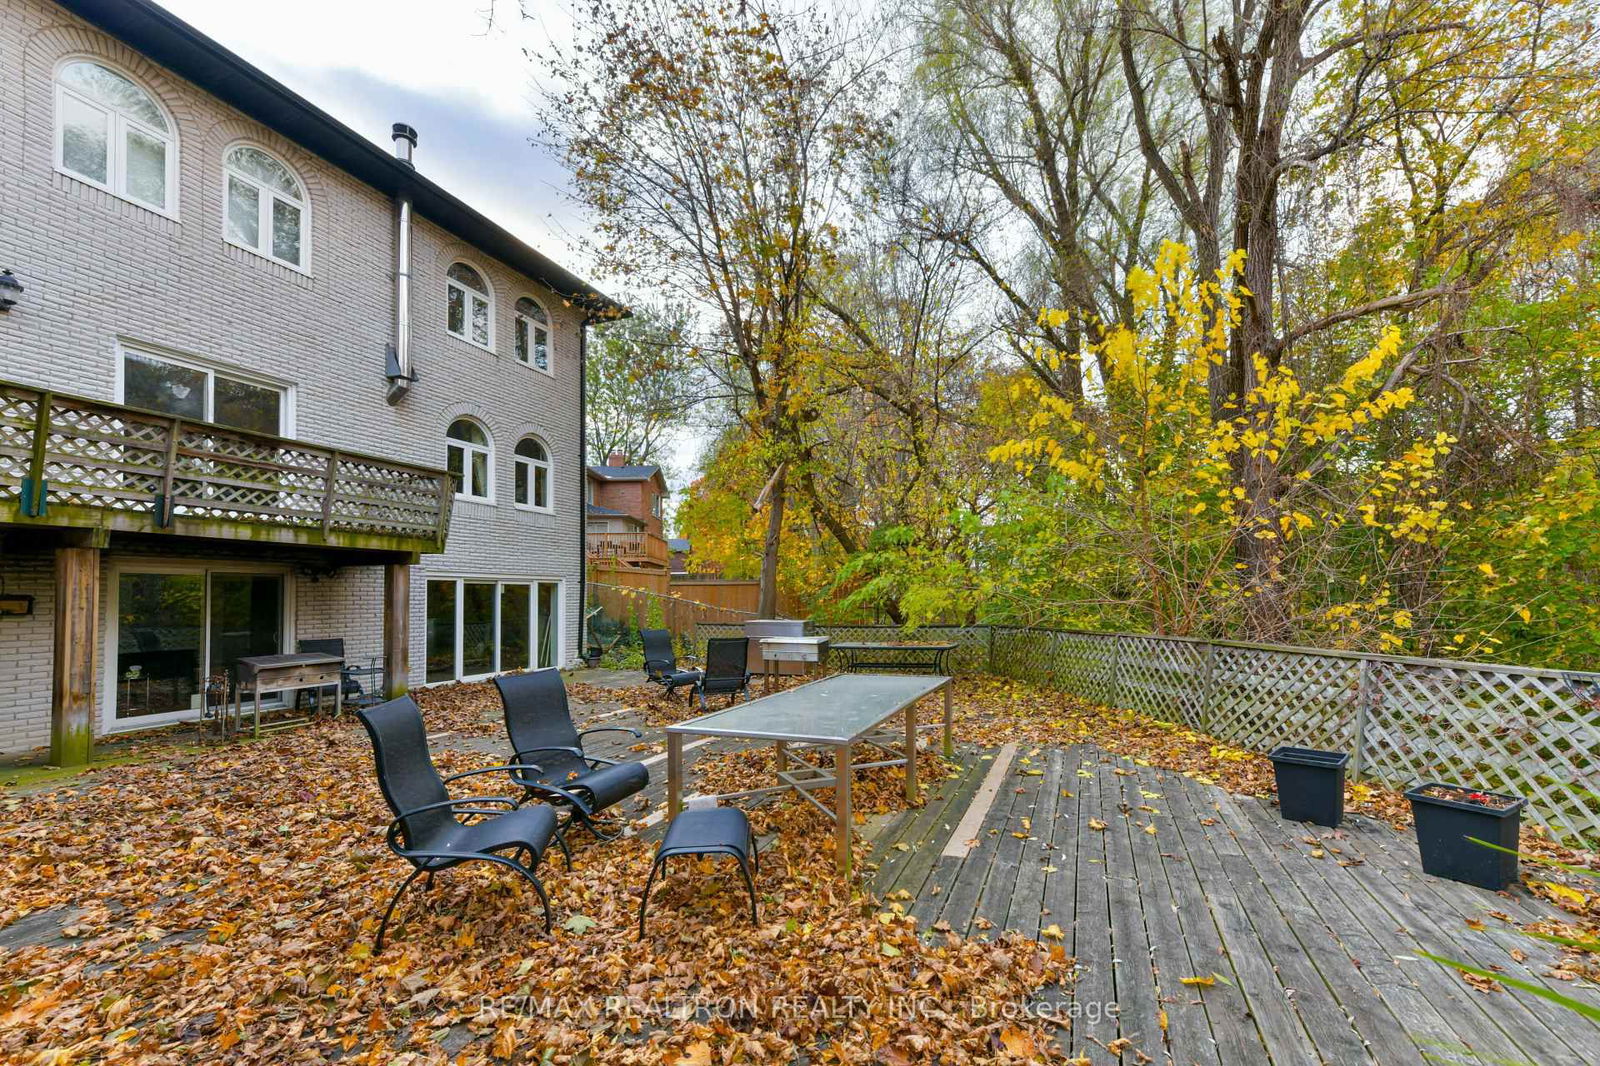
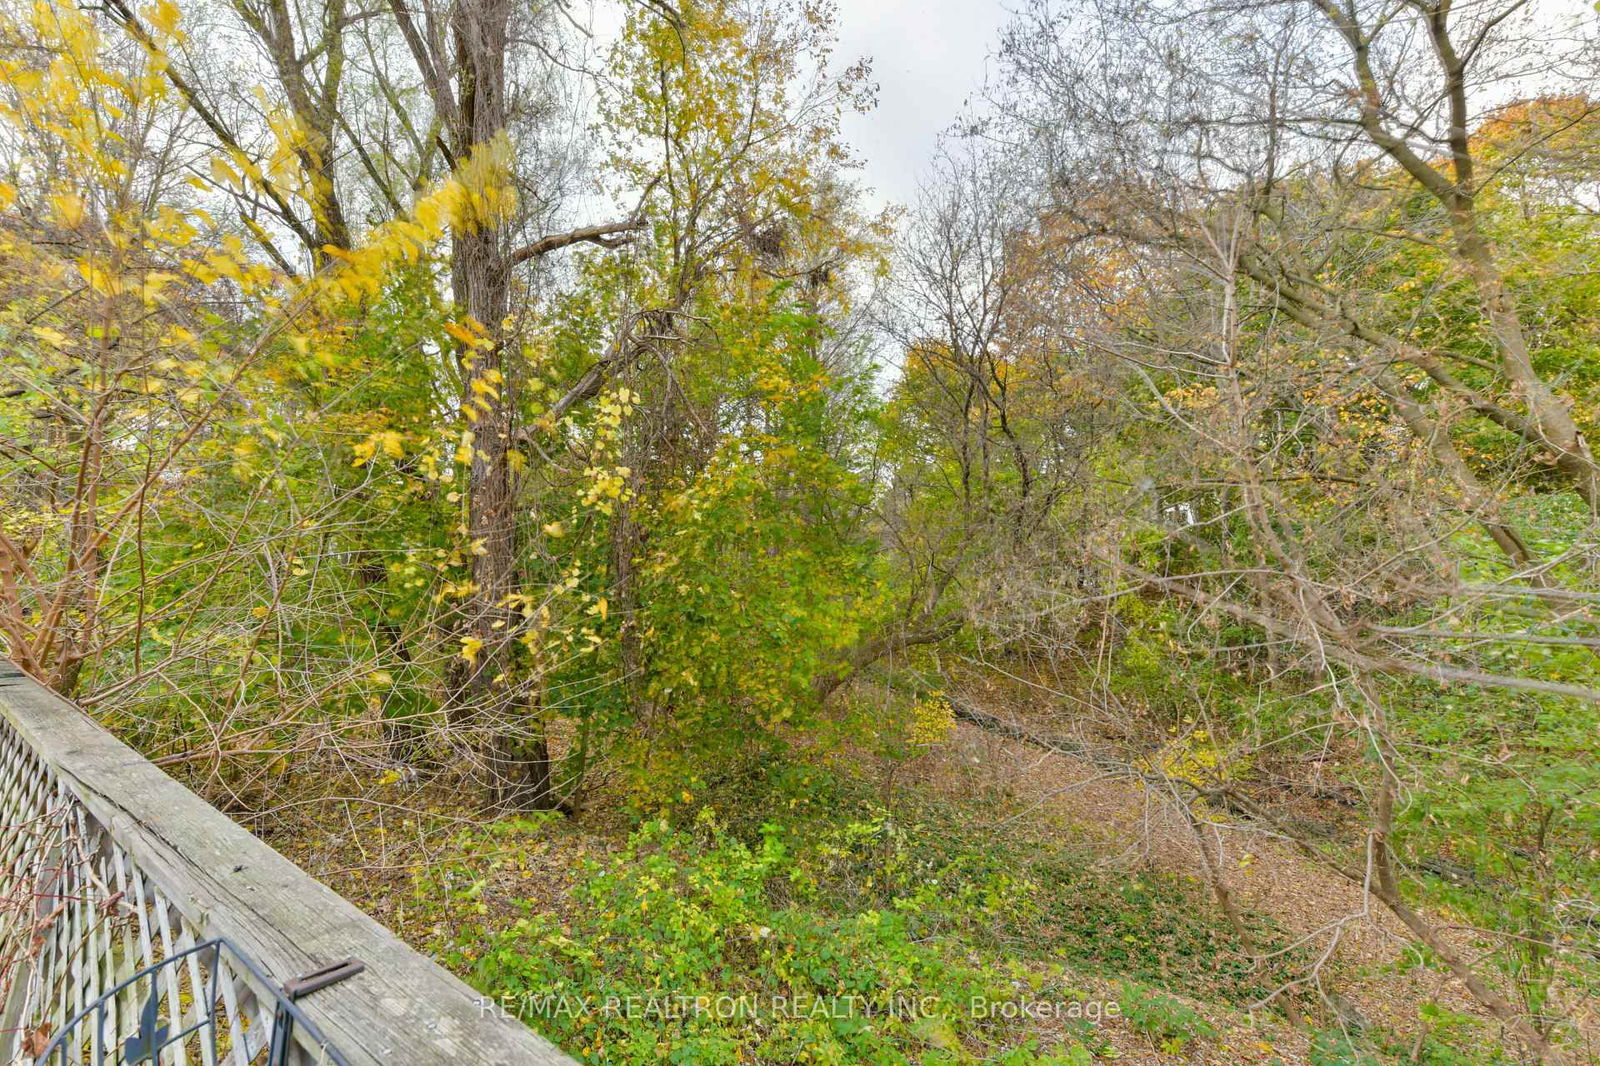
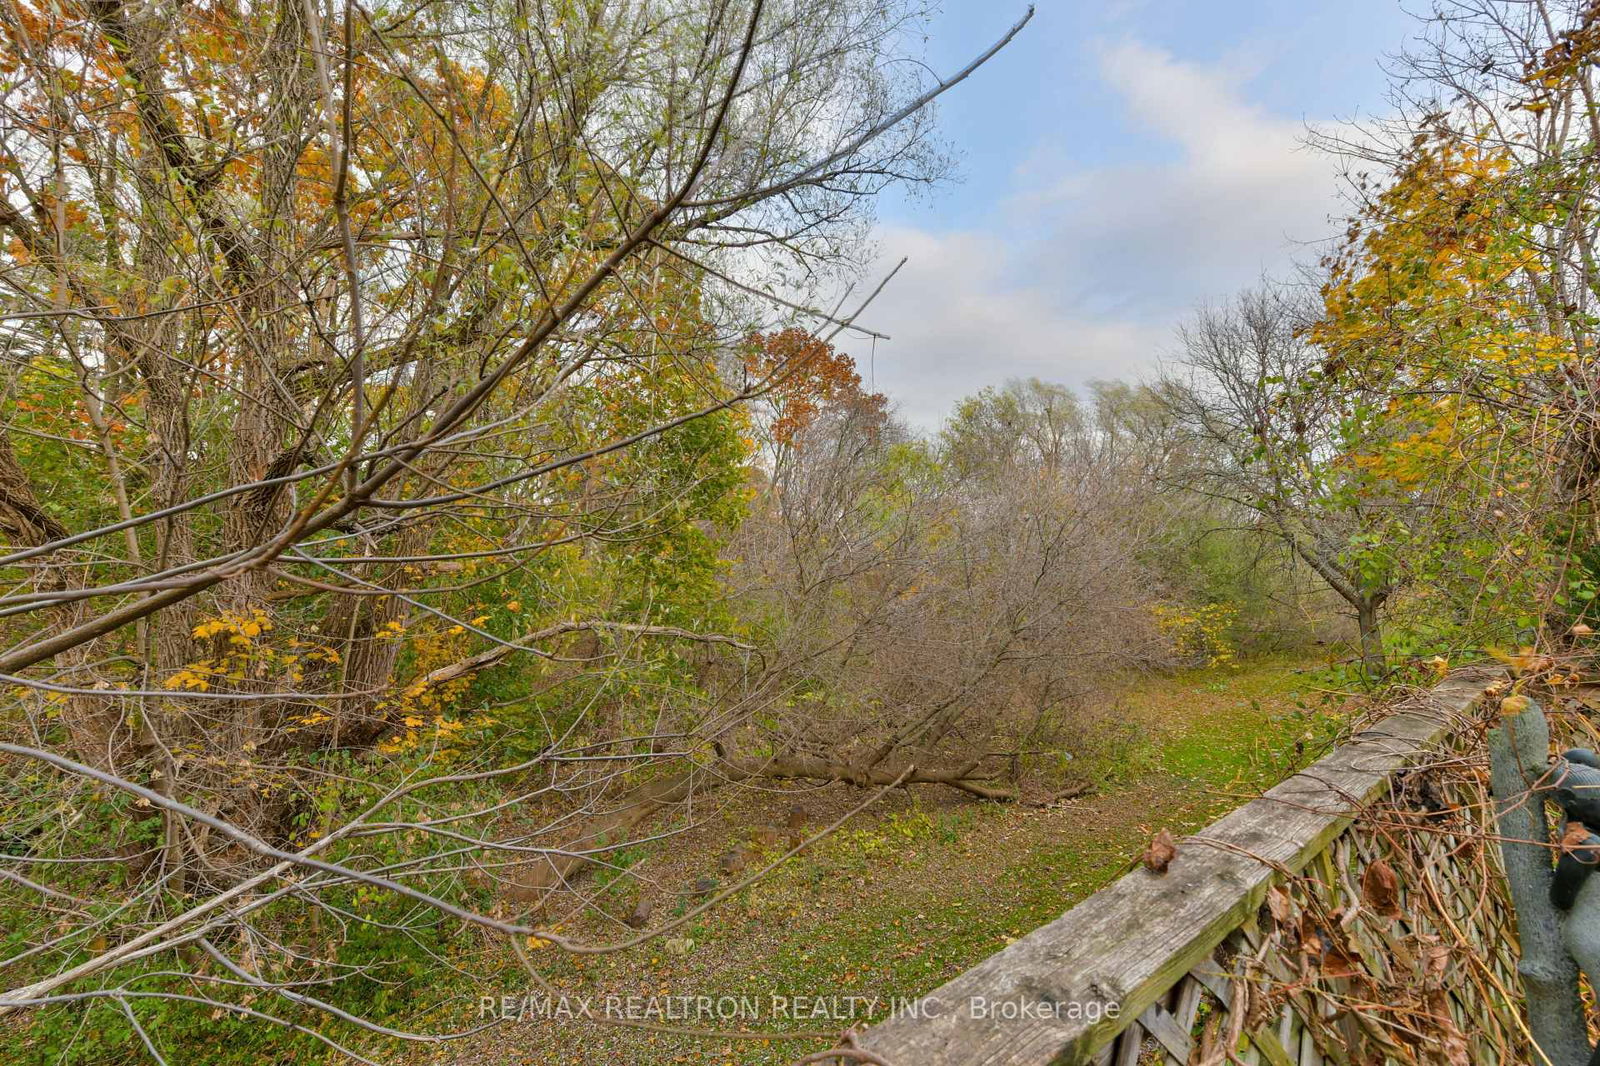
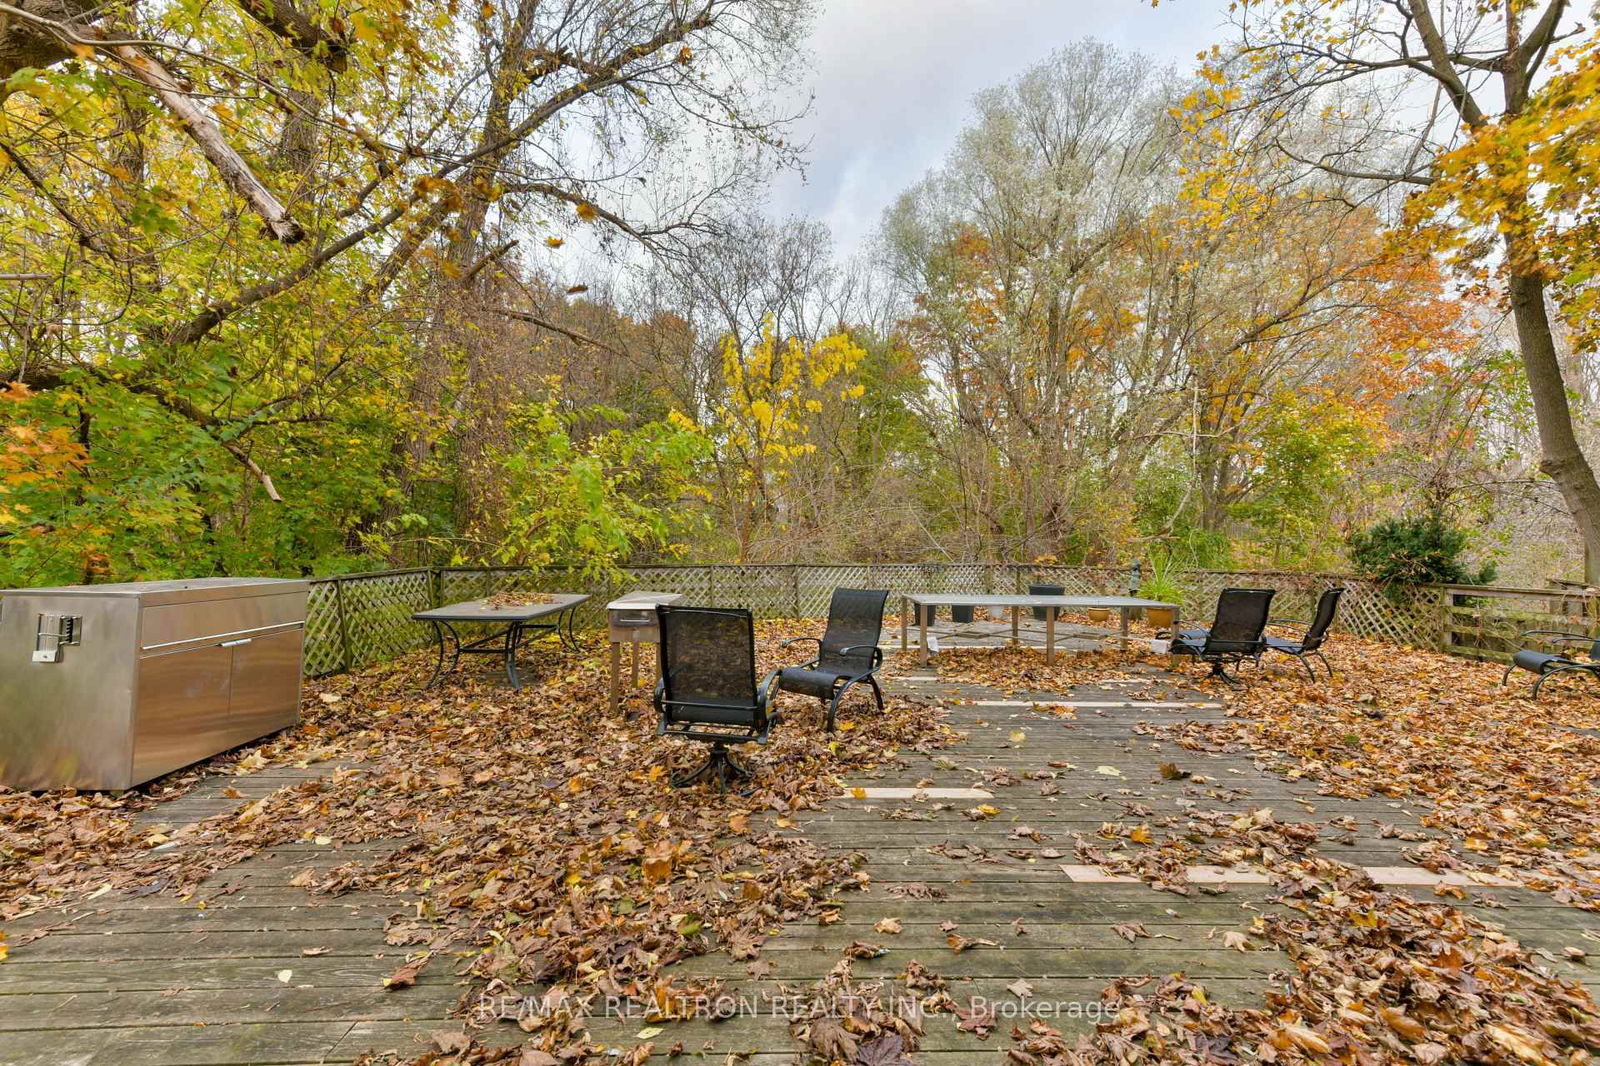
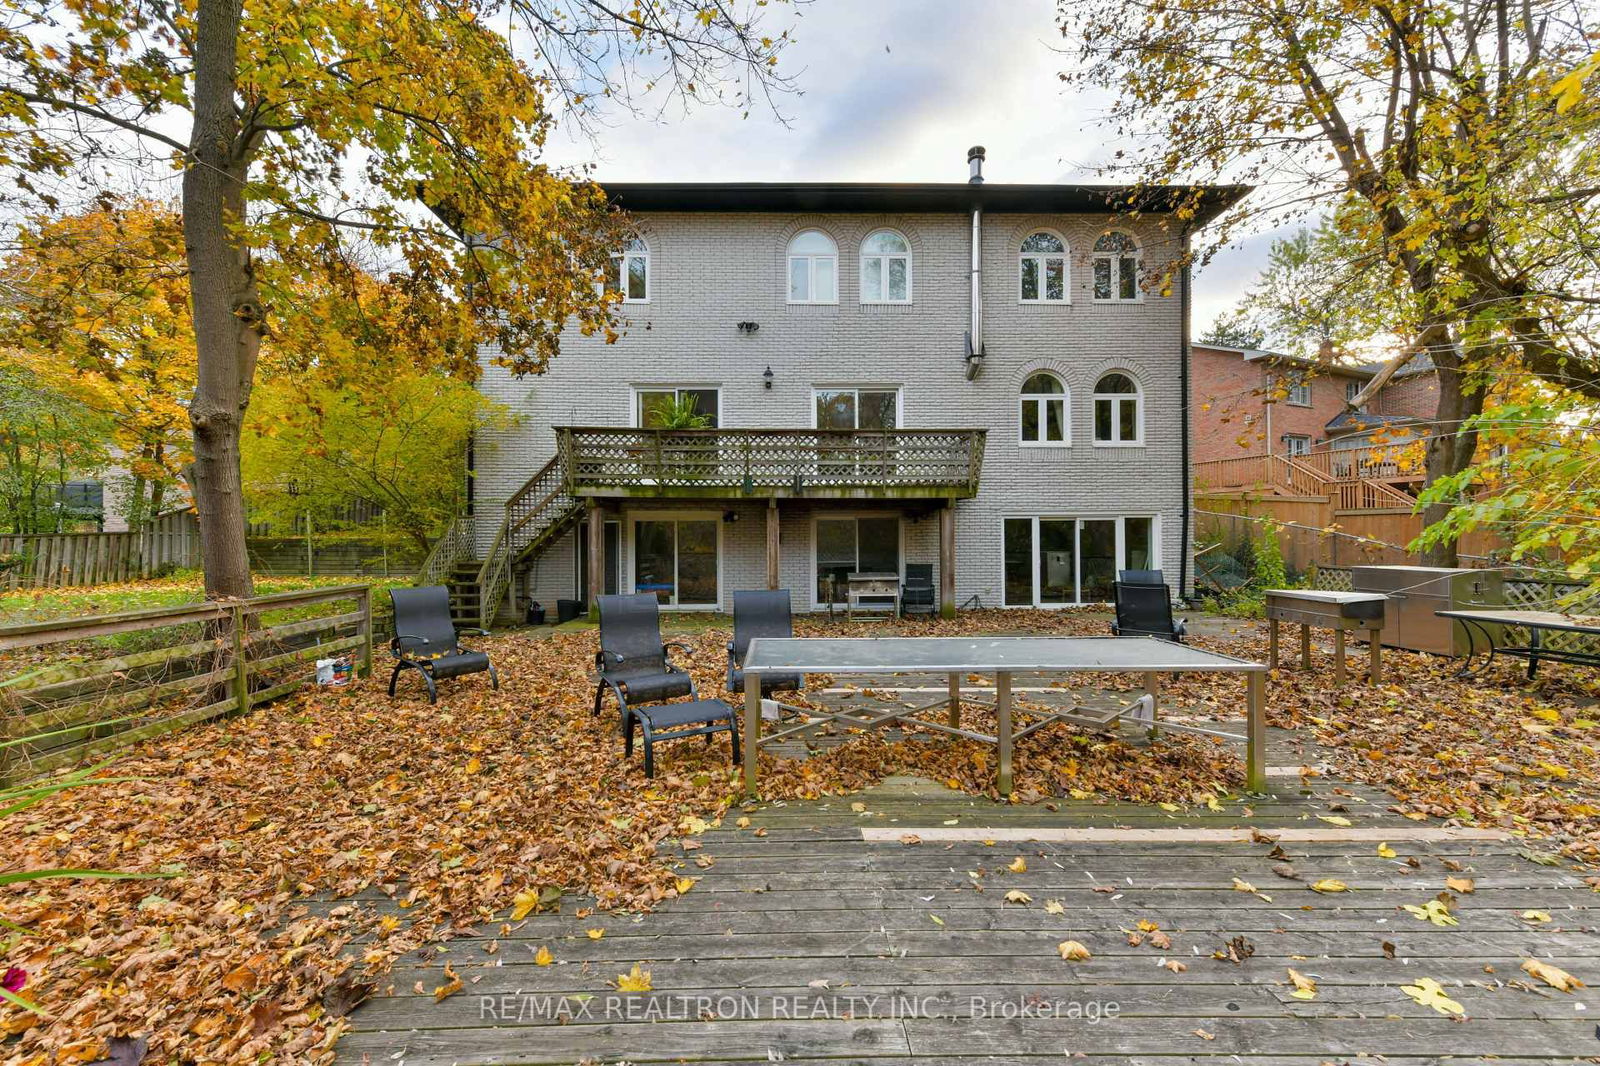
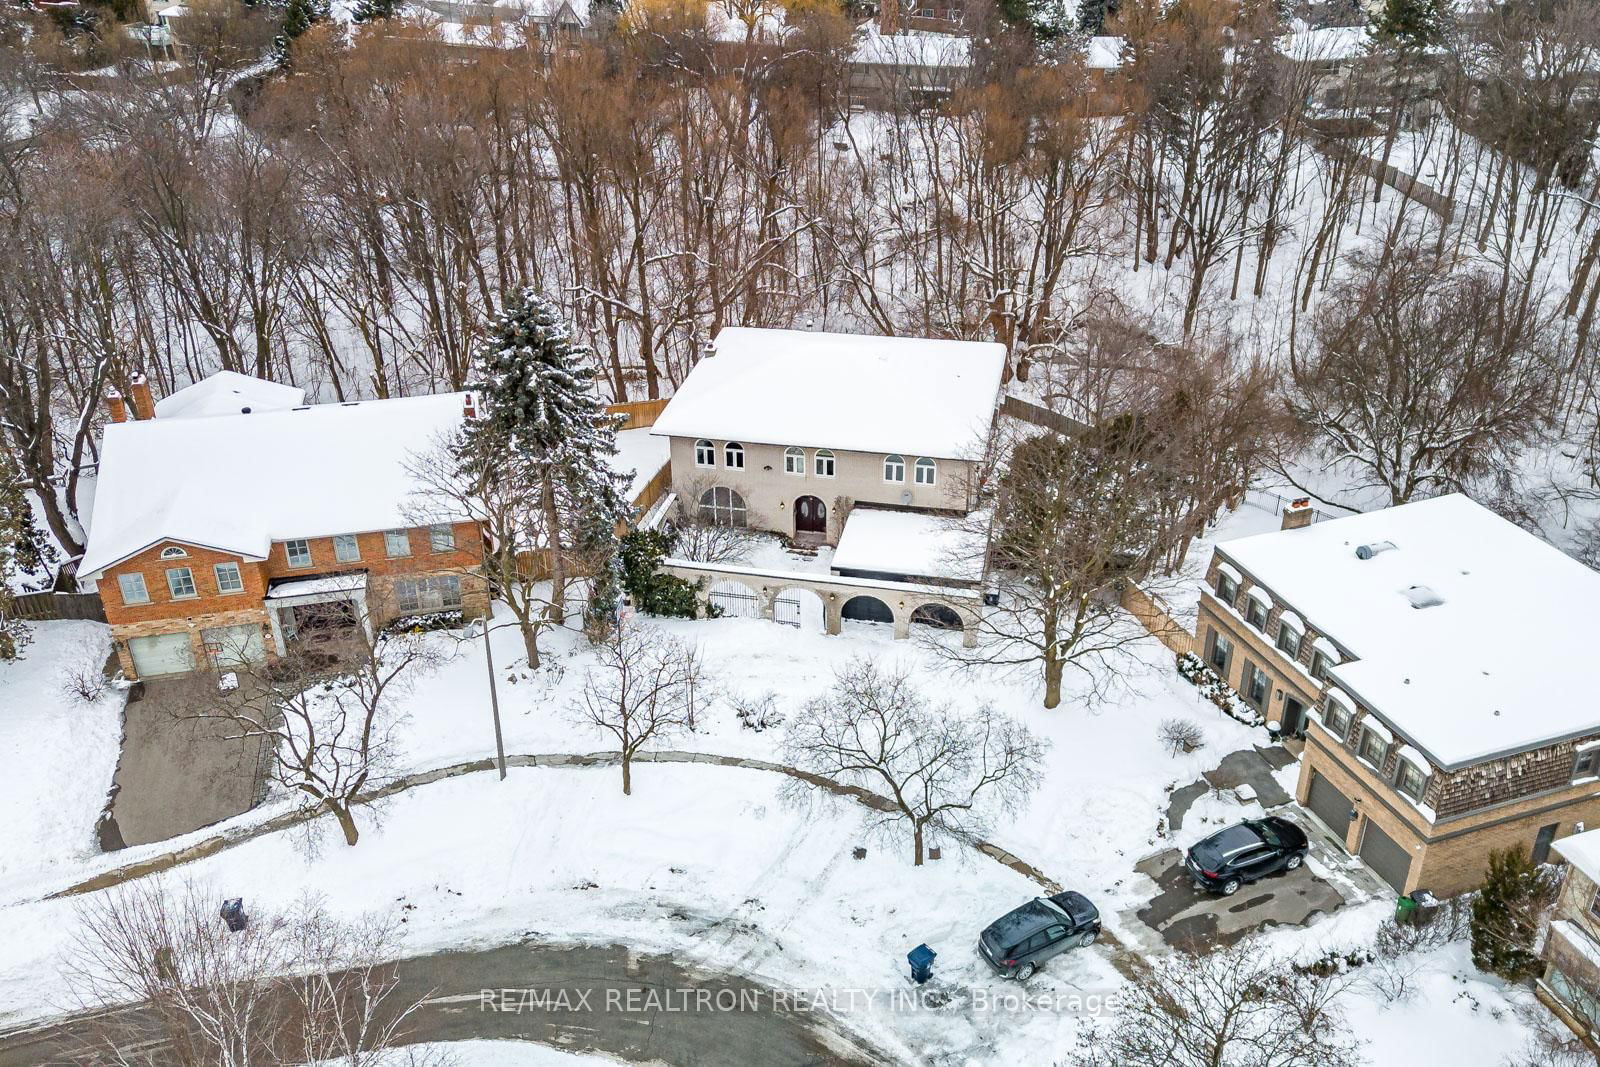
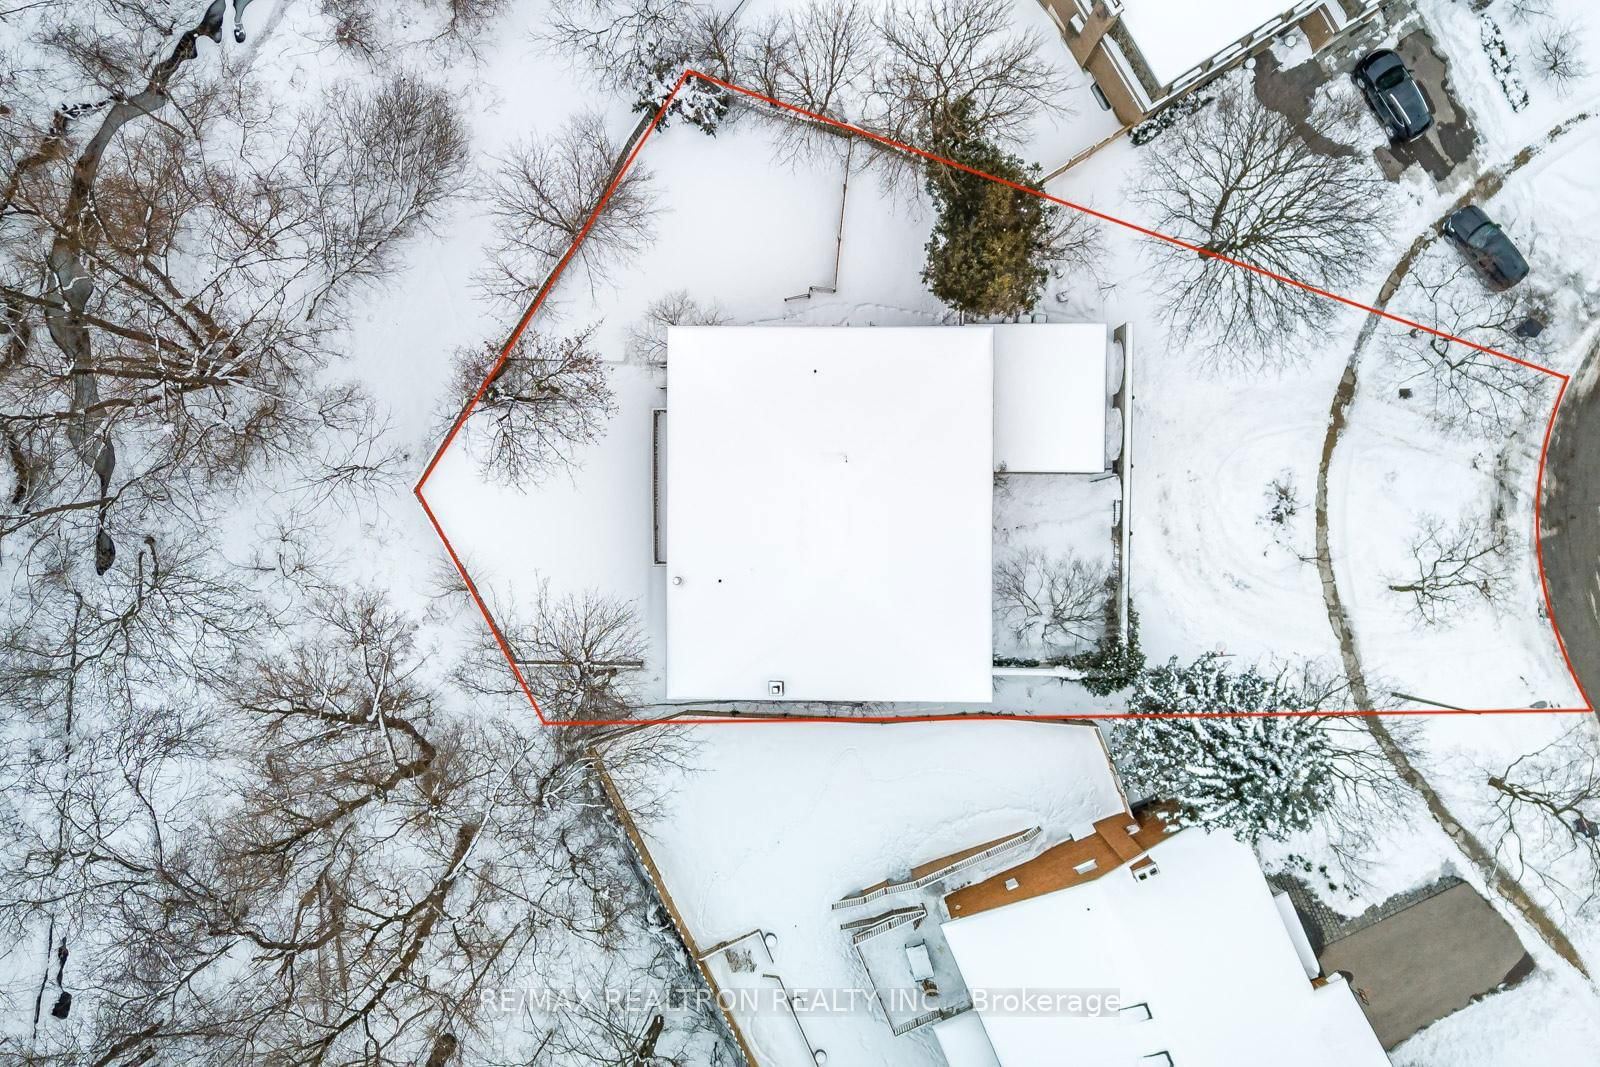
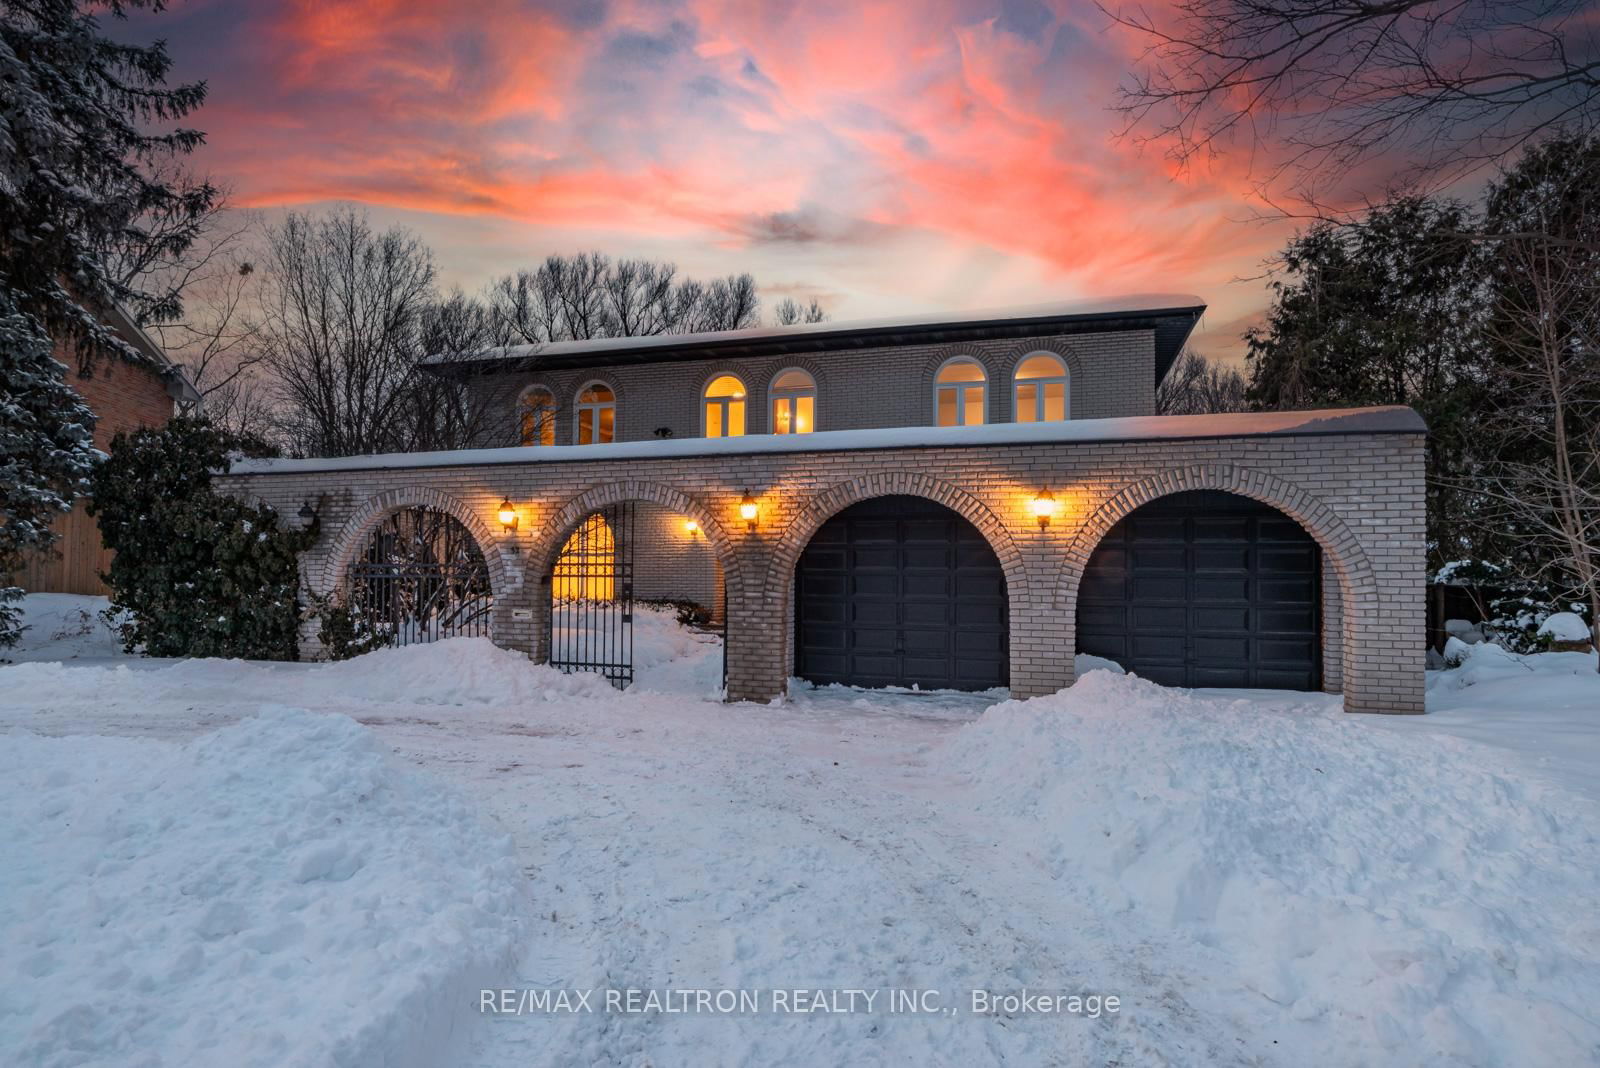
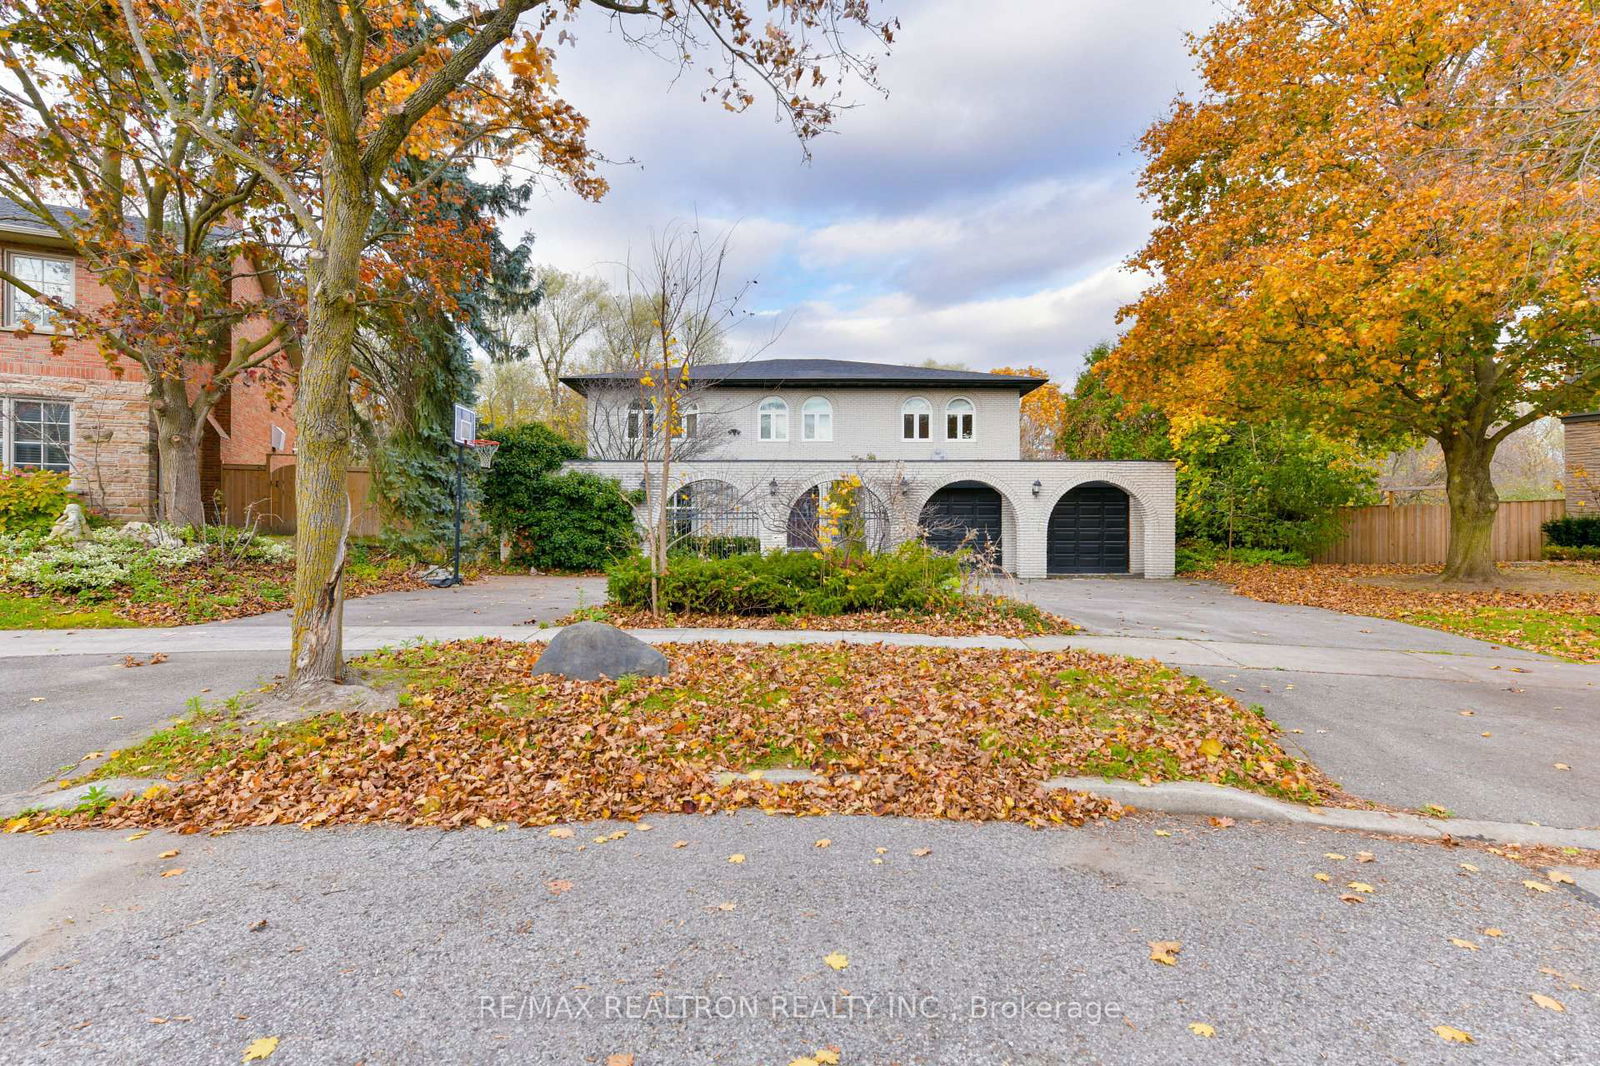
Muskoka in the city! Nestled in the prestigious St. Andrew-Windfields neighbourhood, this rare gem backs onto the lush Vyner Greenbelt, offering unmatched privacy and natural views. Situated on one of the largest lots on this peaceful crescent, this updated executive home delivers over 6,400 sq. ft. of total living space (4,300 above grade + 2,100 basement), including a fully finished walk-out basement. Enjoy a gated front garden for added security and curb appeal. The main floor features 9-ft smooth ceilings (rare for the area), pot lights, a solid oak staircase, hardwood floors, a fully panelled library, and a classic centre hall layout with spacious principal rooms. The chefs kitchen seamlessly connects to the breakfast and family room, with walk-out access to a deck overlooking the treetops. Upstairs, the primary retreat includes double walk-in closets and a large ensuite. A second ensuite bedroom with makeup area and two additional bedrooms overlook the private backyard. The basement is perfect for entertaining with a wet bar, sauna, cedar closet, nannys room, and walk-out to the backyard. Located near top-ranked public (Dunlace P.S., Windfields M.S., York Mills C.I.) and private schools (Bayview Glen, Toronto French, Crescent, Crestwood), Bayview Village Shopping Centre, York Mills subway, parks, and elite golf clubs. Easy access to Hwy 401 and DVP makes commuting simple. A truly exceptional home in one of Torontos most sought-after neighbourhoods.
Fridge, Stove, Dishwasher, Washer, Dryer, A/C (older one). (All Fixtures, Appliances Are Included On An "As-Is" "Where-Is" Basis. No Warranties from The Sellers). Pool Table In Rec Area.
Study
Living
Dining
Family
Kitchen
Laundry
Primary
2nd Br
3rd Br
4th Br
Rec
Games
Br
The graph below compares the average list price and average sale price of homes in this neighborhood by month for the last 24 months. When average sale price is greater than average list price, this may suggest a buyer's market. When average sale price is lower than the average list price this may suggest a seller's market.
The graph below illustrates the average days on market for homes in this neighborhood. The yellow area may indicate a buyer's market, the green area may indicate a balanced market and the red area may indicate a seller's market.
Sales Representative, Century 21 People’s Choice Realty Inc., Brokerage
(647) 576 - 2100
Toronto, St. Andrew-Windfields, M2P 1B9
Toronto, Bayview Village, M2K 1Y7