Century 21 People’s Choice Realty Inc., Brokerage
120 MATHESON BLVD E #103
MISSISSAUGA, Ontario
L4K 0A4


Toronto, South Riverdale, M4M 2W1
$1,289,000
Listed by RE/MAX HALLMARK REALTY LTD..
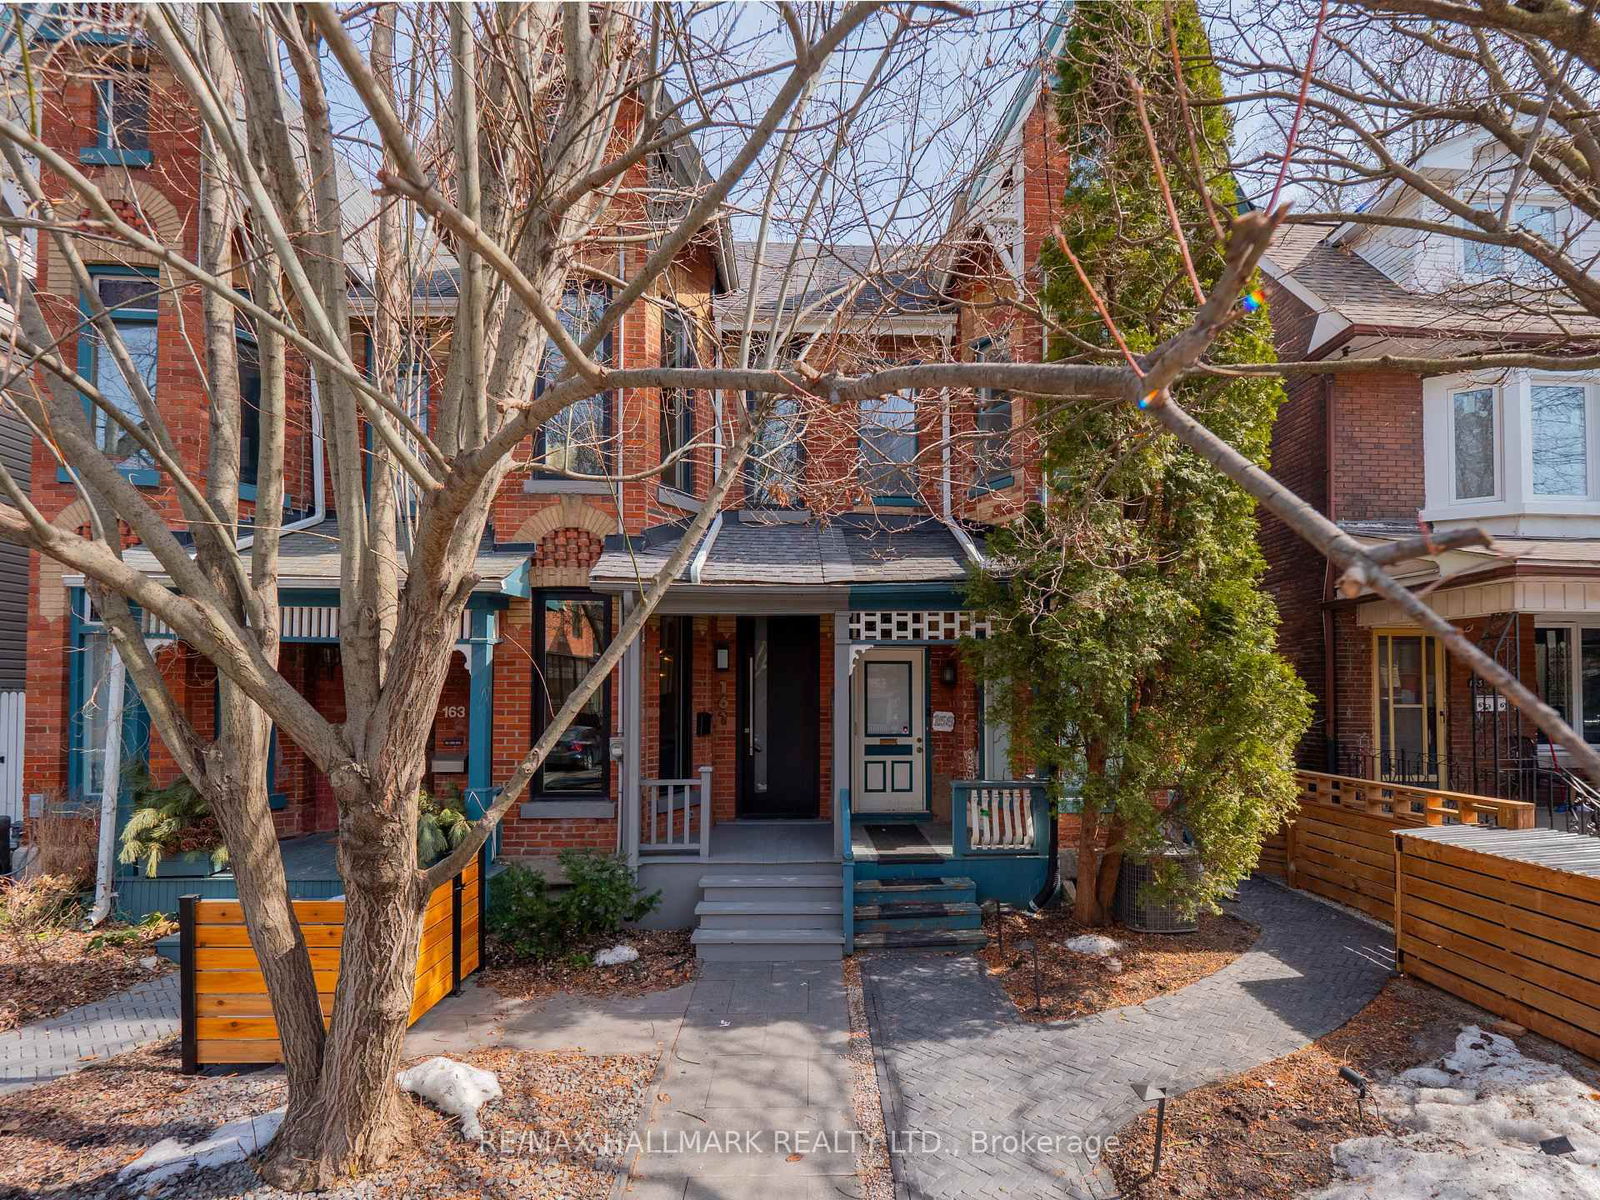
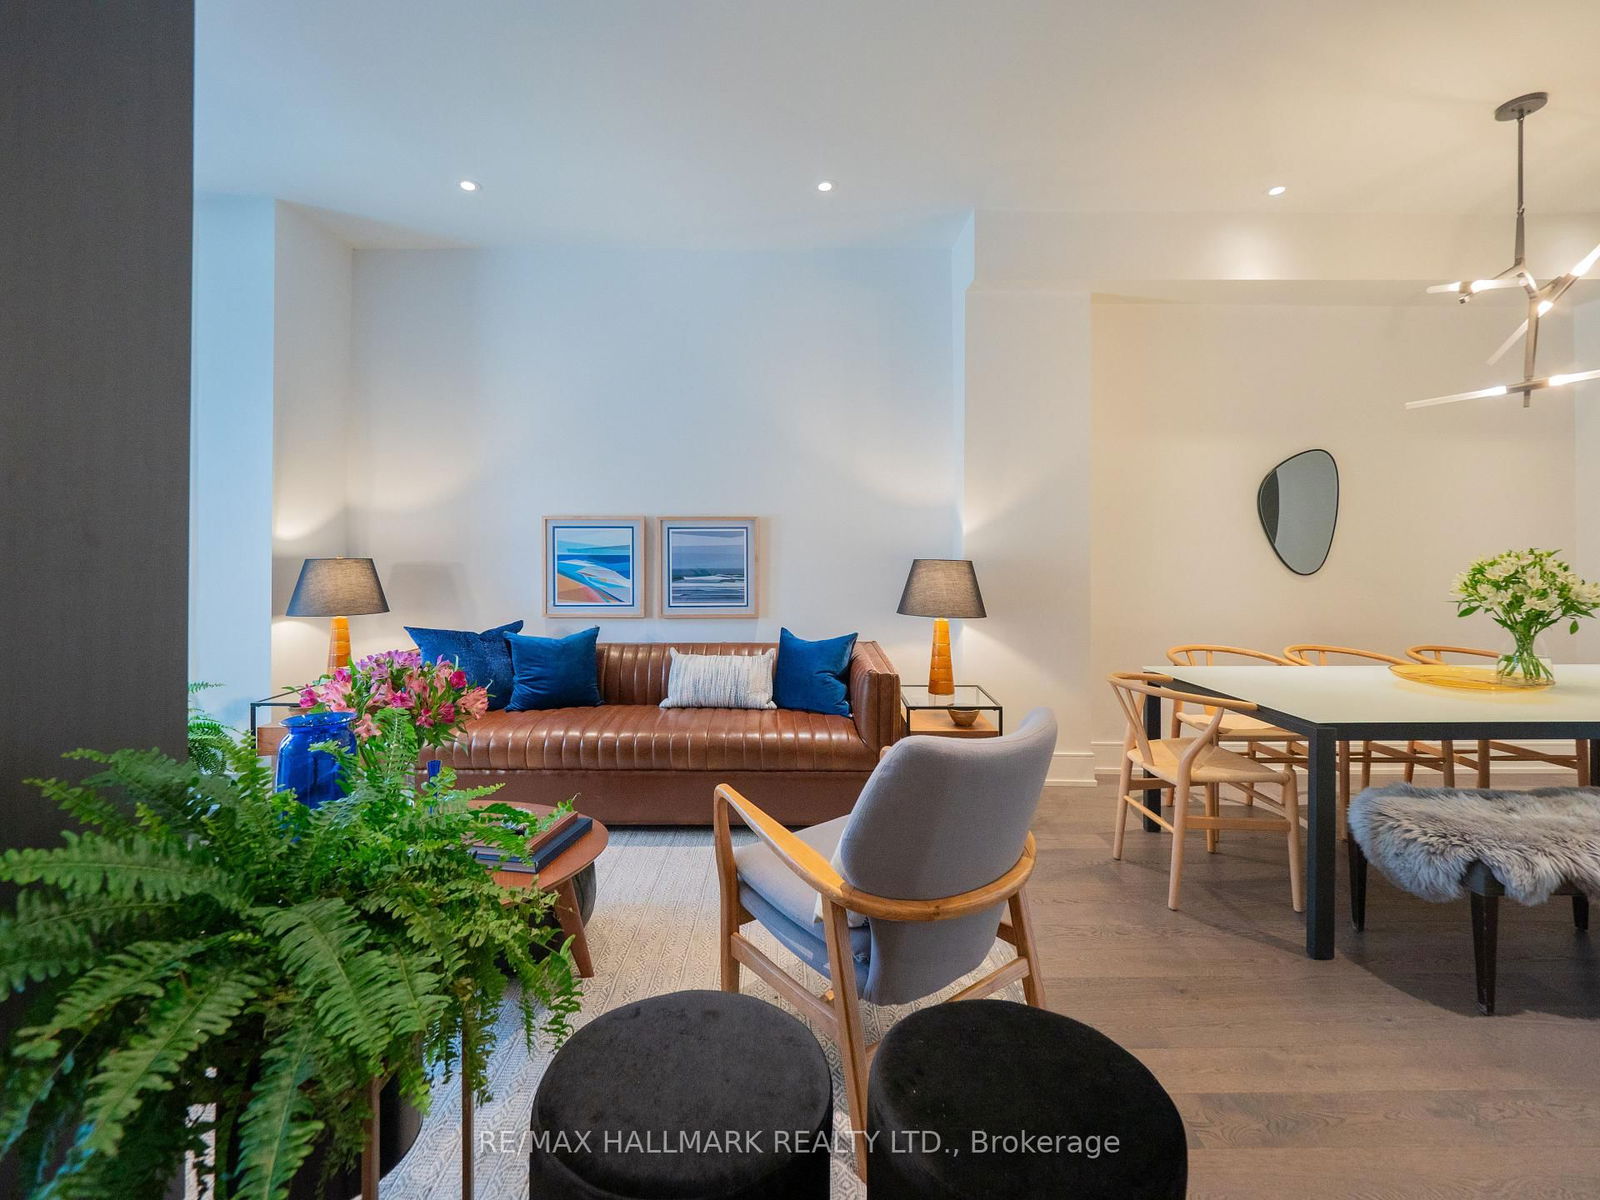
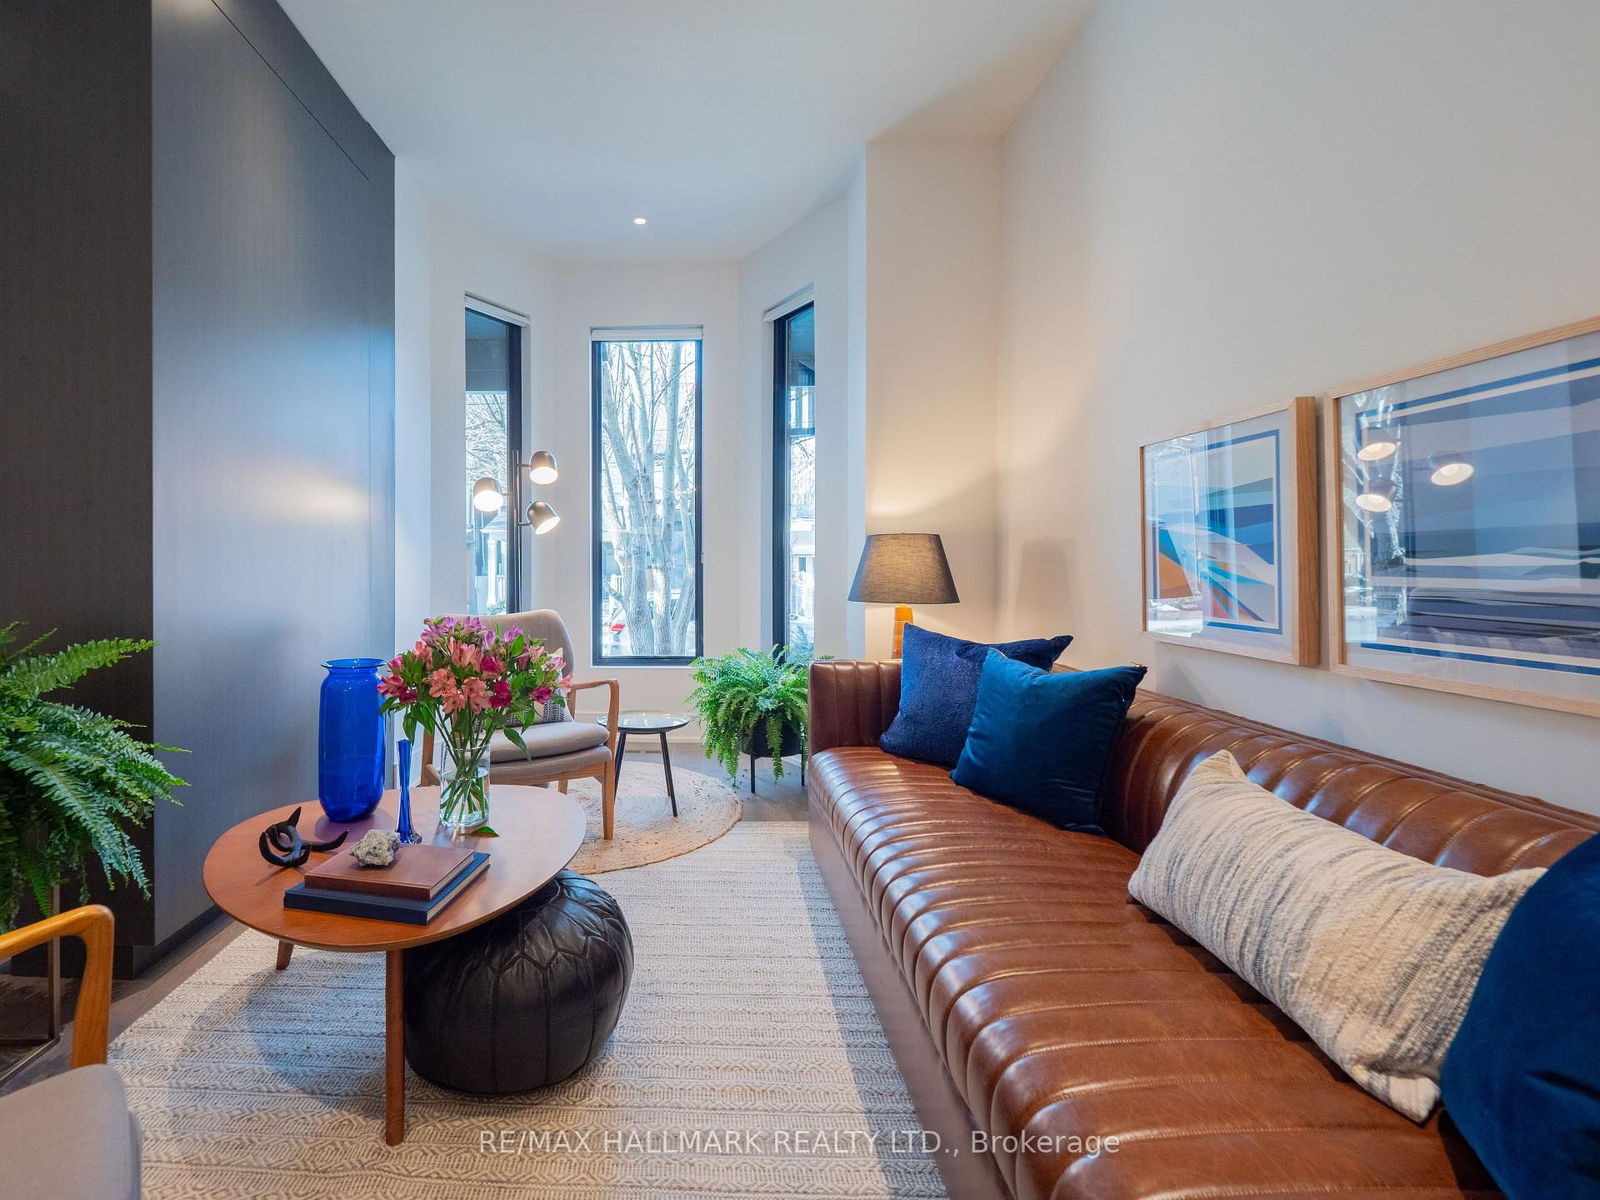
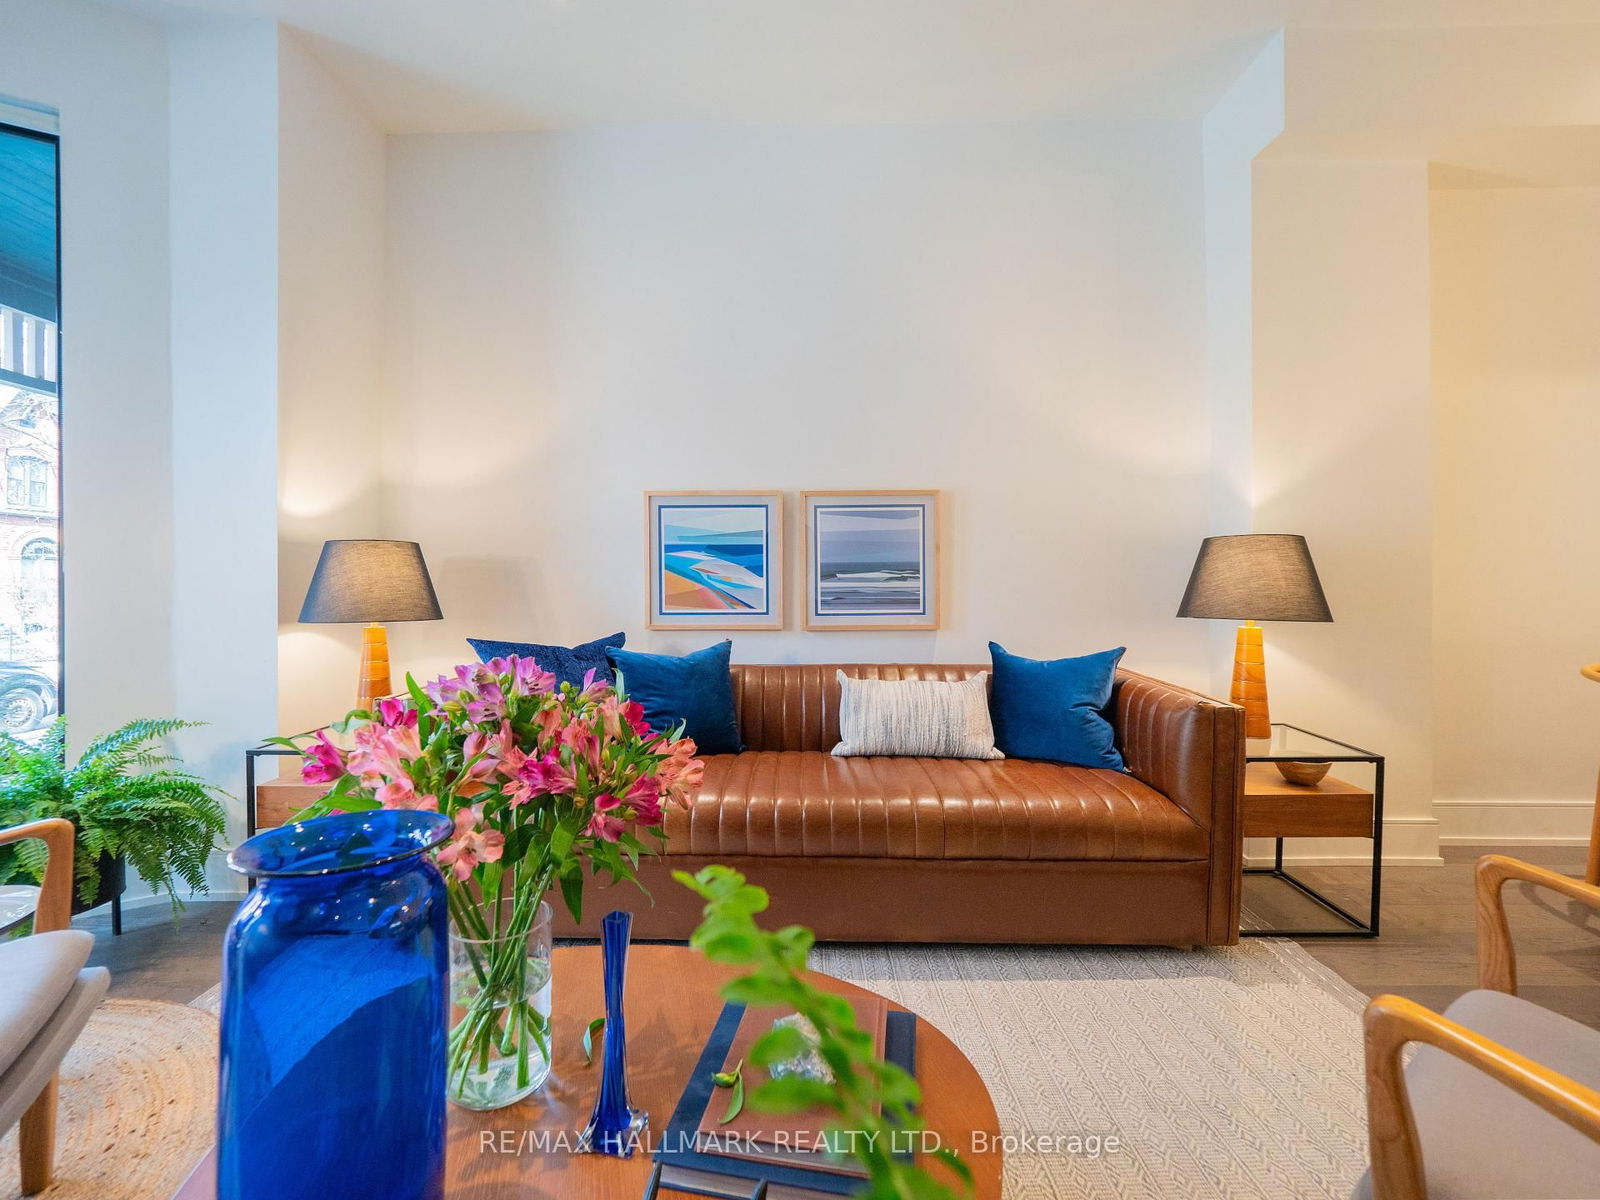
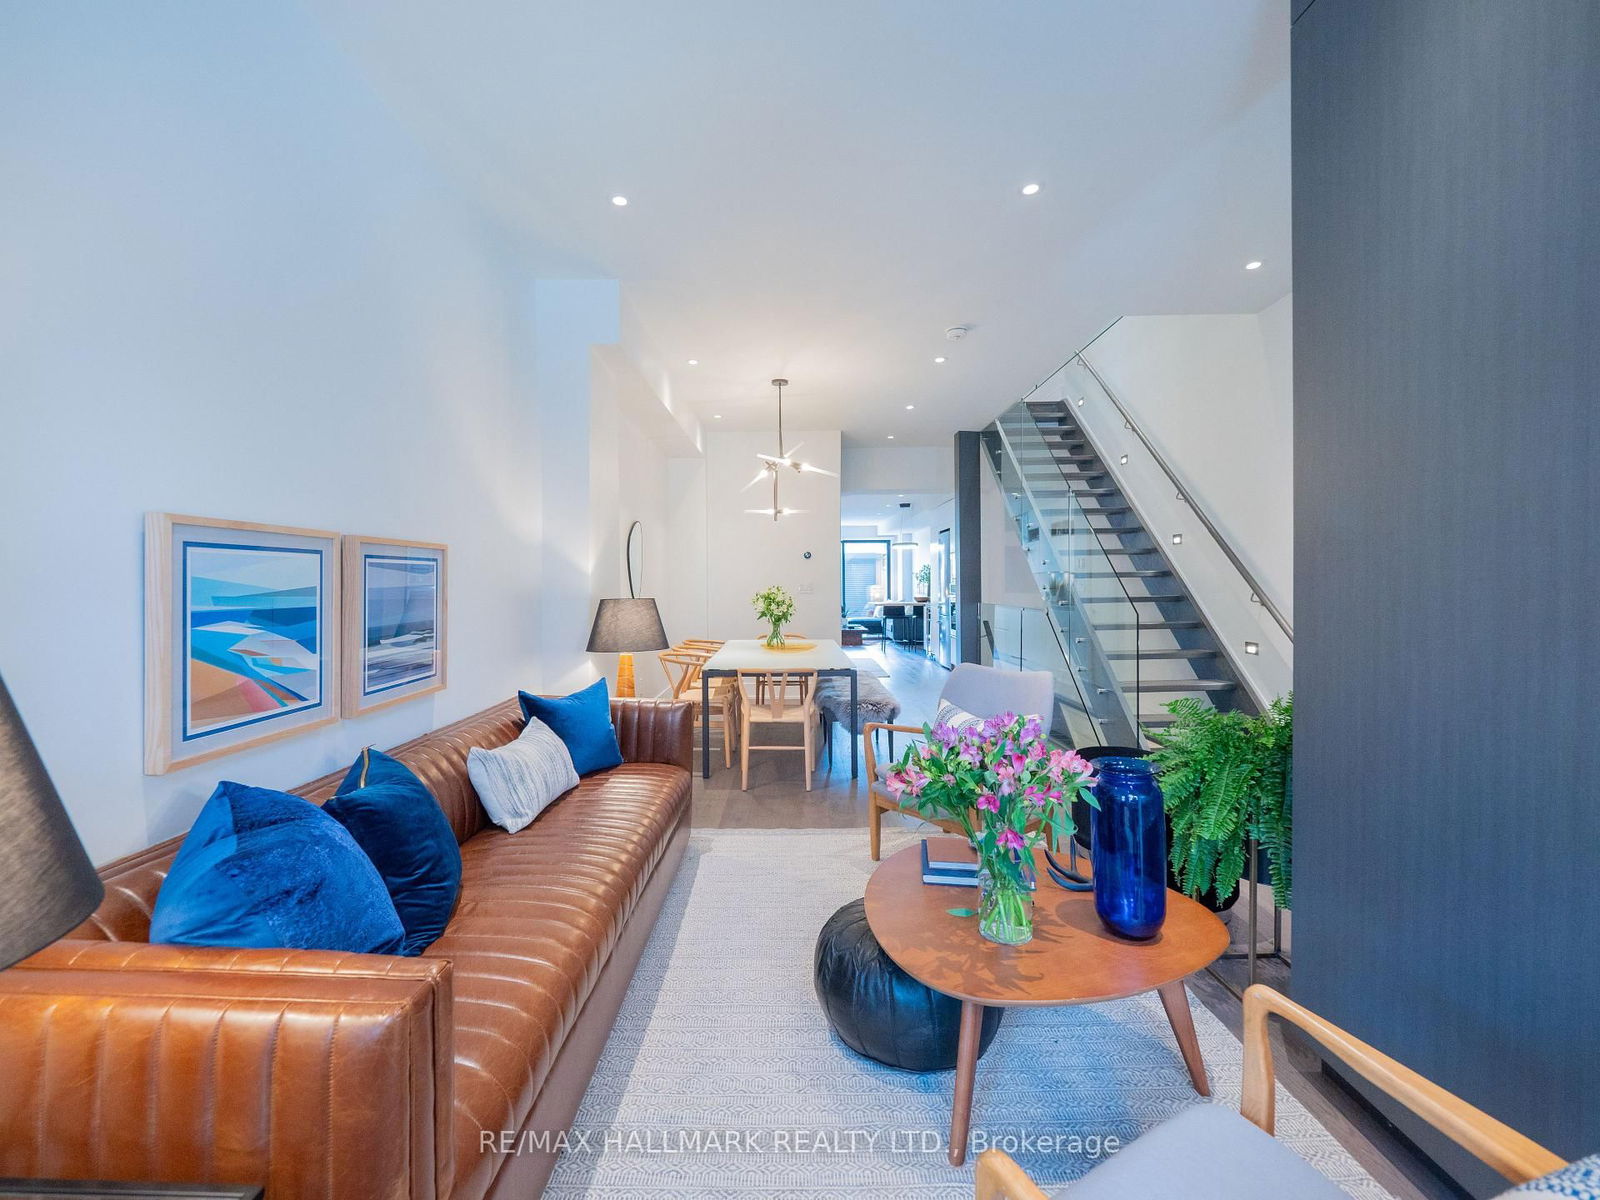
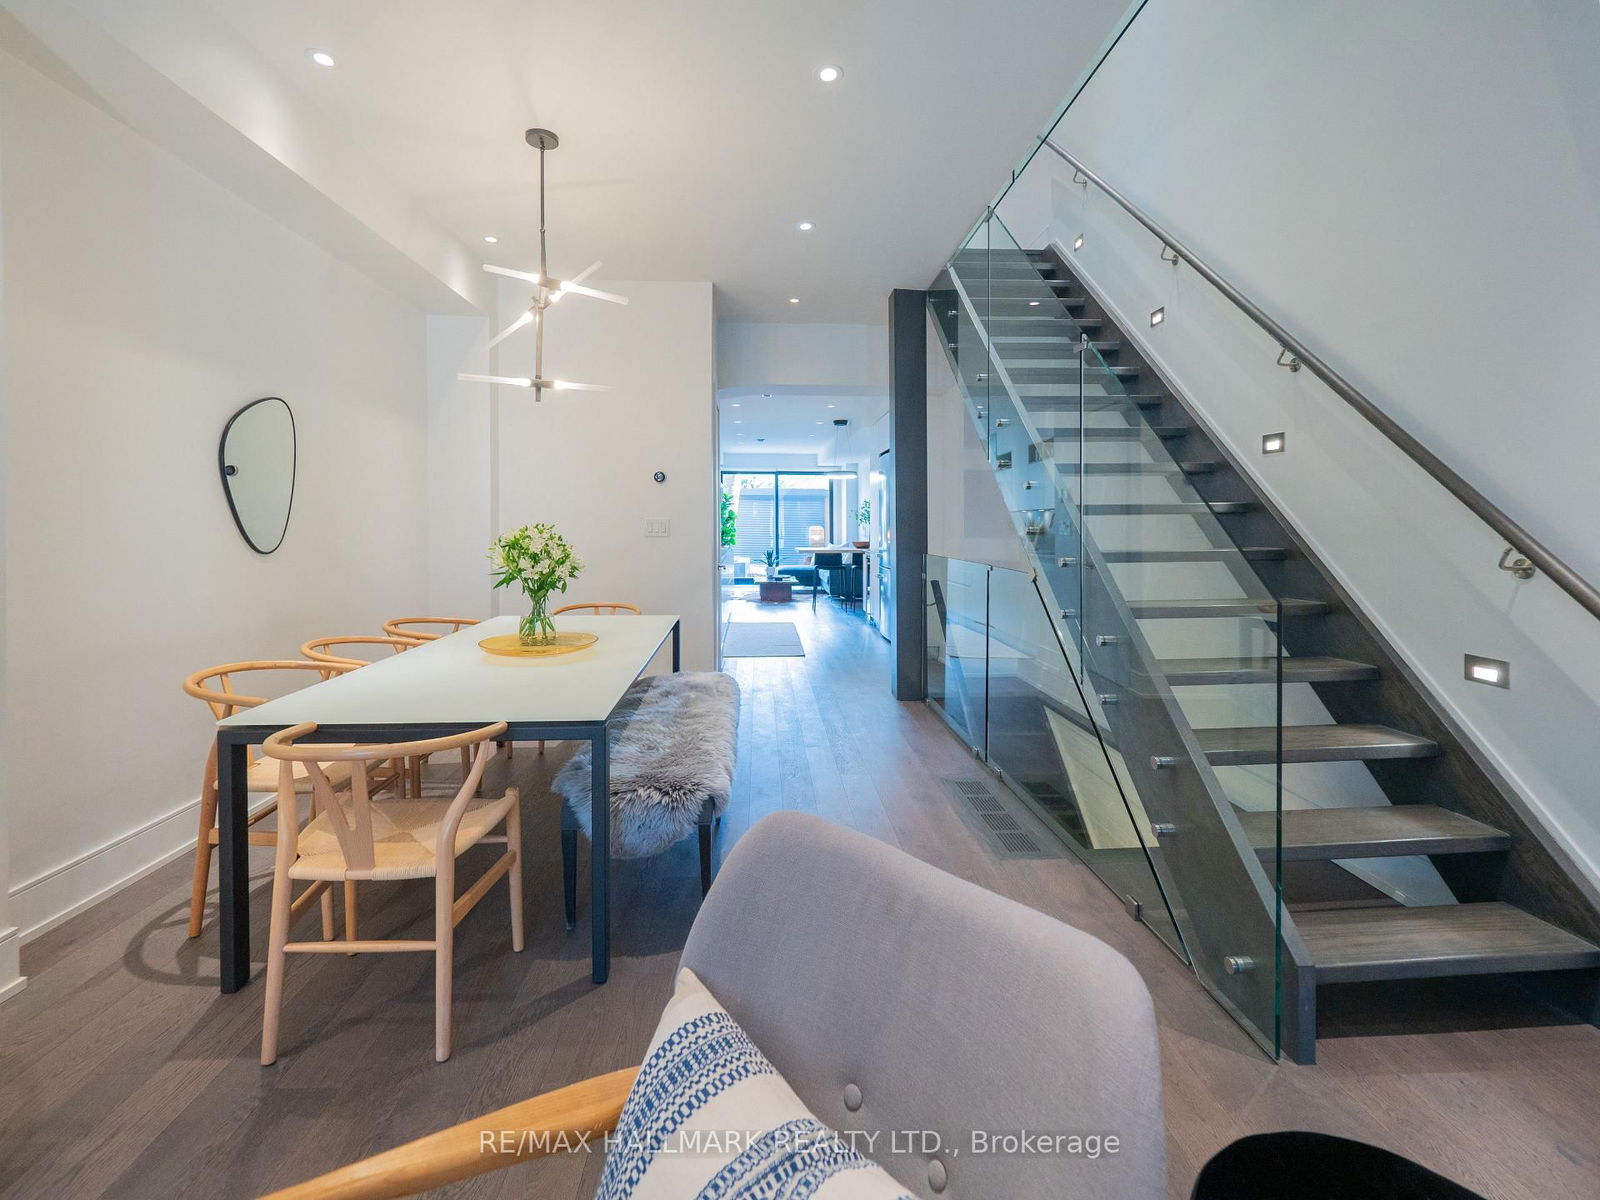
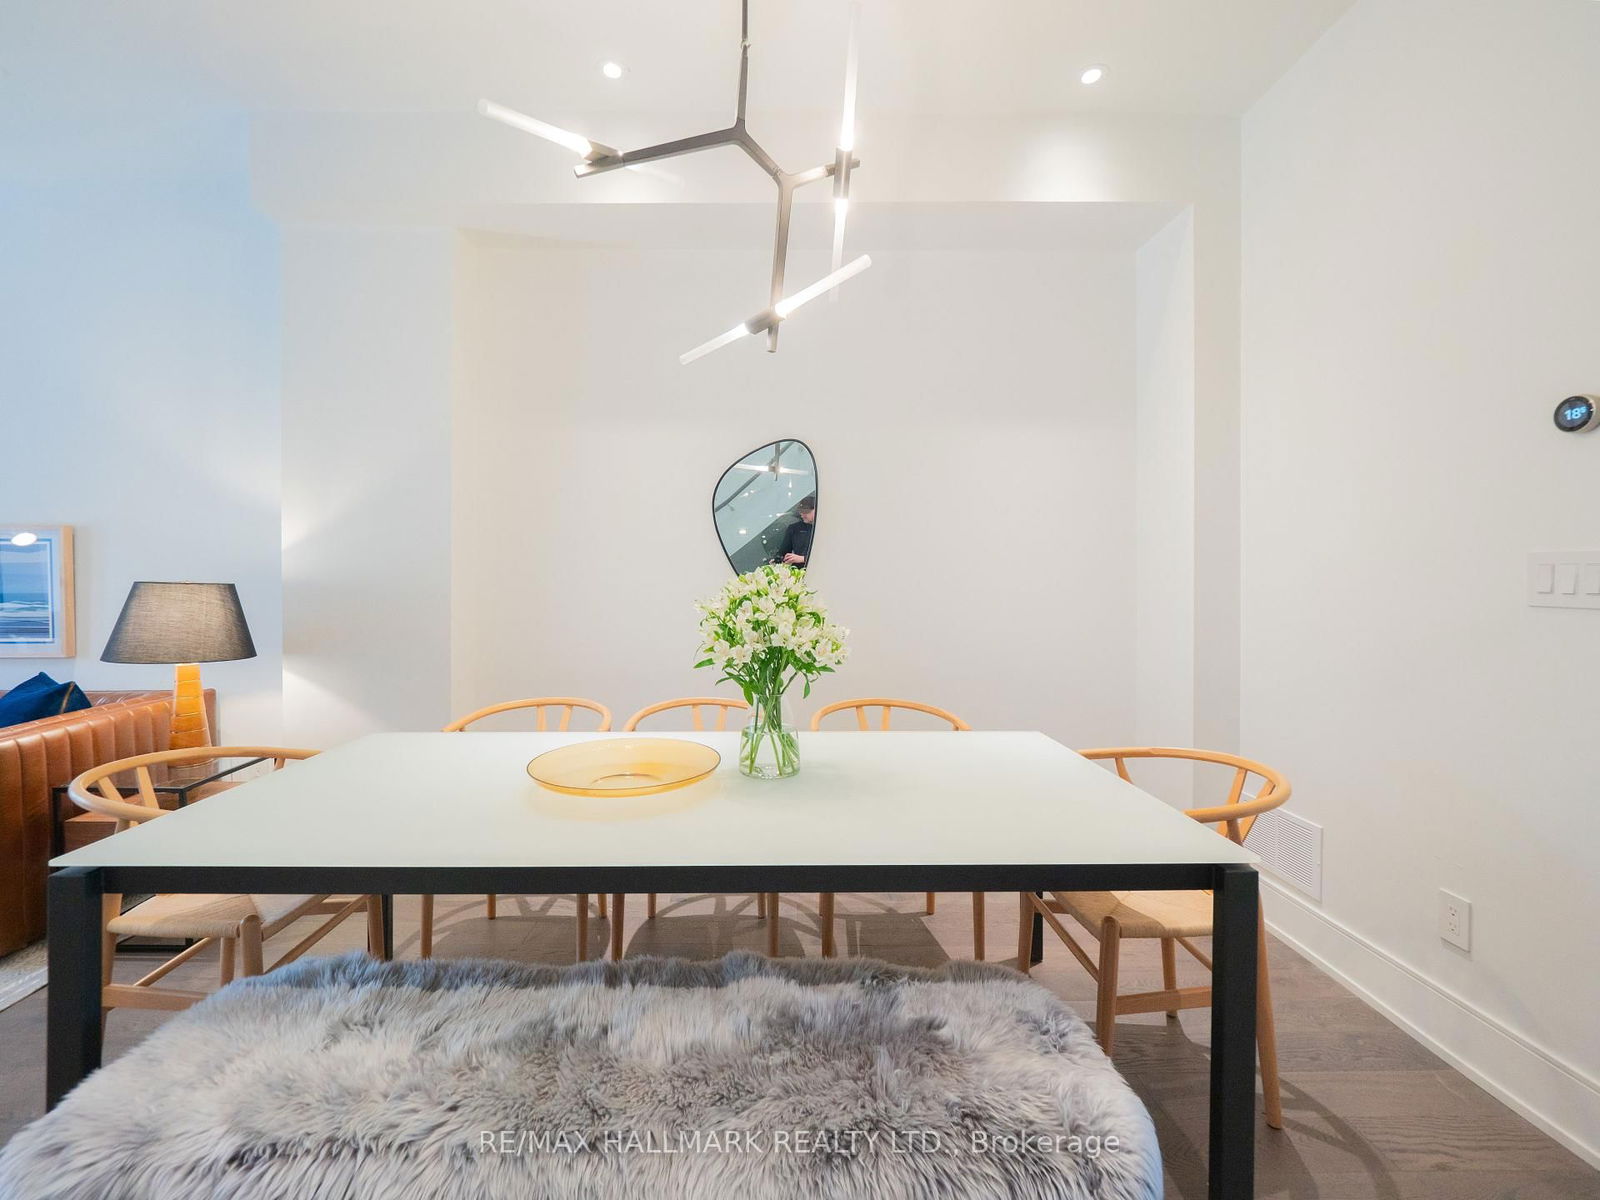
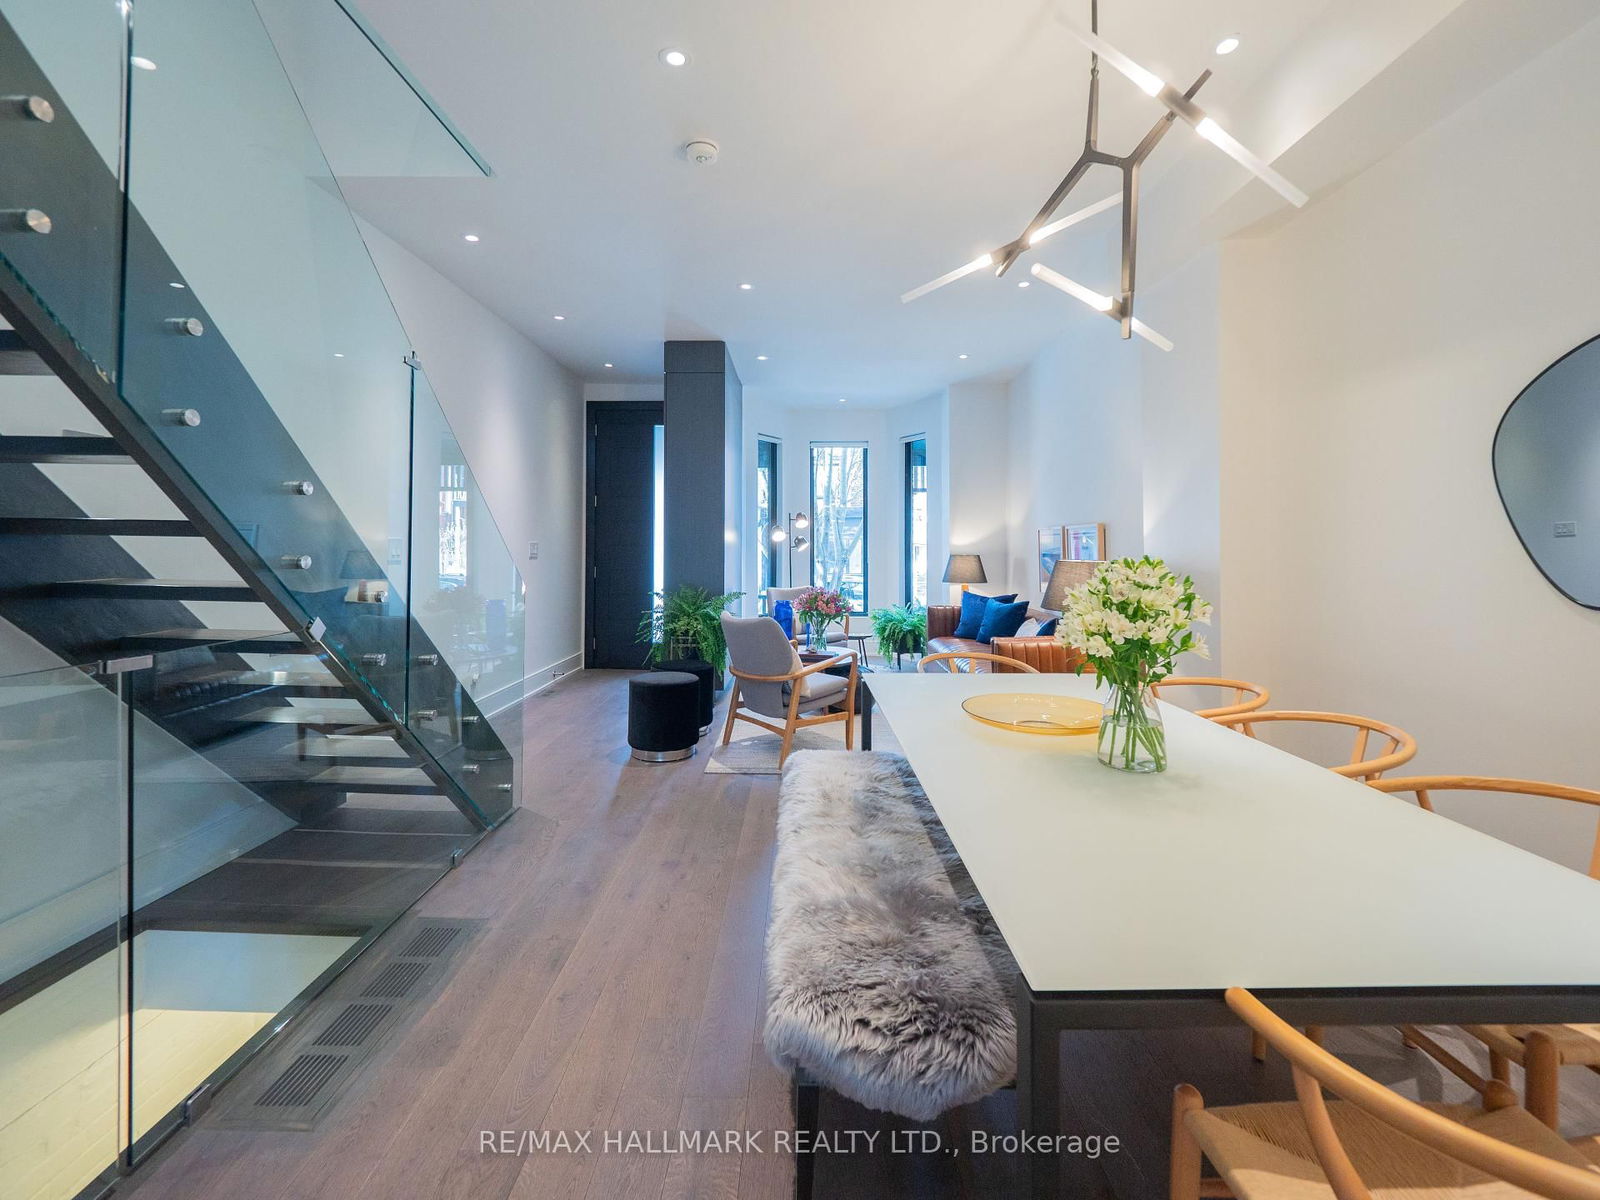
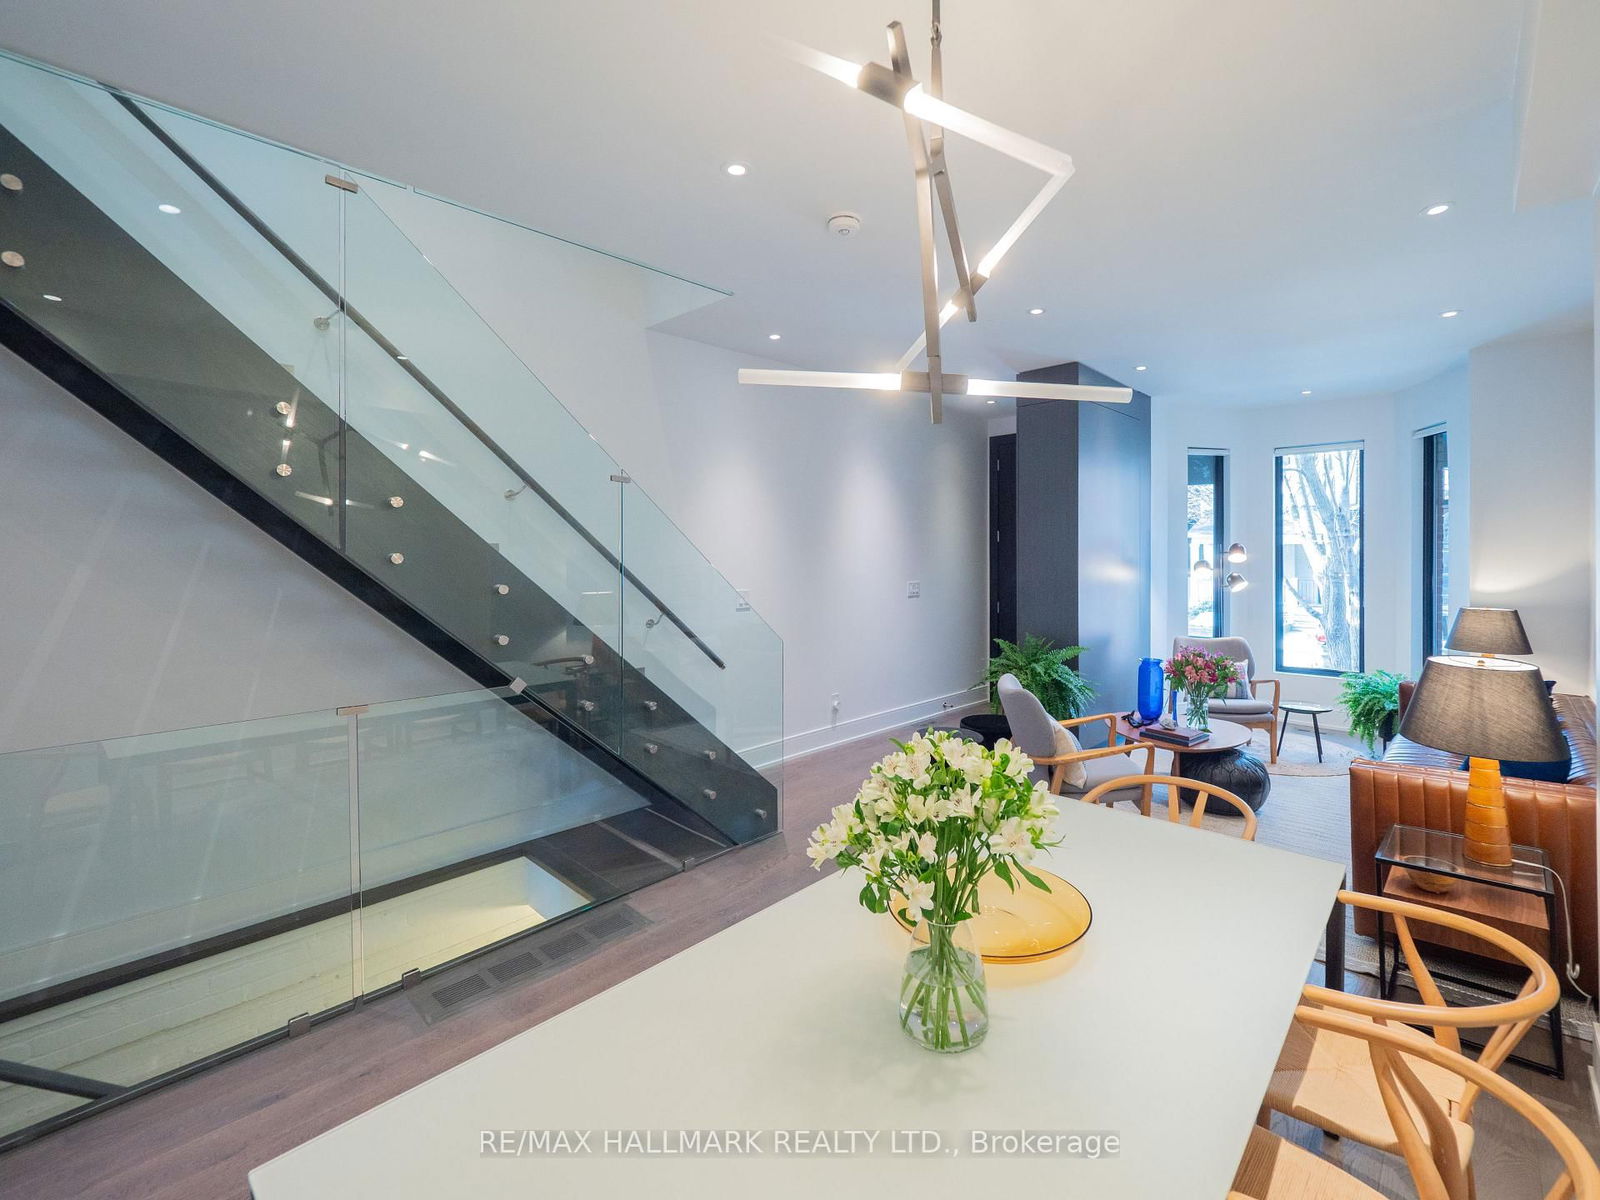
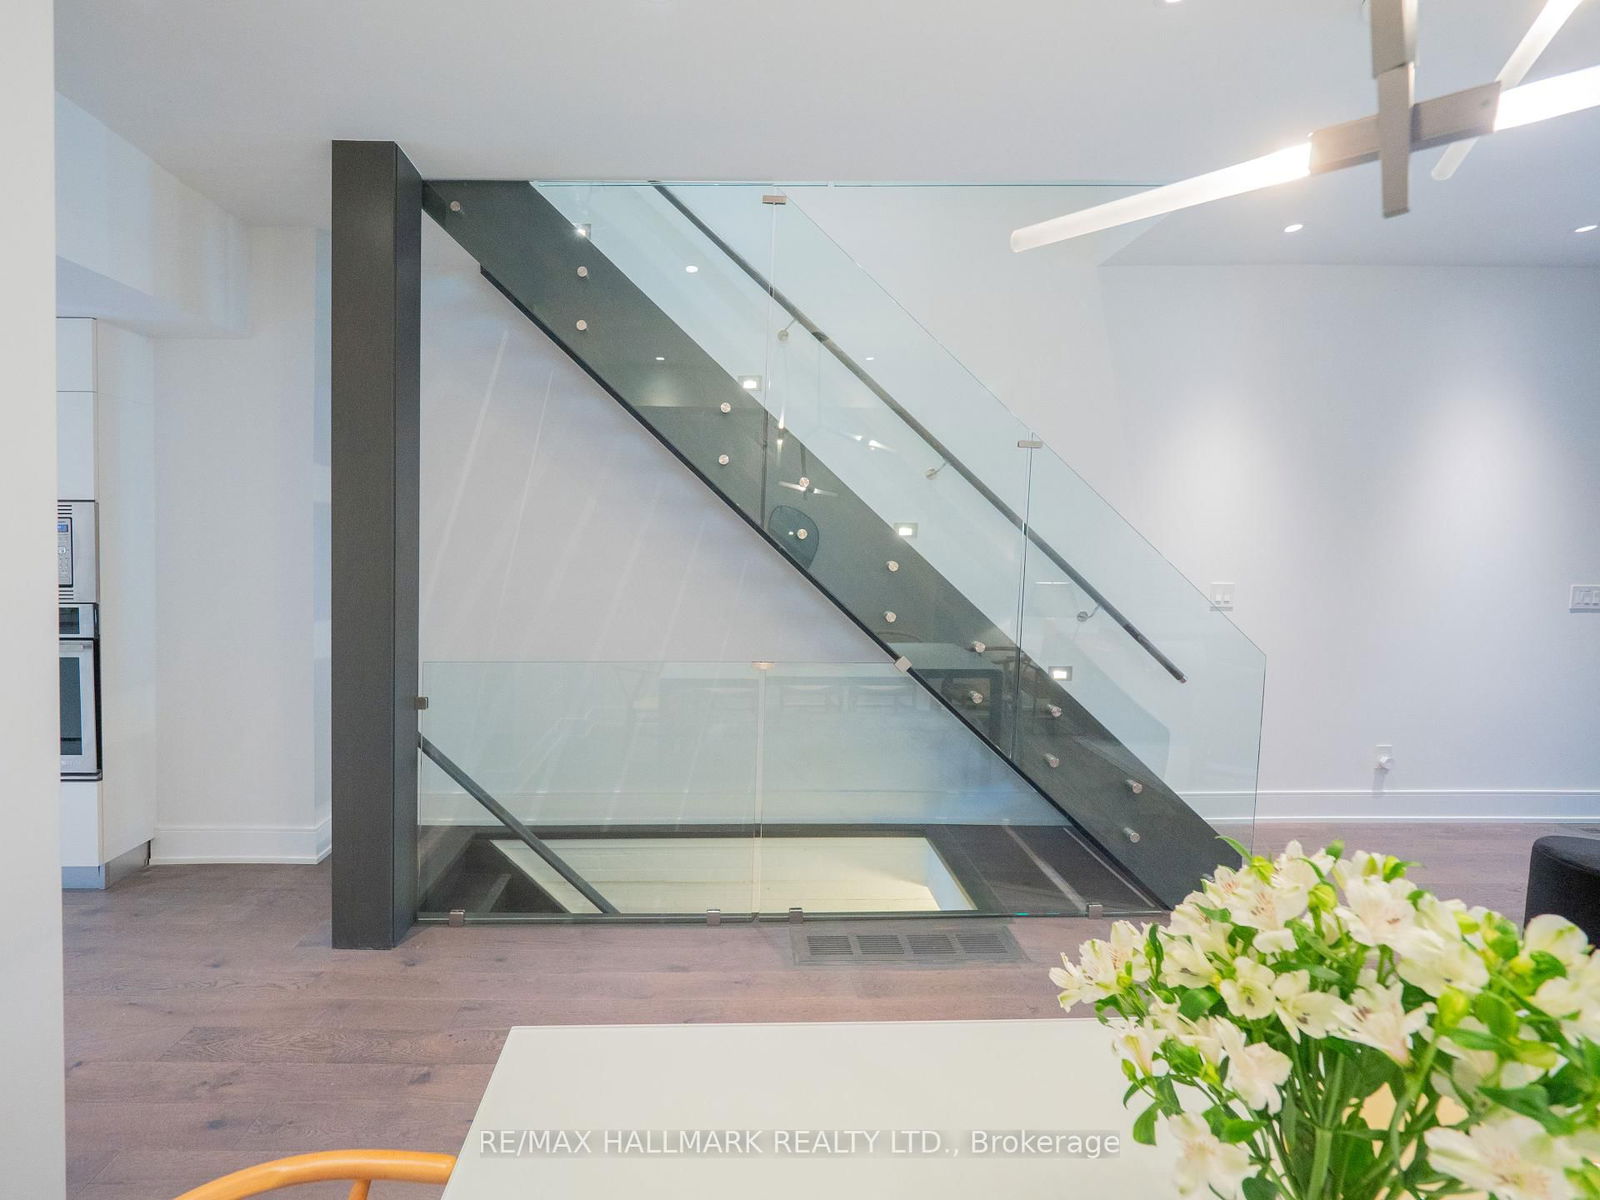
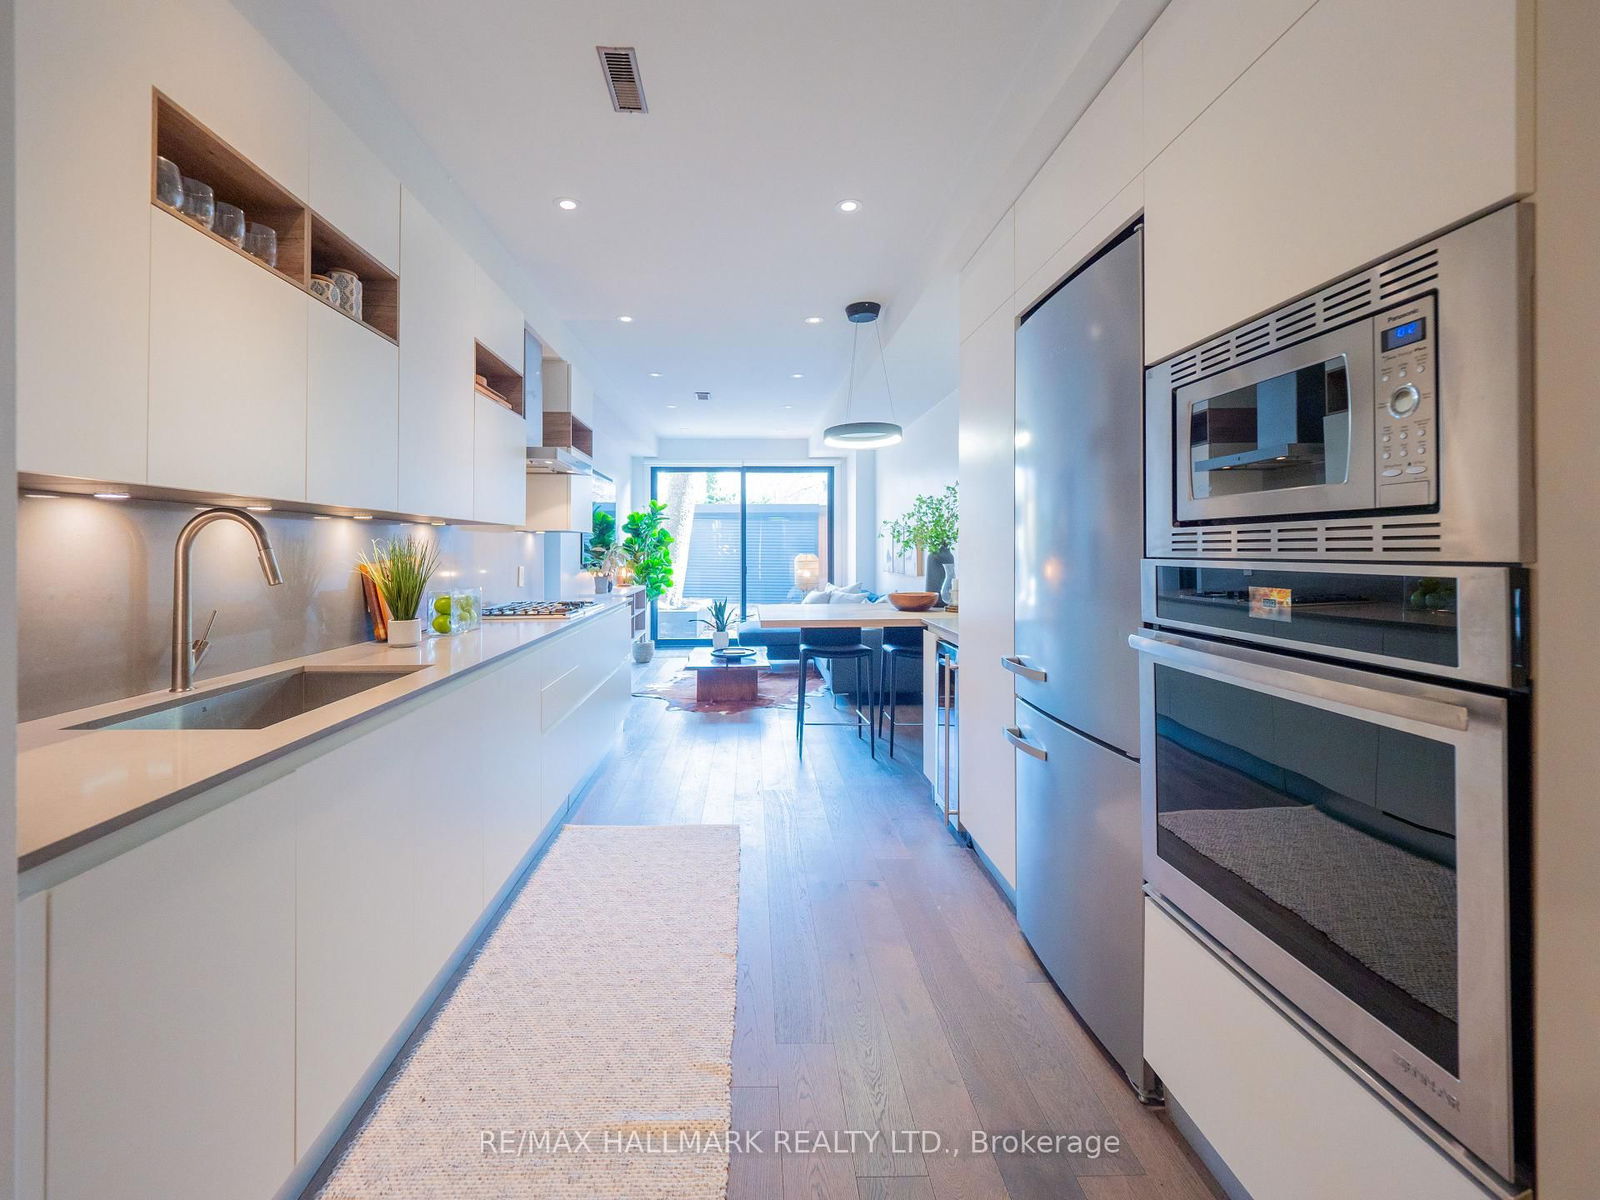
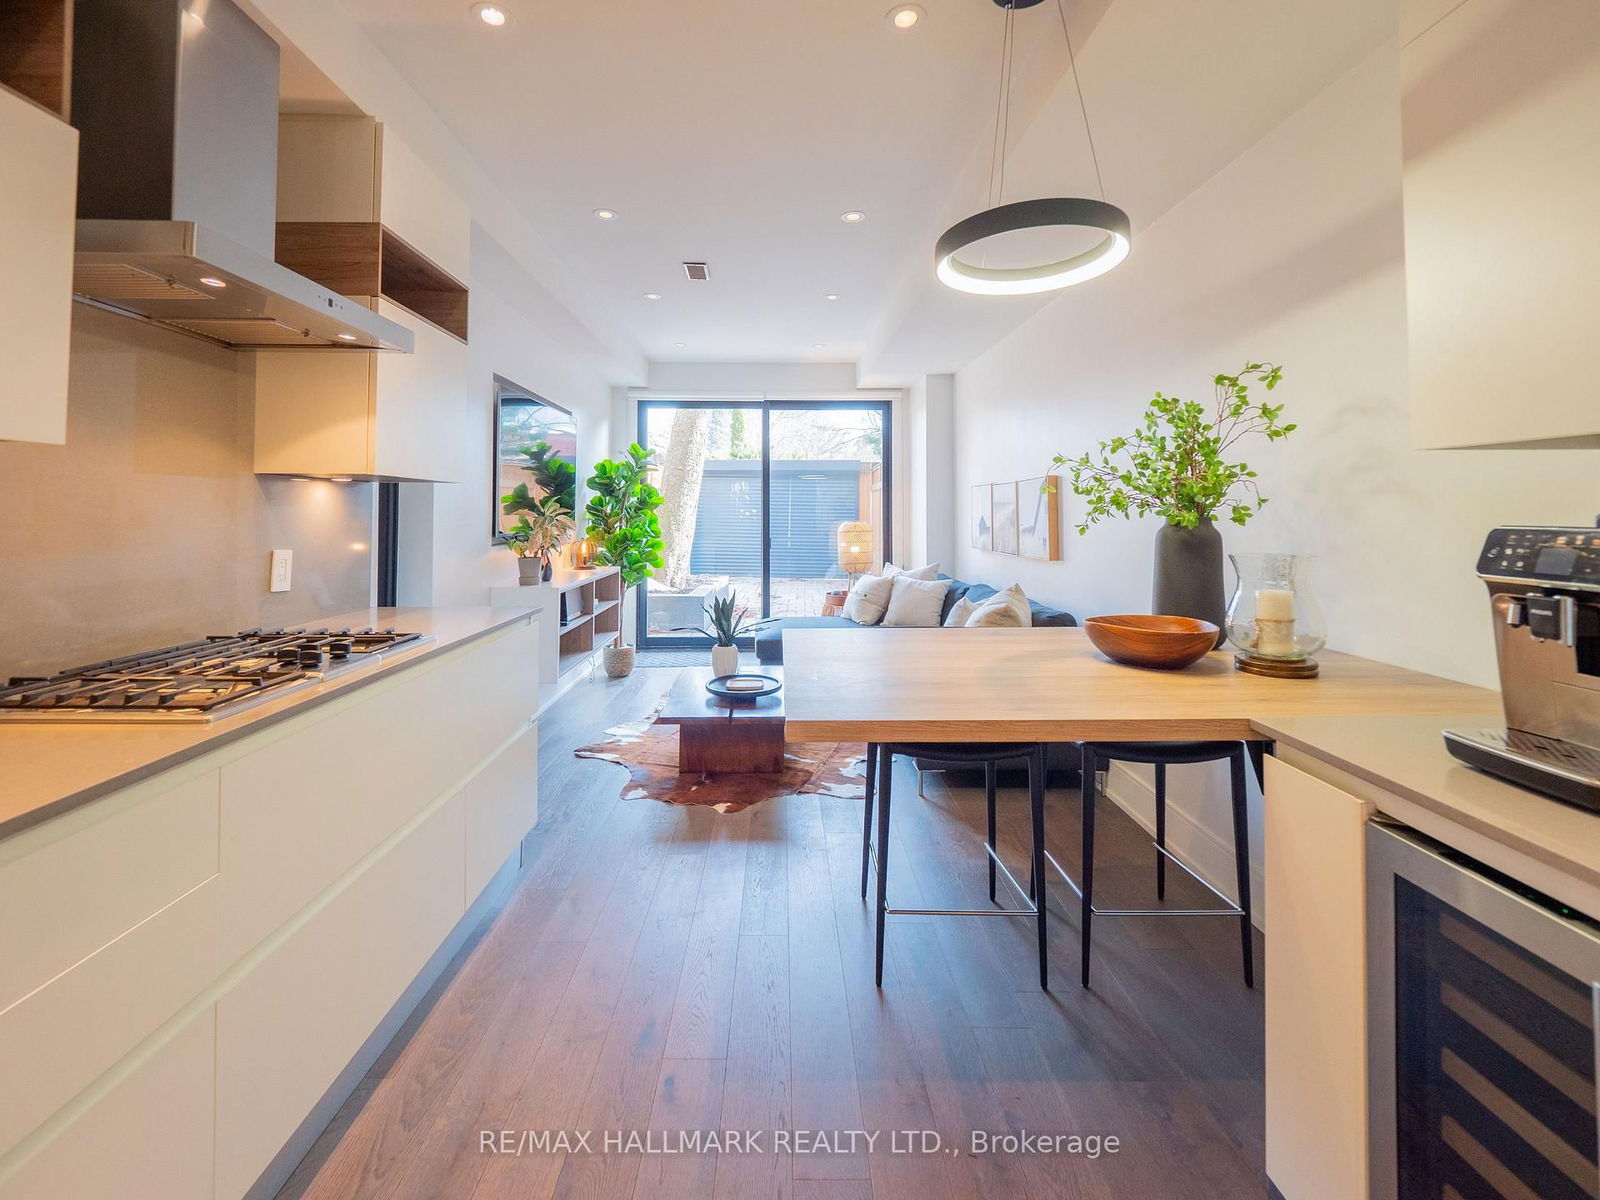
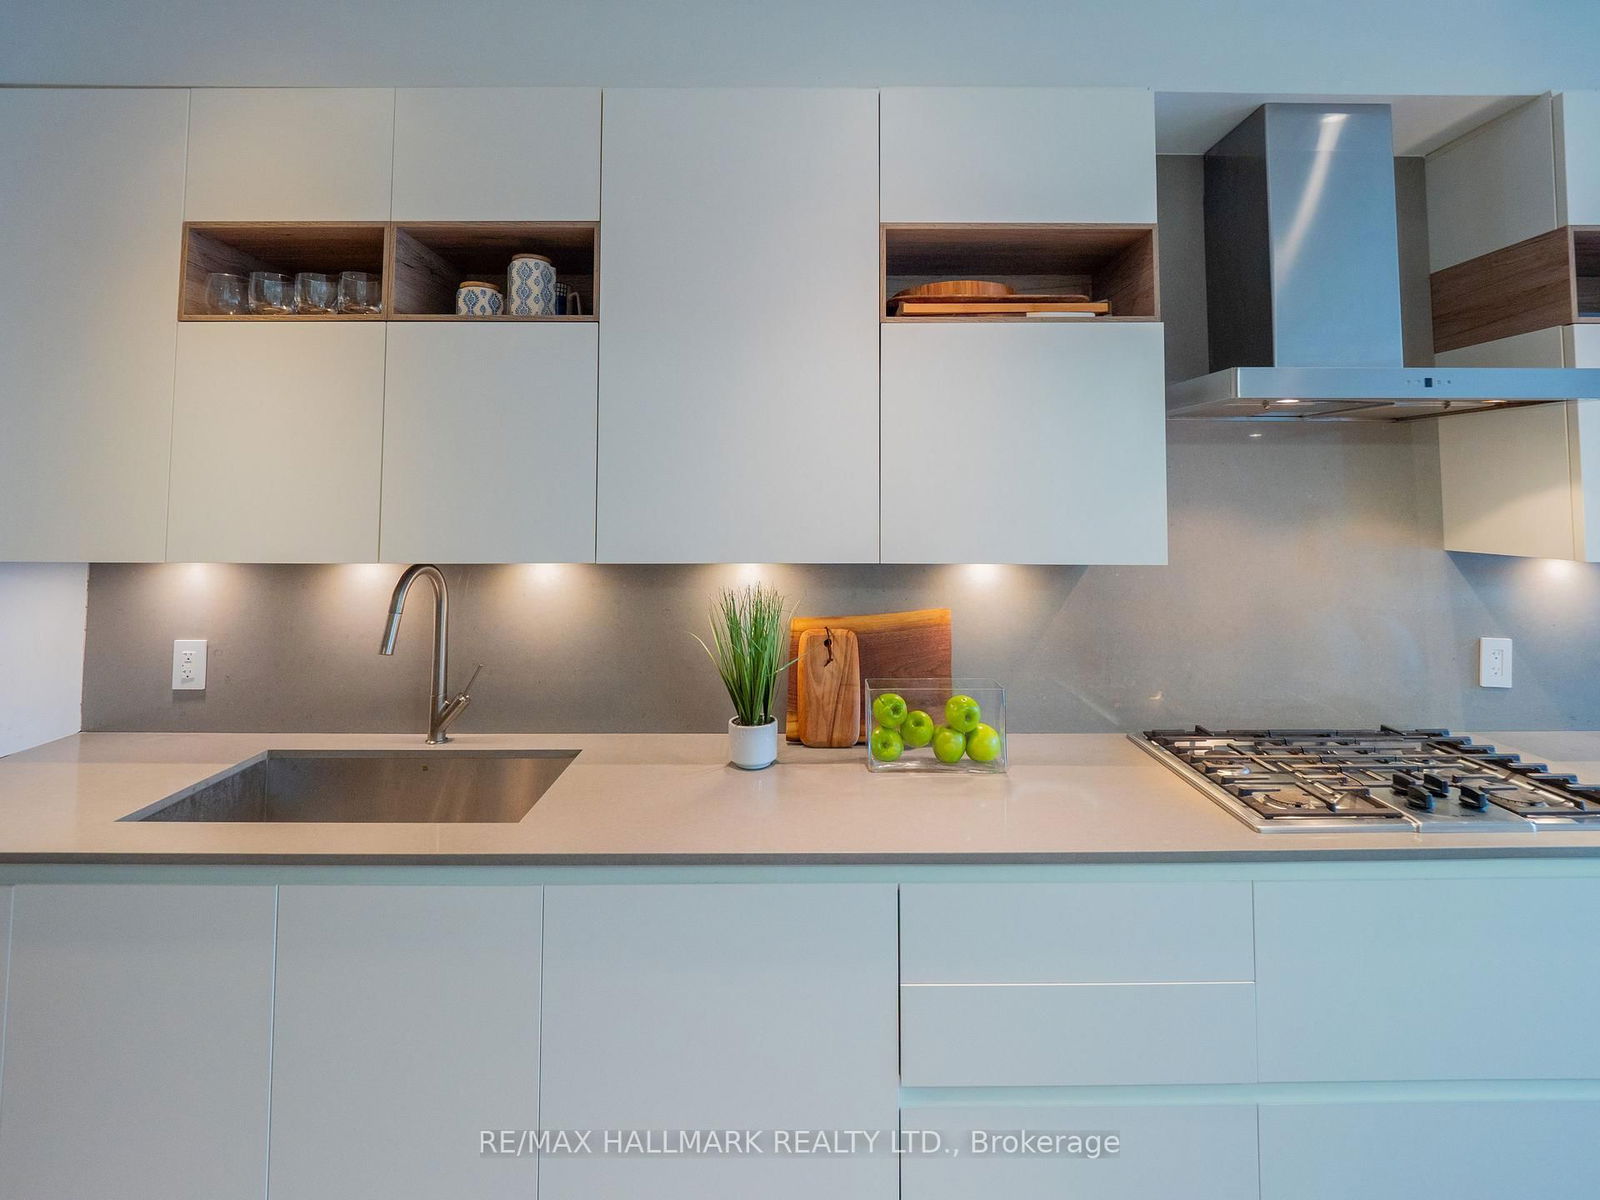
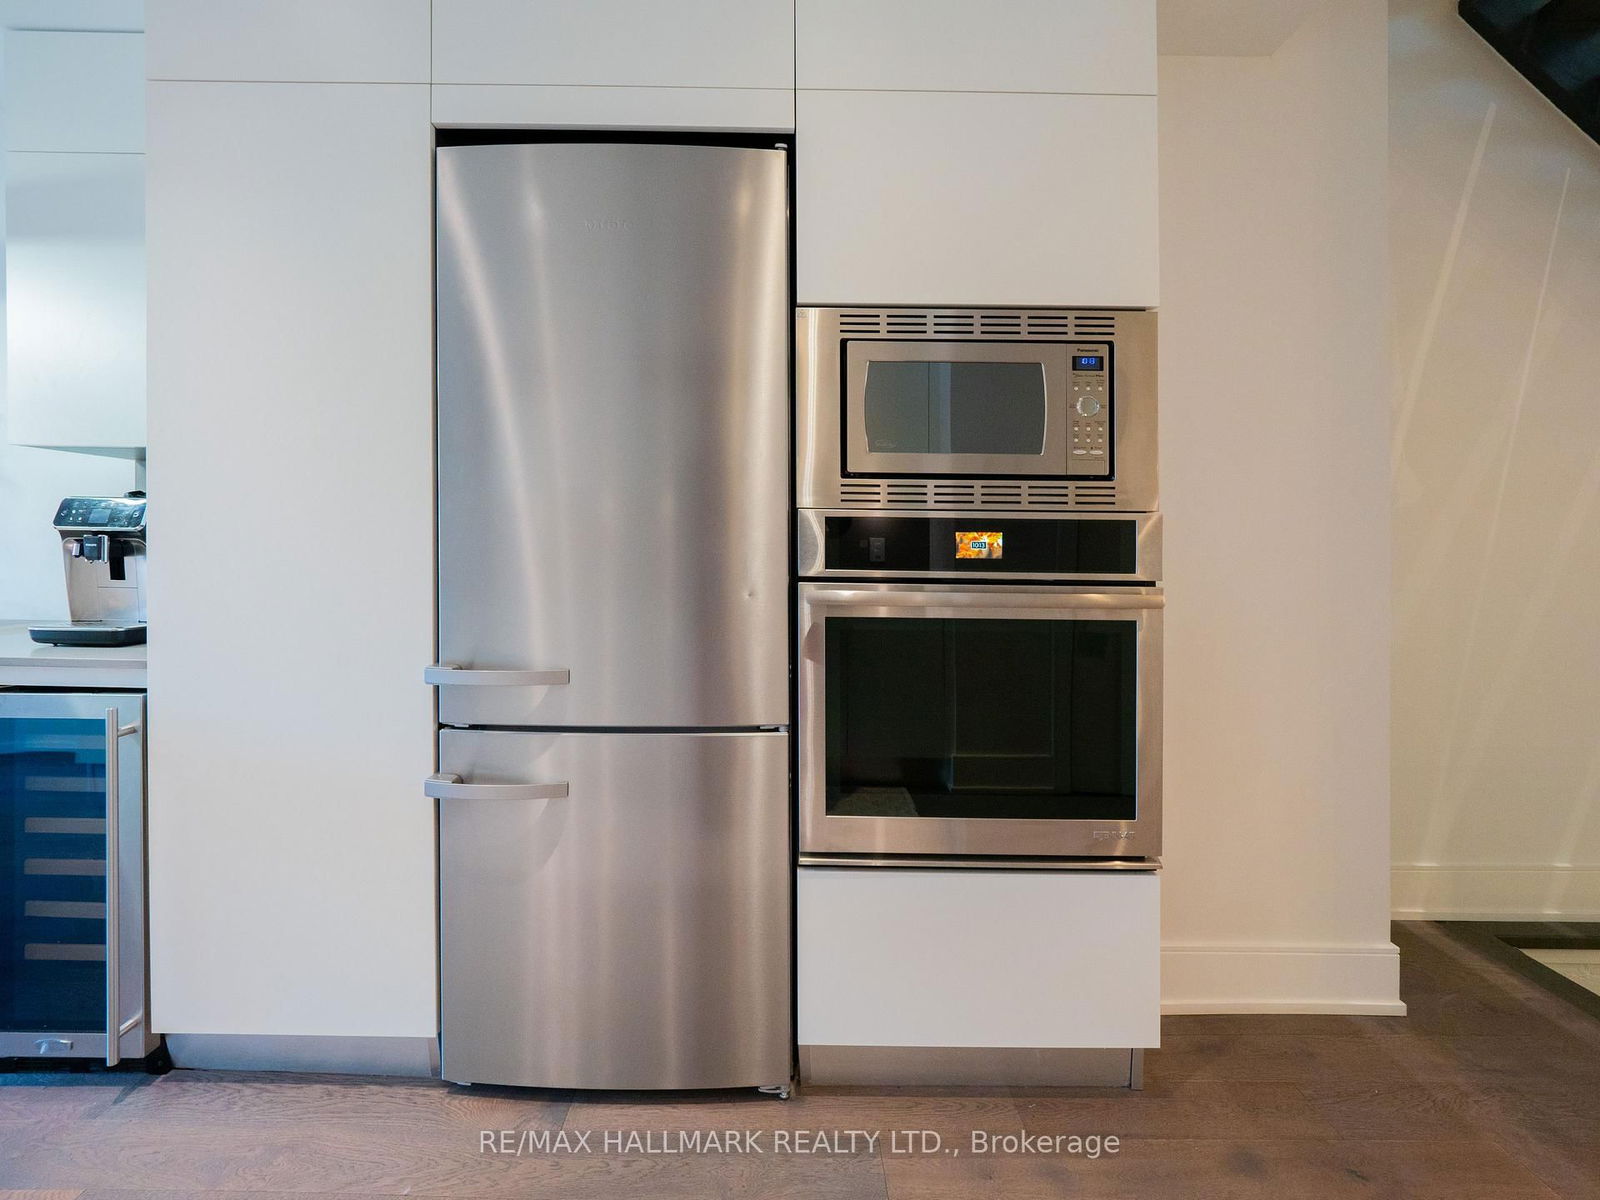
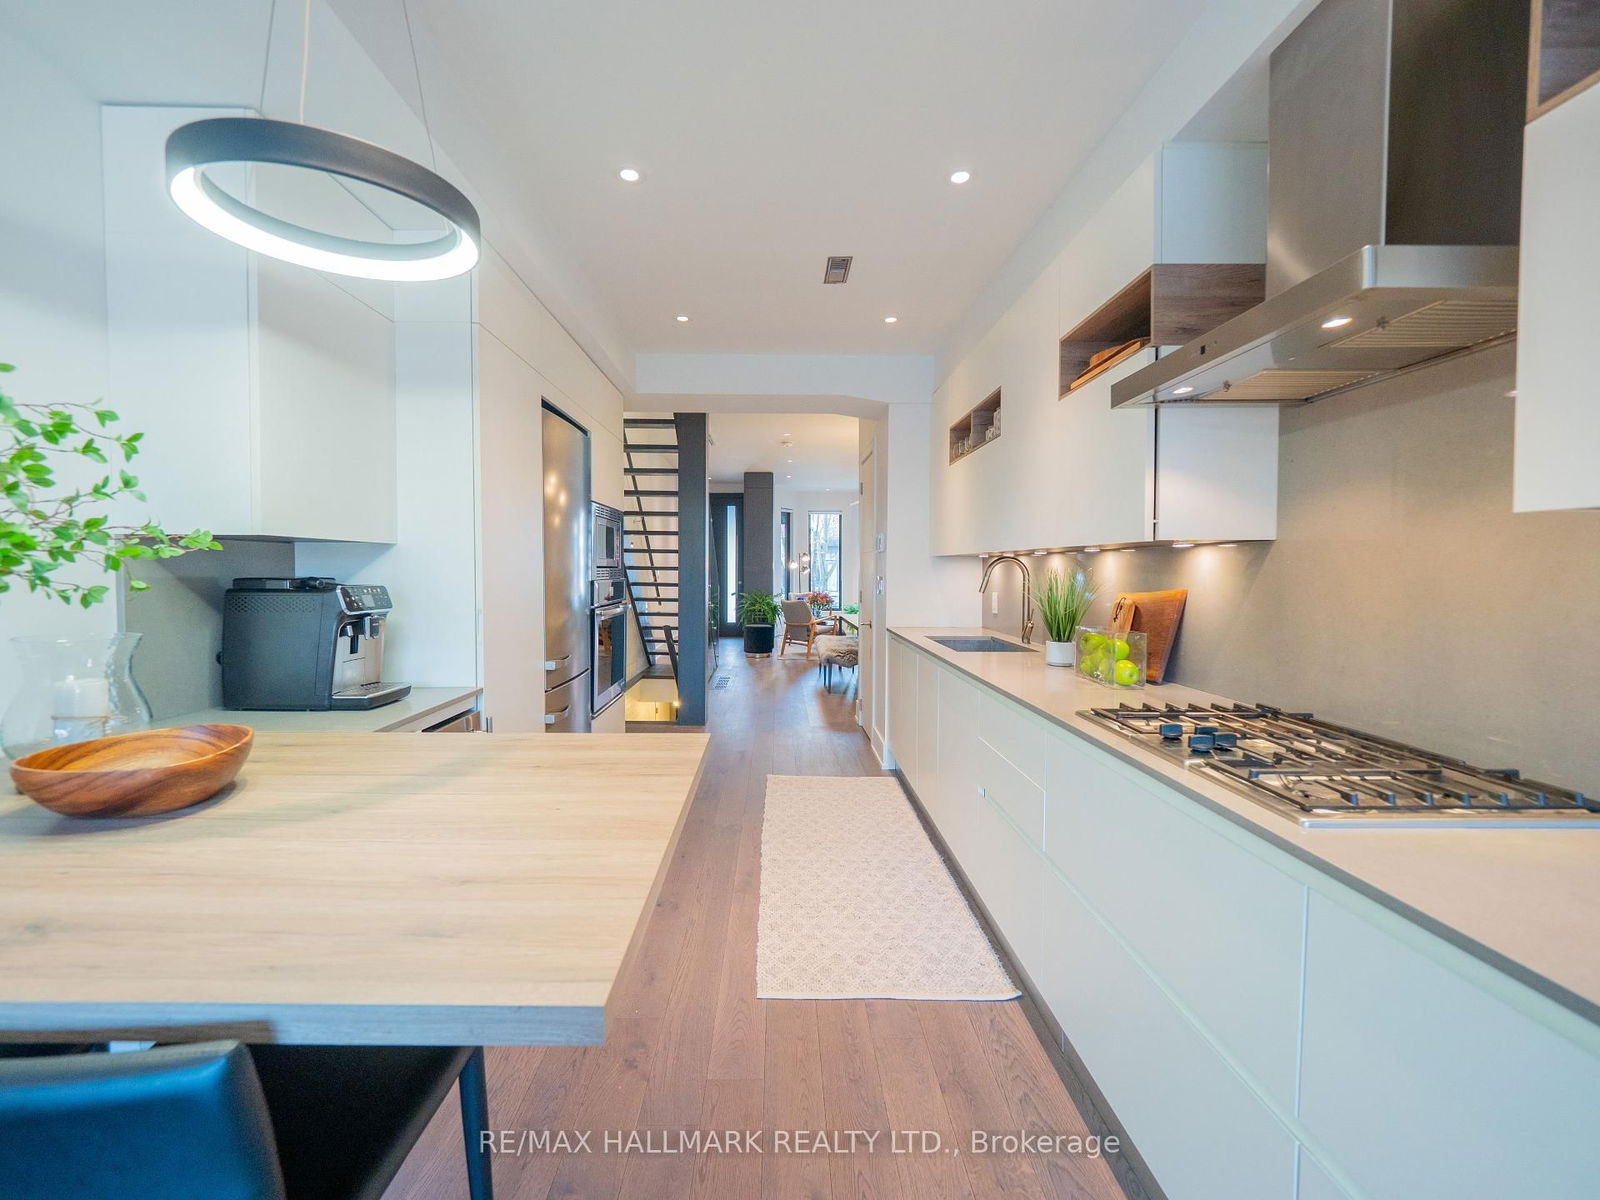
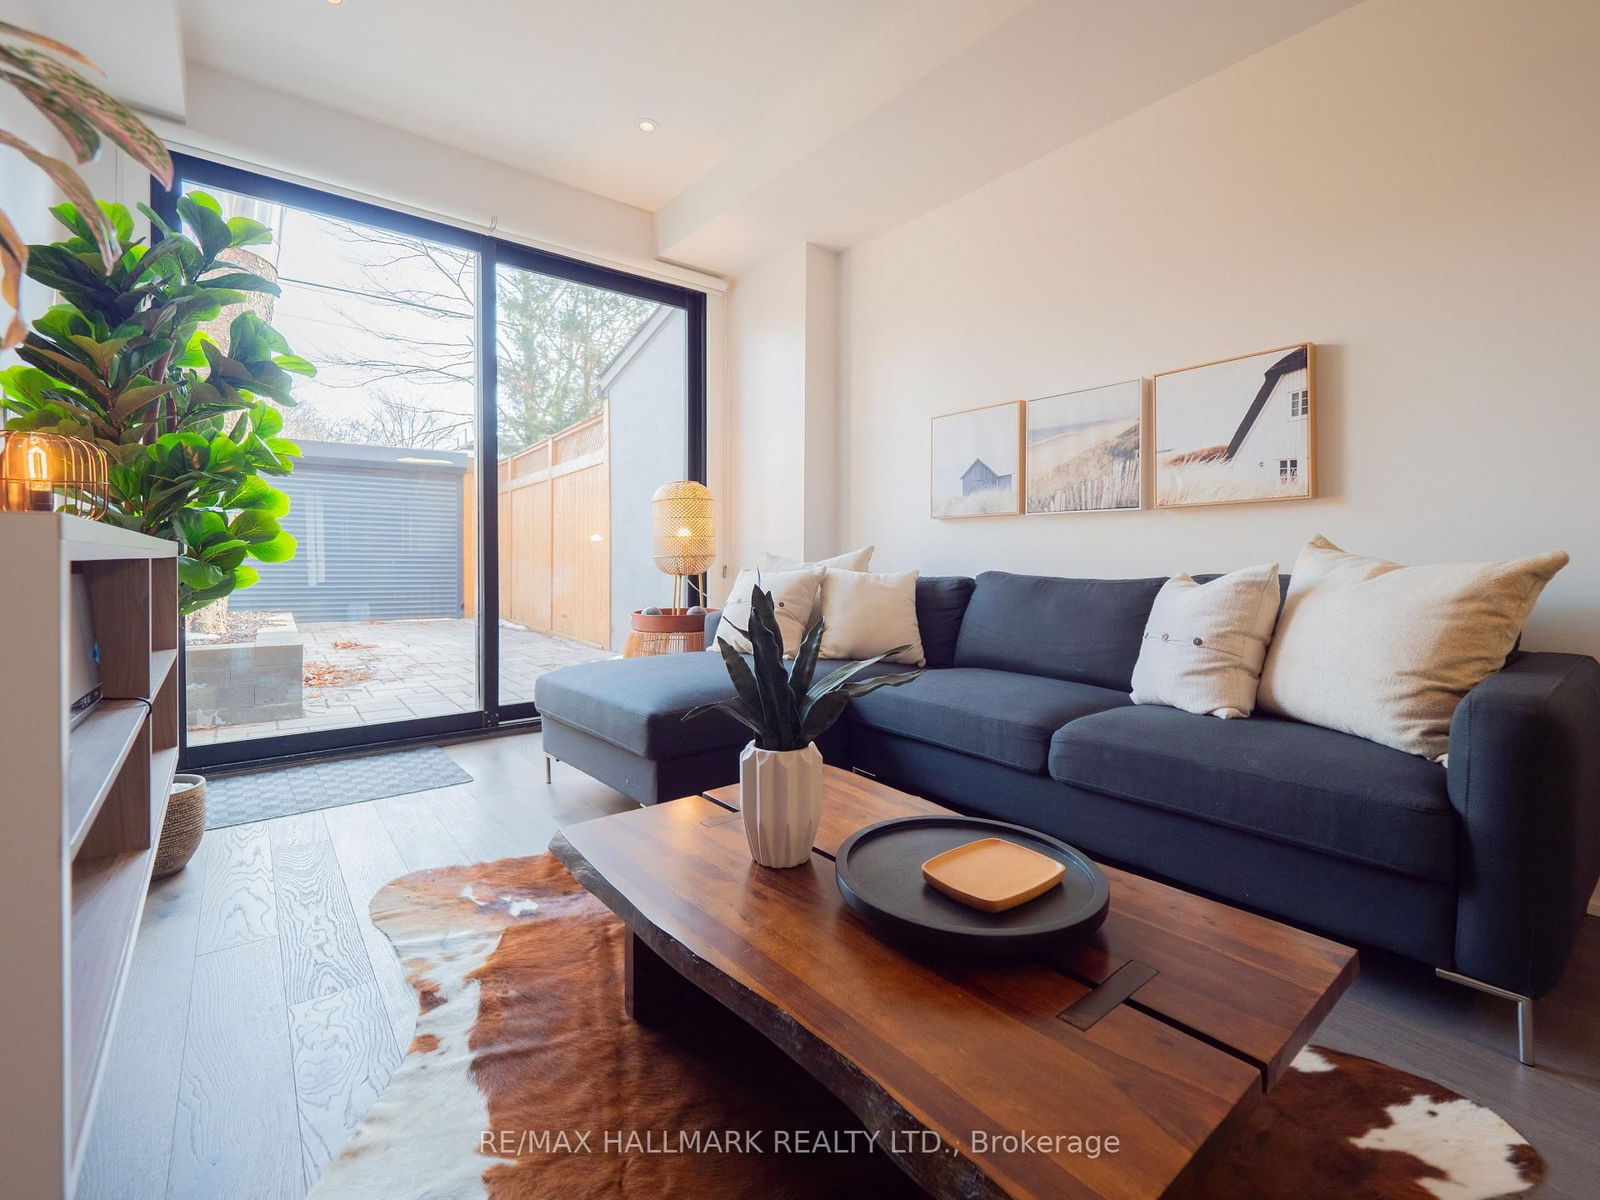
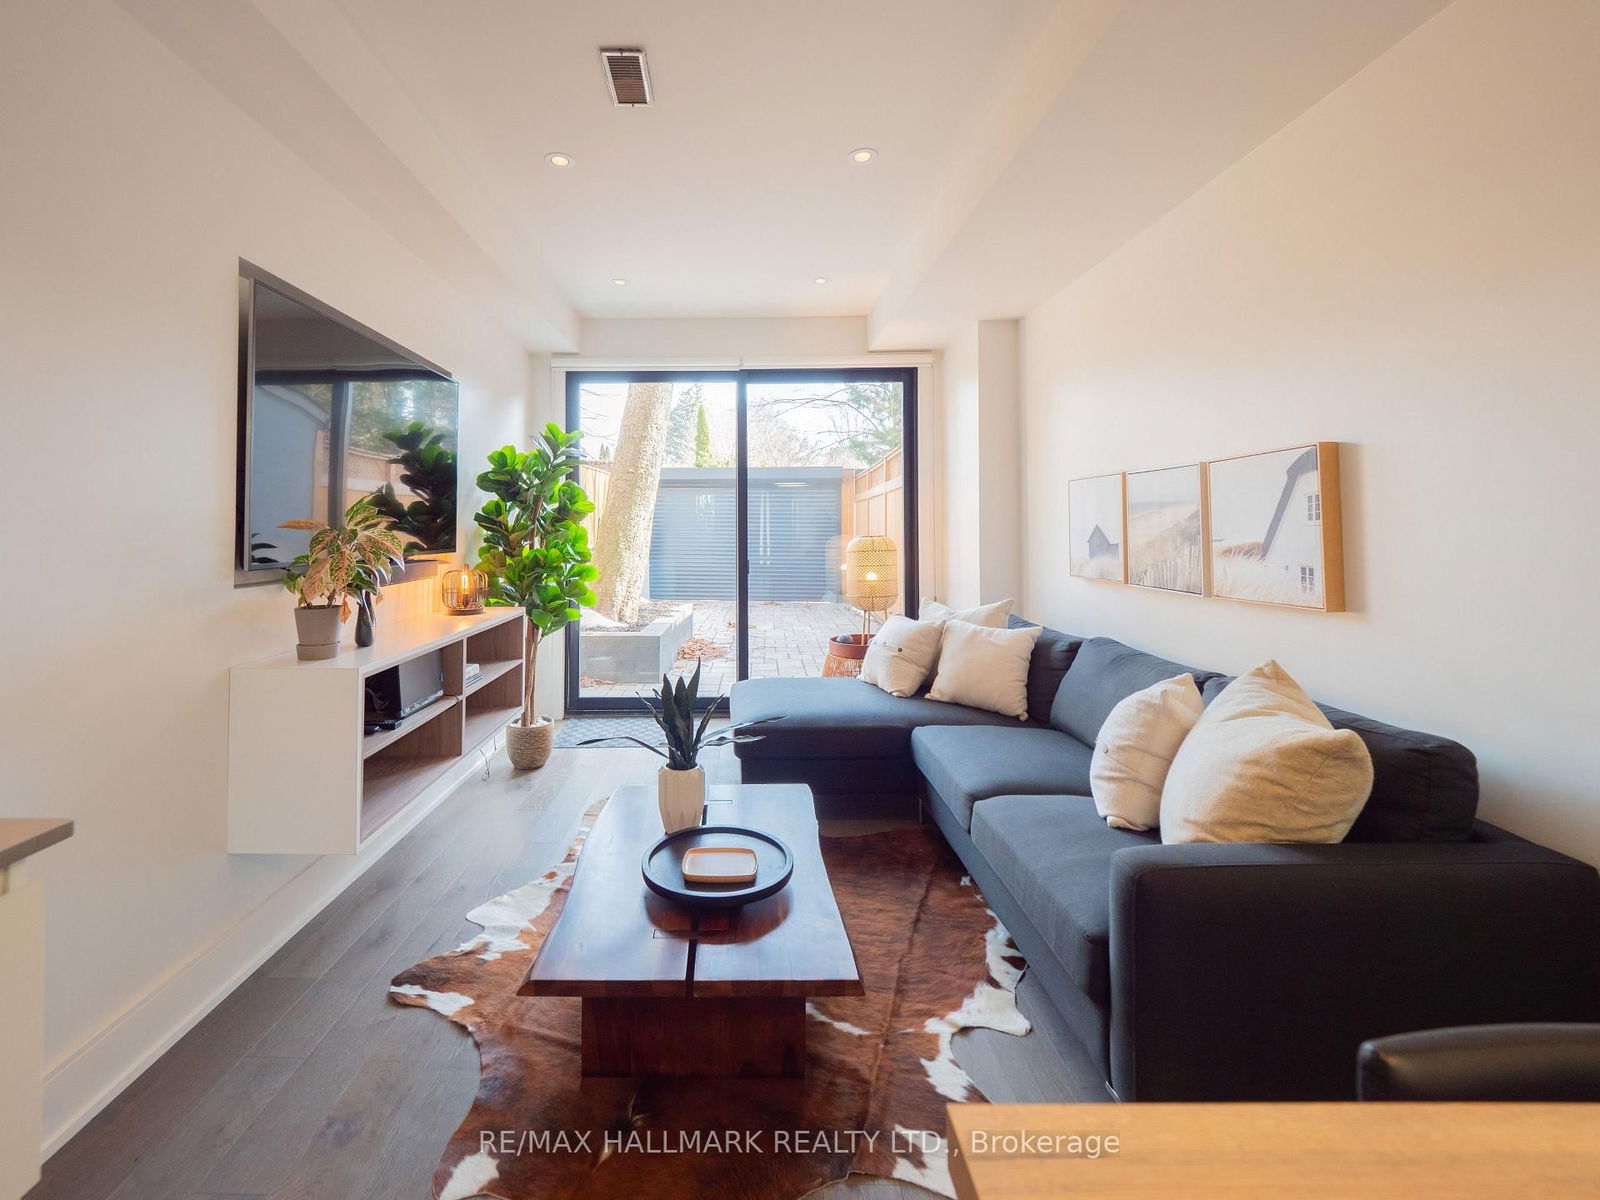
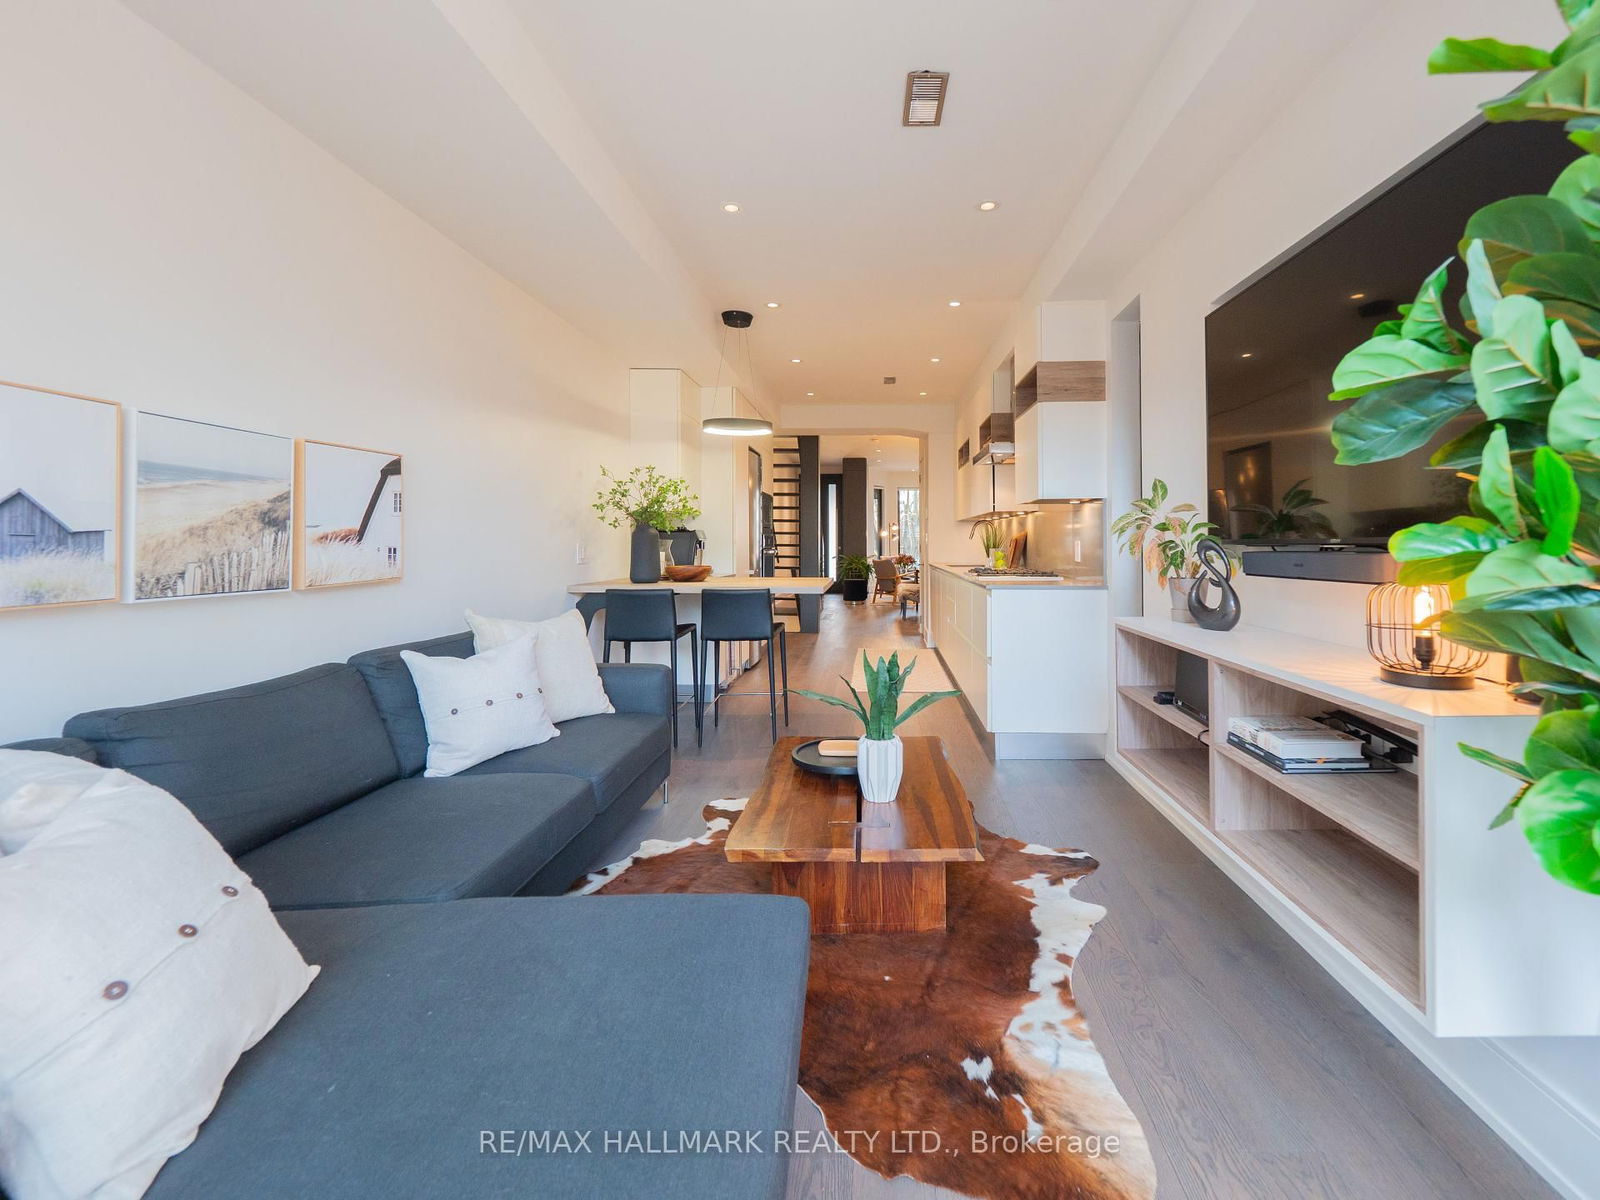
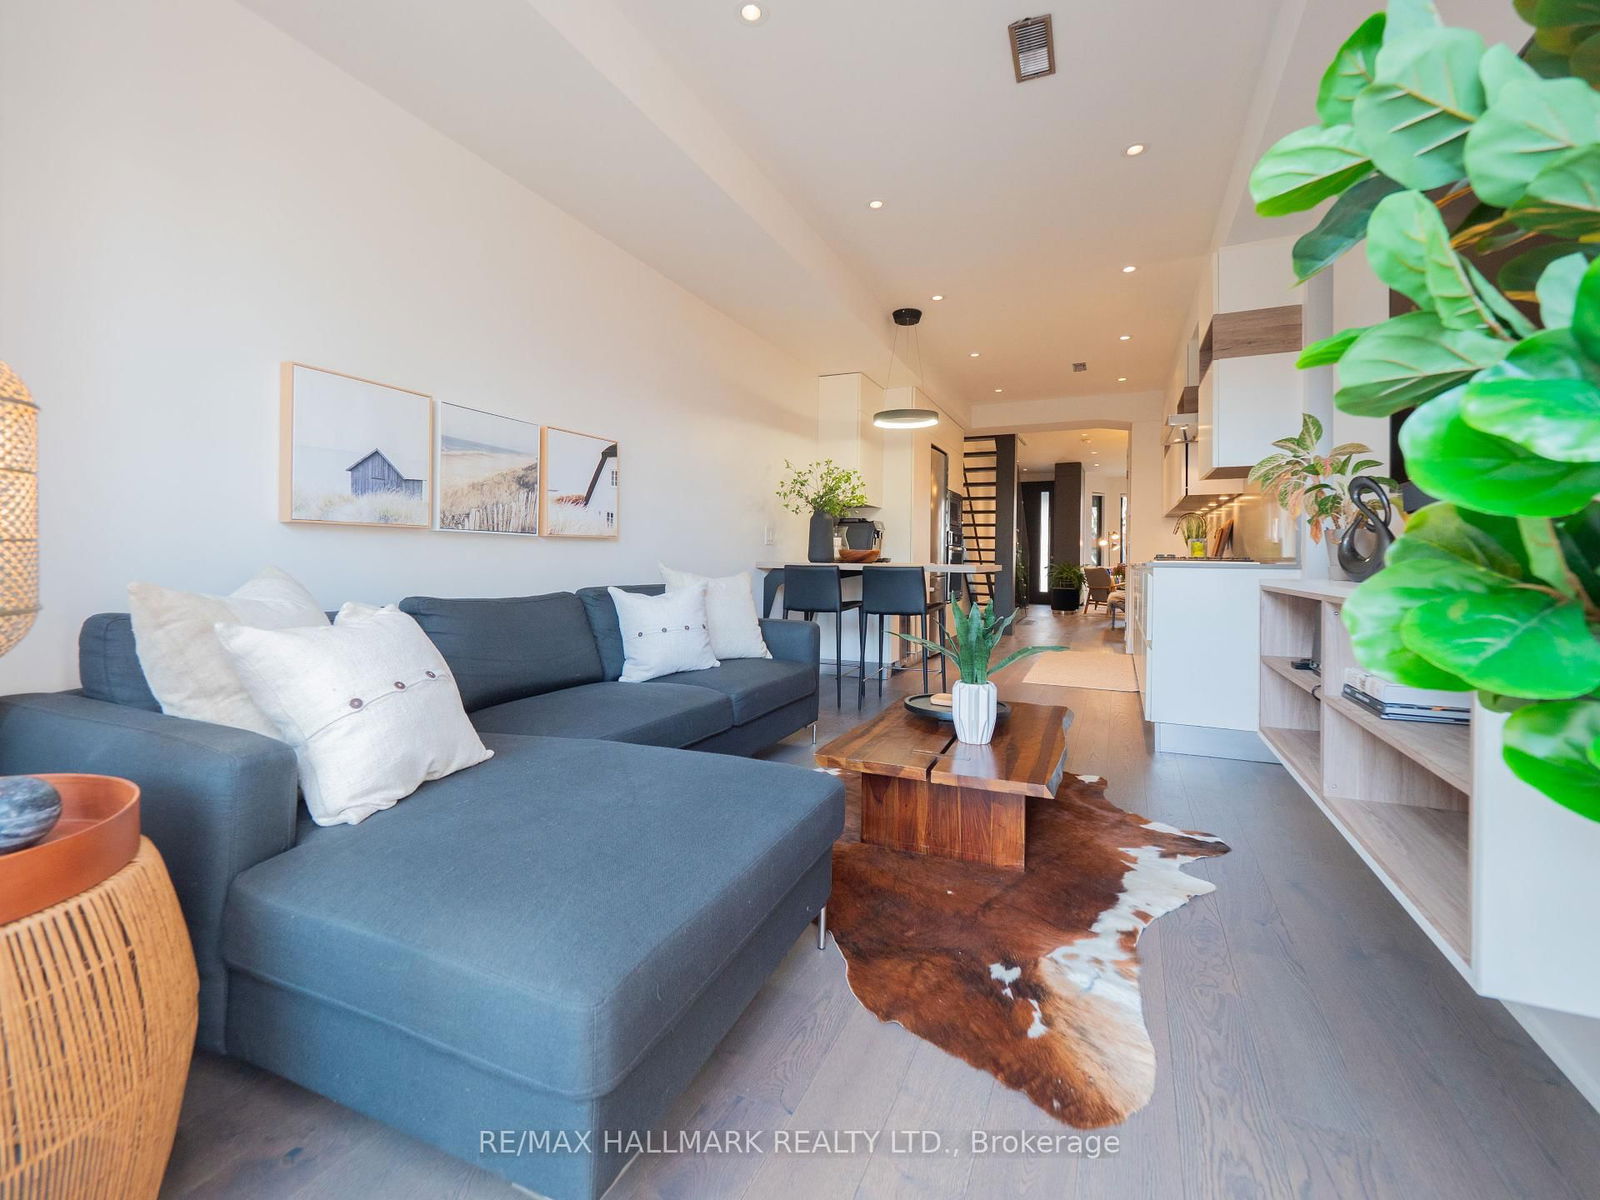
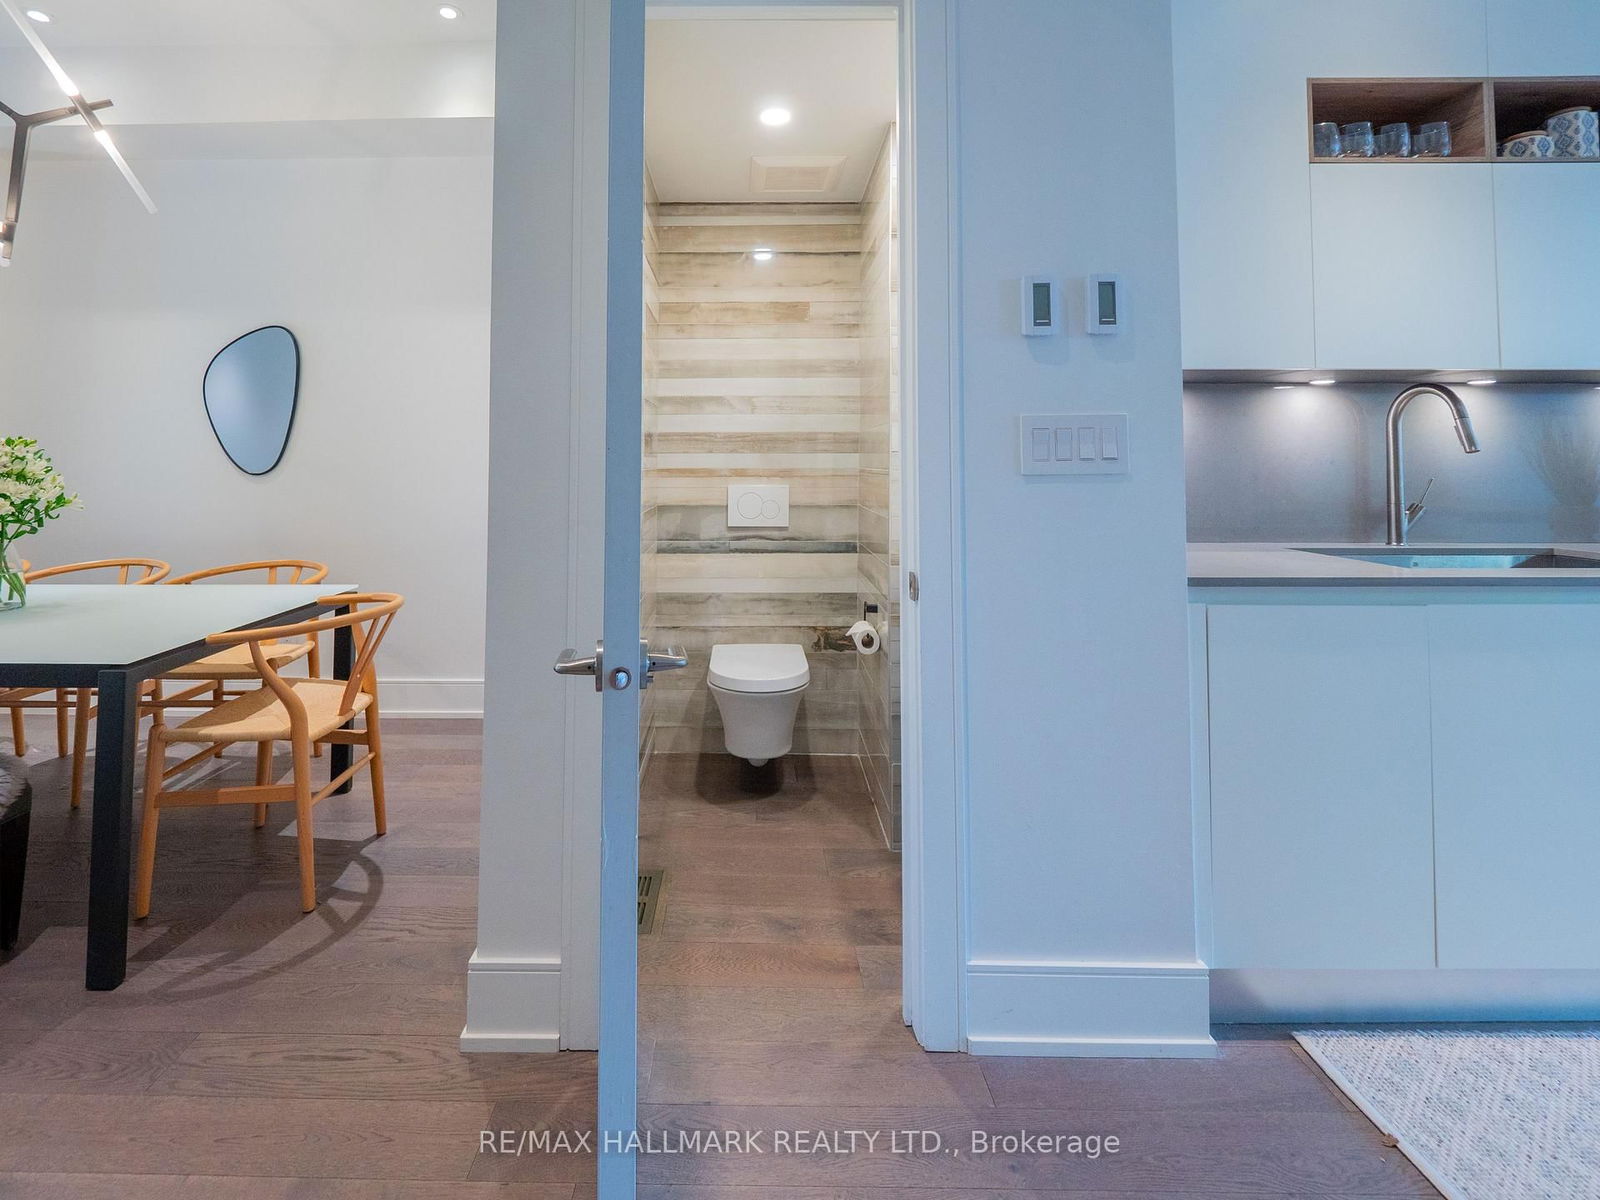
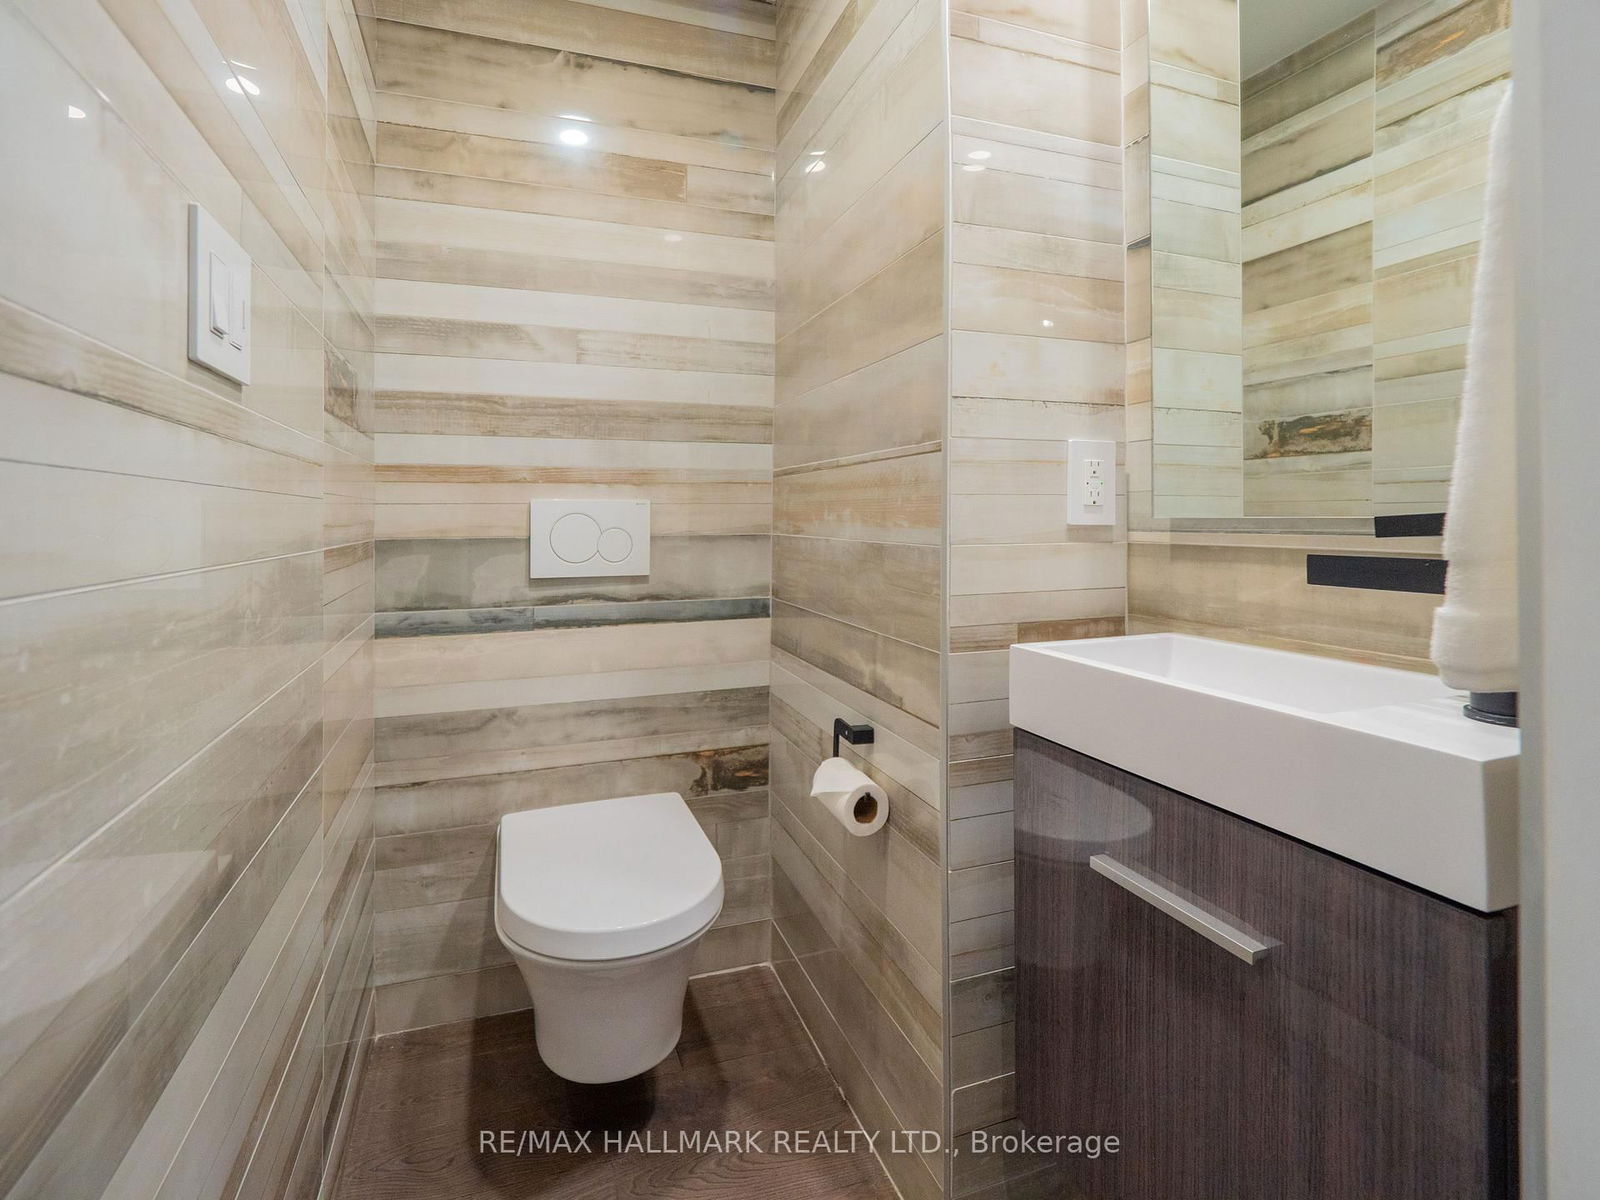
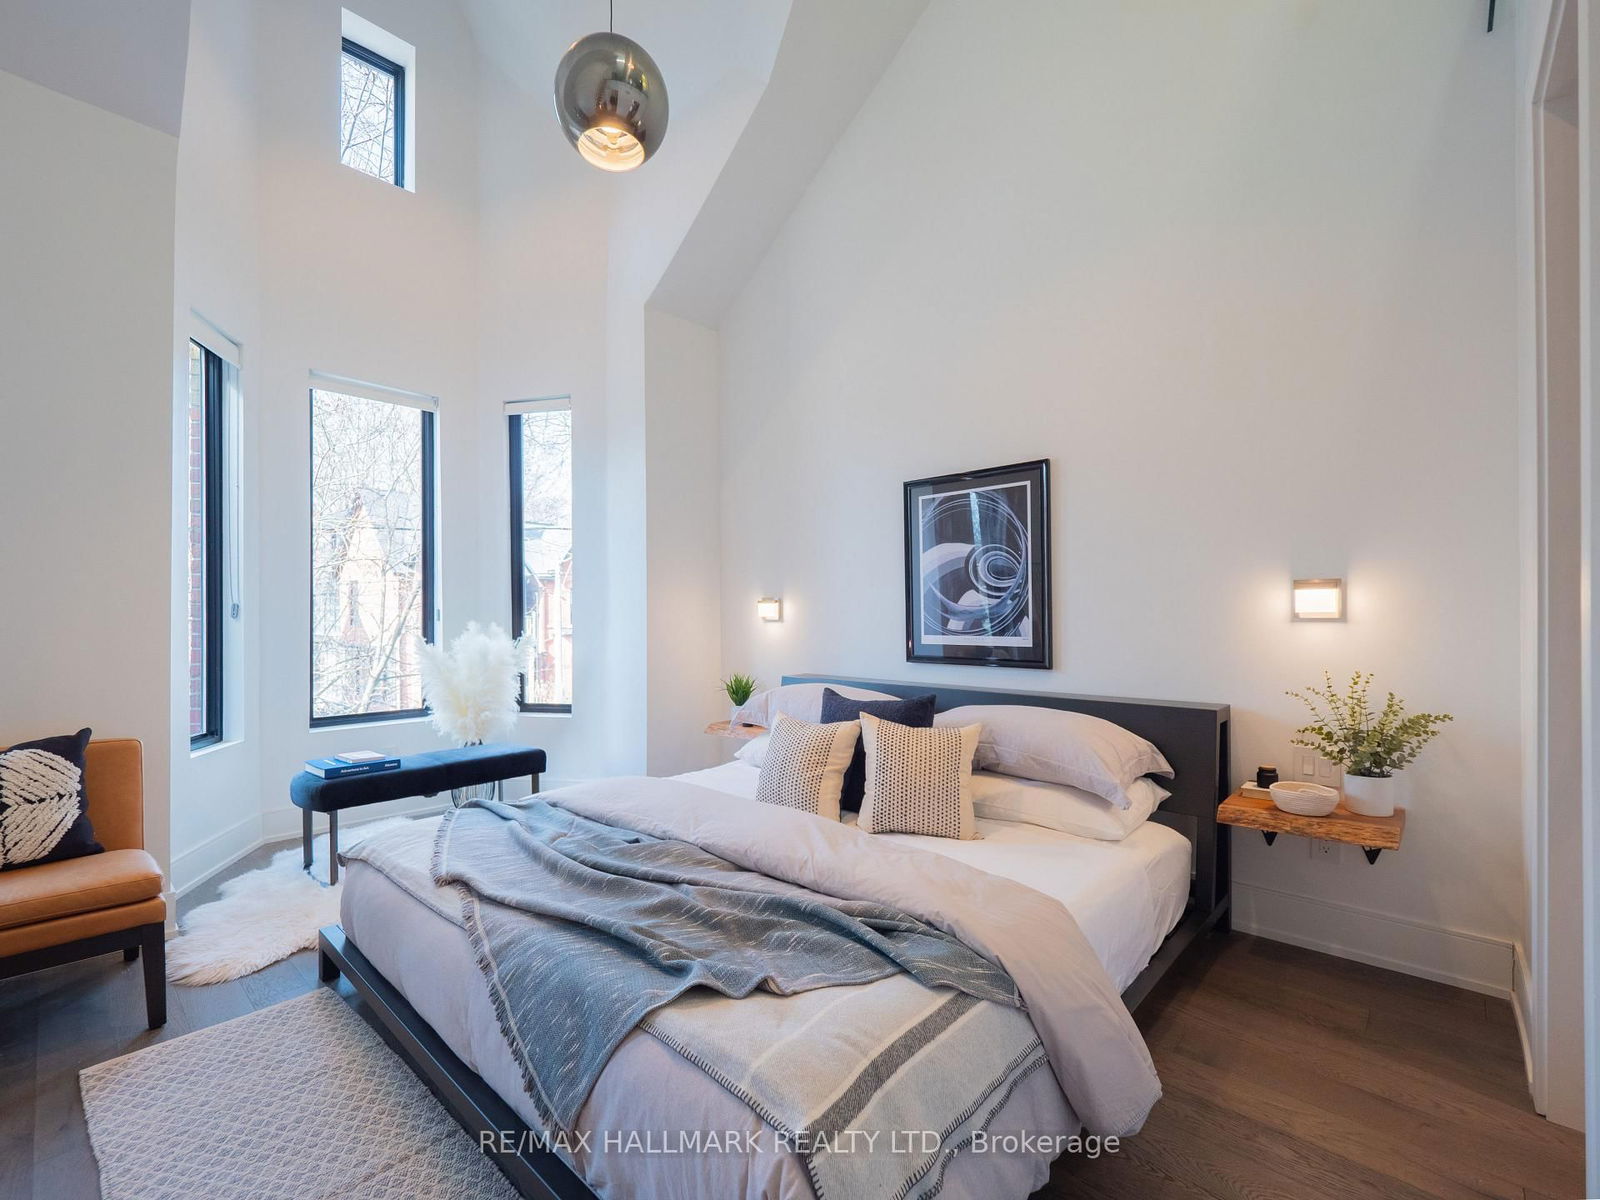
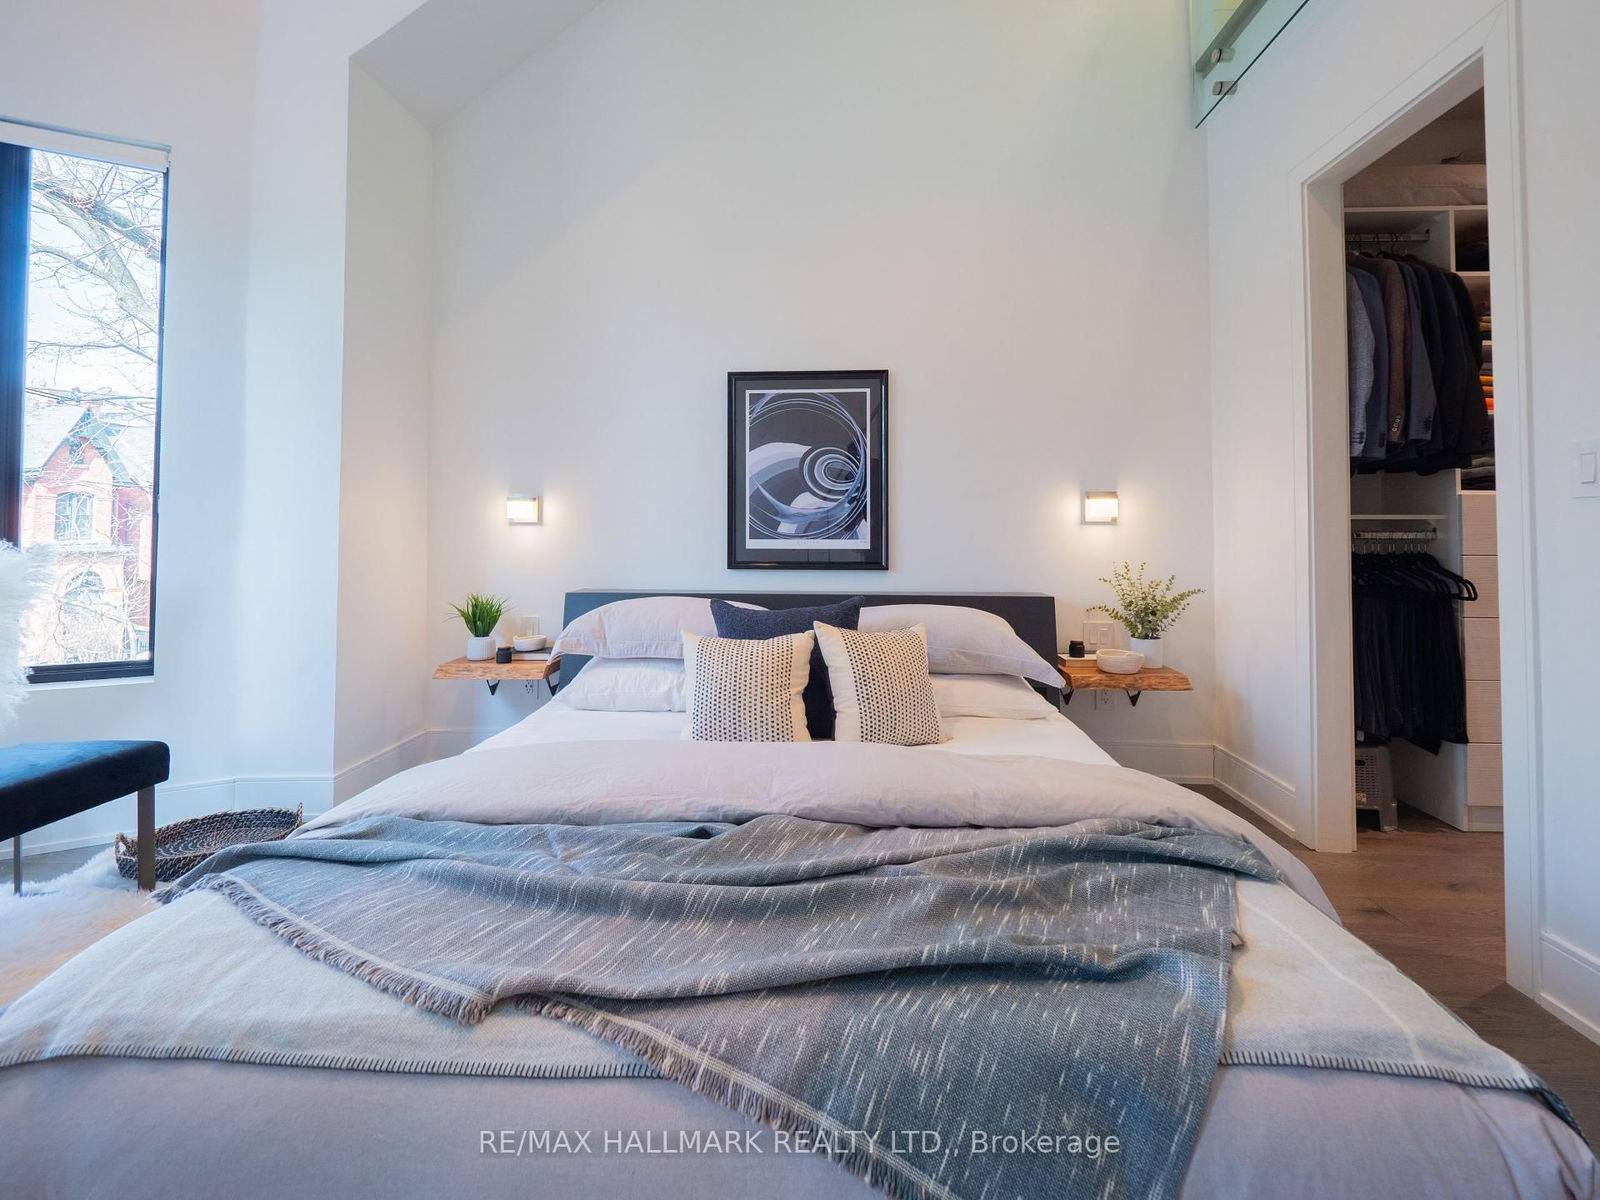
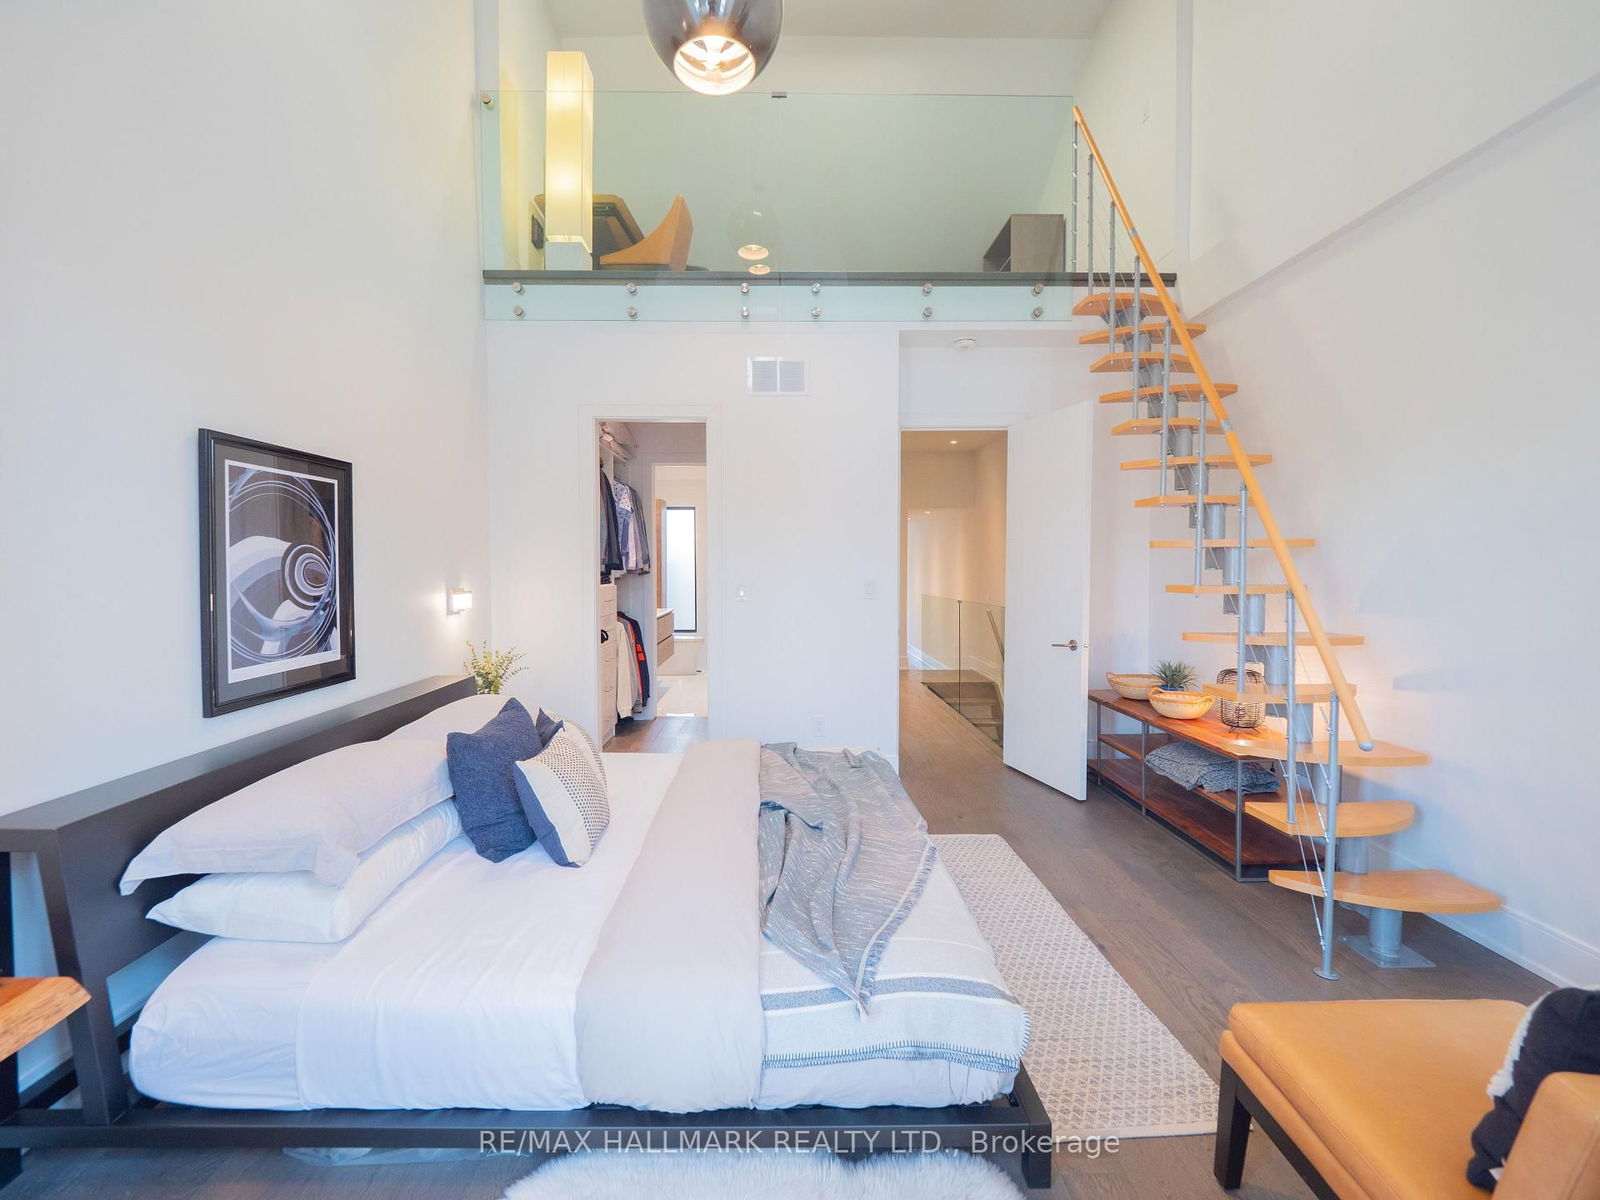
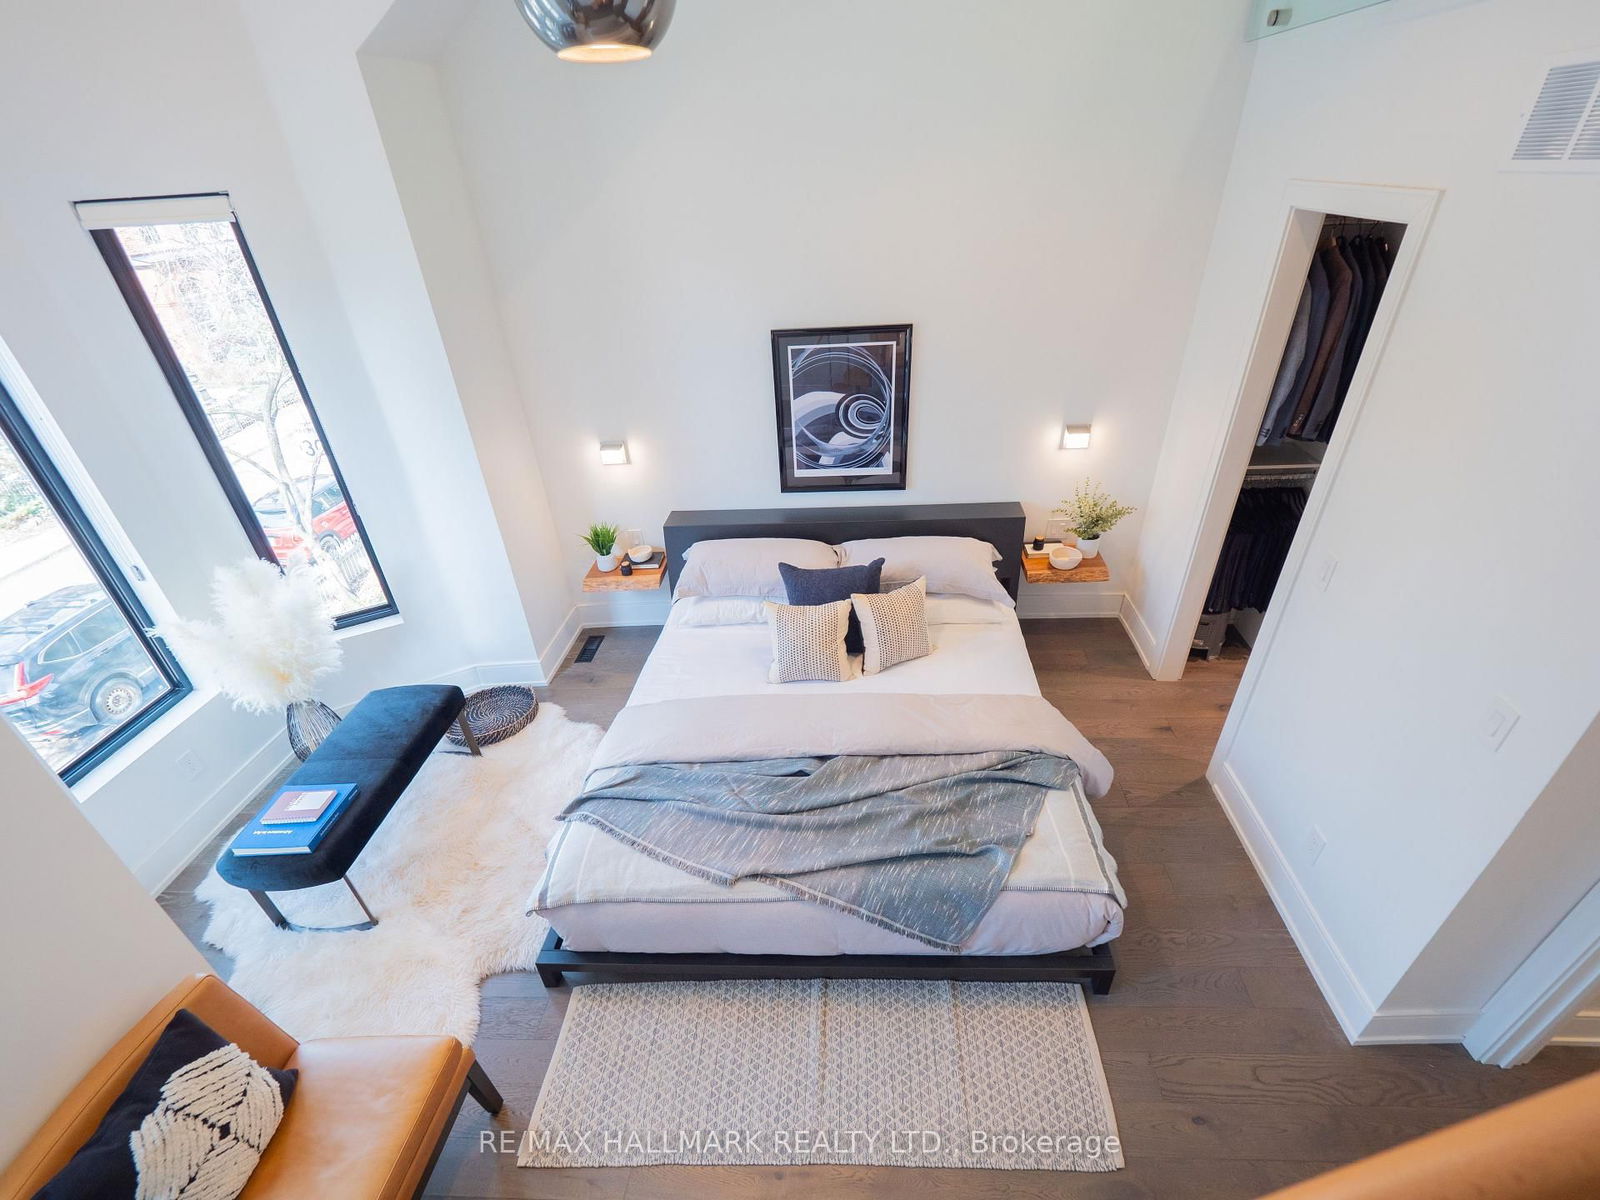
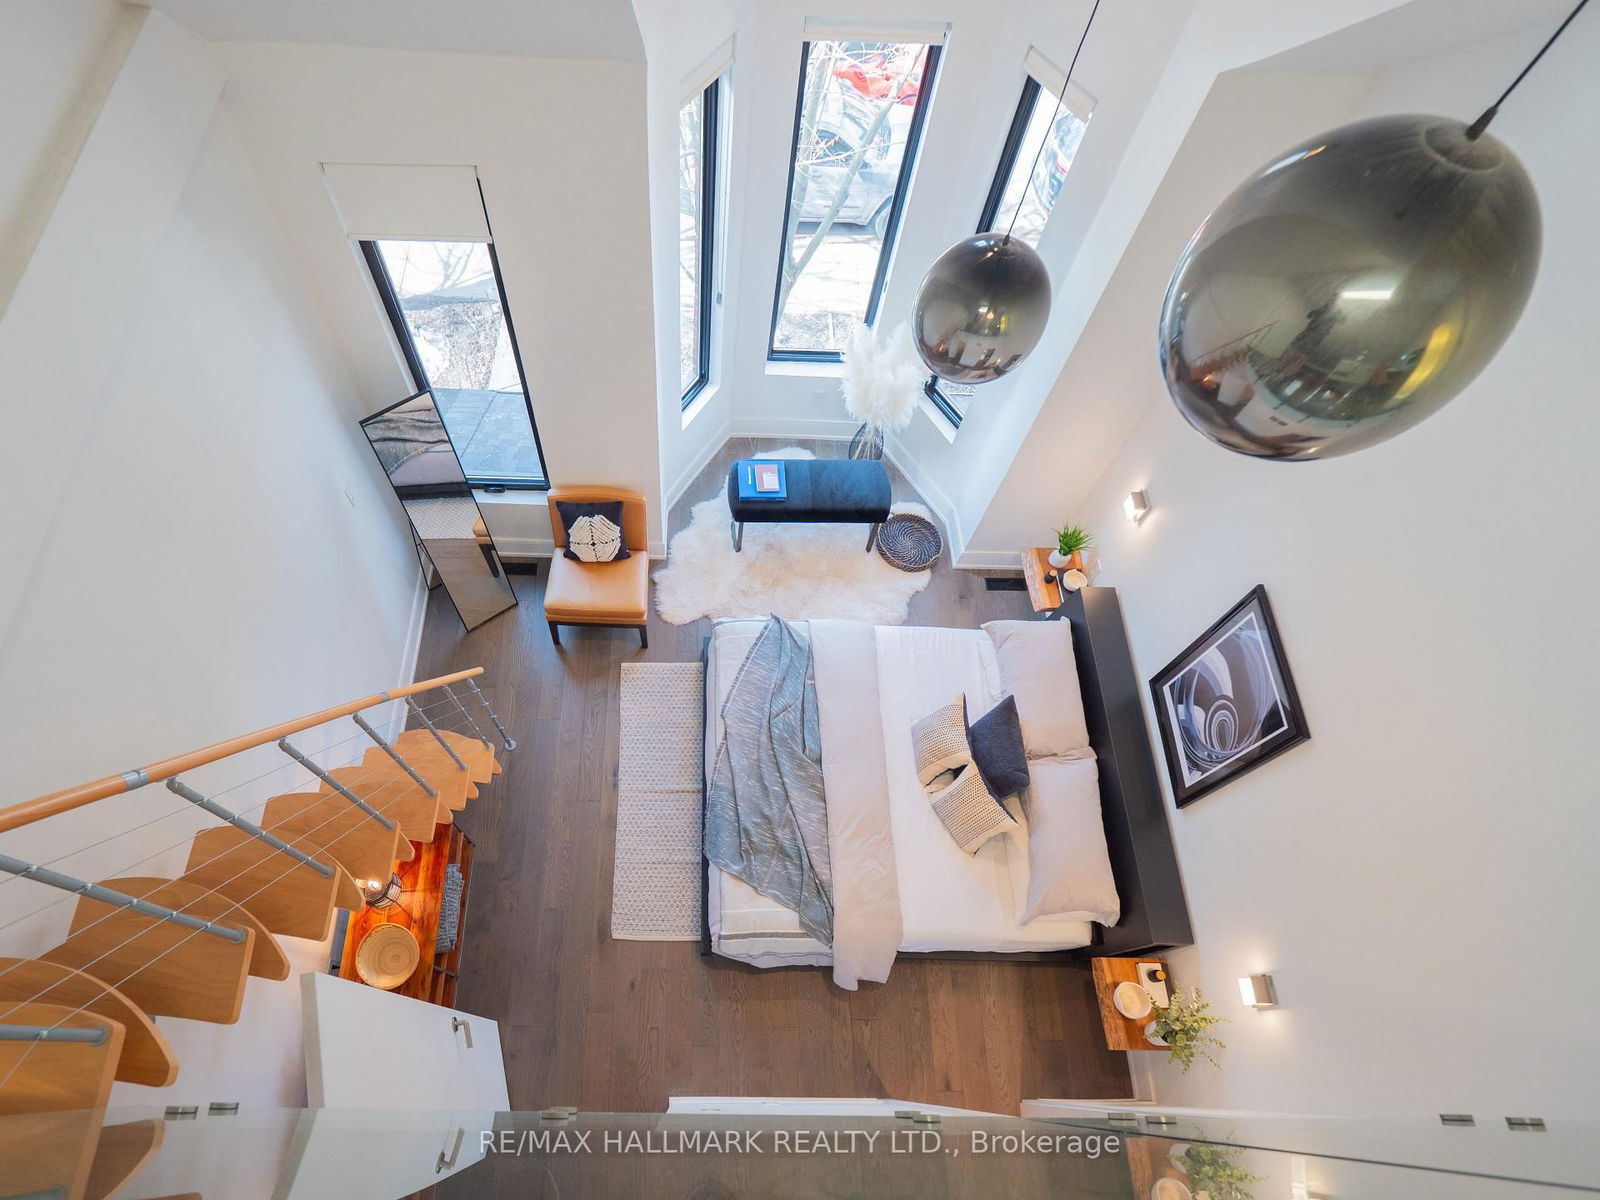
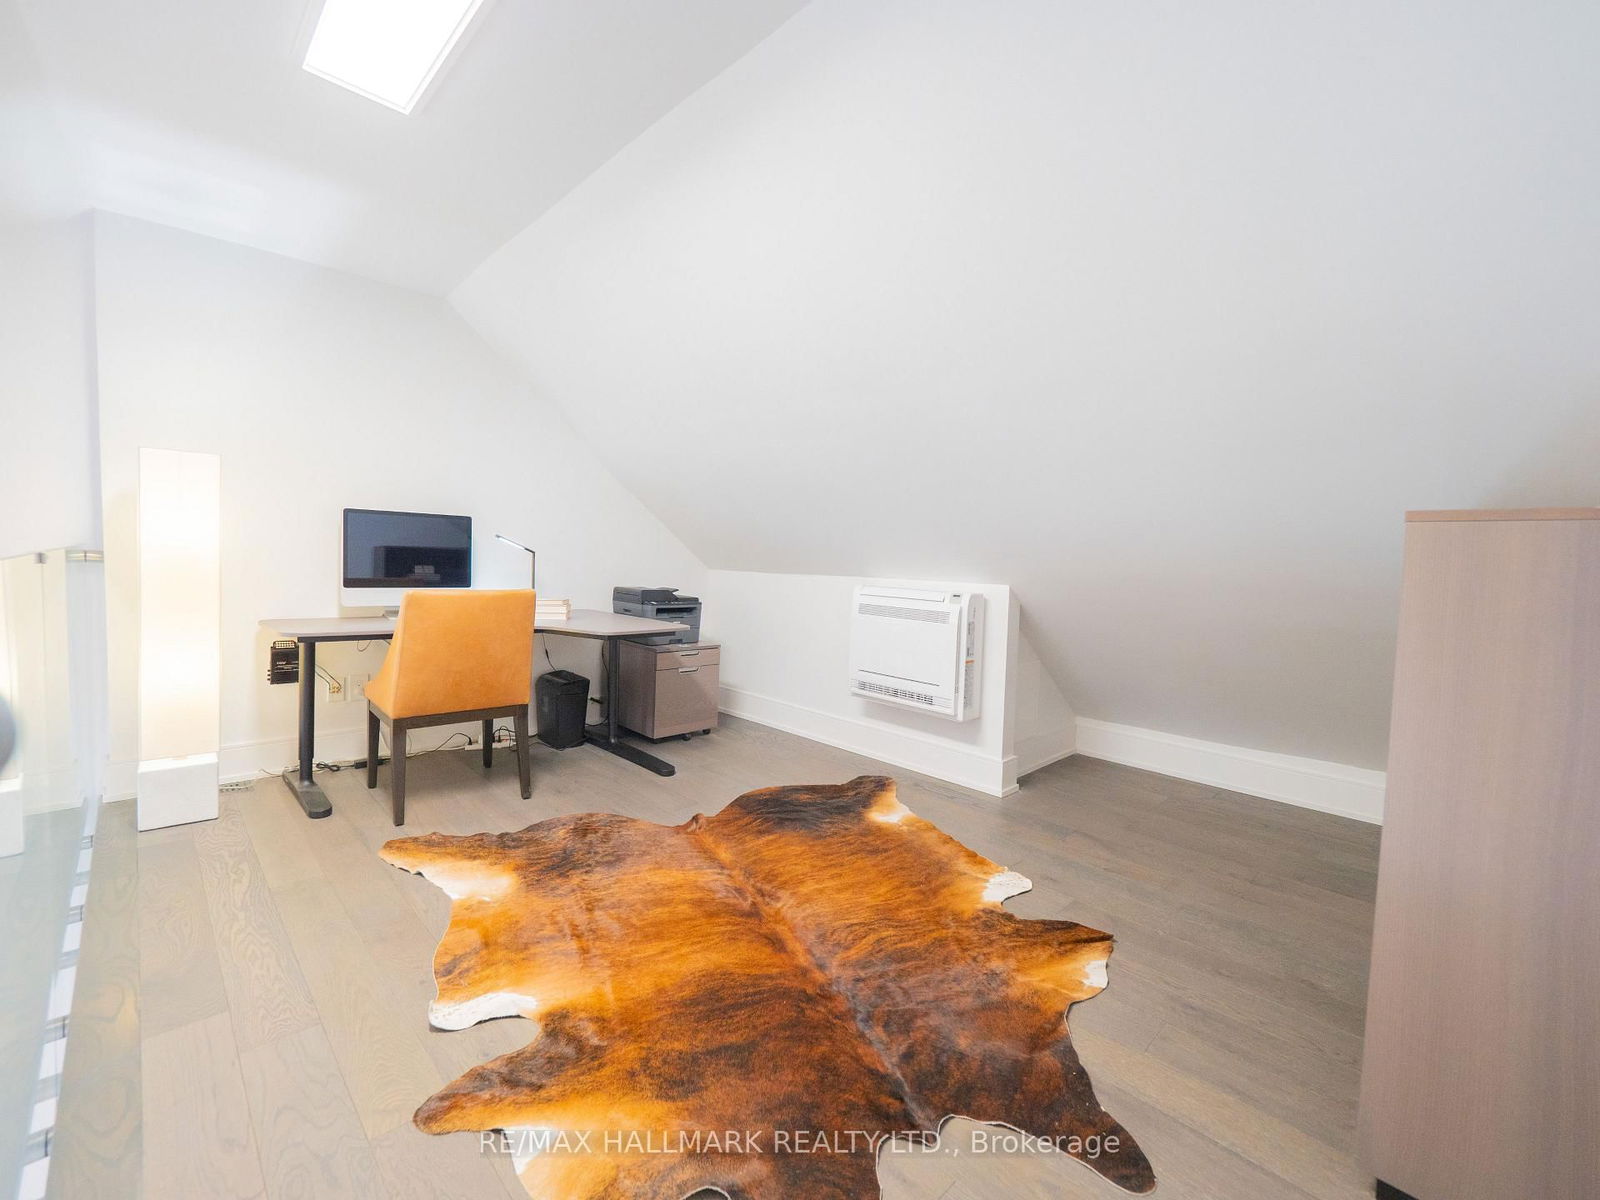
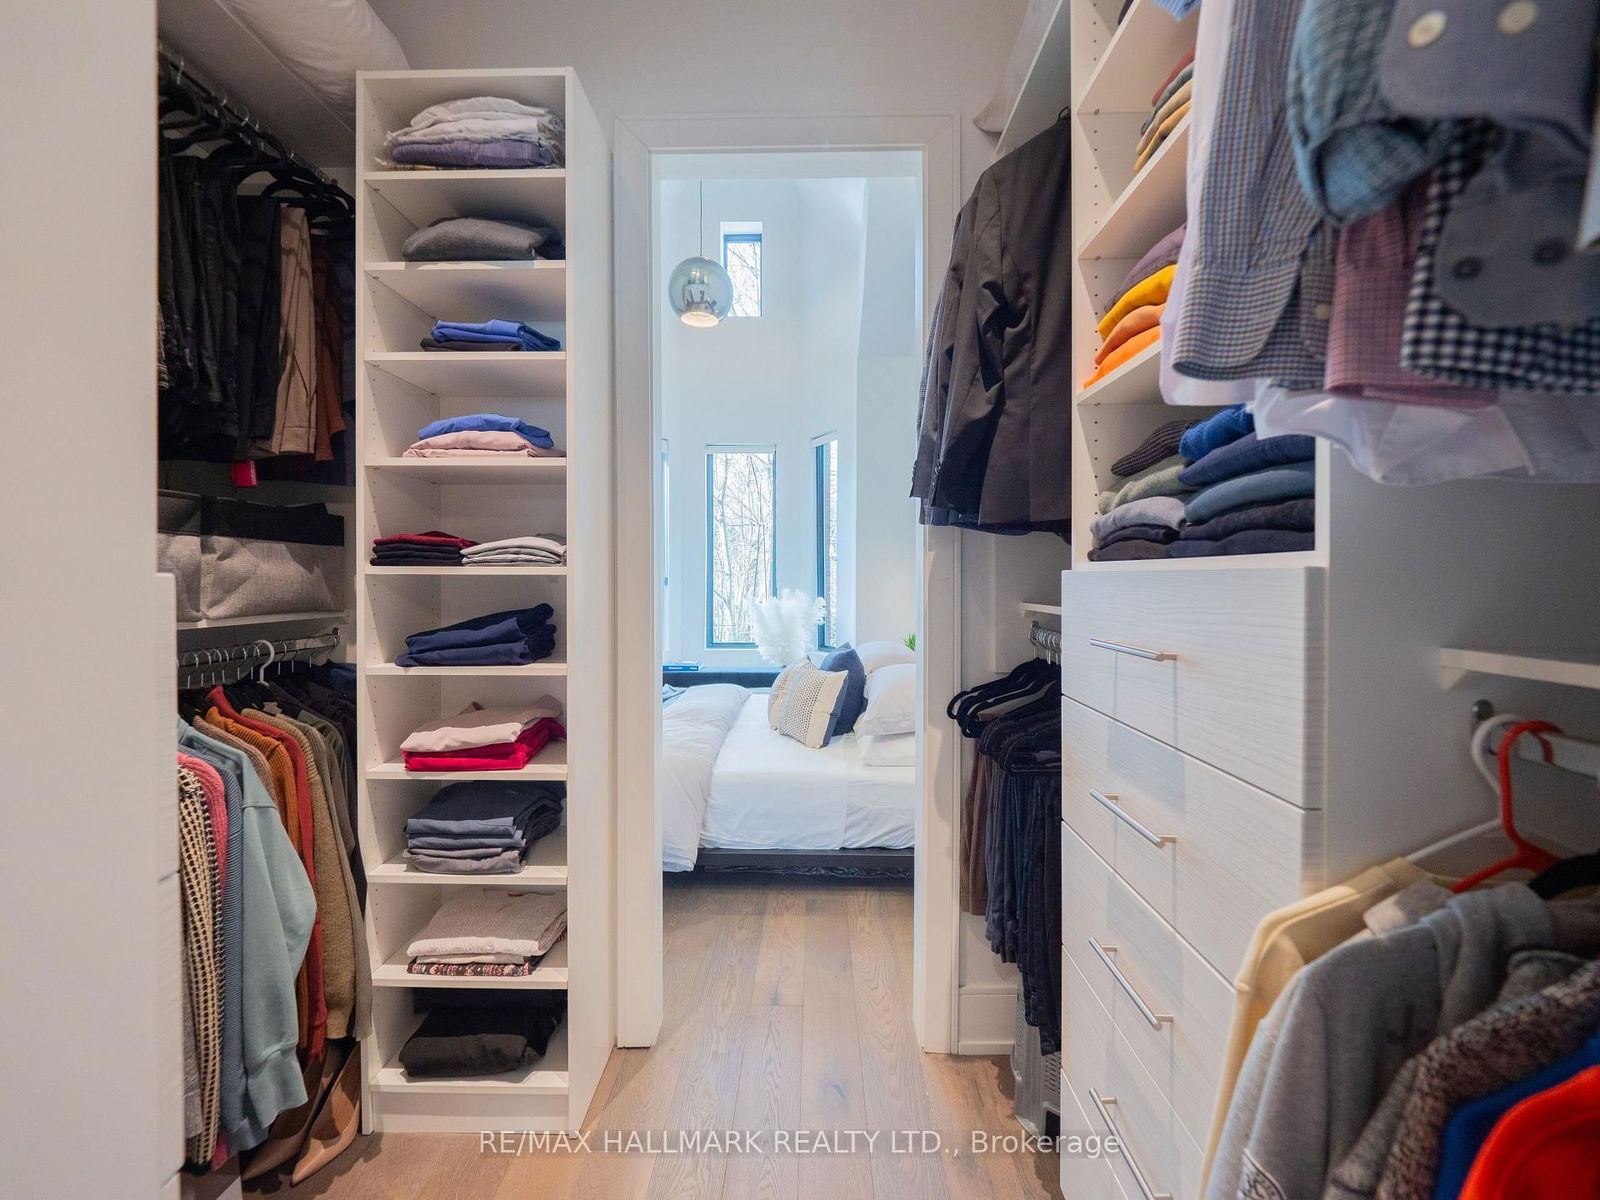
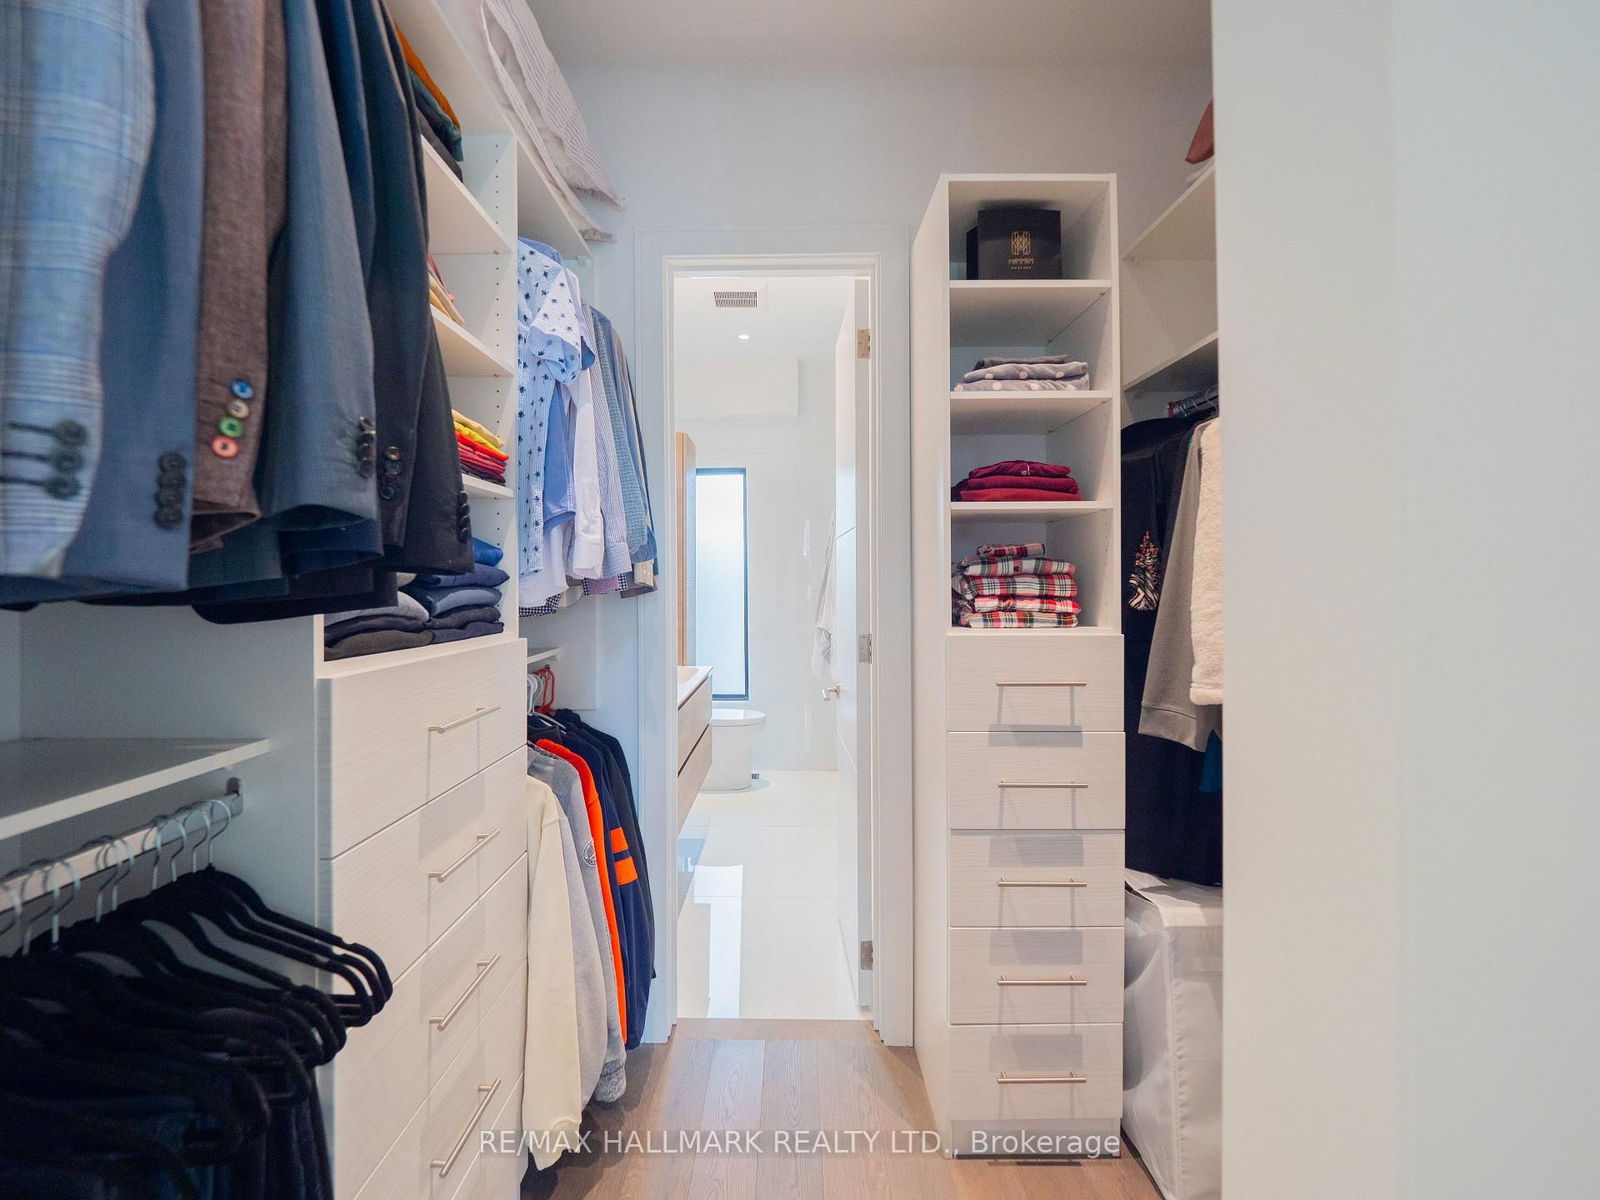
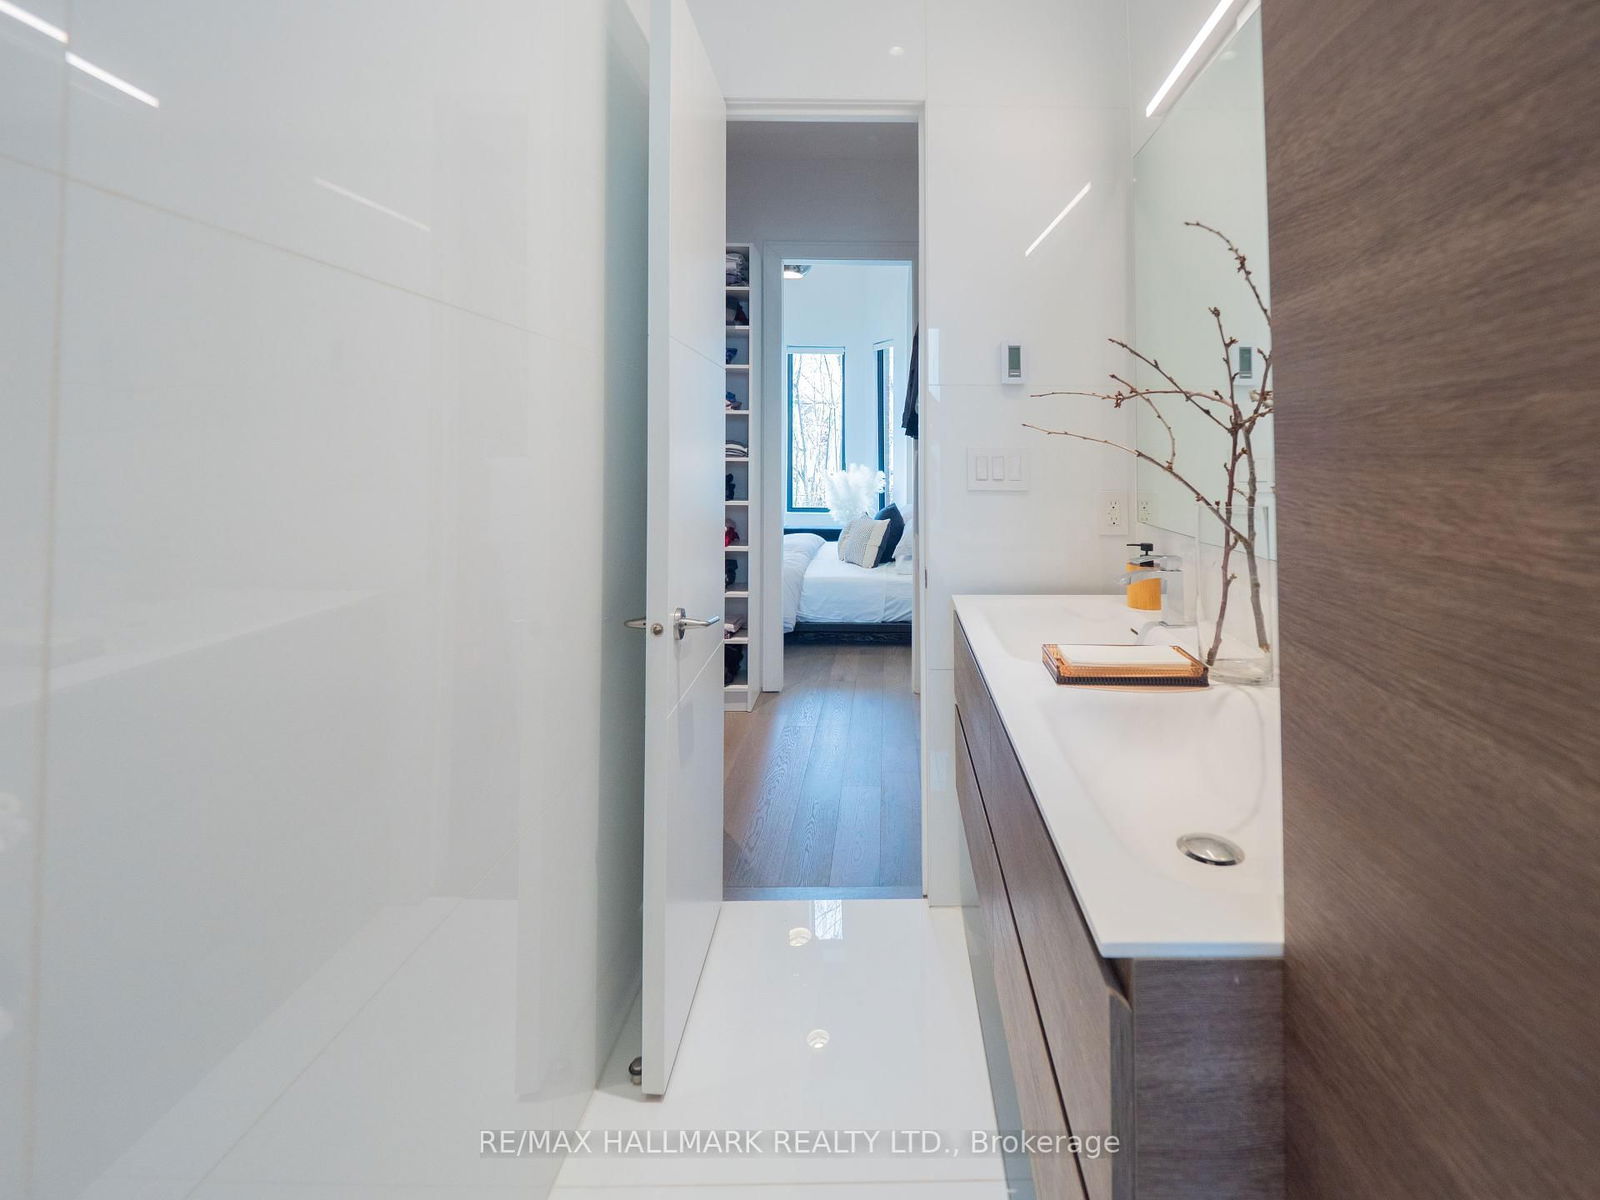
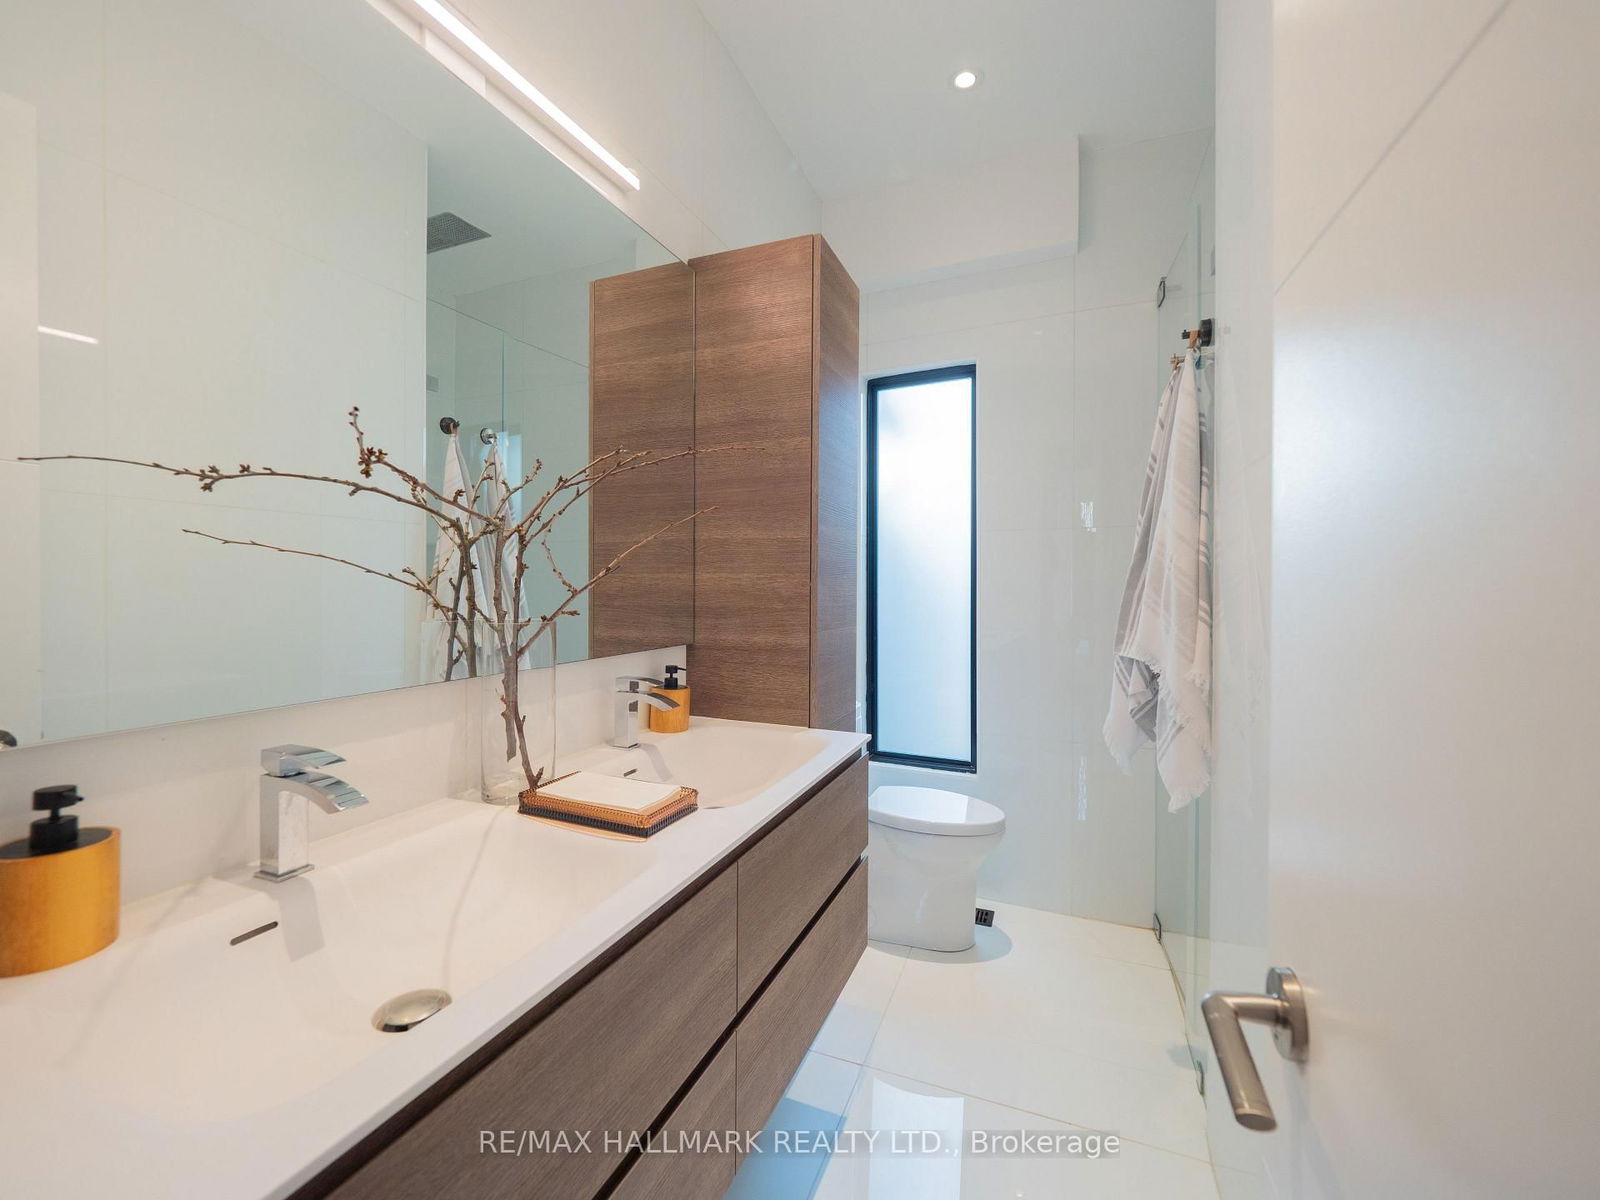
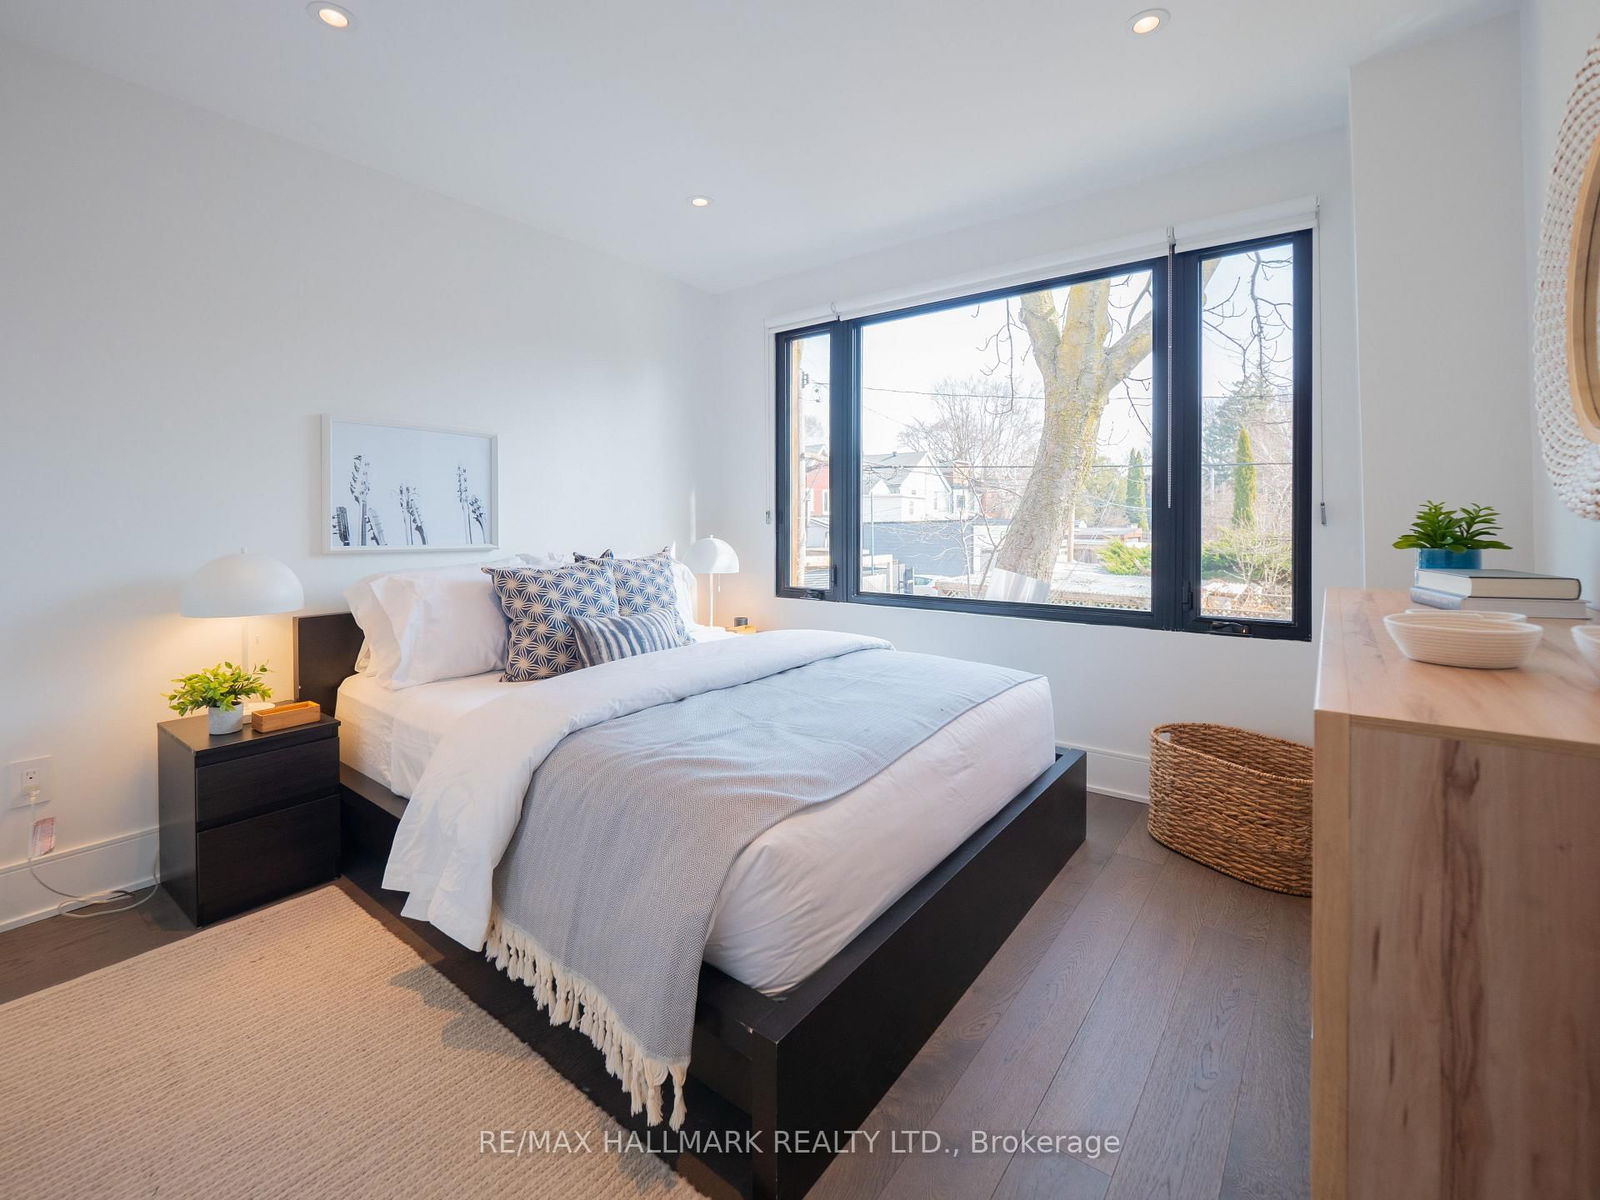
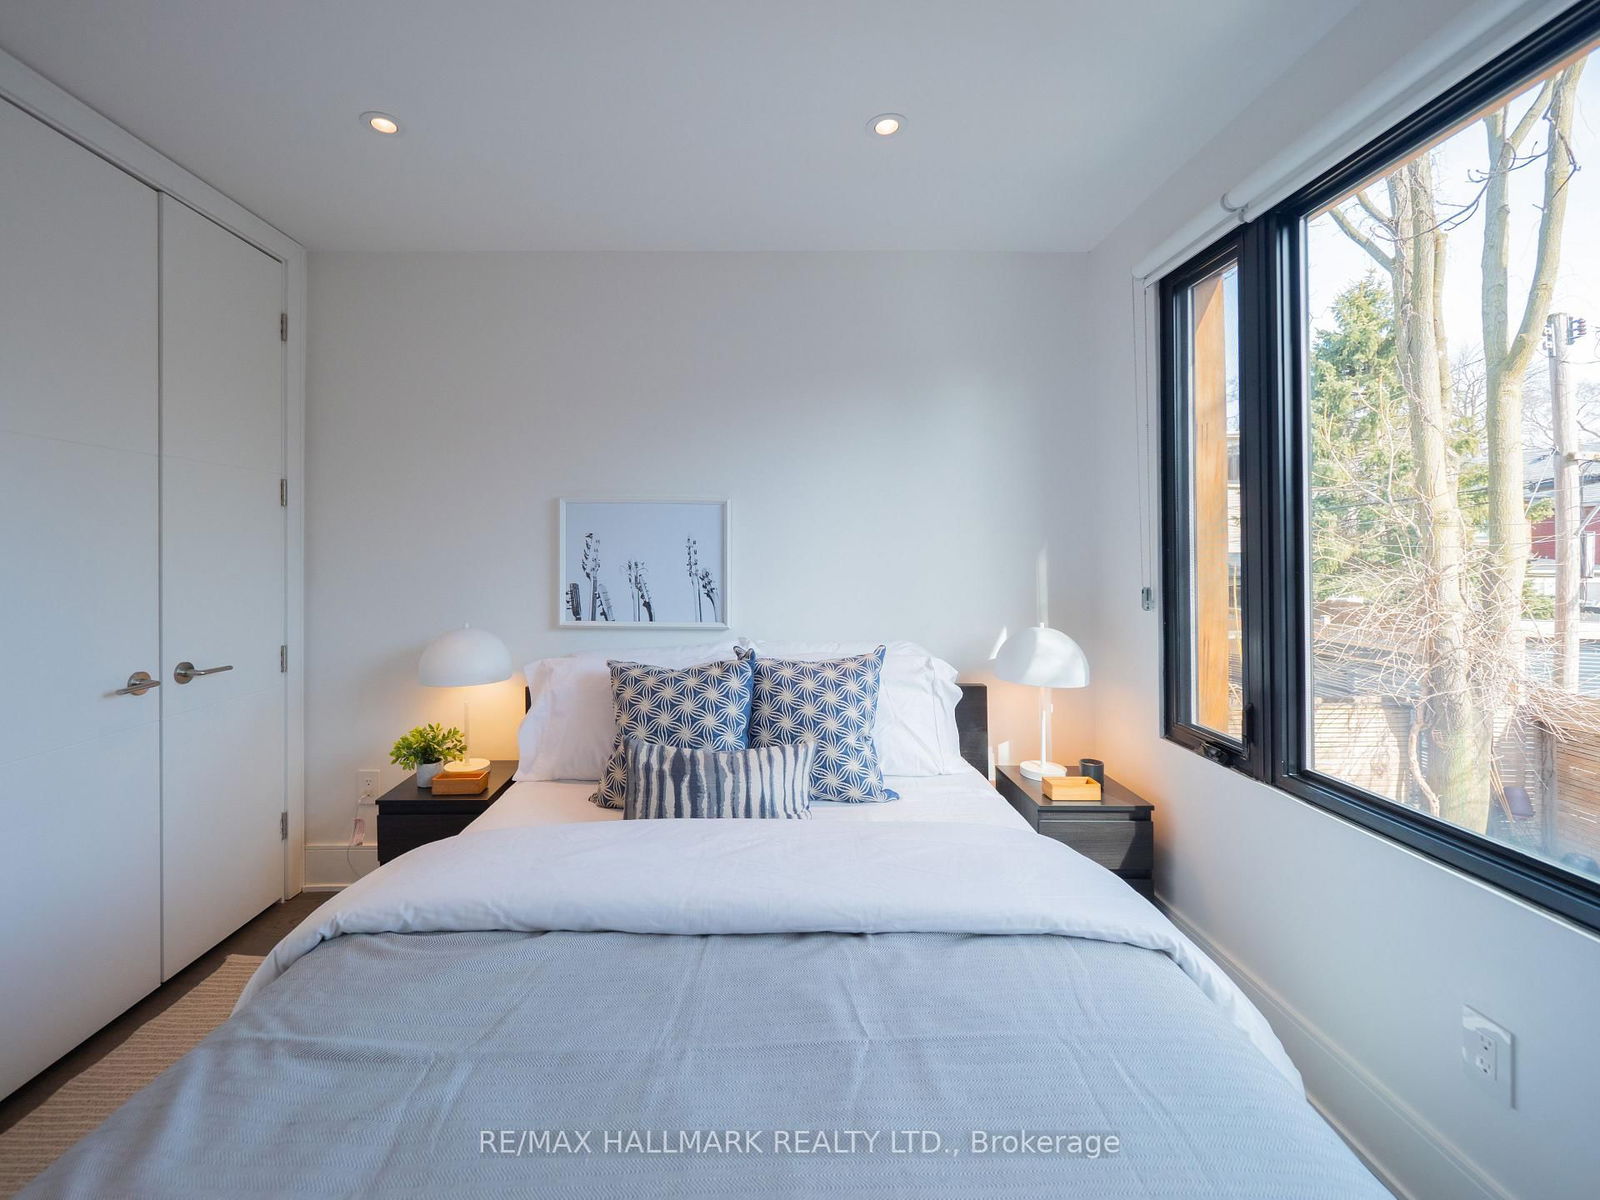
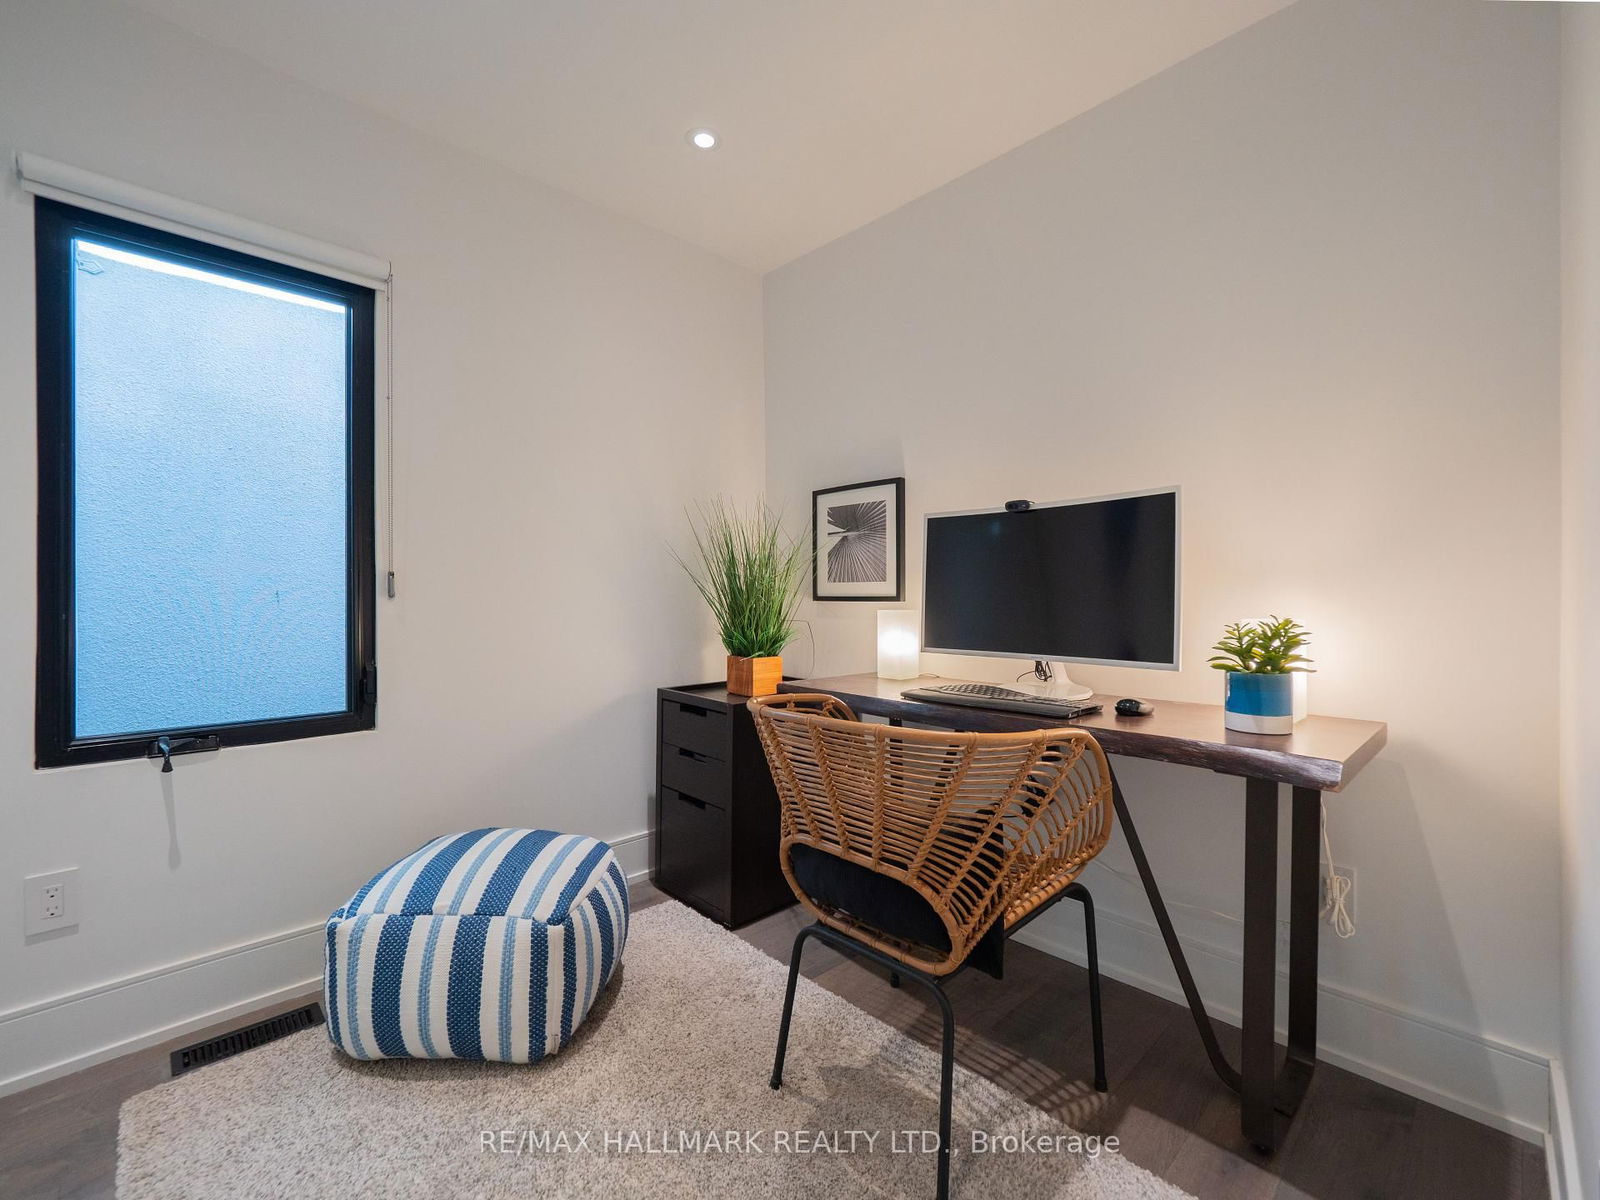
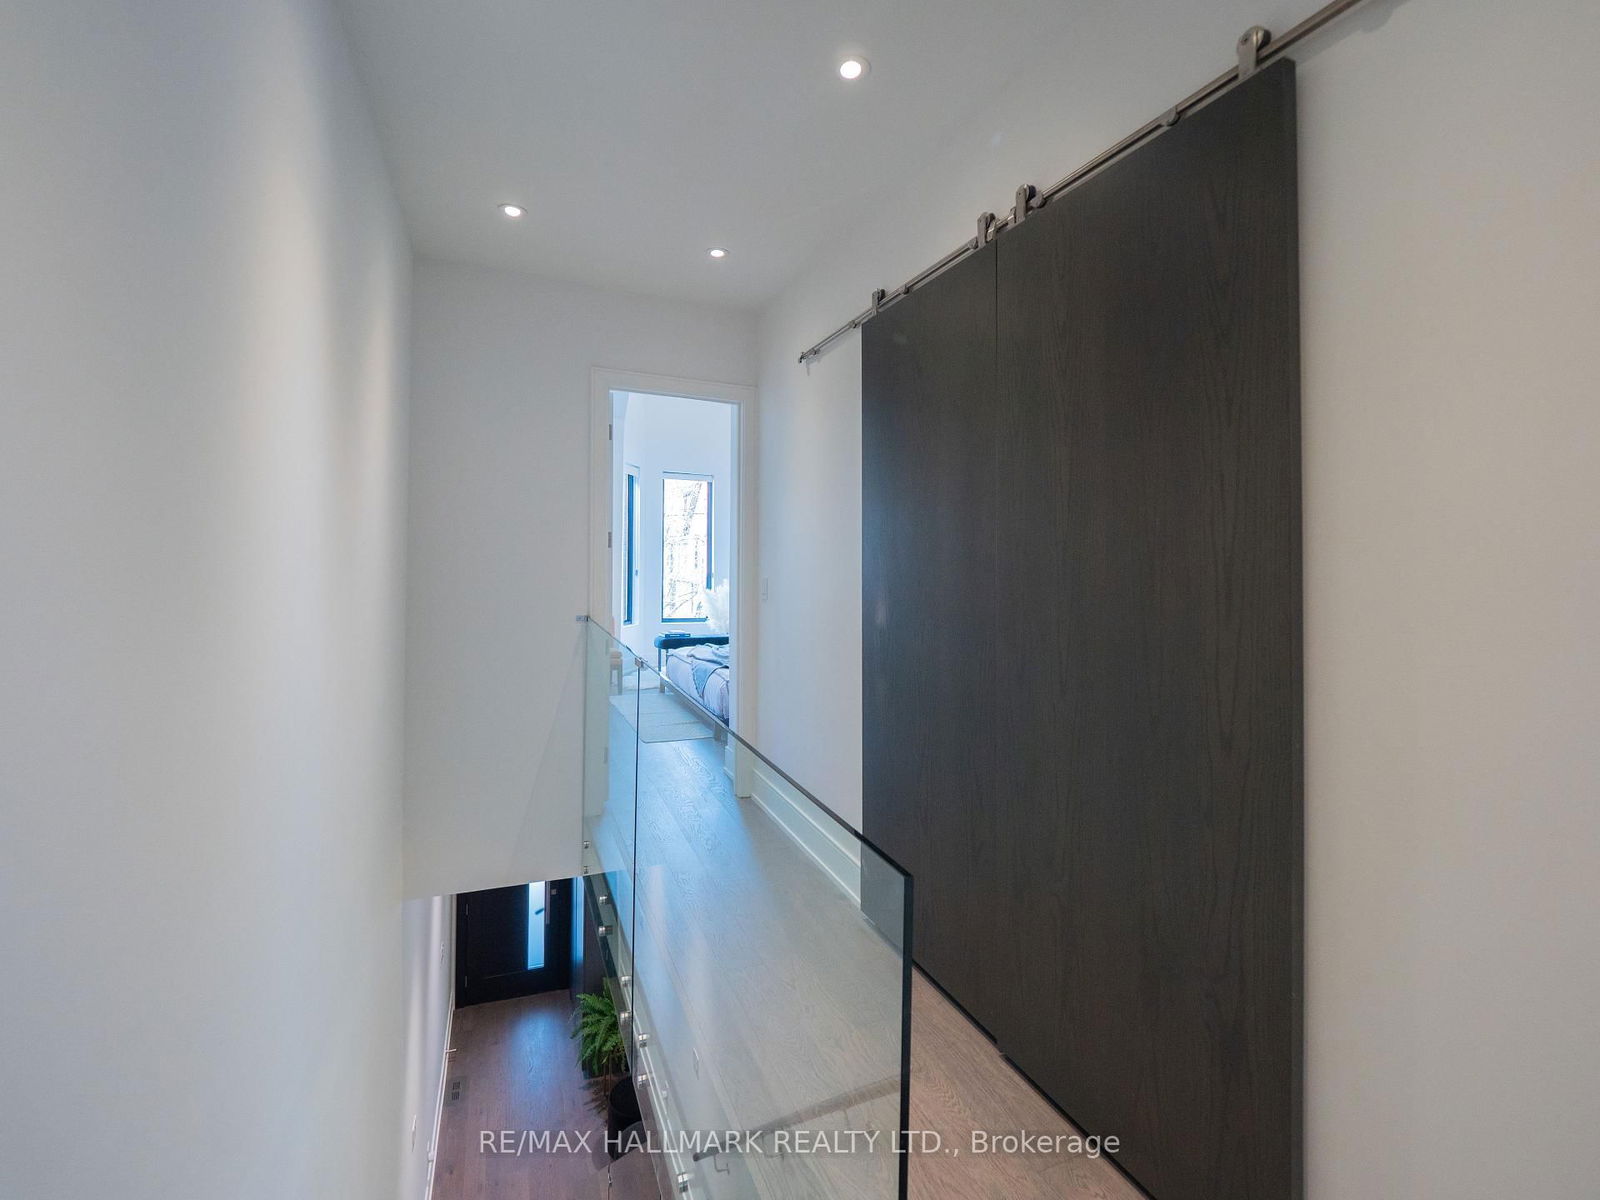
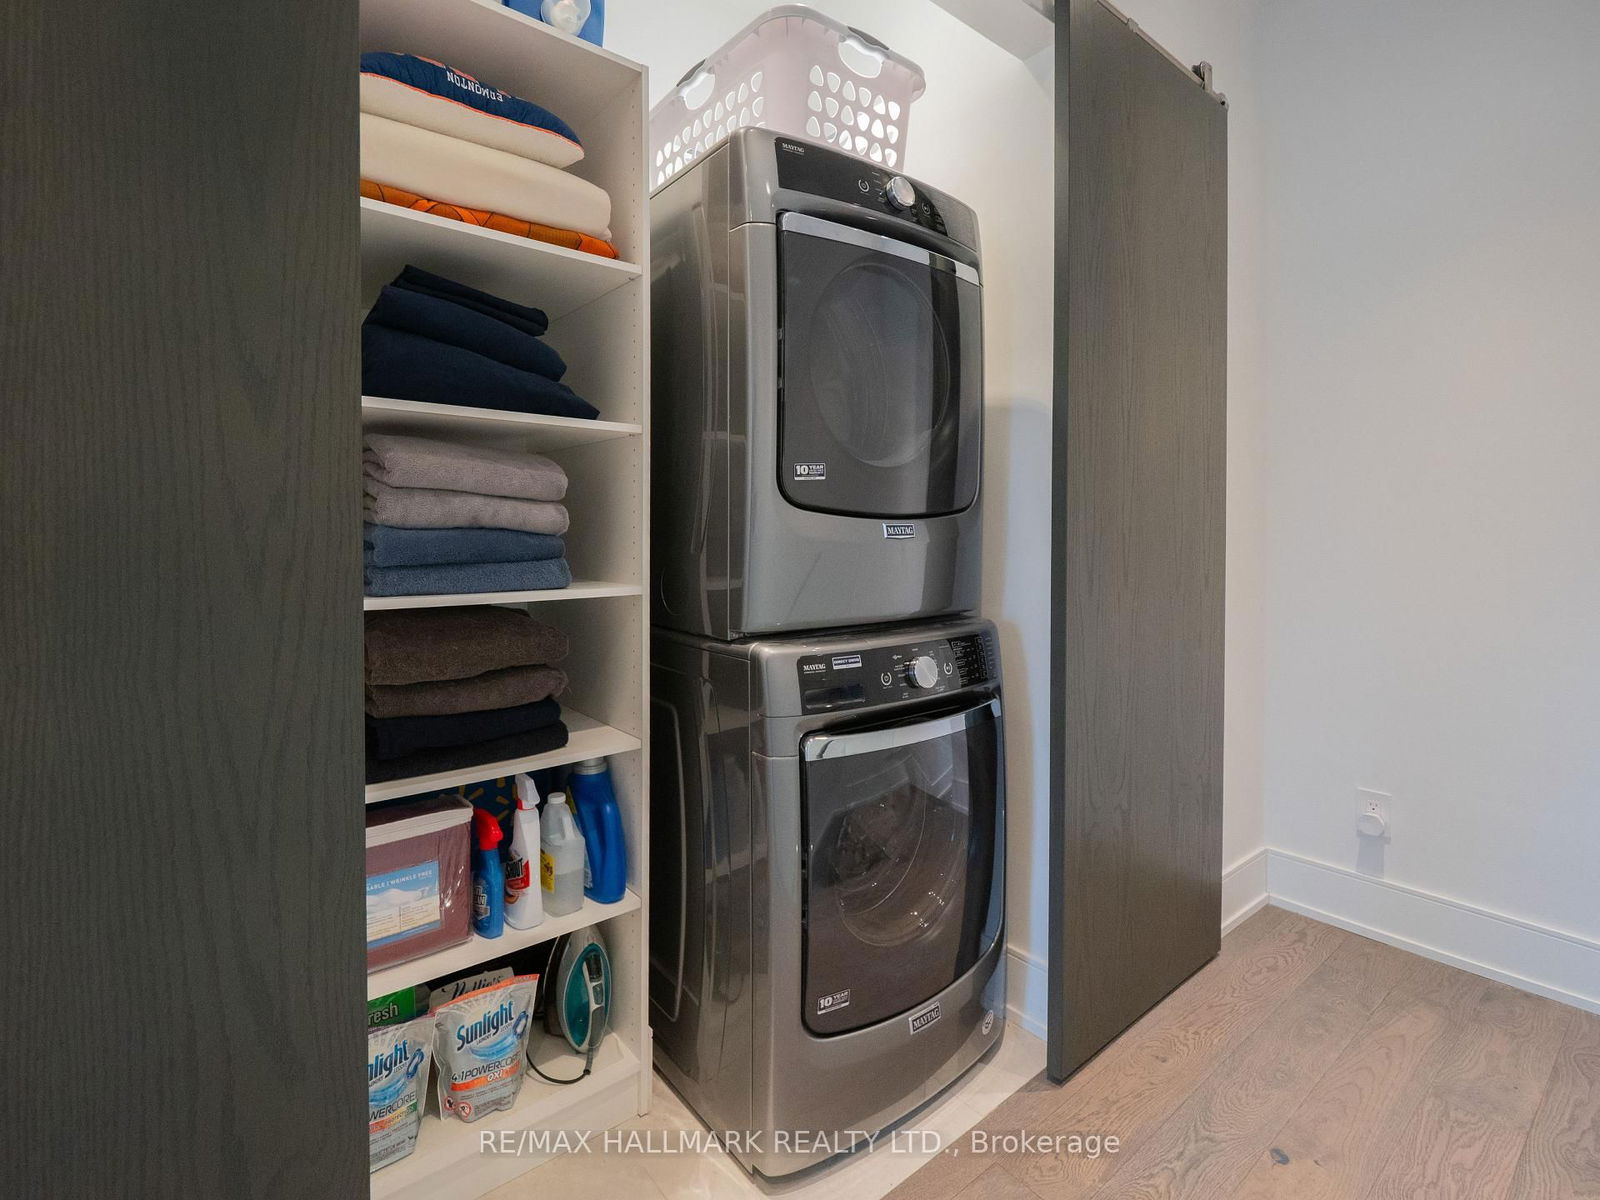
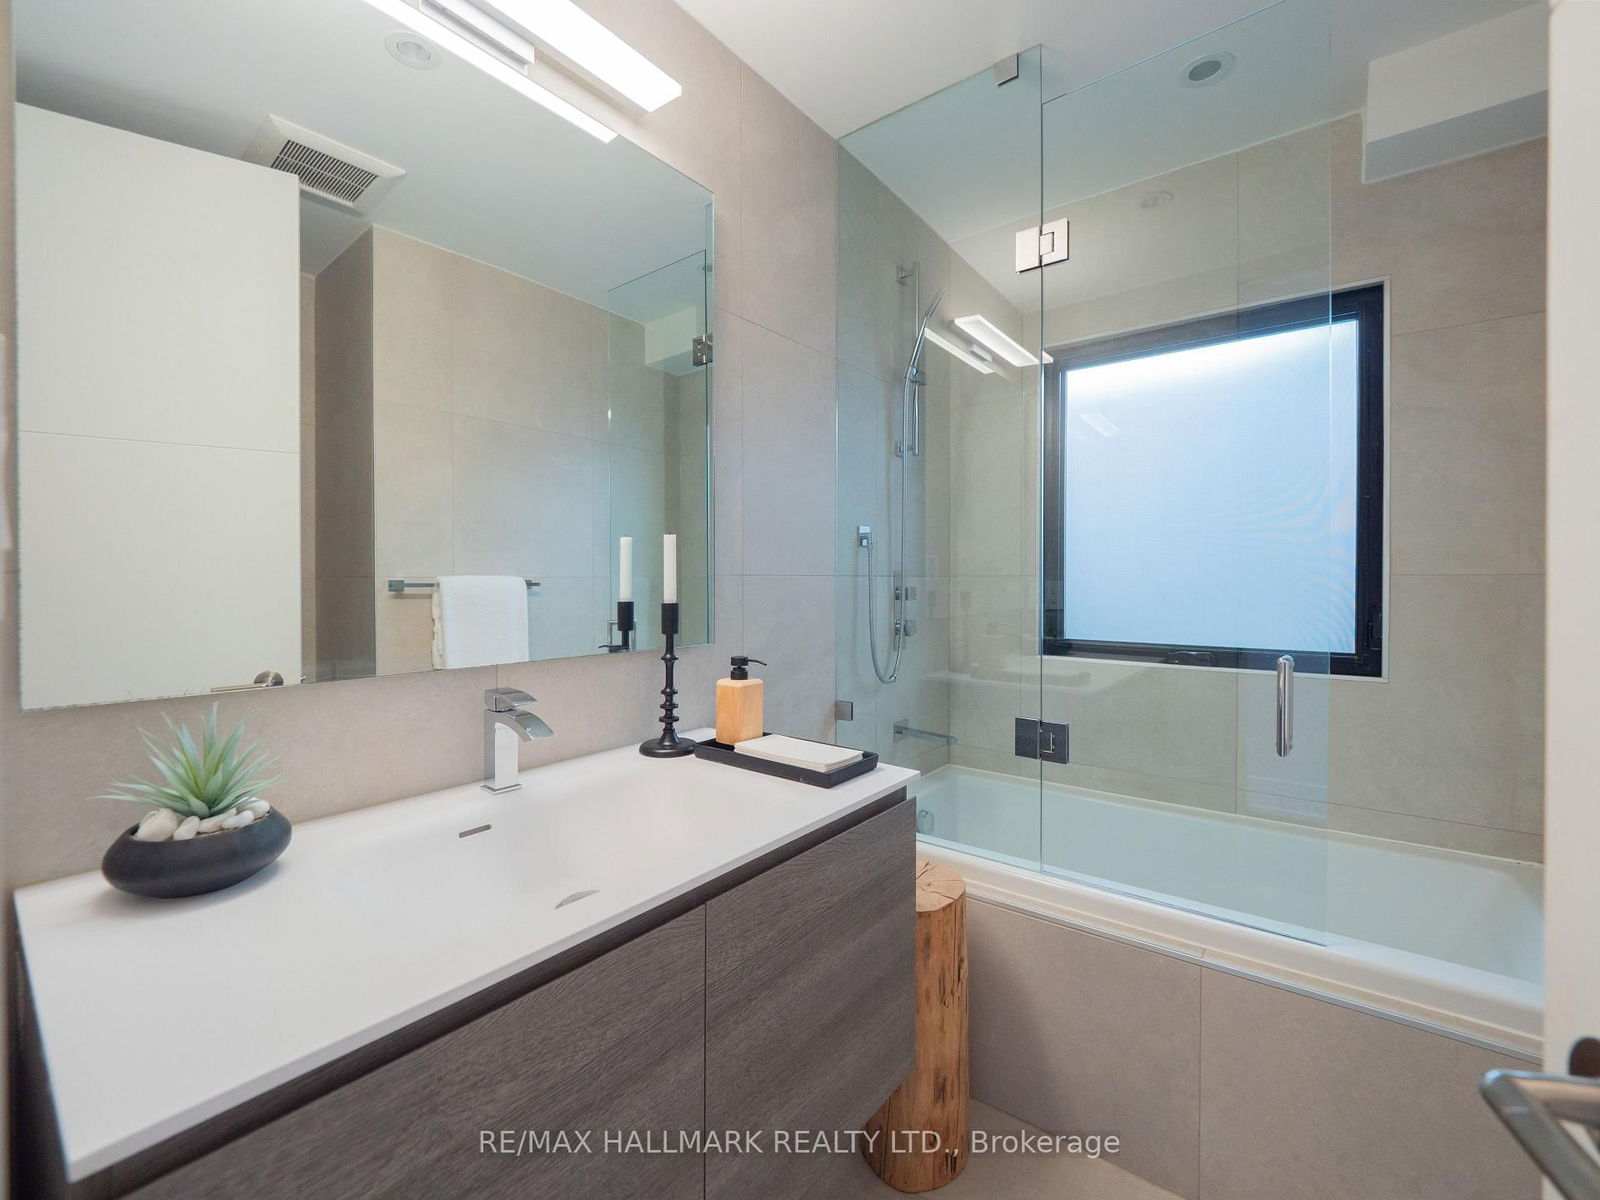
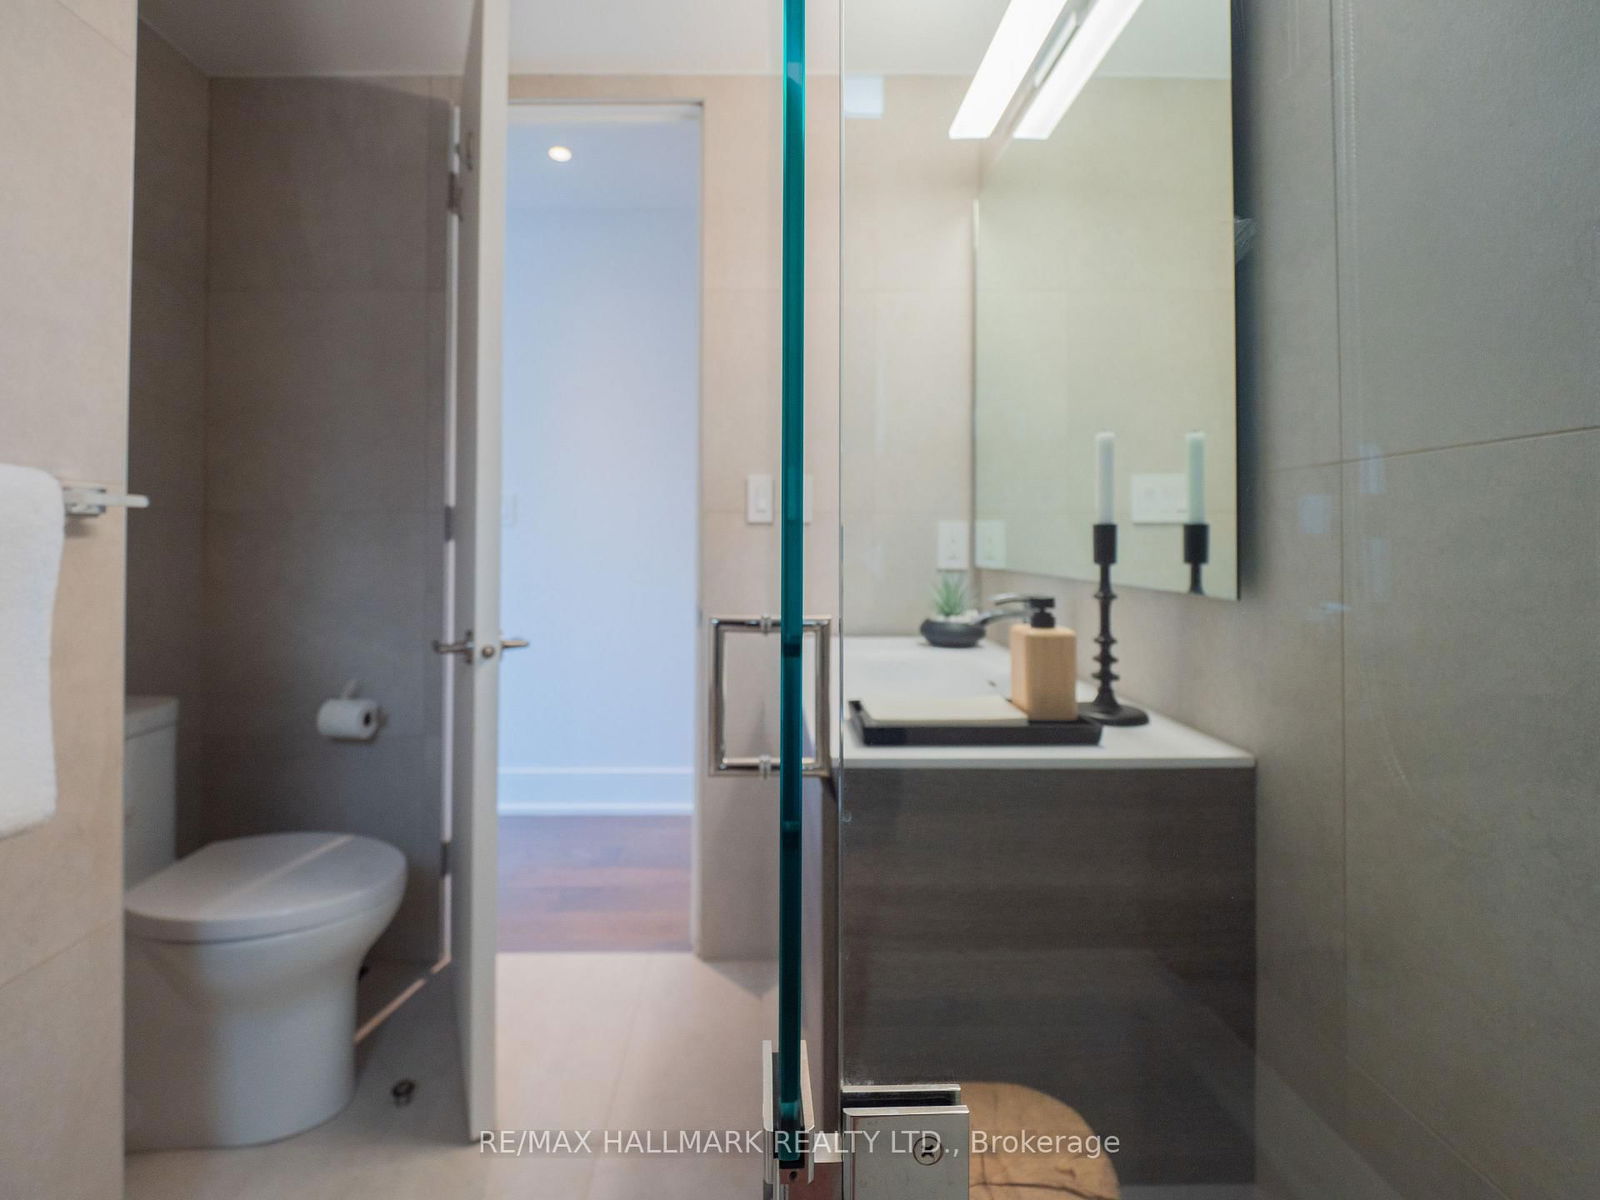
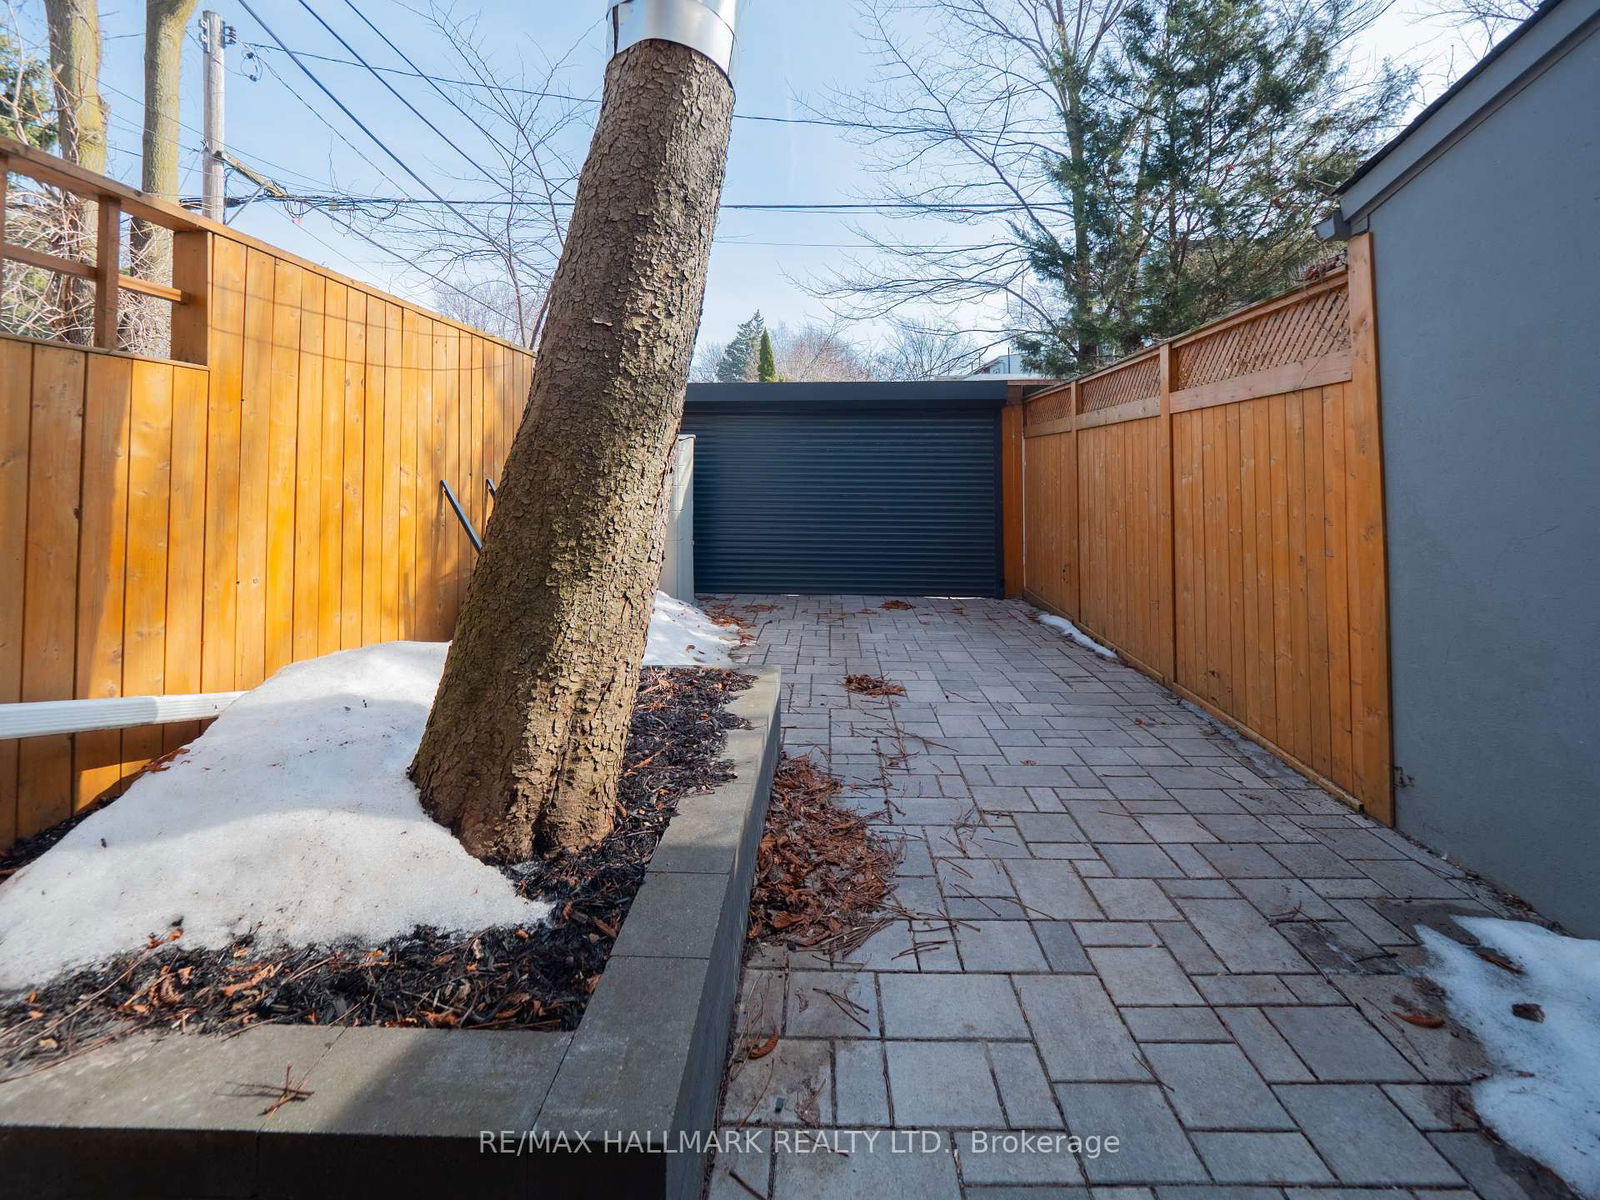
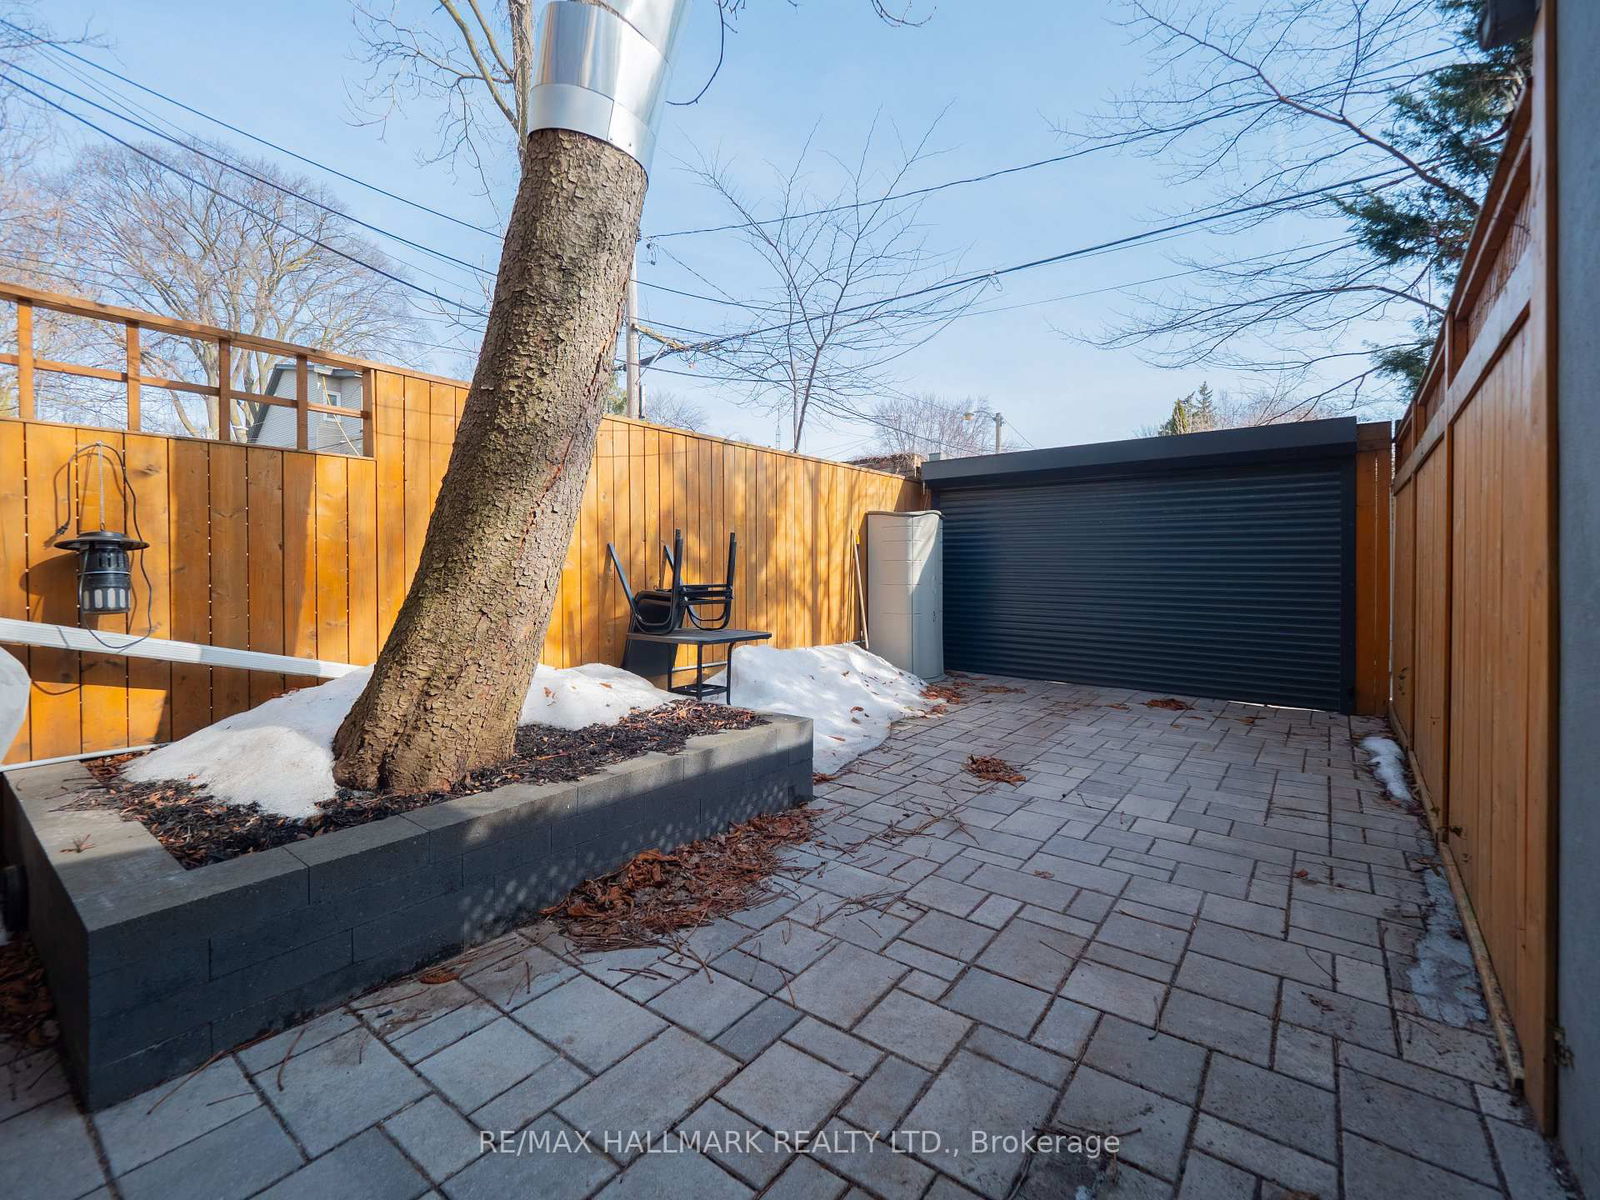
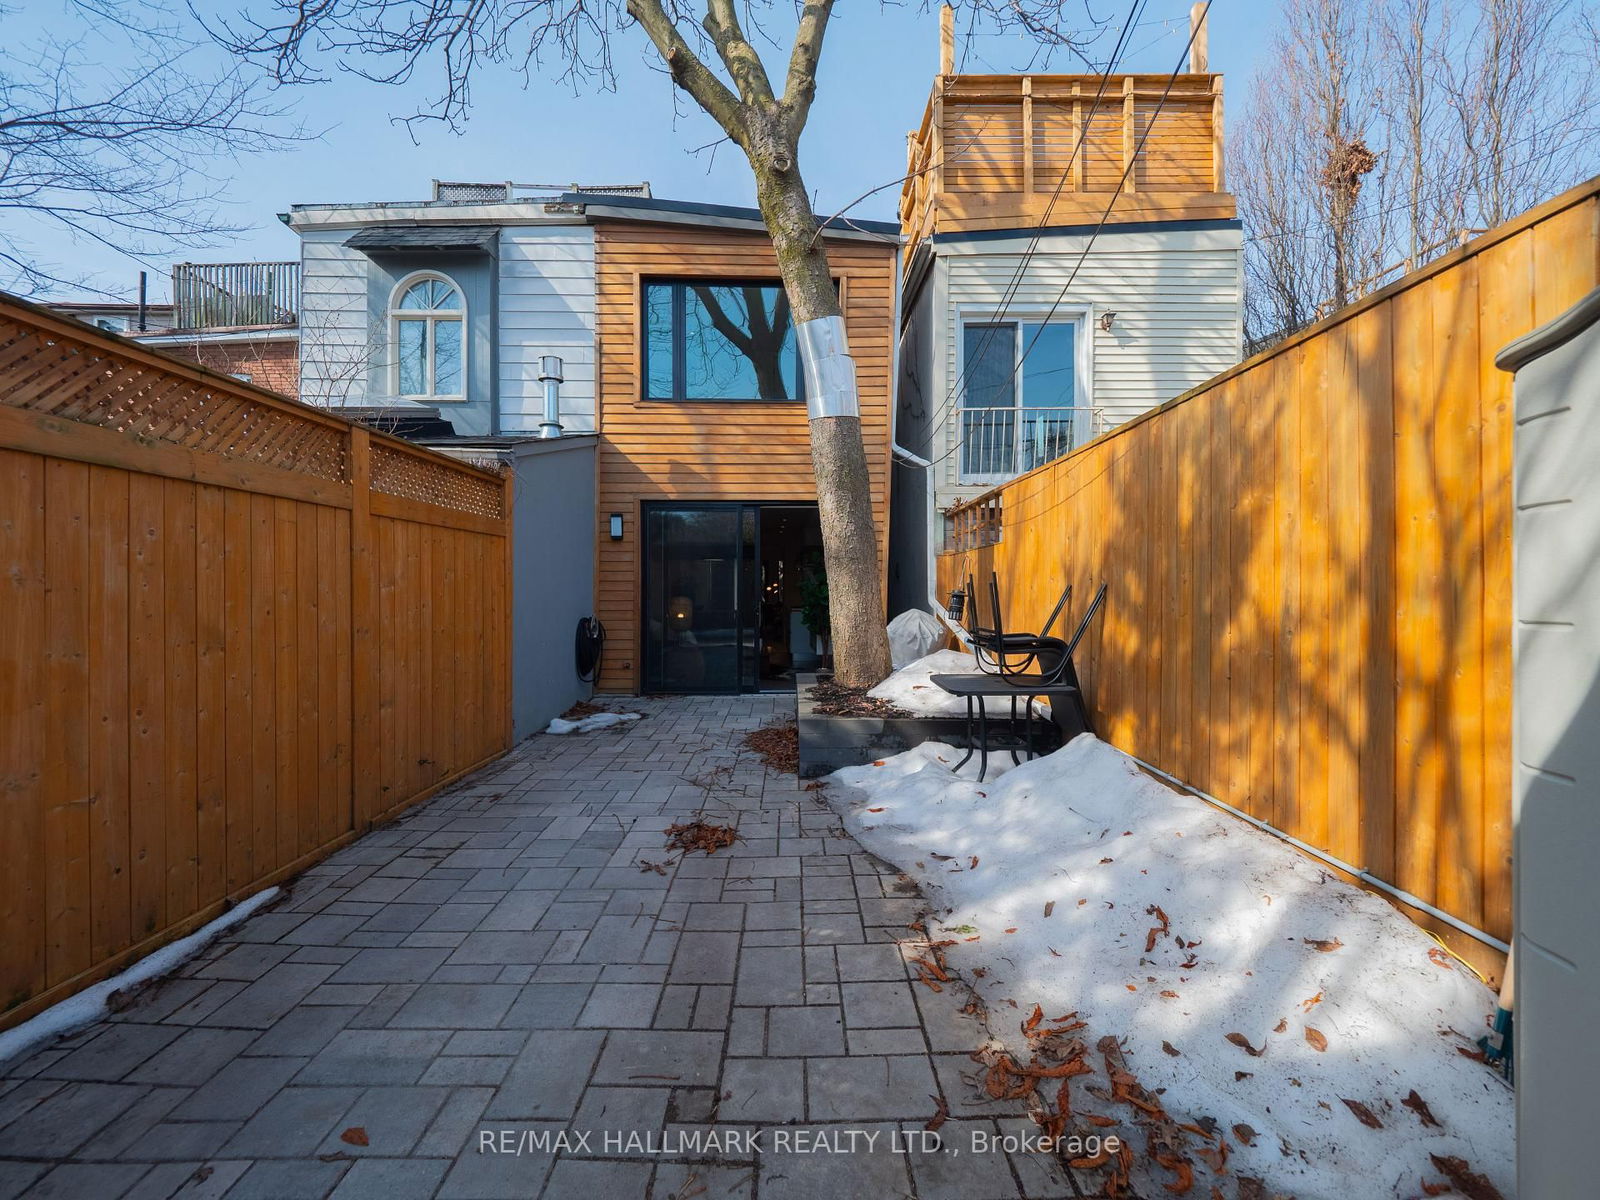
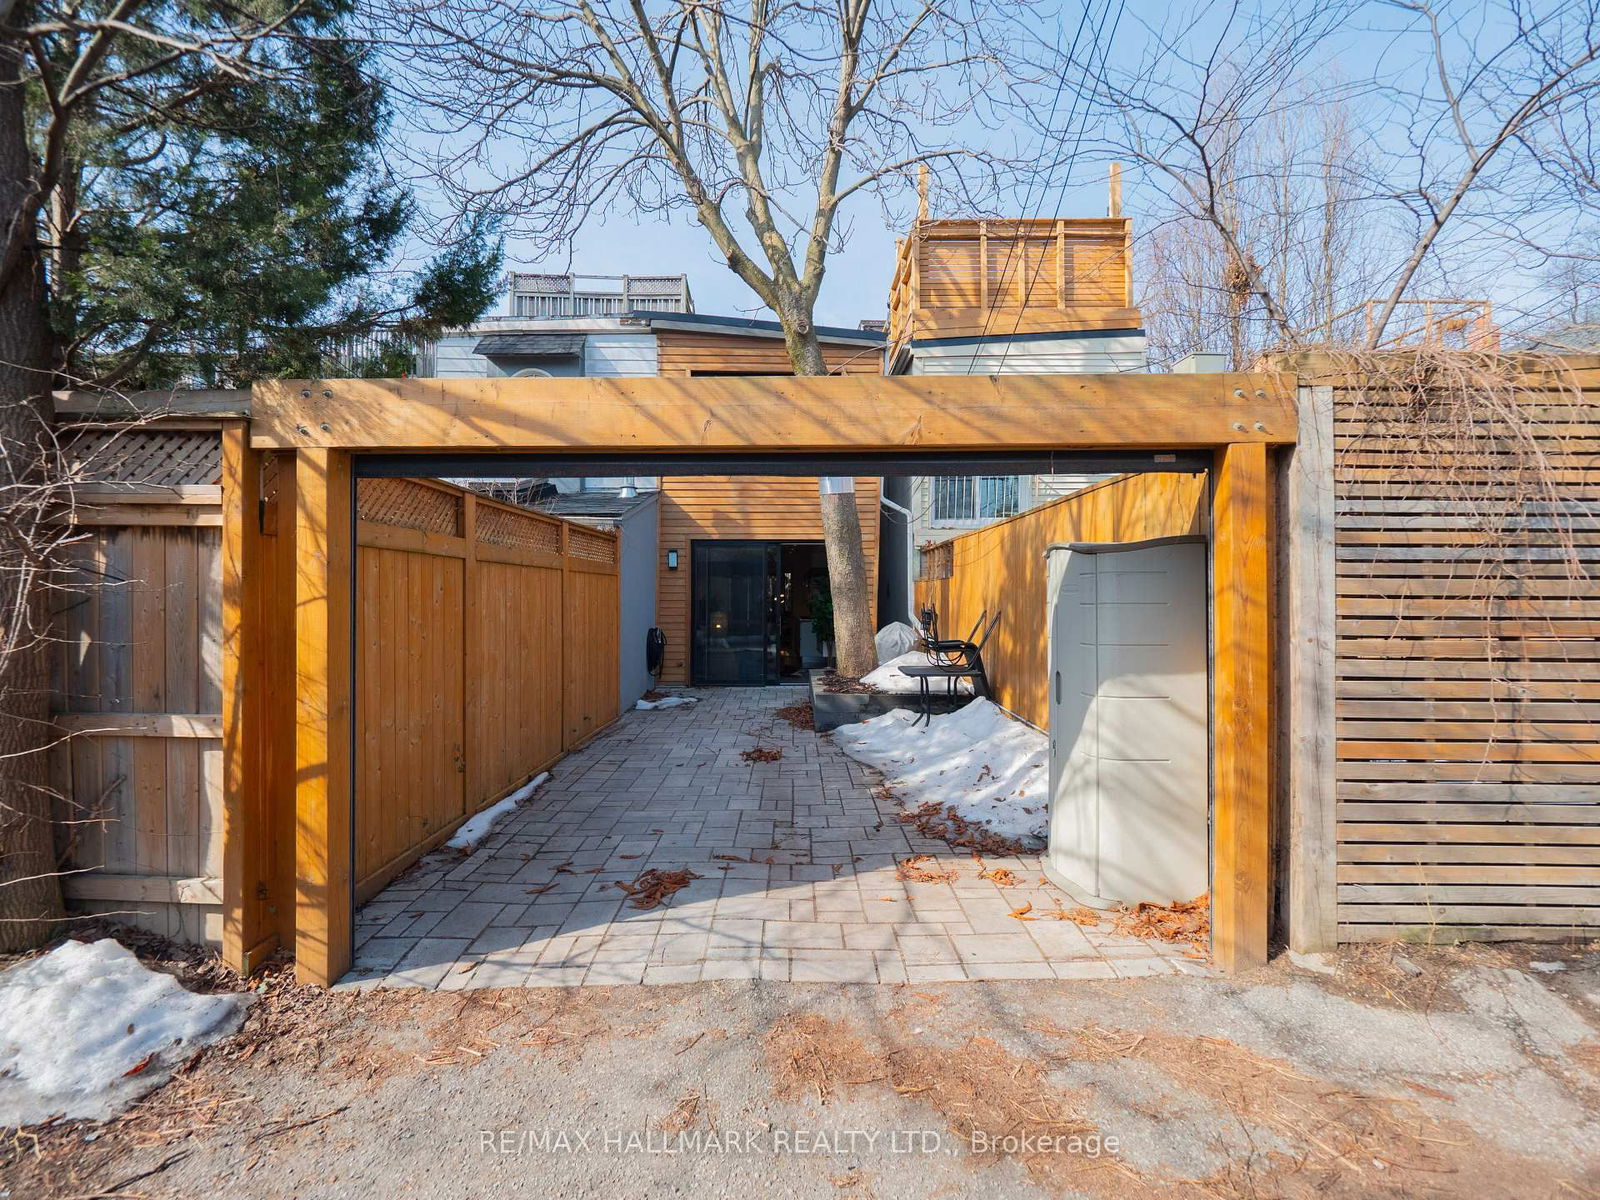
Welcome to 161 Pape Ave - A Leslieville Stunner! This spectacularly renovated Victorian is a true showstopper, blending classic charm with modern luxury in prime Leslieville. From the moment you step inside, you'll be captivated by its high-end finishes, open-concept design, and seamless indoor-outdoor flow. Main Floor Perfection: Soaring high ceilings and hardwood floors throughout. Sleek Scavolini custom kitchen with top-tier stainless steel appliances. A rare main floor family room with floor-to-ceiling glass doors leading to a private, professionally landscaped backyard. A Powder room for added convenience. Laneway parking with a Kimble roller garage door. A Second Floor Retreat: A Stunning floating staircase leading up to the private quarters that feature a luxurious primary suite with vaulted ceilings, a walk-in closet, and a custom 4-piece spa-like ensuite. Second-floor laundry (because convenience is key!) Two additional bright and spacious bedrooms, This 3-bedroom, 3-bathroom masterpiece is the definition of turn-key living, exuding warmth, style, and sophistication at every turn. We're completely gaga for this home- and we think you will be too! Offers Leslieville's Best: Walk to the best coffee shops, restaurants, parks, and transit. Bruce Public School & Riverdale Collegiate School District. Don't miss your chance to own a piece of prime East End real estate! Lets get you in for a private tour, you will be happy you did.
S/S Bosch gas cook top, Jennair built-in wall oven, Miele fridge, integrated Miele built-in dishwasher, Panasonic built-in microwave, s/s built-in wine fridge, Maytag front loading washer and dryer, GB&E, CAC, all electic light fixtures, all custom blinds, Kimble Roller Garage door (2019)
Living
Dining
Kitchen
Family
Primary
2nd Br
3rd Br
Loft
The graph below compares the average list price and average sale price of homes in this neighborhood by month for the last 24 months. When average sale price is greater than average list price, this may suggest a buyer's market. When average sale price is lower than the average list price this may suggest a seller's market.
The graph below illustrates the average days on market for homes in this neighborhood. The yellow area may indicate a buyer's market, the green area may indicate a balanced market and the red area may indicate a seller's market.
Sales Representative, Century 21 People’s Choice Realty Inc., Brokerage
(647) 576 - 2100
Toronto, Waterfront Communities C8, M5A 4C9