

Century 21 People’s Choice Realty Inc., Brokerage
120 MATHESON BLVD E #103
MISSISSAUGA, Ontario
L4Z 1X1


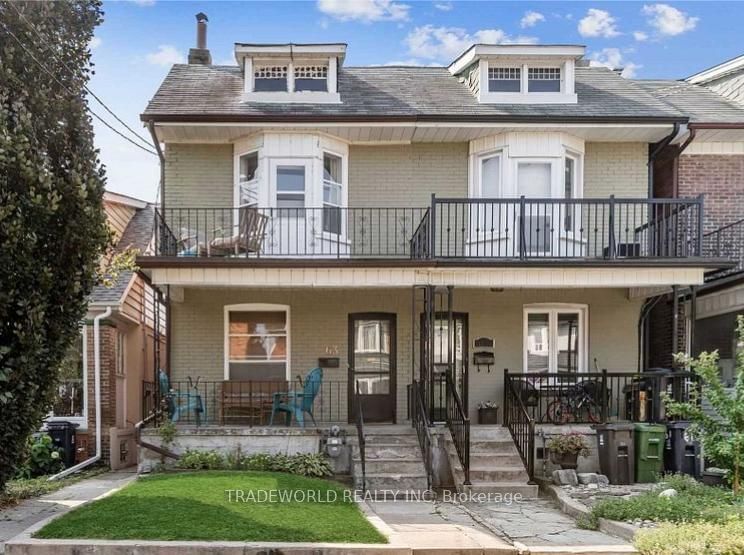
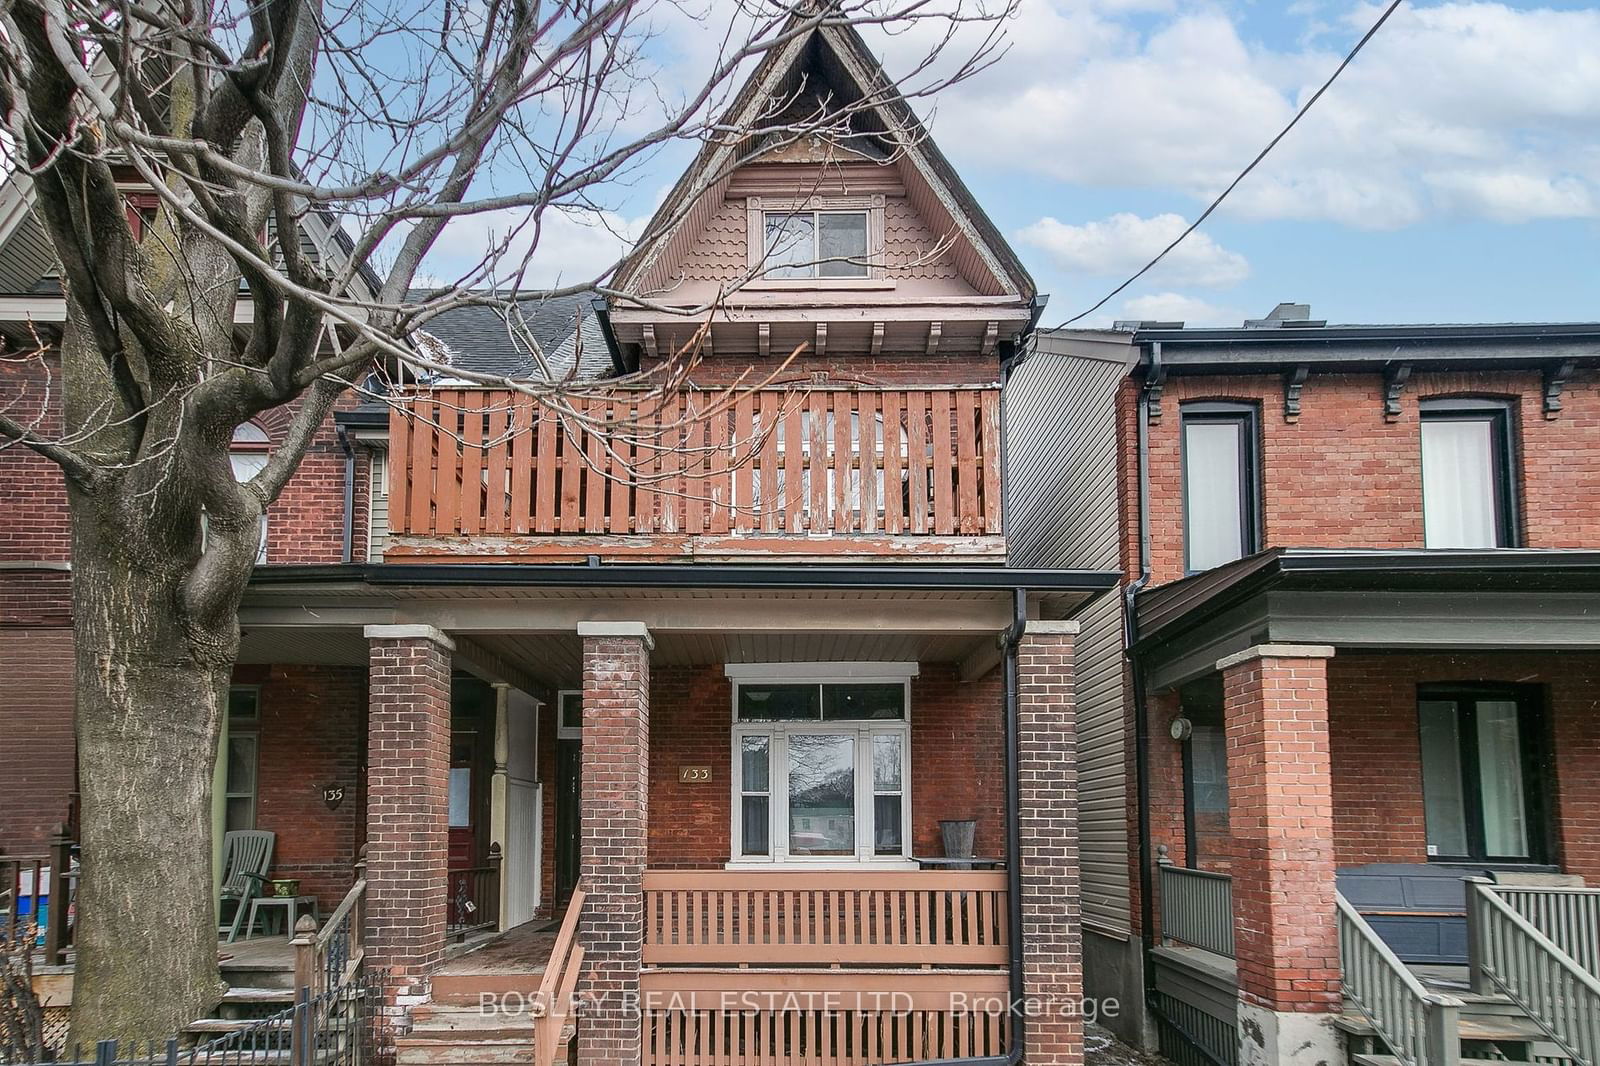
Toronto, Playter Estates-Danforth, M4K 1W2
$1,499,000
Listed by RE/MAX HALLMARK REALTY LTD..
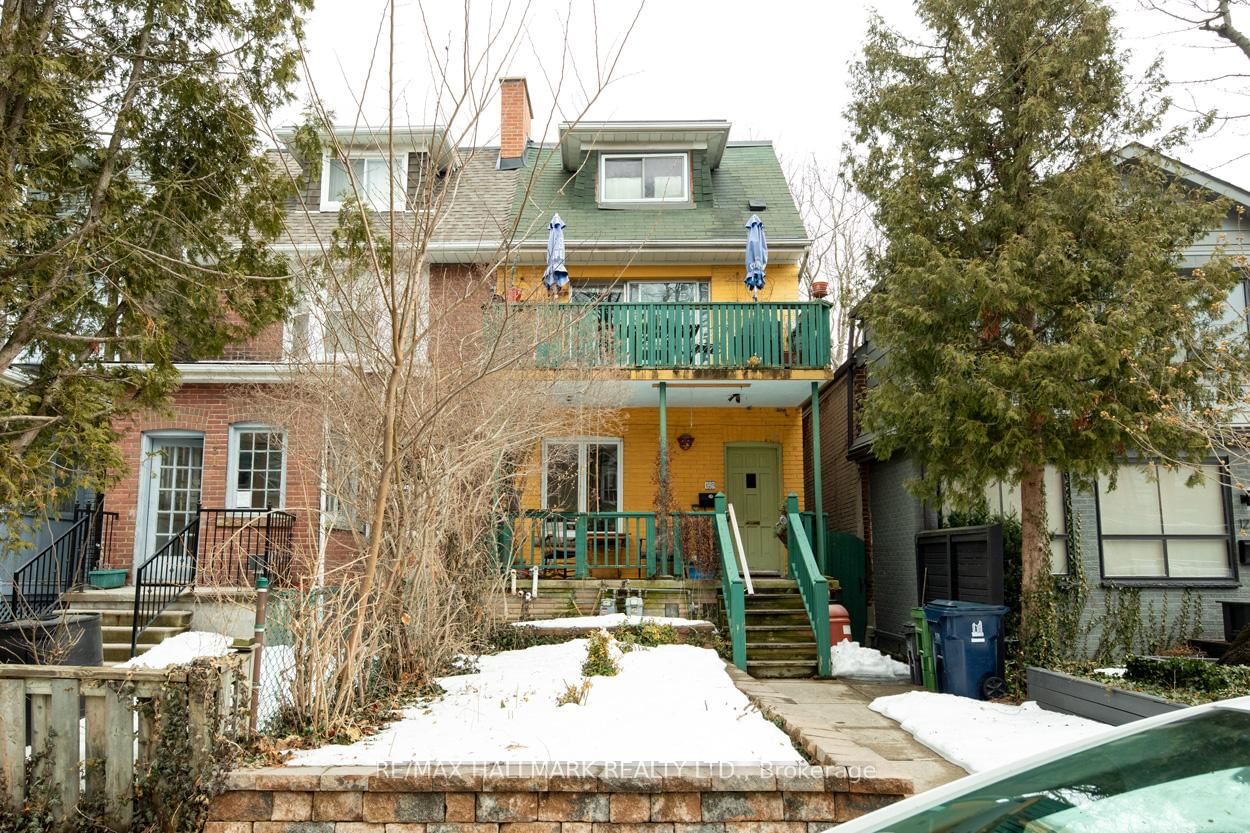
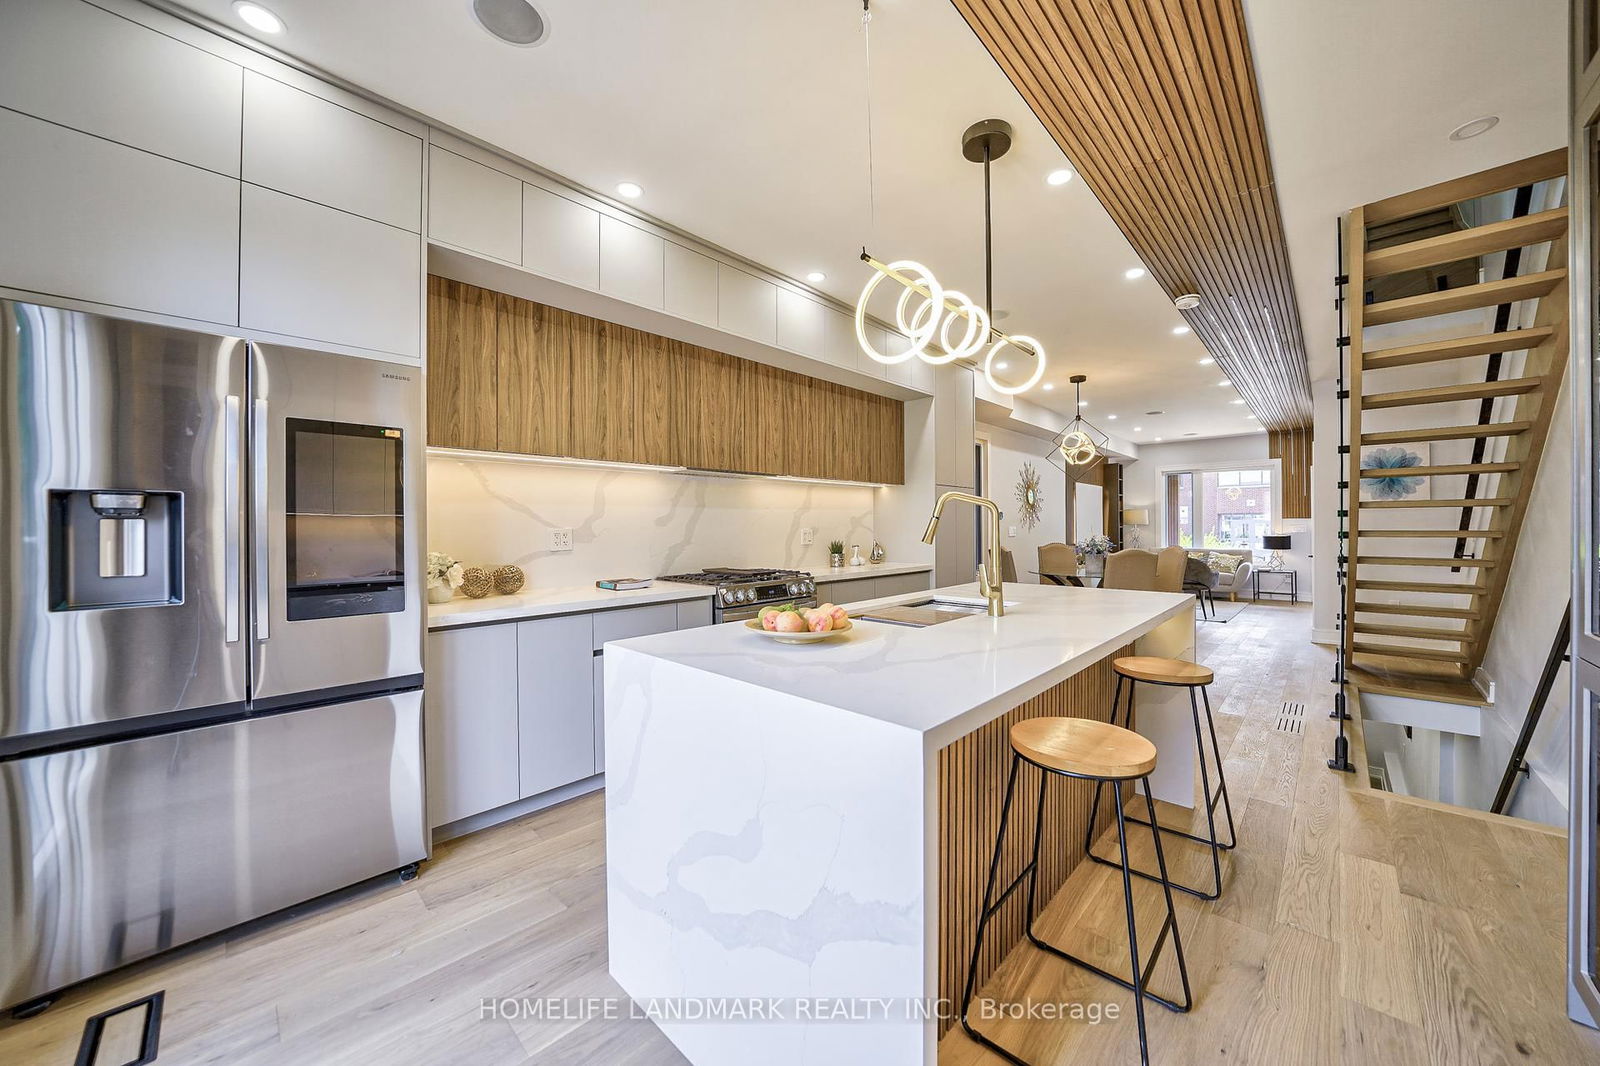
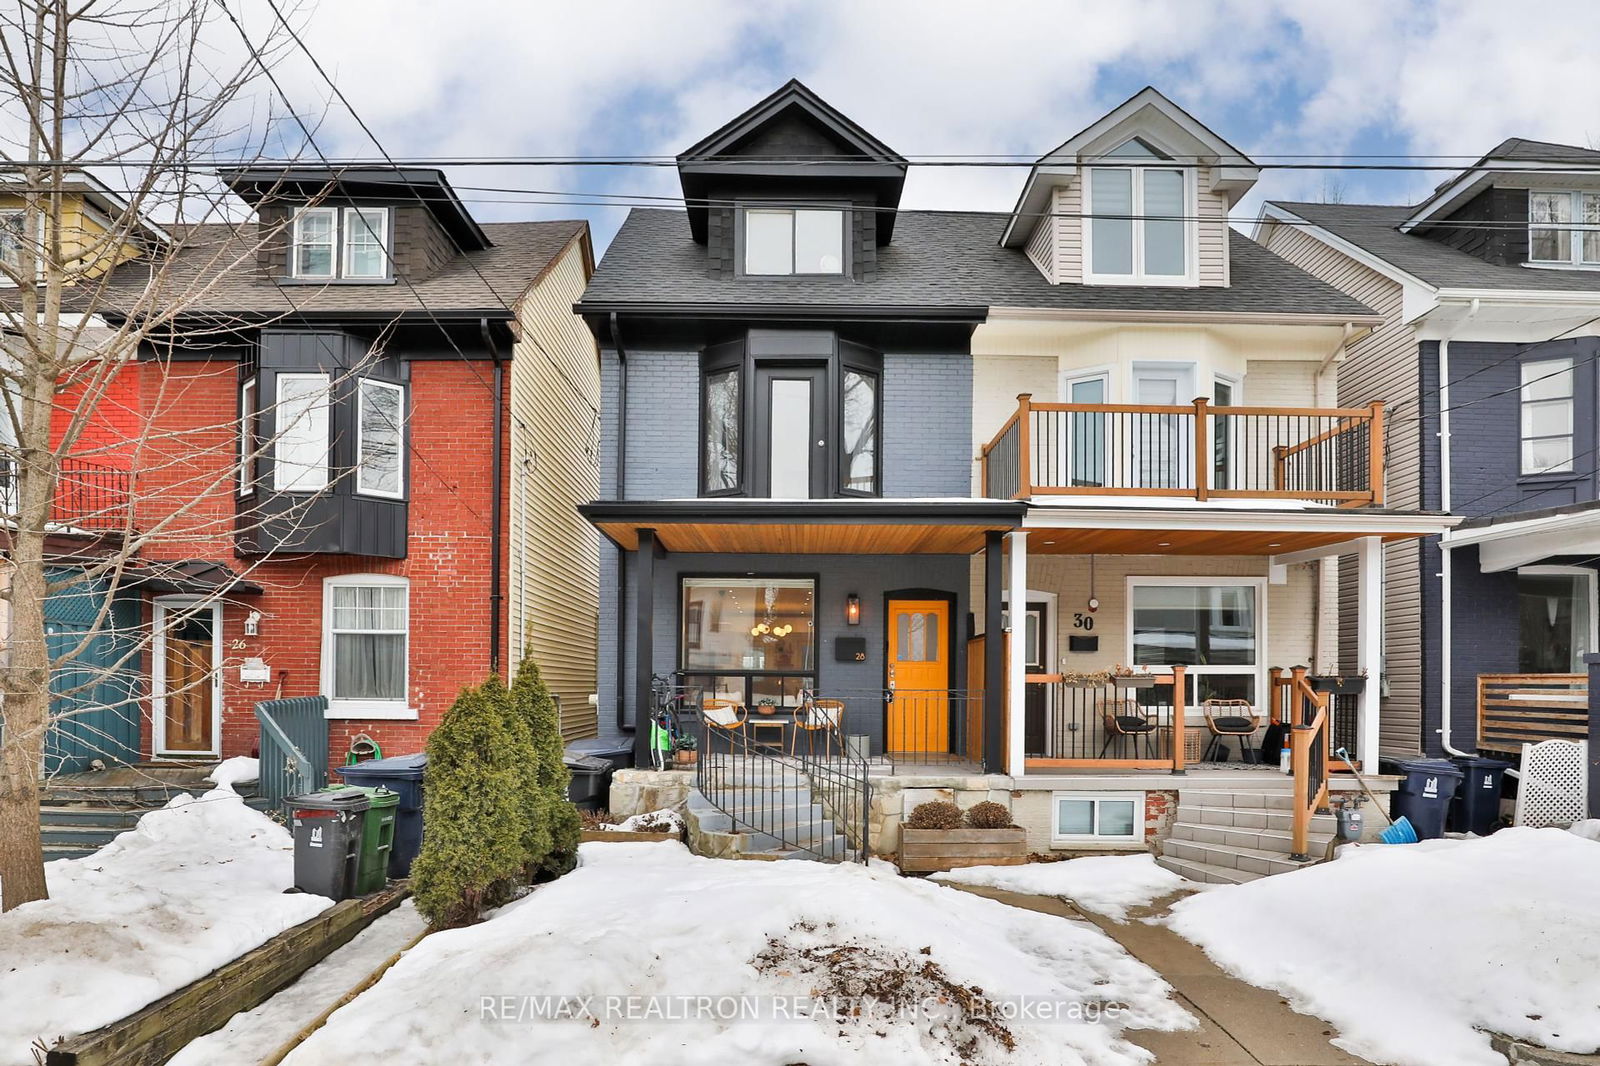
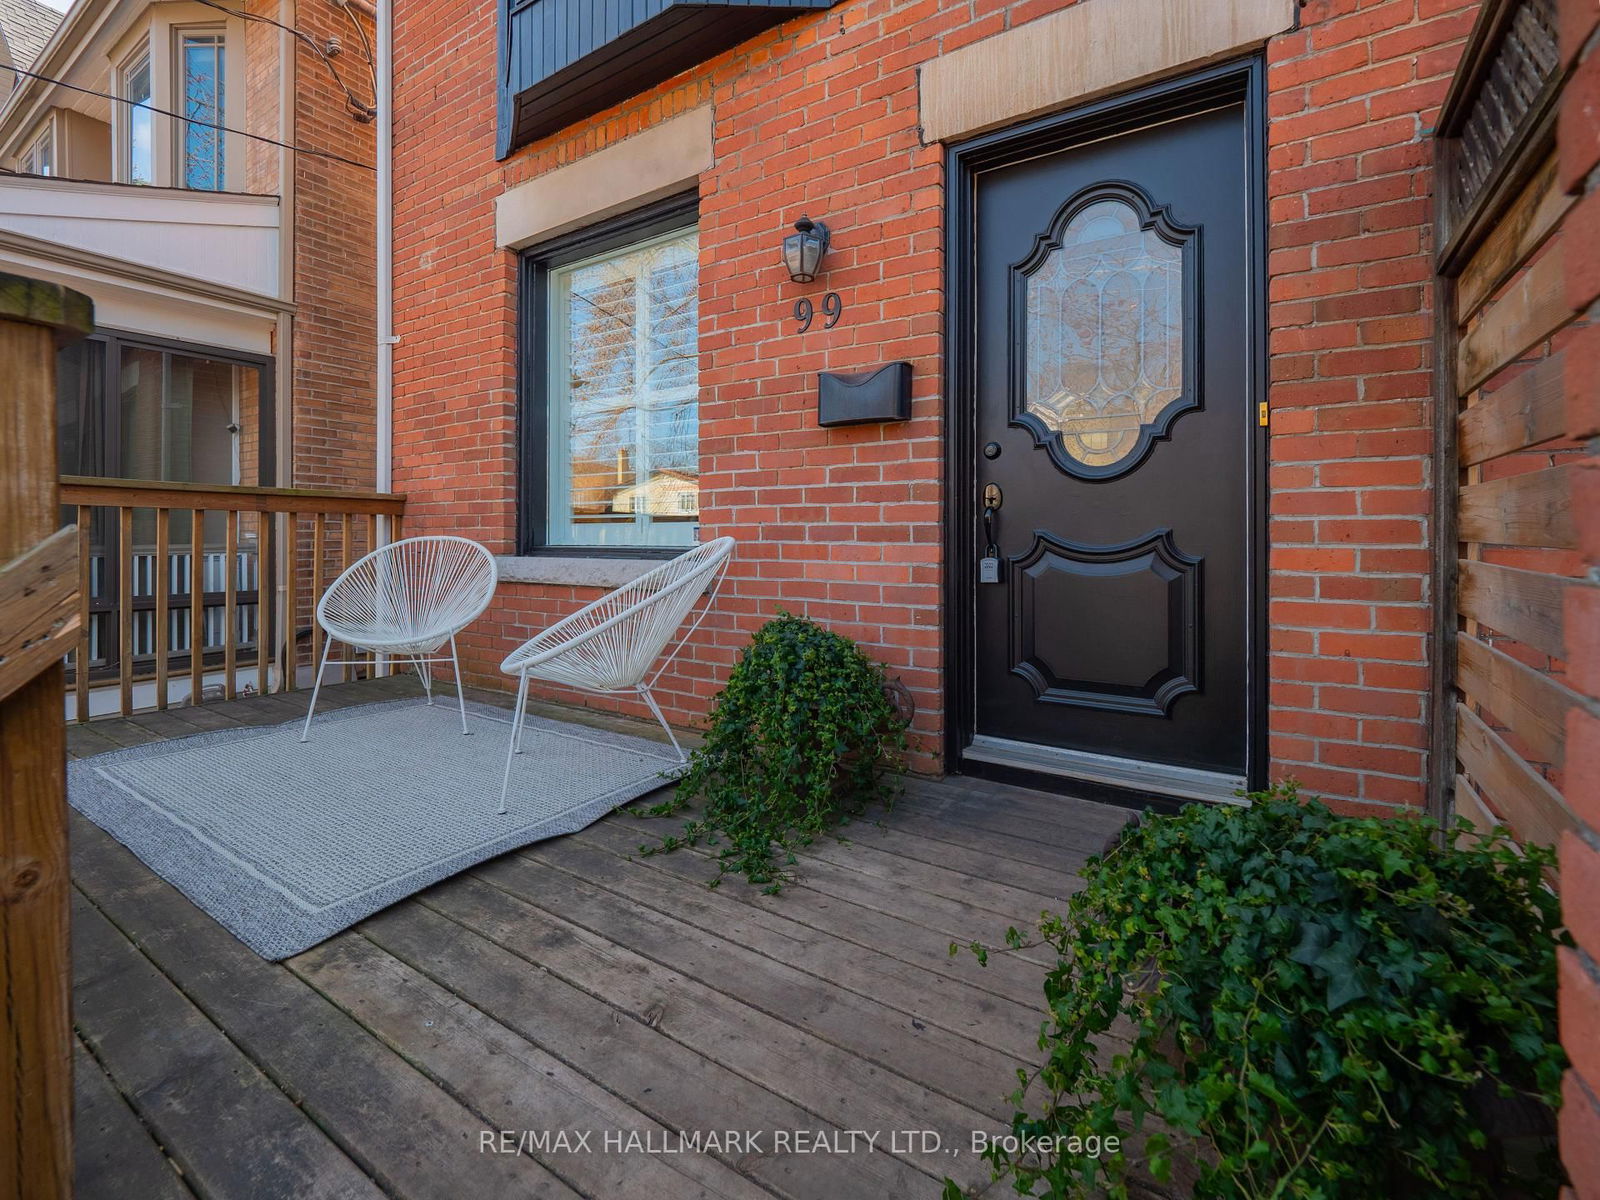
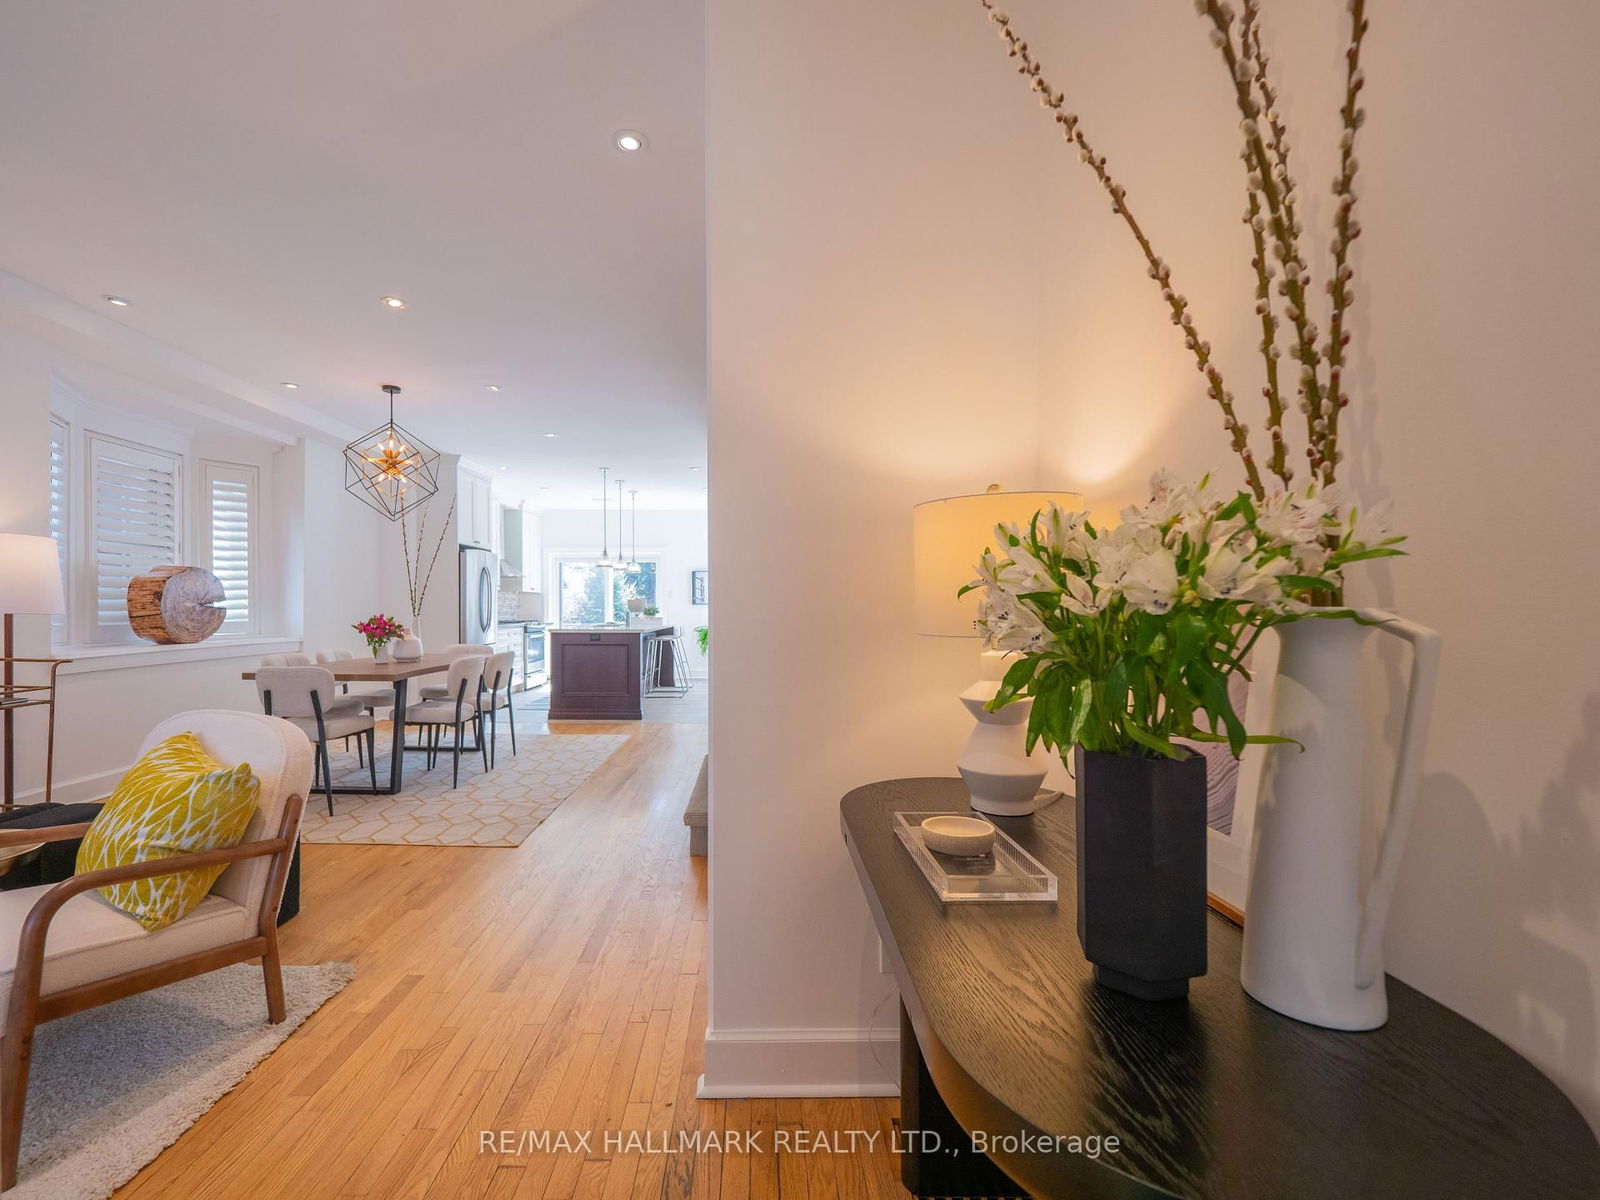
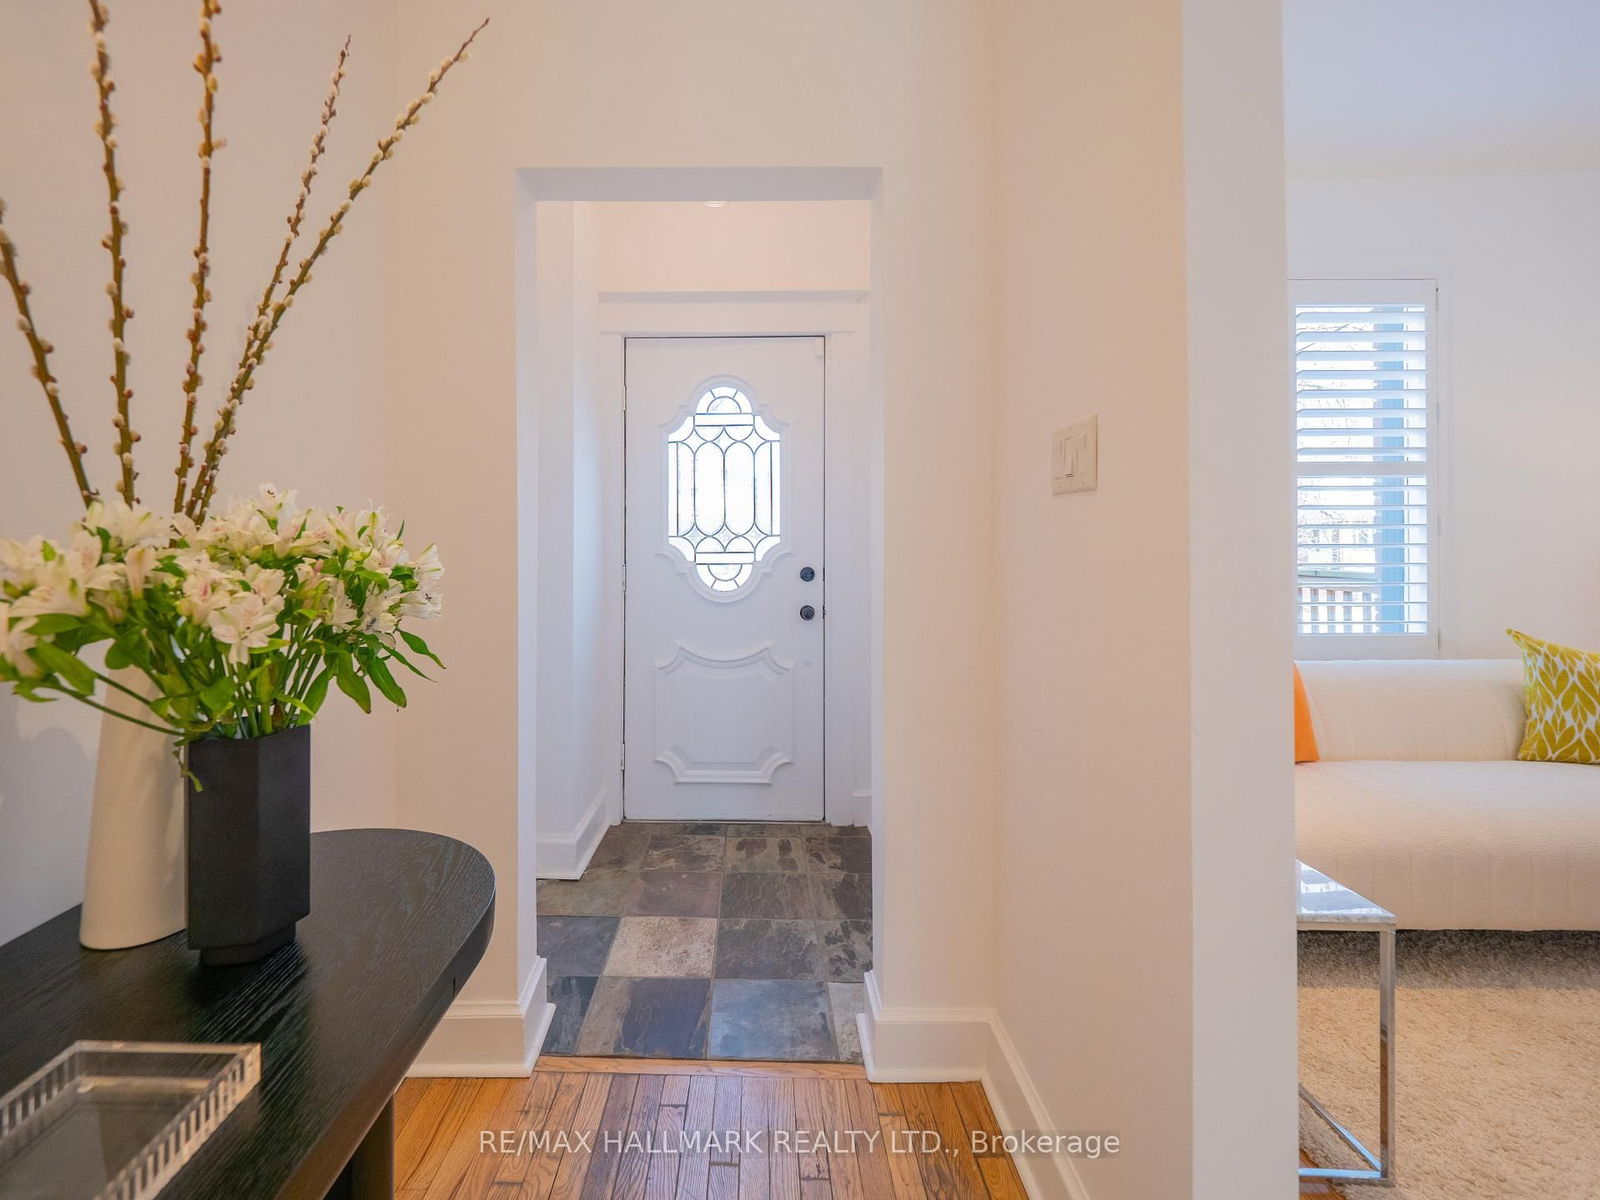
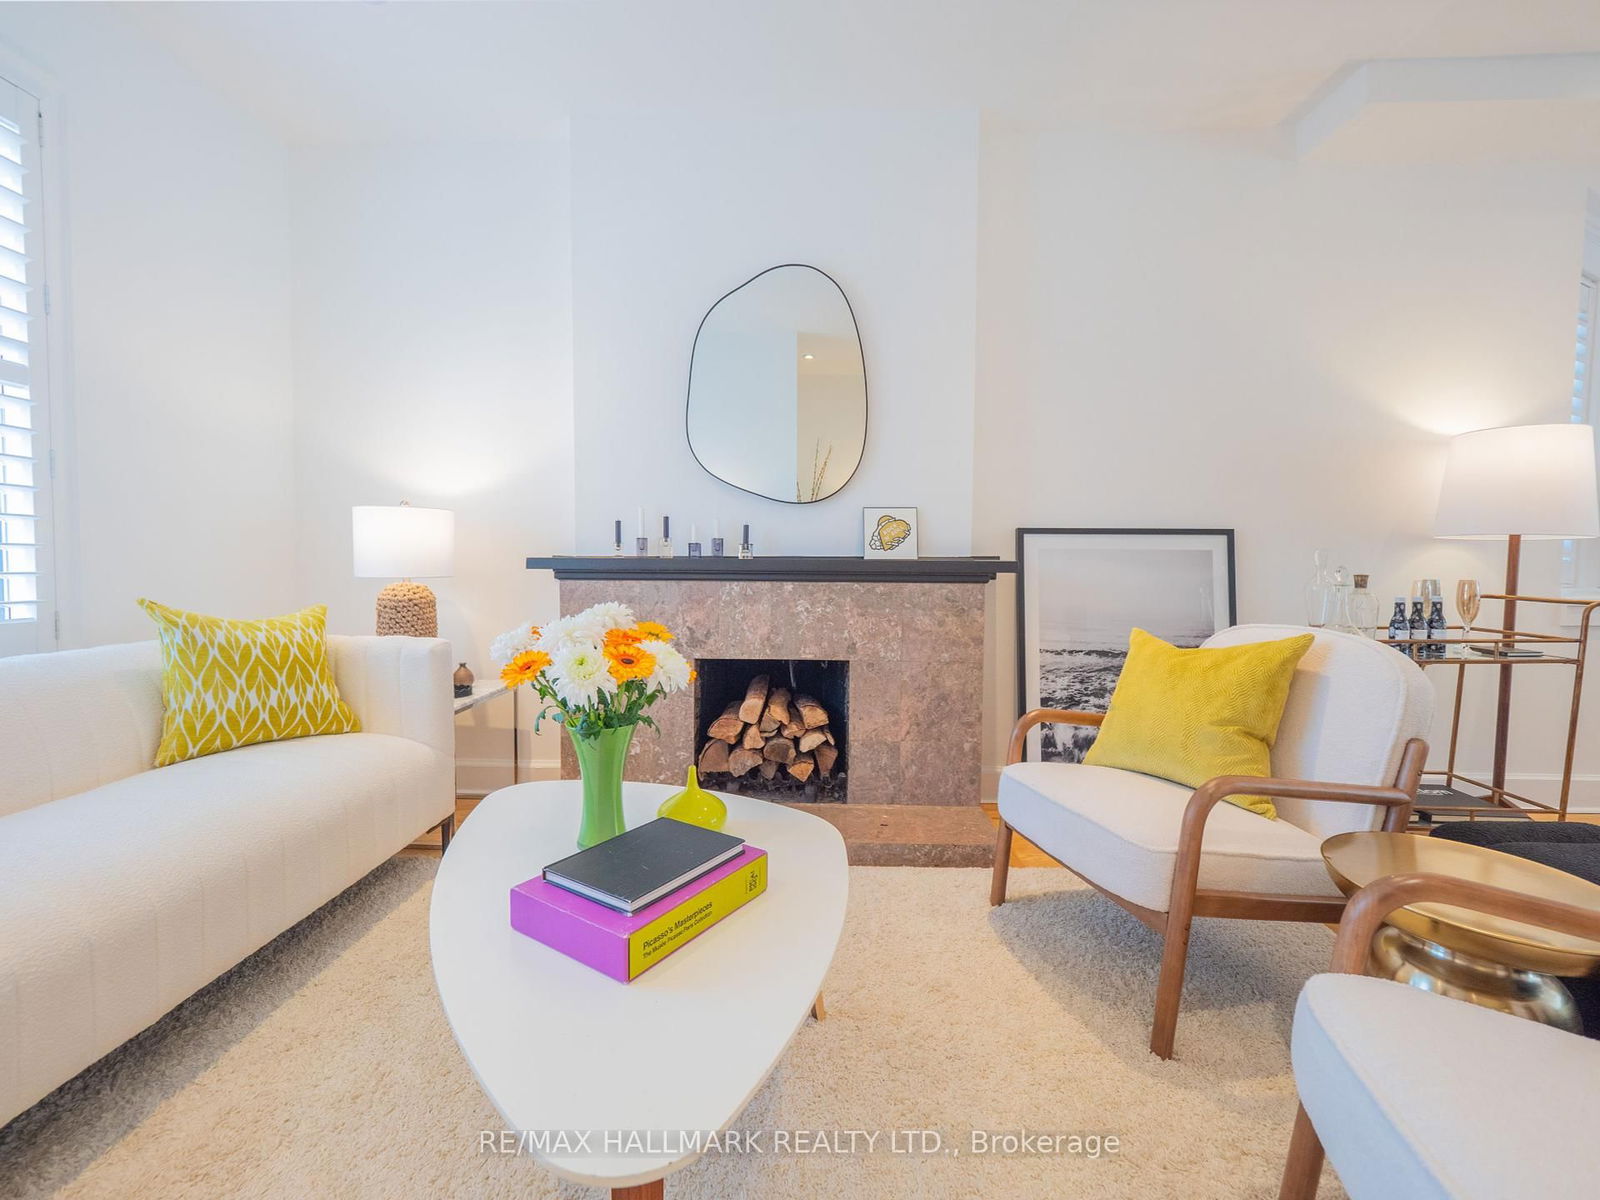
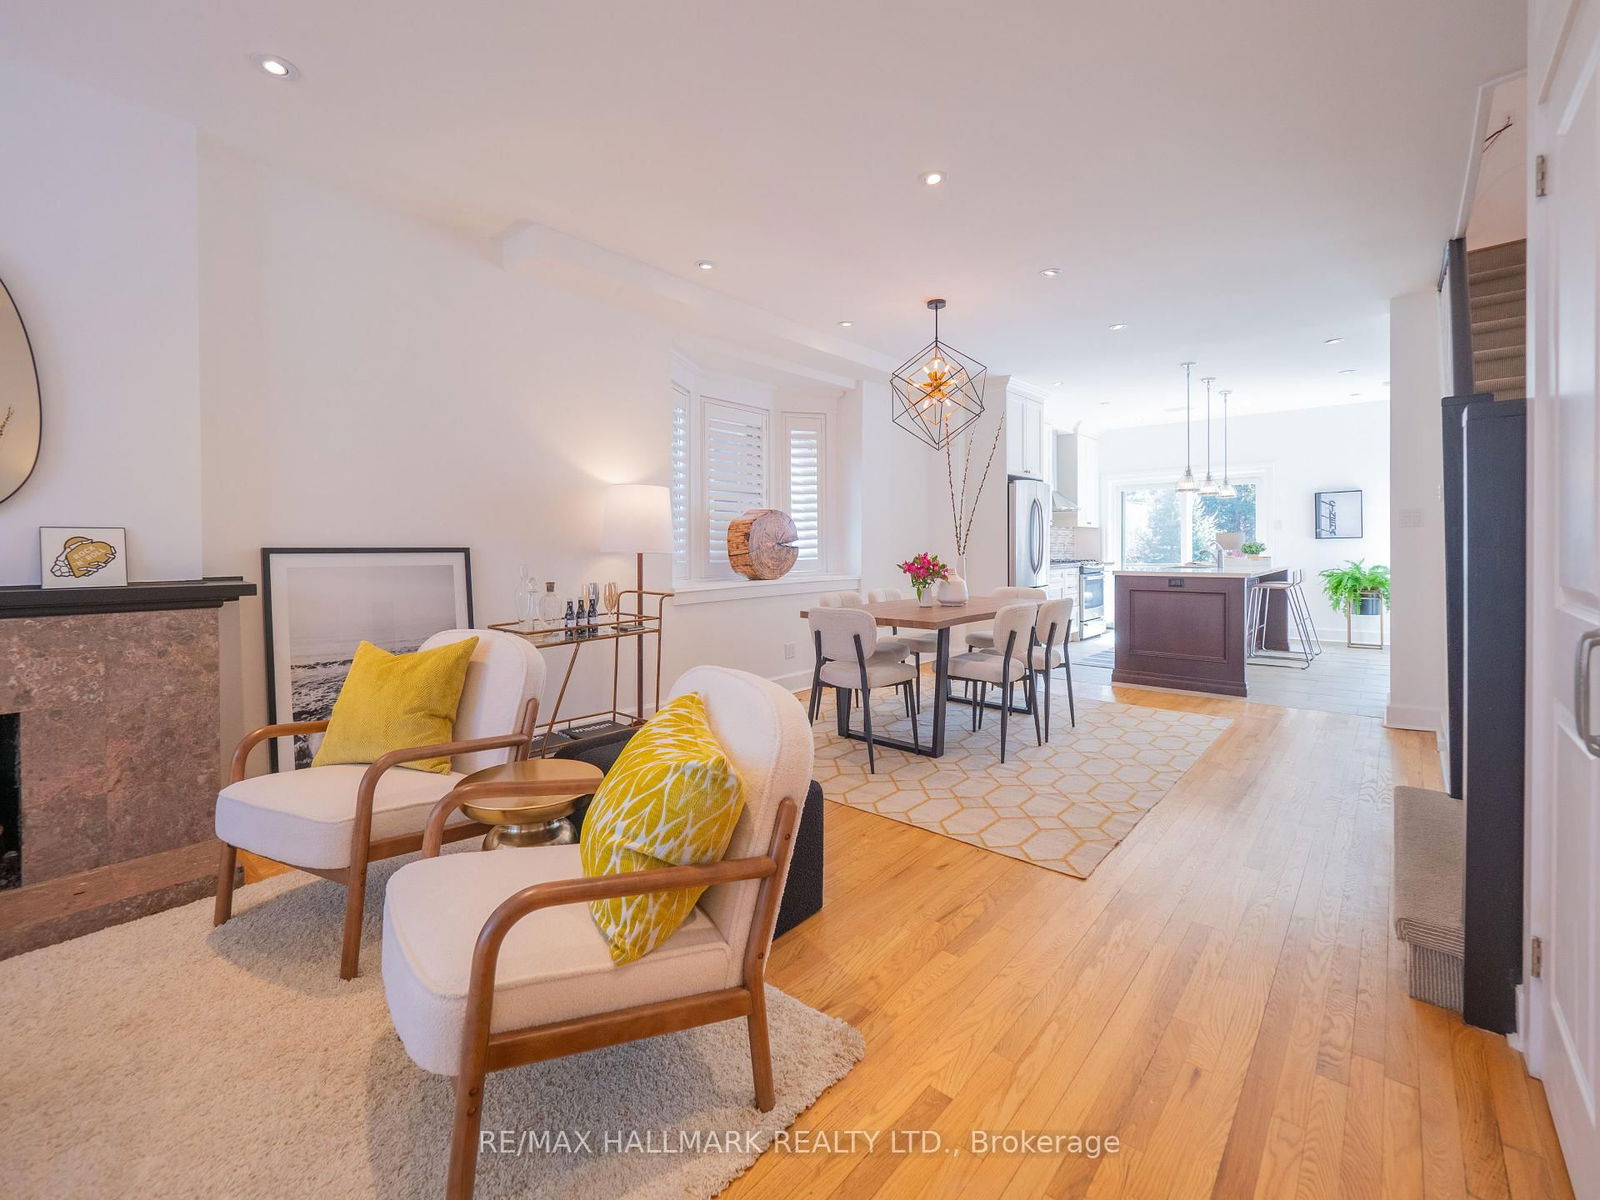
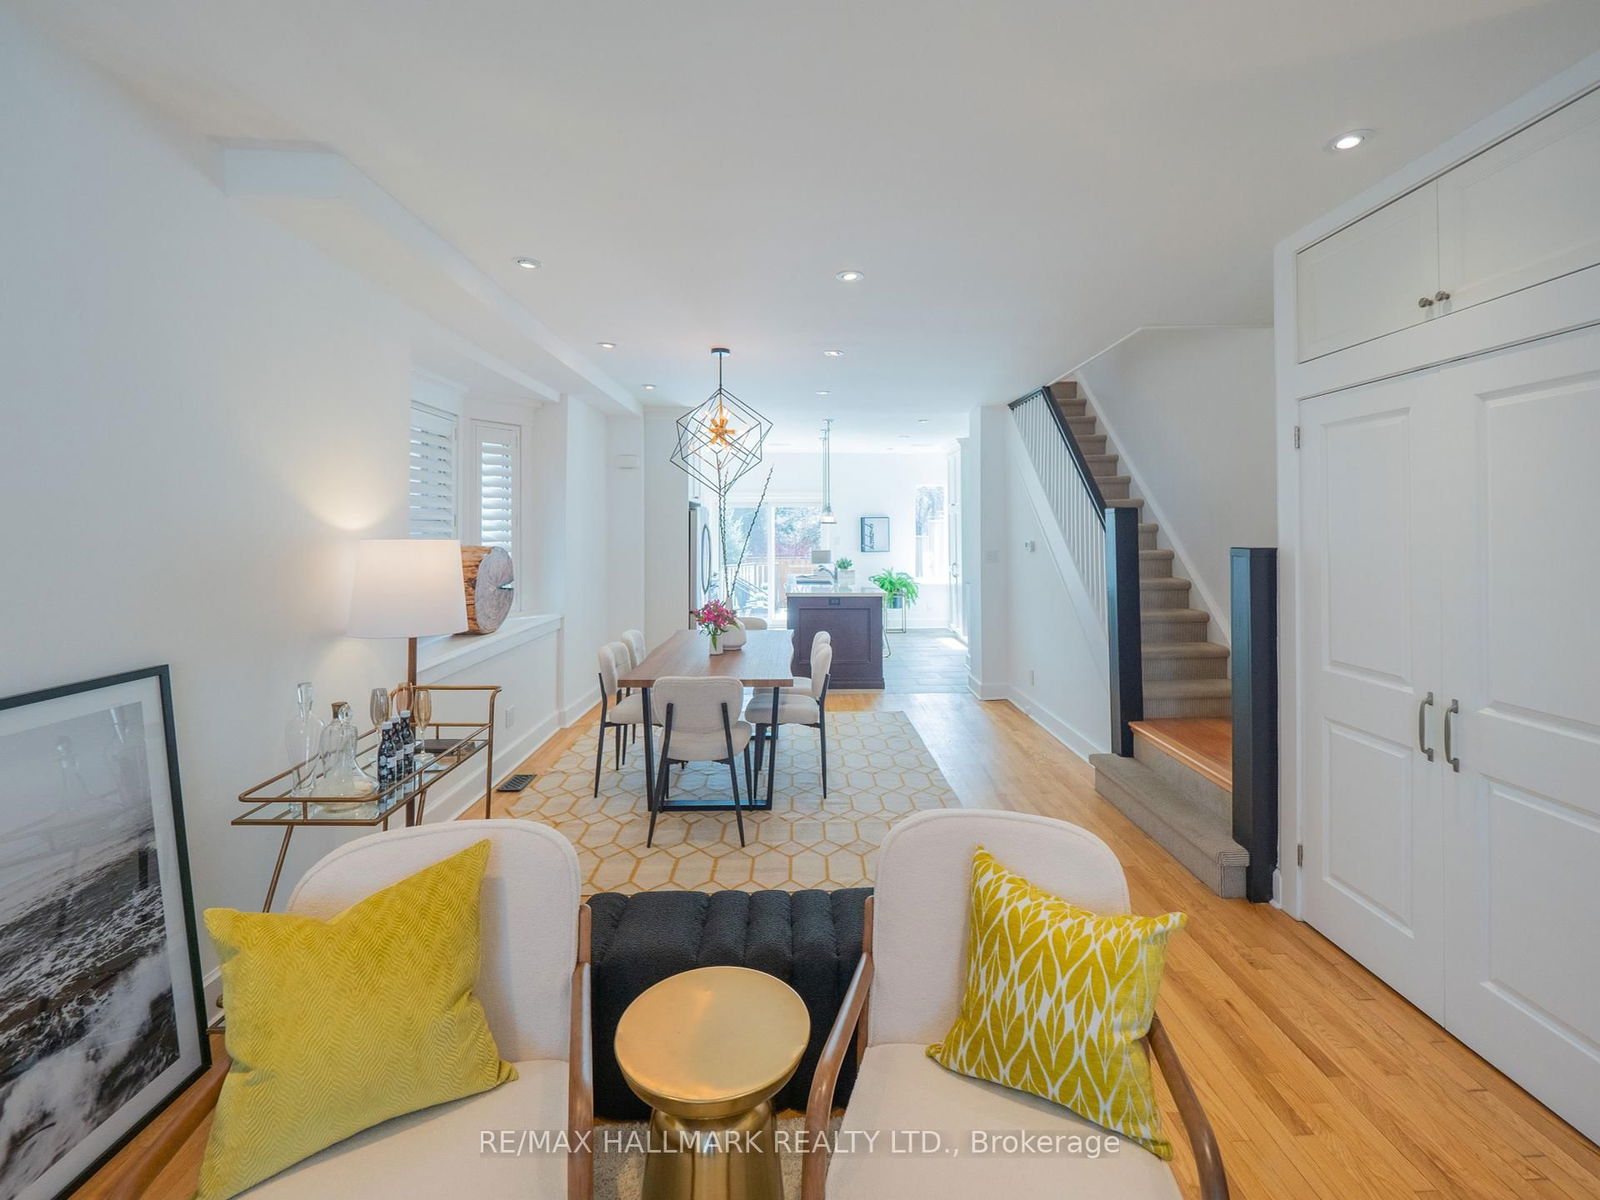
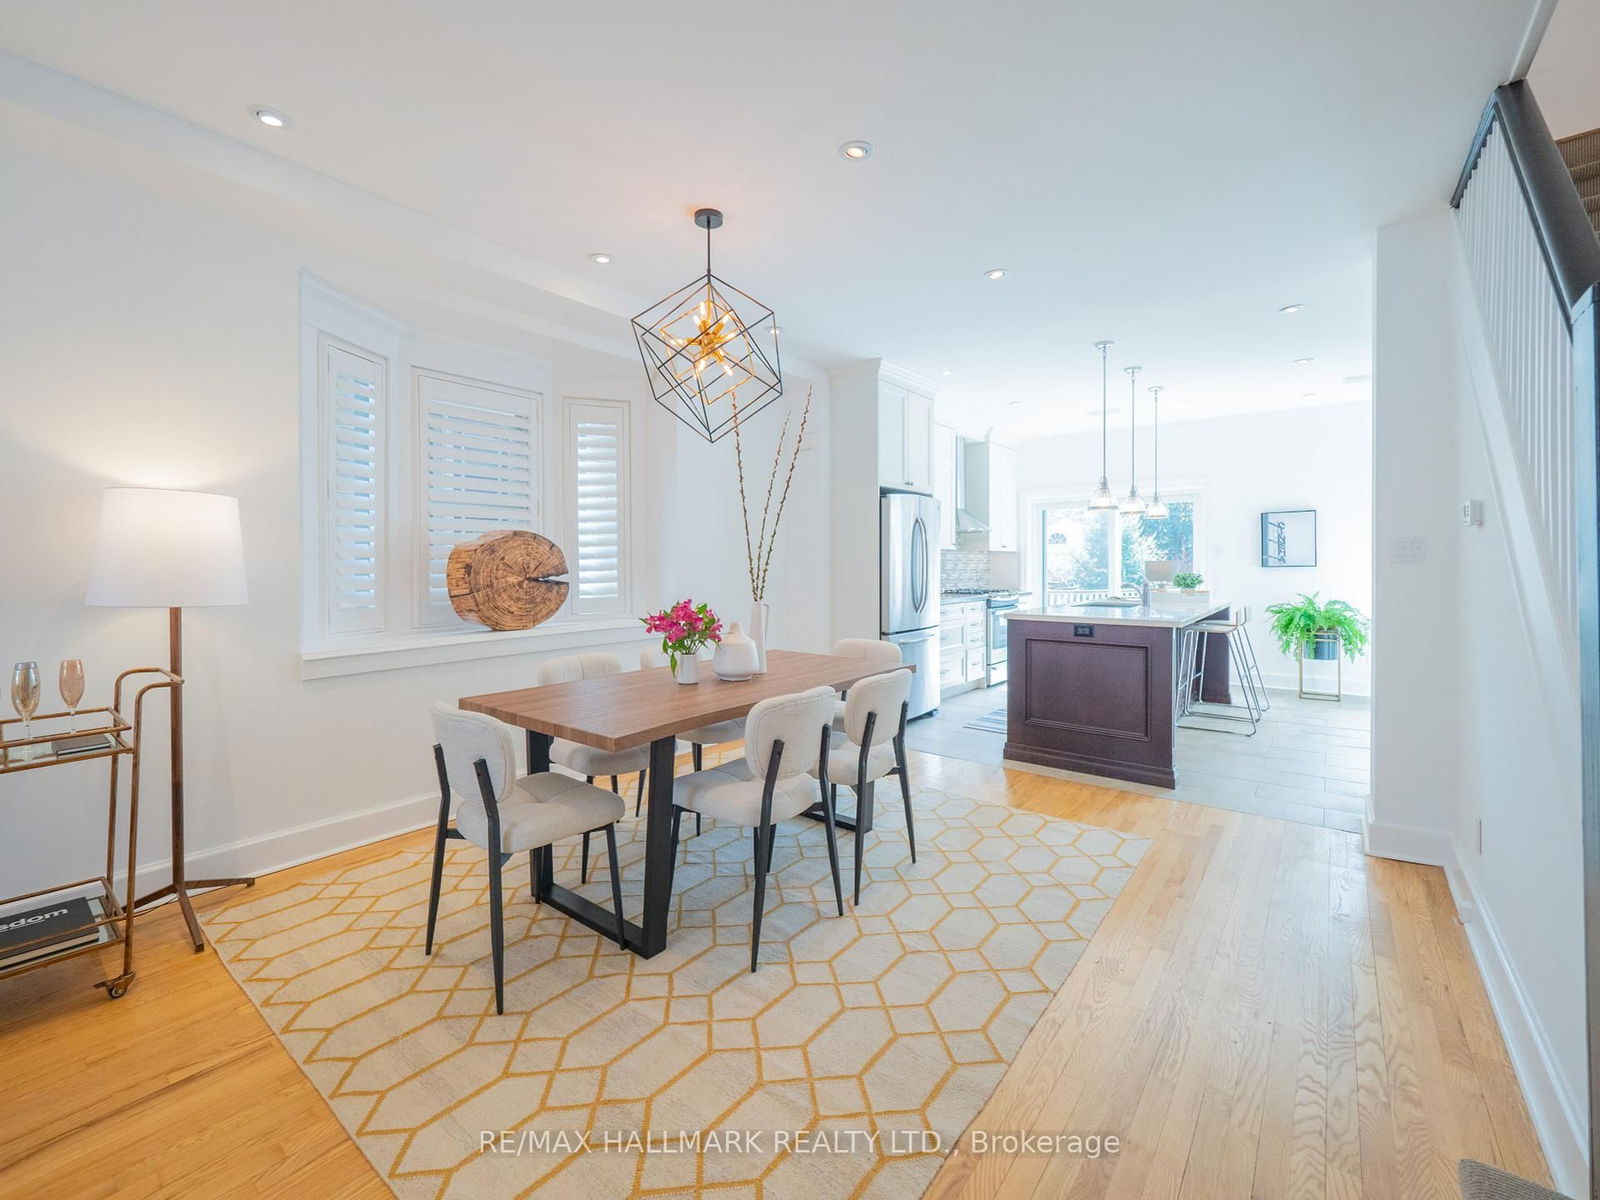
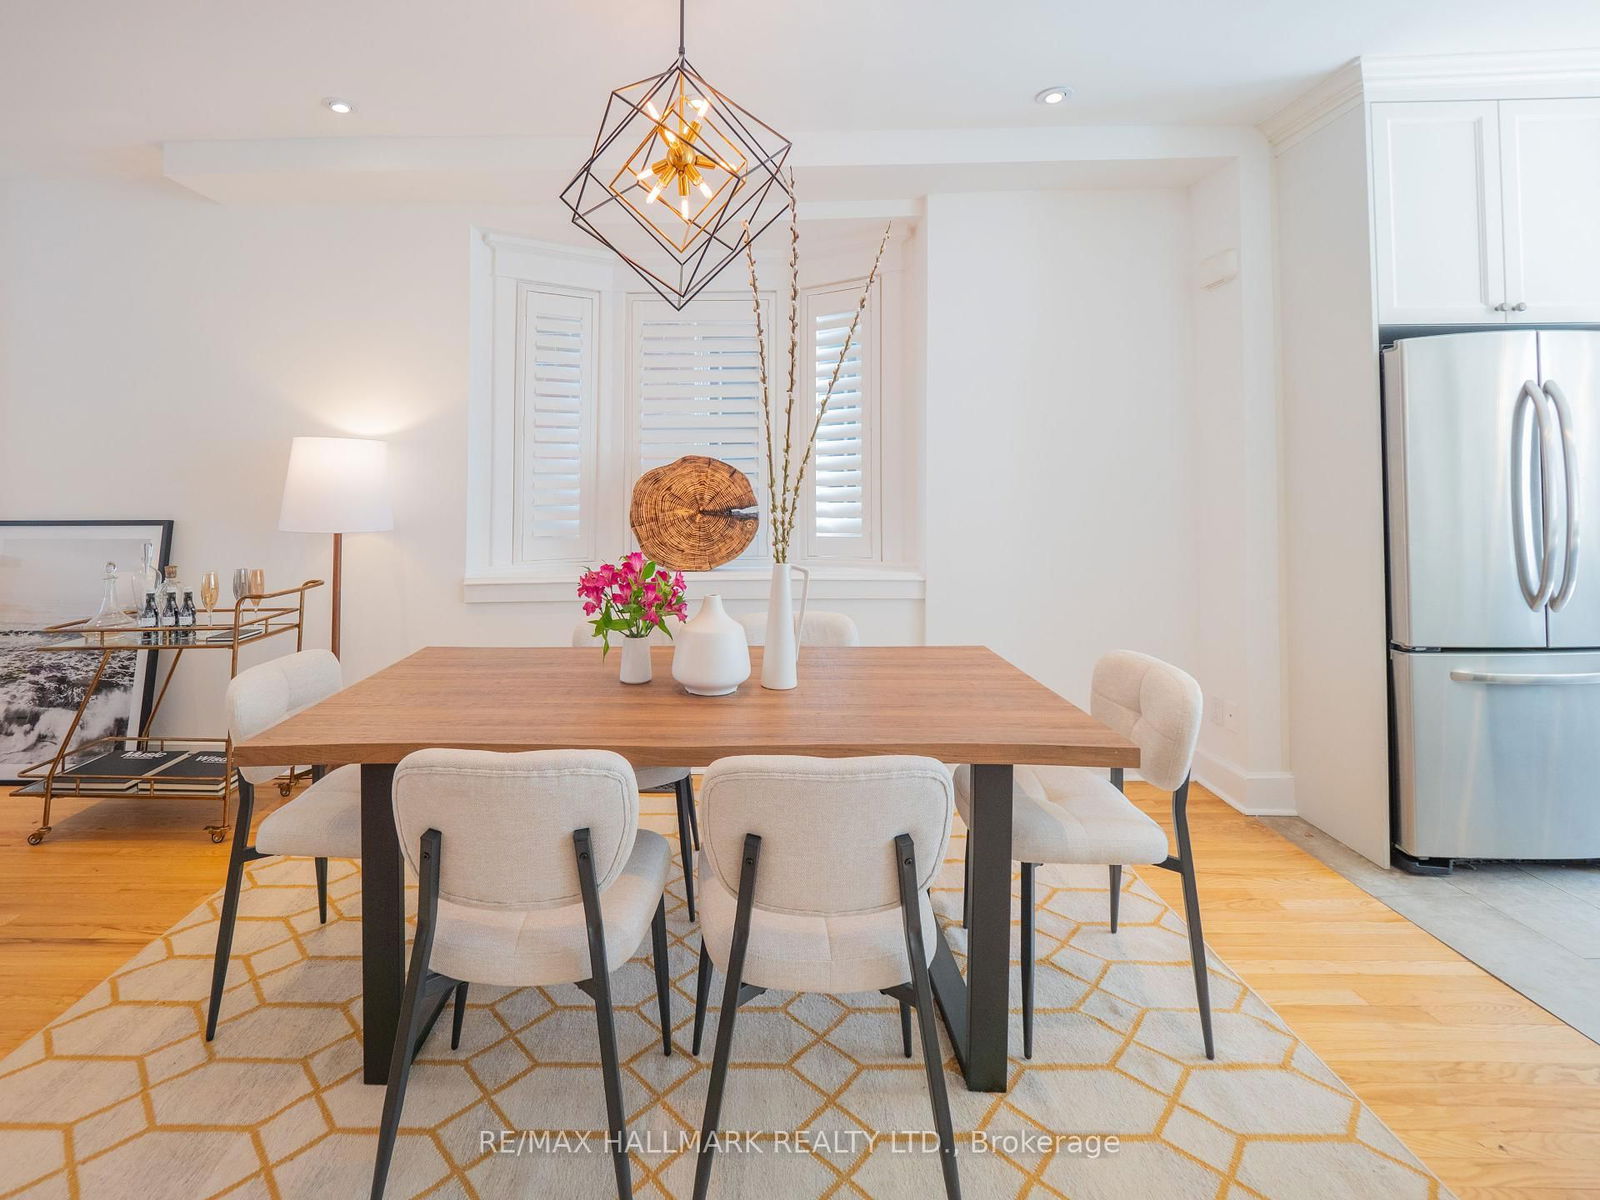
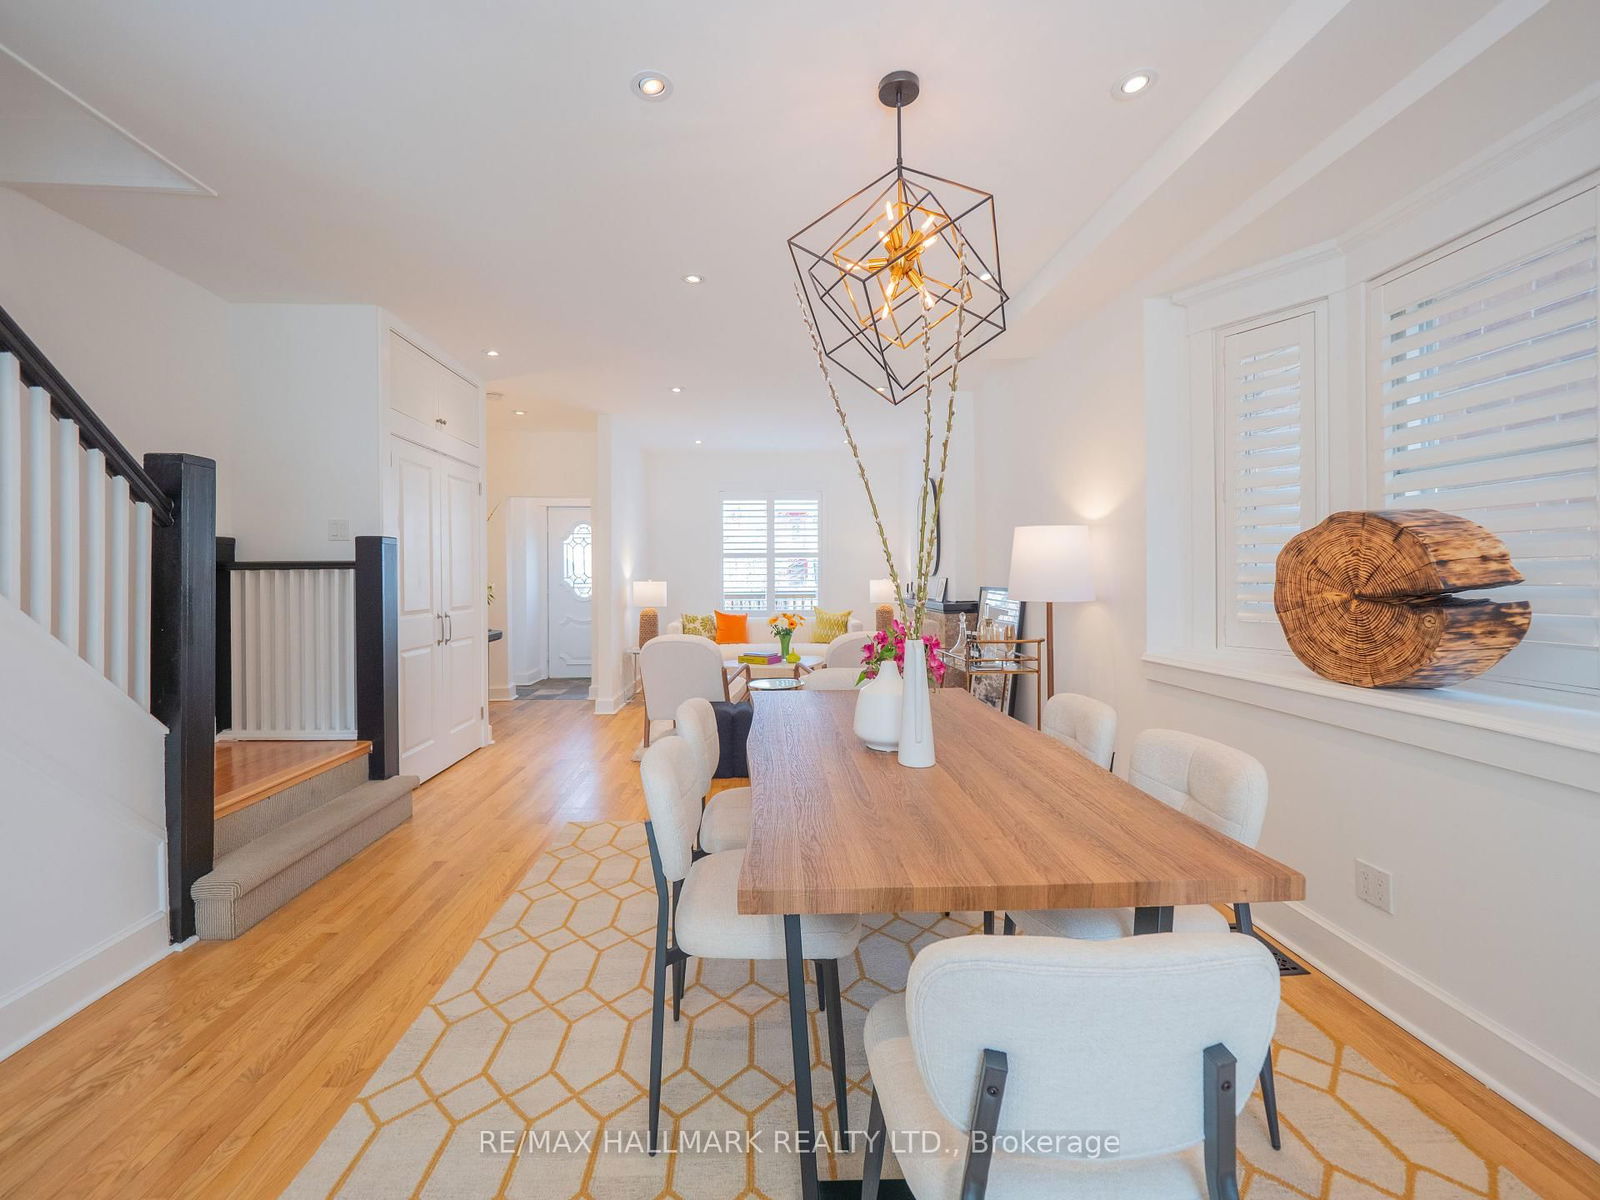
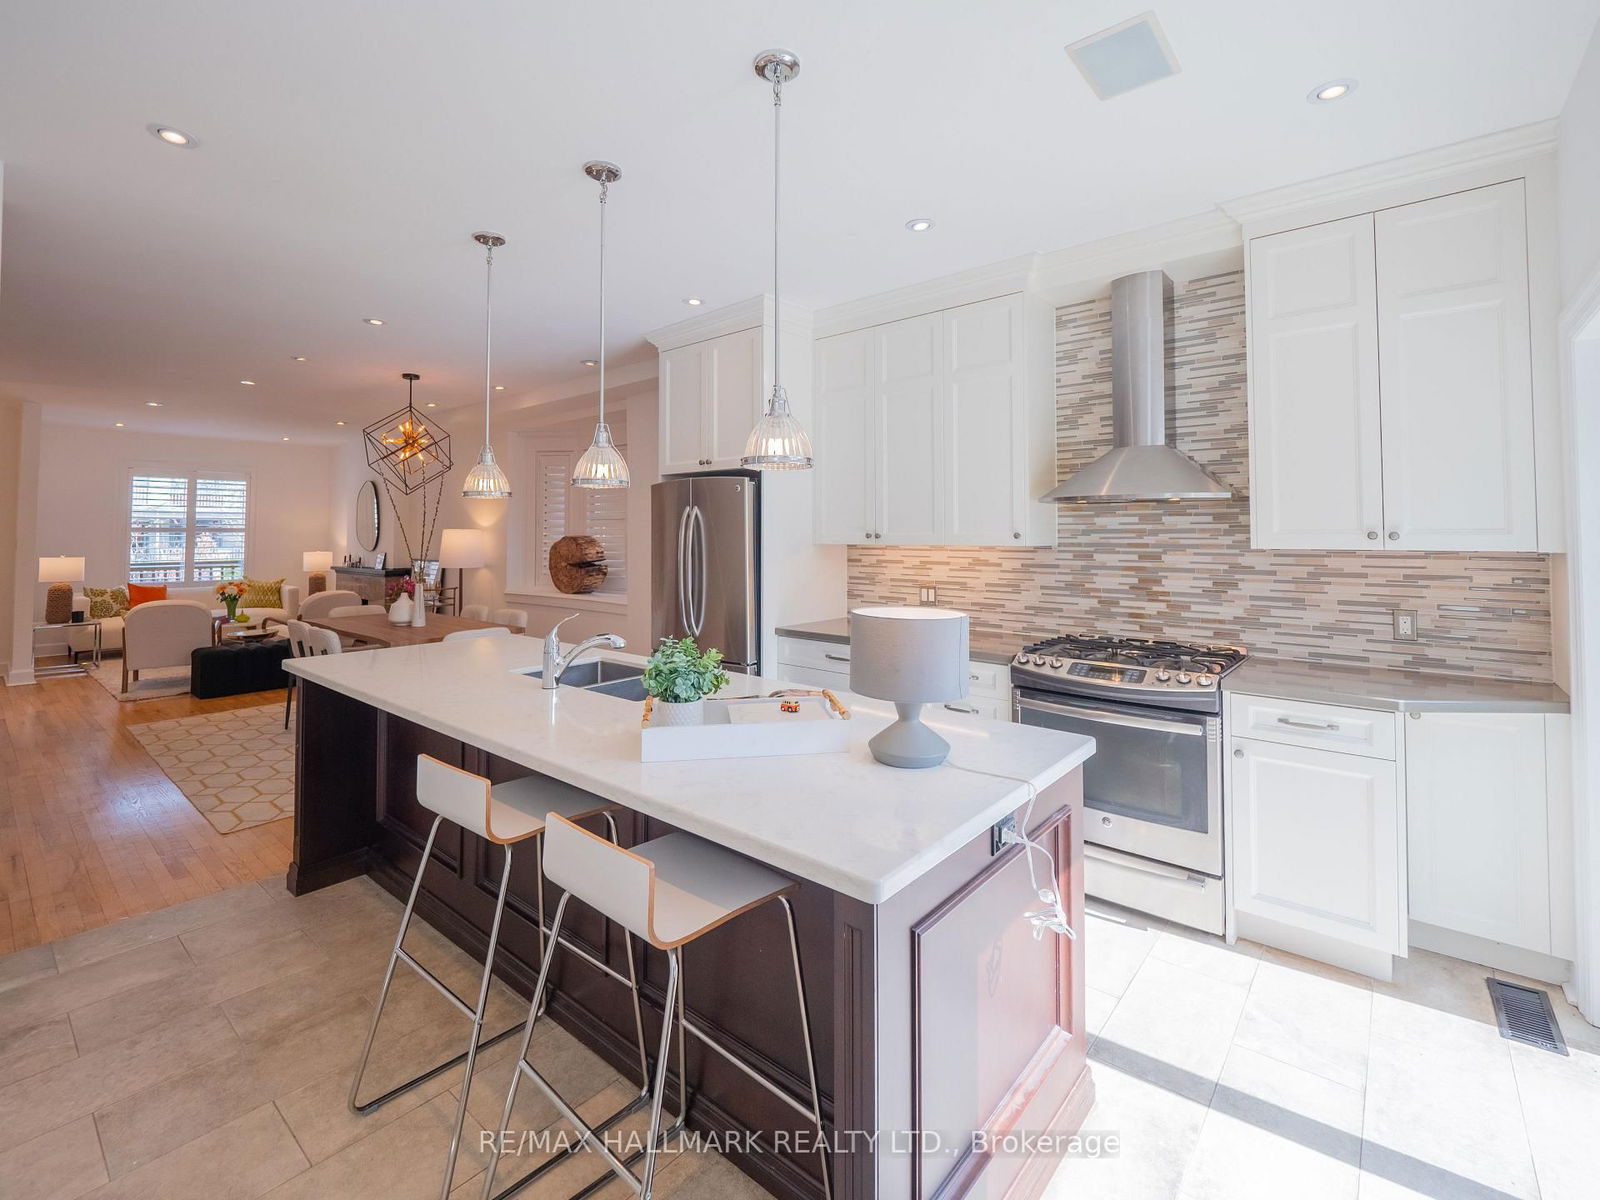
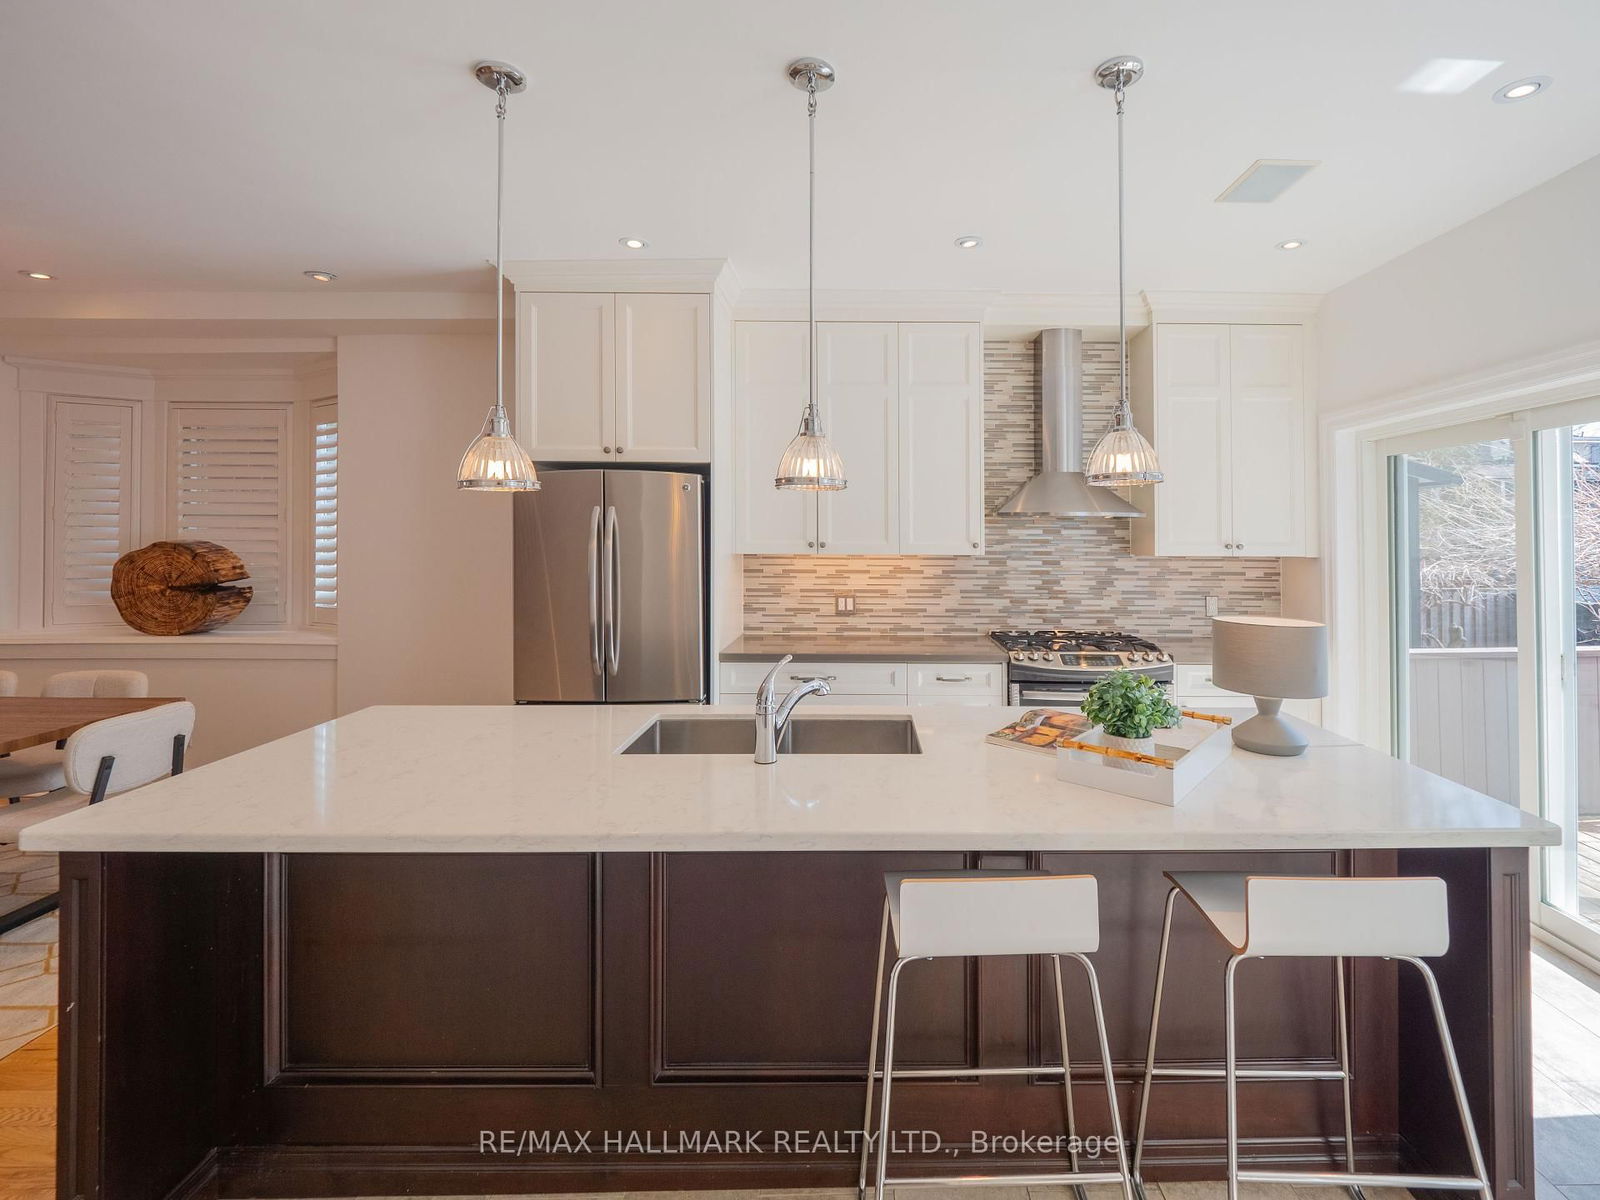
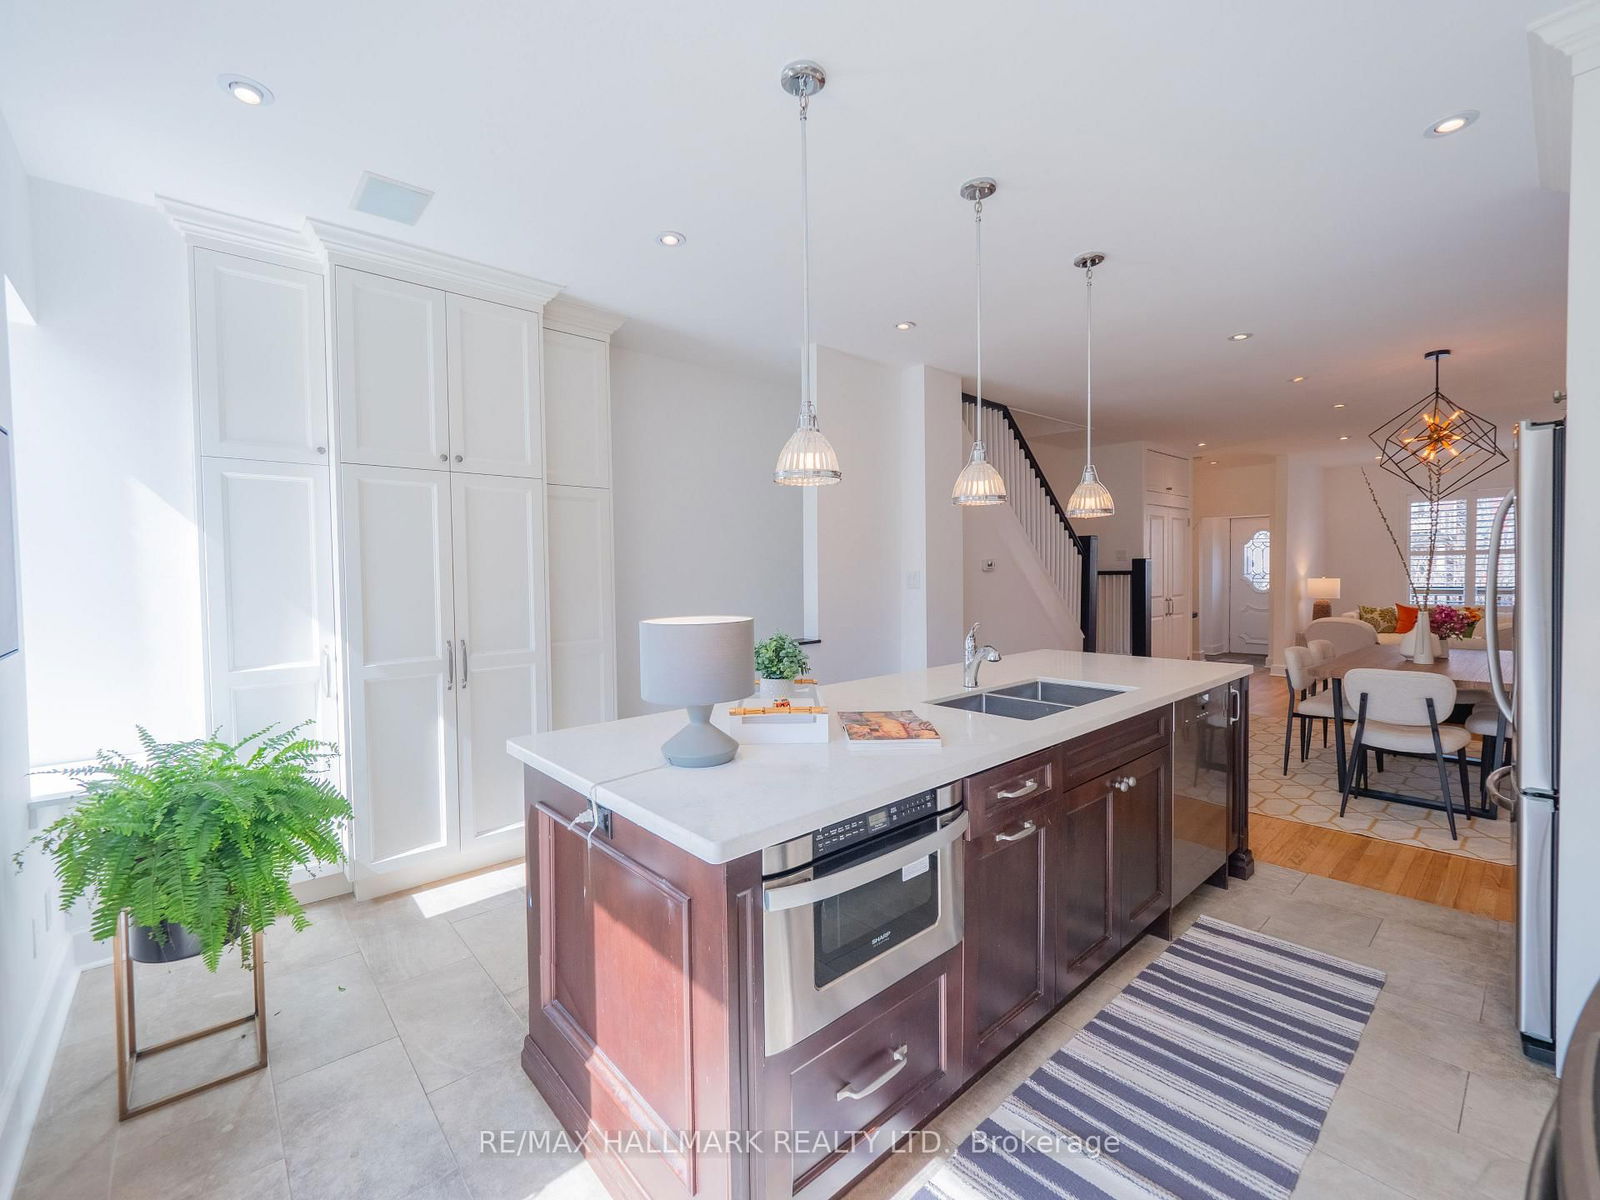
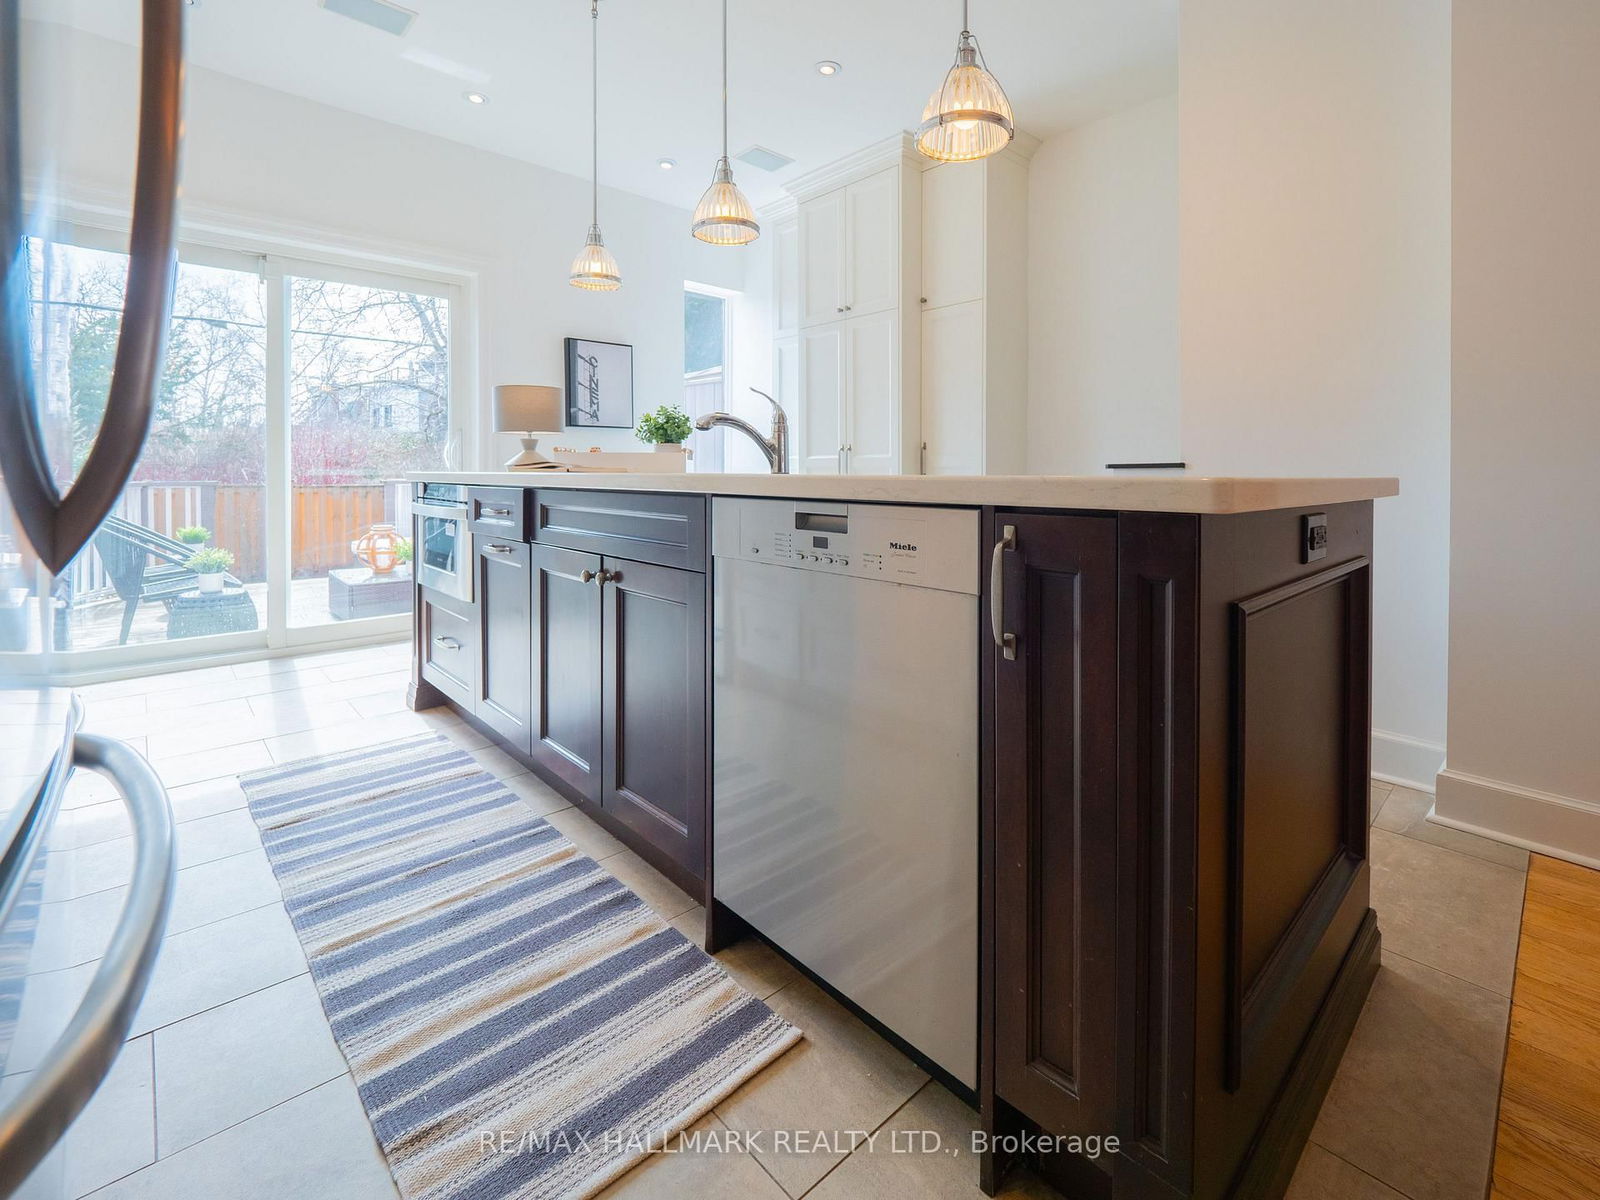
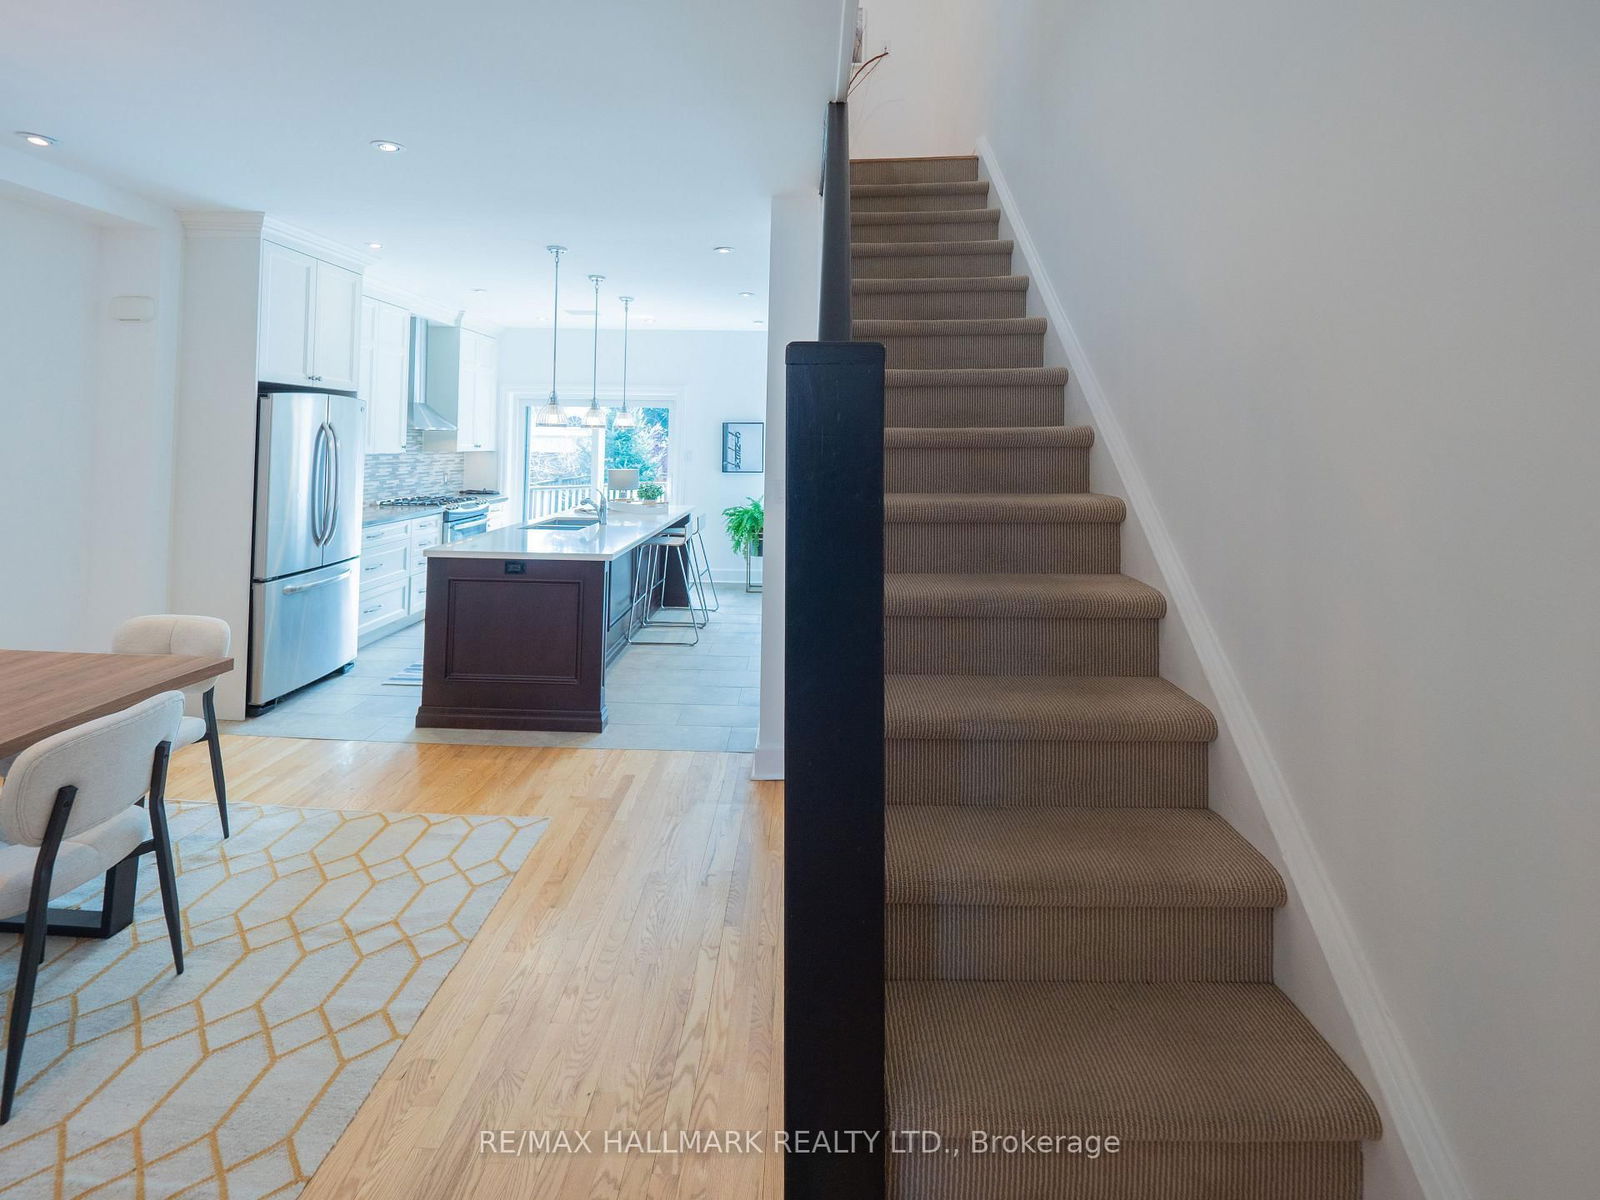
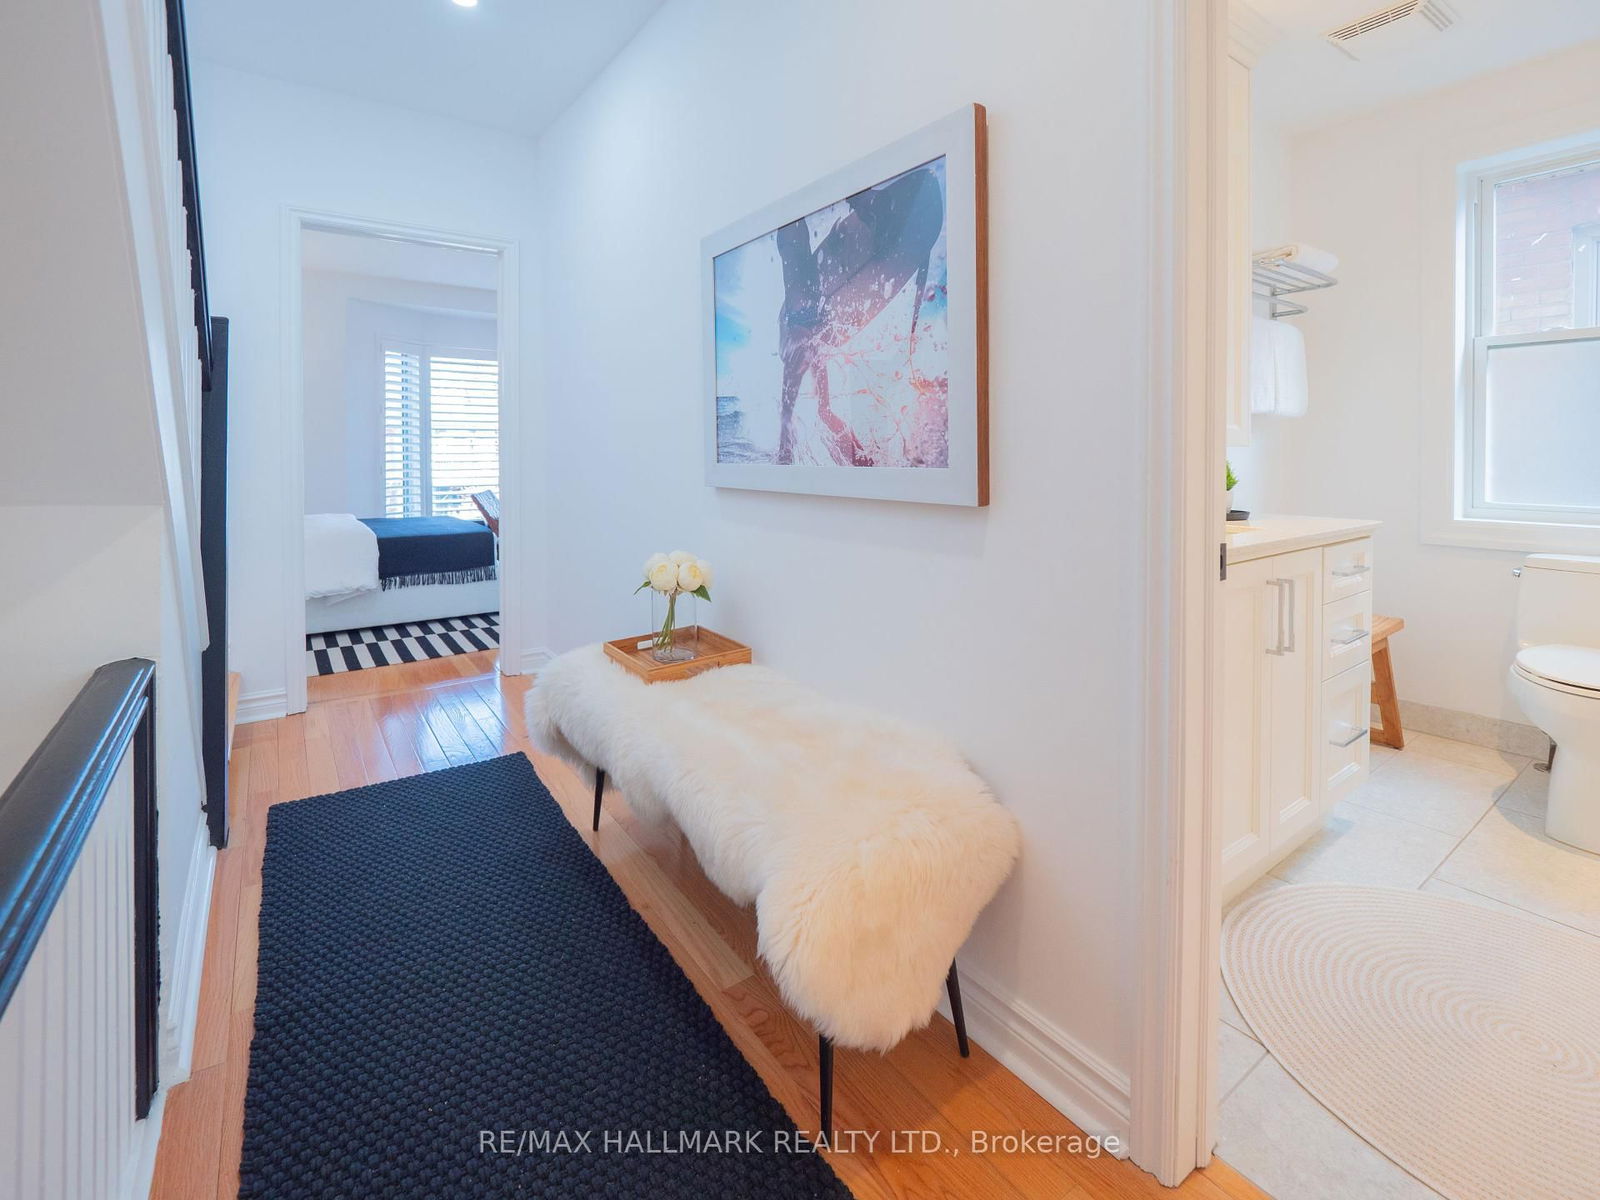
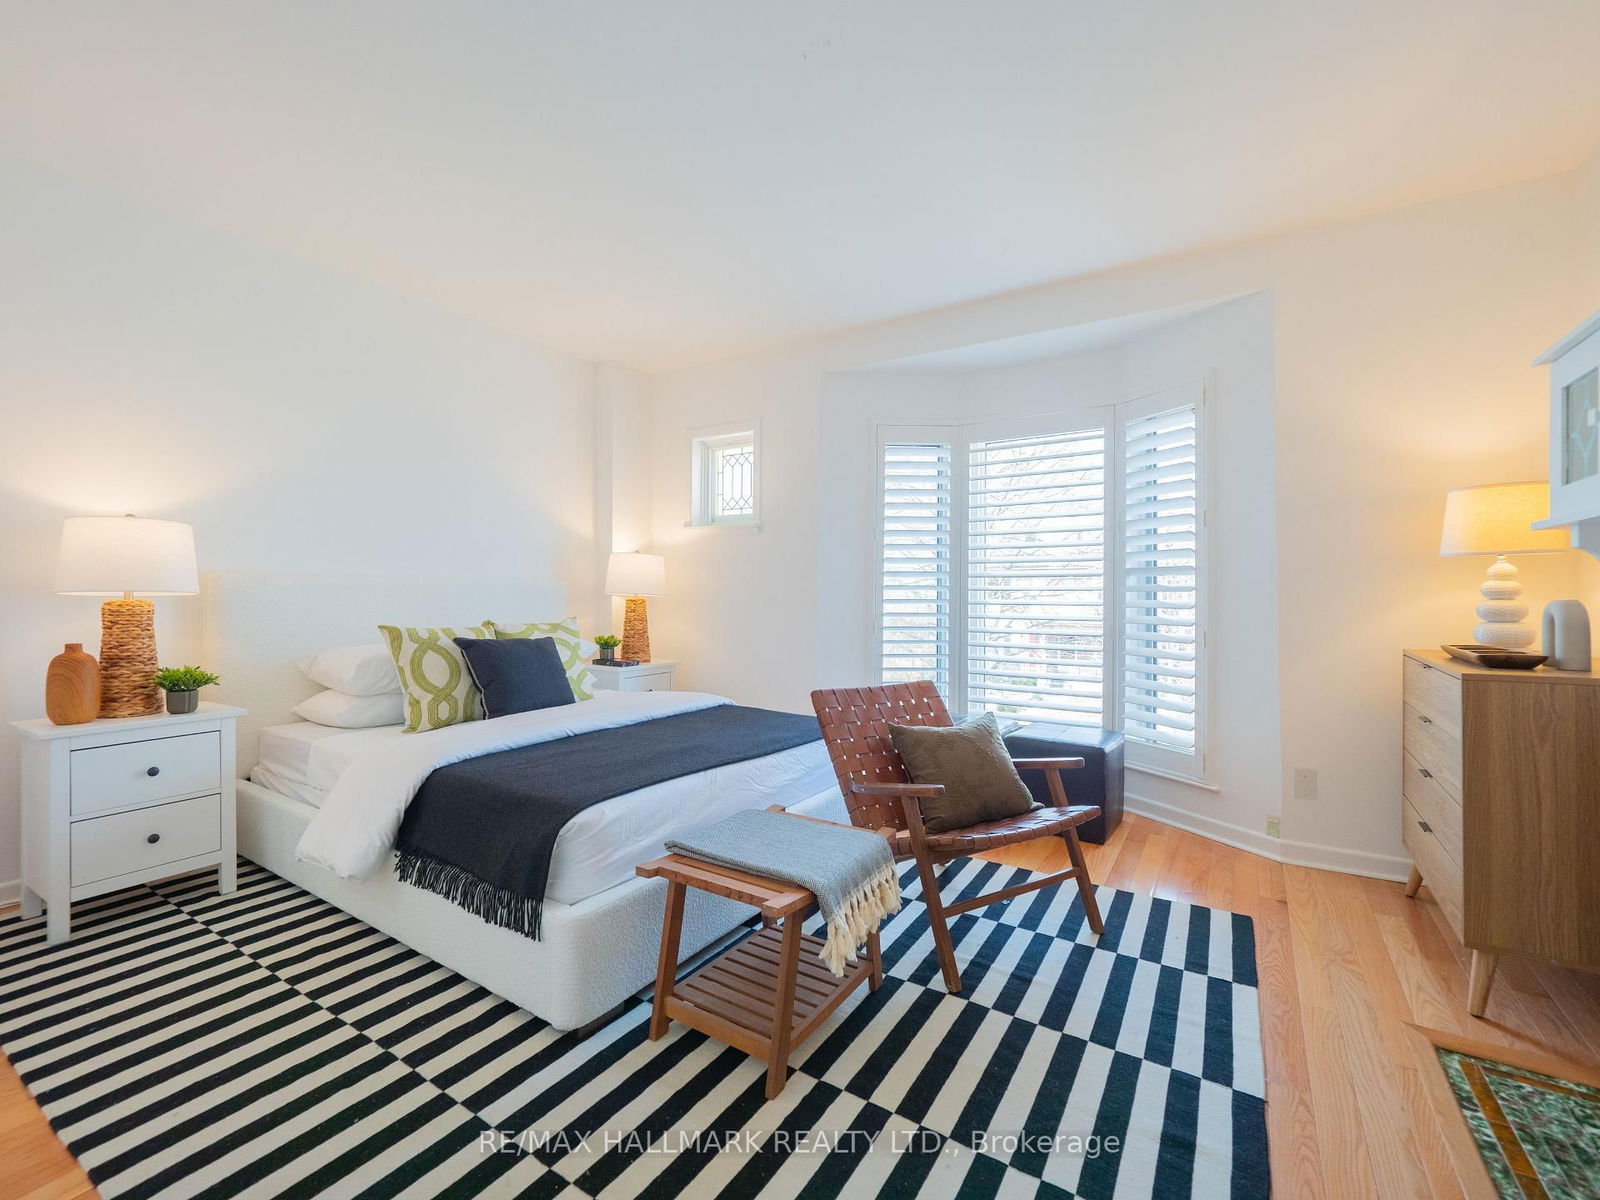
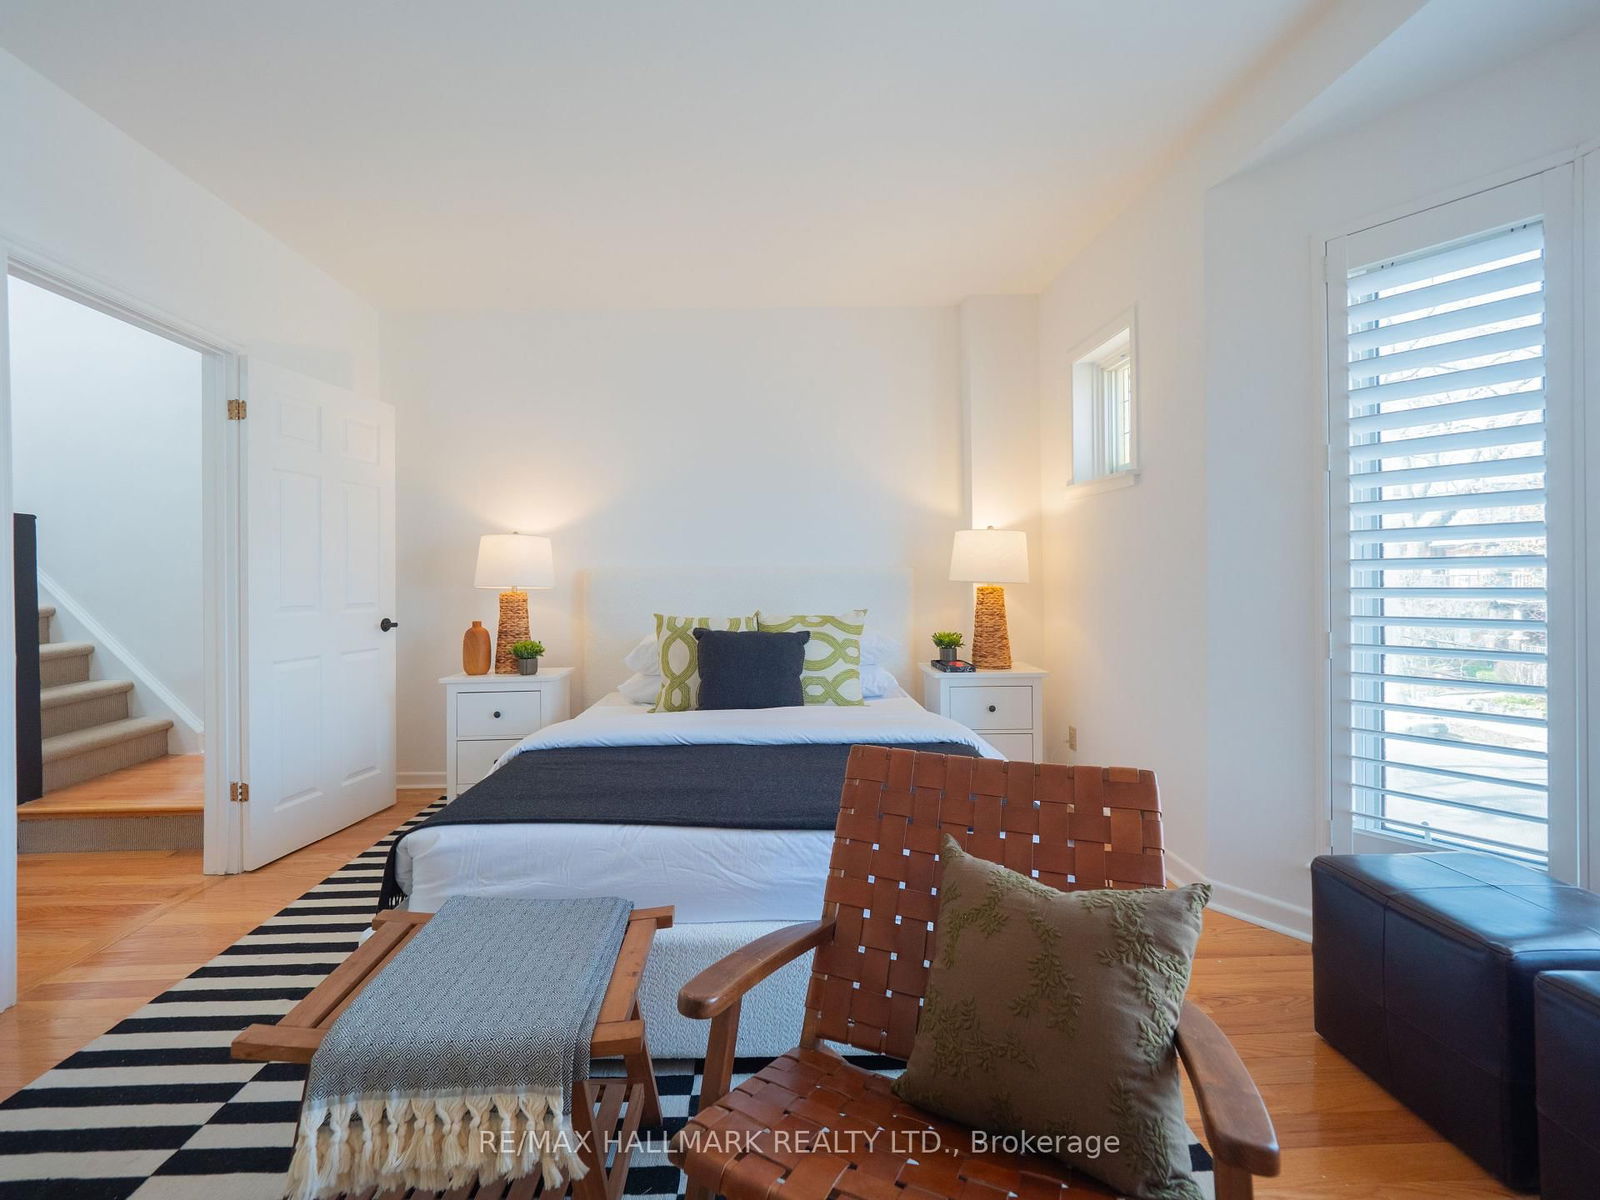
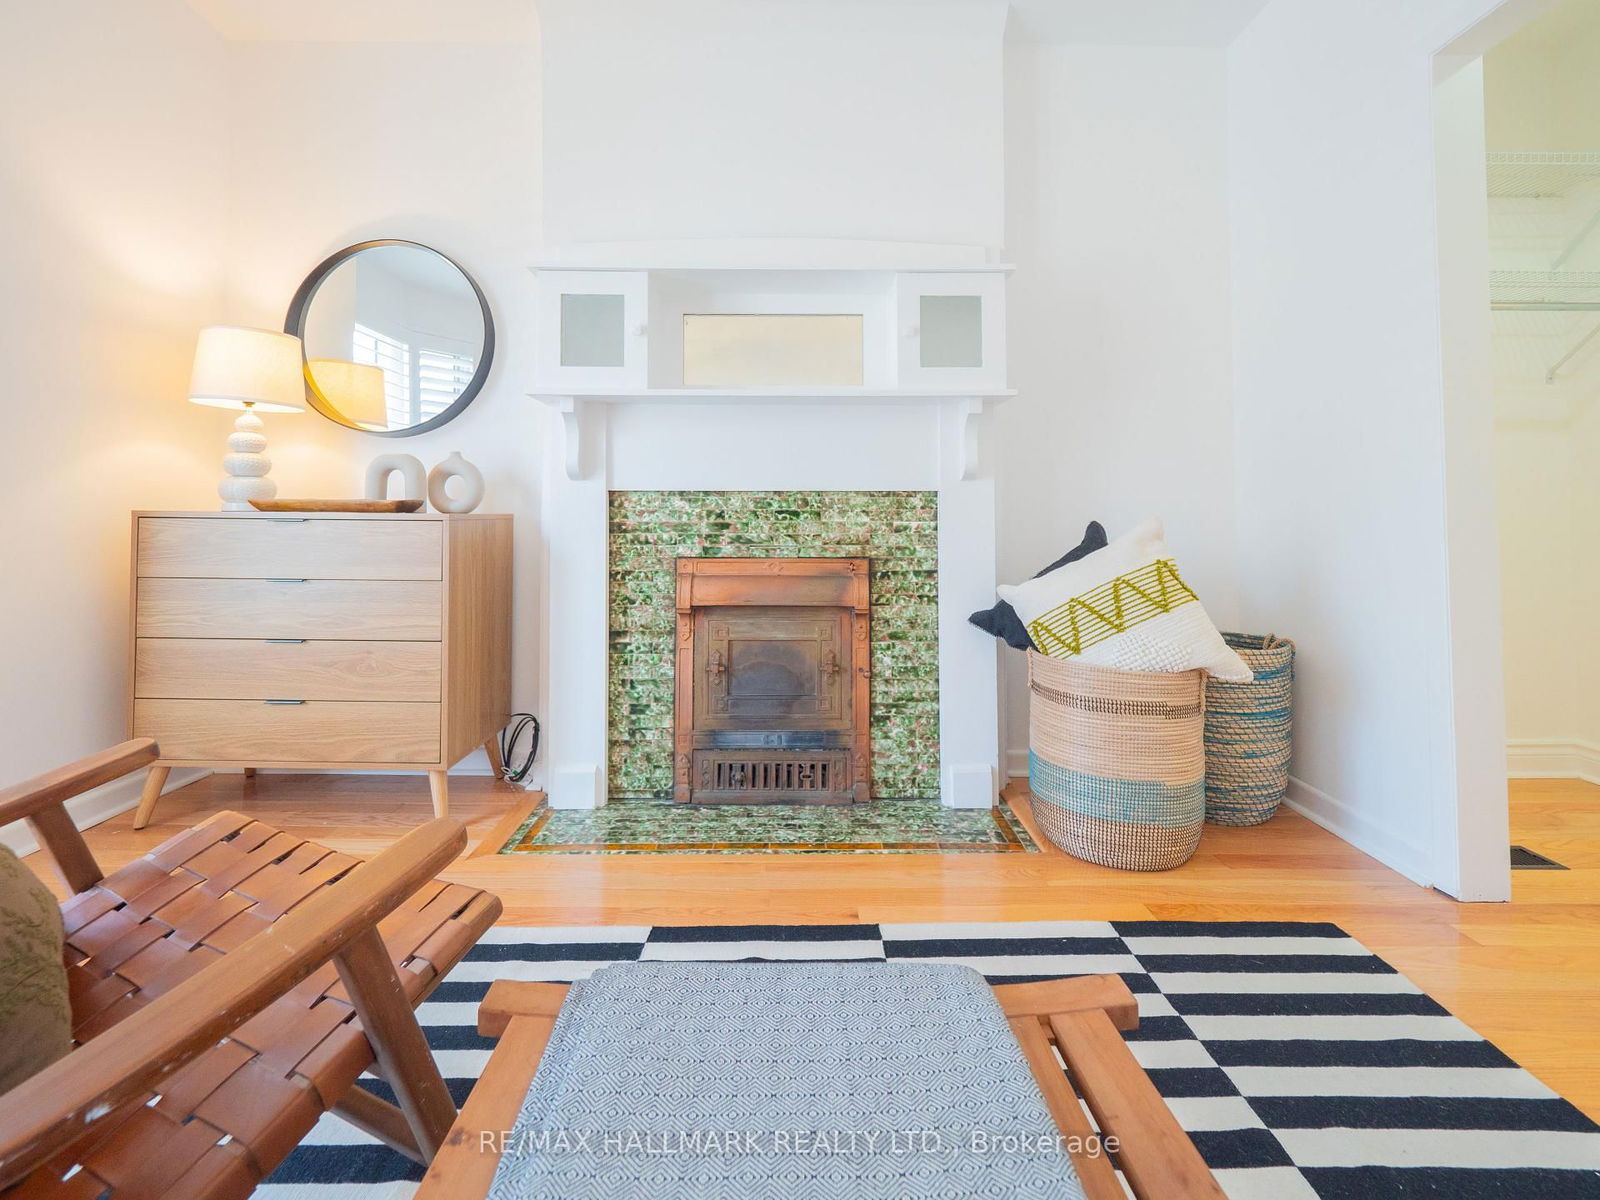
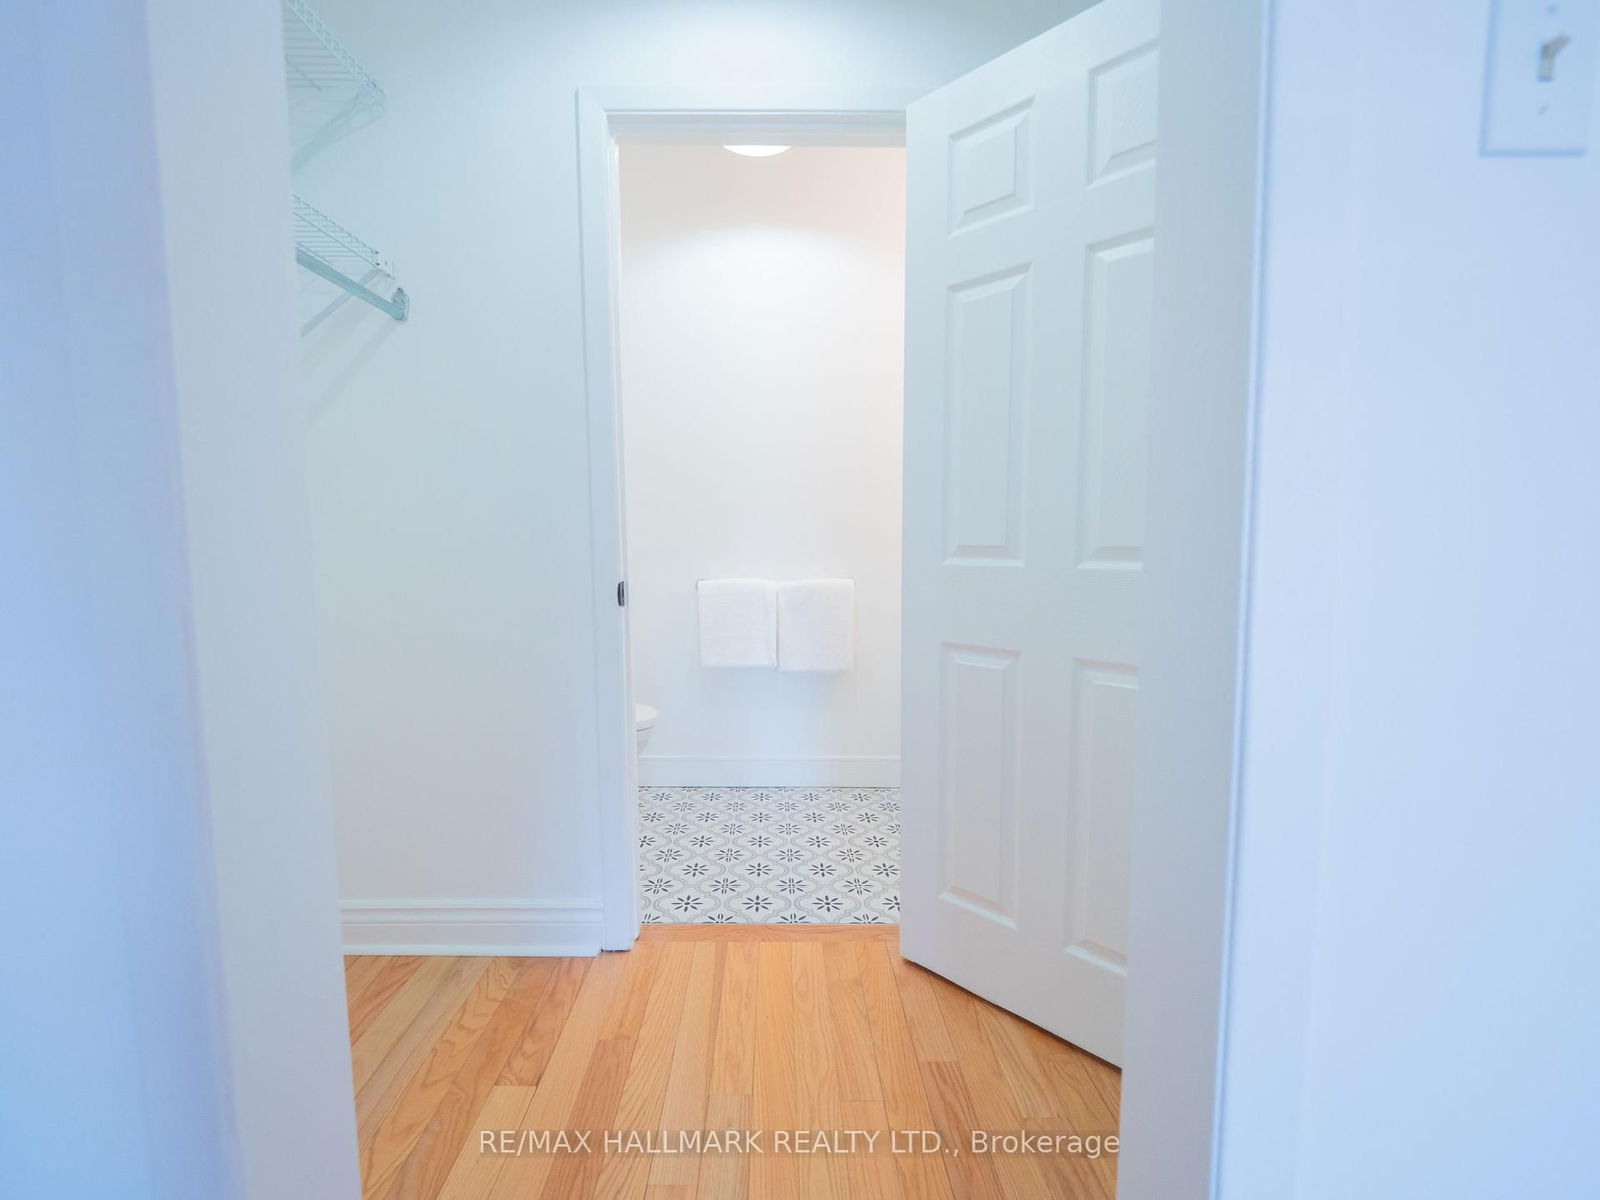
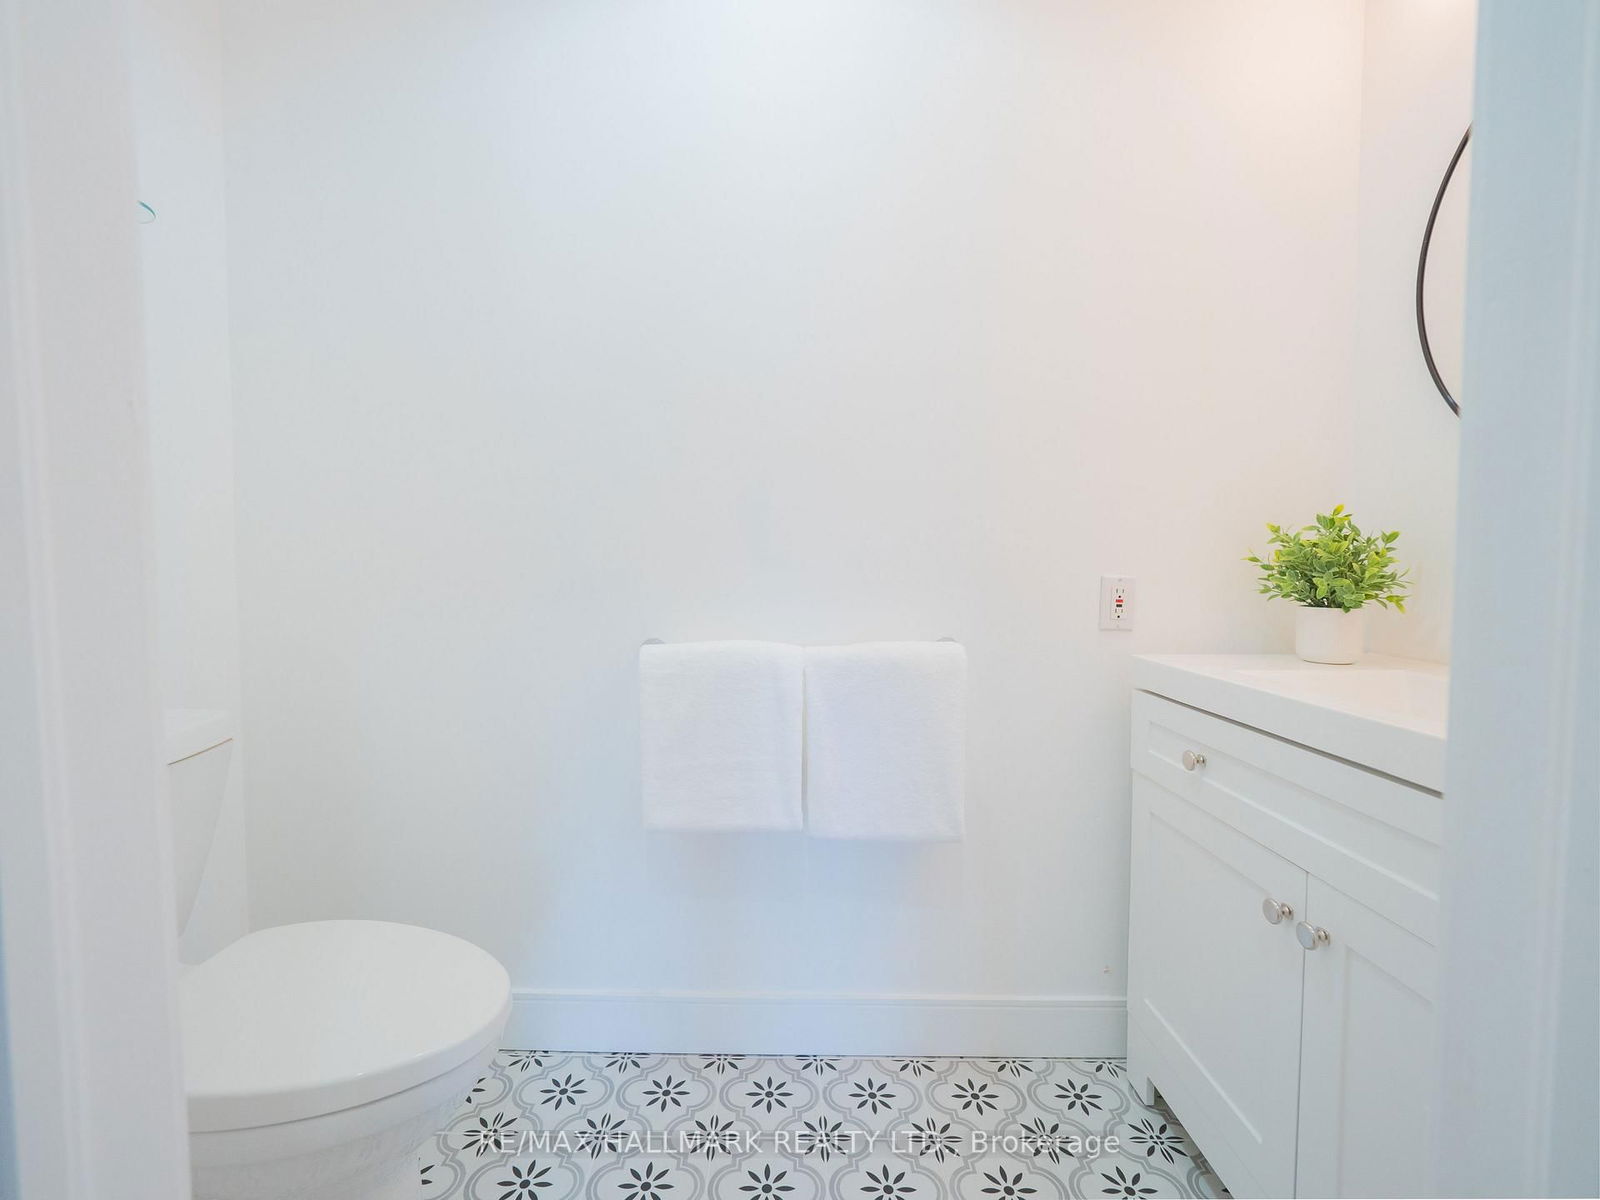
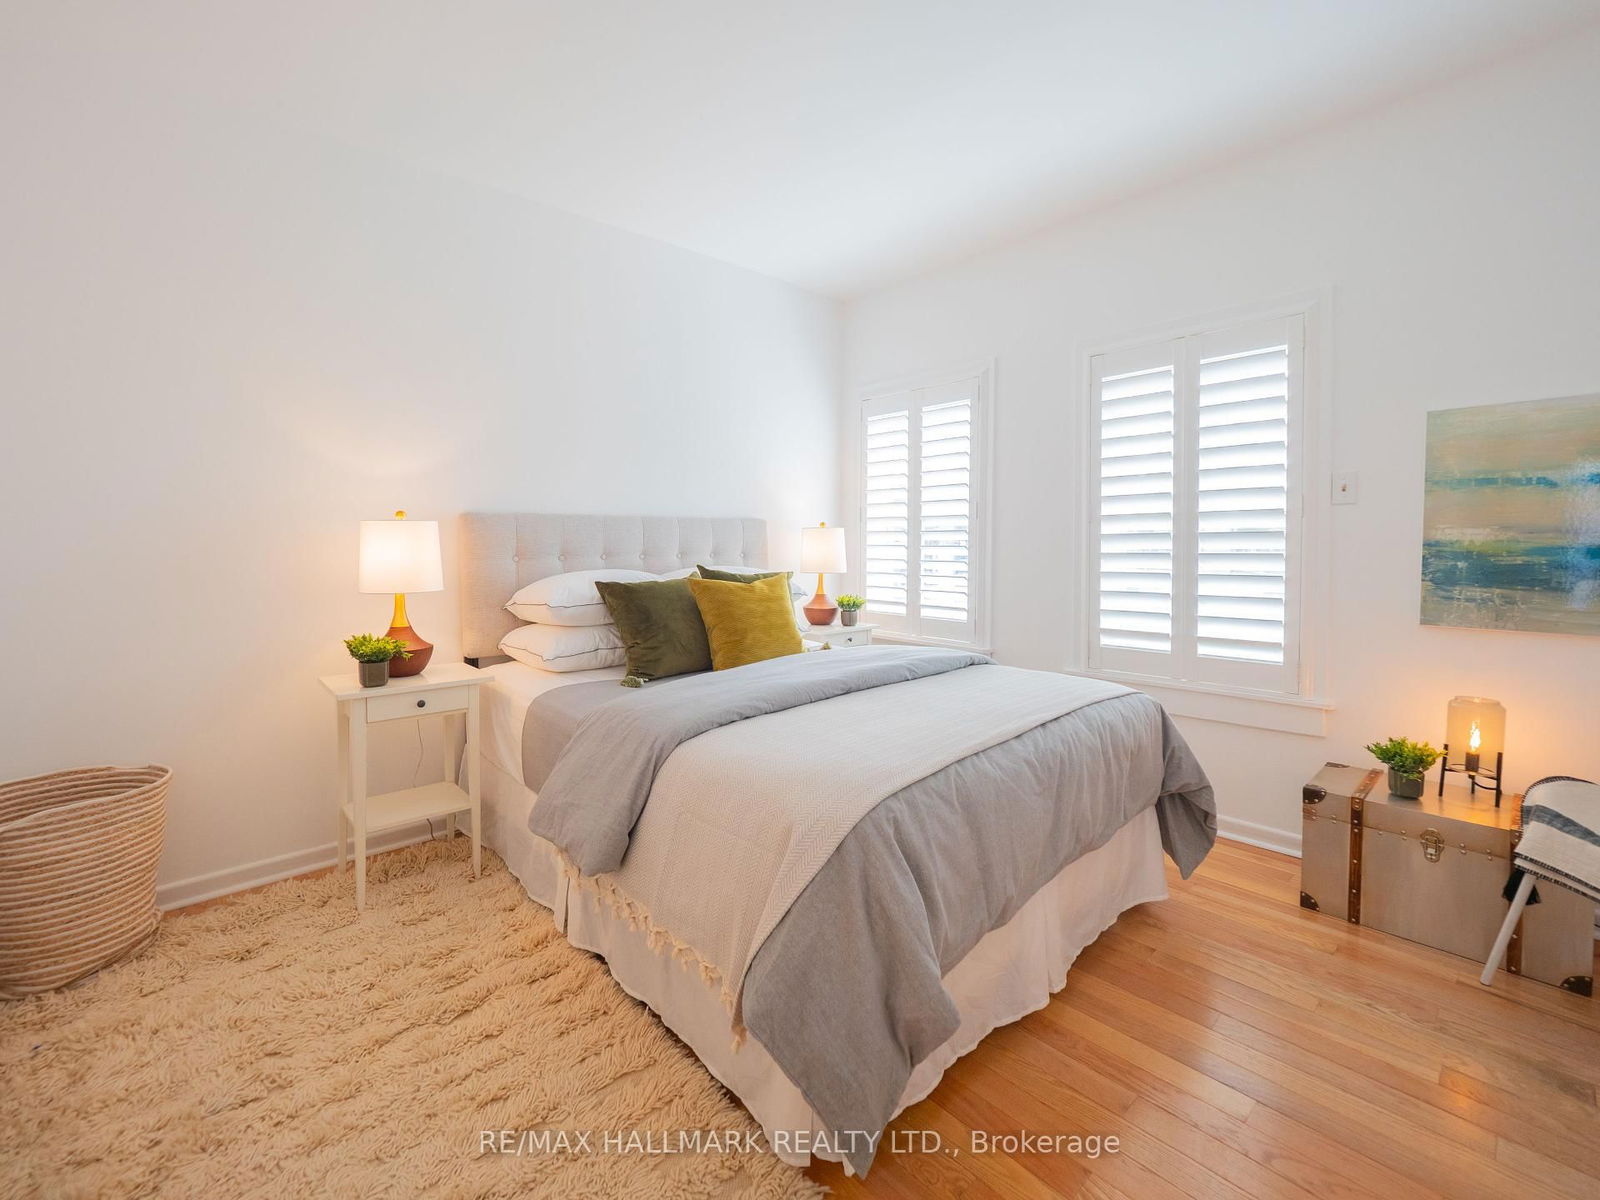
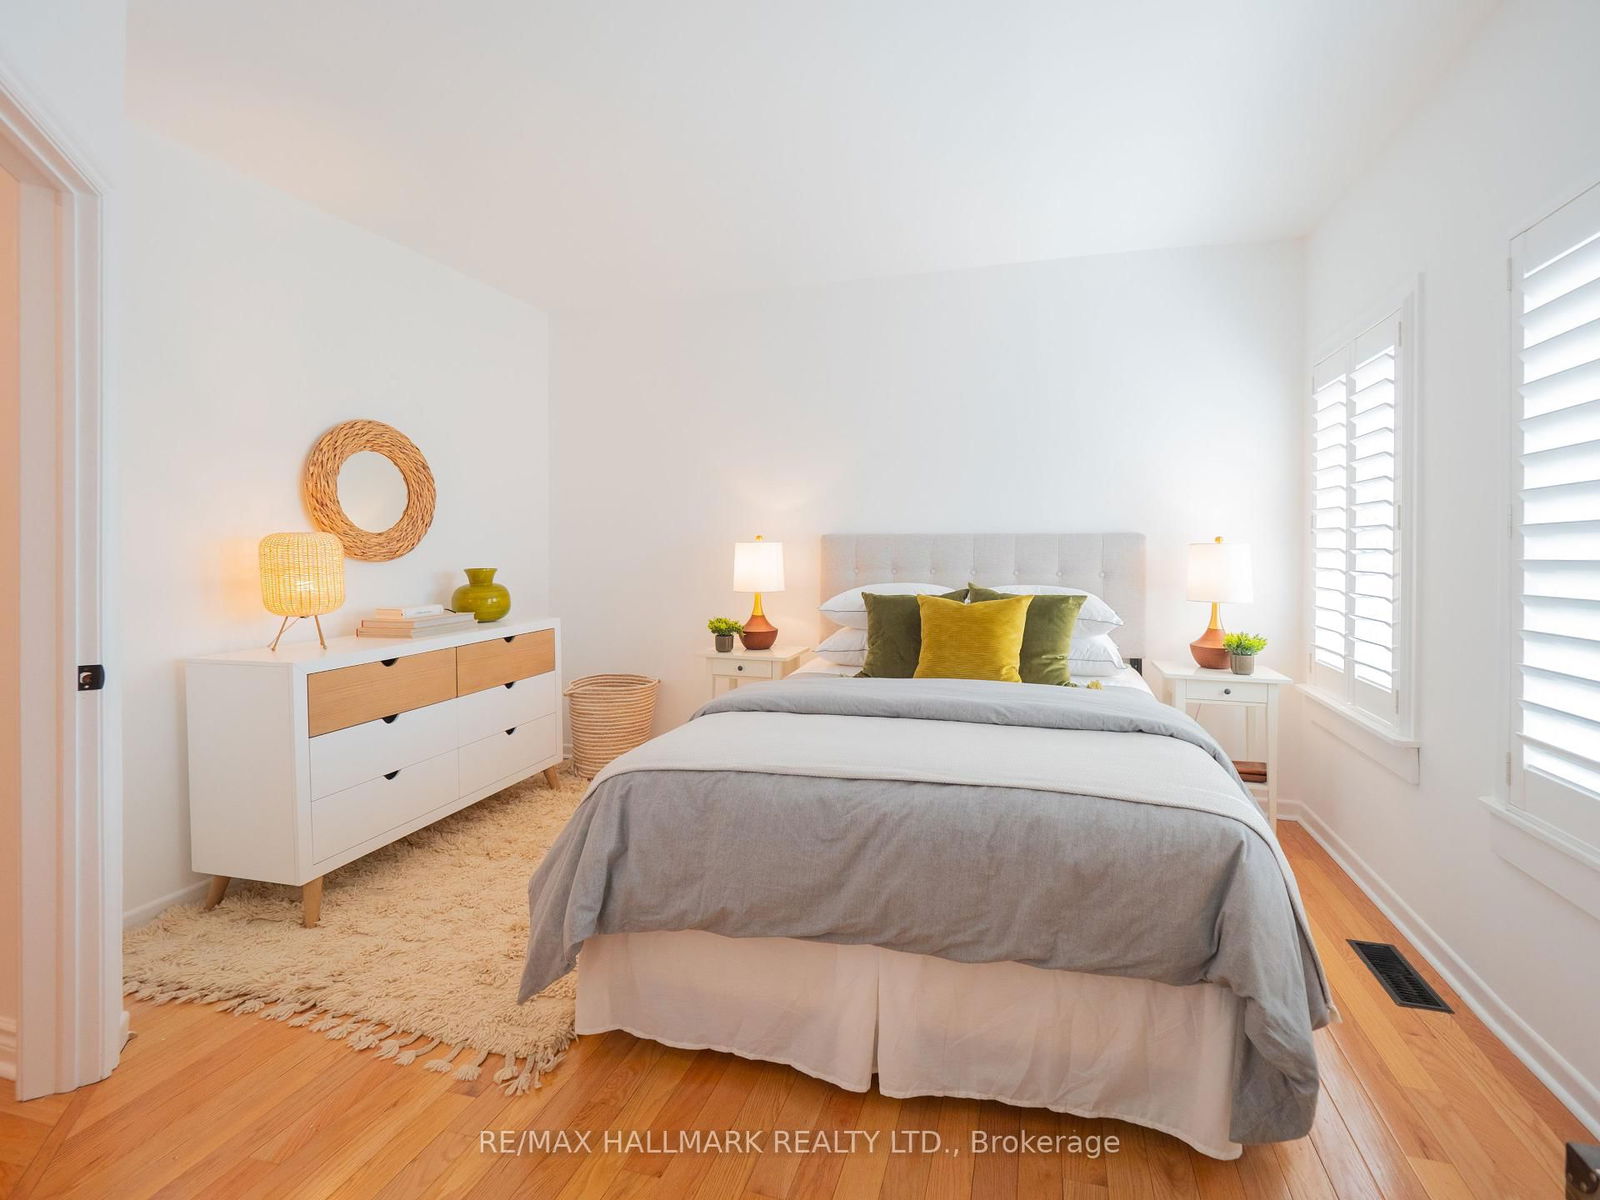
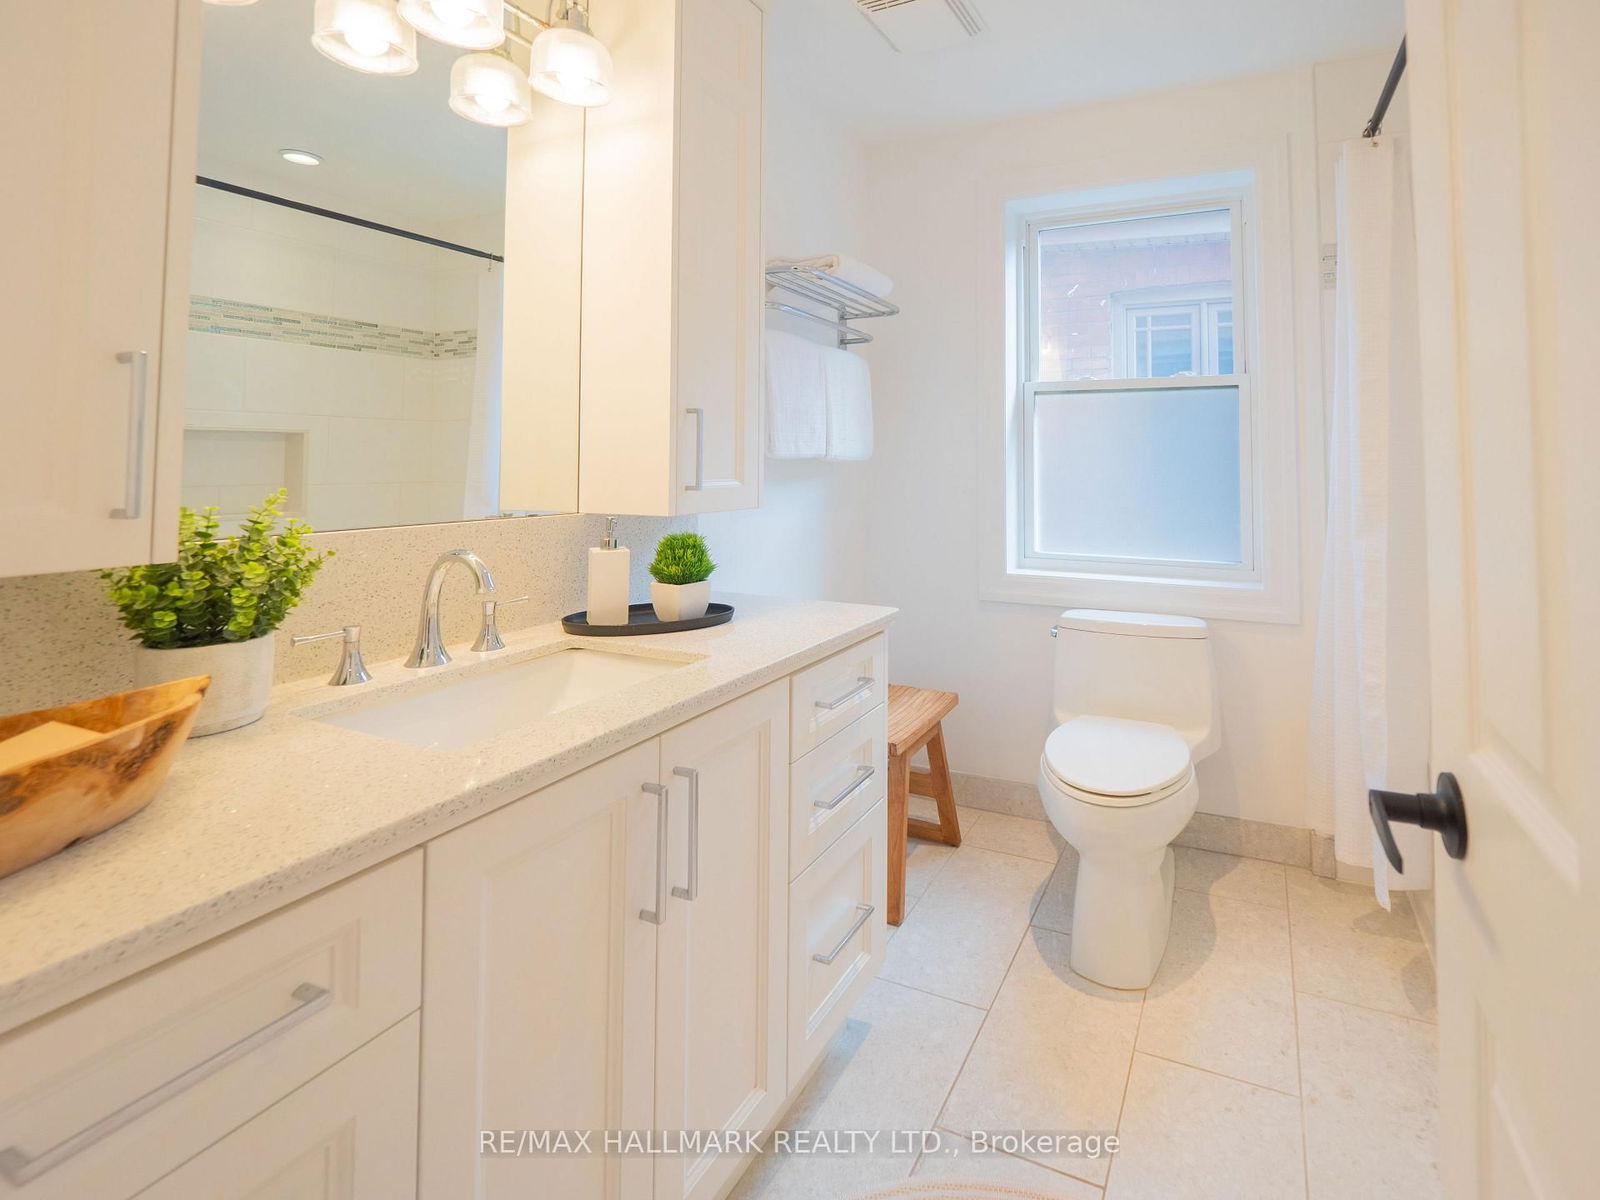
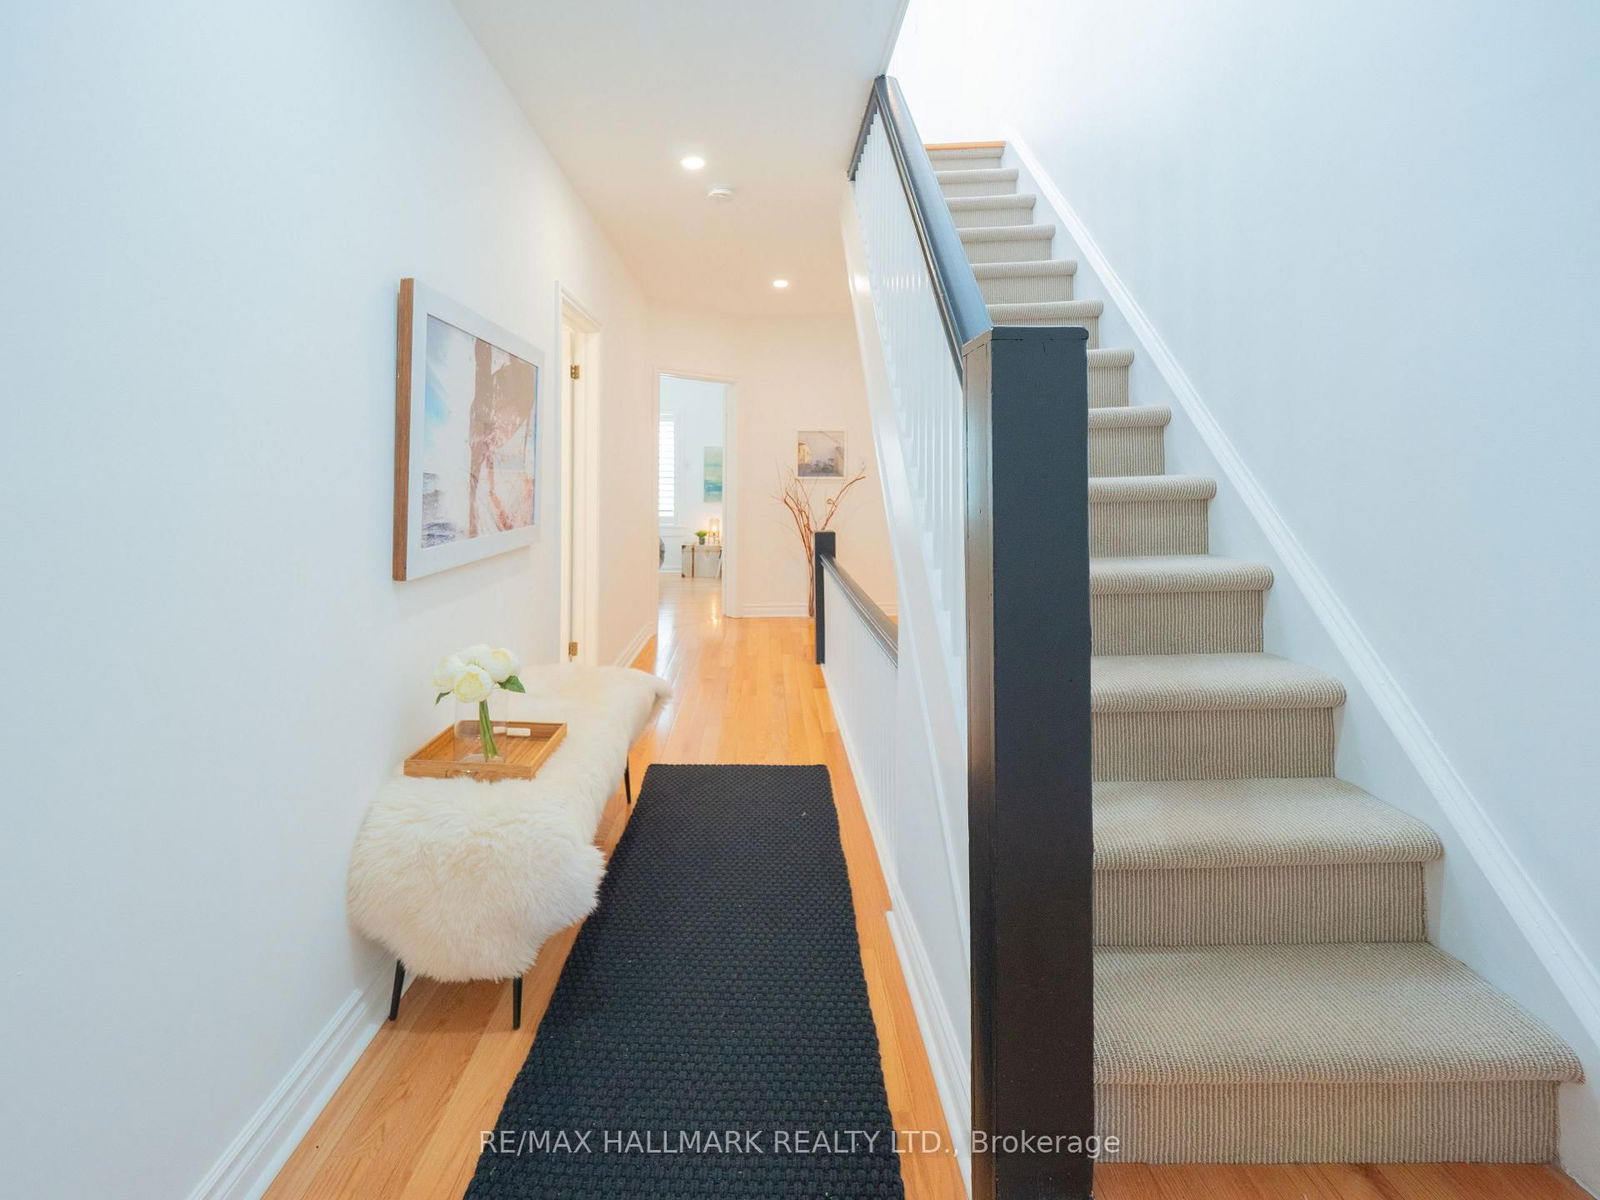
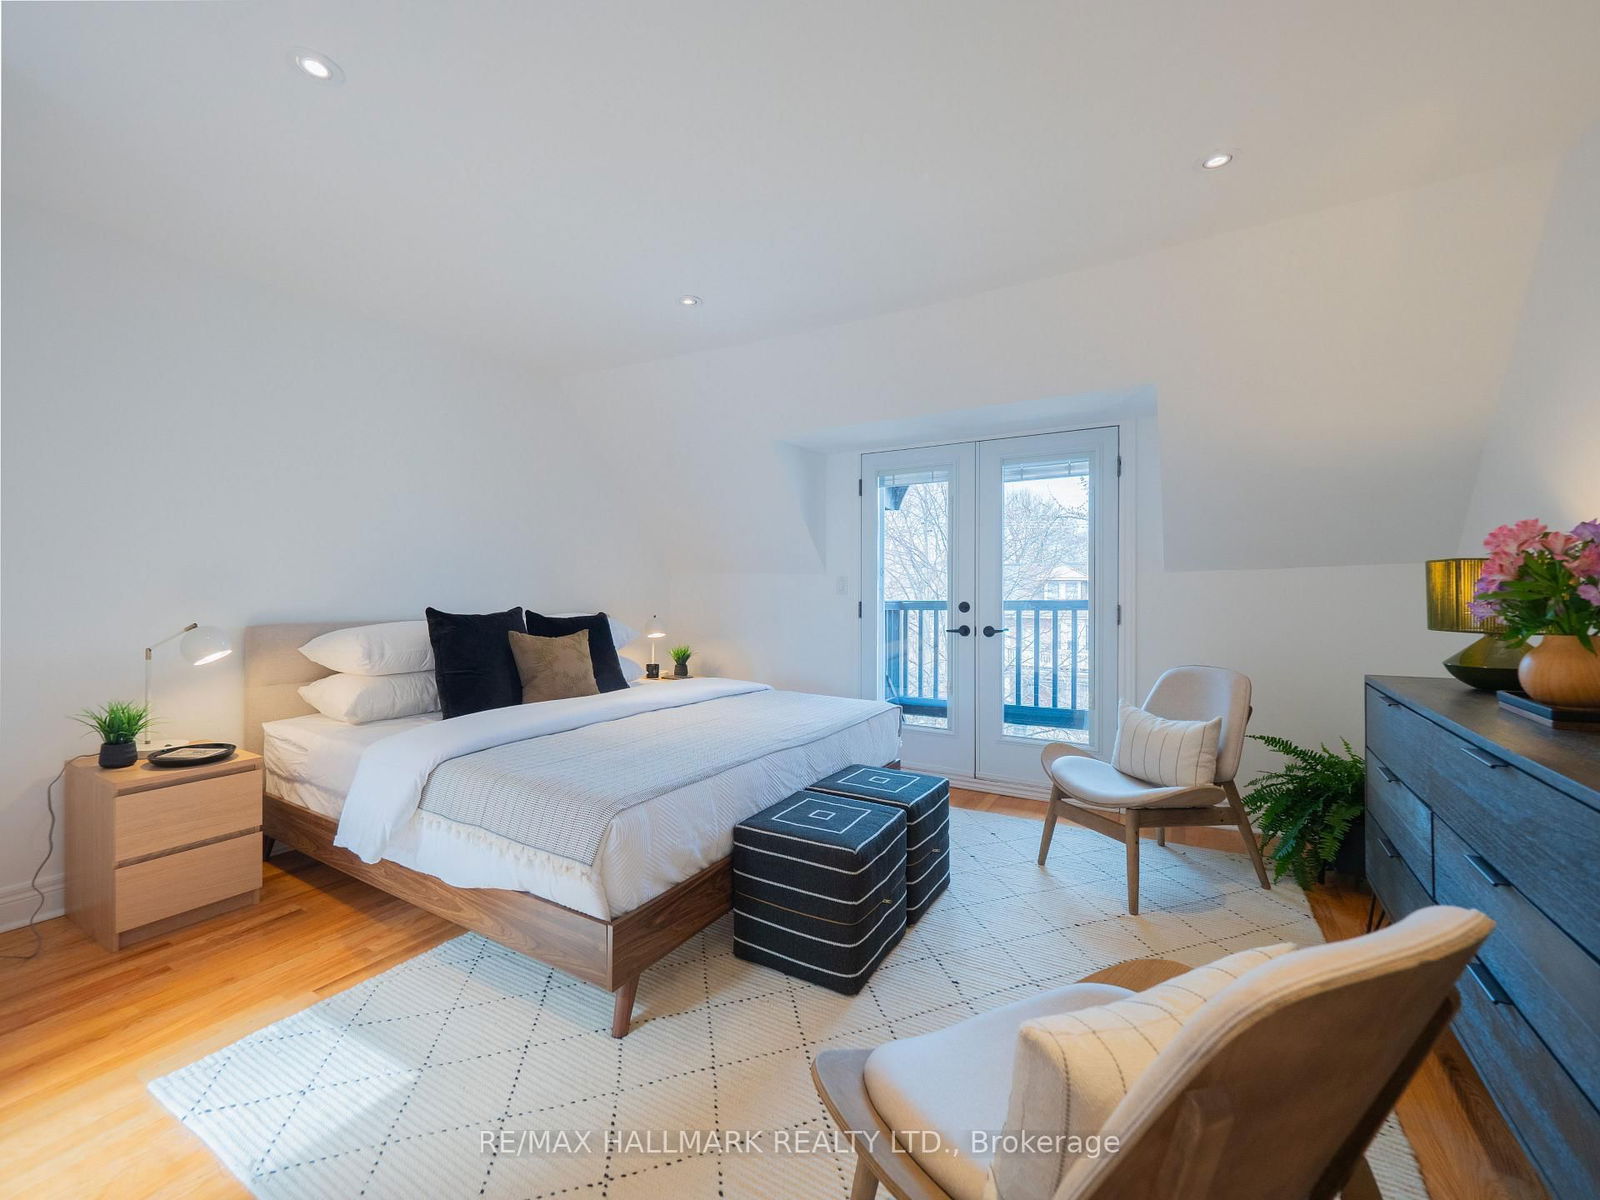
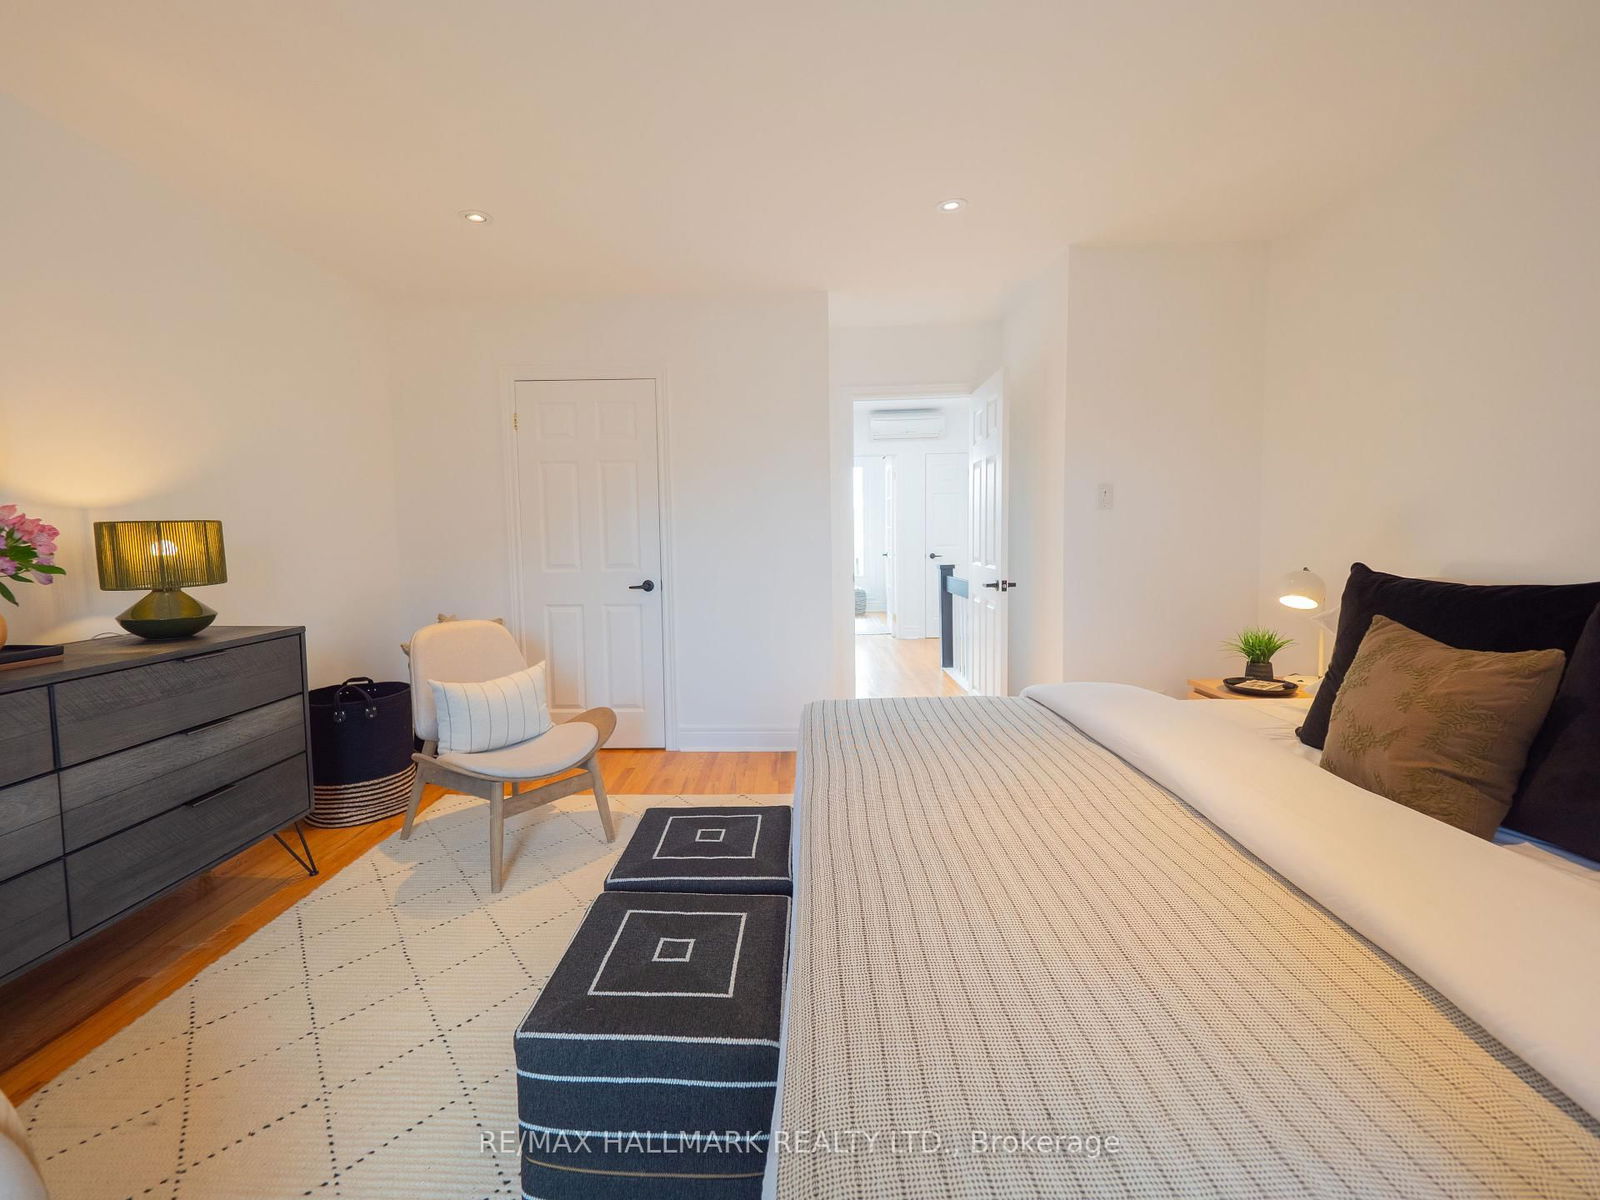
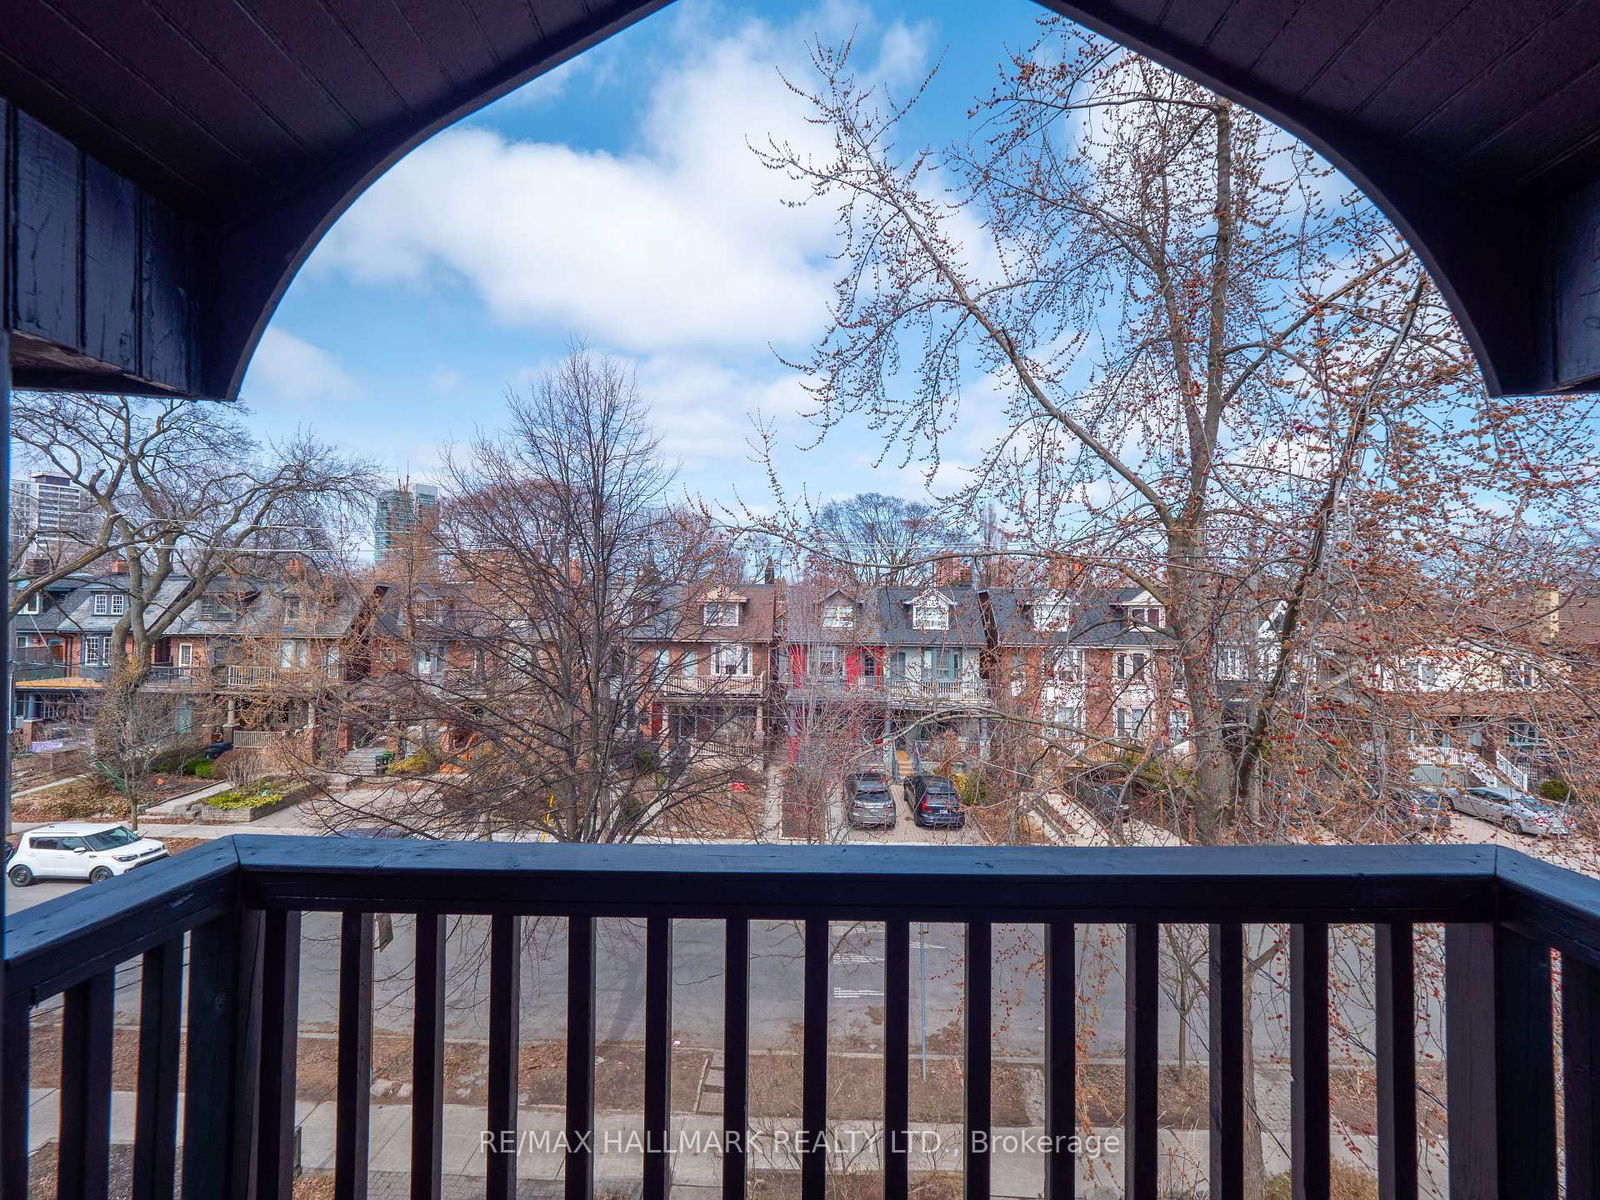
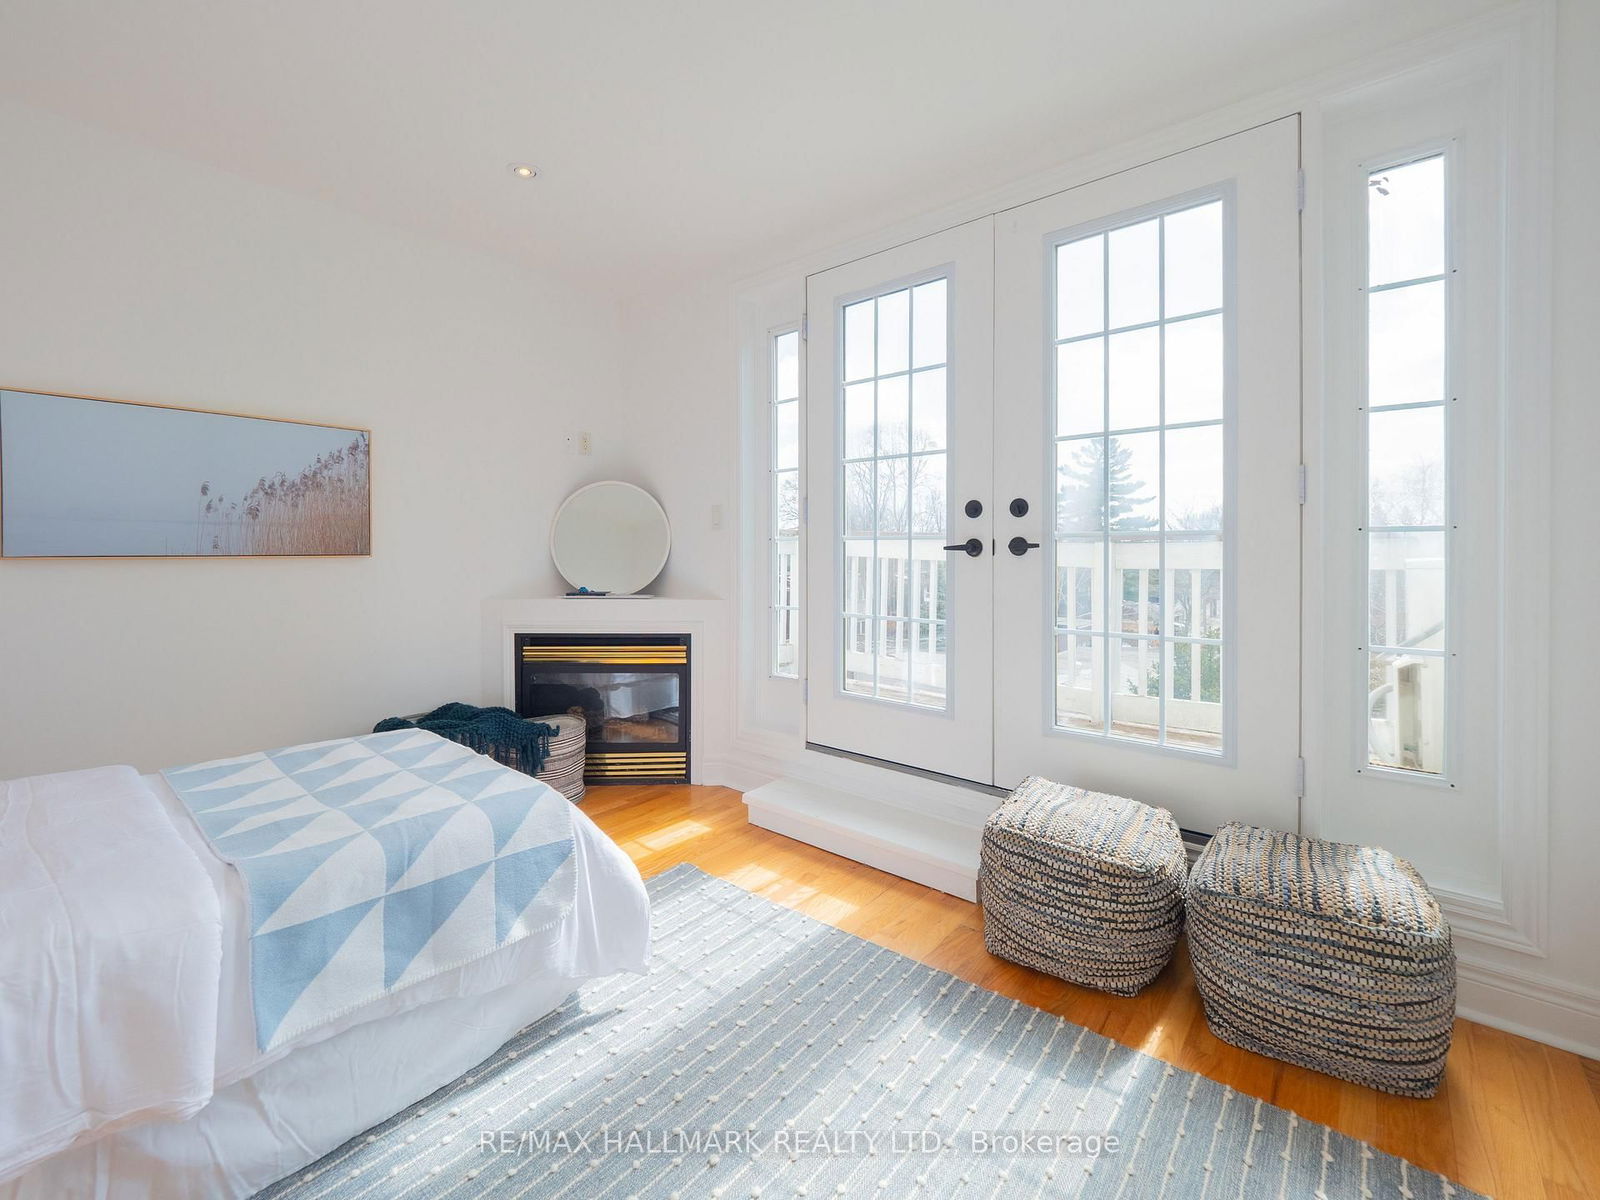
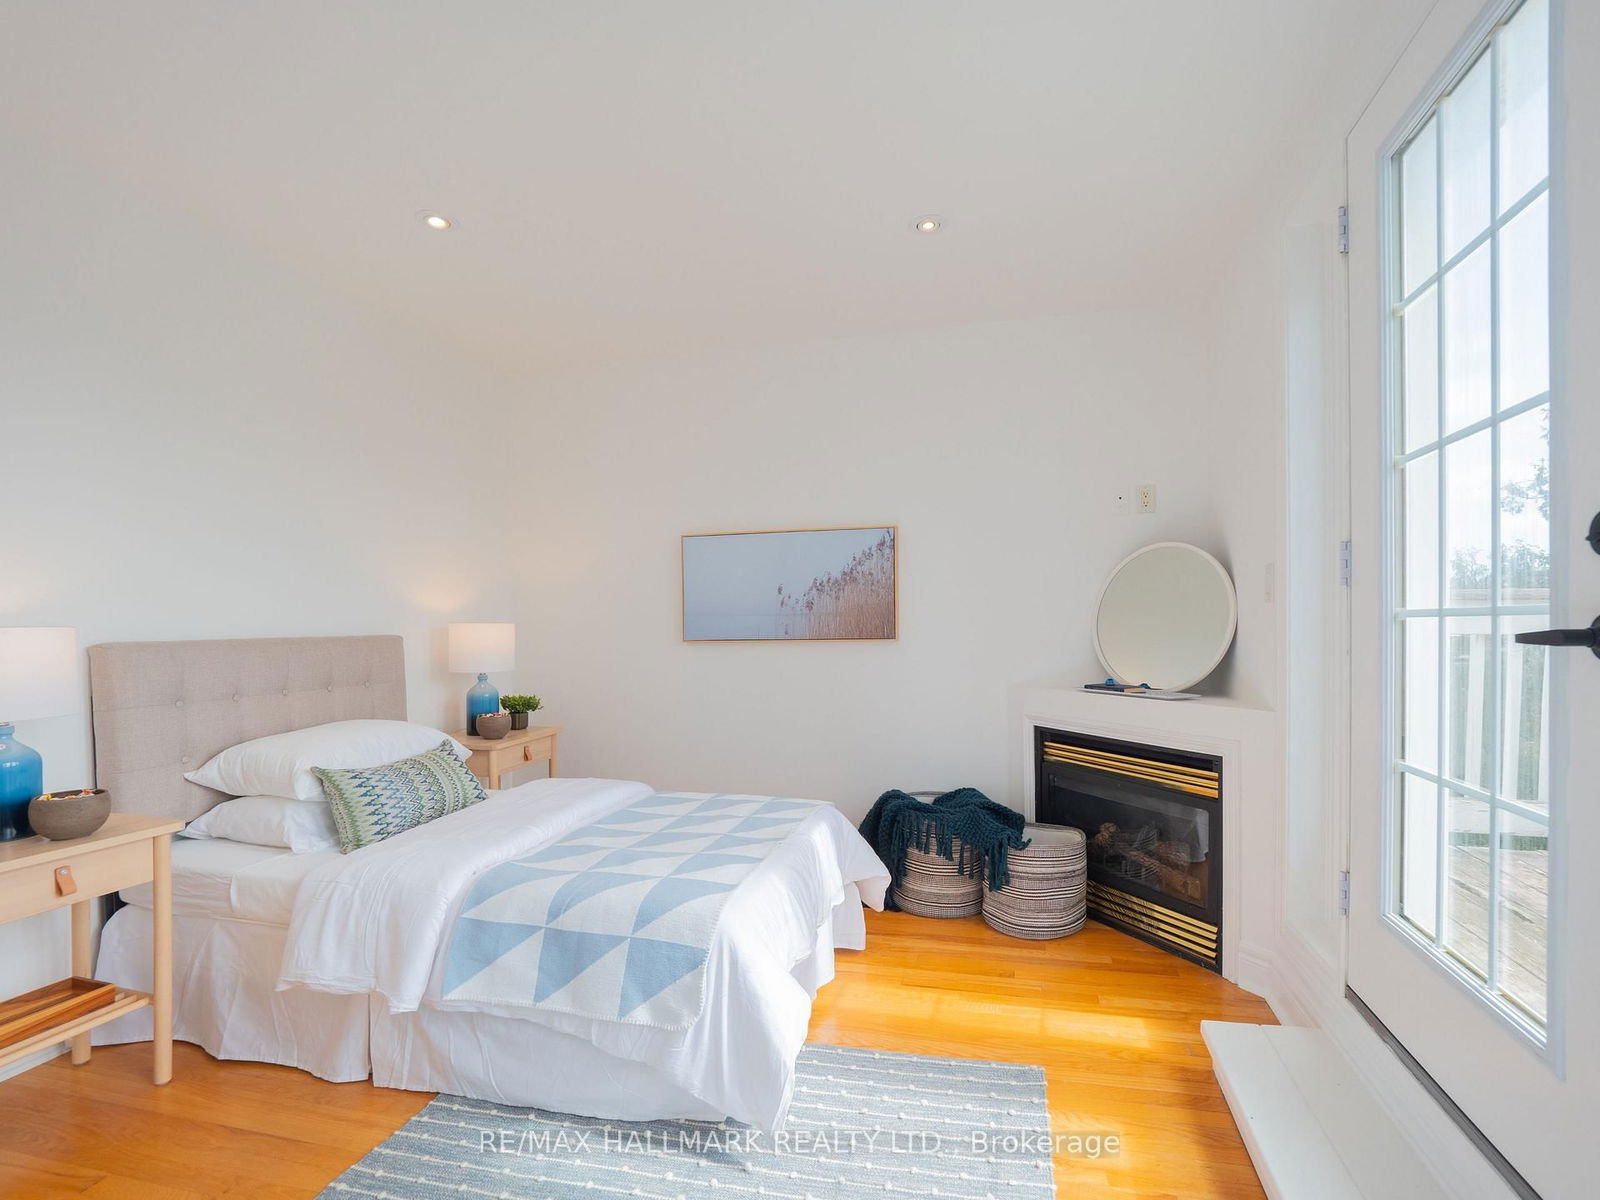
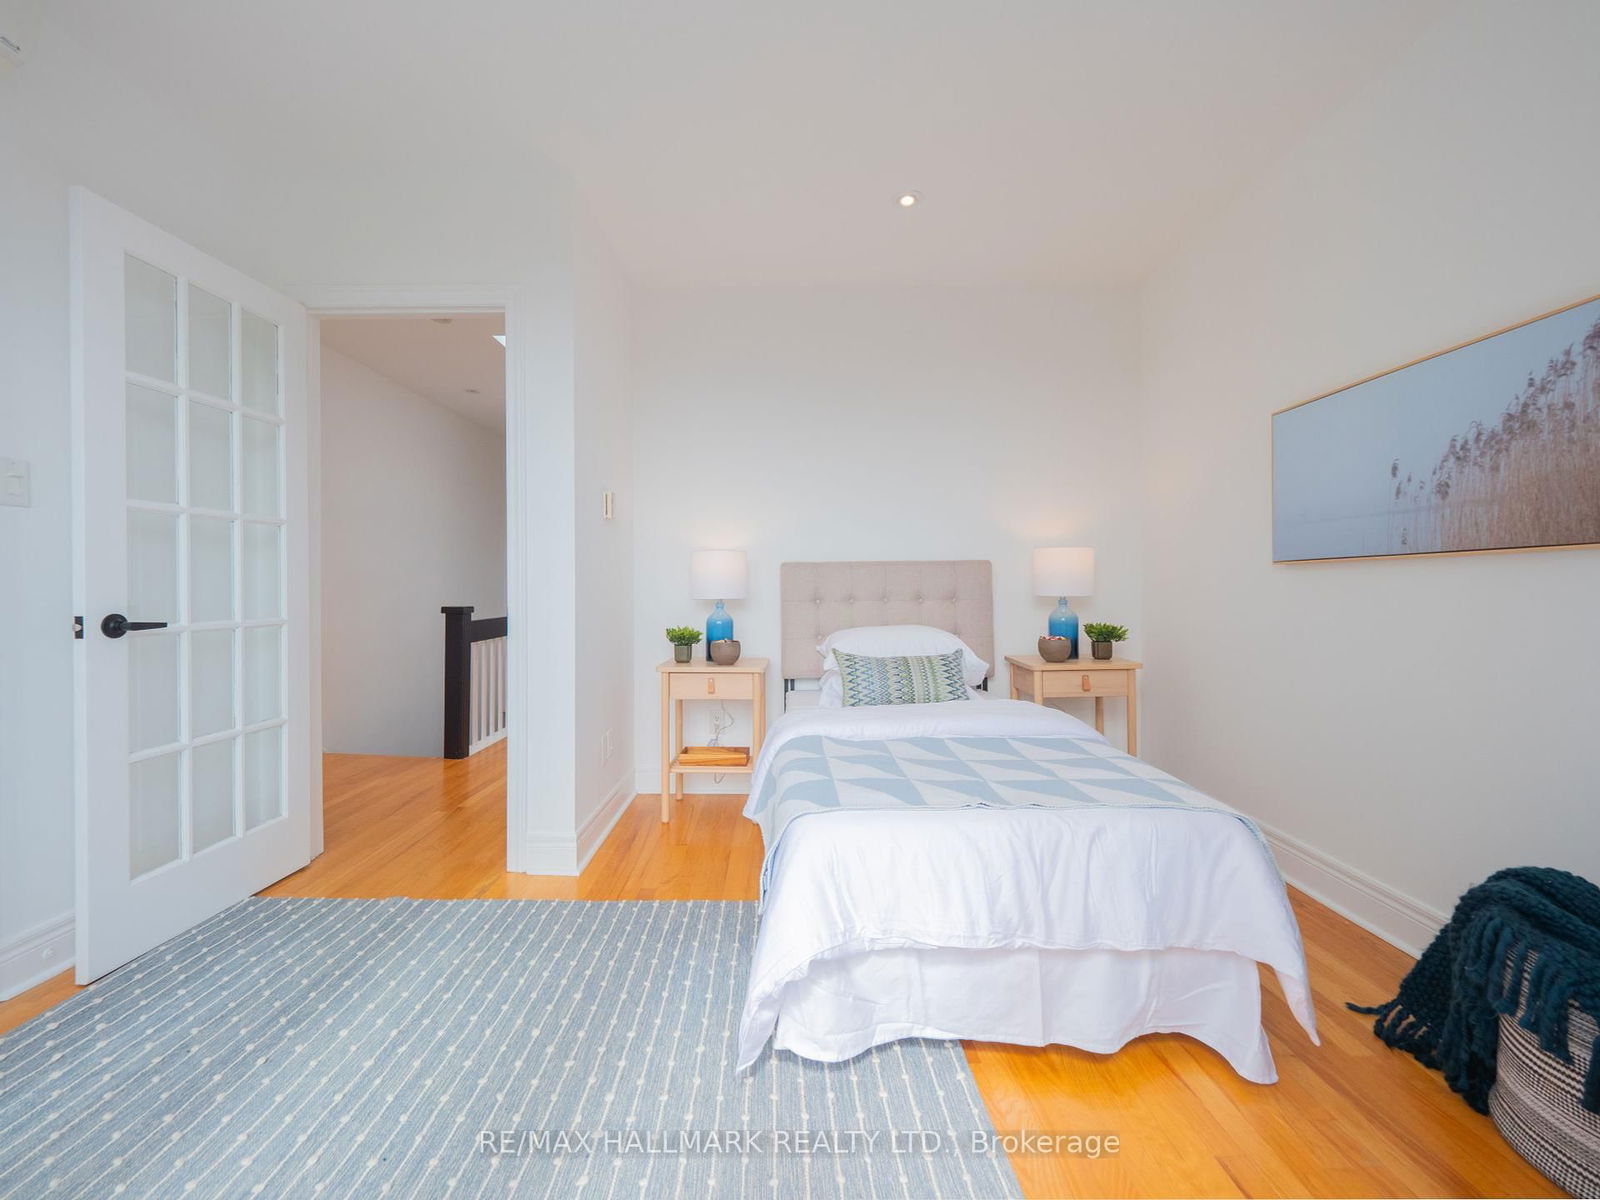
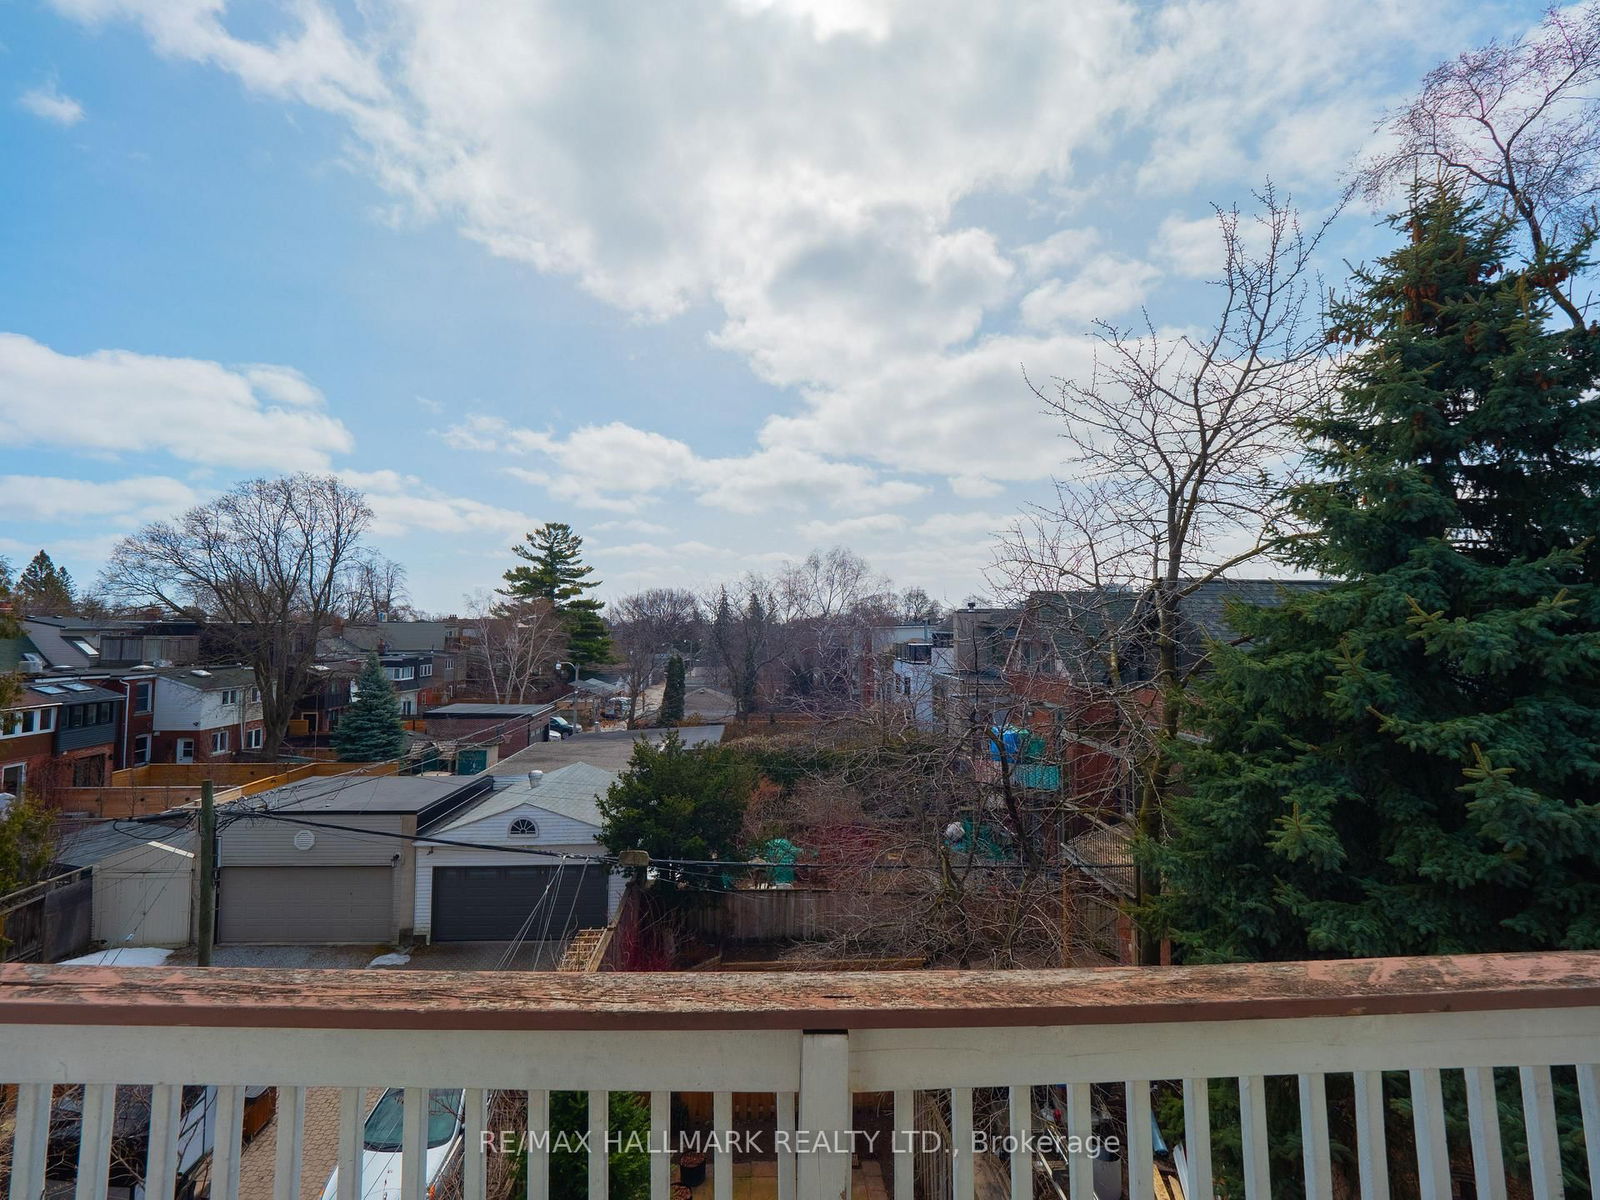
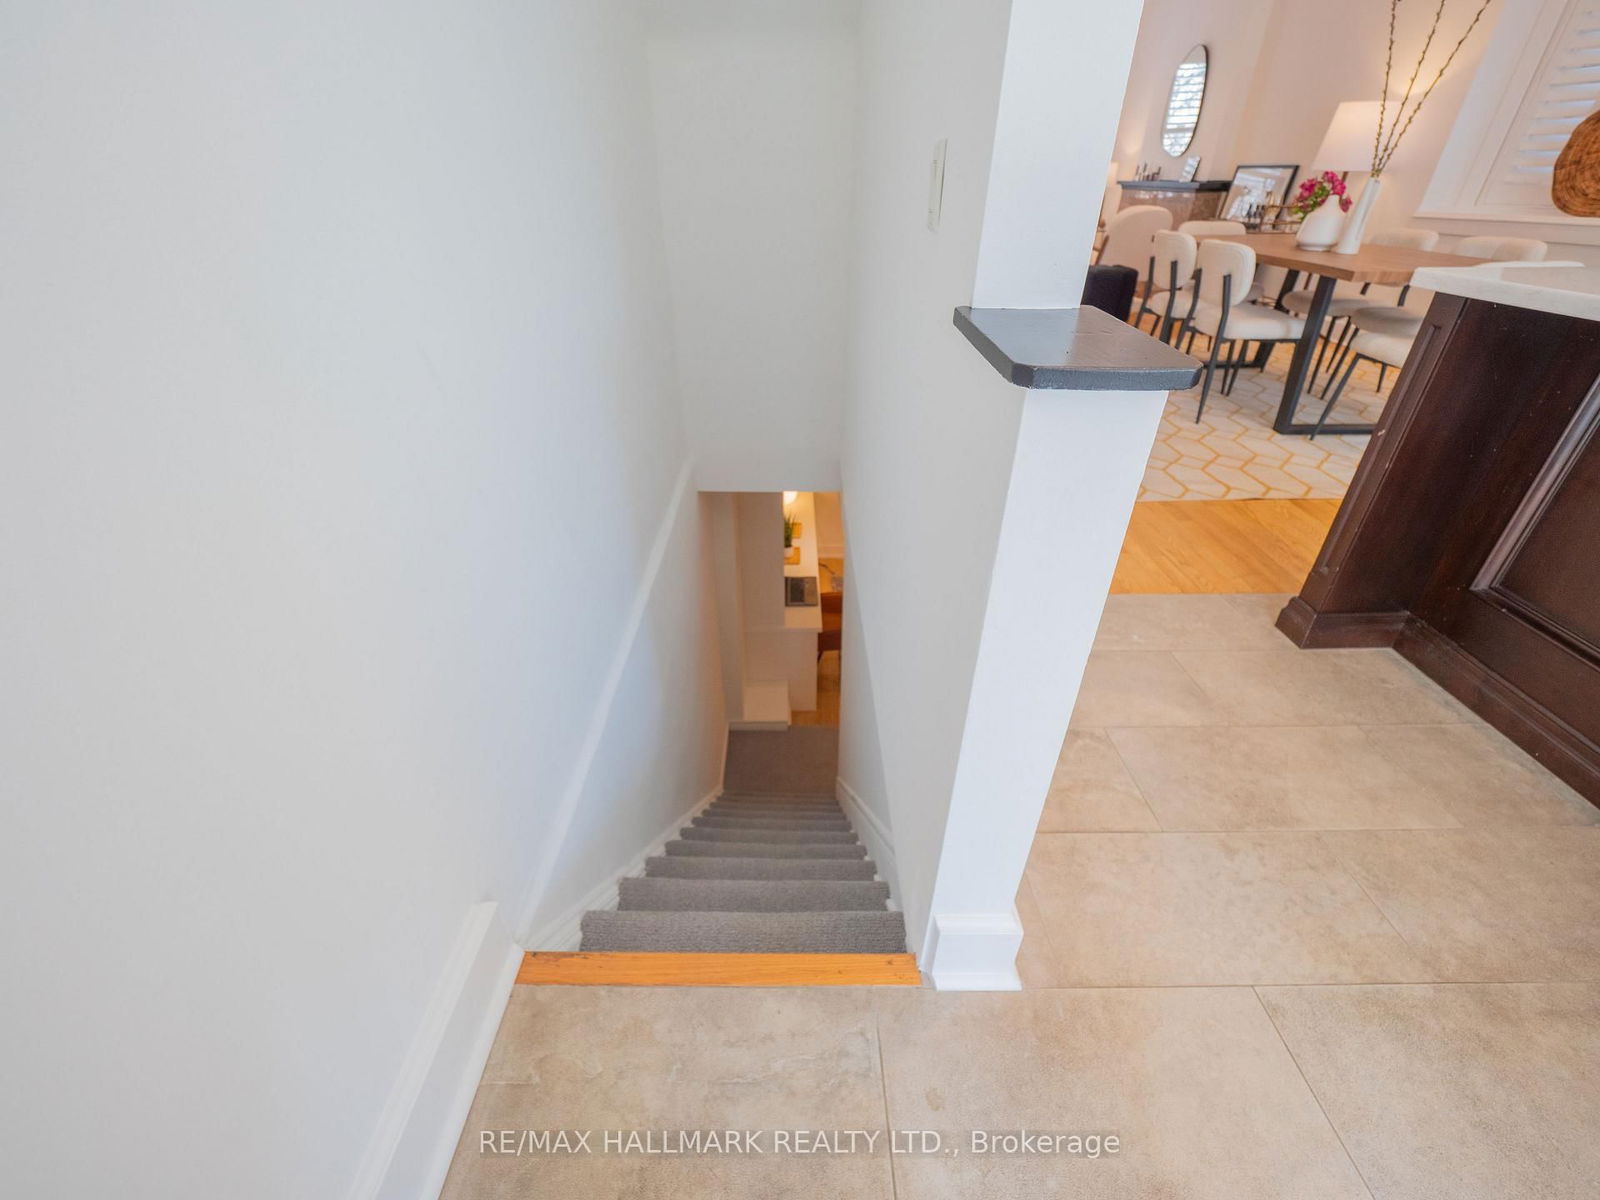
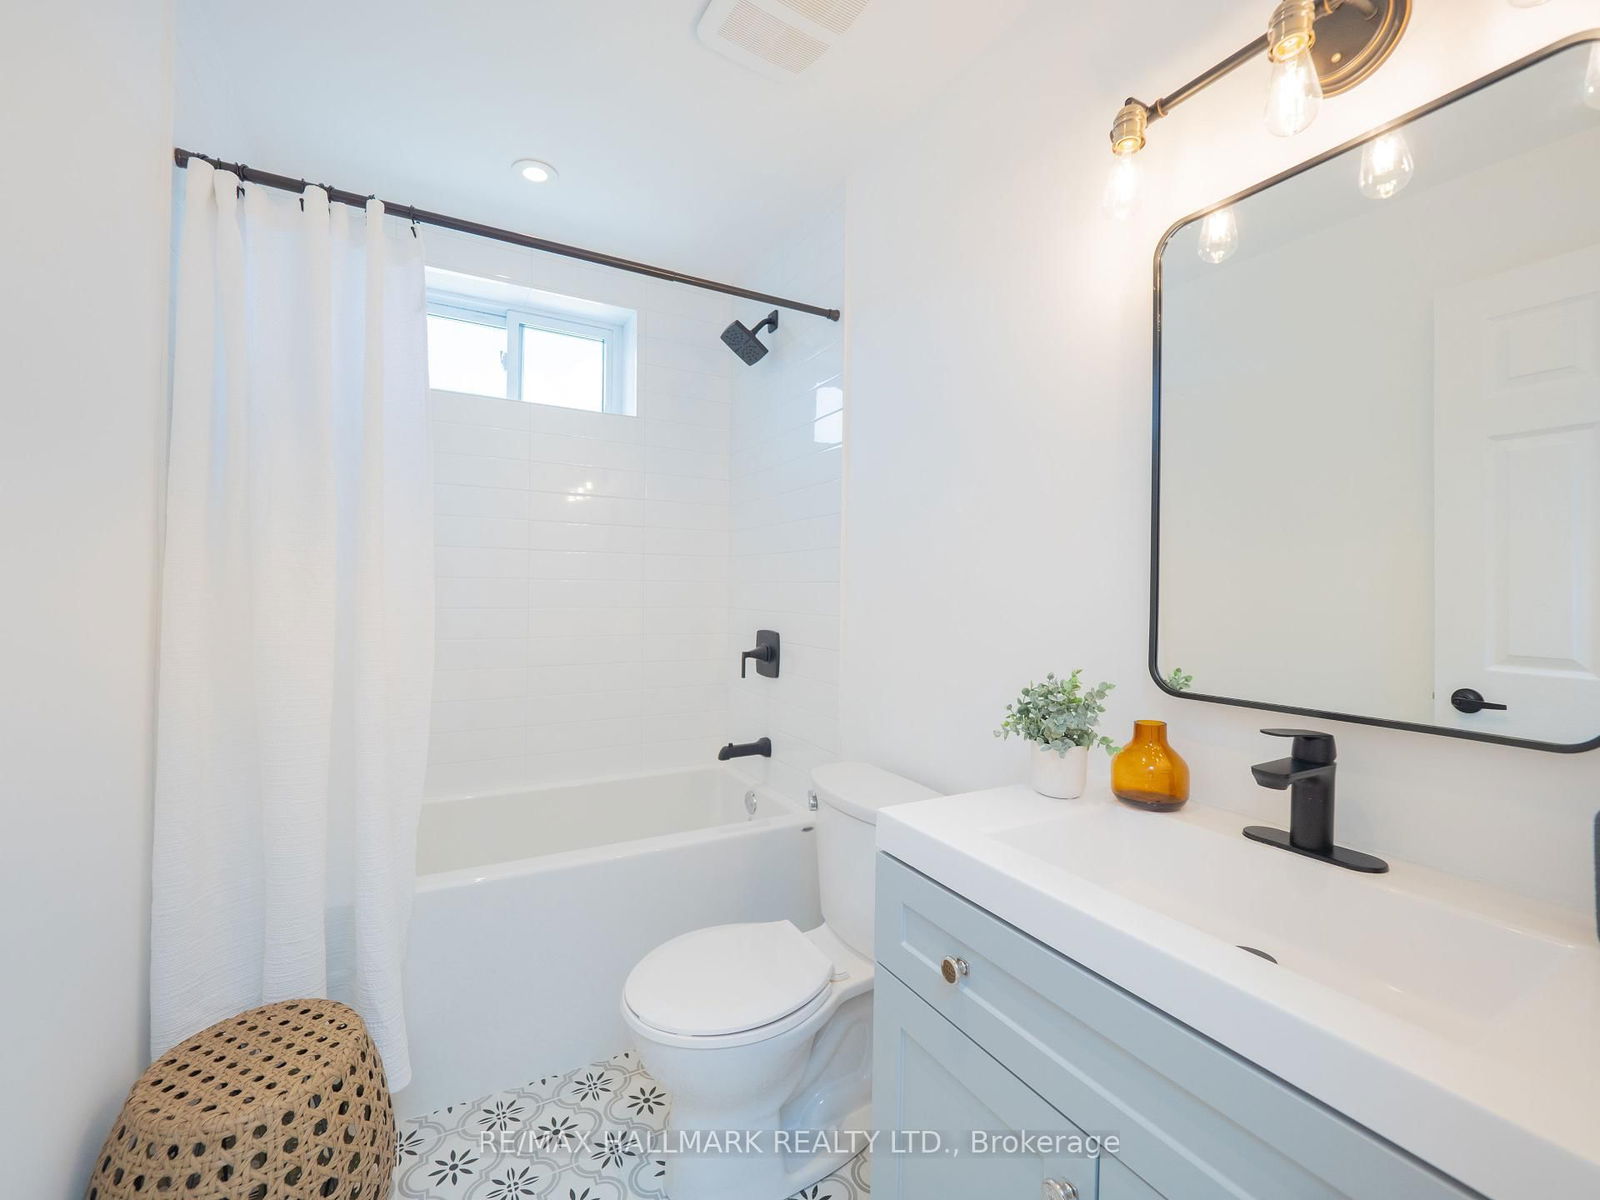
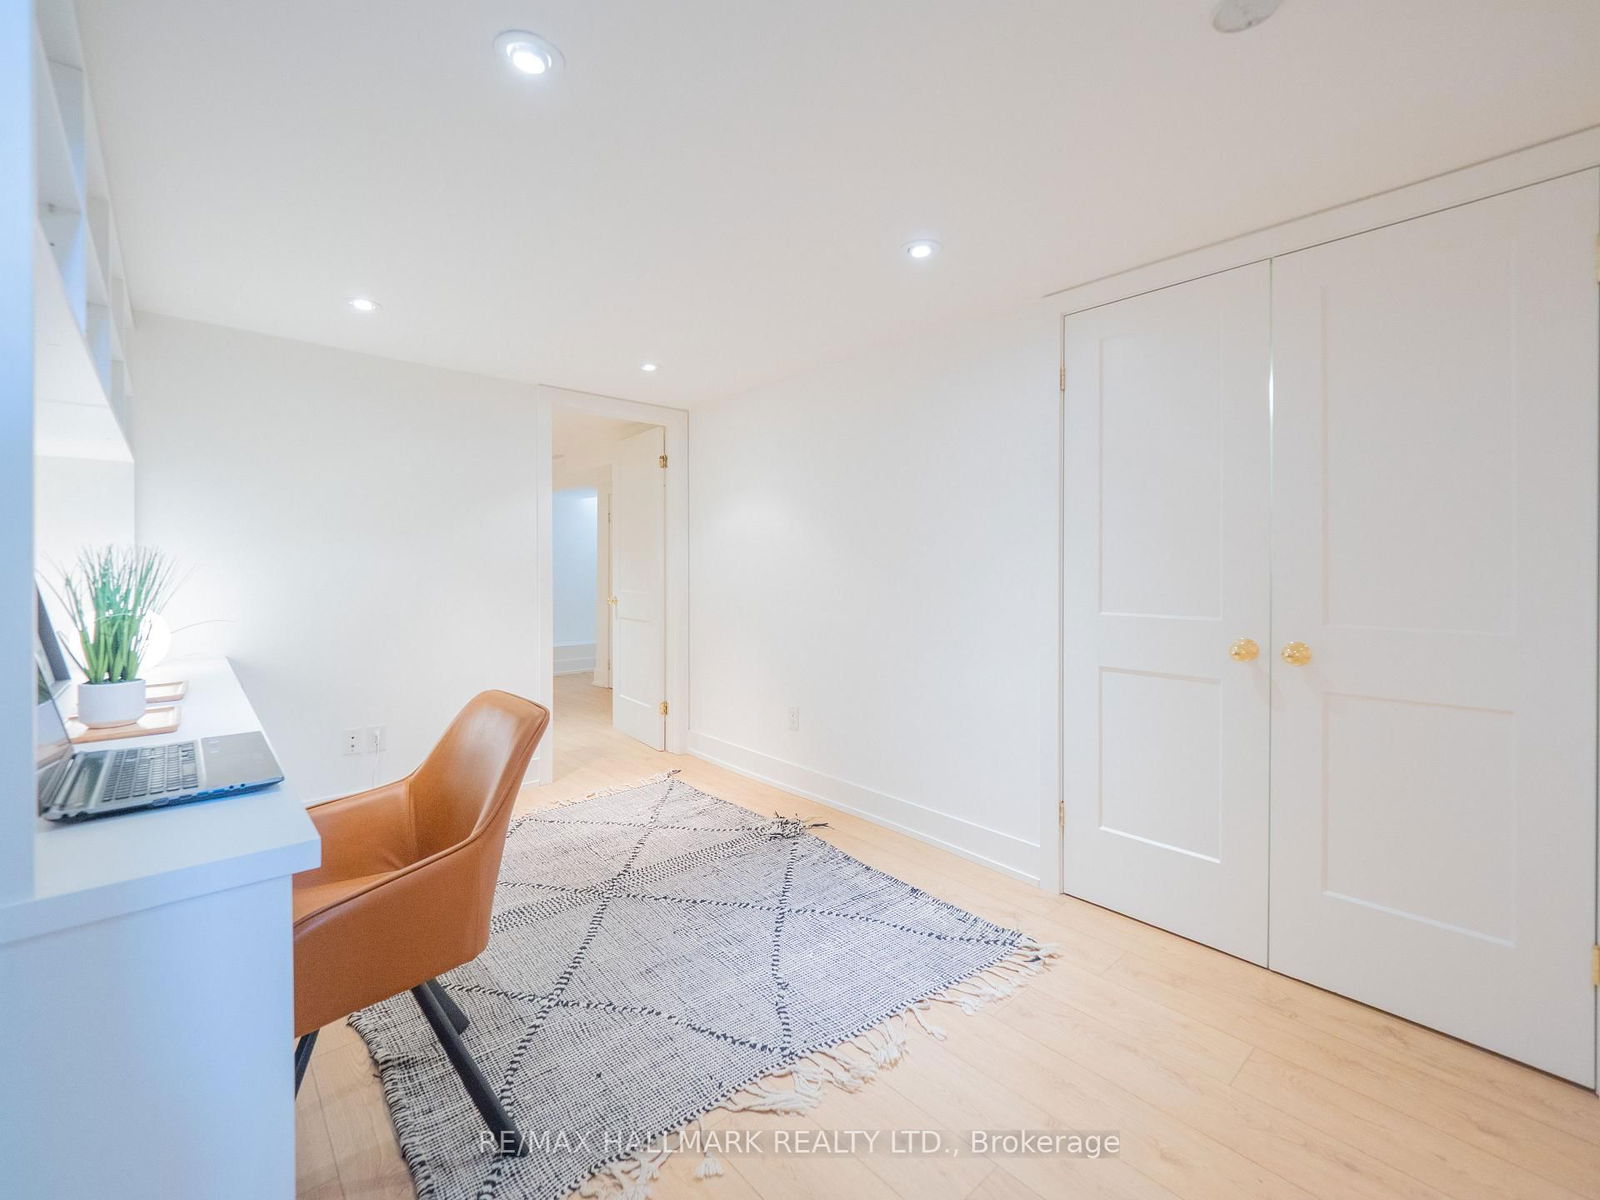
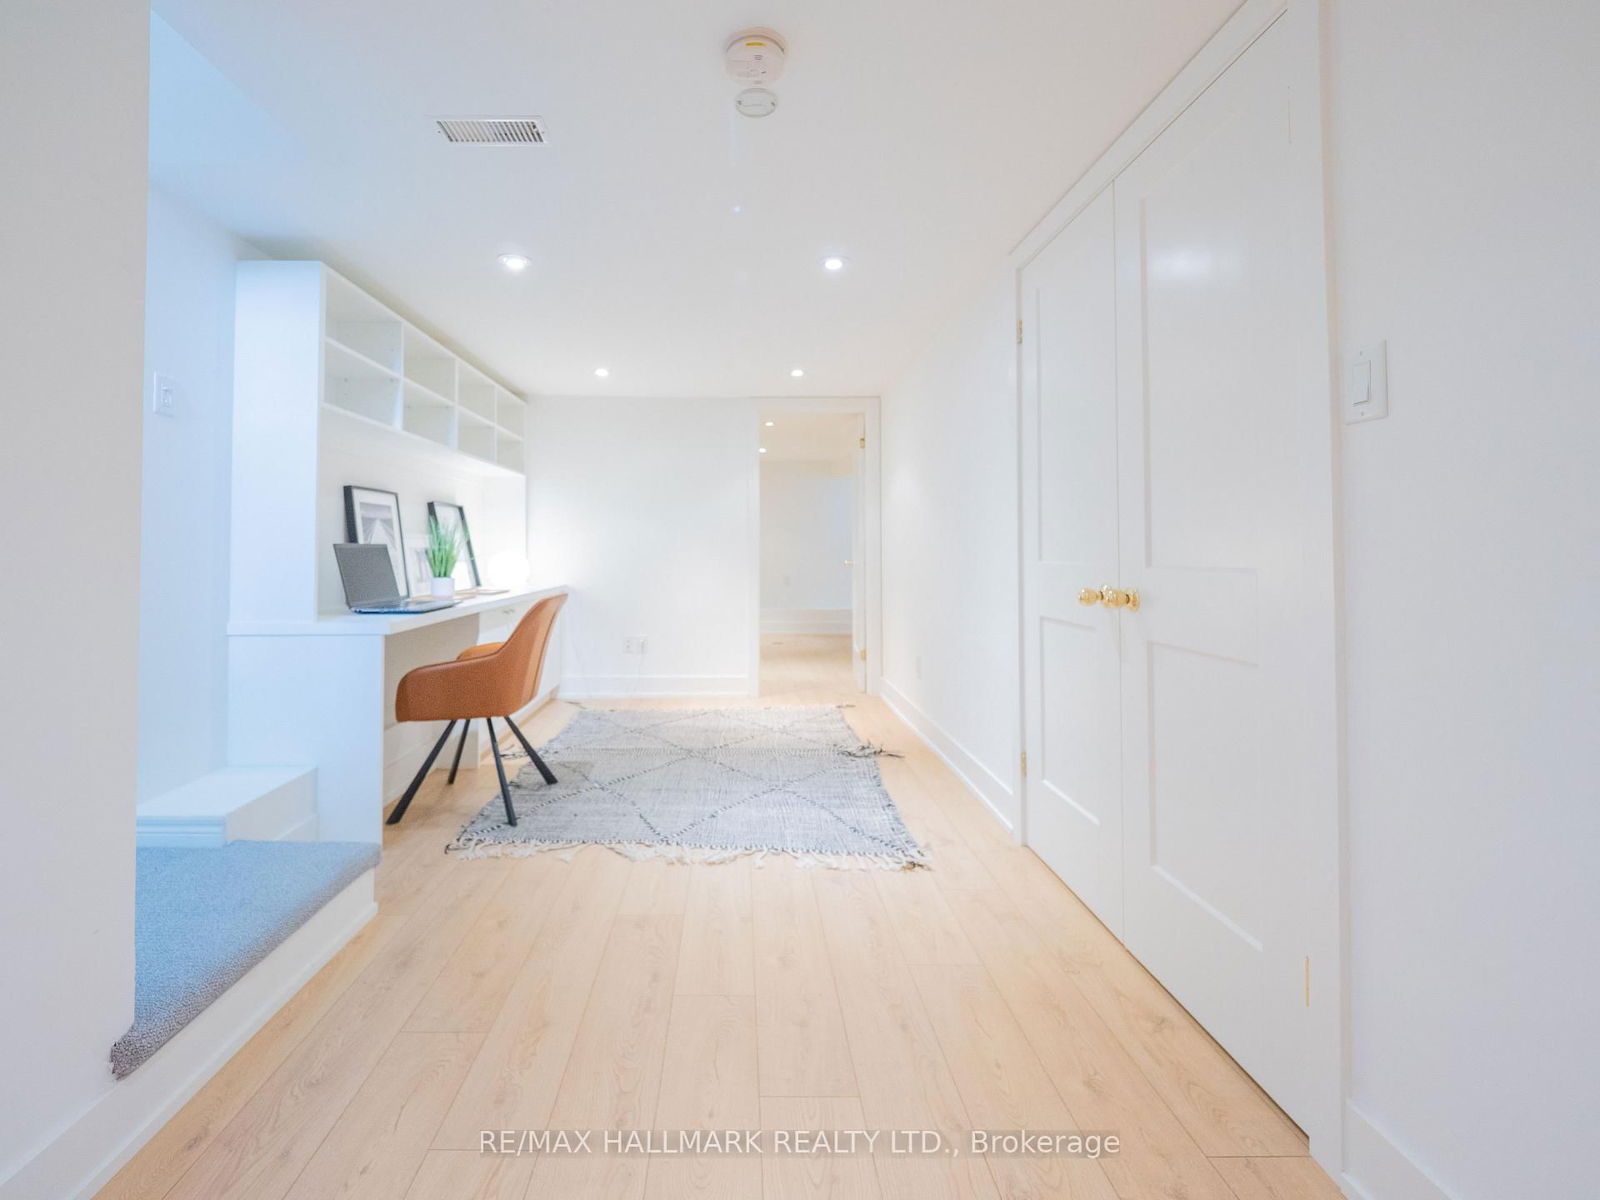
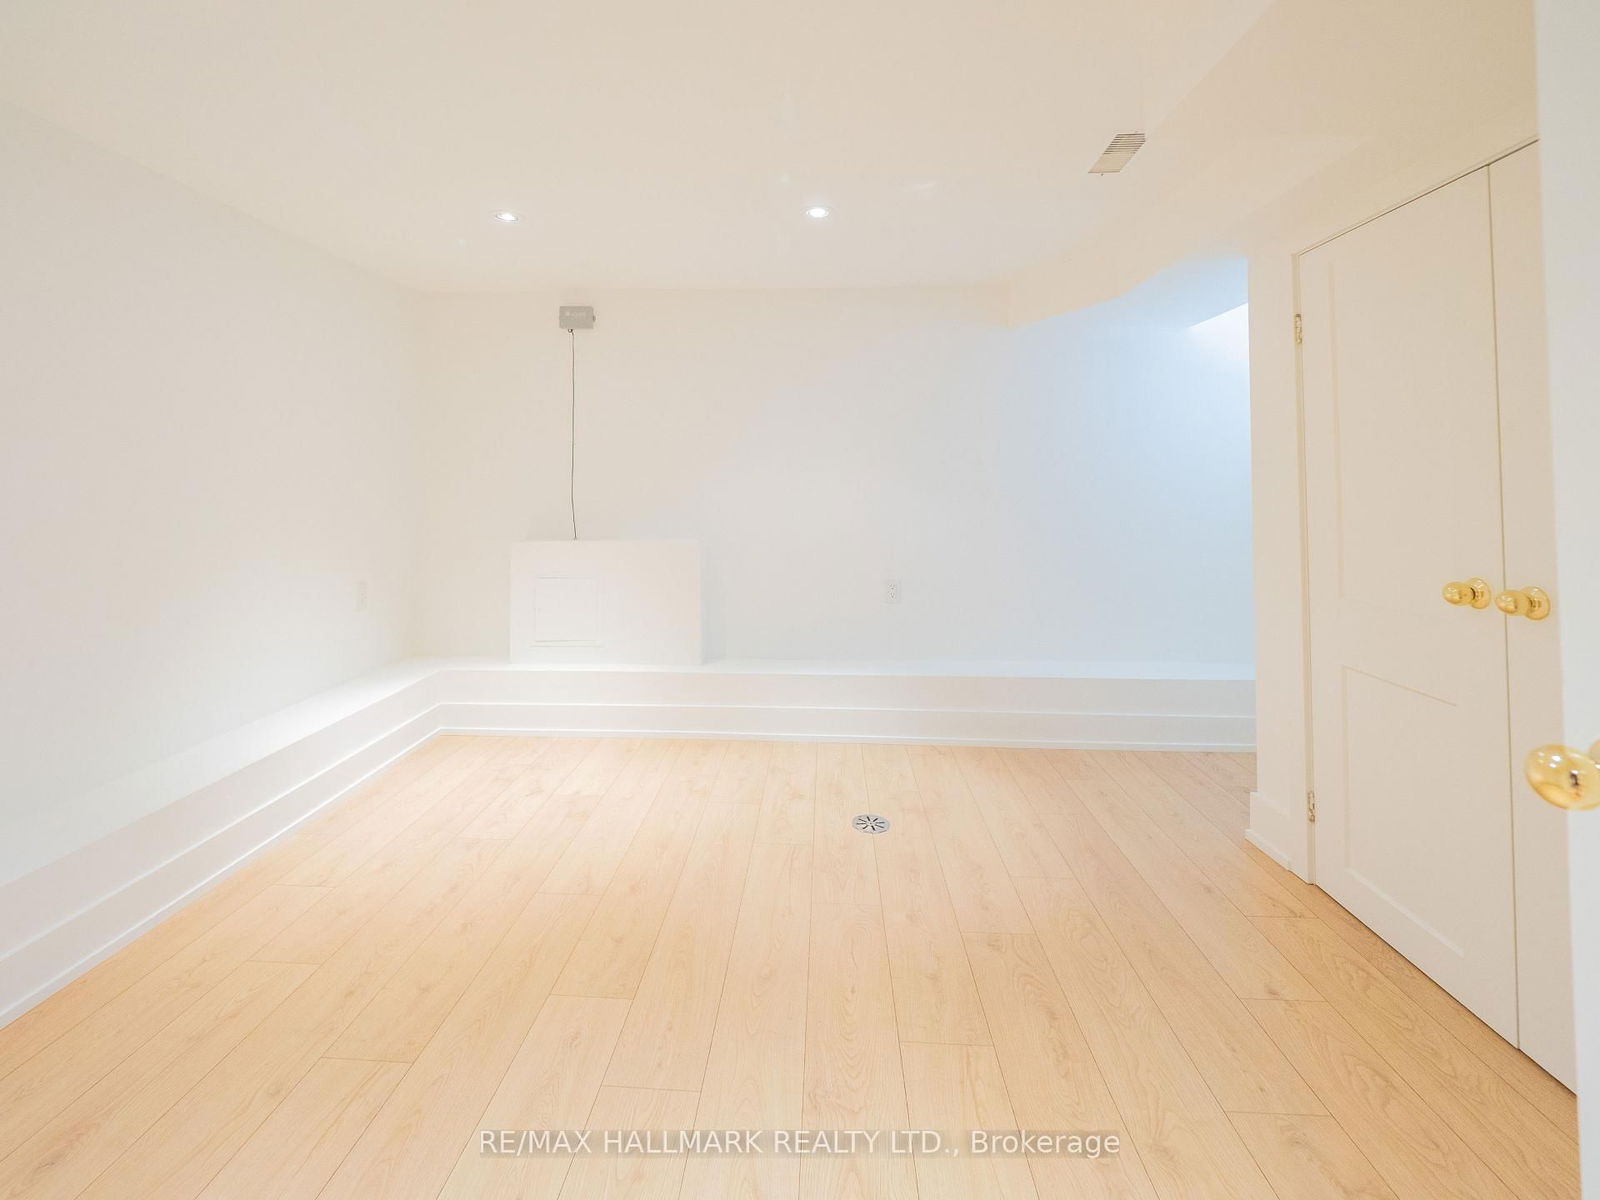
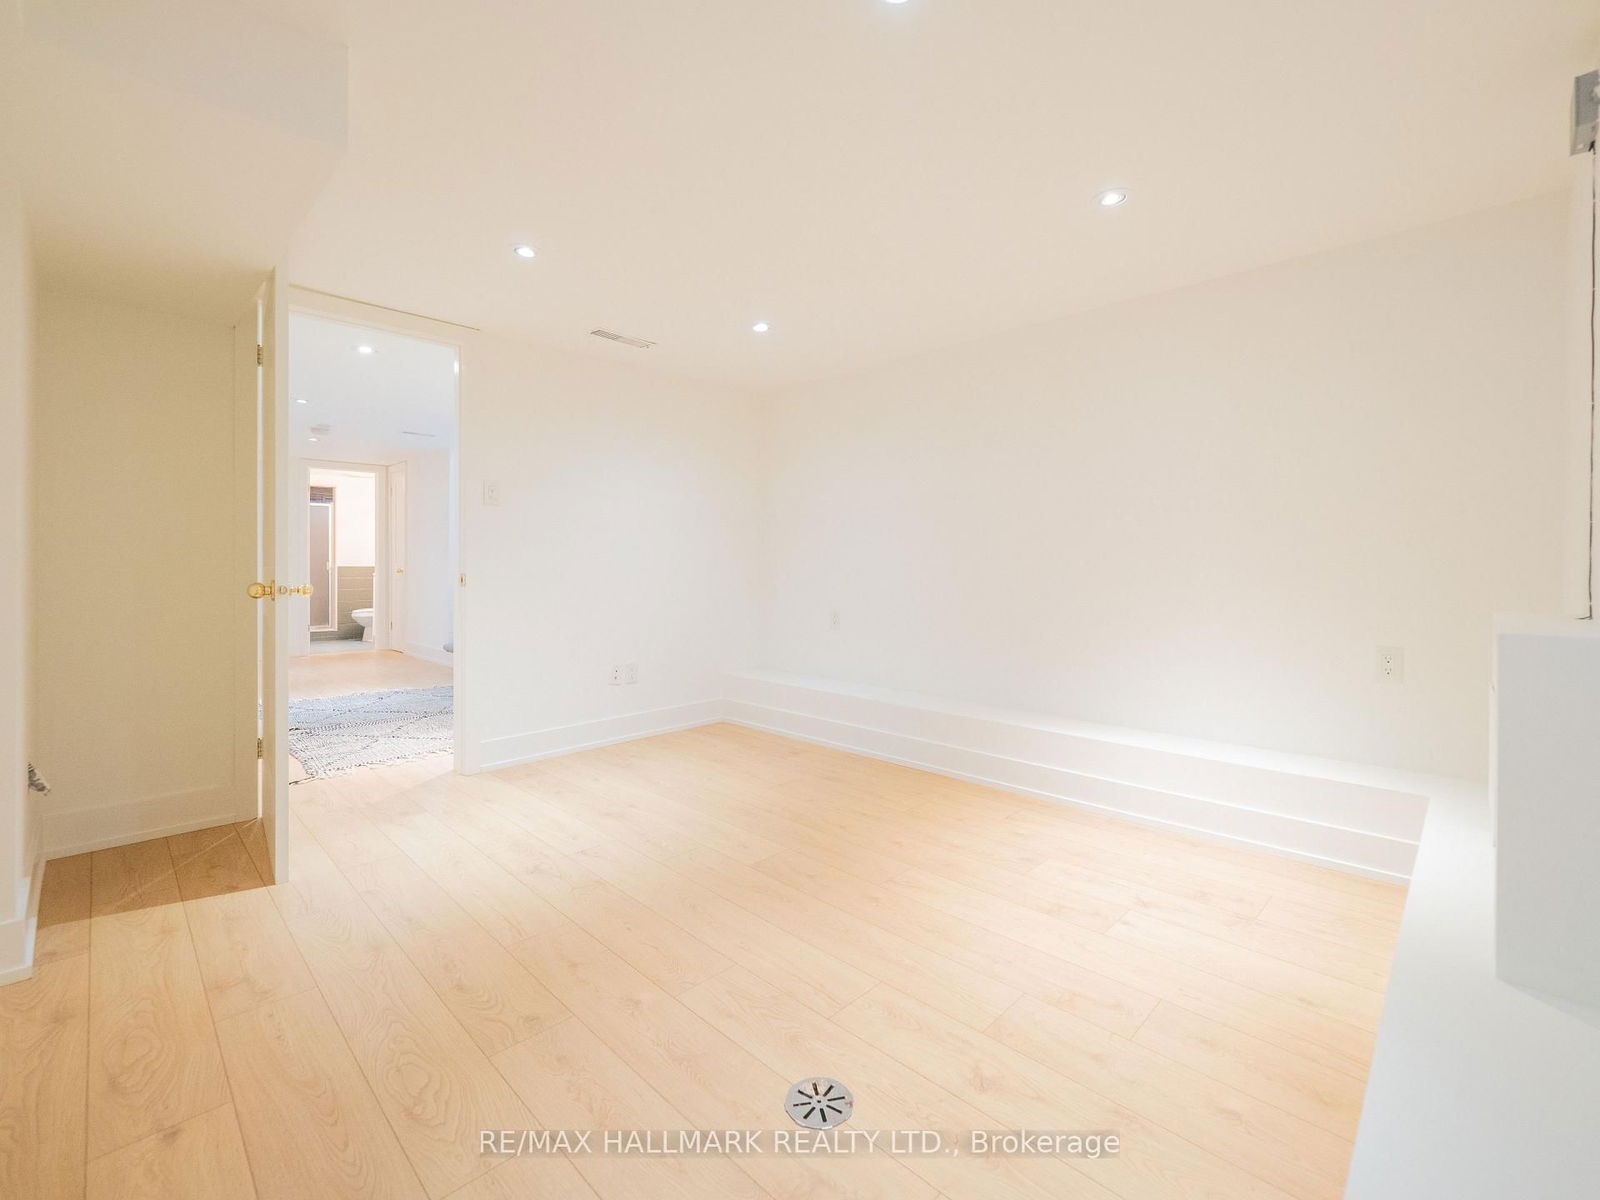
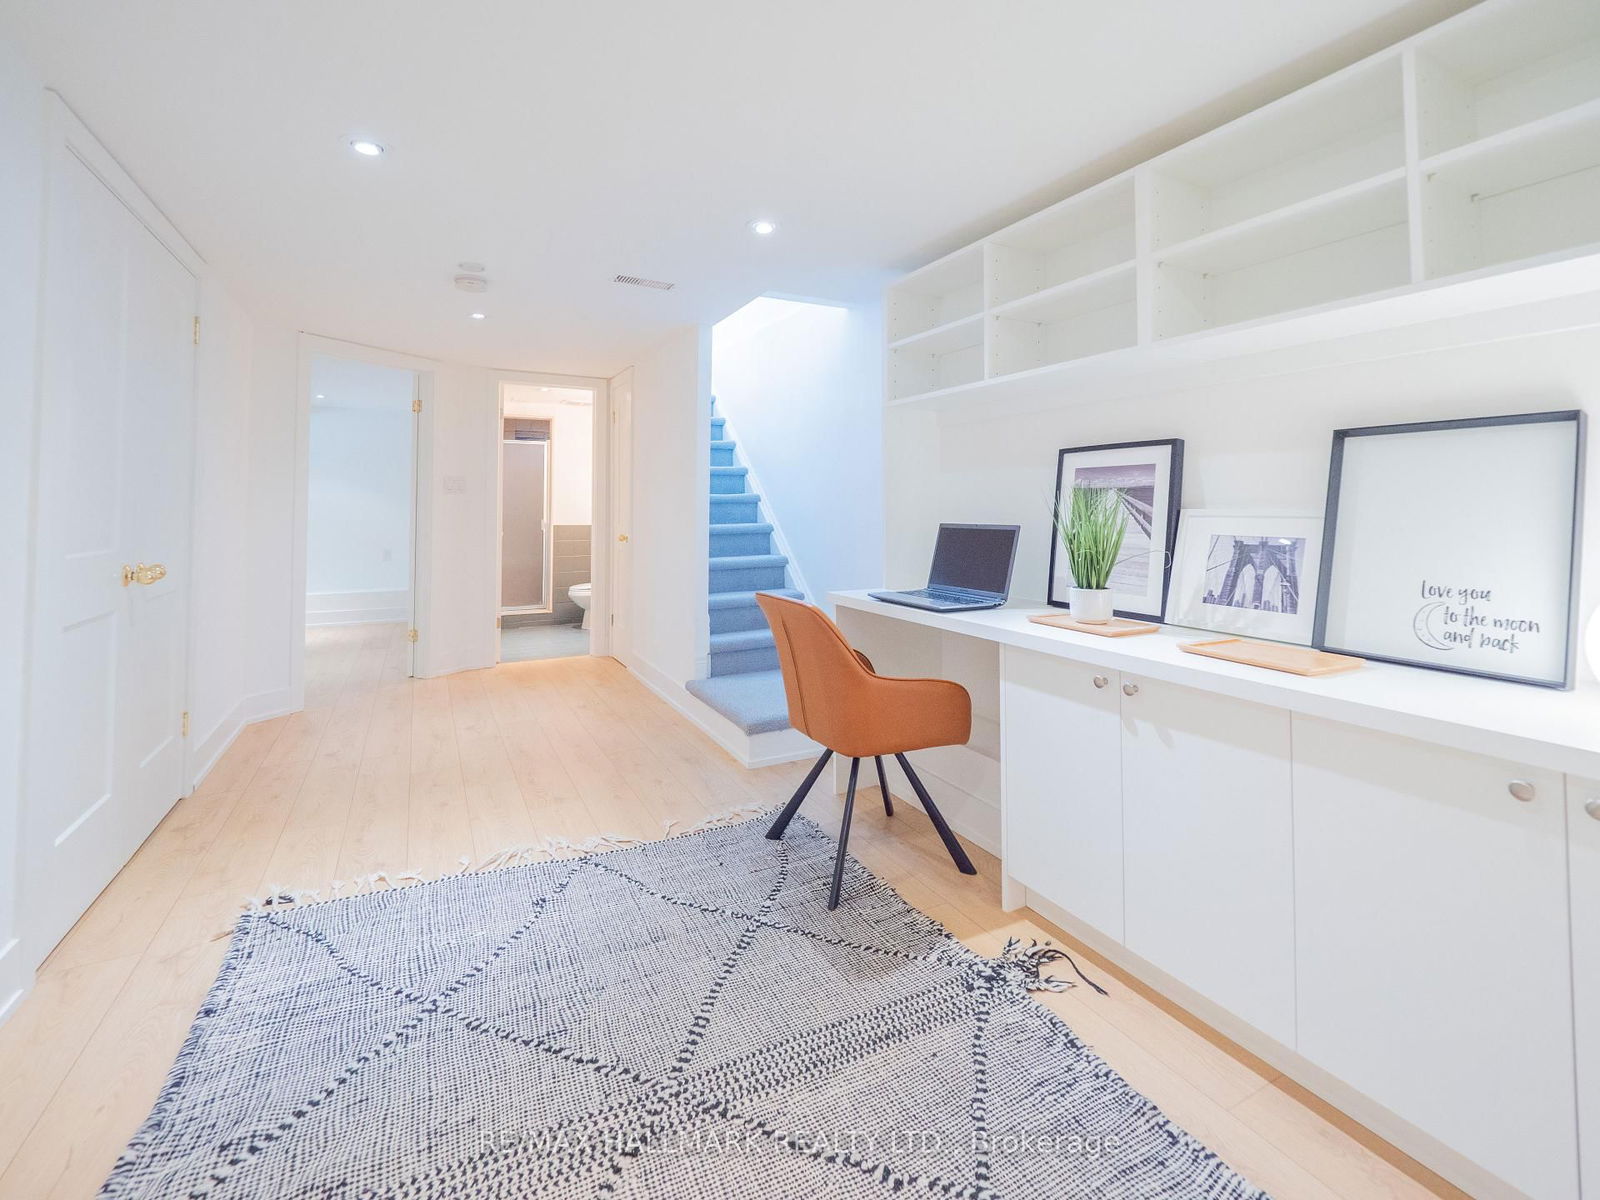
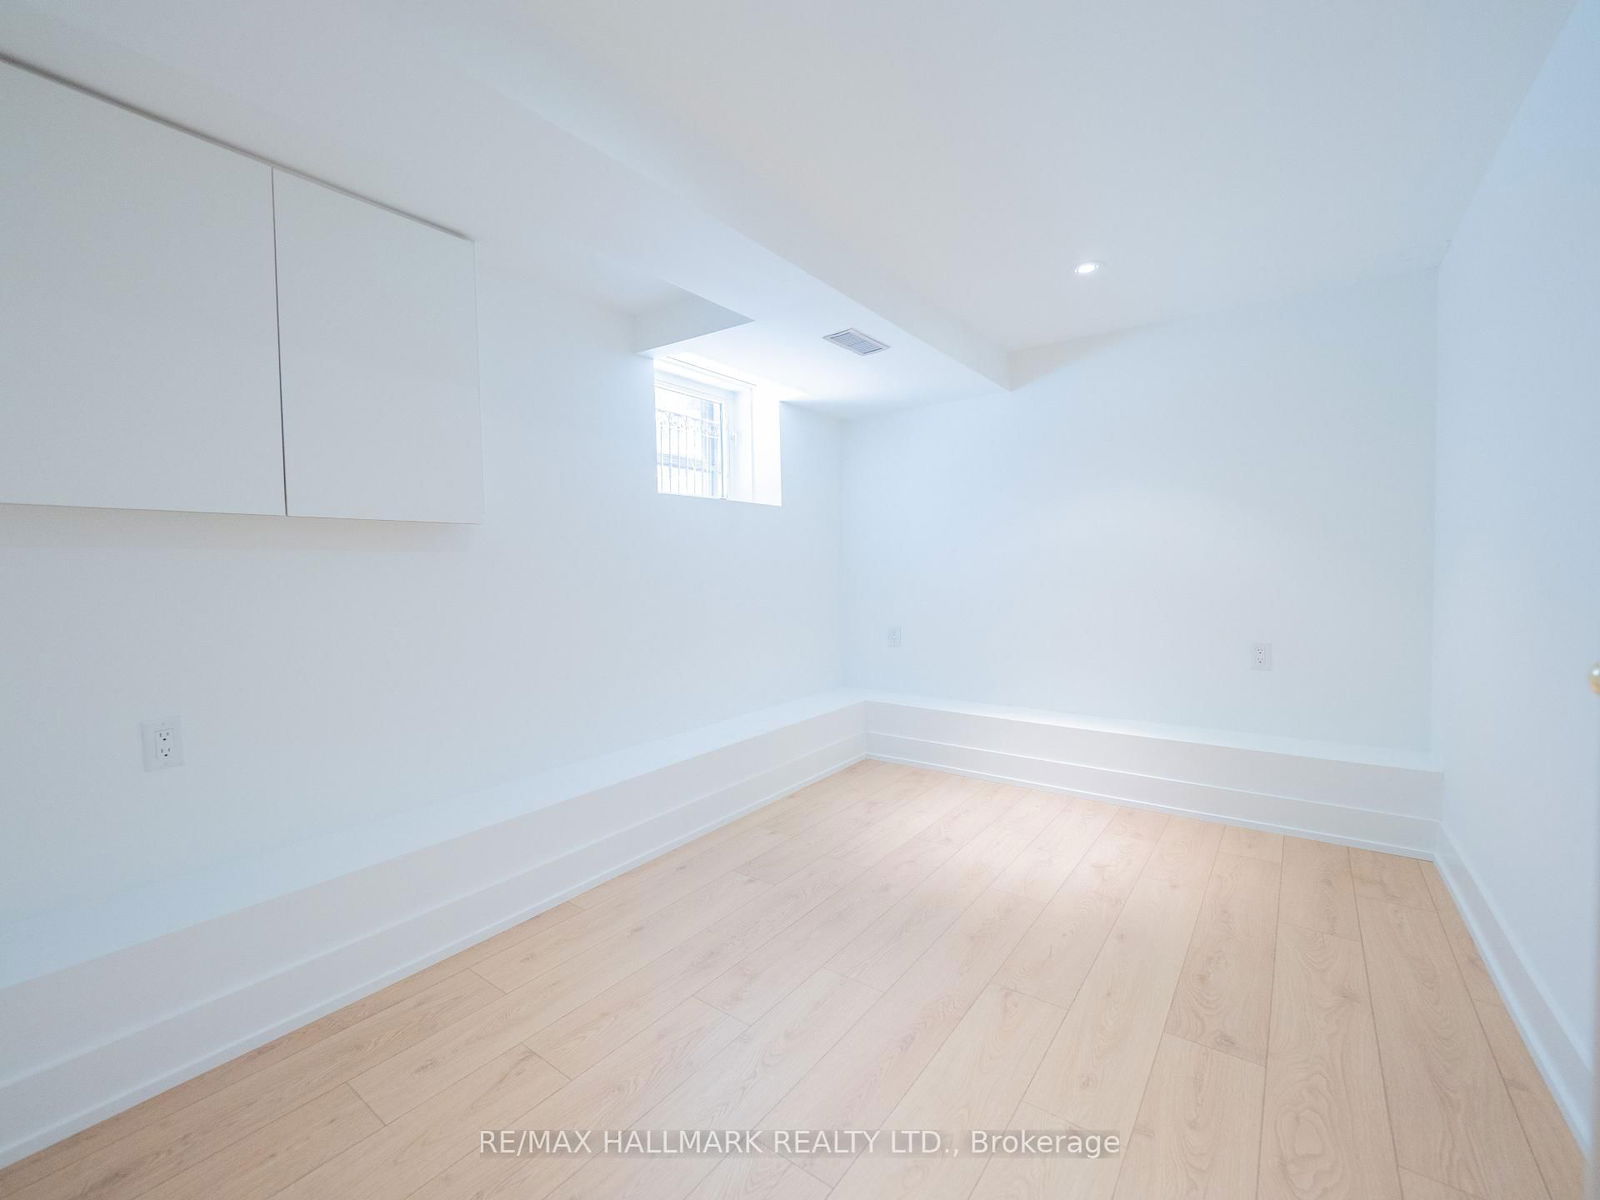
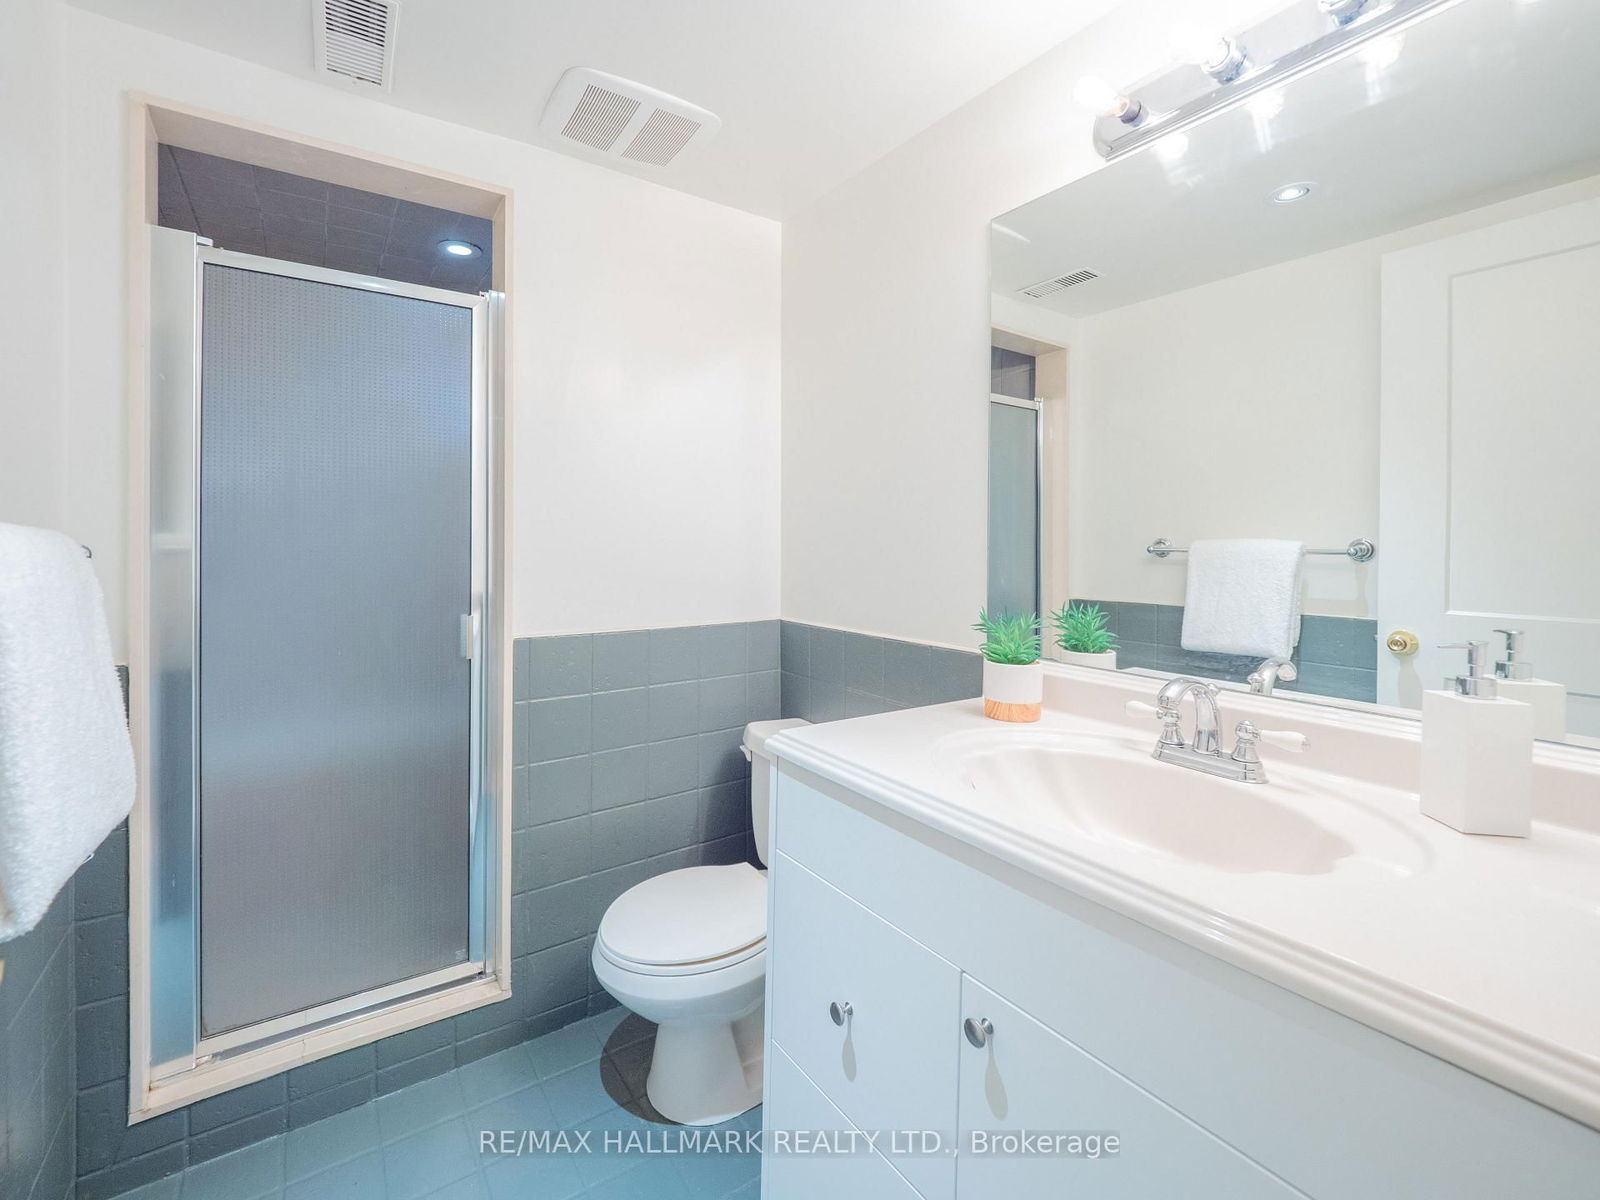
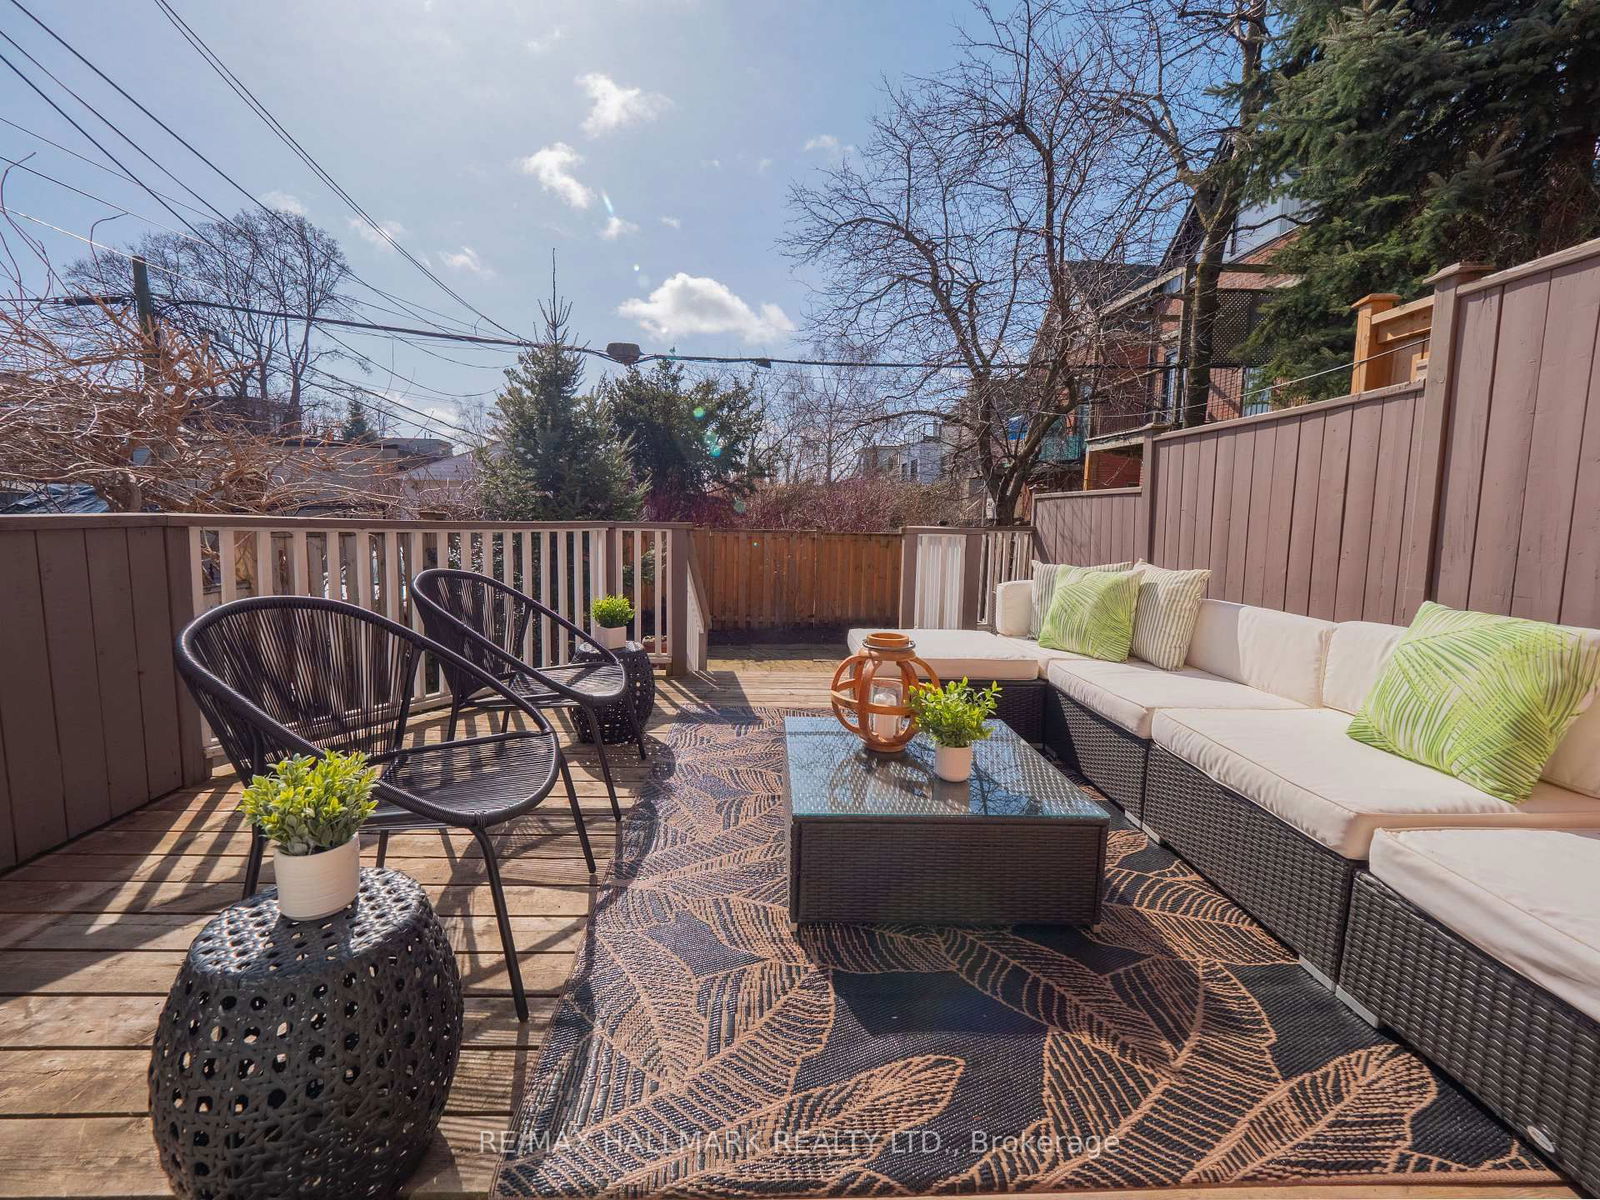
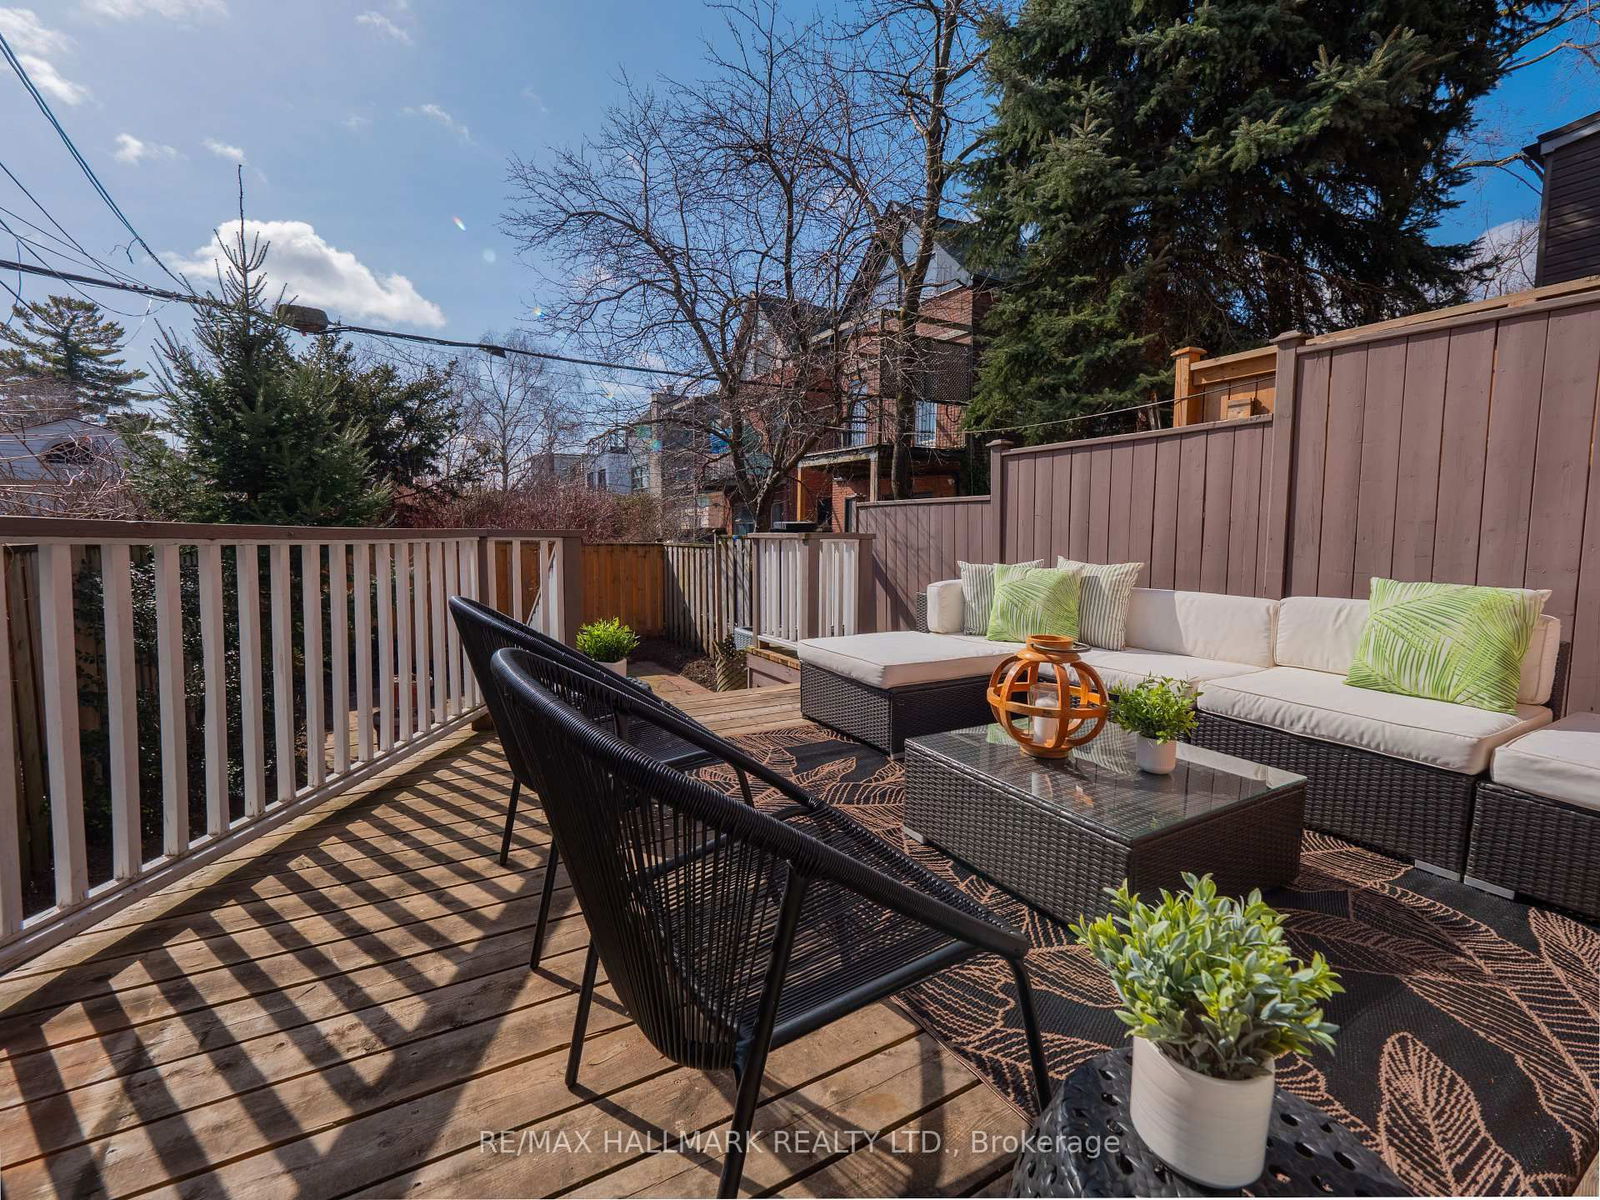
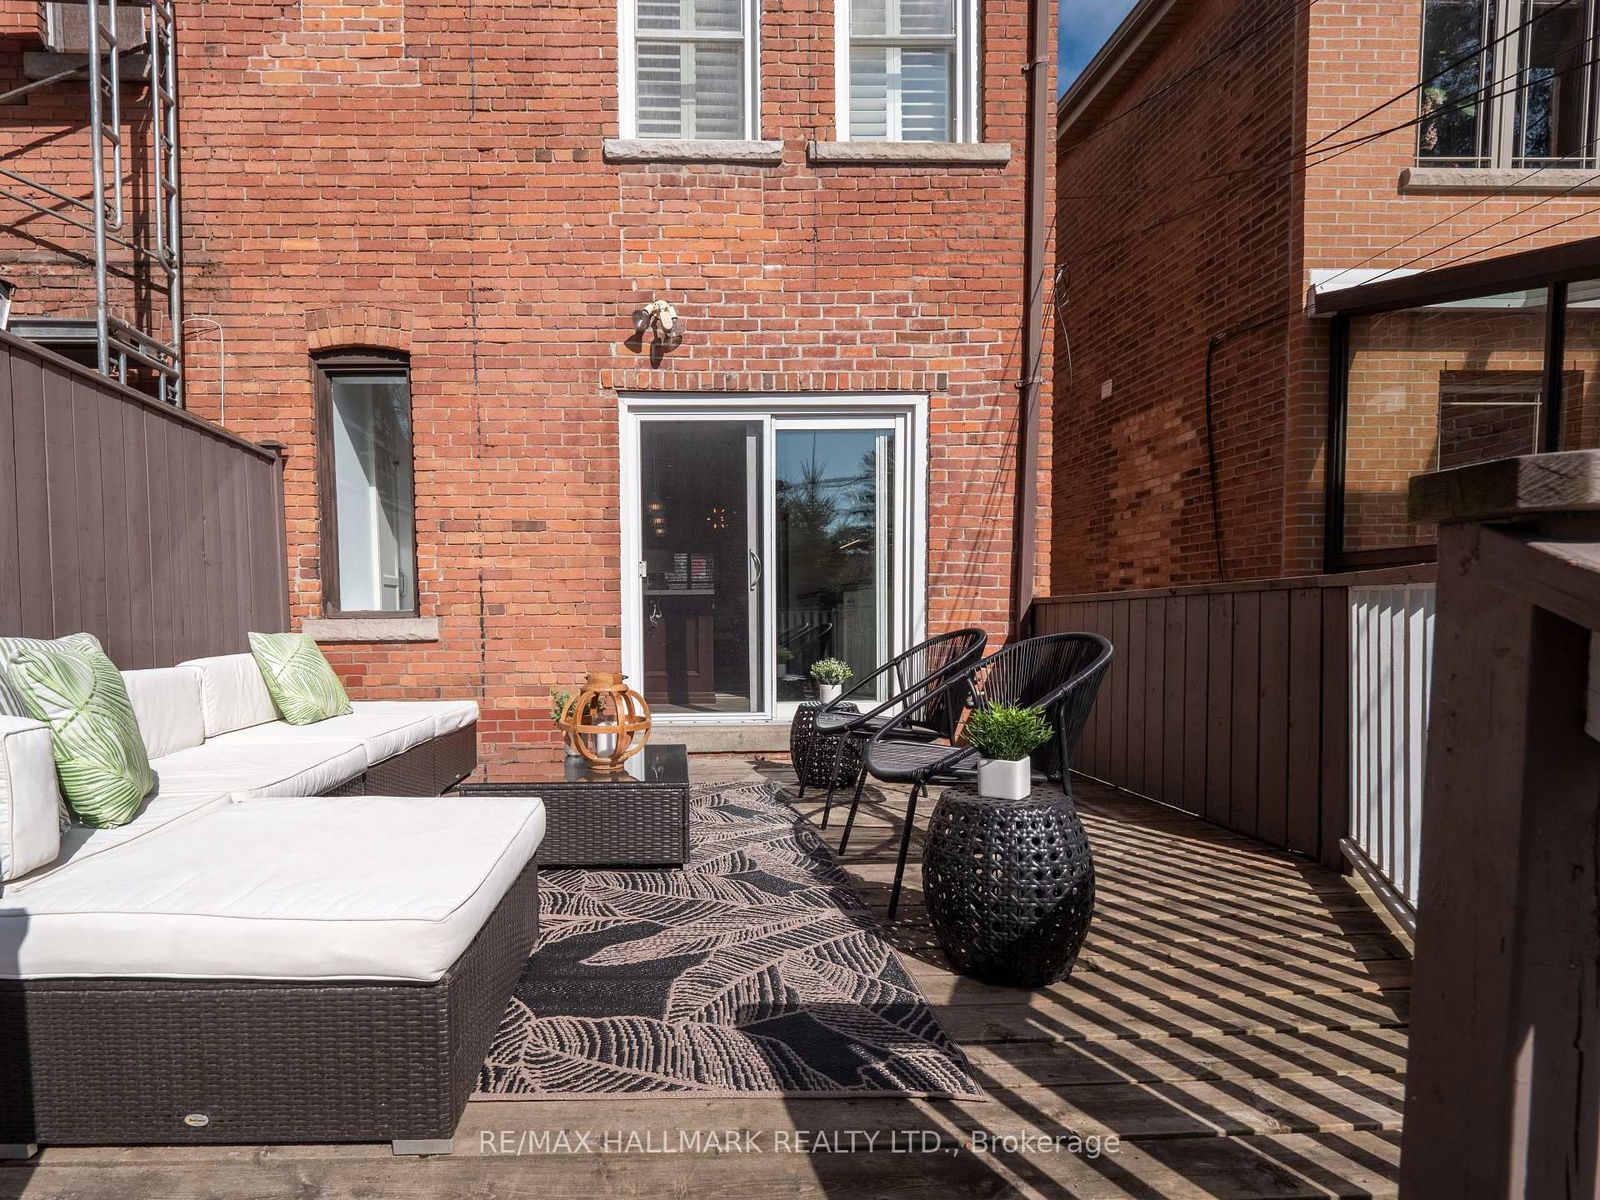
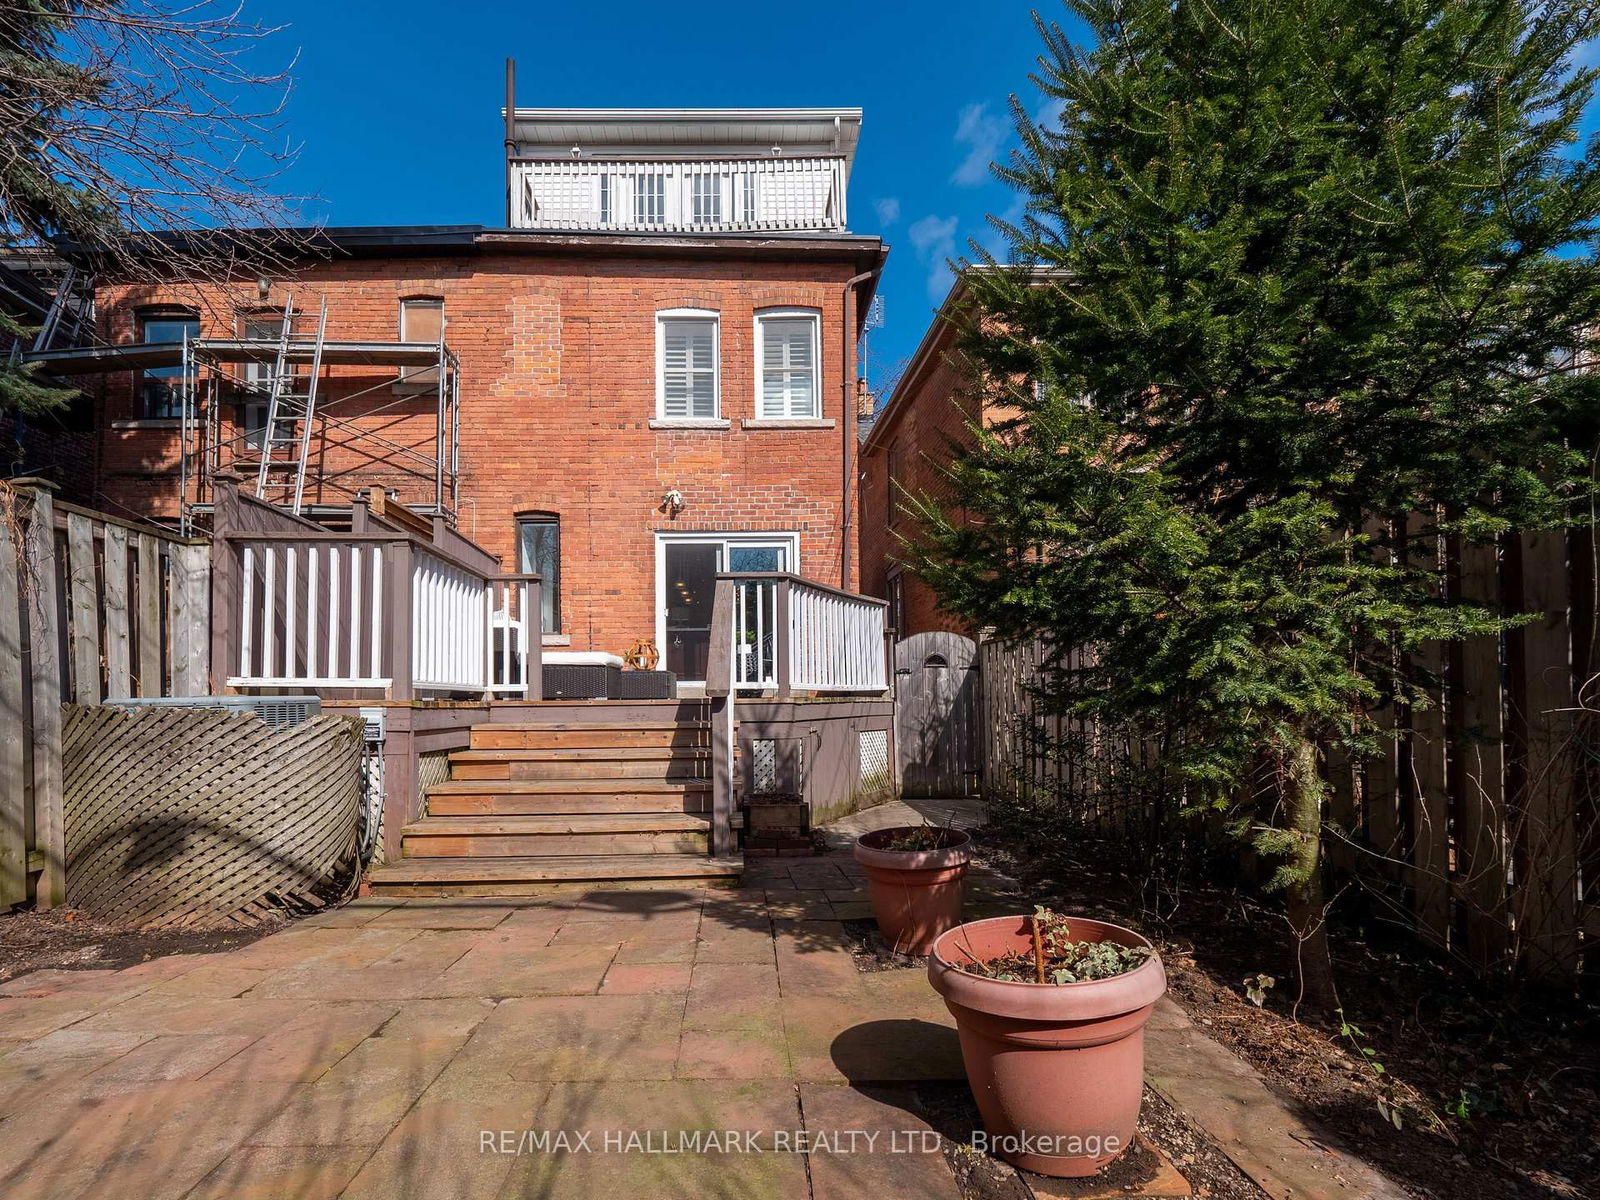
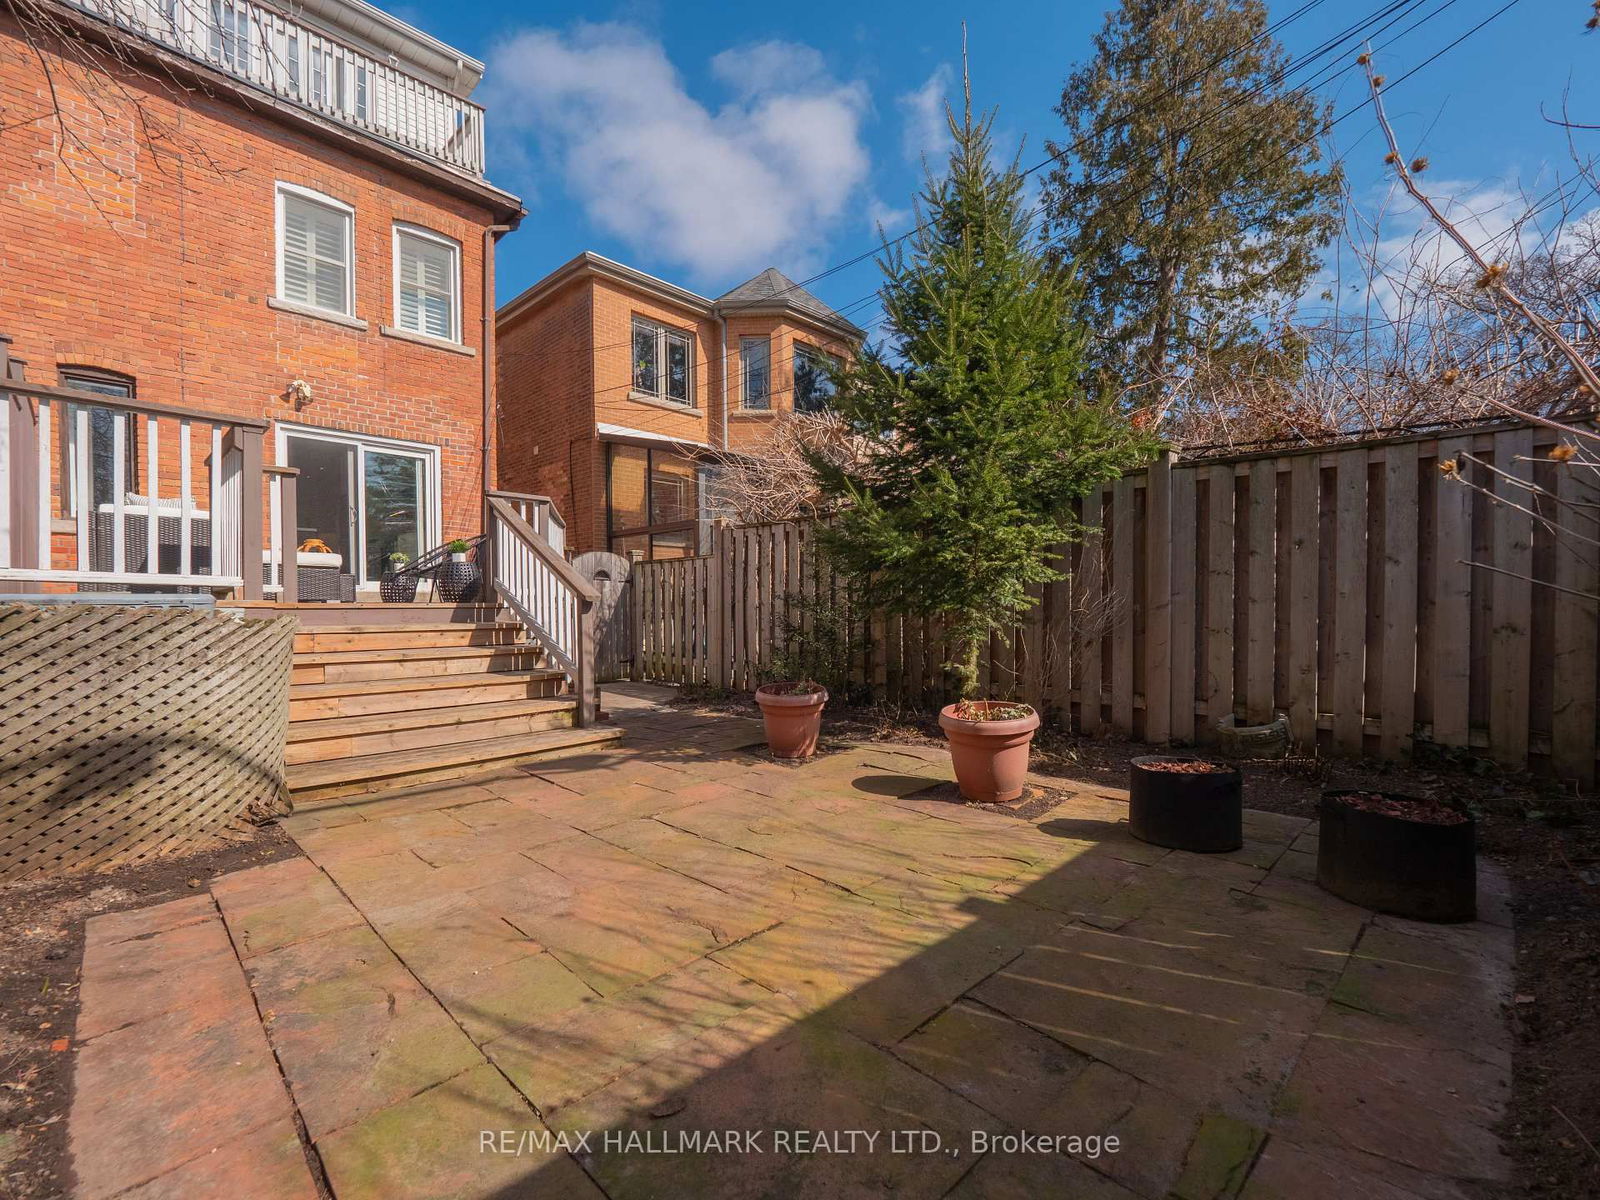
Welcome to 99 Browning Avenue -The One You've Been Waiting For. Perfectly positioned on one of the most beautiful, tree-lined streets in Playter Estates, this sun-soaked, south-facing home is a rare find. With four expansive levels, 4+2 bedrooms, and 4 bathrooms, there's room for your family to grow, work, entertain, and truly live. Step inside and be greeted by a bright, open-concept main floor with high ceilings, hardwood floors, pot lights, and a cozy wood-burning fireplace. The heart of the home - a custom-designed kitchen features an impressive 8-foot island, sleek stainless steel appliances, and plenty of space to gather. Walk out to your private, south-facing deck and fenced-in yard -a quiet urban oasis in the heart of the city. Upstairs, discover three spa-inspired bathrooms, a luxurious primary retreat complete with a walk-in closet and ensuite, and wide, airy hallways leading you through the second and third floors. Natural light pours in through the skylight, adding to the sense of calm and comfort. The finished, dug-down basement offers high ceilings and incredible versatility perfect for a home office, guest space, or nanny suite. All this in the Jackman School district, just steps from the Danforth, TTC, parks, and some of the east ends best cafés and shops. Incredible neighbours, unbeatable location, and nothing to do but move in. This is not just a house. This is home. And its one you don't want to miss.
Existing S/S gas stove, double door fridge, built-in dishwasher, built-in microwave, range hood, washer and dryer, GB&E, CAC, electric light fixtures, window coverings
Living
Dining
Kitchen
Primary
2nd Br
3rd Br
4th Br
Rec
Br
Br
The graph below compares the average list price and average sale price of homes in this neighborhood by month for the last 24 months. When average sale price is greater than average list price, this may suggest a buyer's market. When average sale price is lower than the average list price this may suggest a seller's market.
The graph below illustrates the average days on market for homes in this neighborhood. The yellow area may indicate a buyer's market, the green area may indicate a balanced market and the red area may indicate a seller's market.
Sales Representative, Century 21 People’s Choice Realty Inc., Brokerage
(647) 576 - 2100