
Century 21 People’s Choice Realty Inc., Brokerage
120 MATHESON BLVD E #103
MISSISSAUGA, Ontario
L4Z 1X1


Toronto, Englemount-Lawrence, M6B 2H8
$2,999,000$000000
Listed by SLAVENS & ASSOCIATES REAL ESTATE INC..
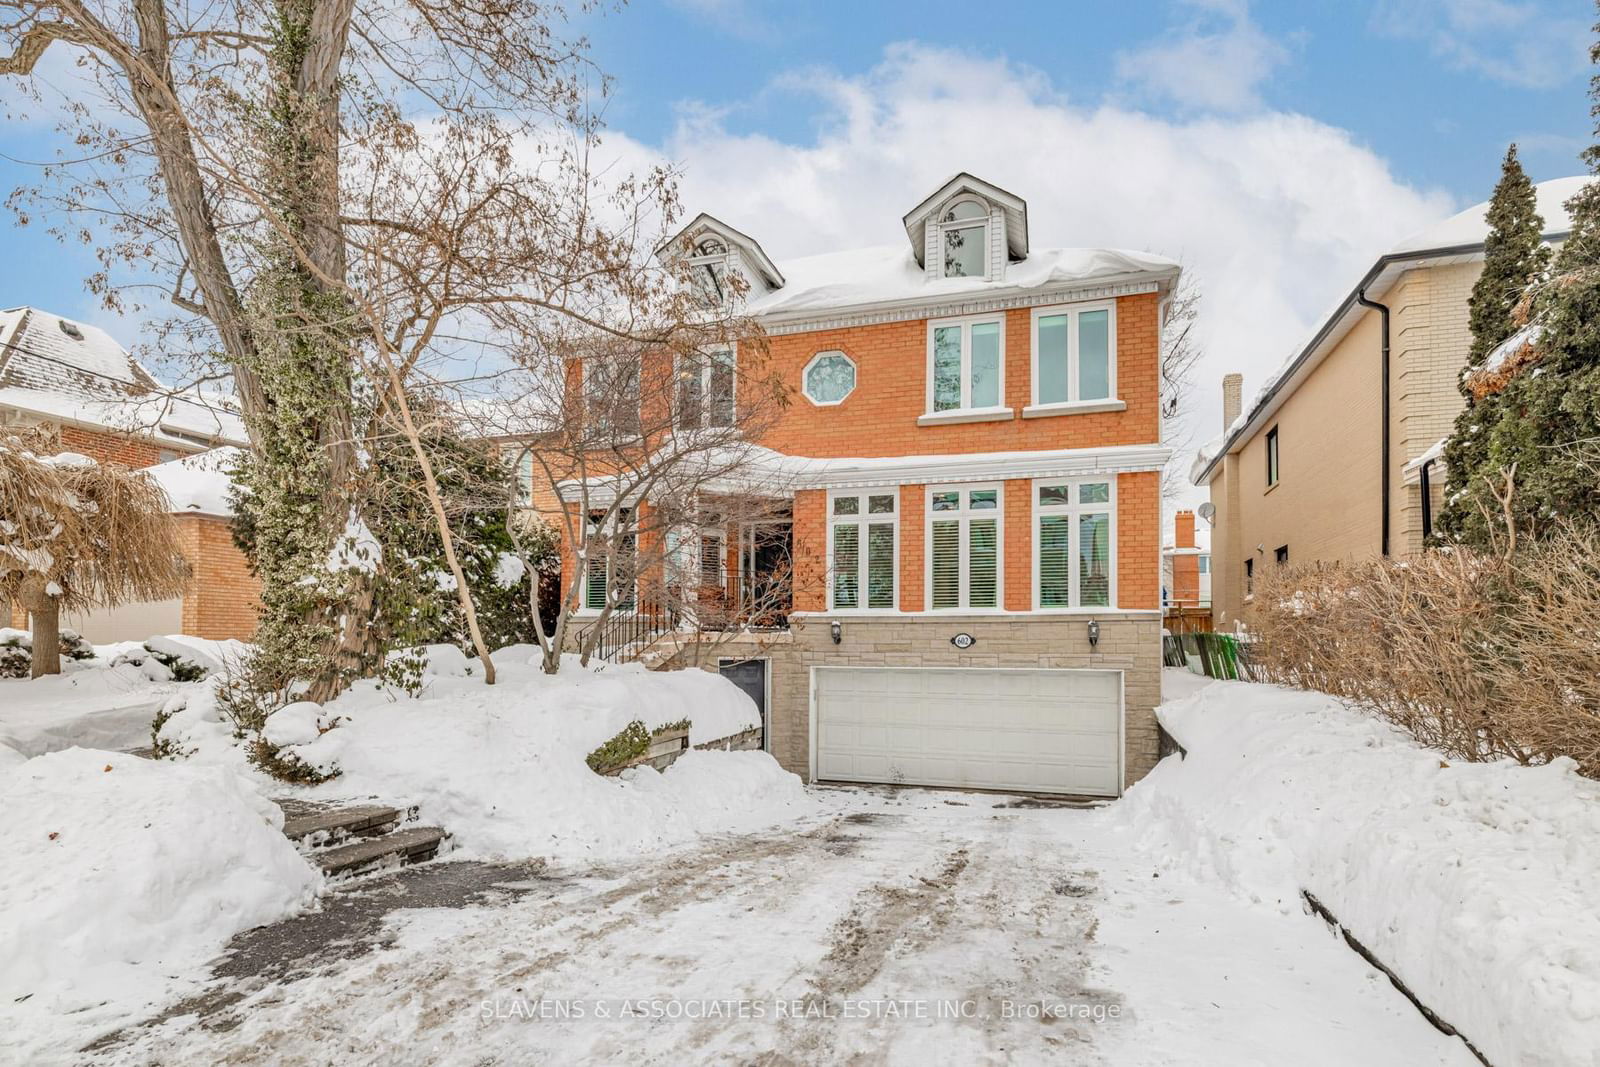
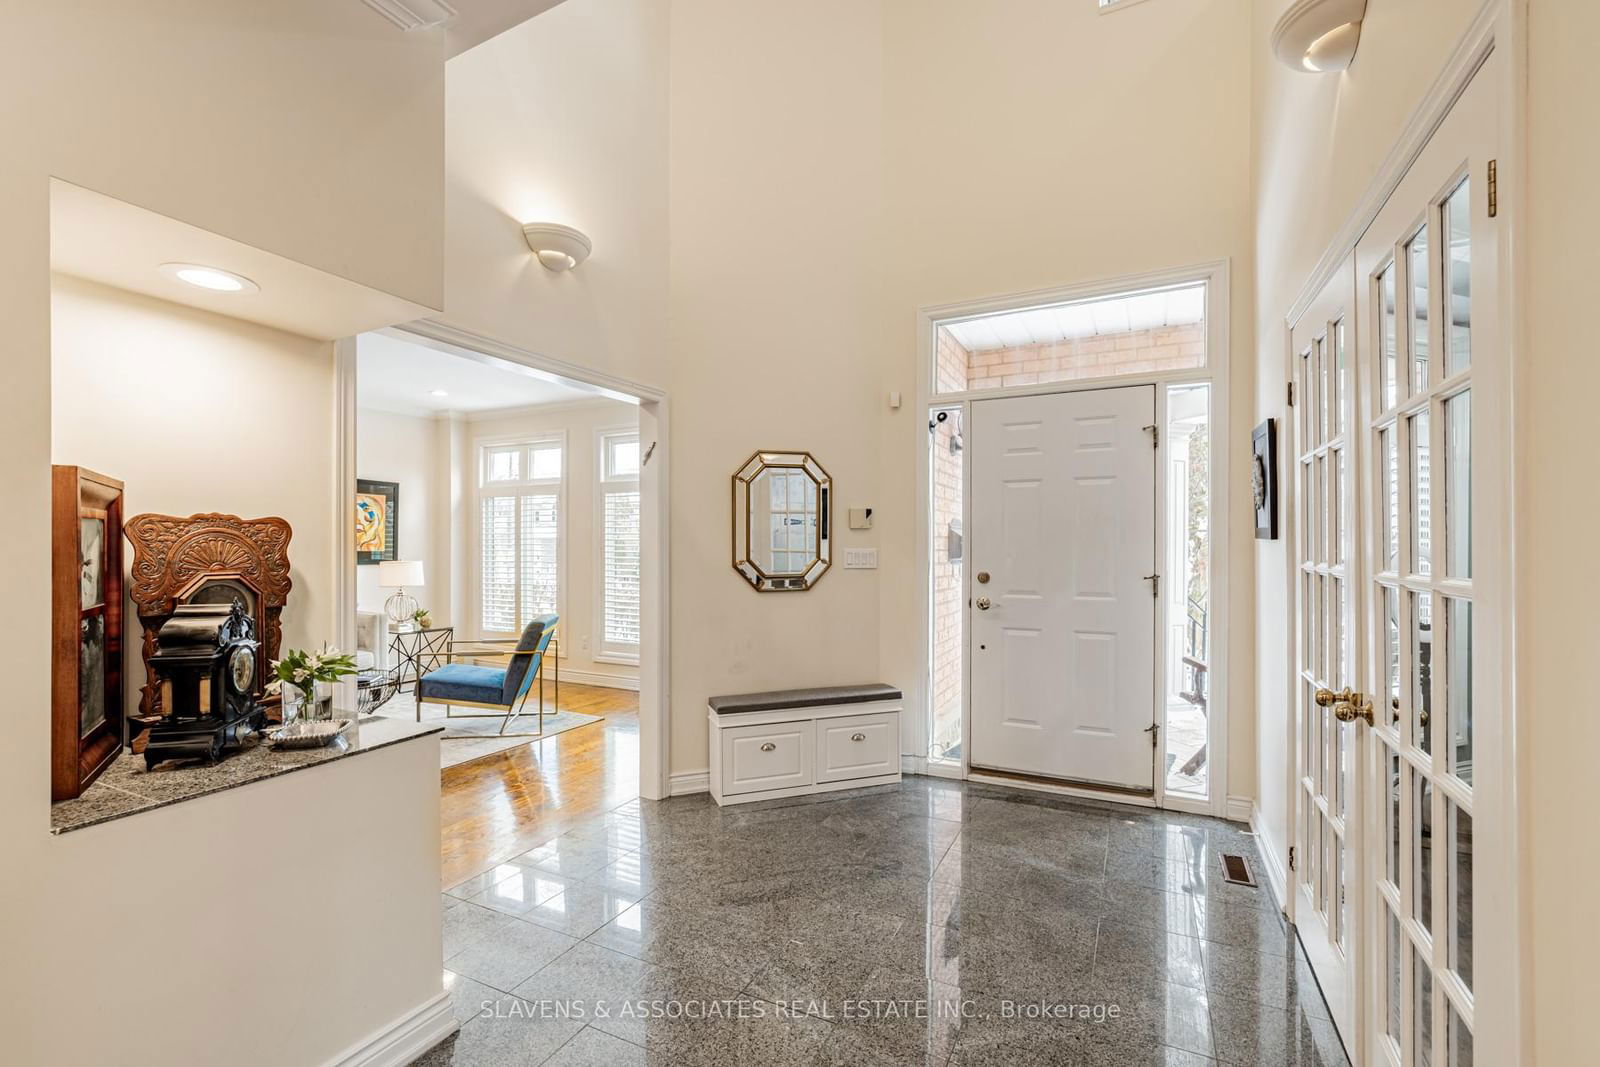
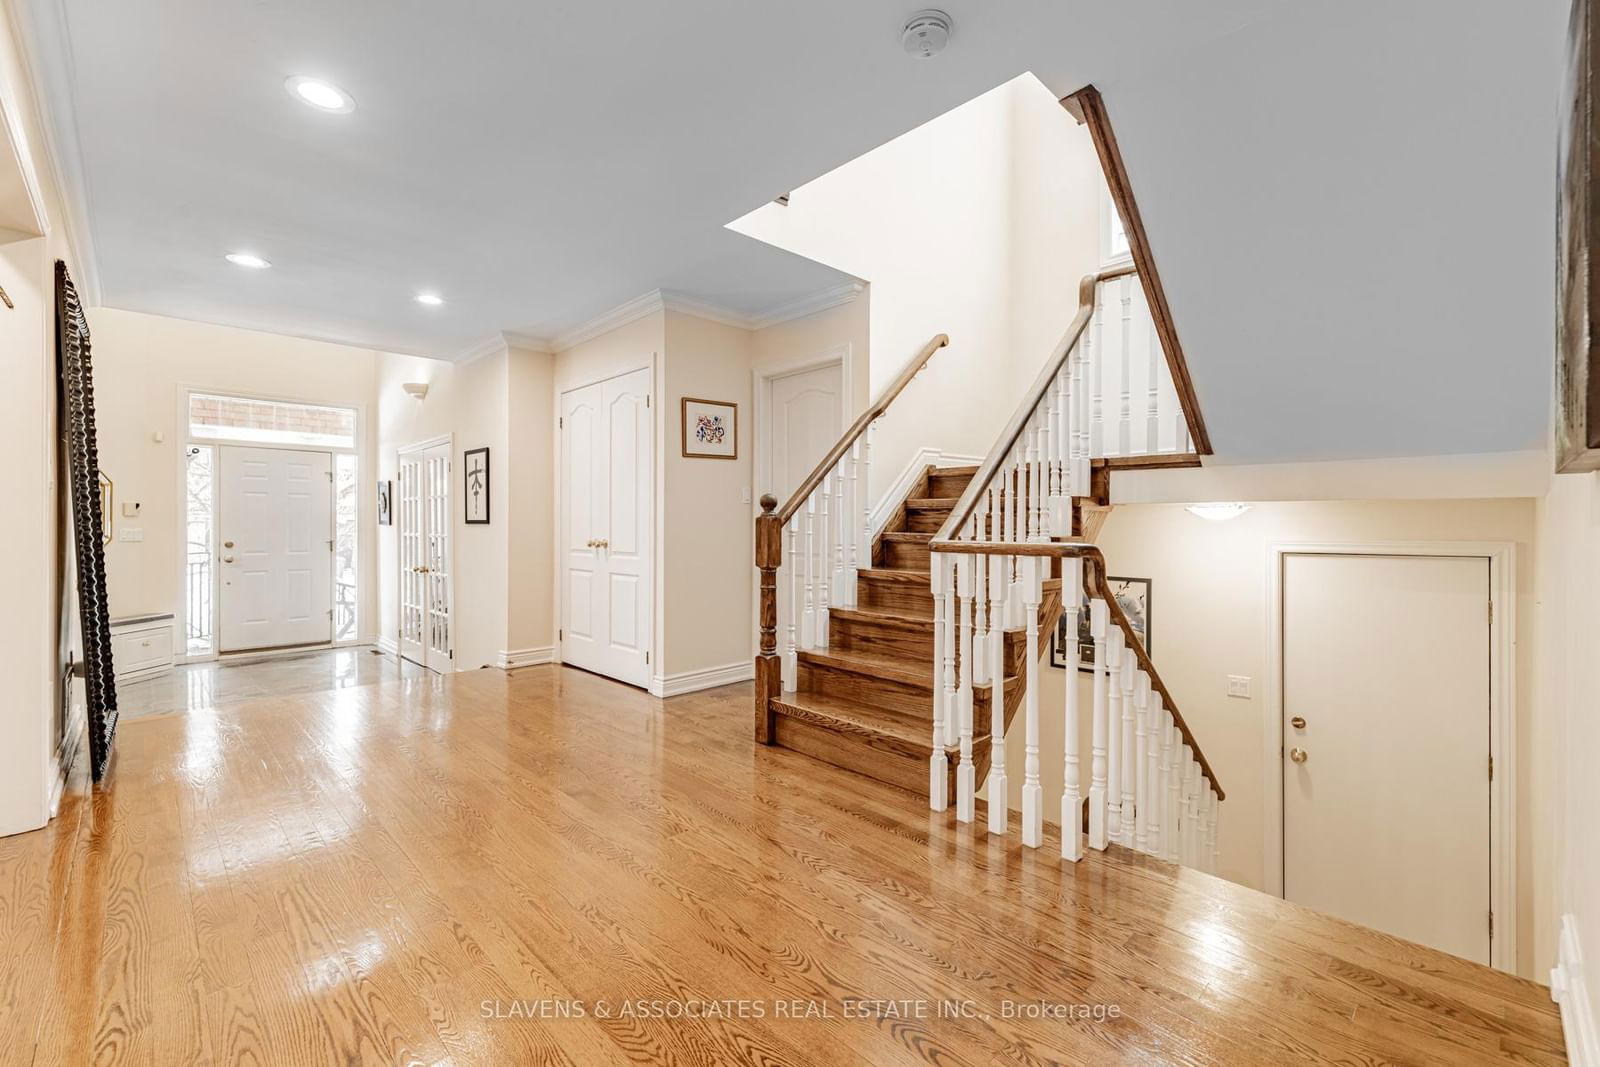
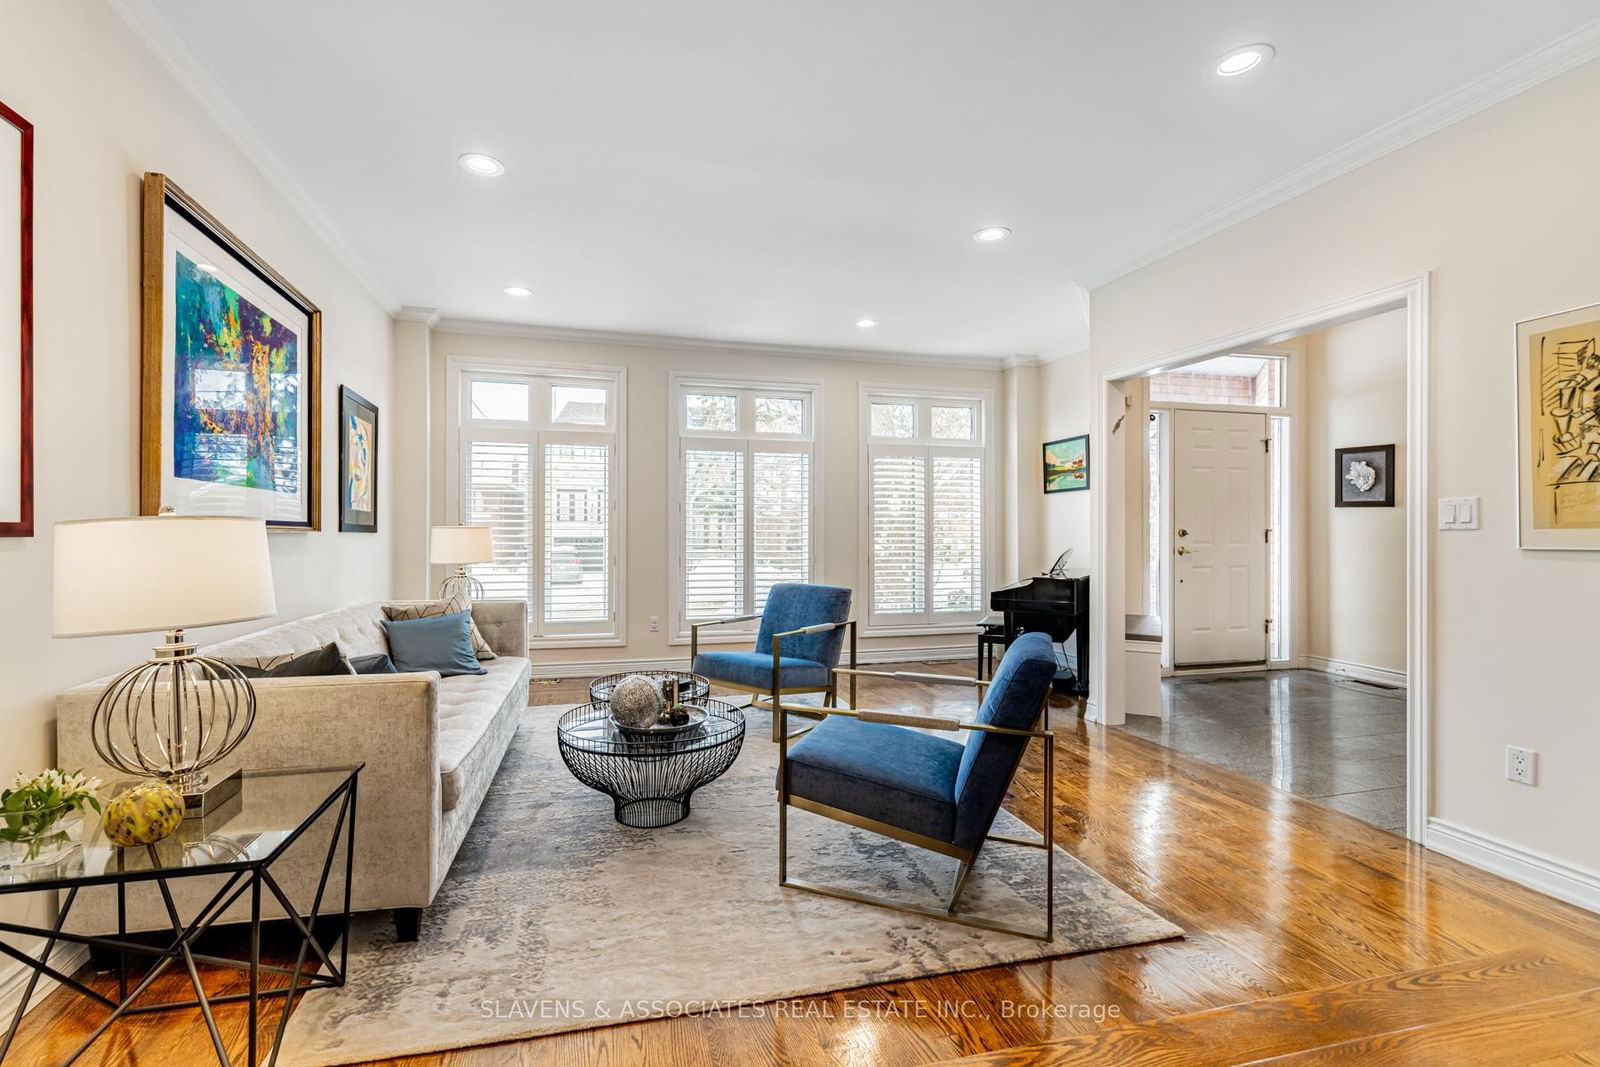
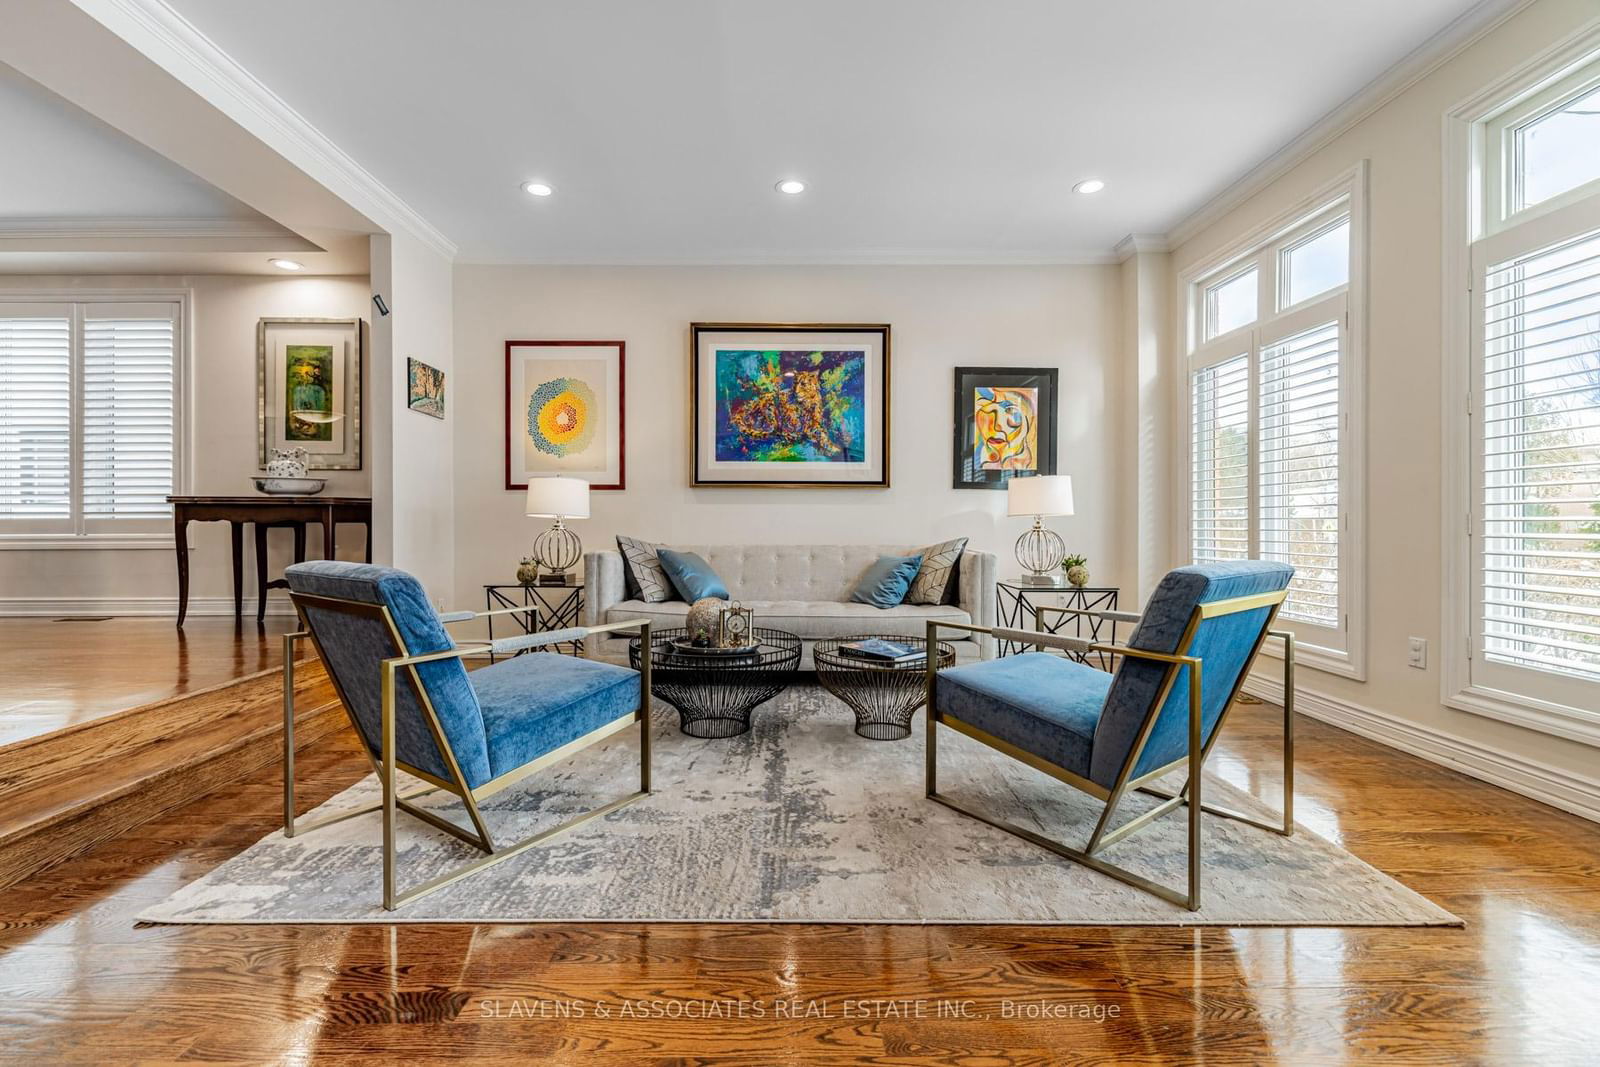
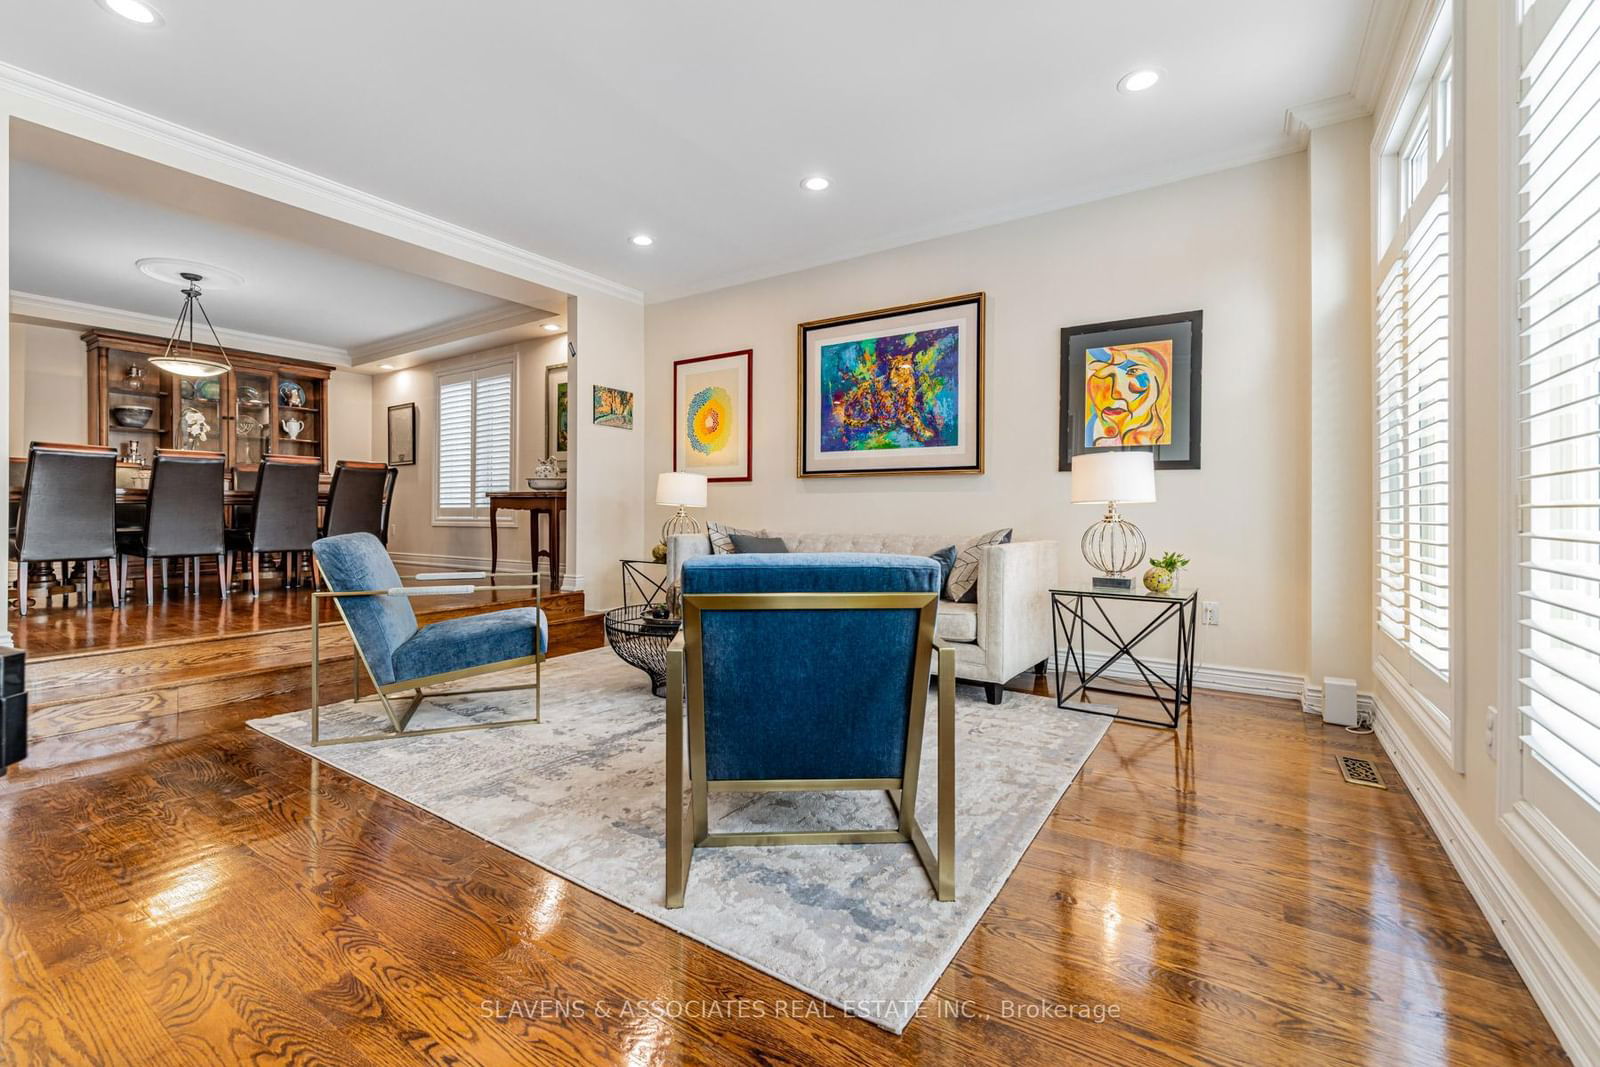
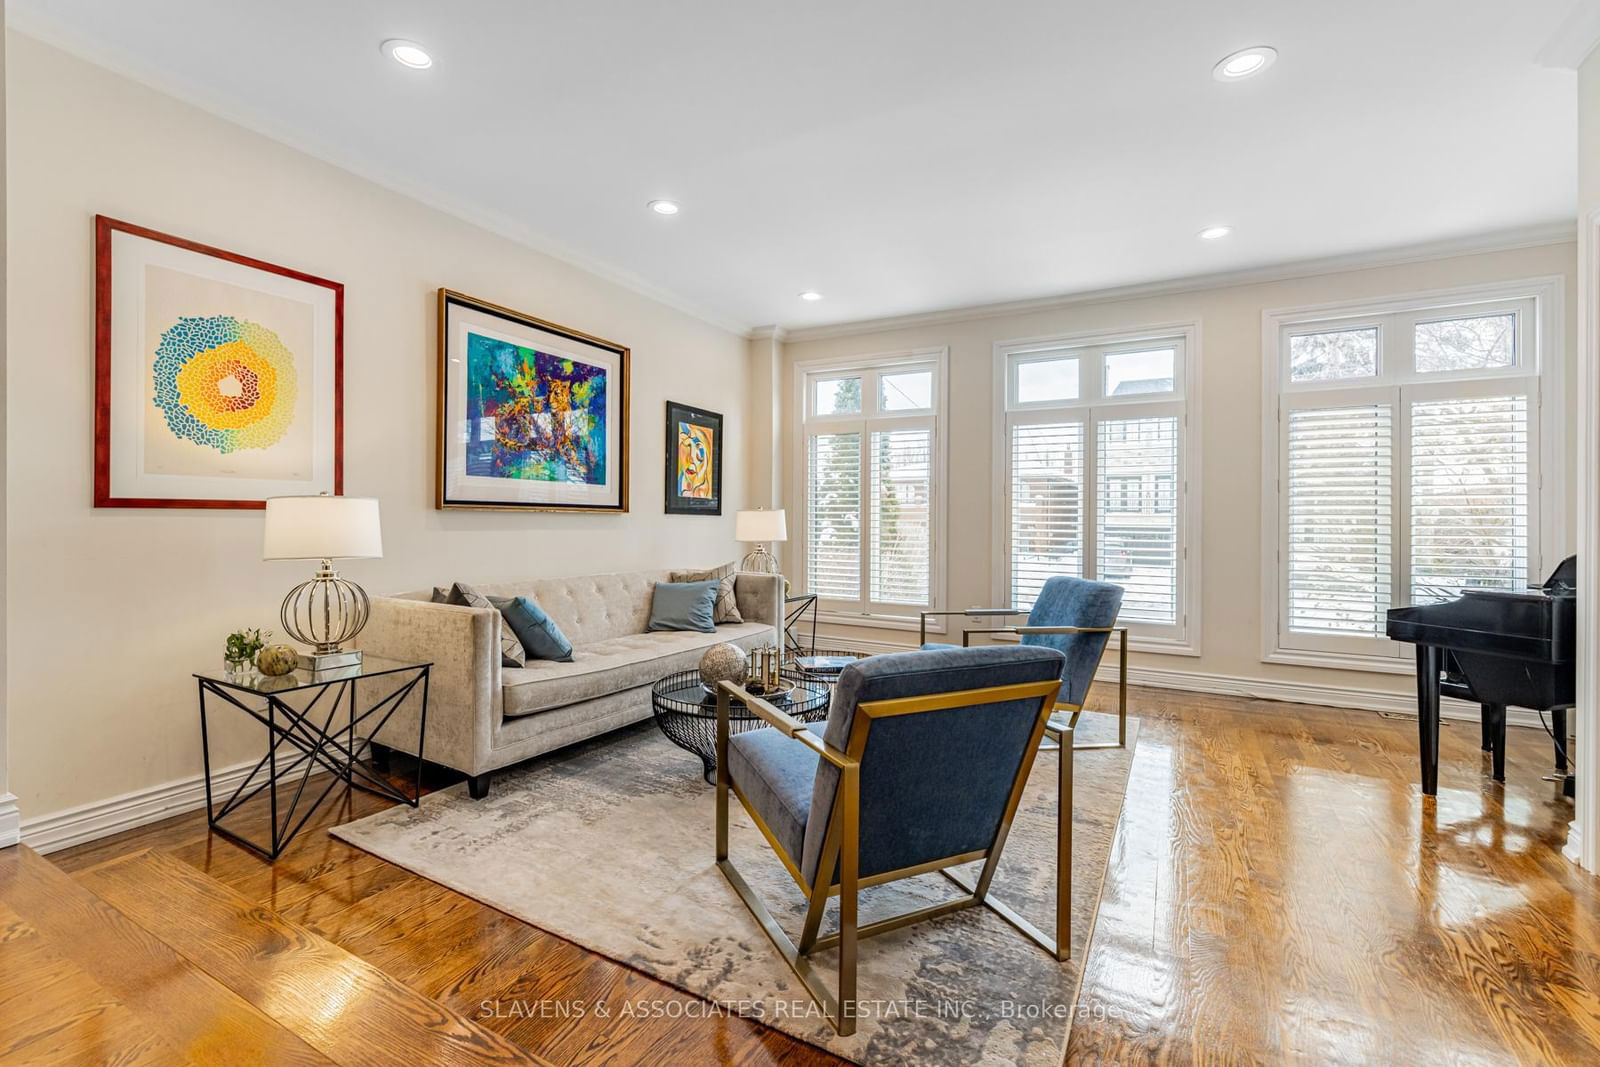
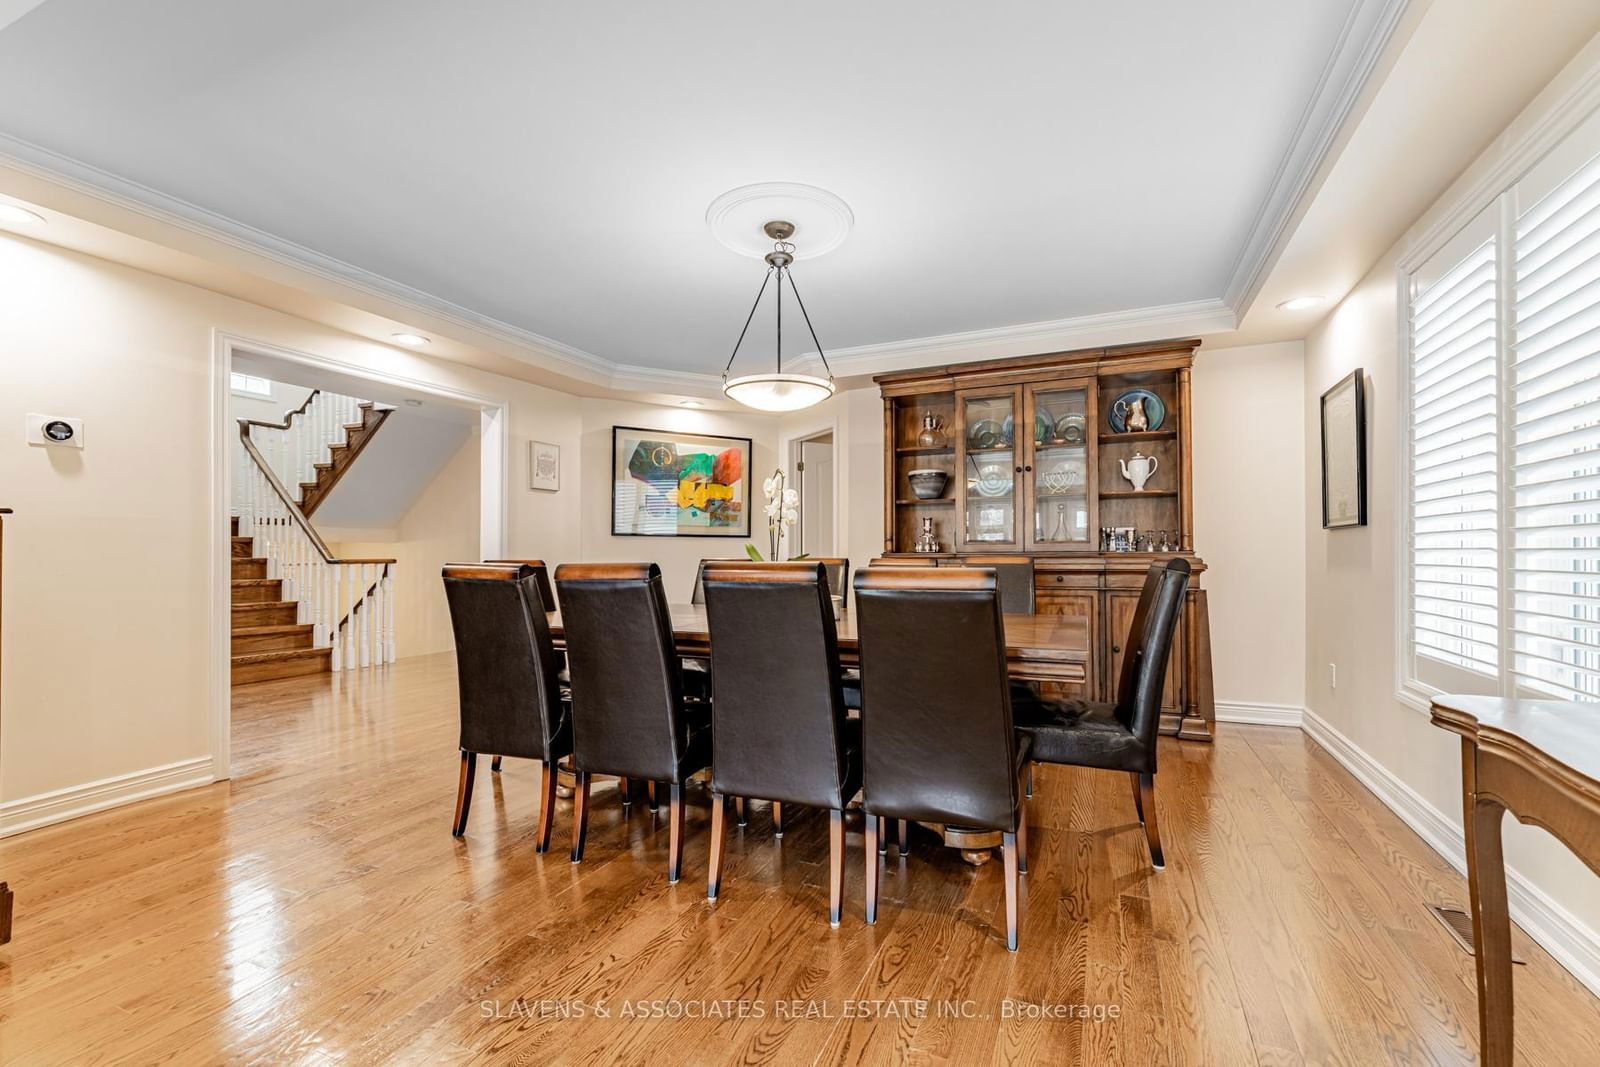
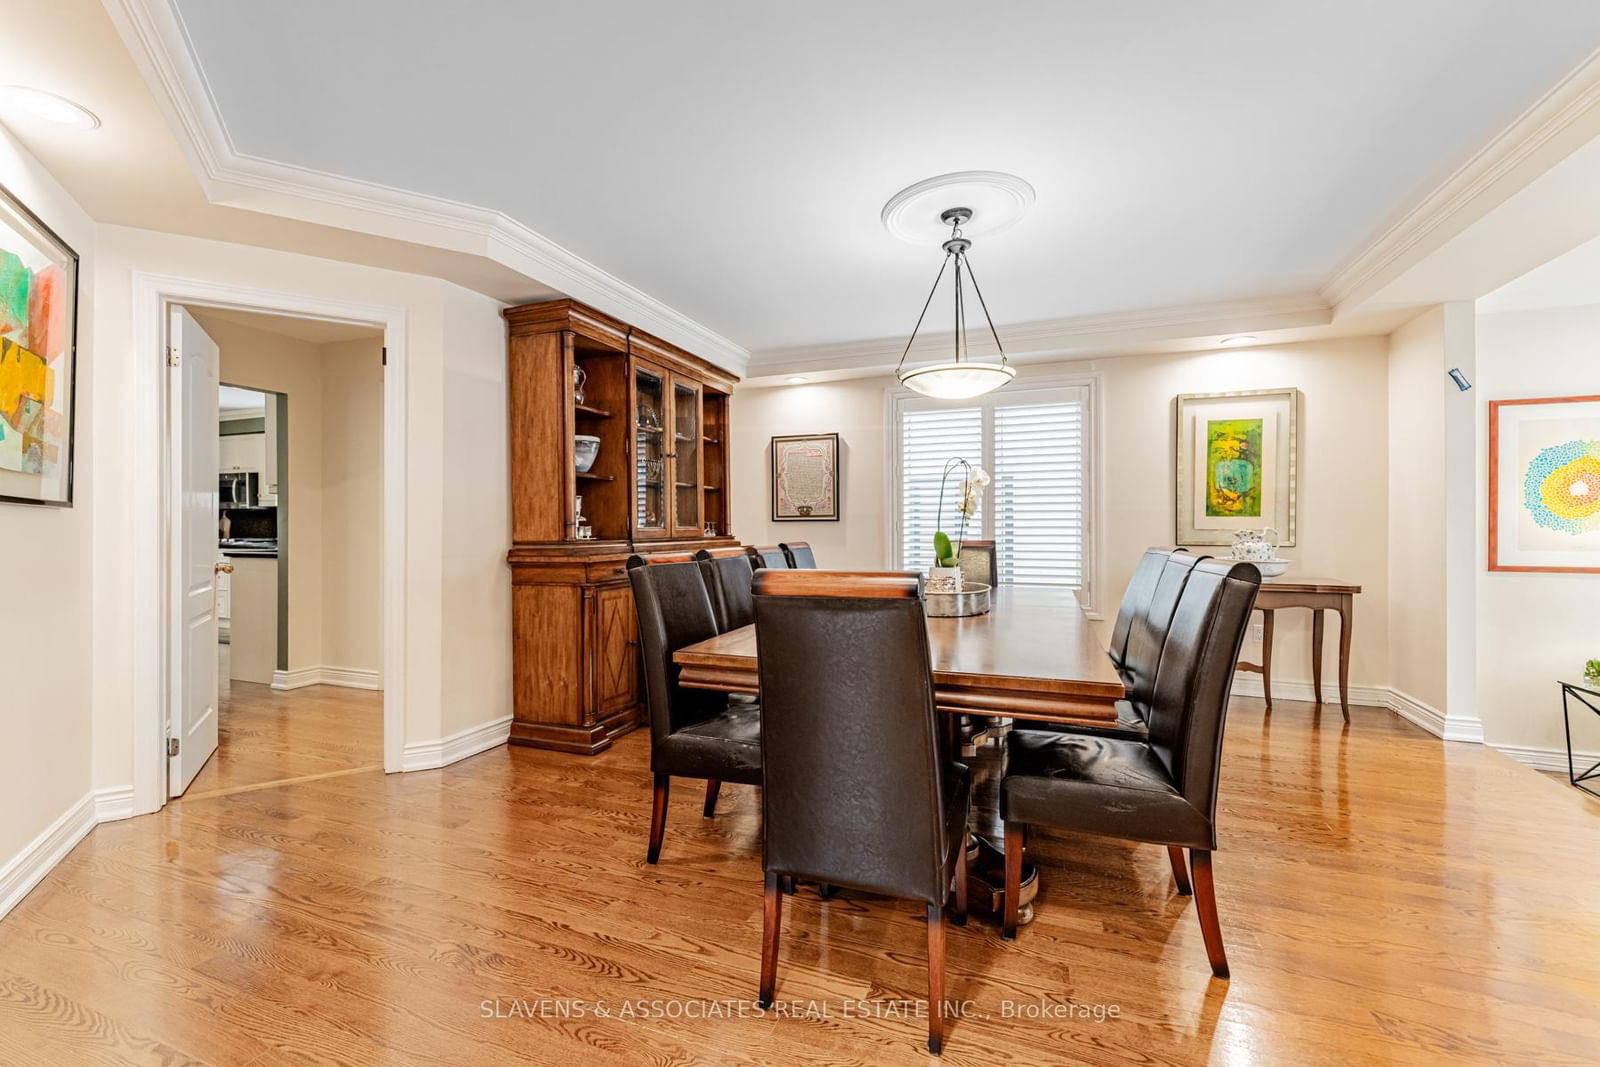
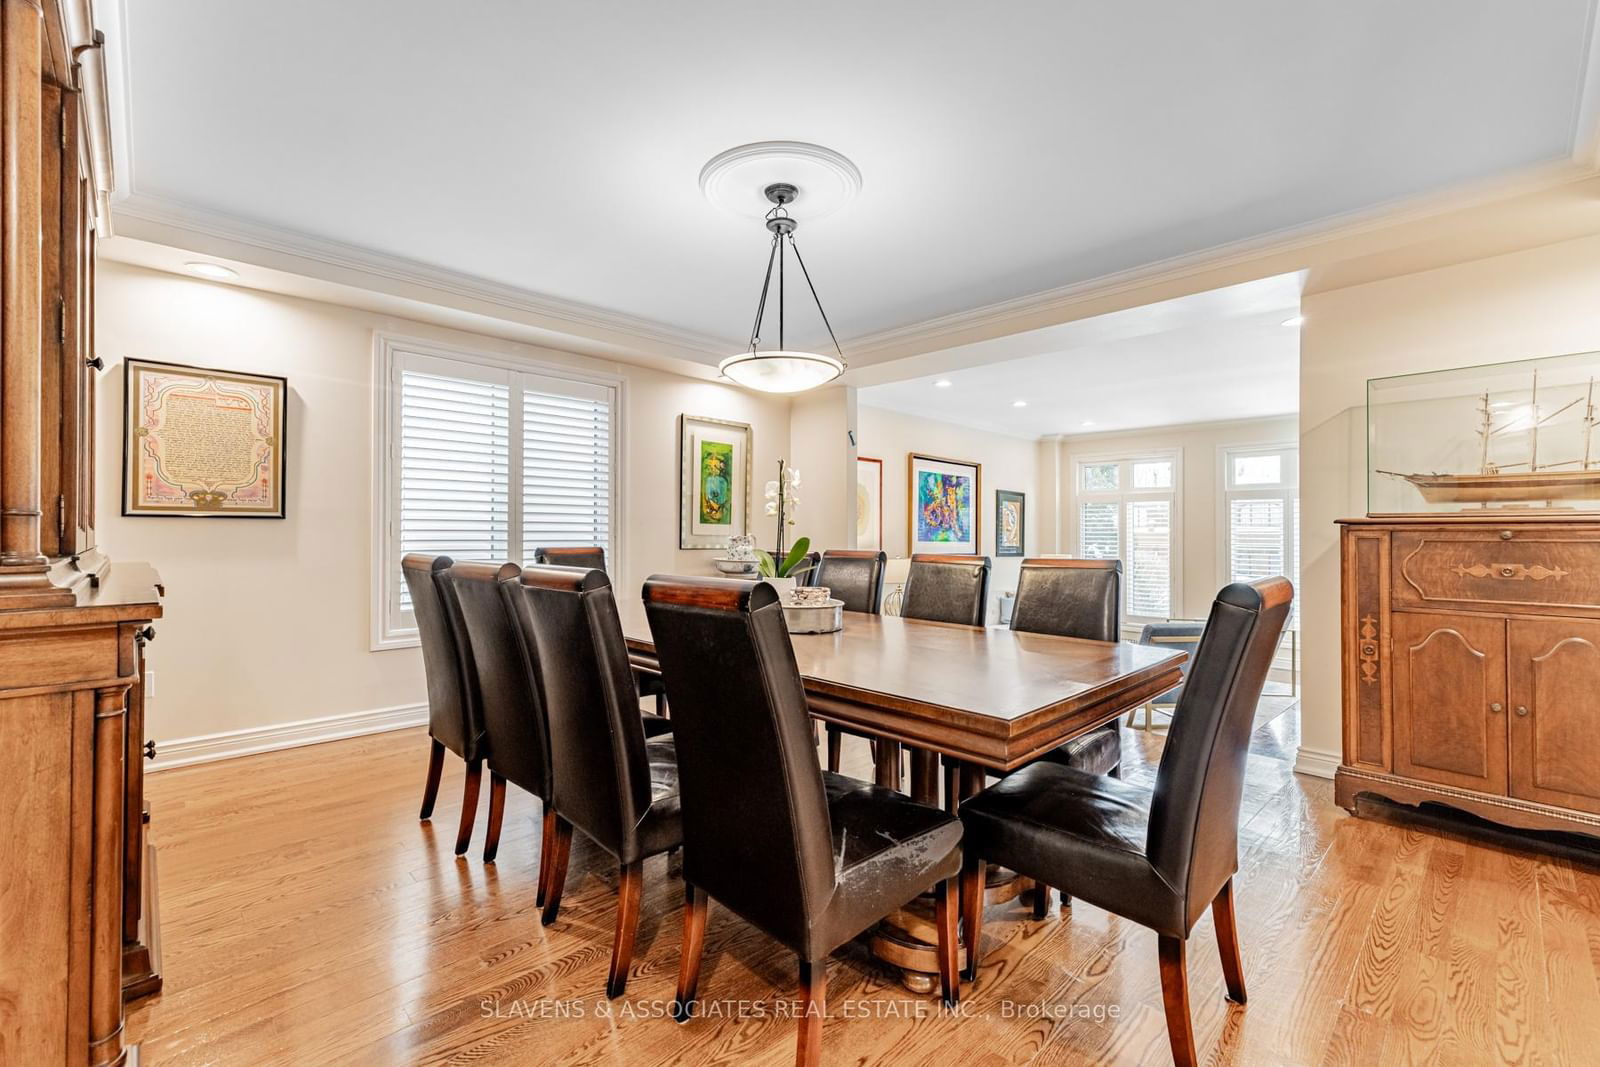
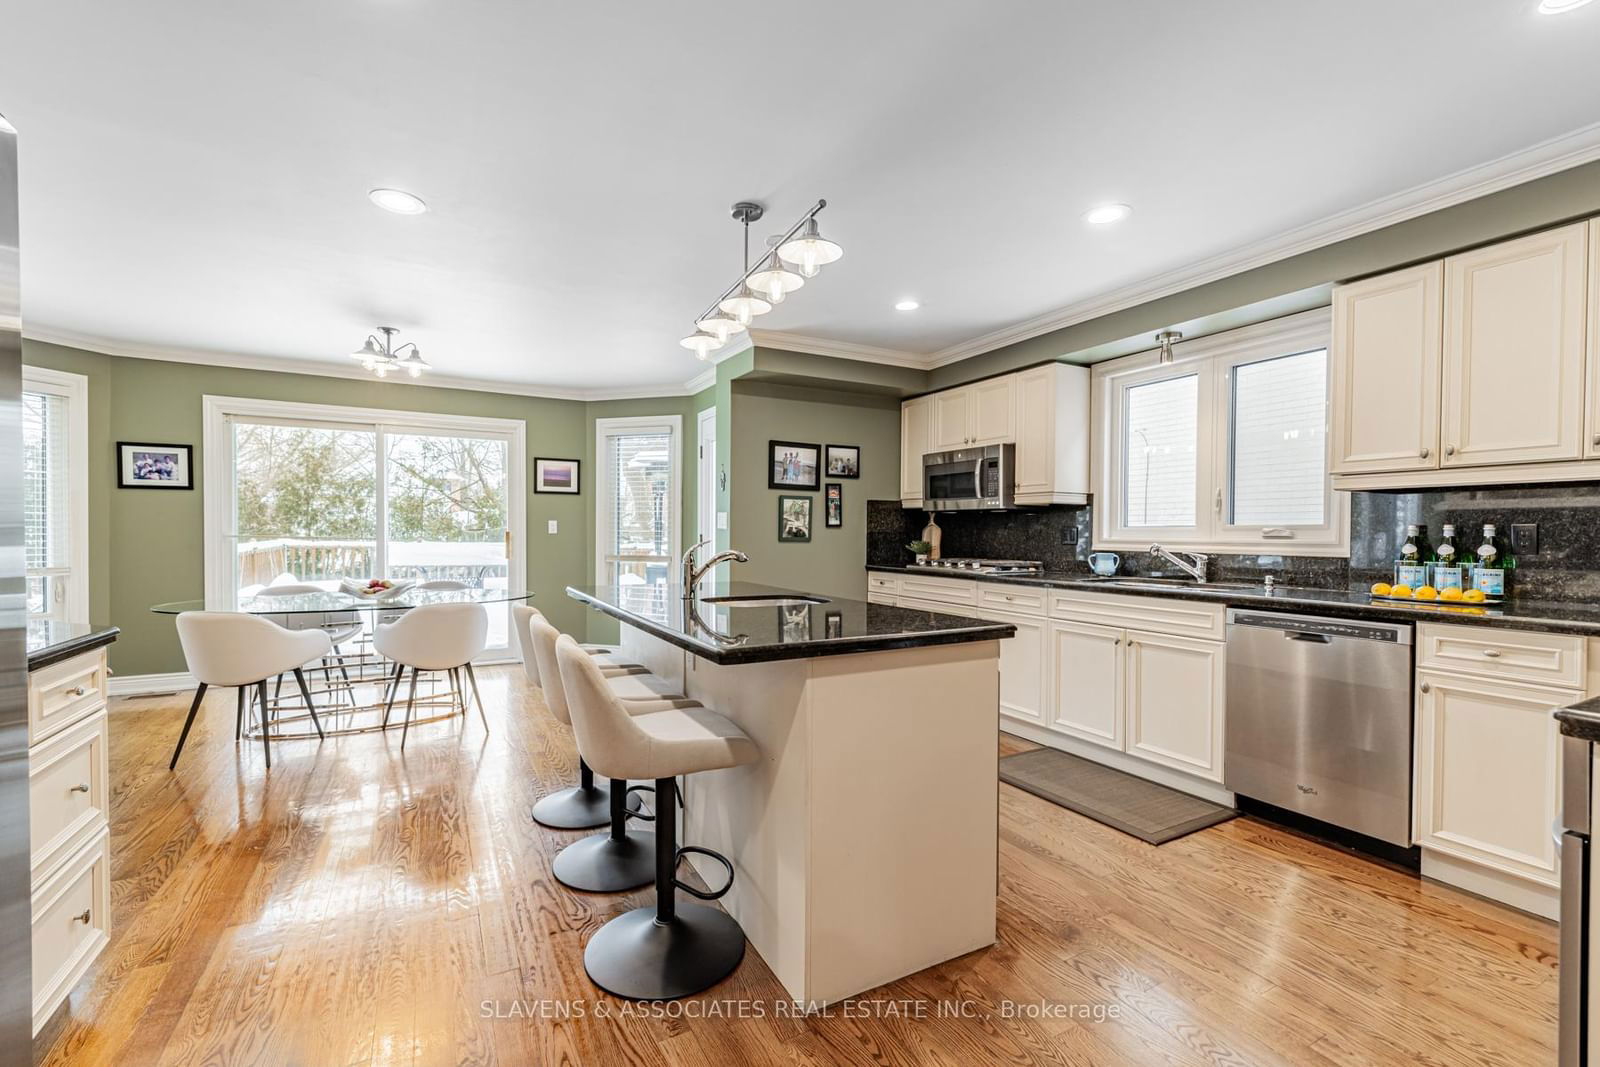
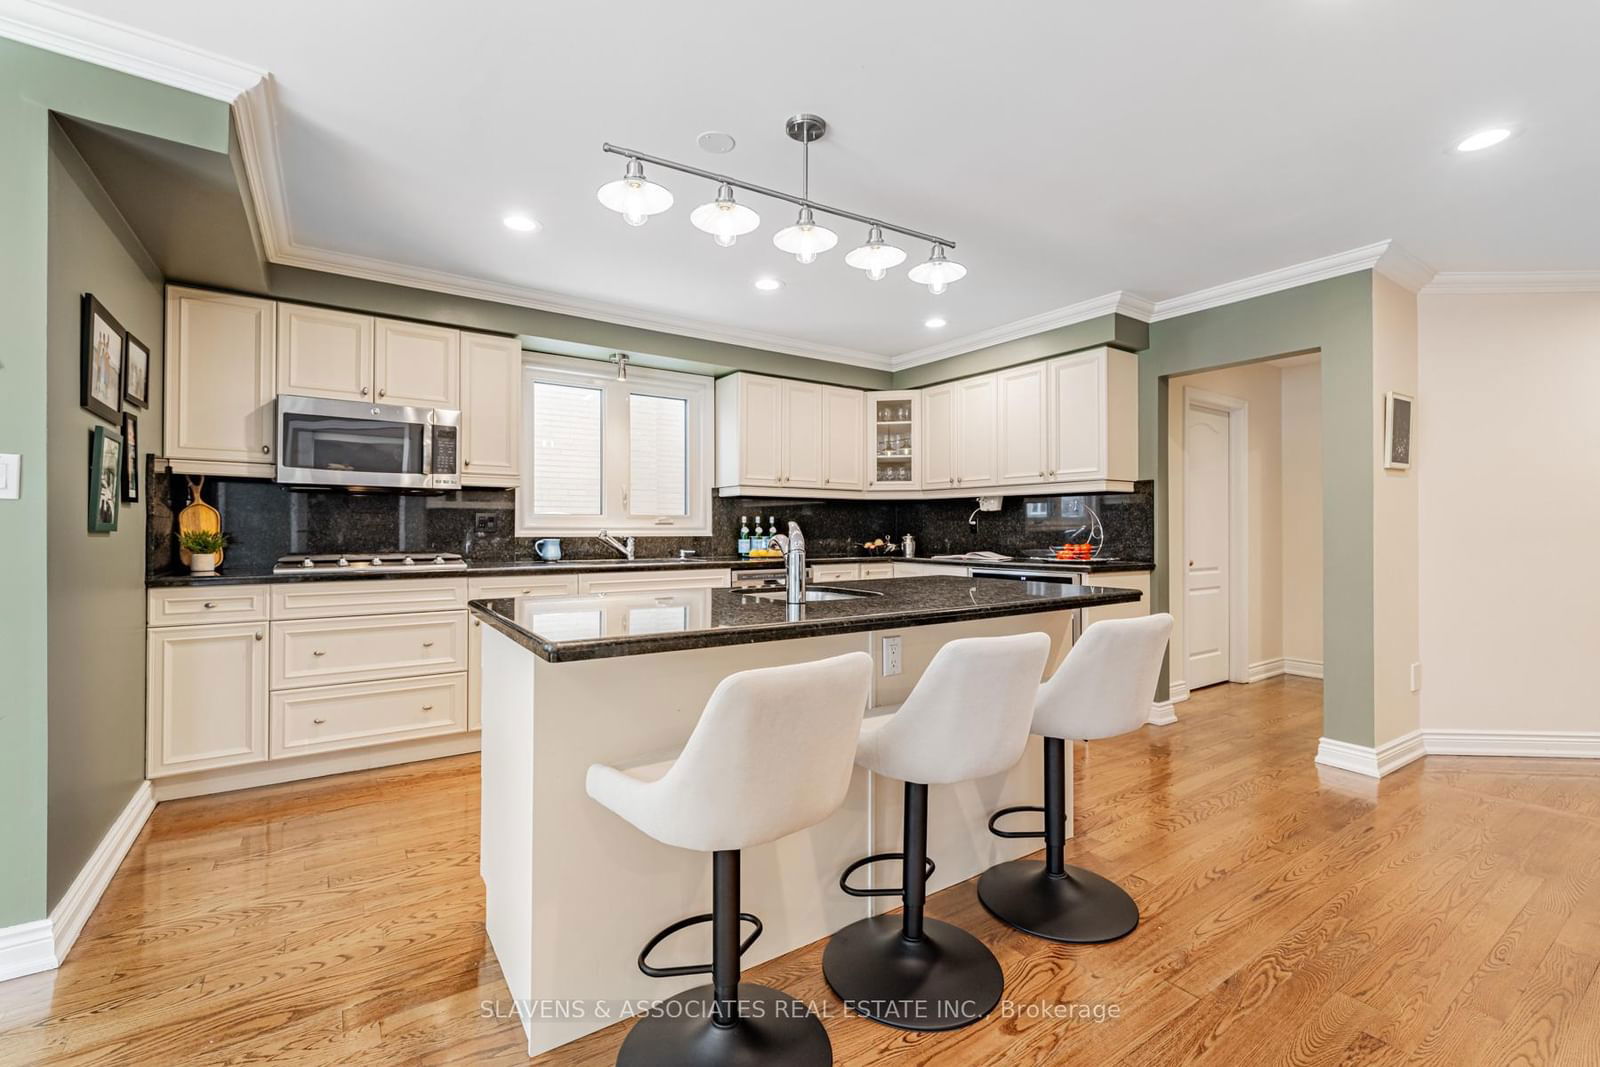
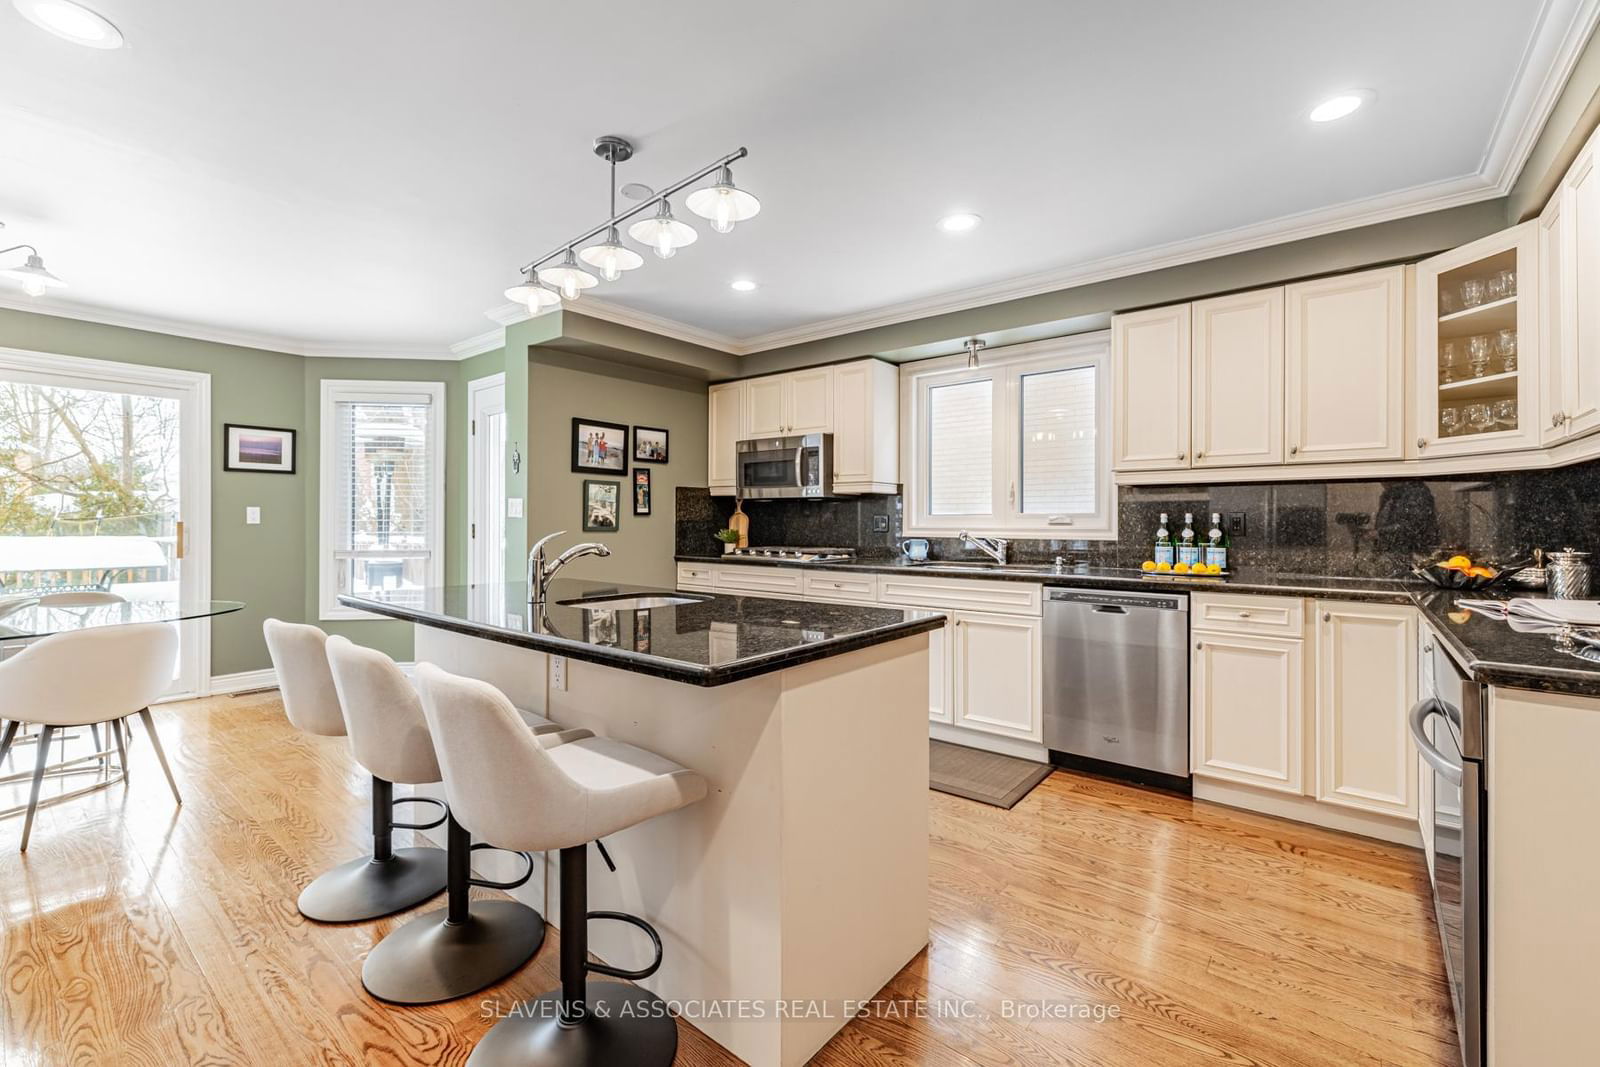
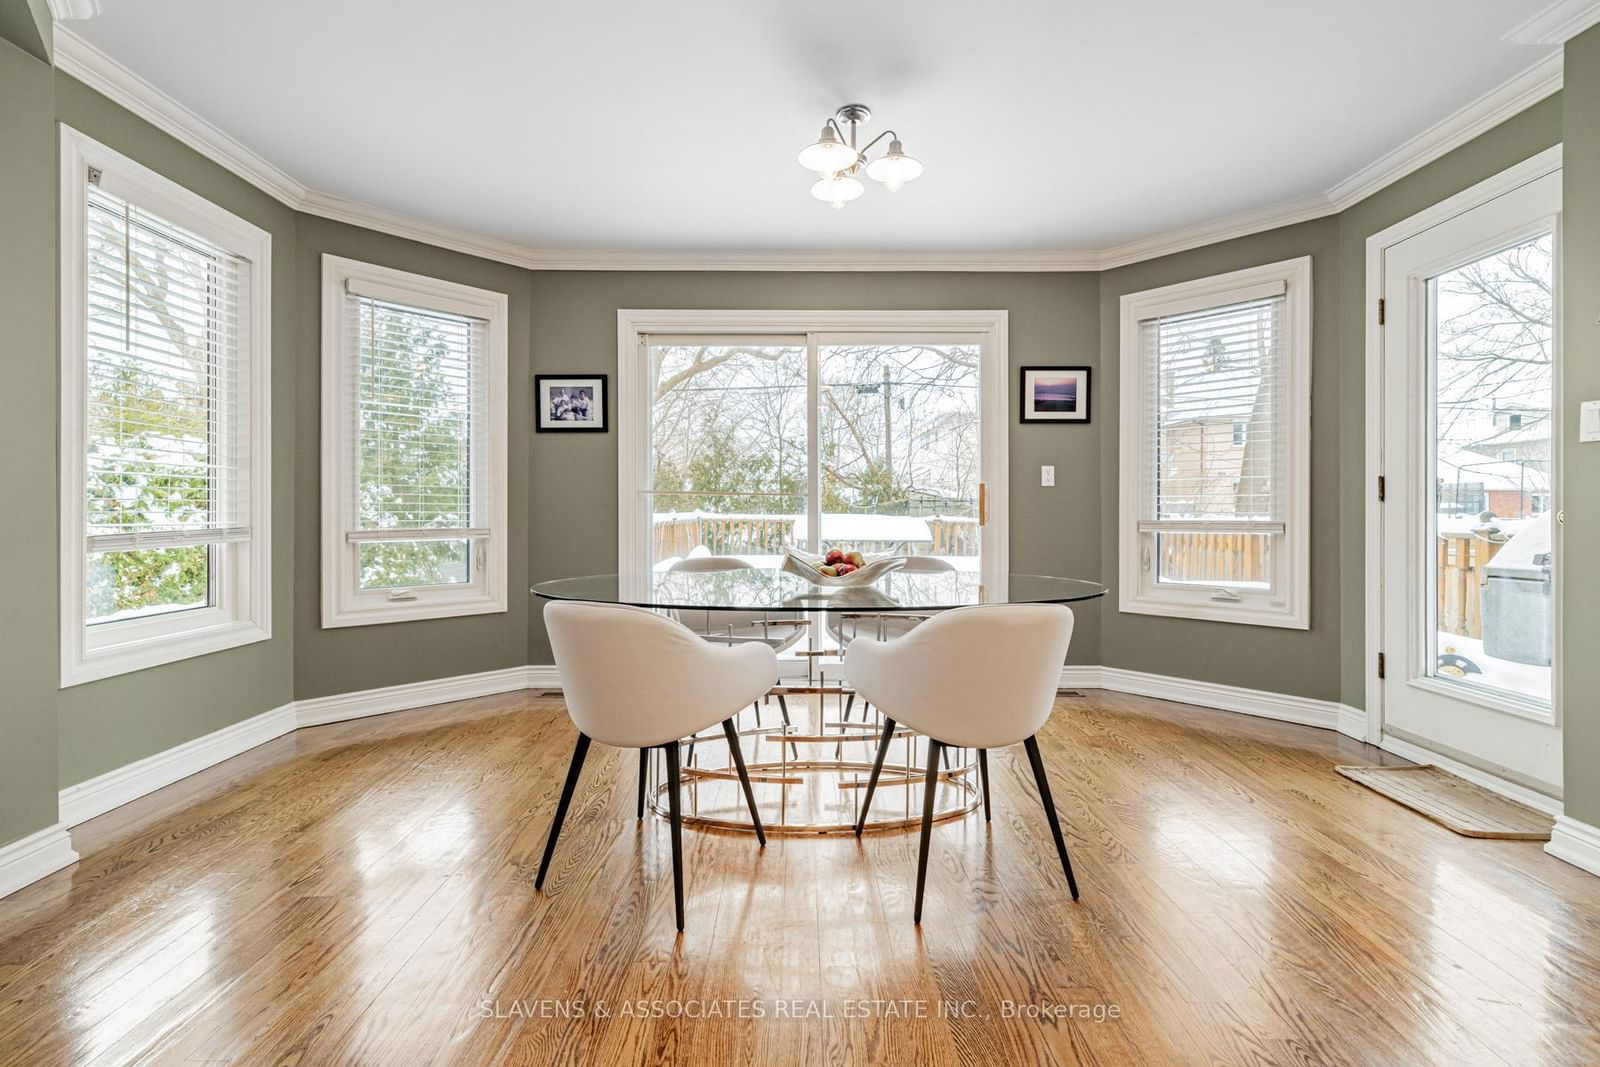
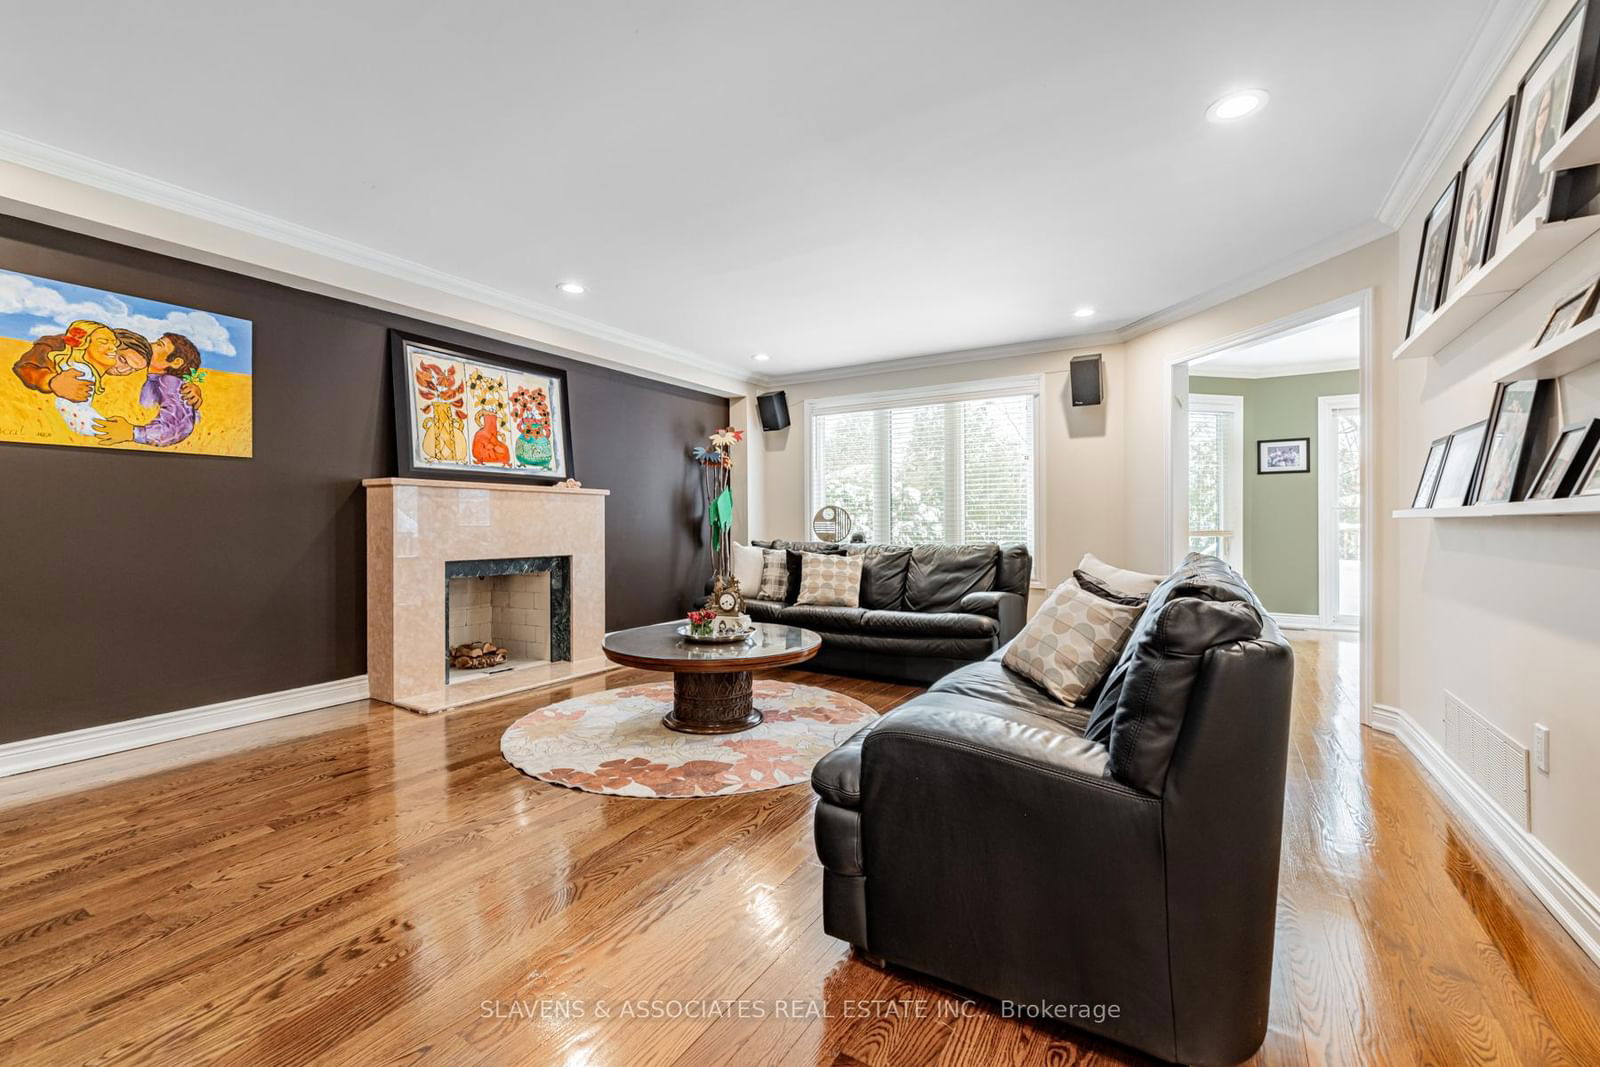
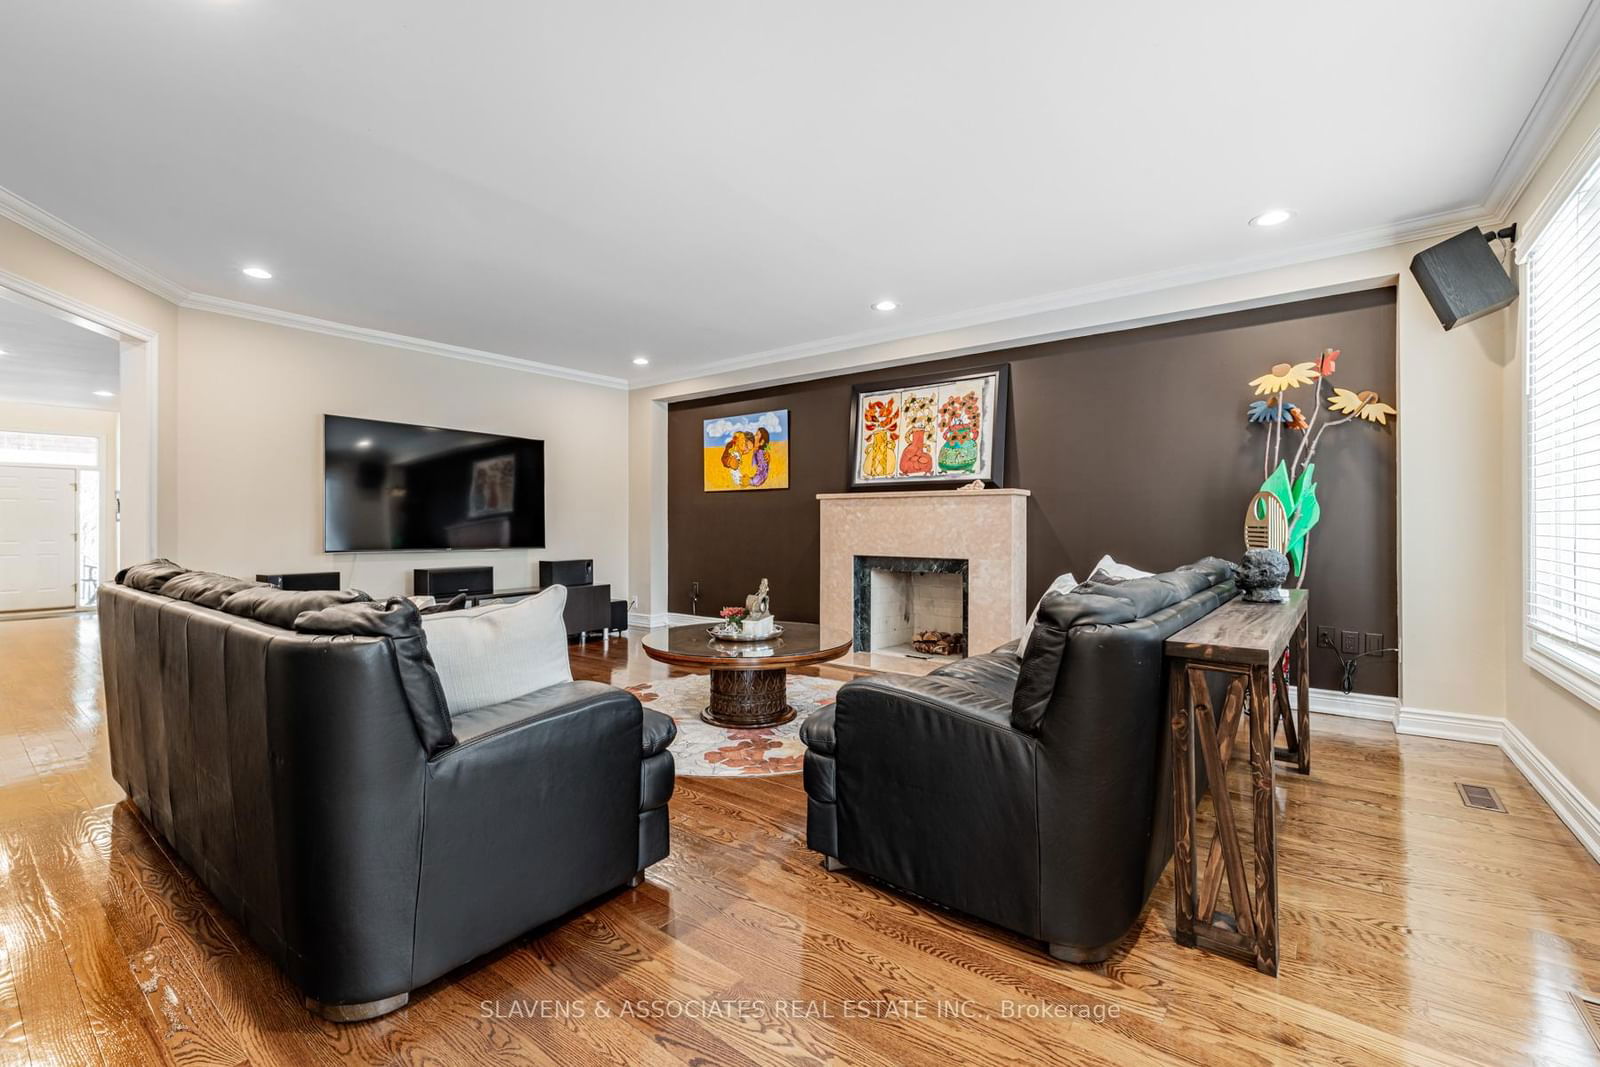
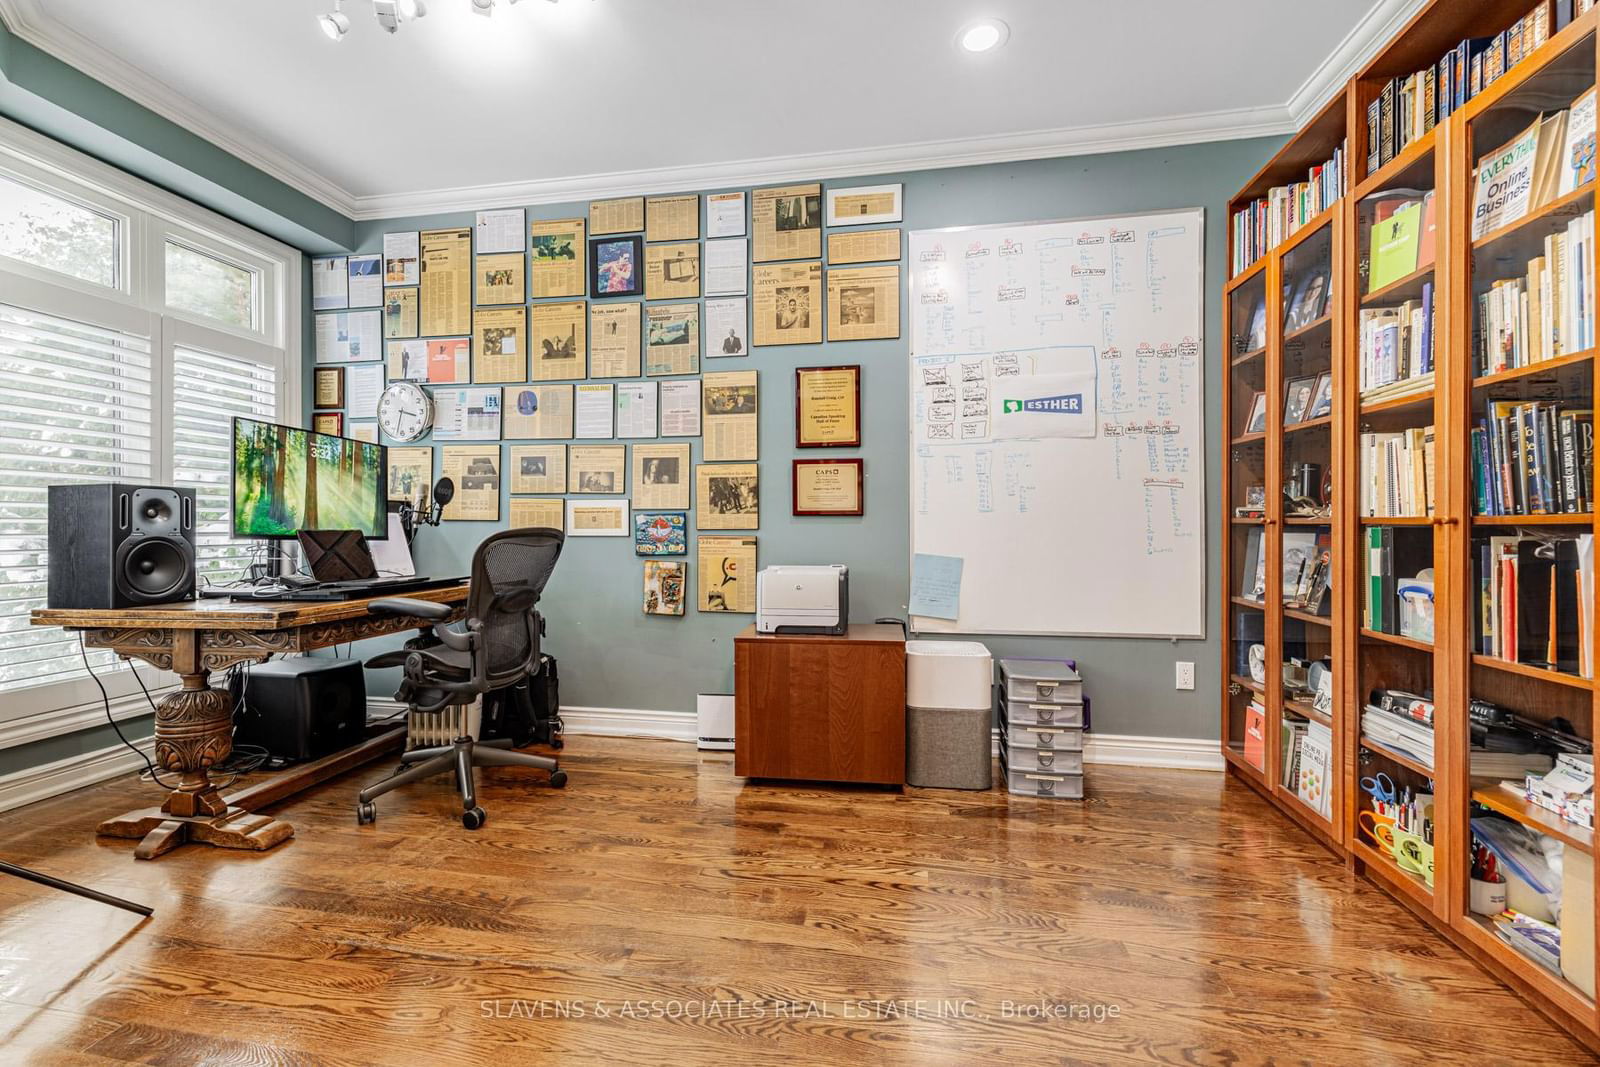
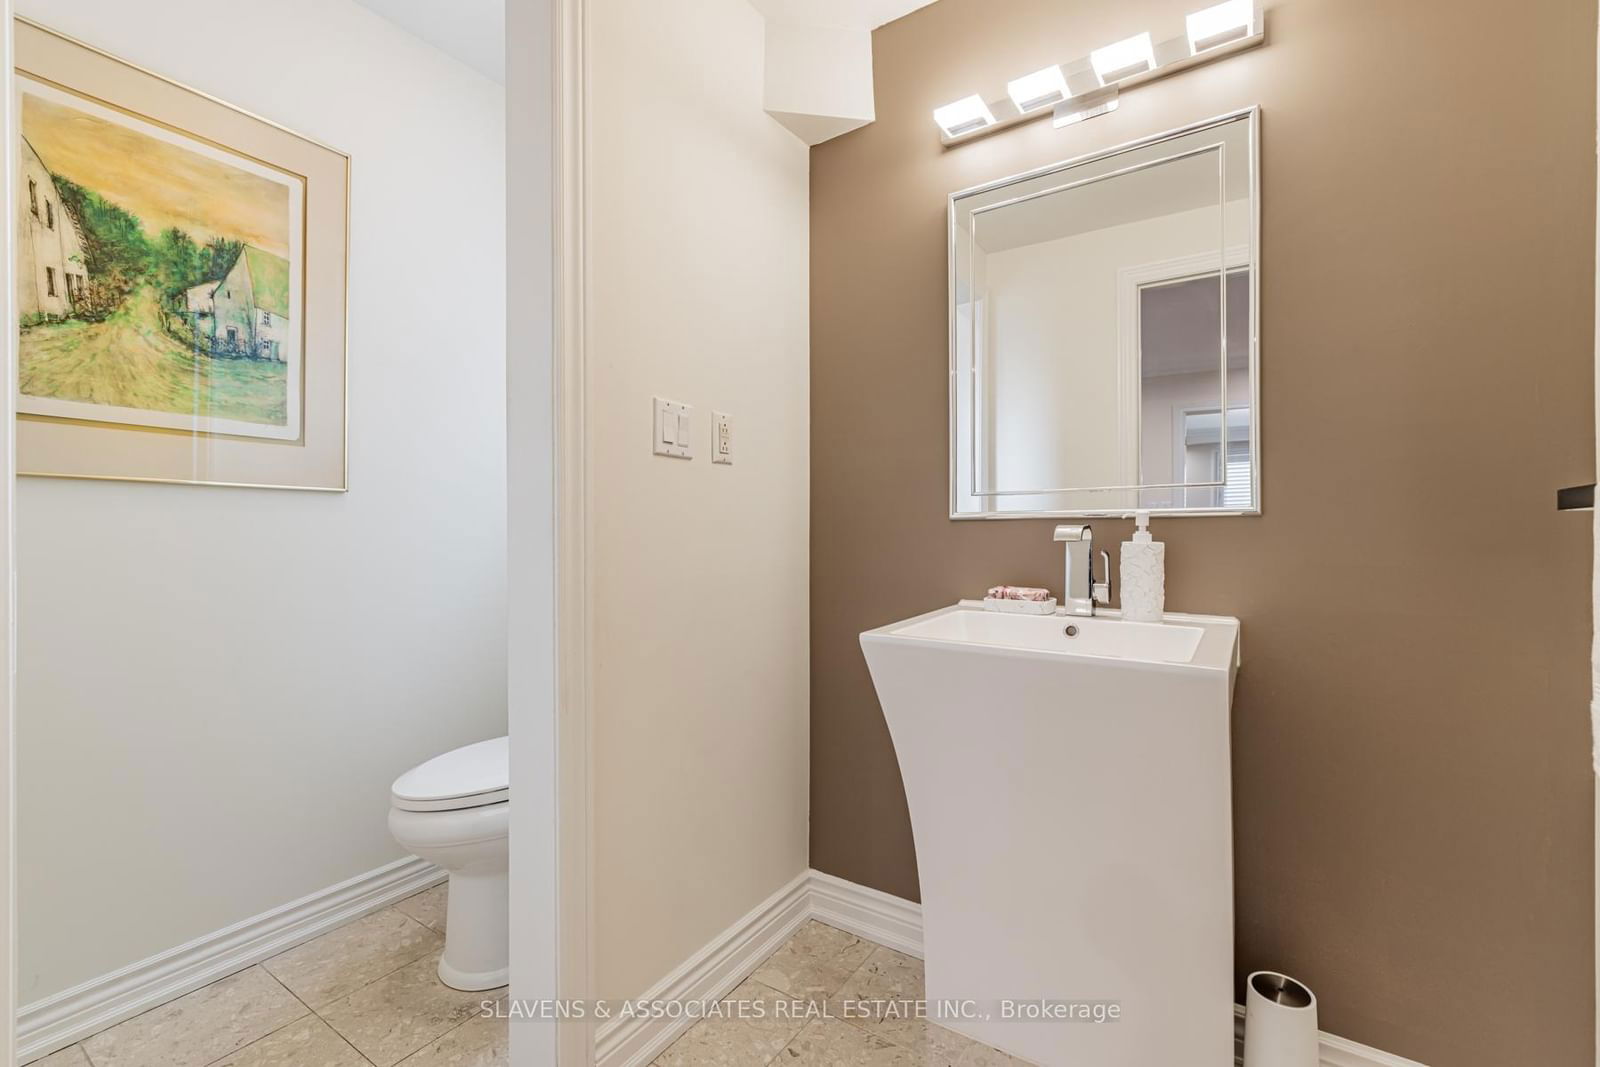
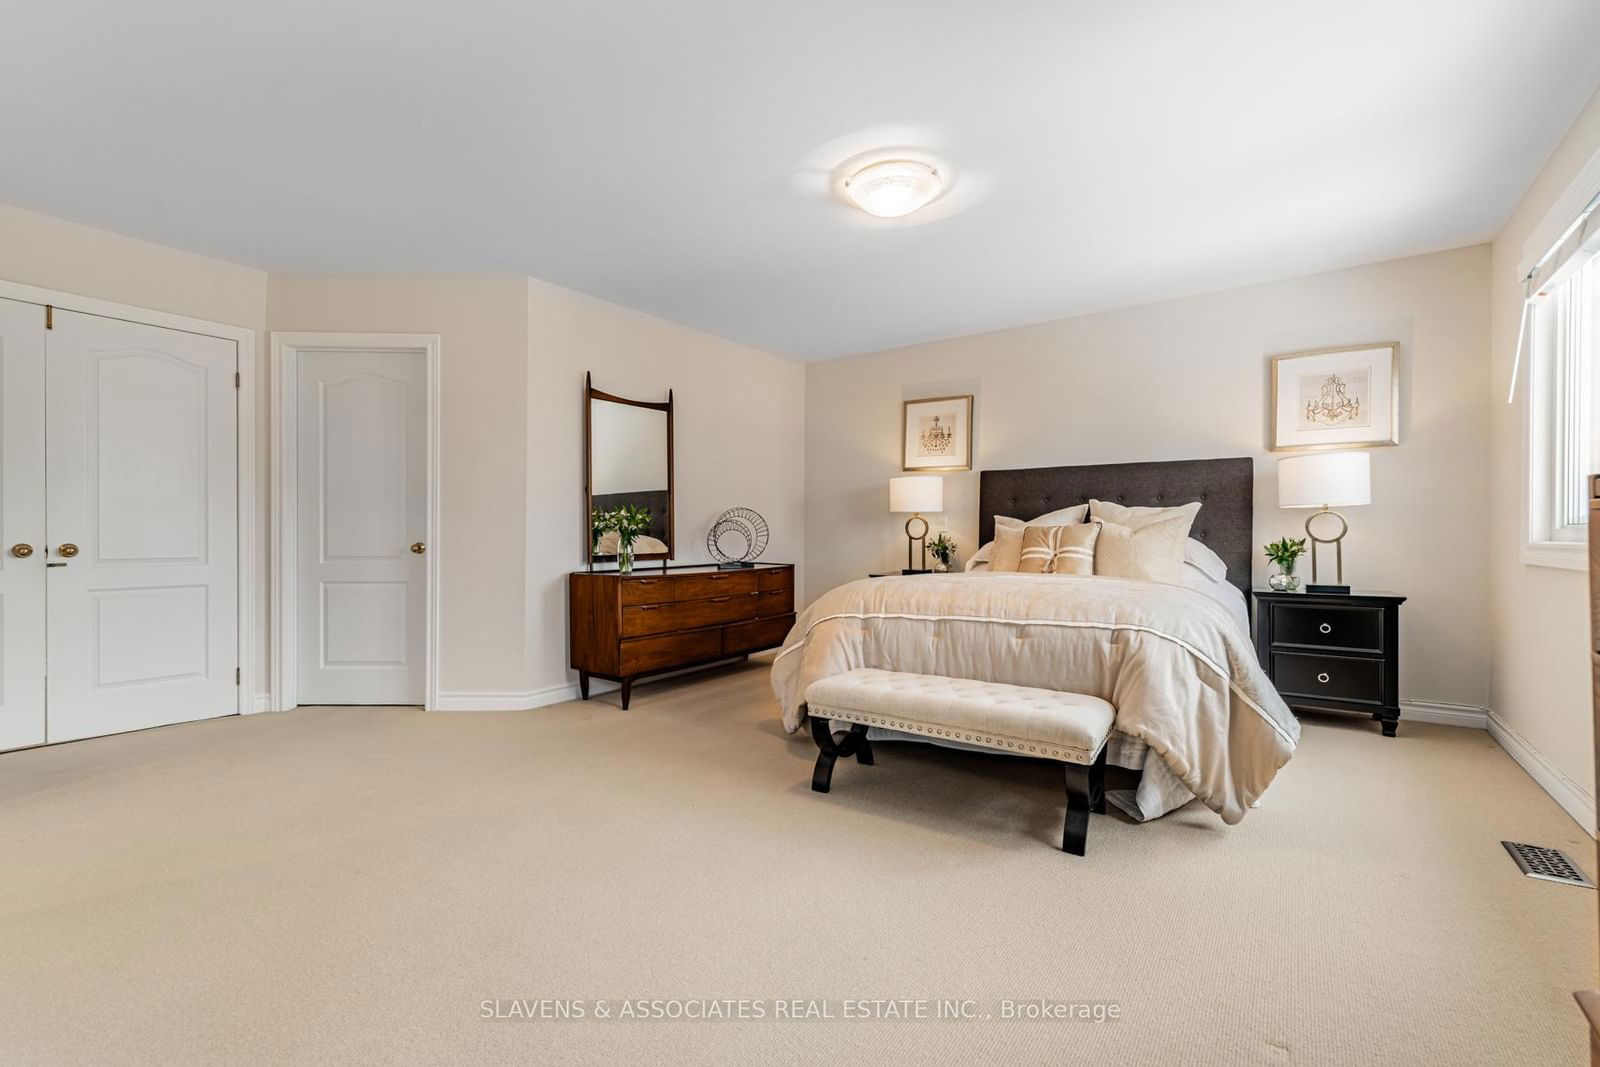
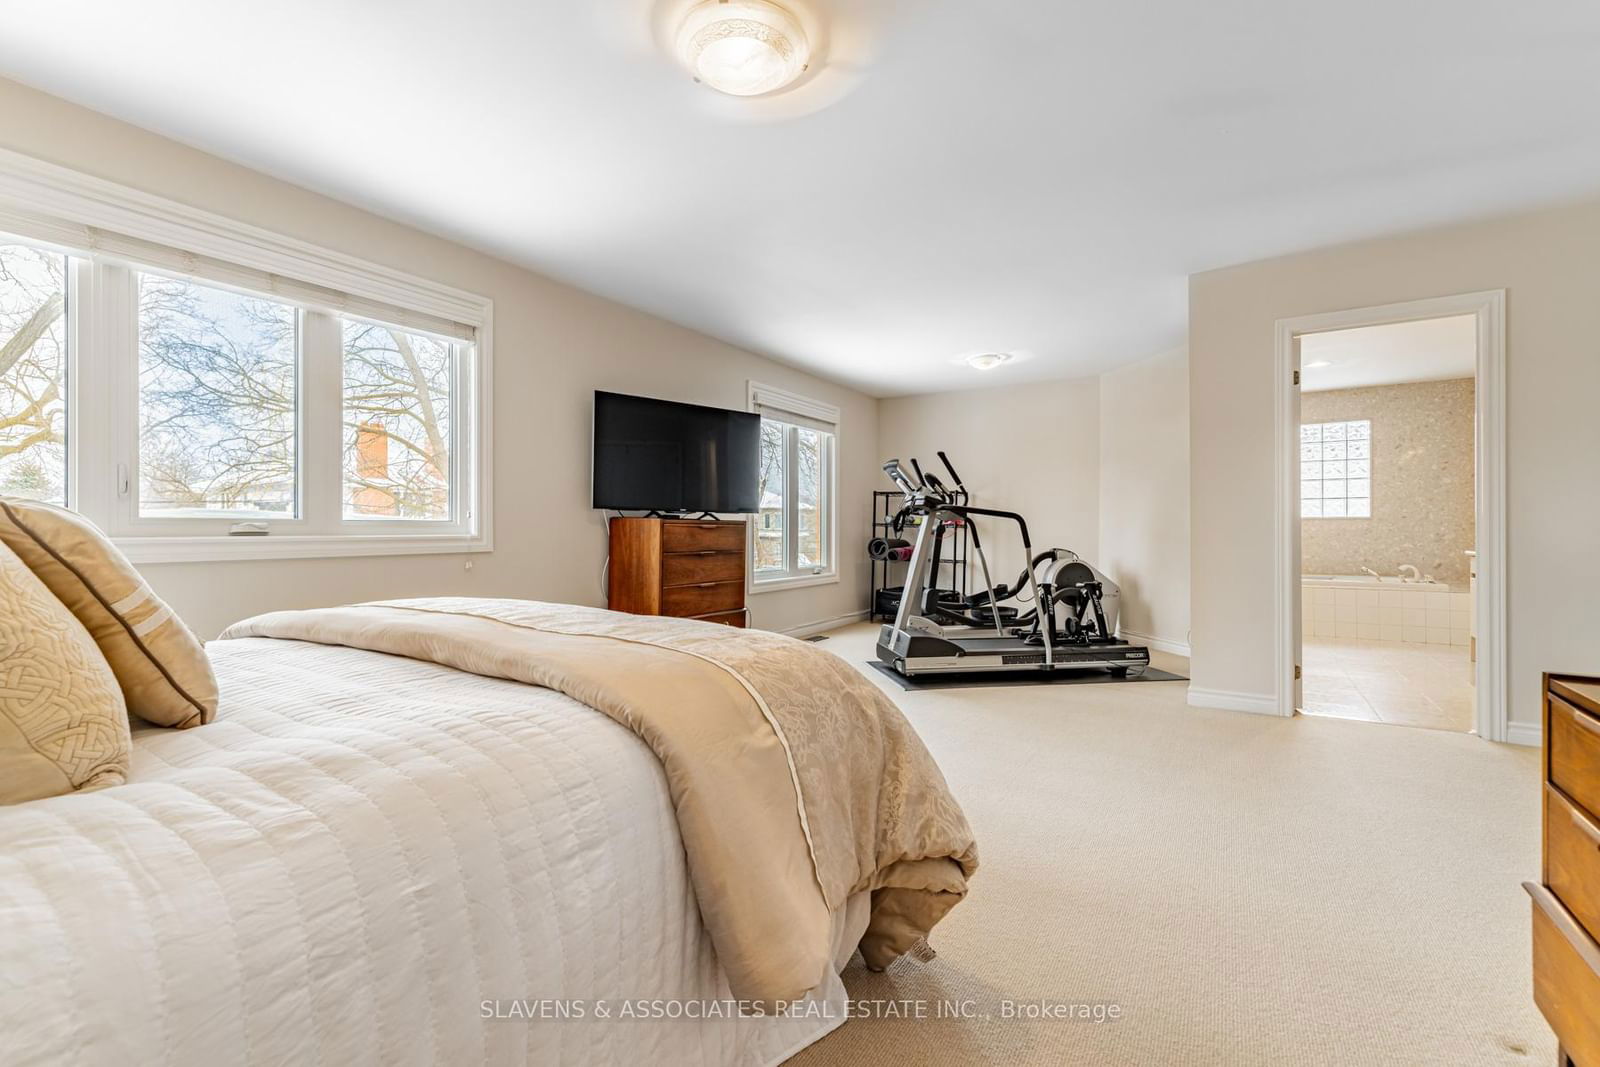
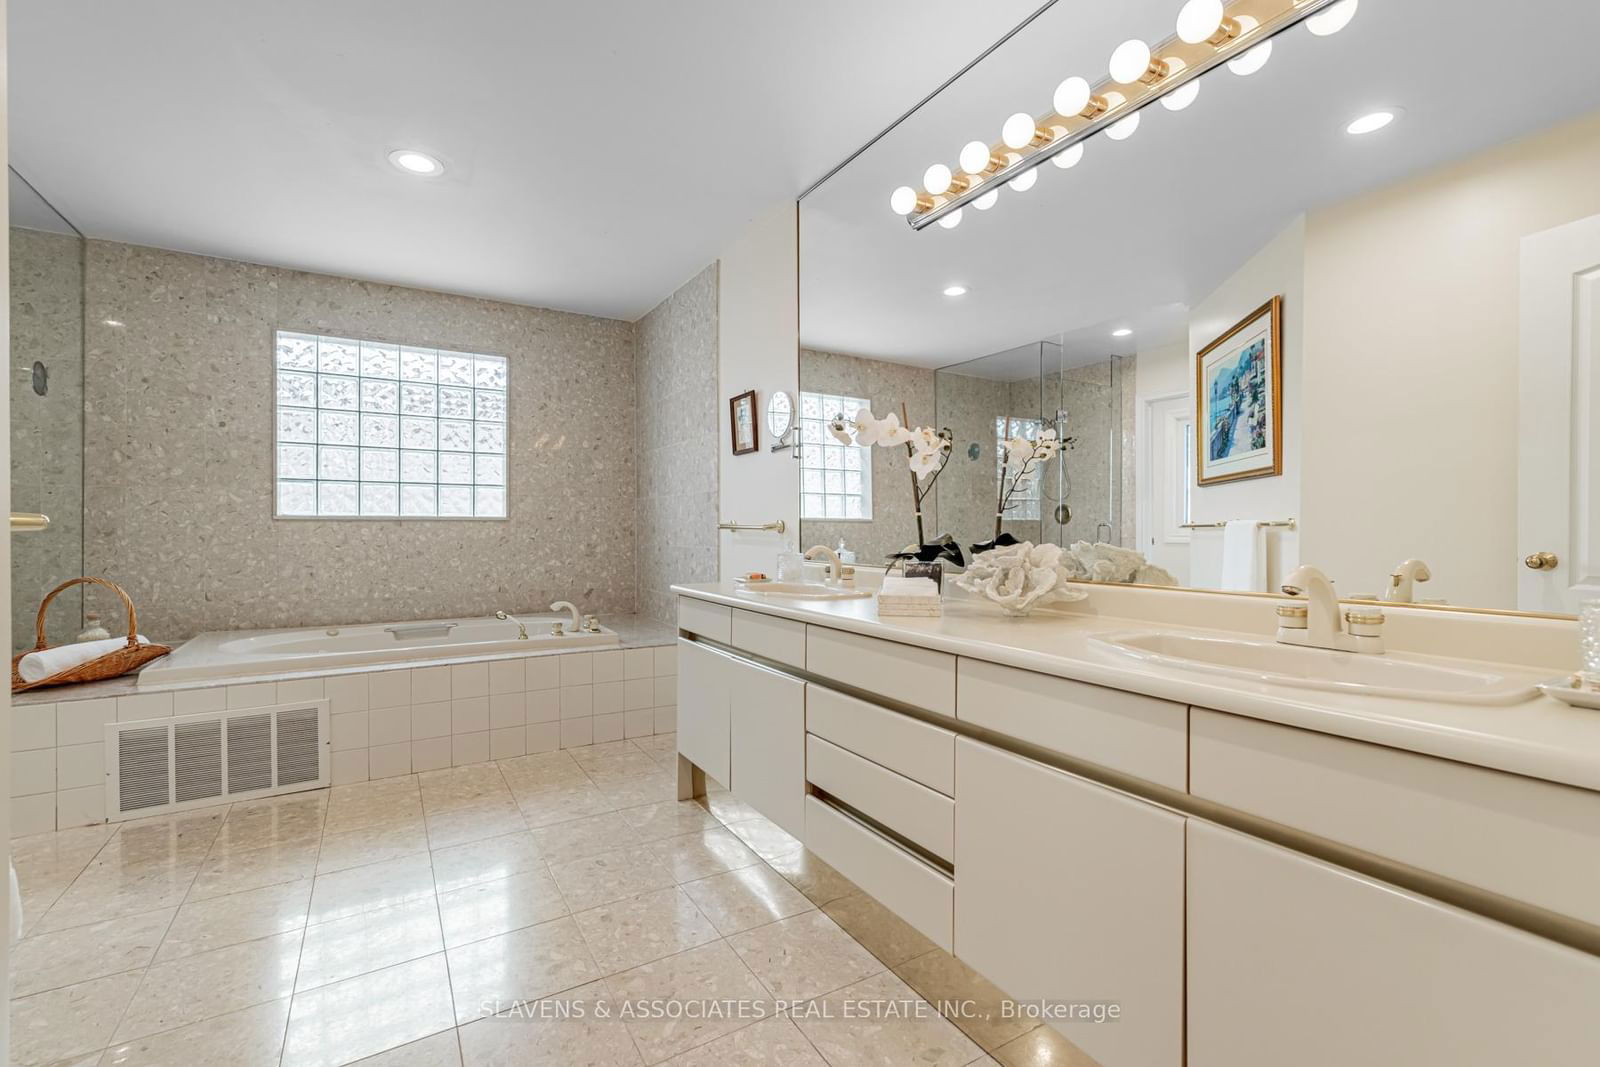
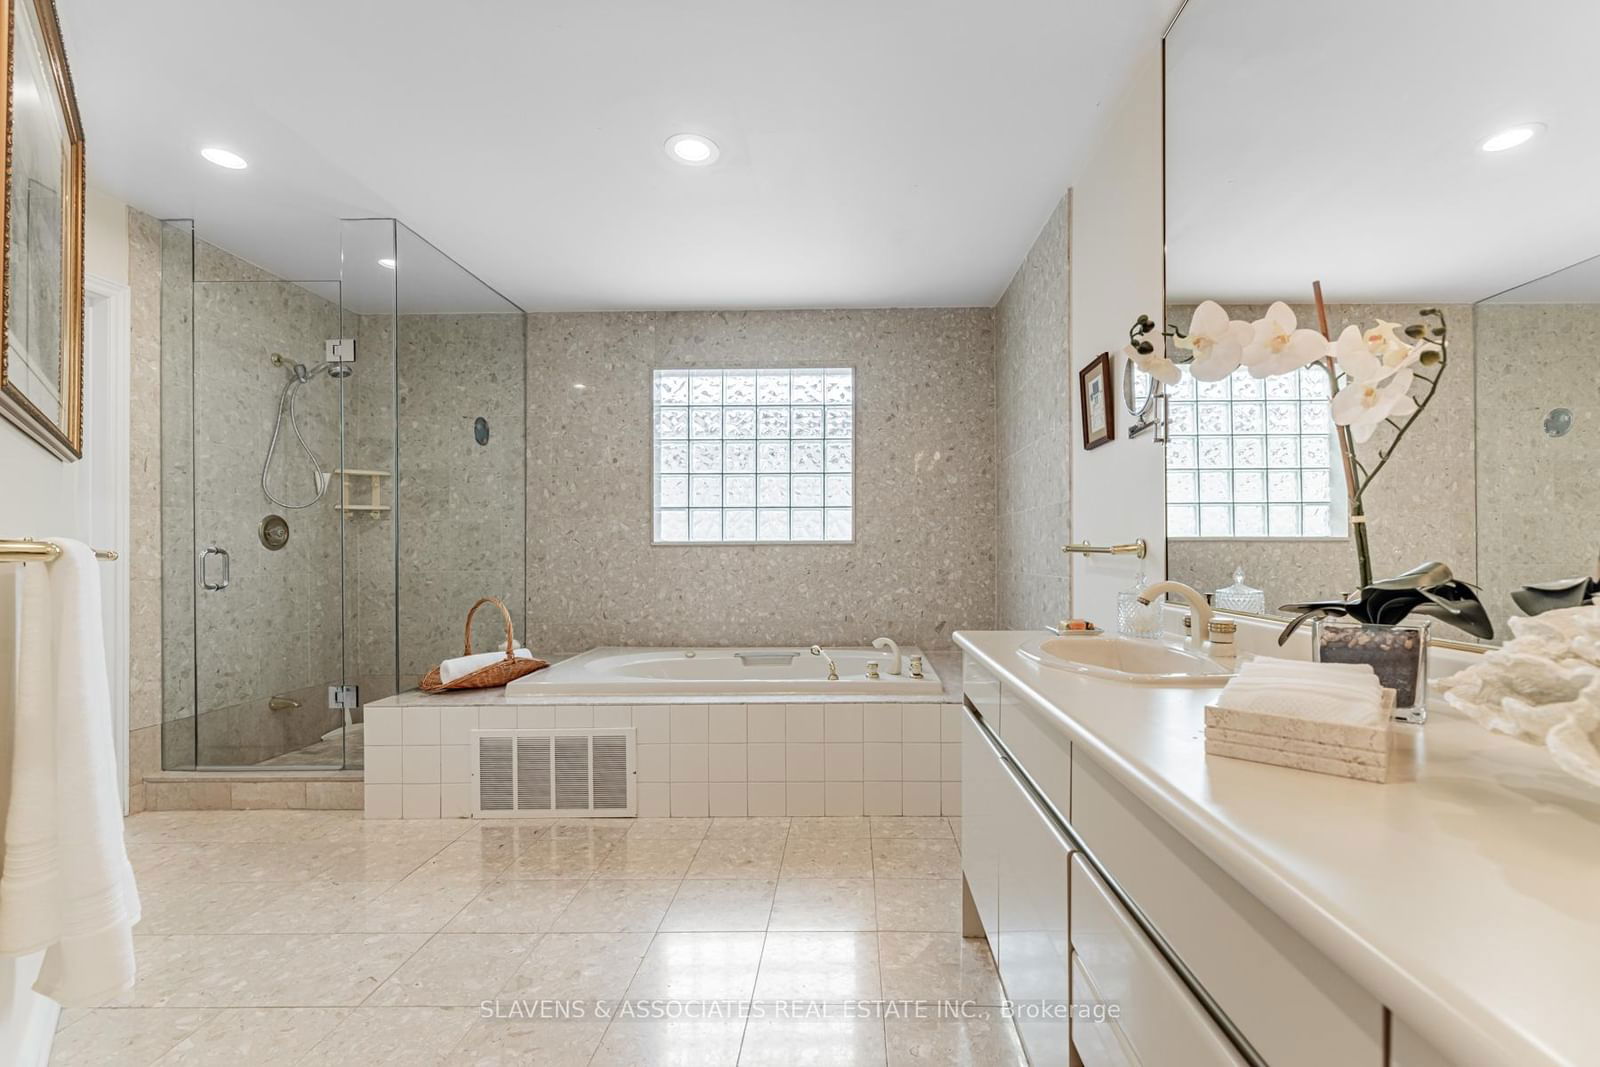
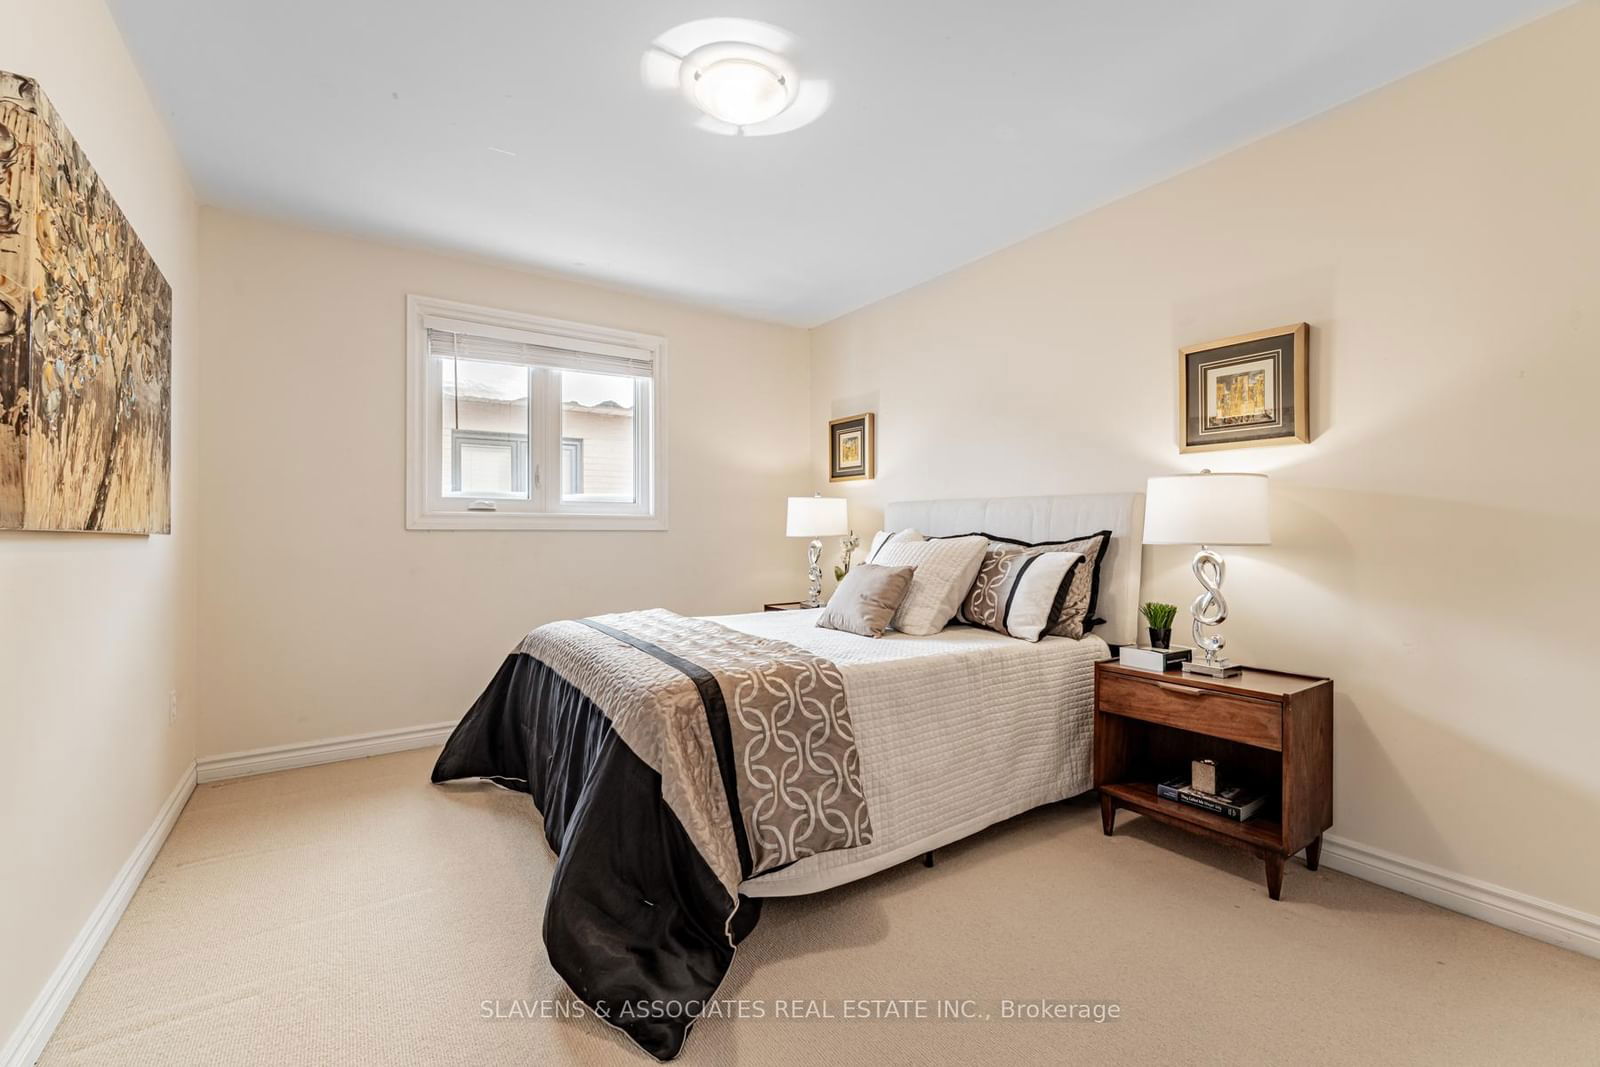
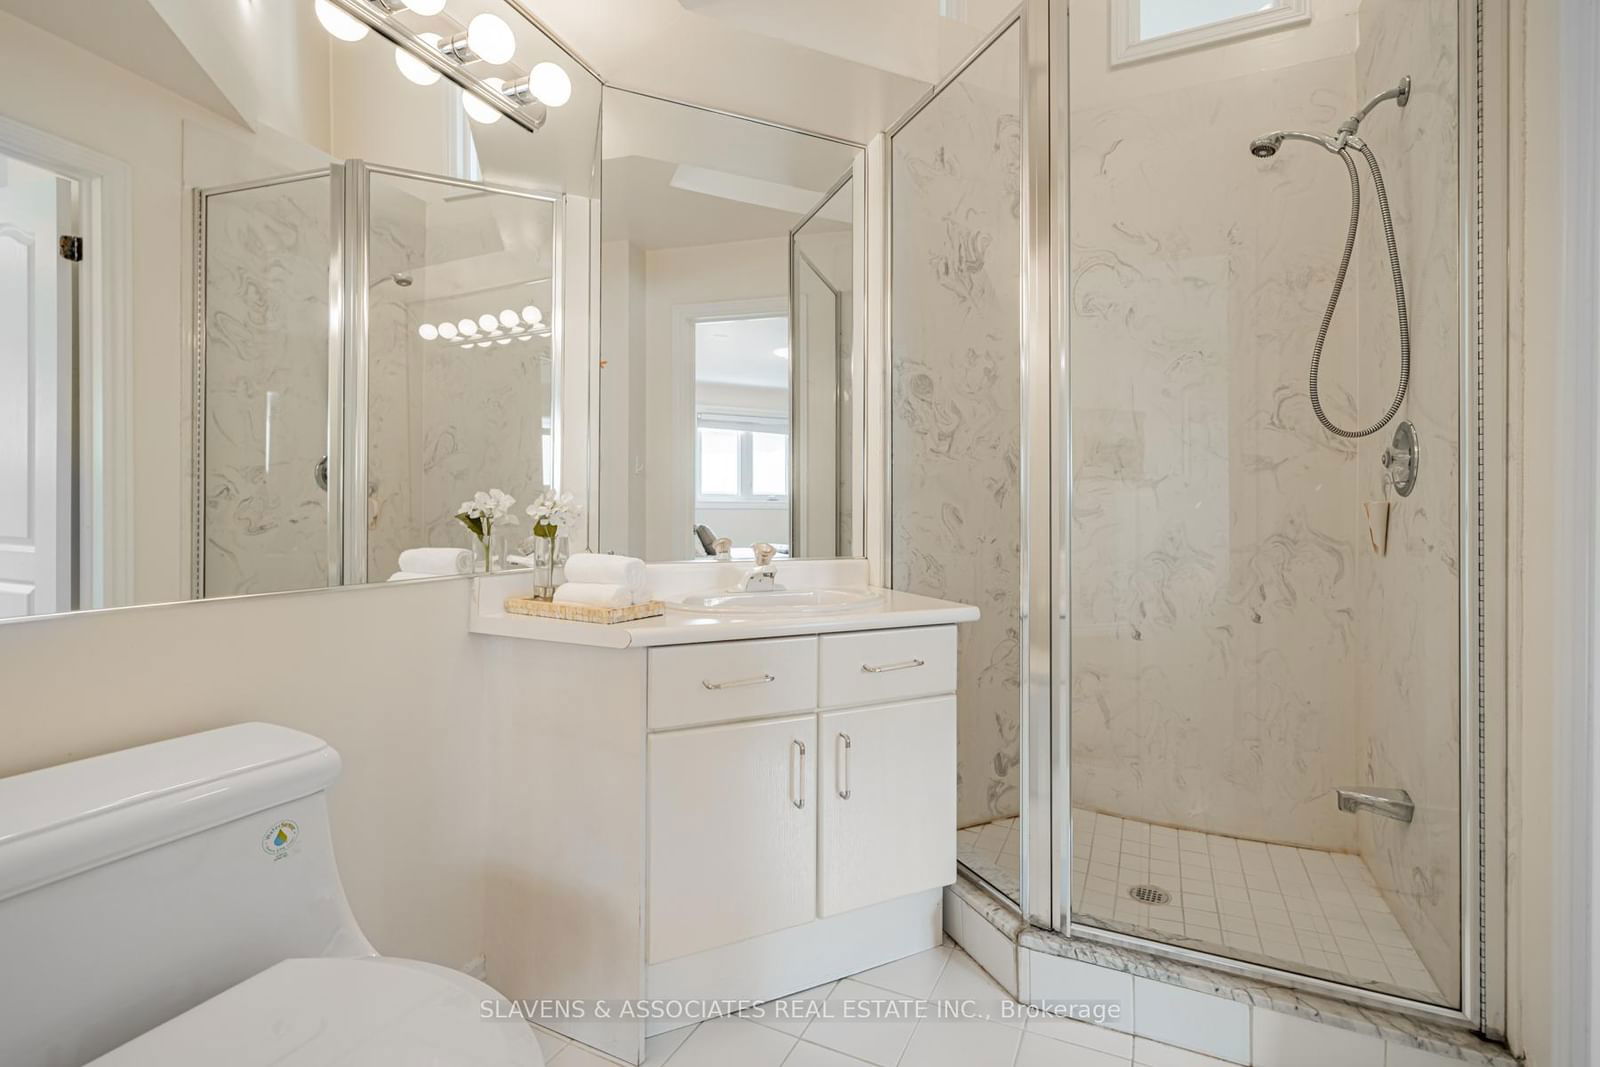
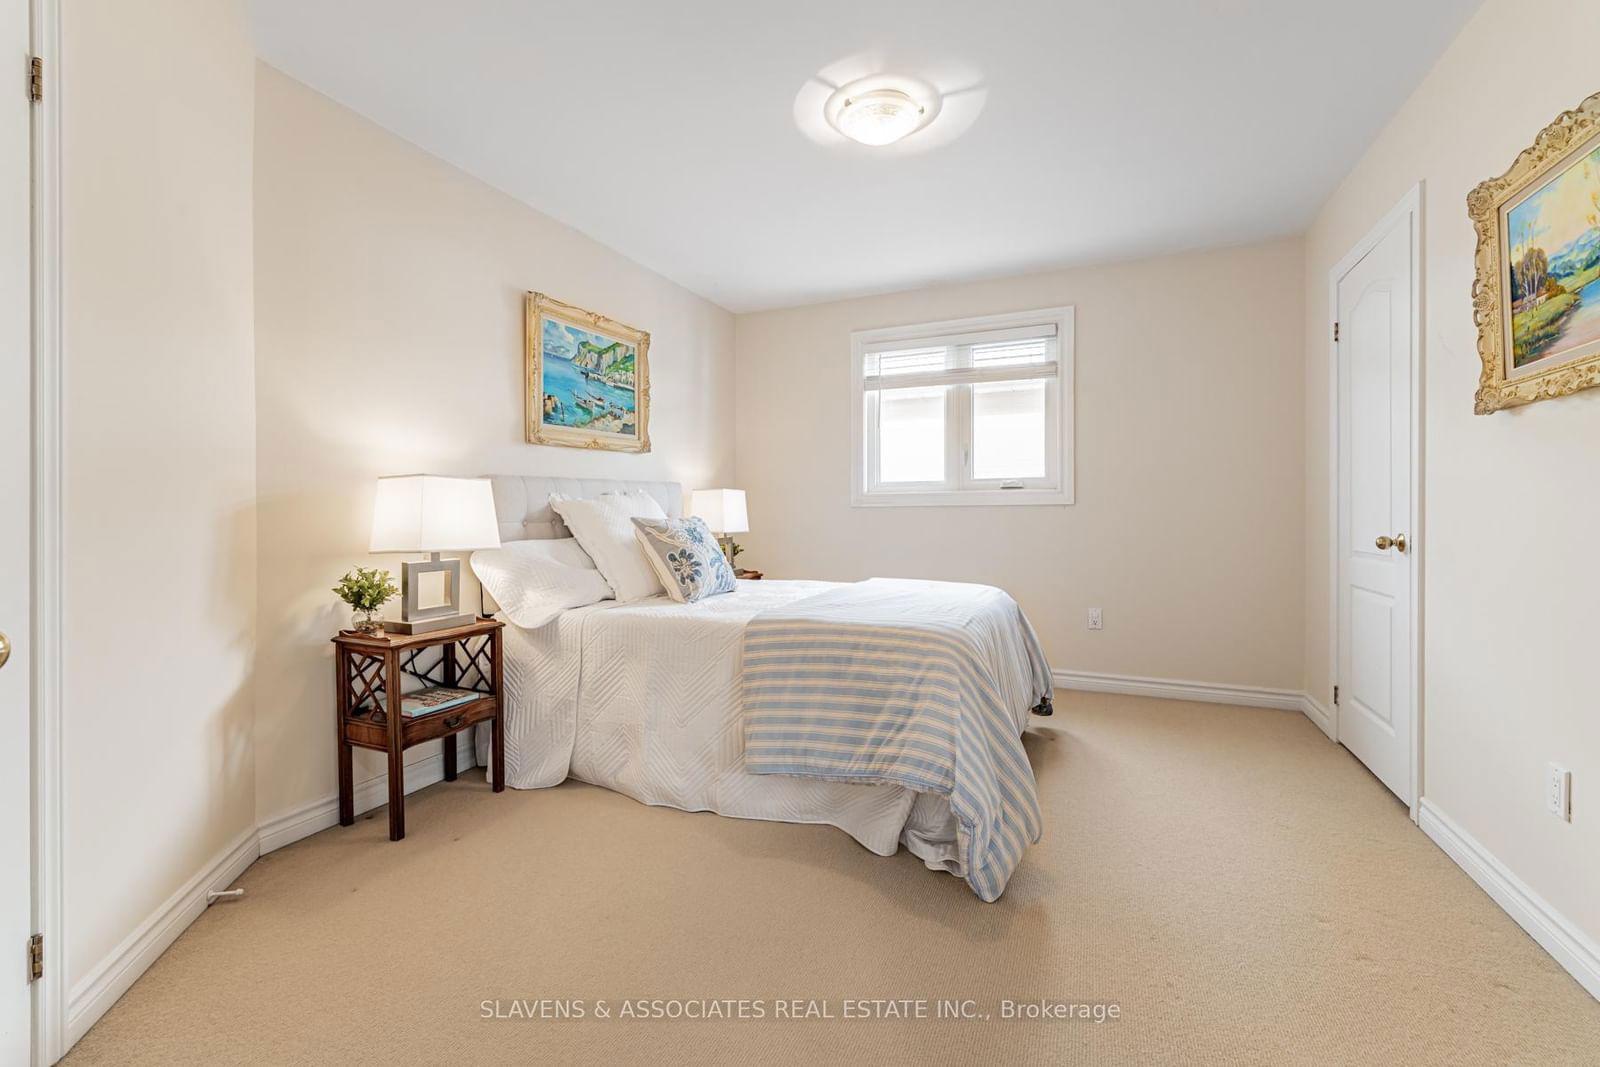
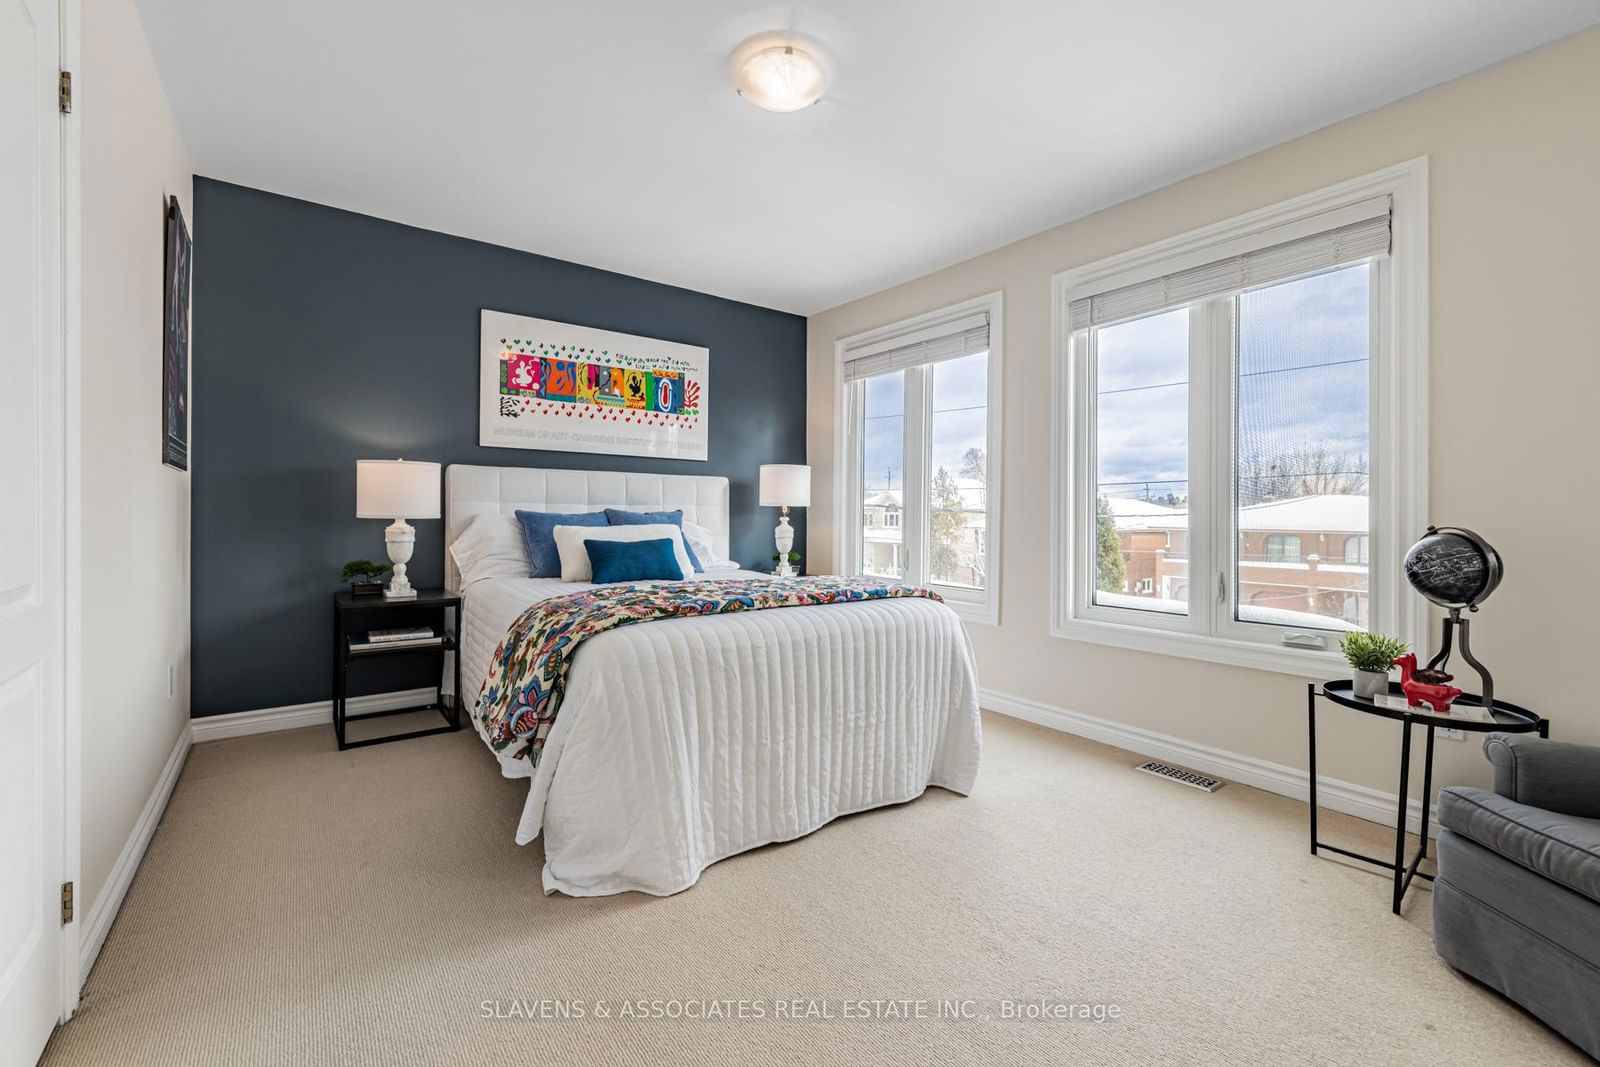
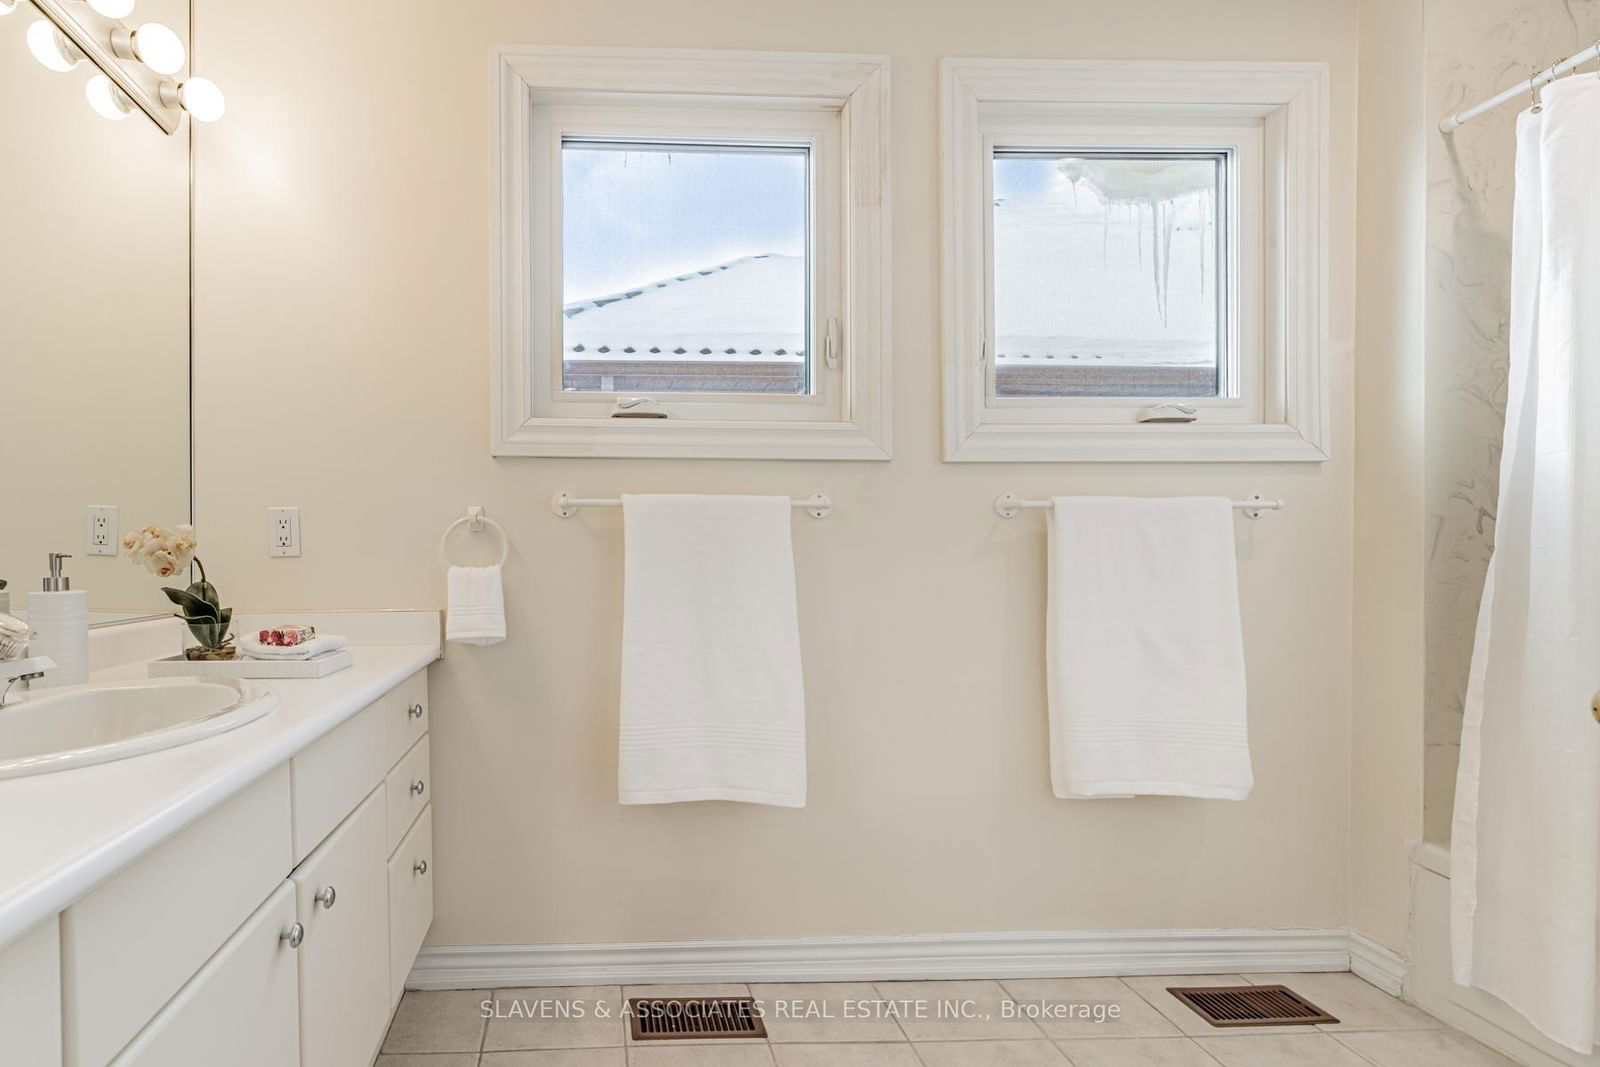
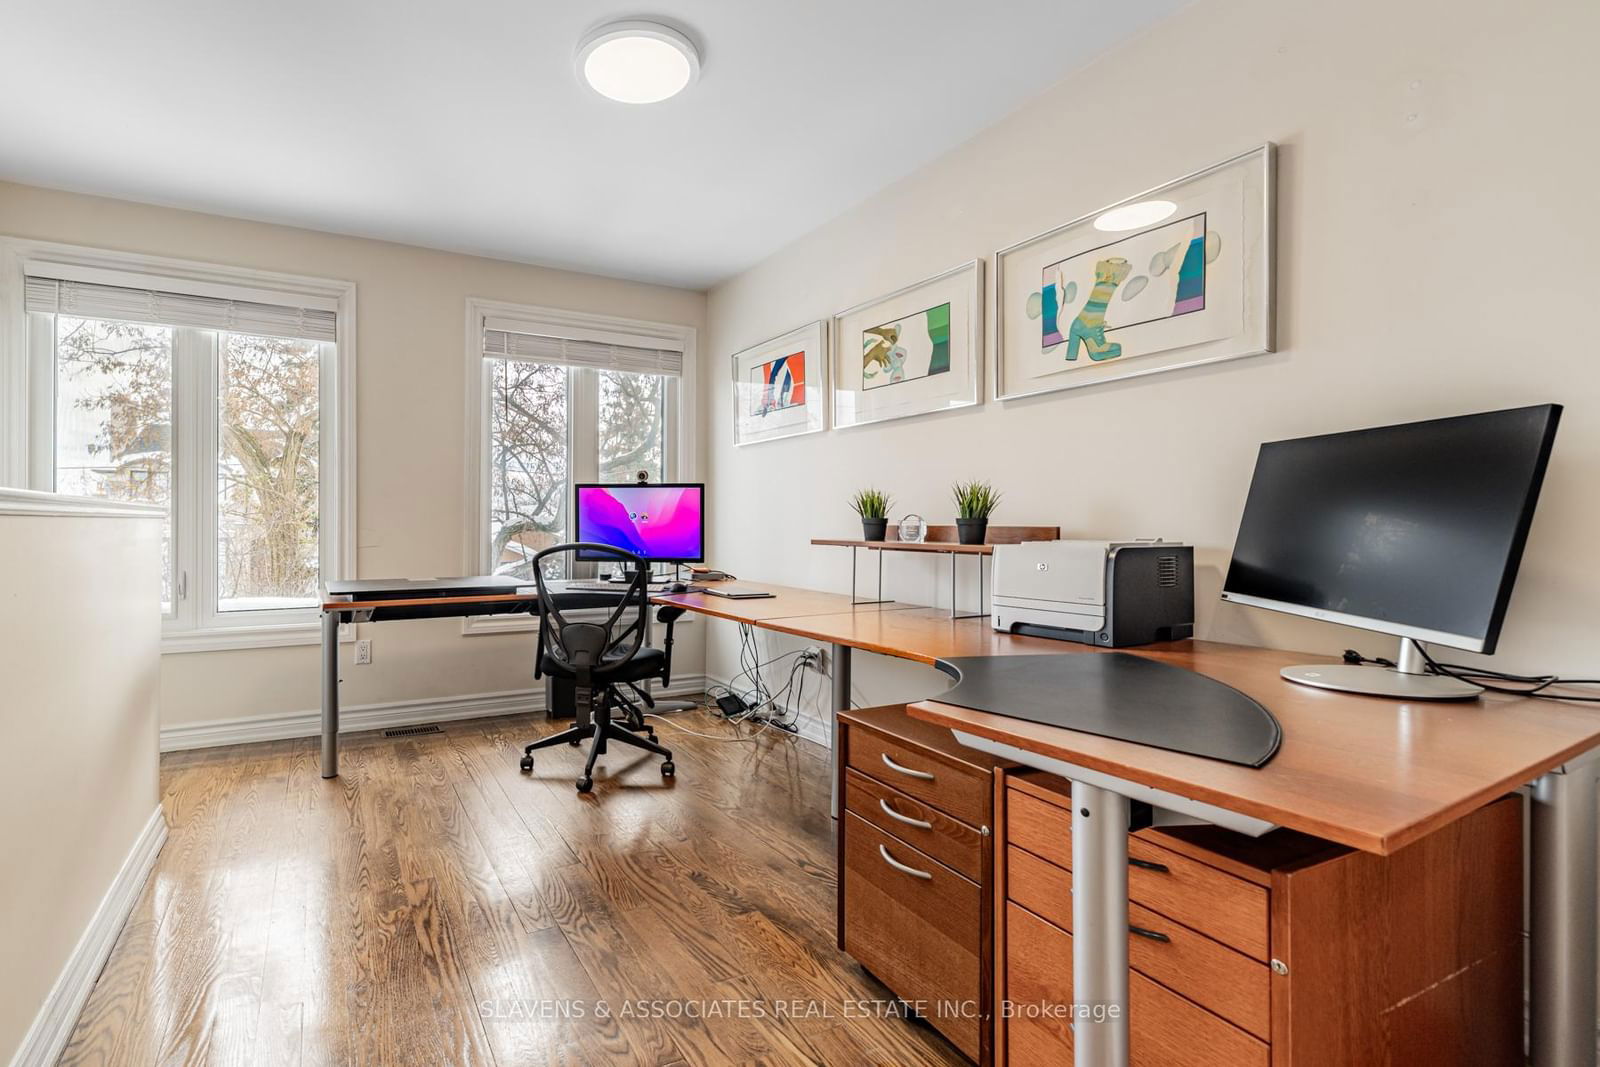
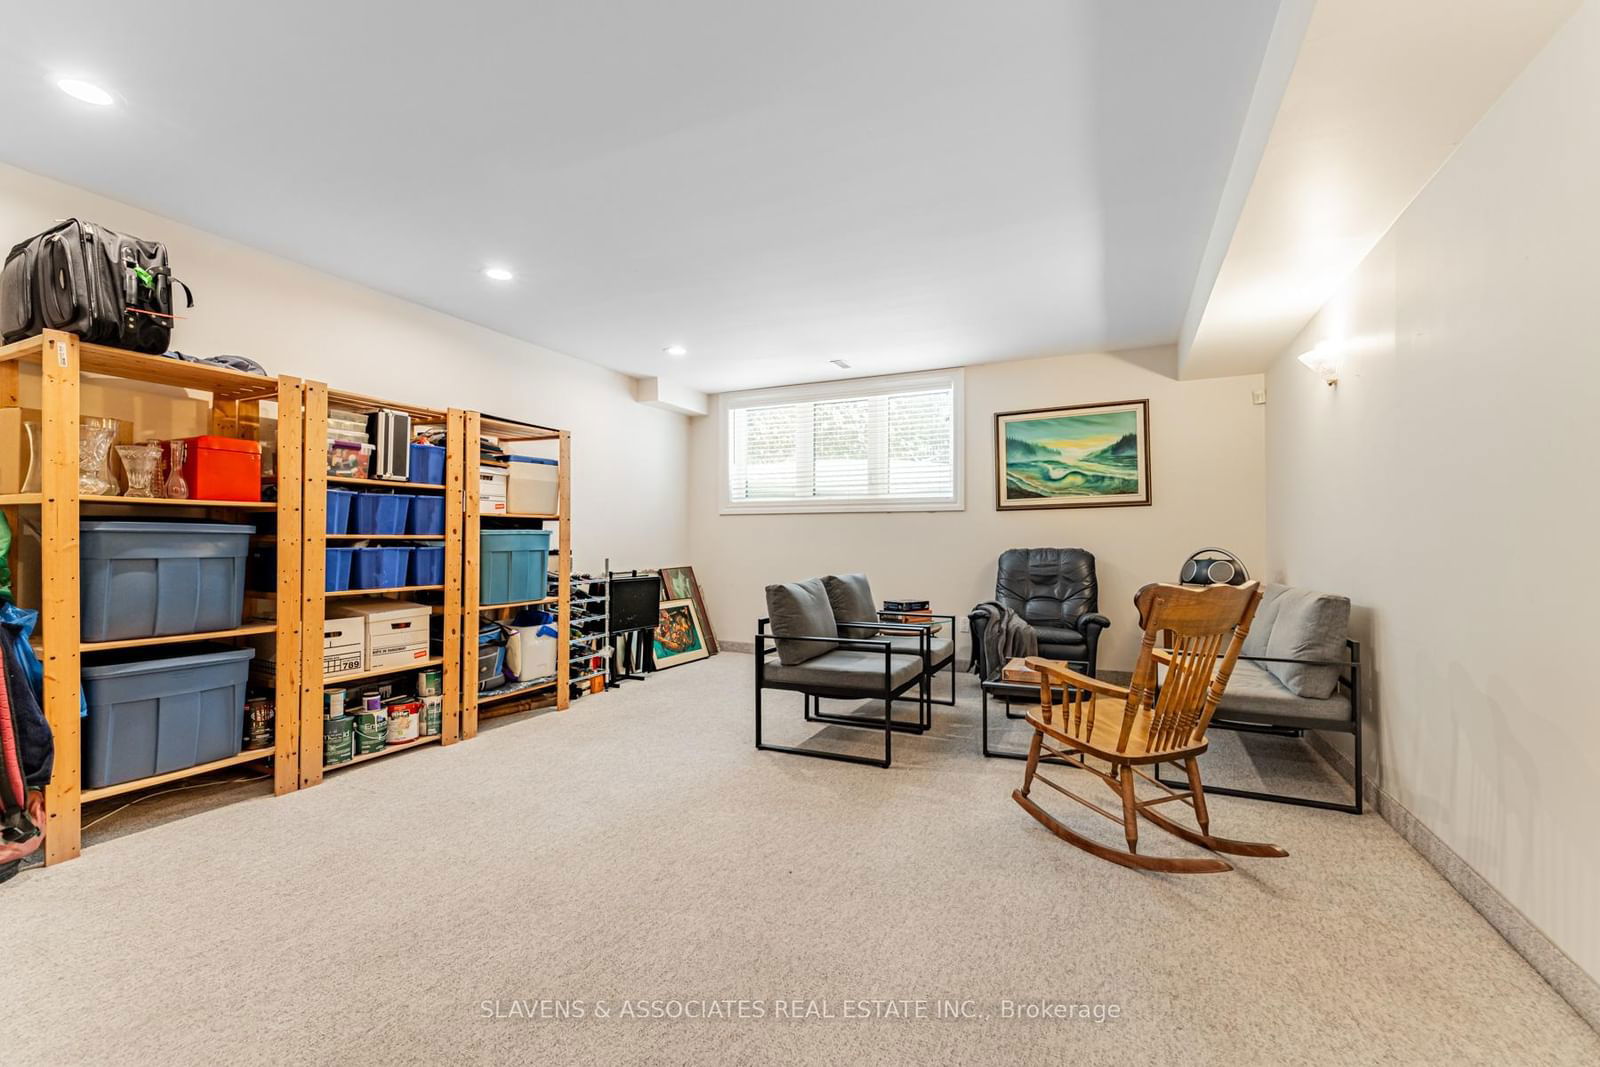
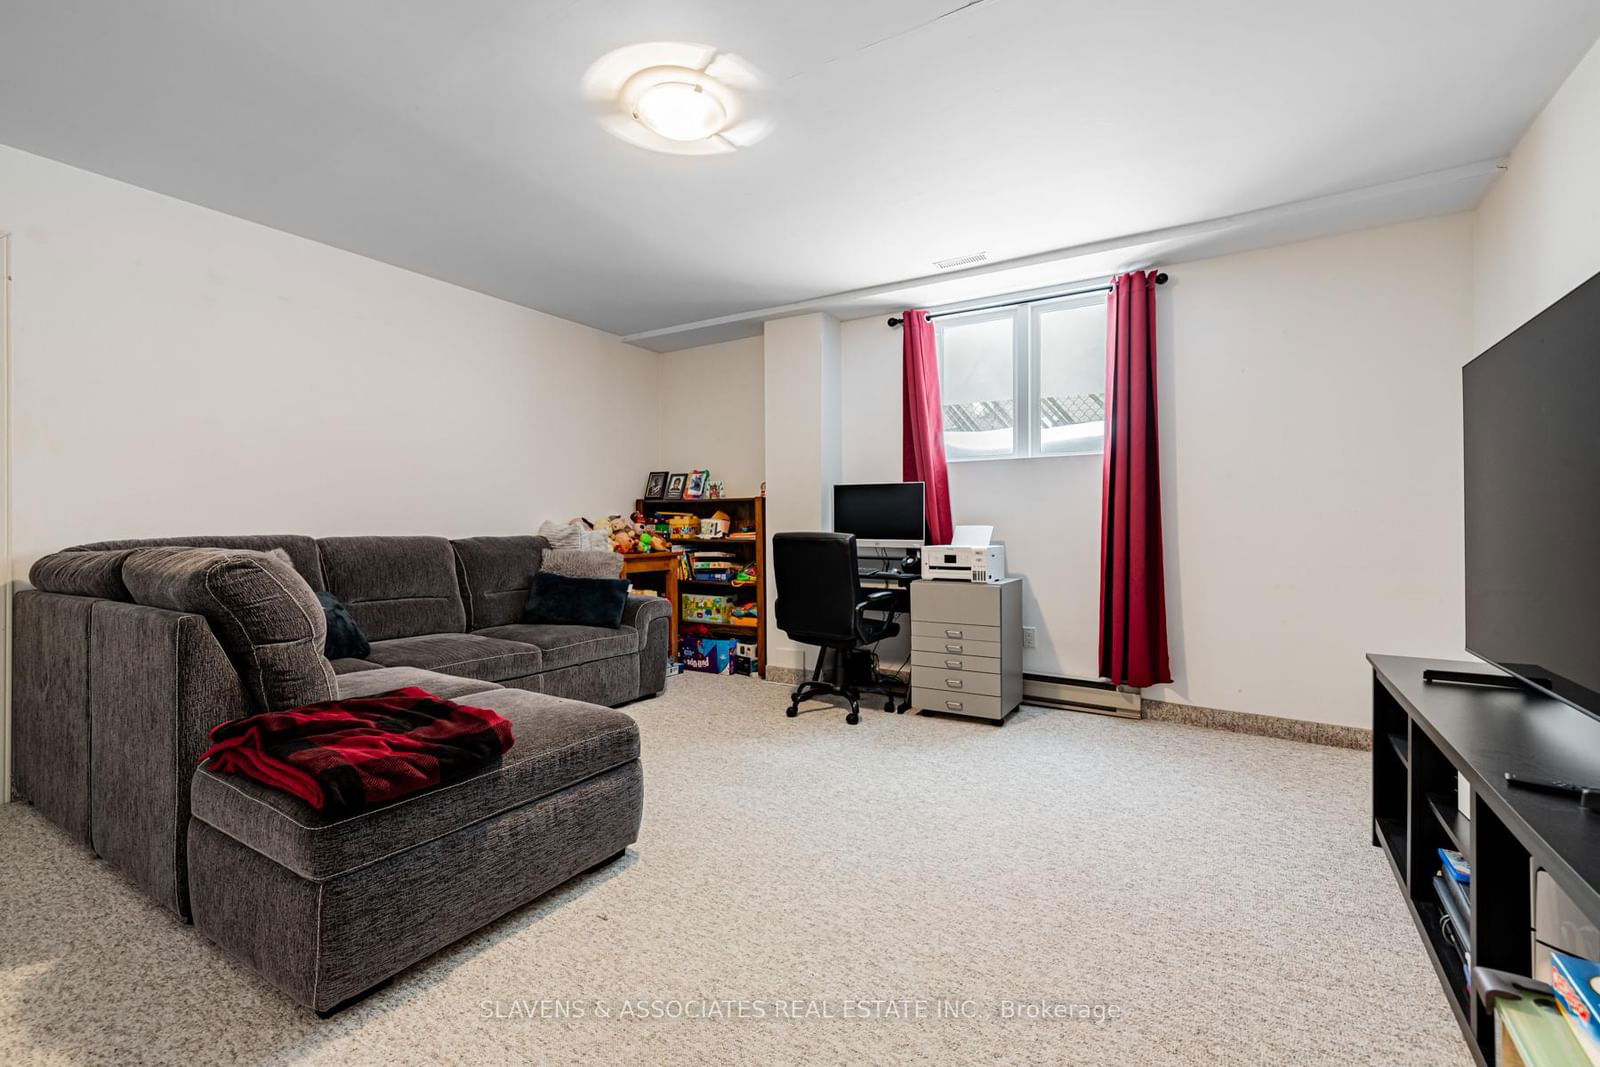
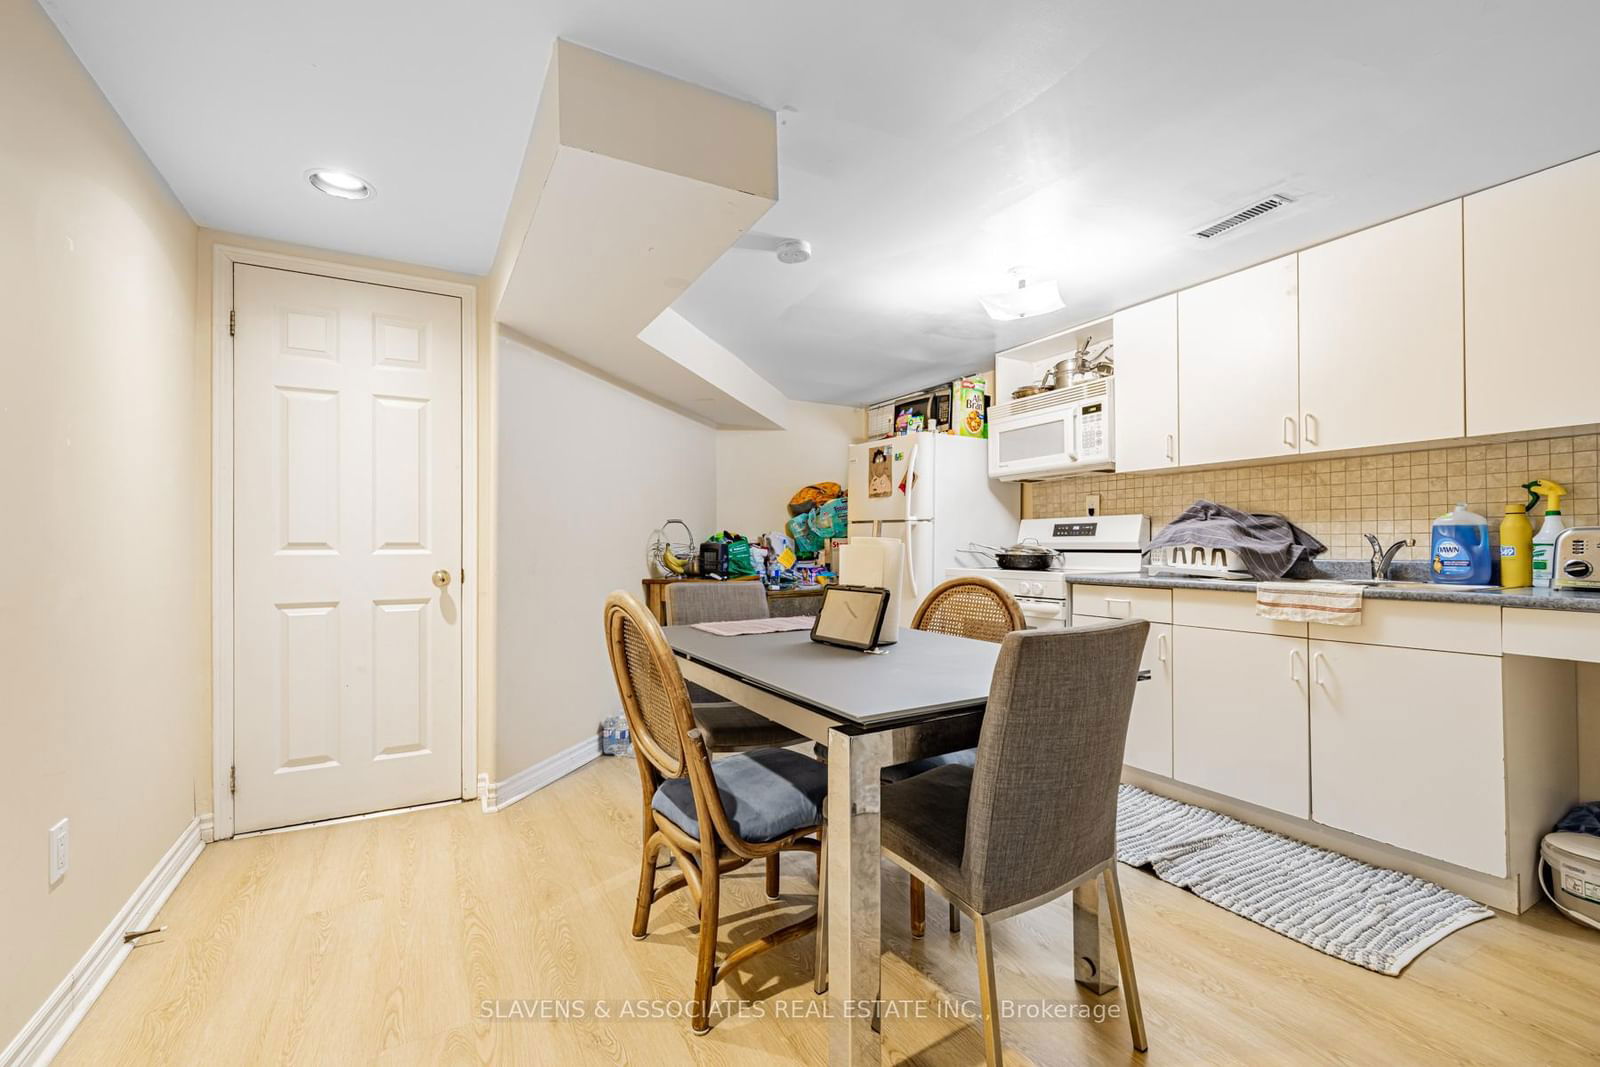
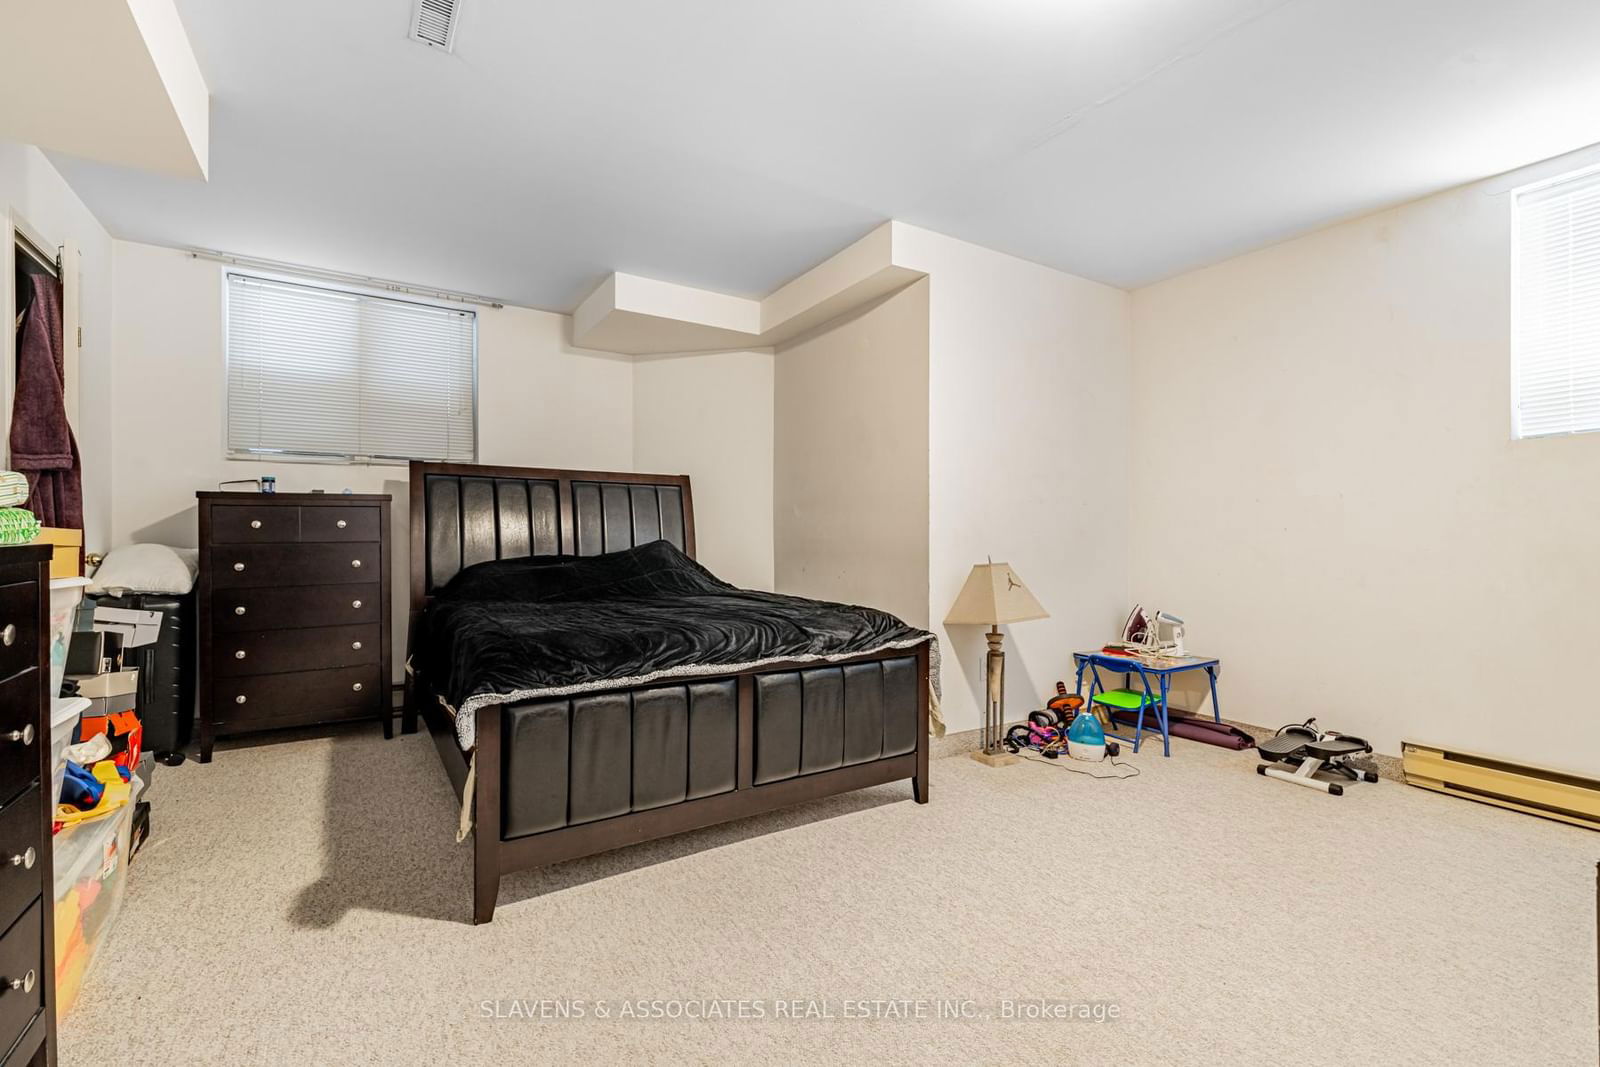
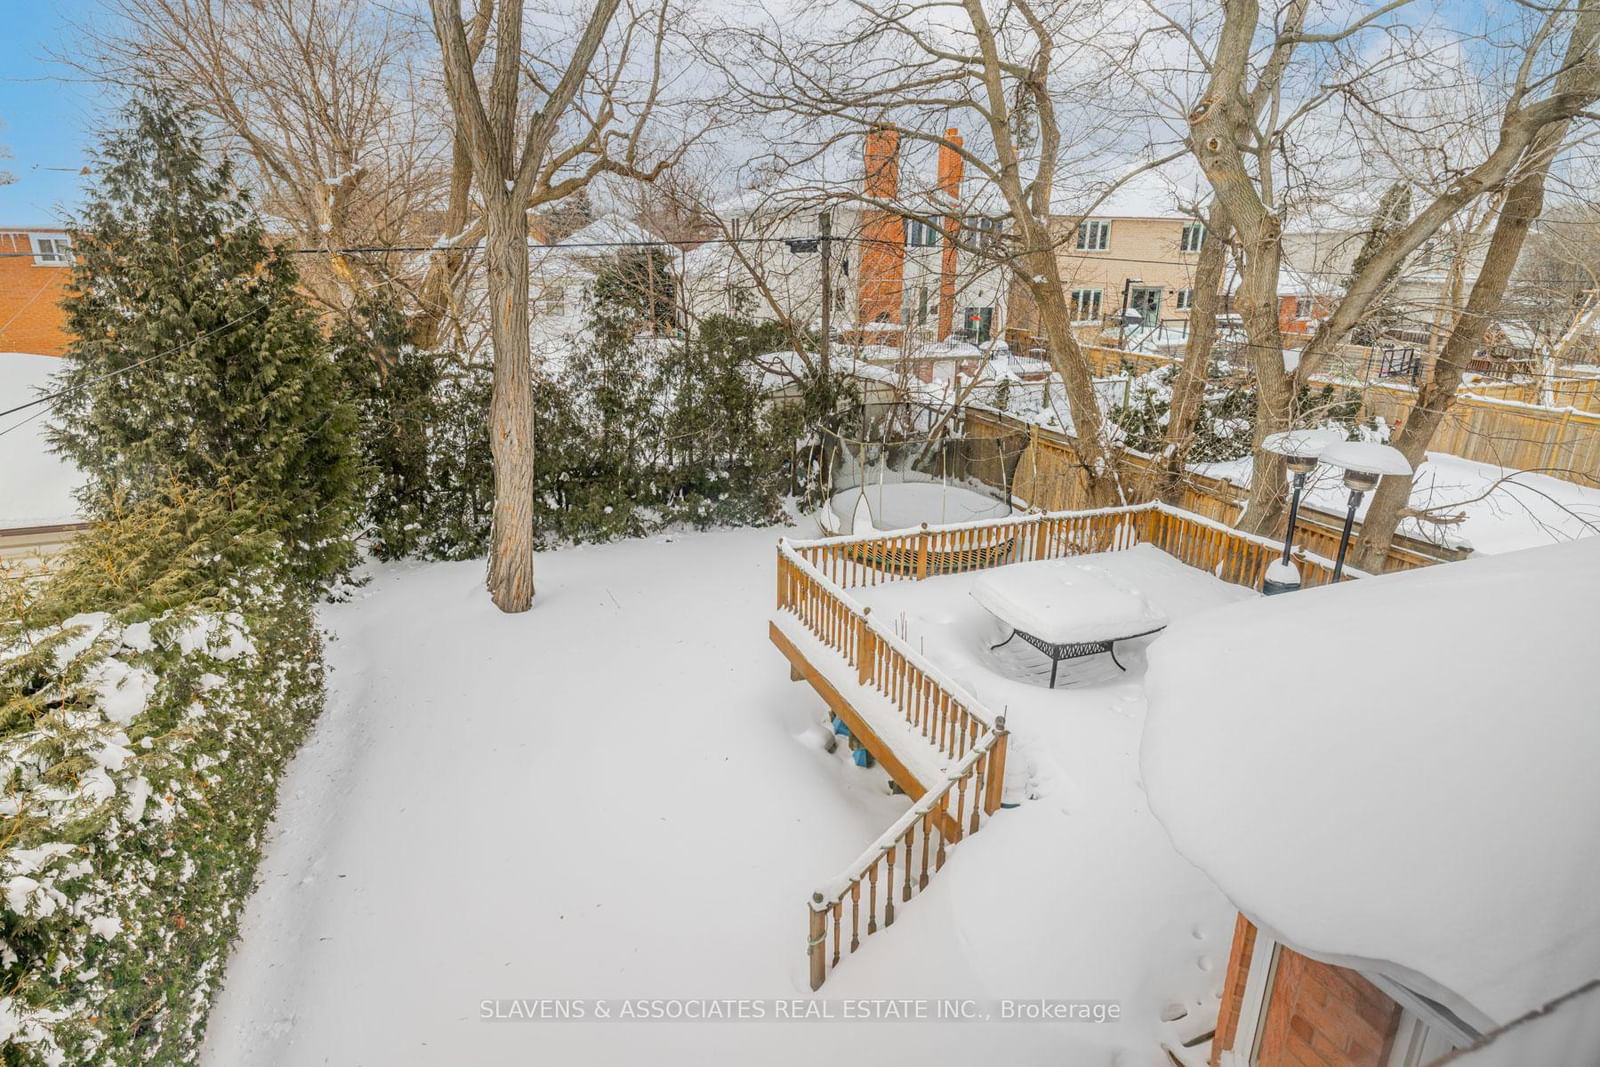
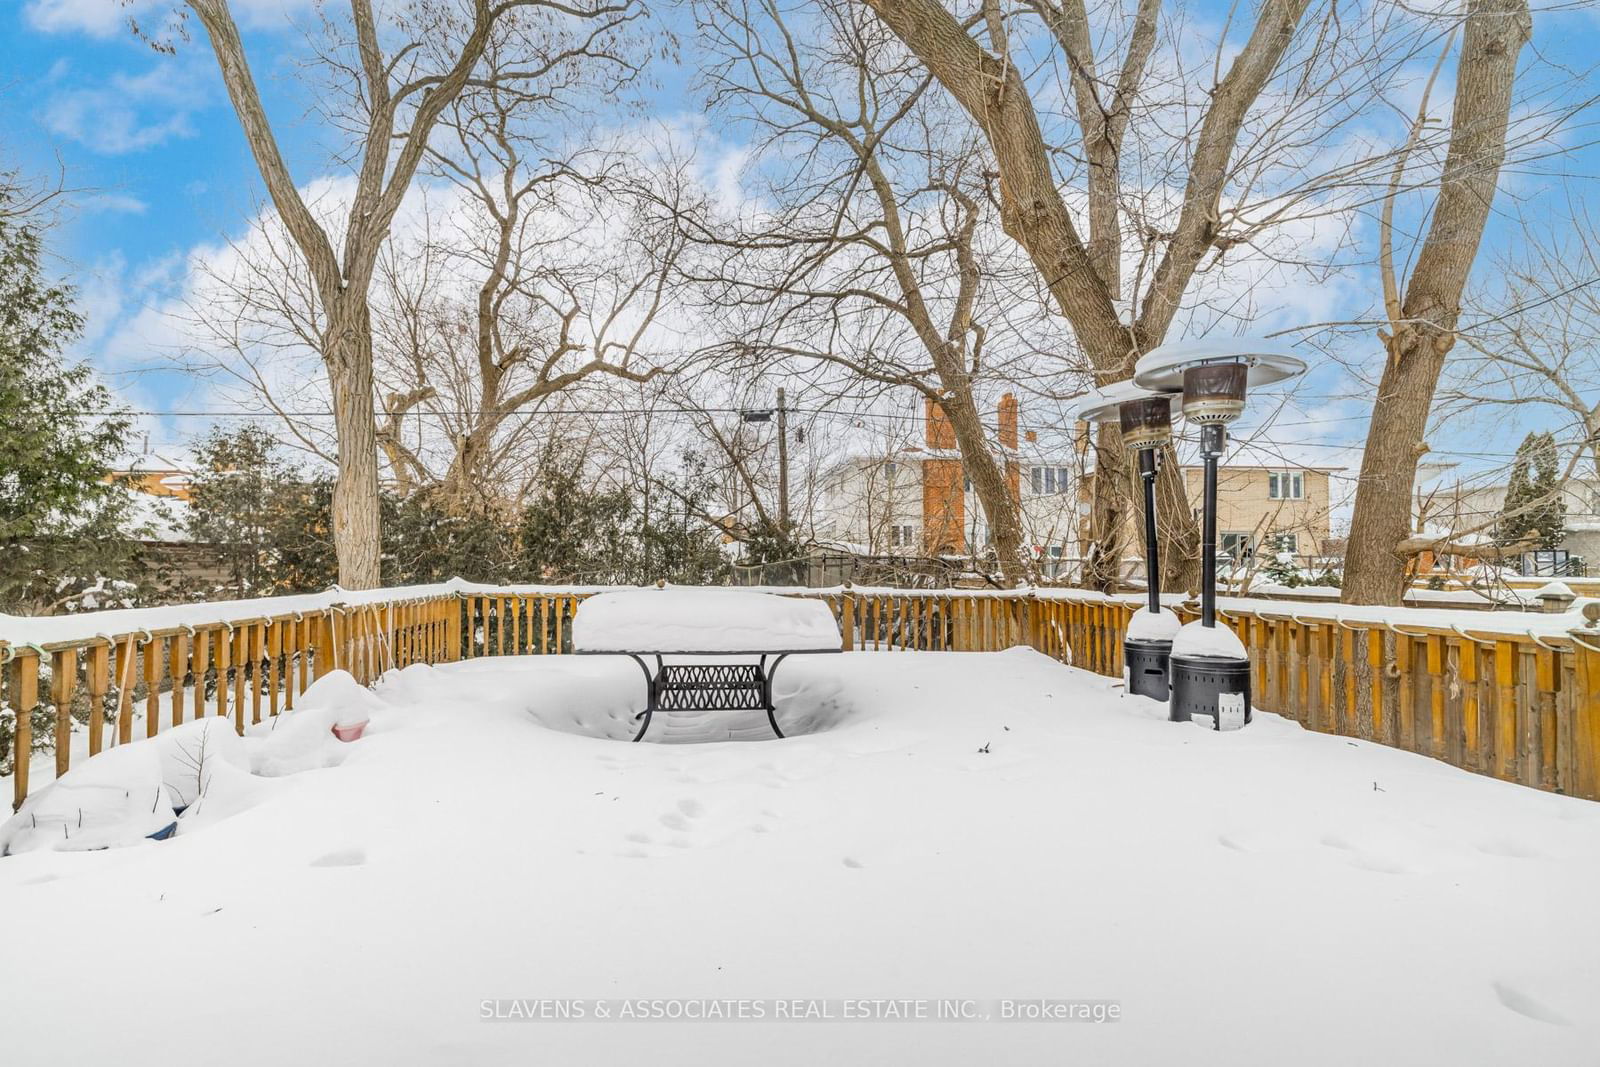
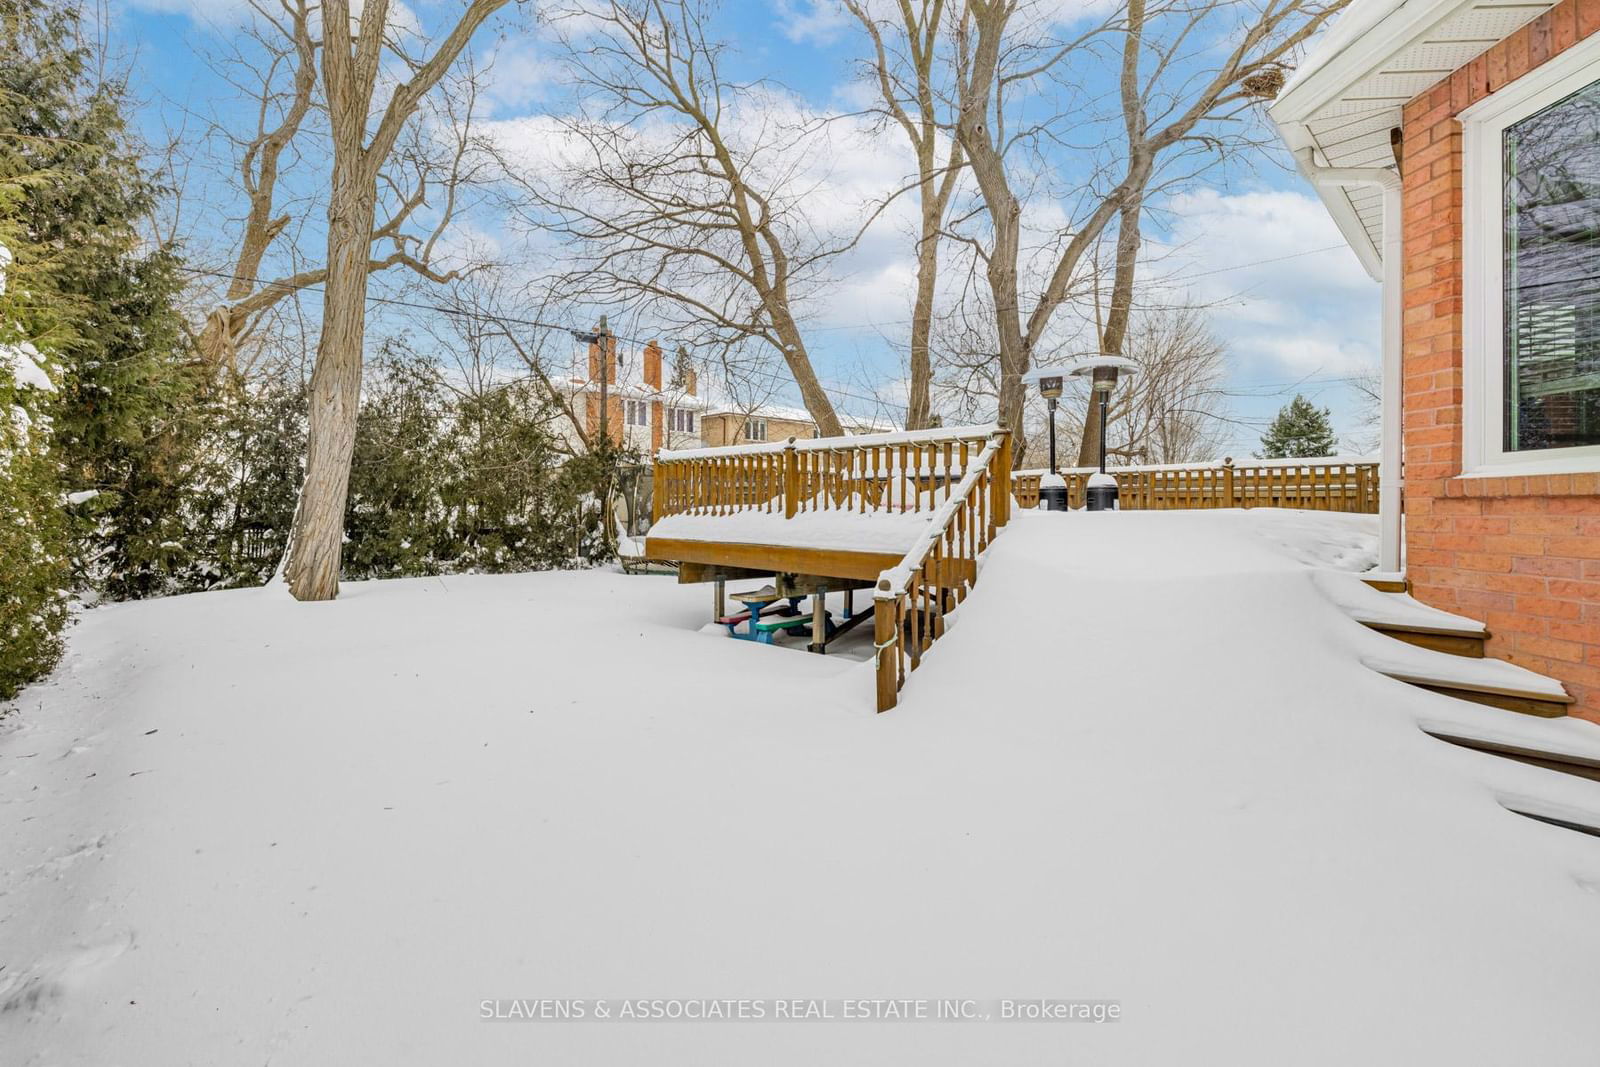
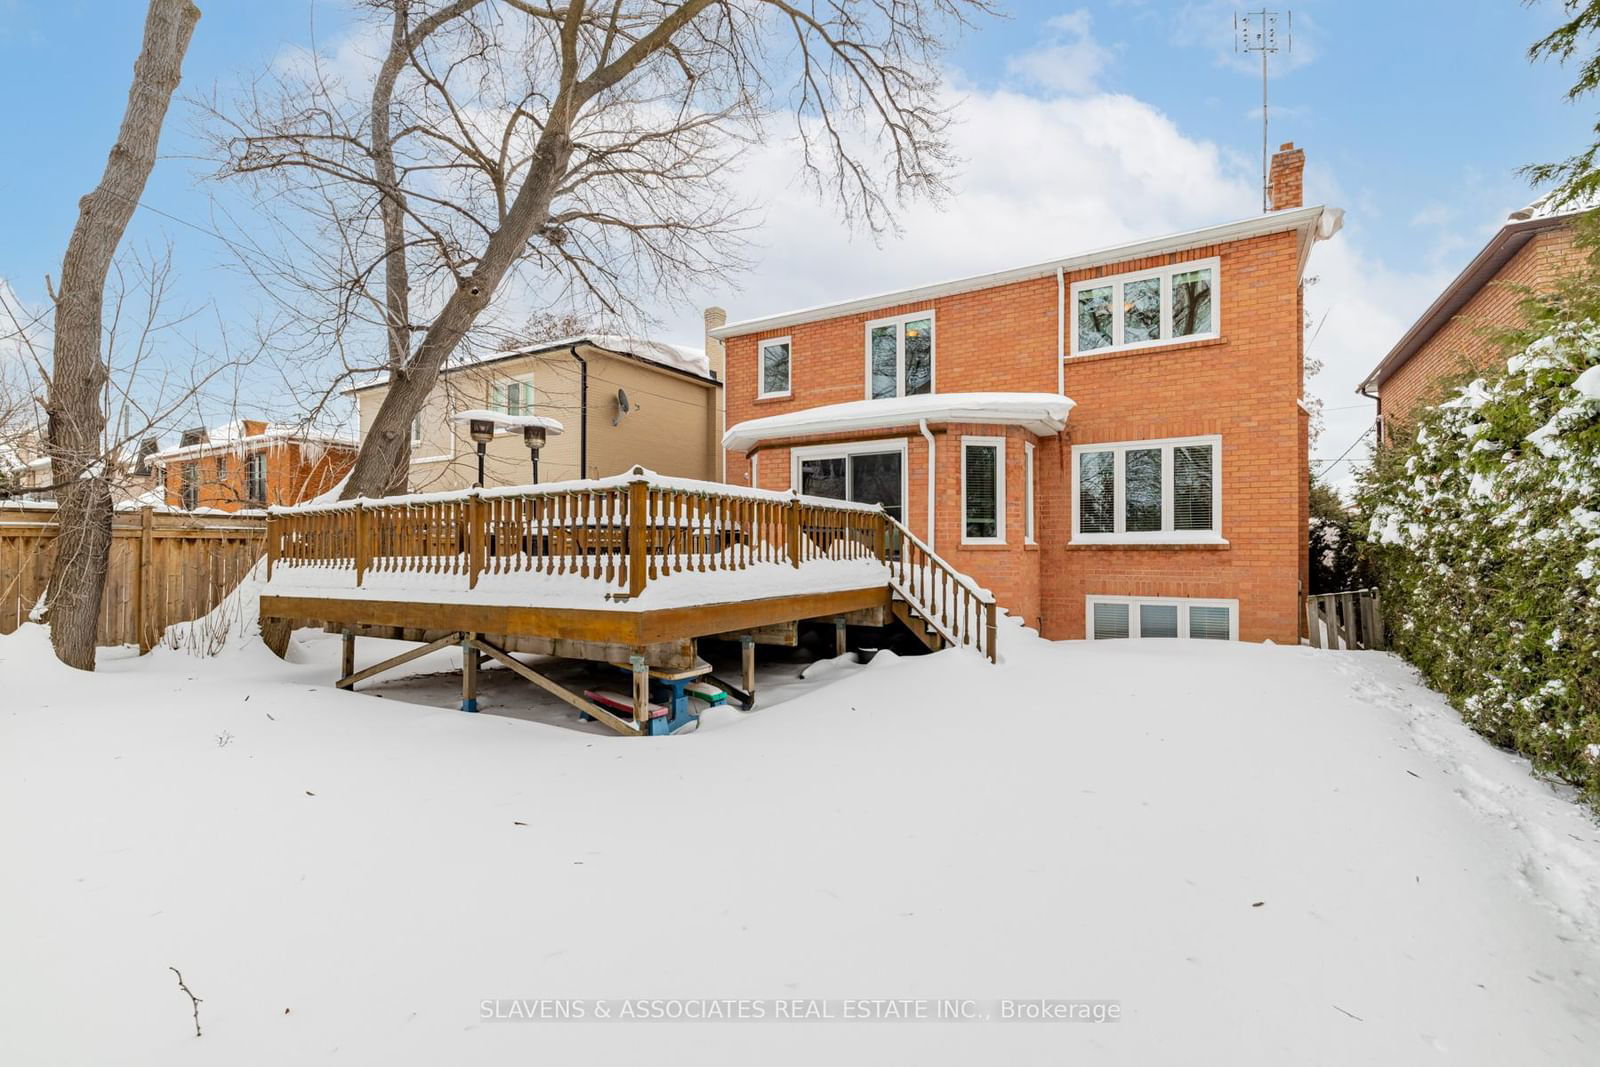
Welcome to 602 Glengrove Avenue, nestled in the Lawrence Englemount community. This sun-filled home offers a spacious and inviting layout, perfect for comfortable living and entertainment. Features include 5 + 1 bedrooms, 5 bathrooms, a kosher kitchen, plus a second kitchen in the basement, ideal for larger families or those who enjoy hosting. Over 5,500 sq ft of total living space with fifth bedroom currently being used as an office. The large deck, complete with a gas barbecue hook-up, is perfect for outdoor entertaining, while the mature trees and tree canopy create a serene and peaceful atmosphere. Inside, you'll find gleaming oak flooring and 47 newly-upgraded LCD pot lights that illuminate the space beautifully. Move-in ready with a clean, modern feel, this home is close to grocery stores, pharmacies, and the new Humber Regional Hospital. Just a short walk to a variety of synagogues and Jewish day schools, this location provides the convenience and tranquility you're looking for. For families, there are ample schooling options within the neighbourhood including French immersion. The house is well situated for access to parks, tennis courts, and the Beltline Trail for walking and cycling being close by for recreational enjoyment. Commuters will love the proximity to Glencairn subway station, accessibility to Bathurst street and easy access to major highways, including the 401, Allen Road and just a 30-minute drive to the airport. Don't miss out on this fantastic opportunity to live in a vibrant and welcoming neighborhood!
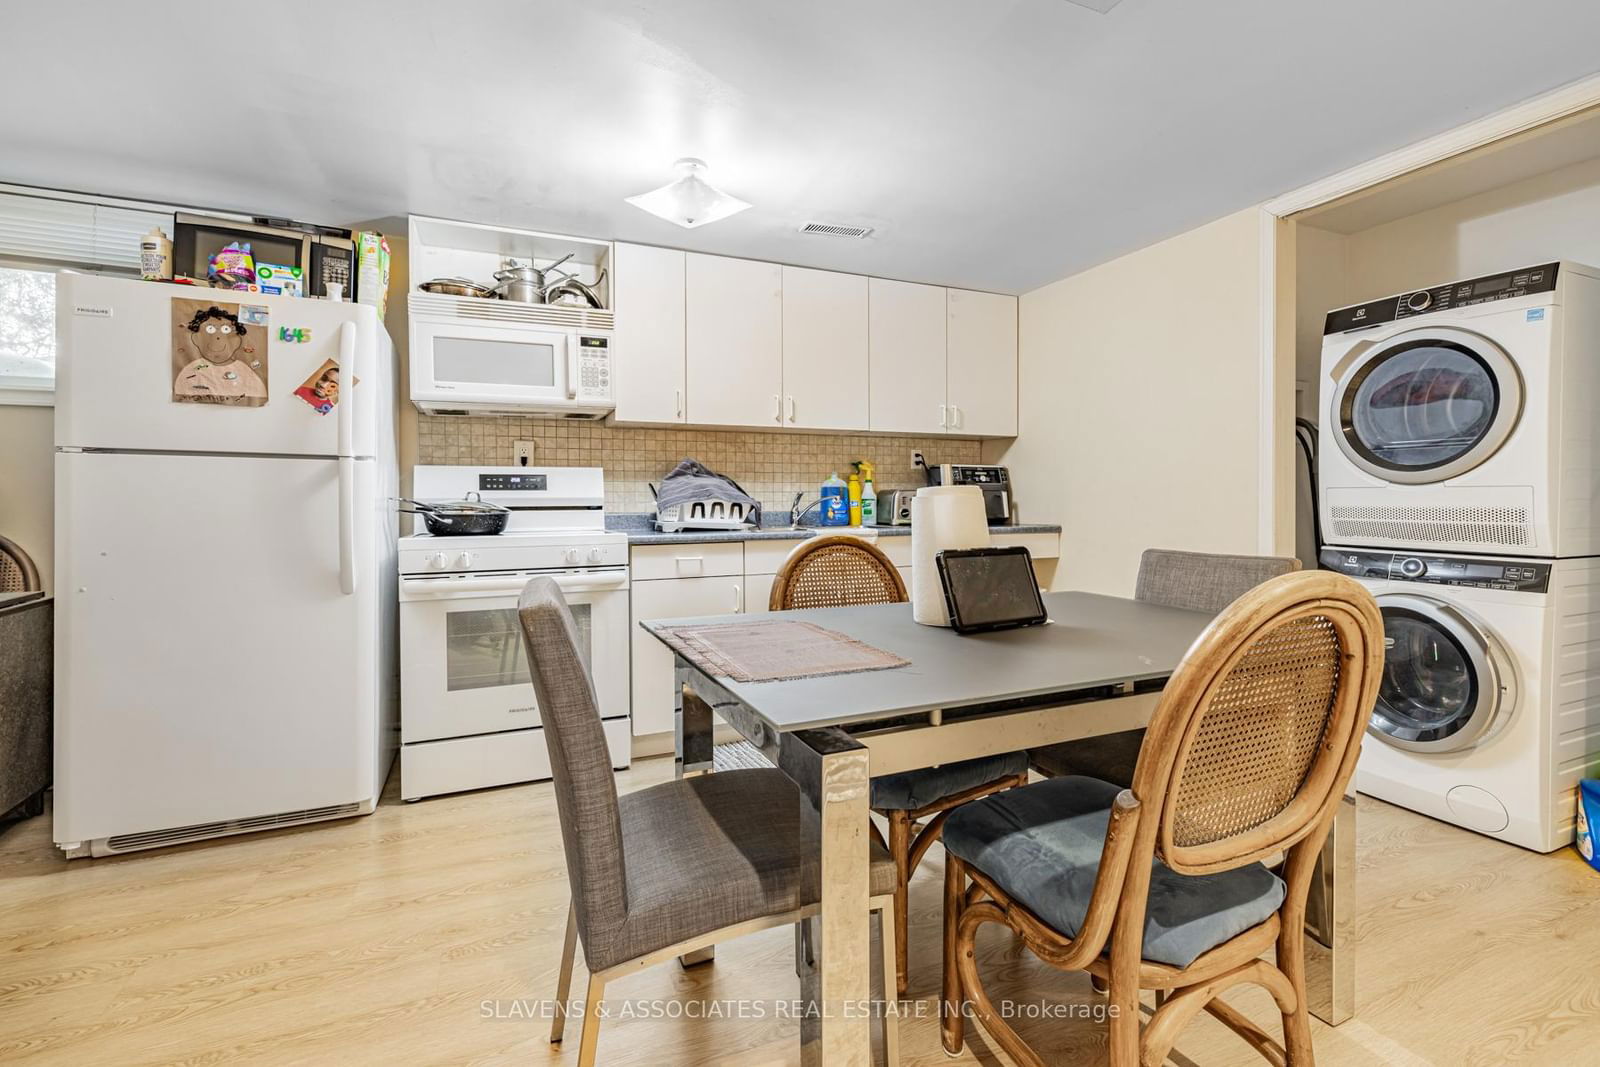
S/S: KitchenAid, LG stove (2025), Whirlpool built in dishwasher, LG built in dishwasher, Samsung Cooktop (2021); front load Kenmore washer/dryer; lower level Frigidaire fridge and stove, Electrolux stacked ventless washer/dryer; all electrical light fixtures, all window coverings, broadloom where laid, central vacuum and equipment ; electric garage opener and remote; ev plug in - garage, gas burner and equipment, central air conditioning and equipment (2020), large vinyl sukkah, gas BBQ and trampoline (as is), cast aluminum table with 8 chairs.
Living
Dining
Kitchen
Breakfast
Family
Office
Primary
2nd Br
3rd Br
4th Br
Office
Rec
Living
Kitchen
Br
Mudroom
The graph below compares the average list price and average sale price of homes in this neighborhood by month for the last 24 months. When average sale price is greater than average list price, this may suggest a buyer's market. When average sale price is lower than the average list price this may suggest a seller's market.
The graph below illustrates the average days on market for homes in this neighborhood. The yellow area may indicate a buyer's market, the green area may indicate a balanced market and the red area may indicate a seller's market.
Sales Representative, Century 21 People’s Choice Realty Inc., Brokerage
(647) 576 - 2100