


Century 21 People’s Choice Realty Inc., Brokerage
120 MATHESON BLVD E #103
MISSISSAUGA, Ontario
L4K 0A4

St. Thomas, SE, N5R 6A2
$439,000$000000
Listed by STREETCITY REALTY INC., BROKERAGE.
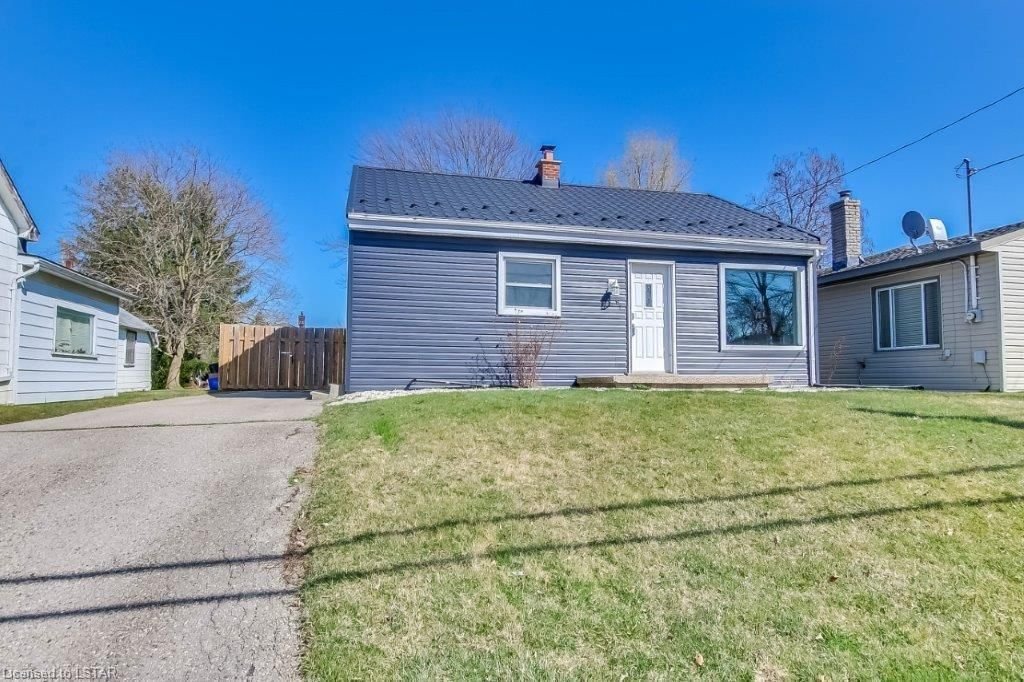
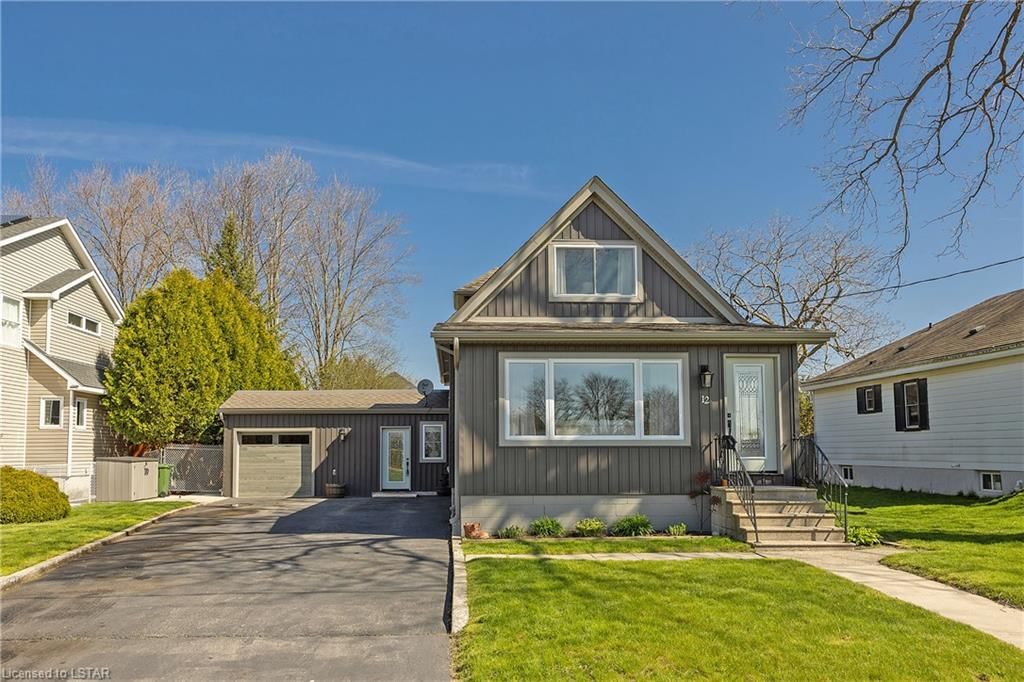
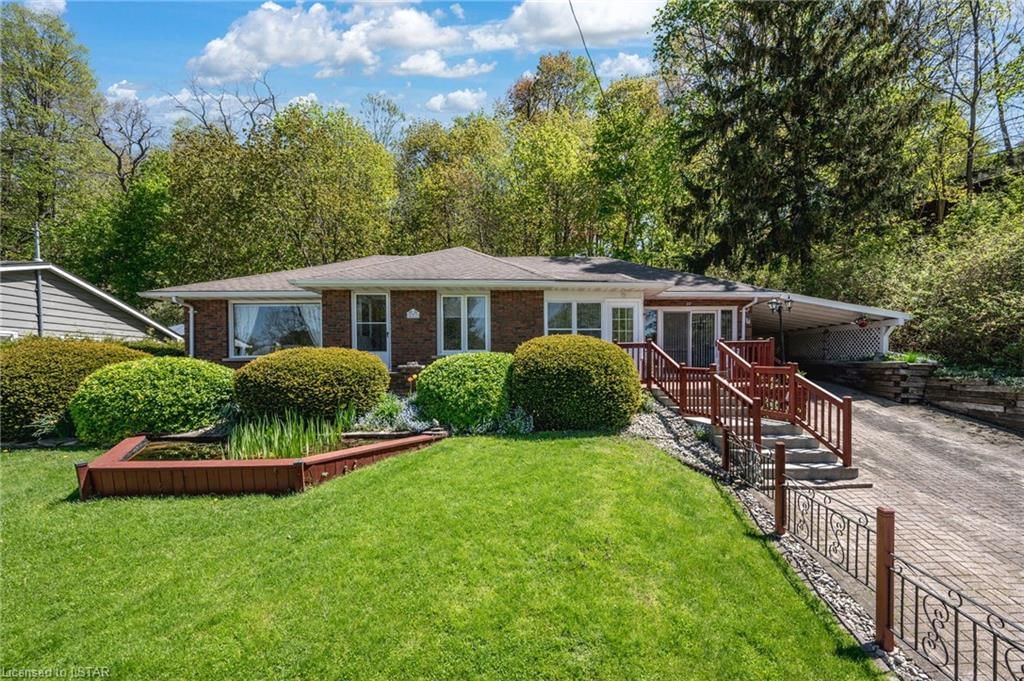
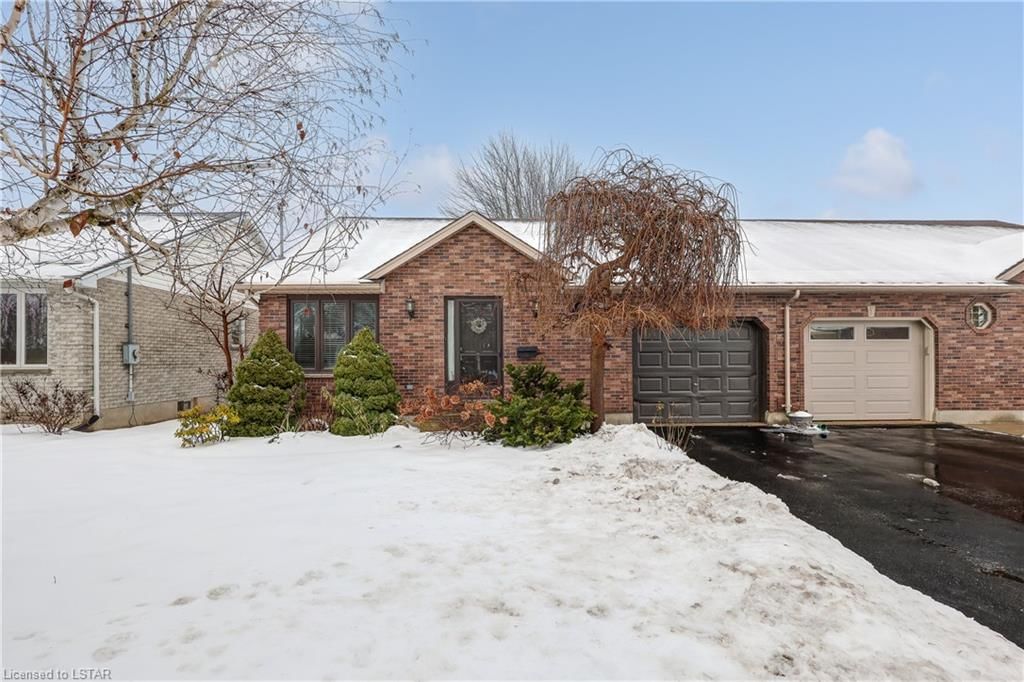
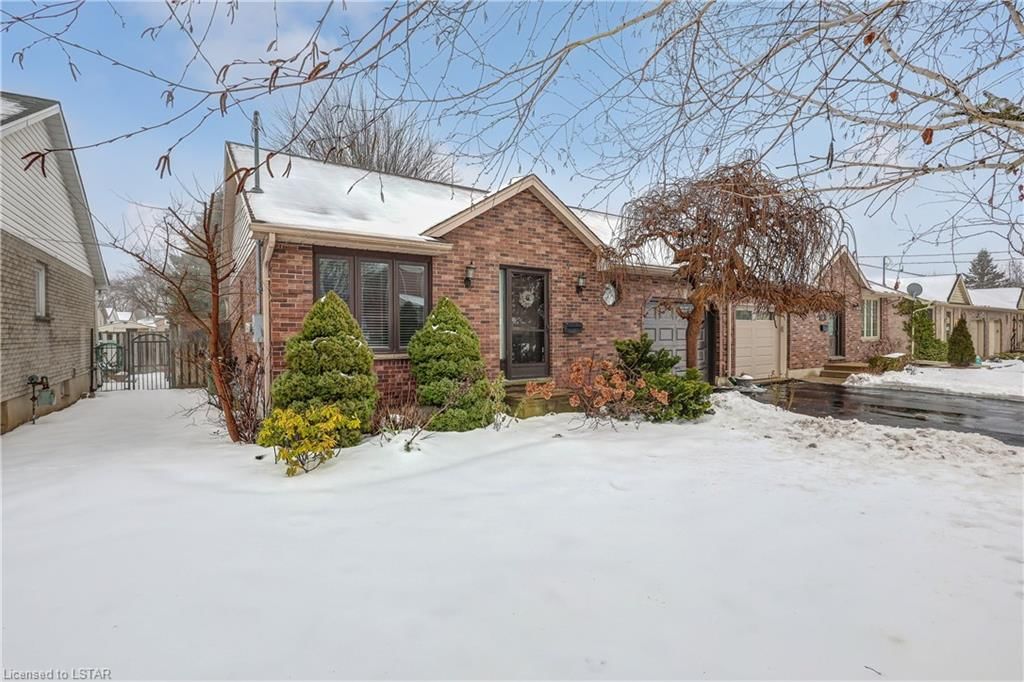
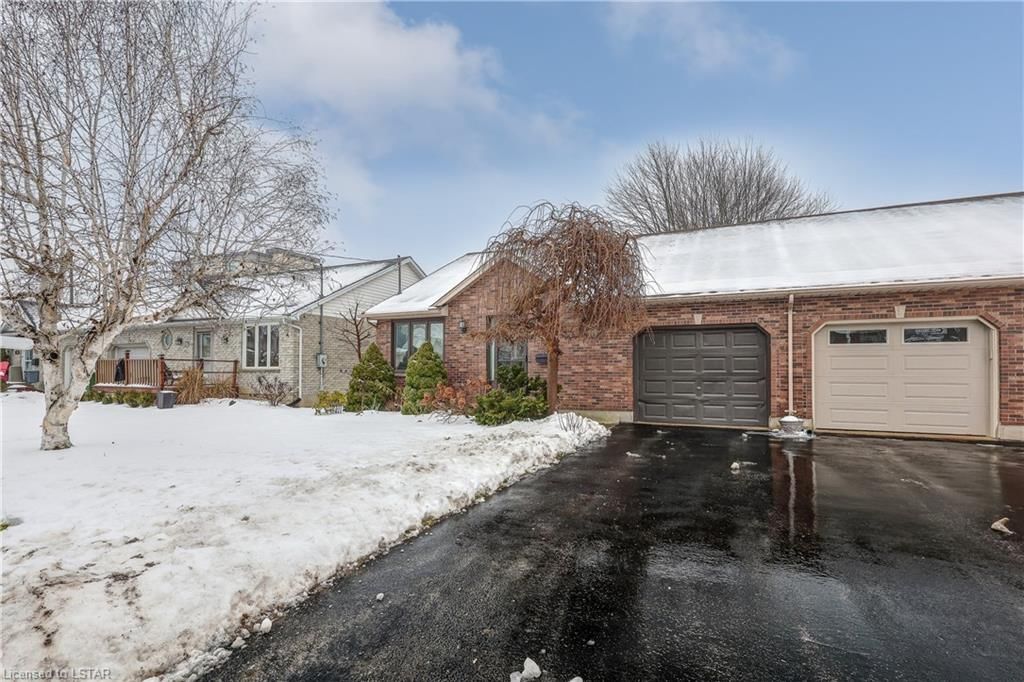
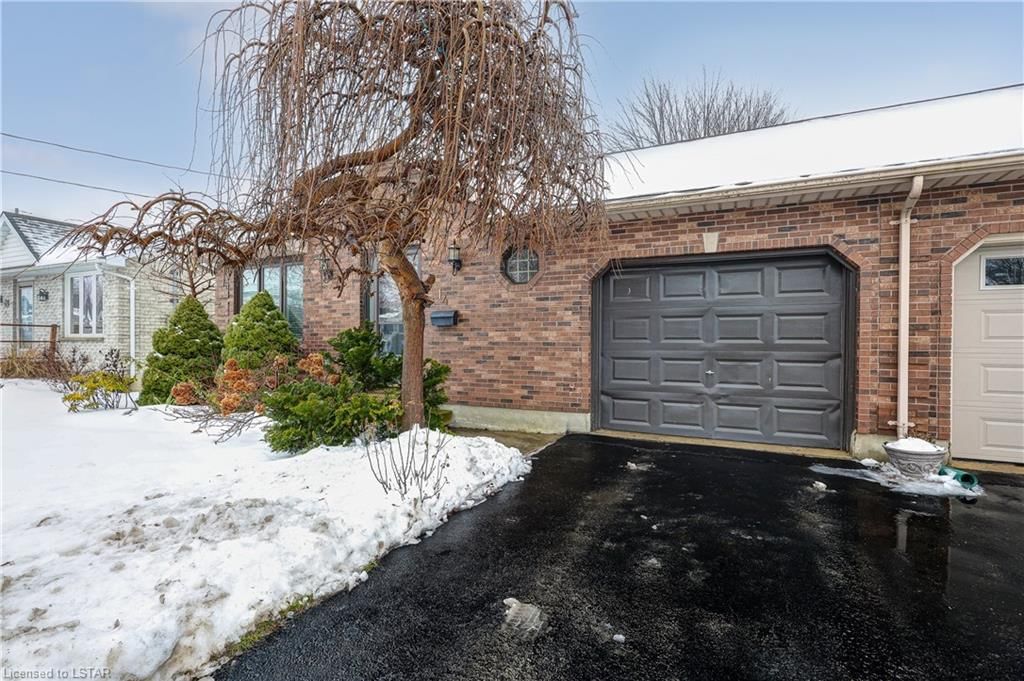
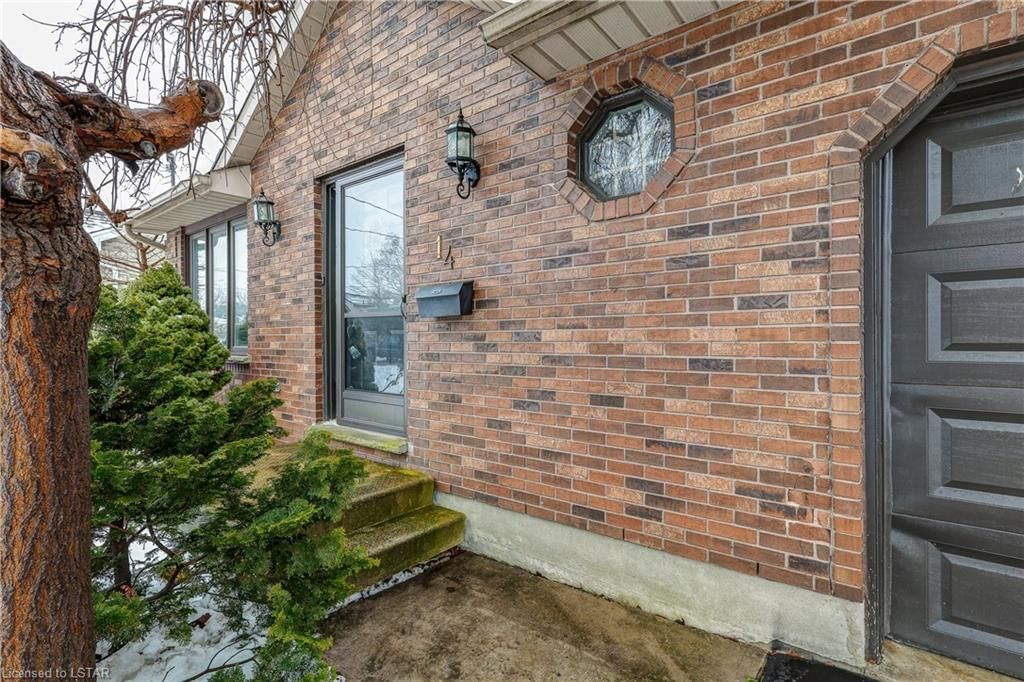
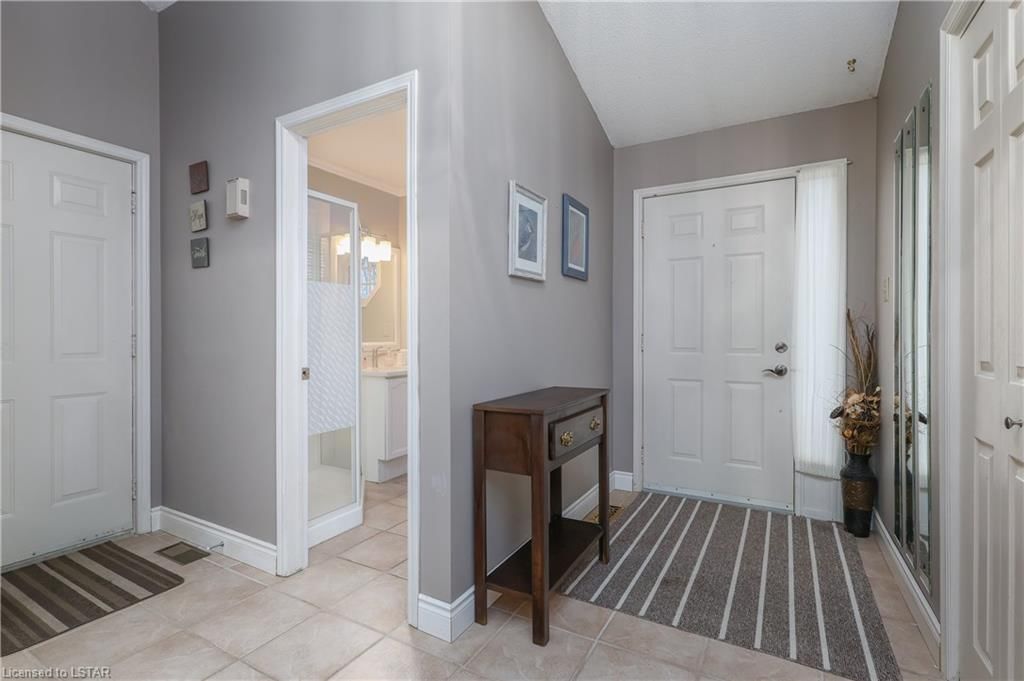
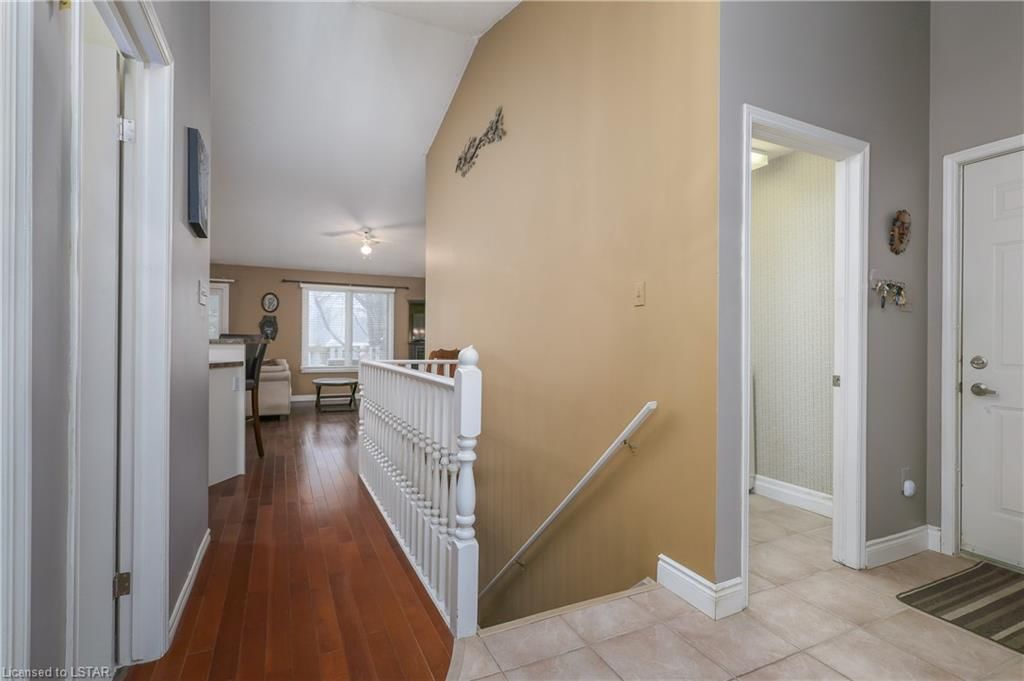
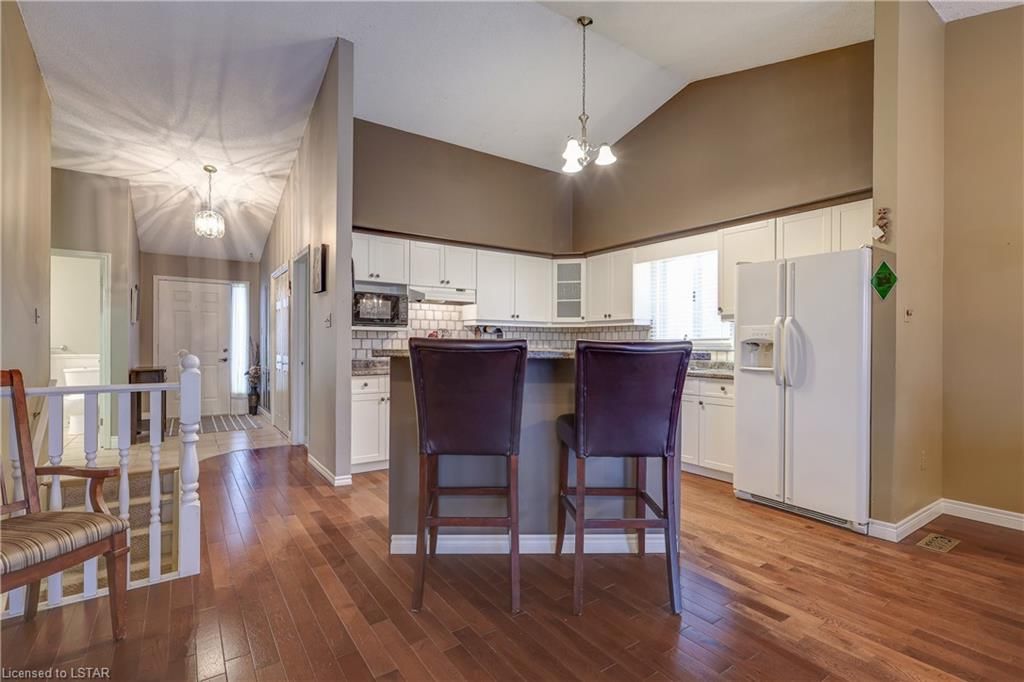
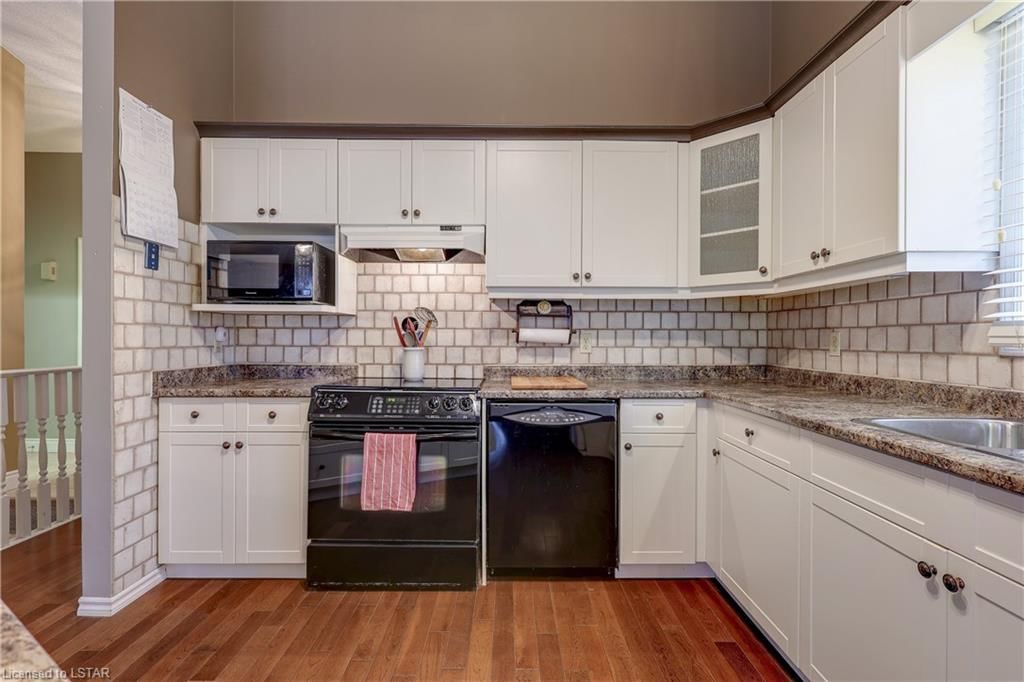
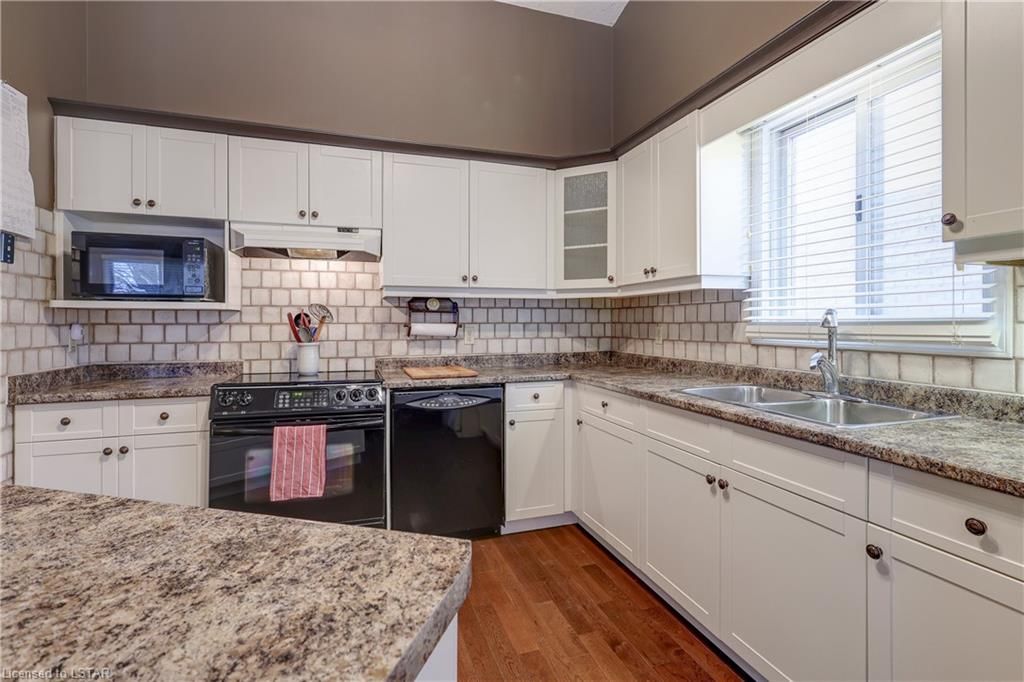
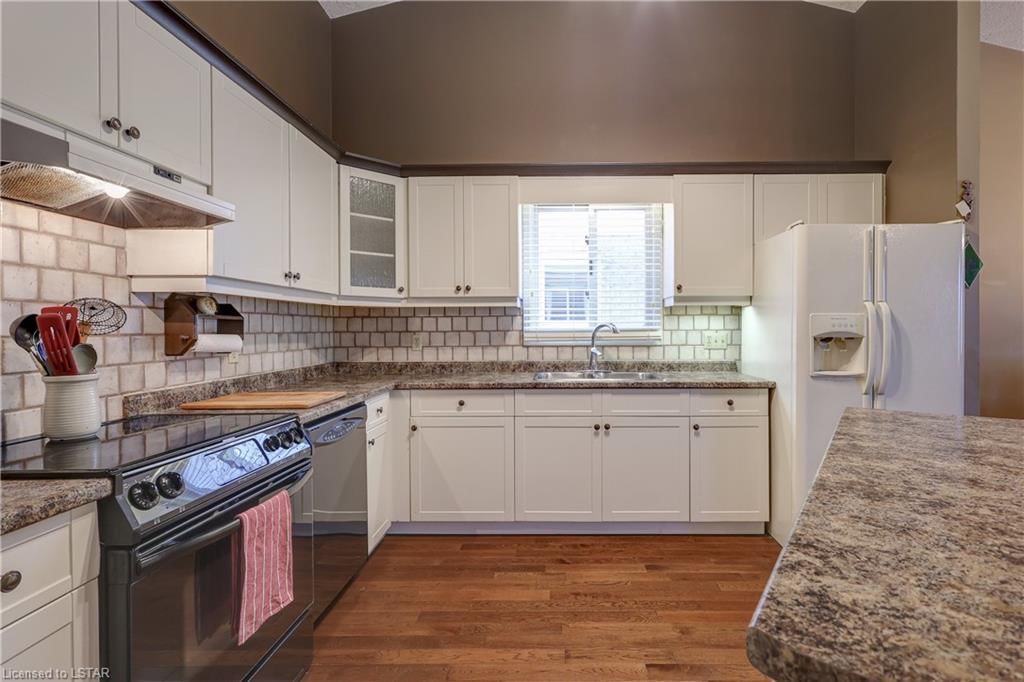
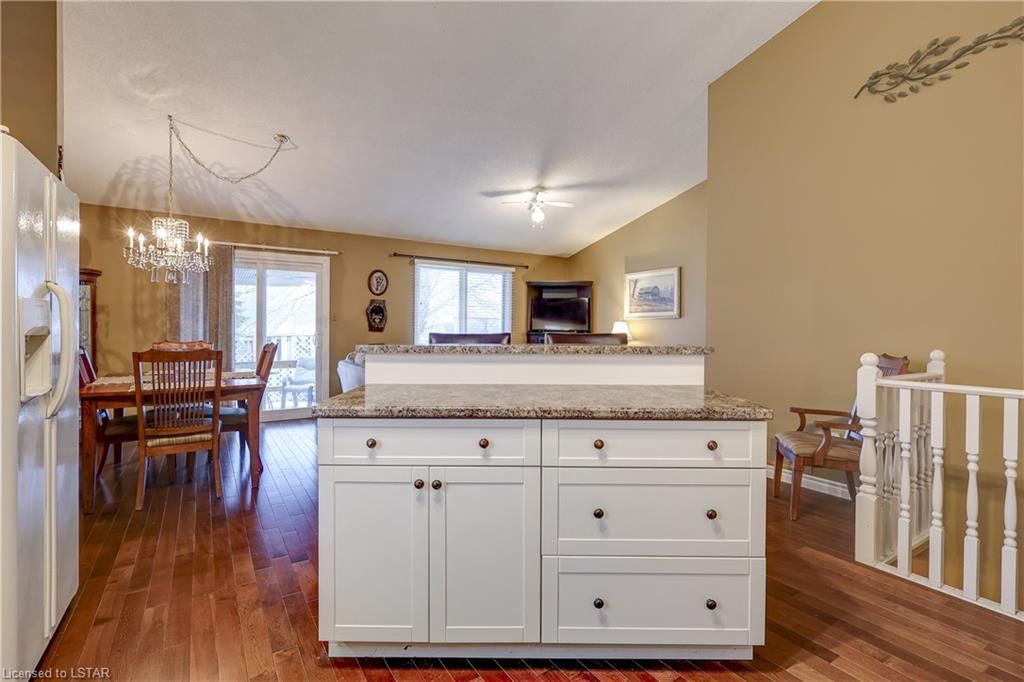
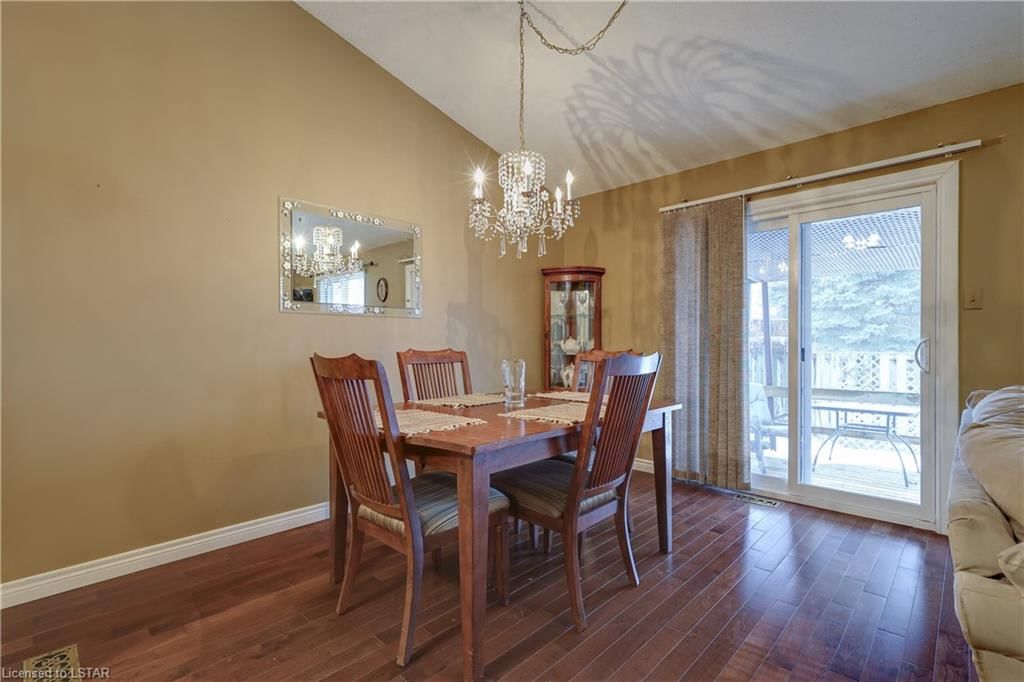
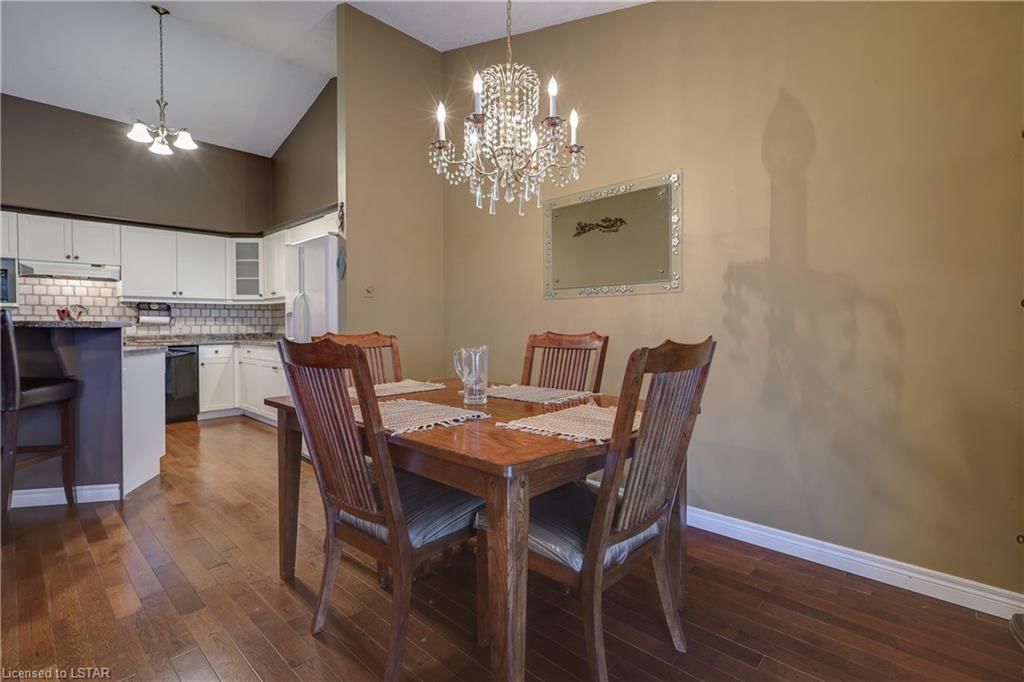
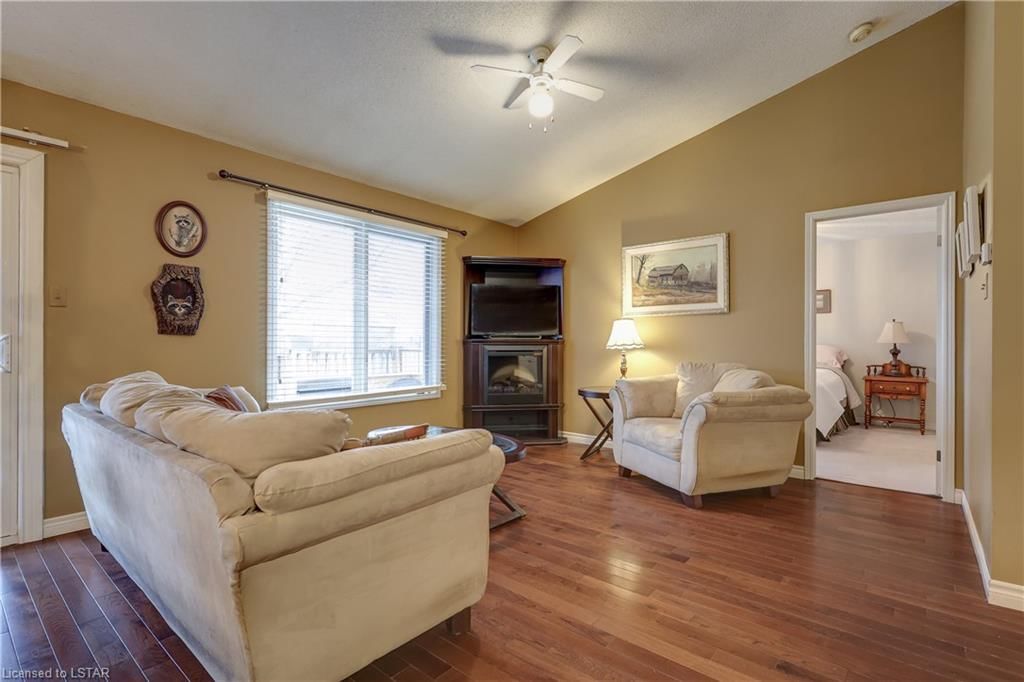
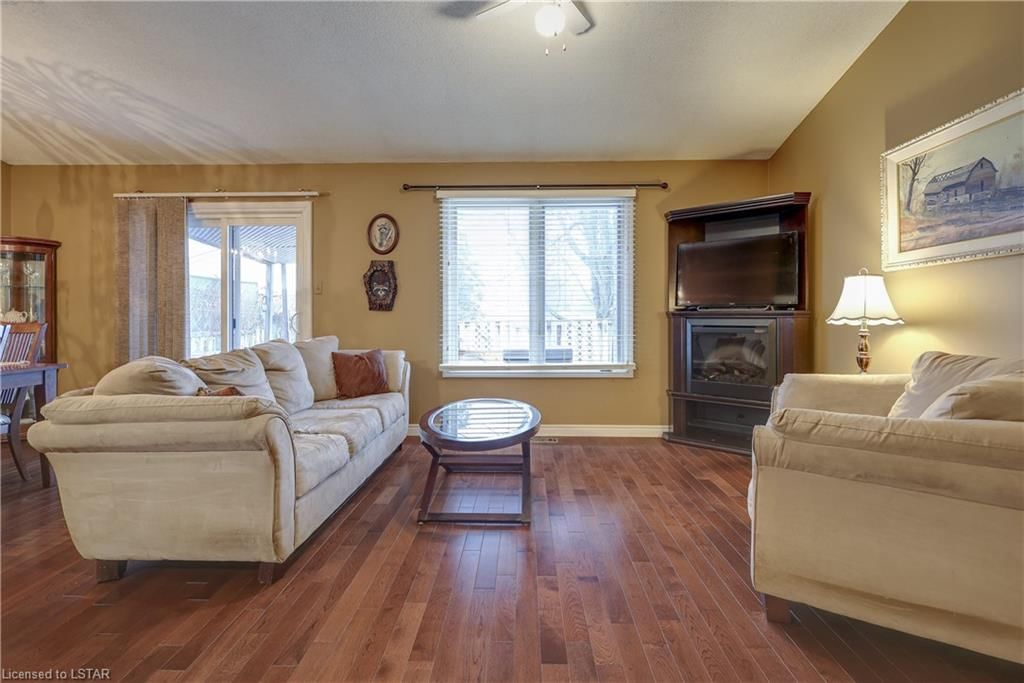
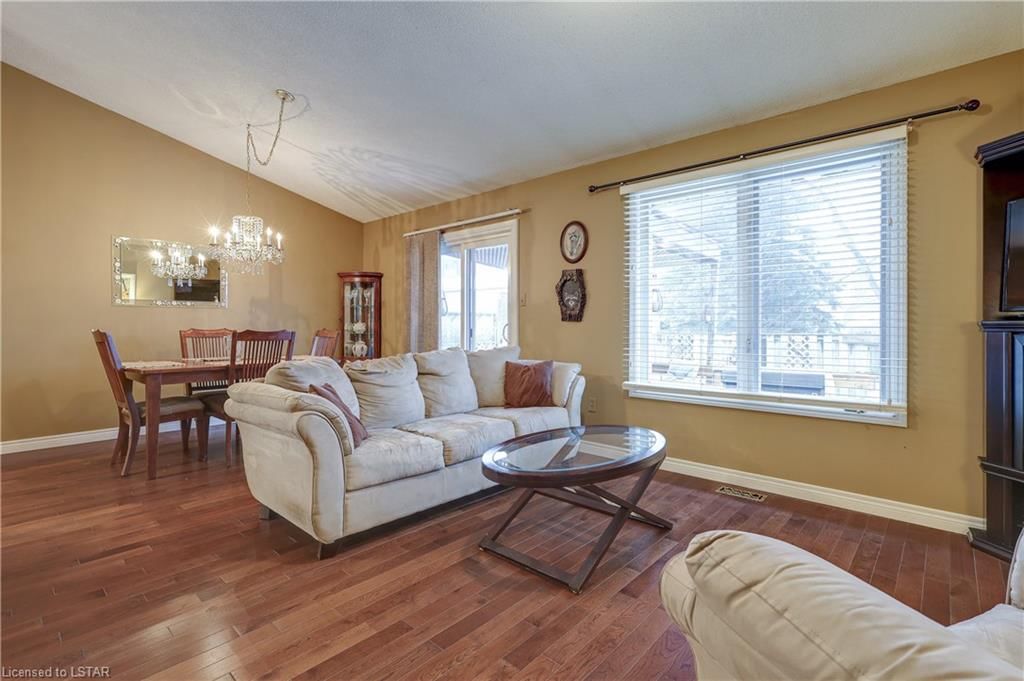
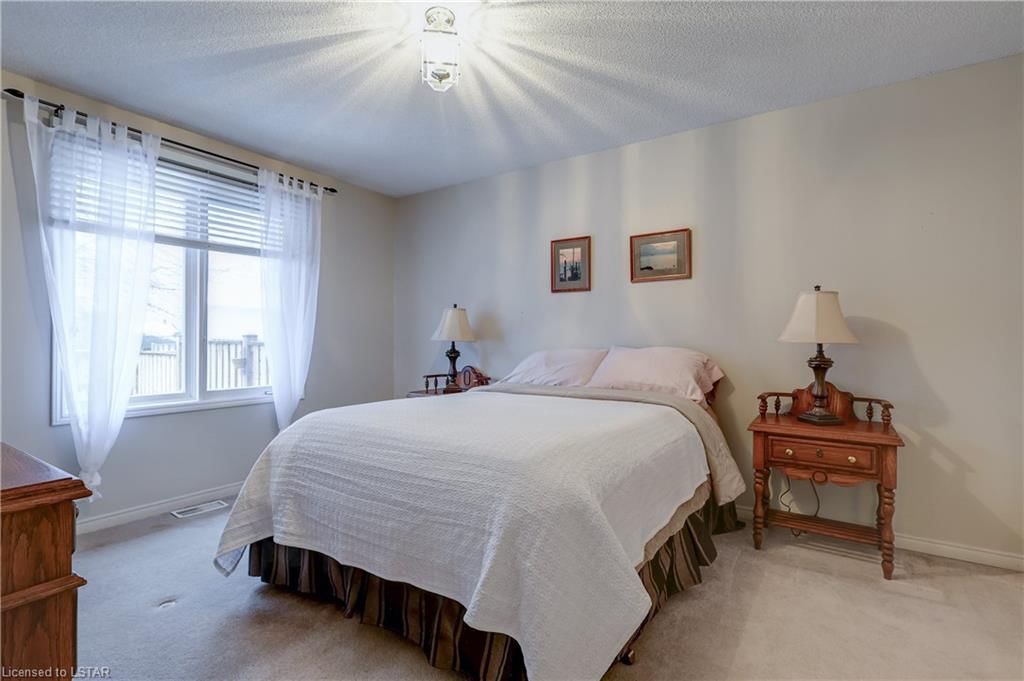
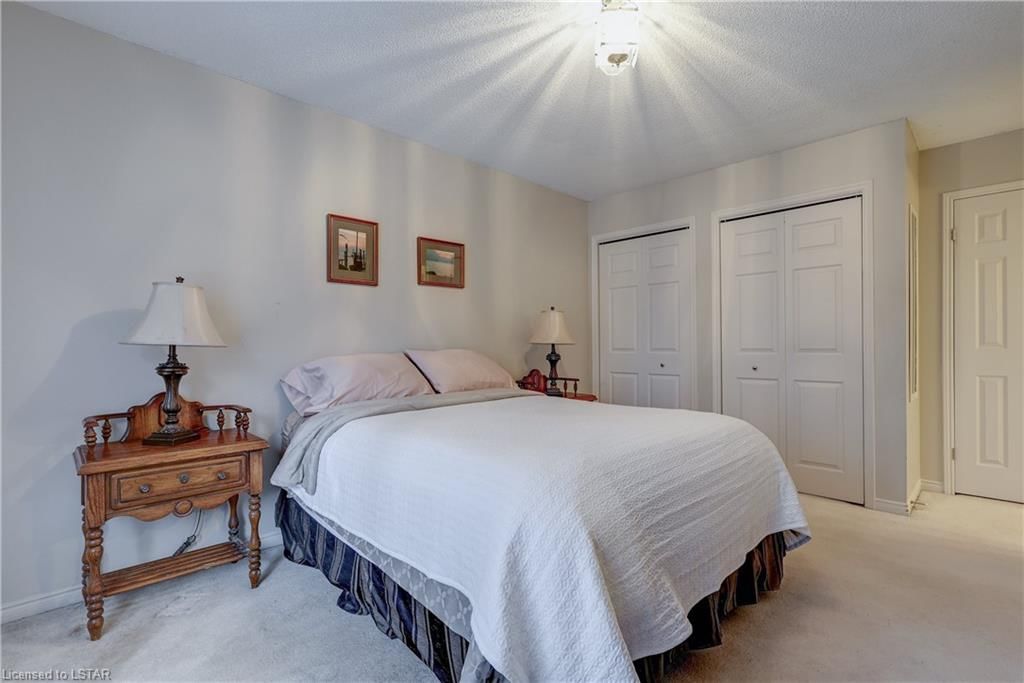
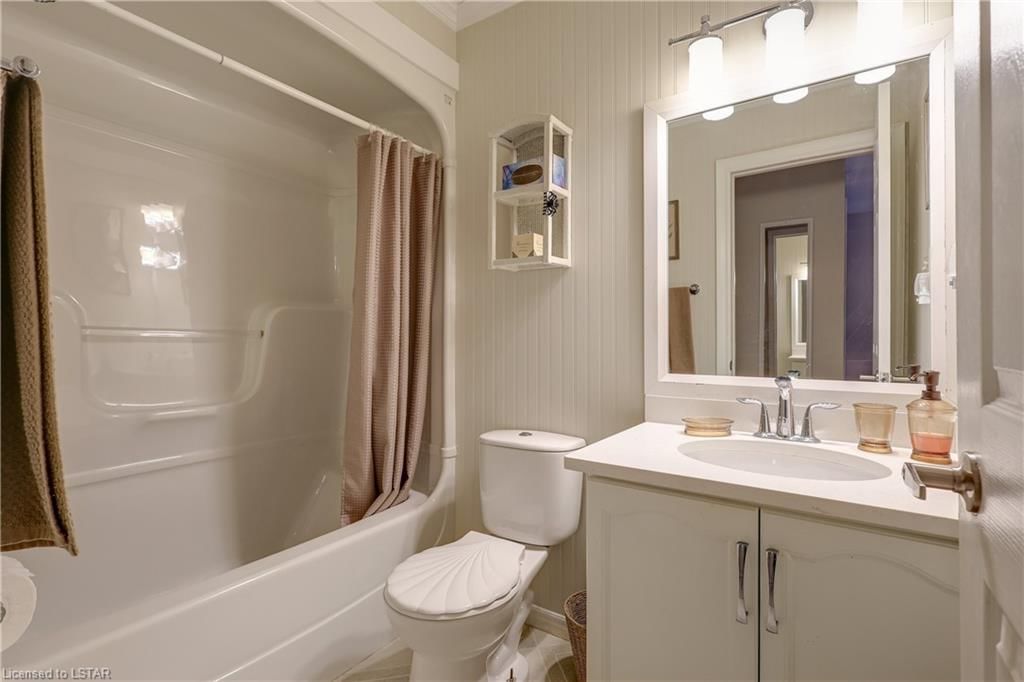
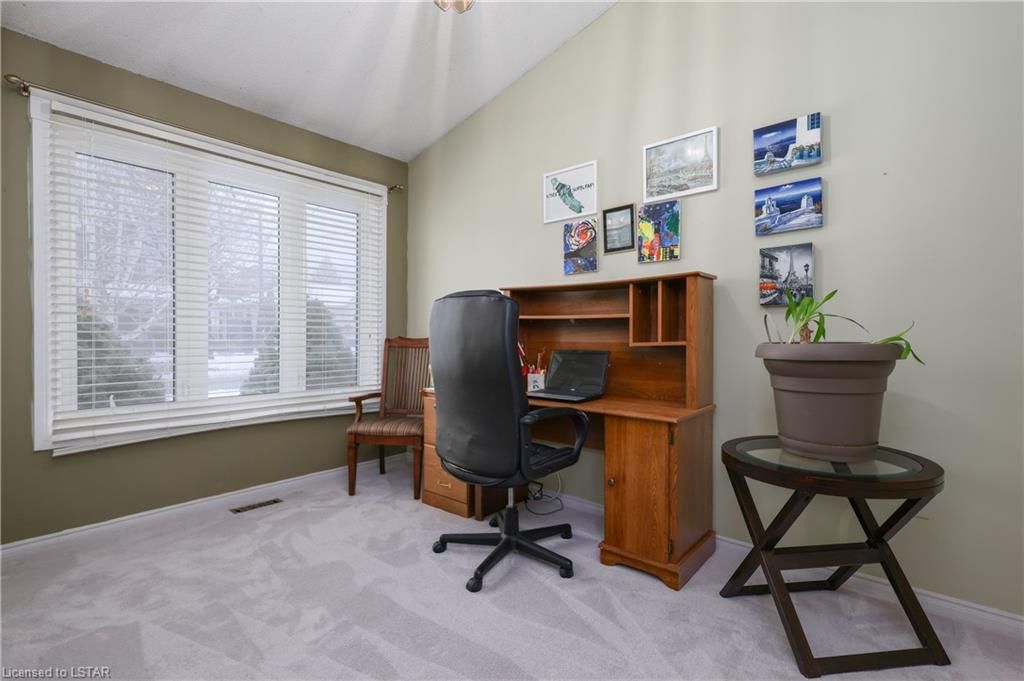
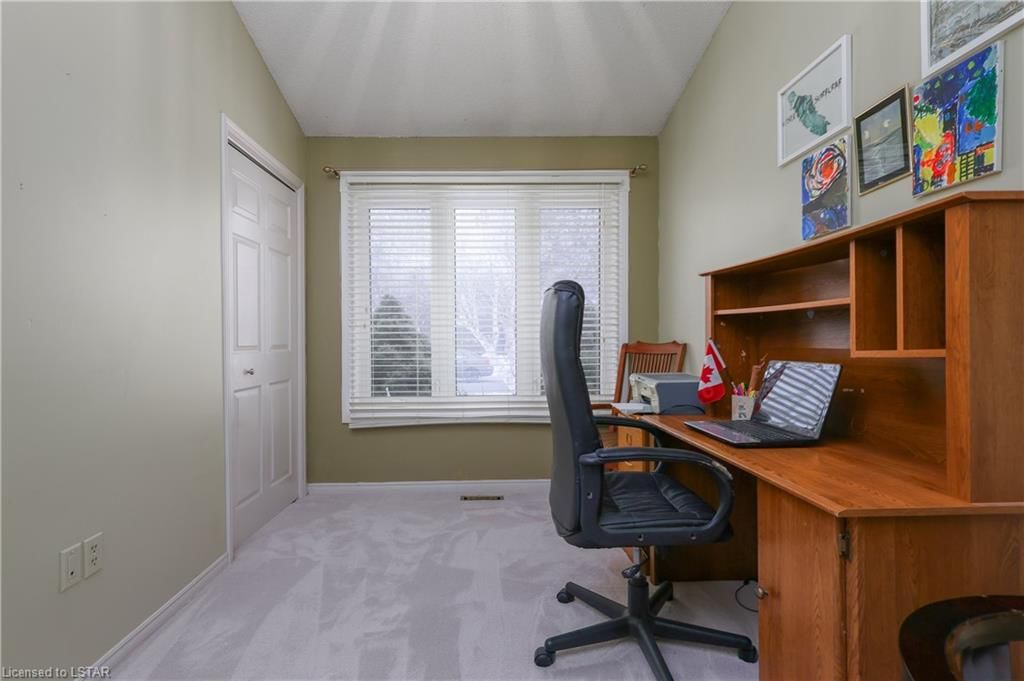
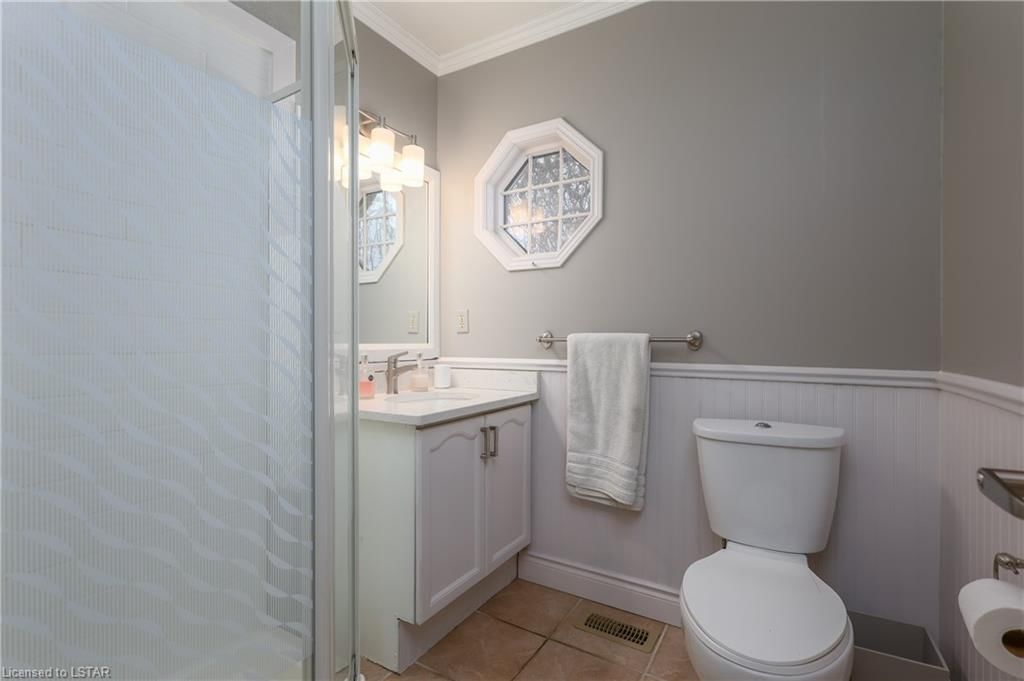
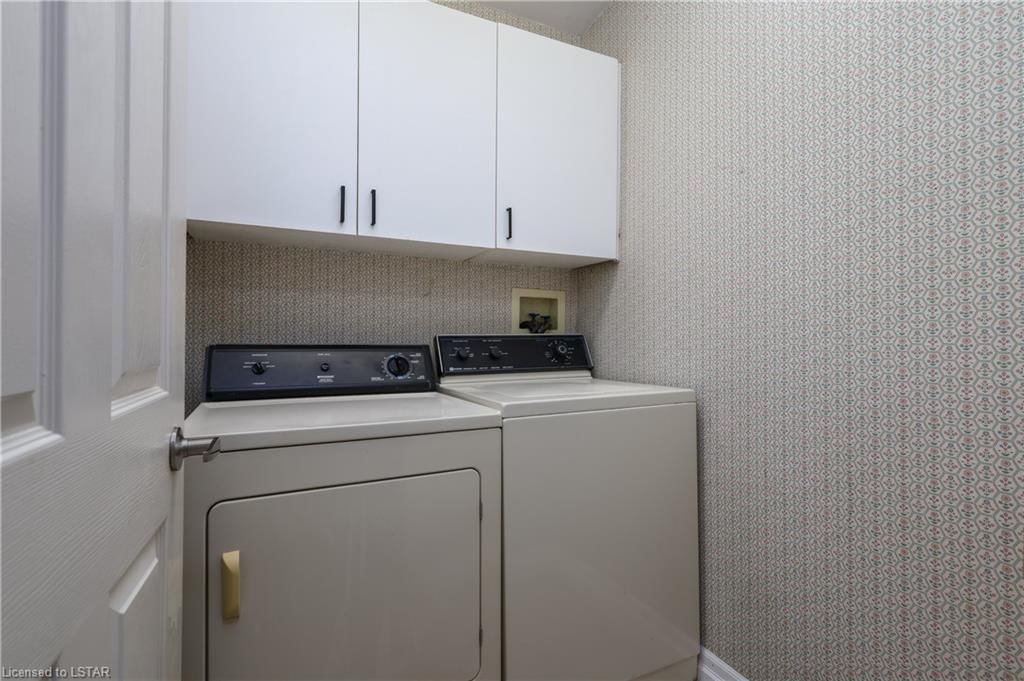
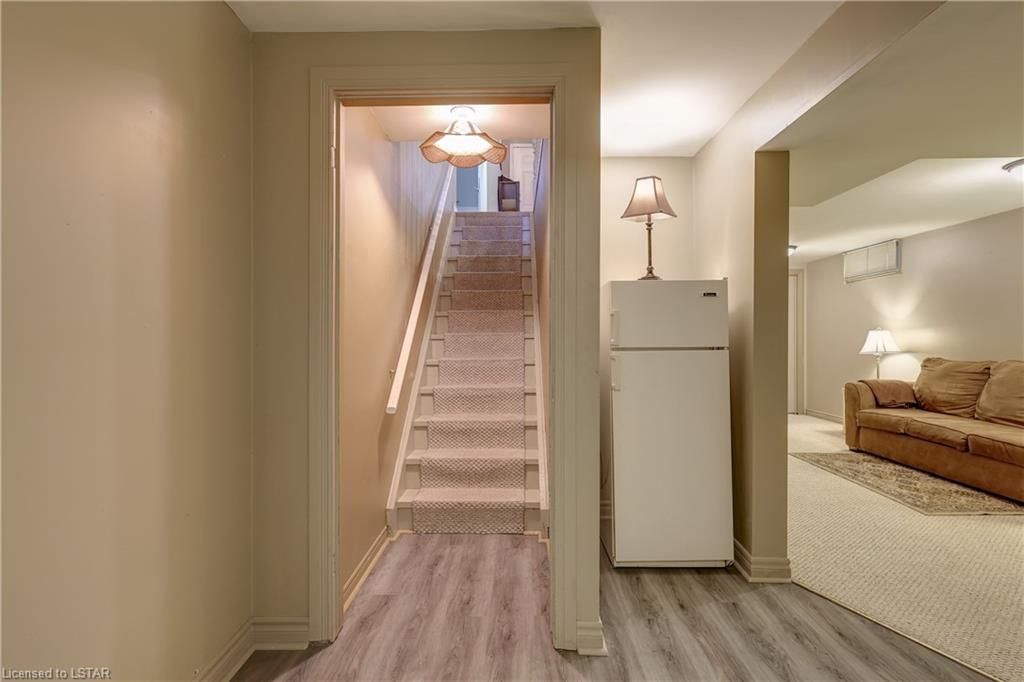
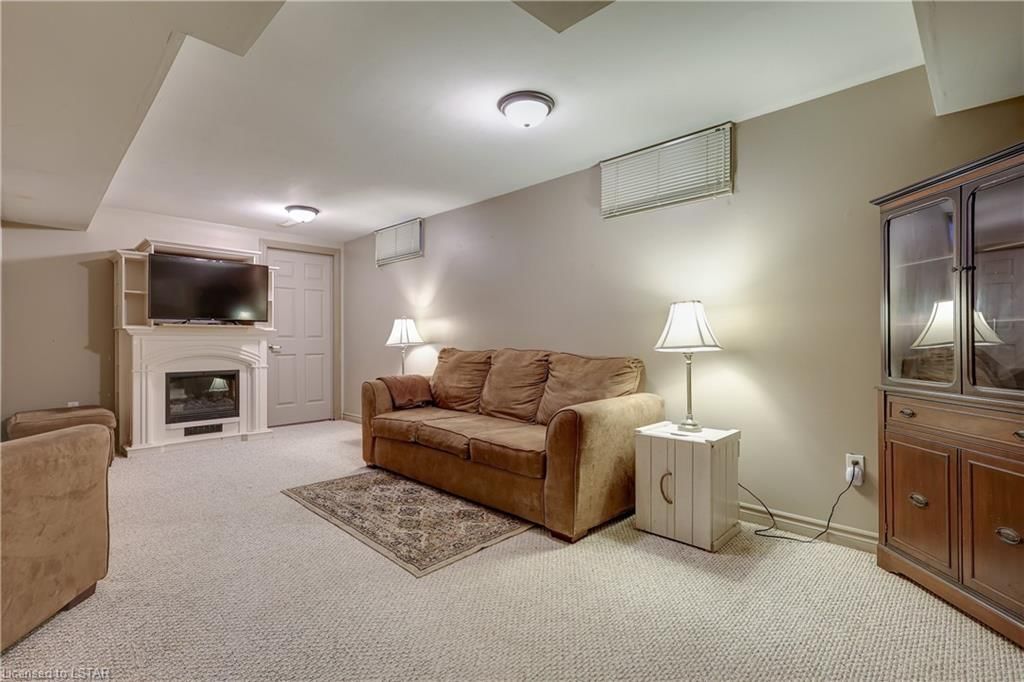
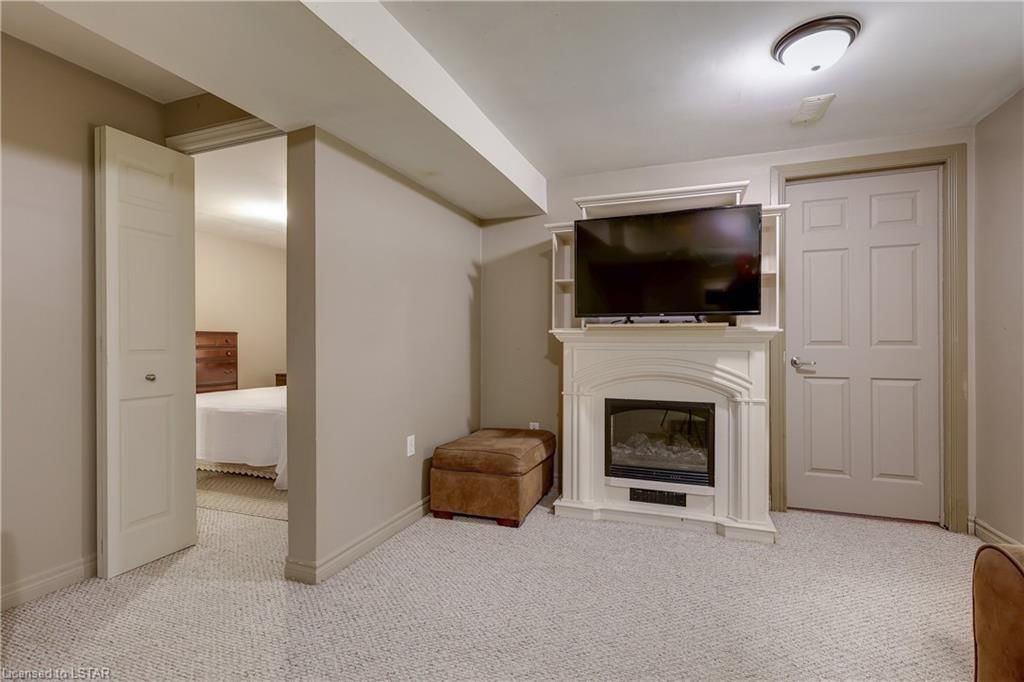
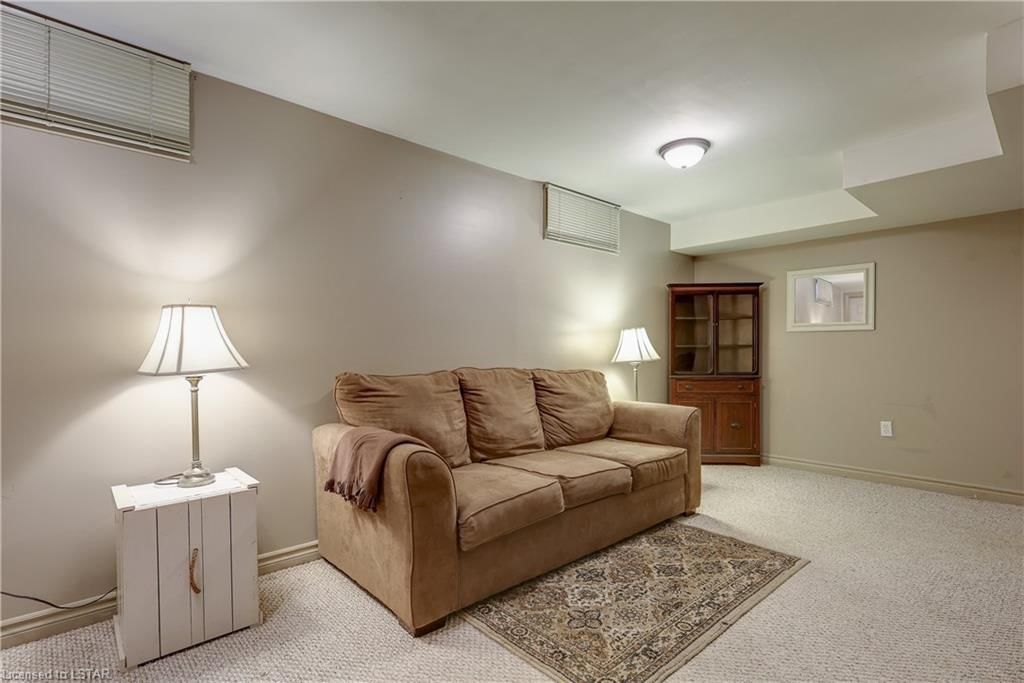
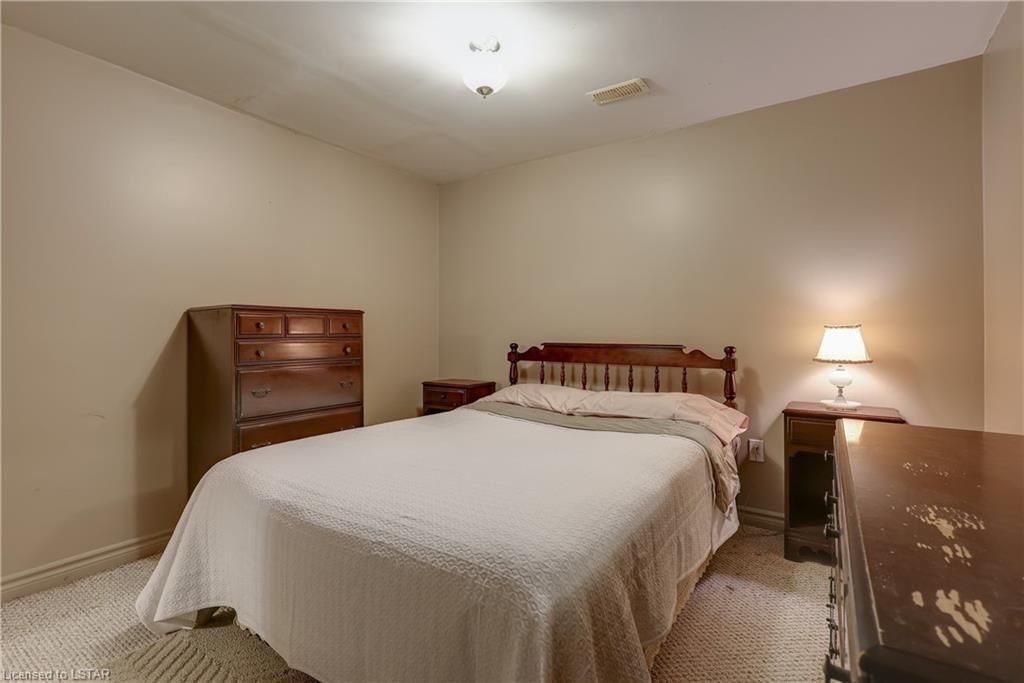
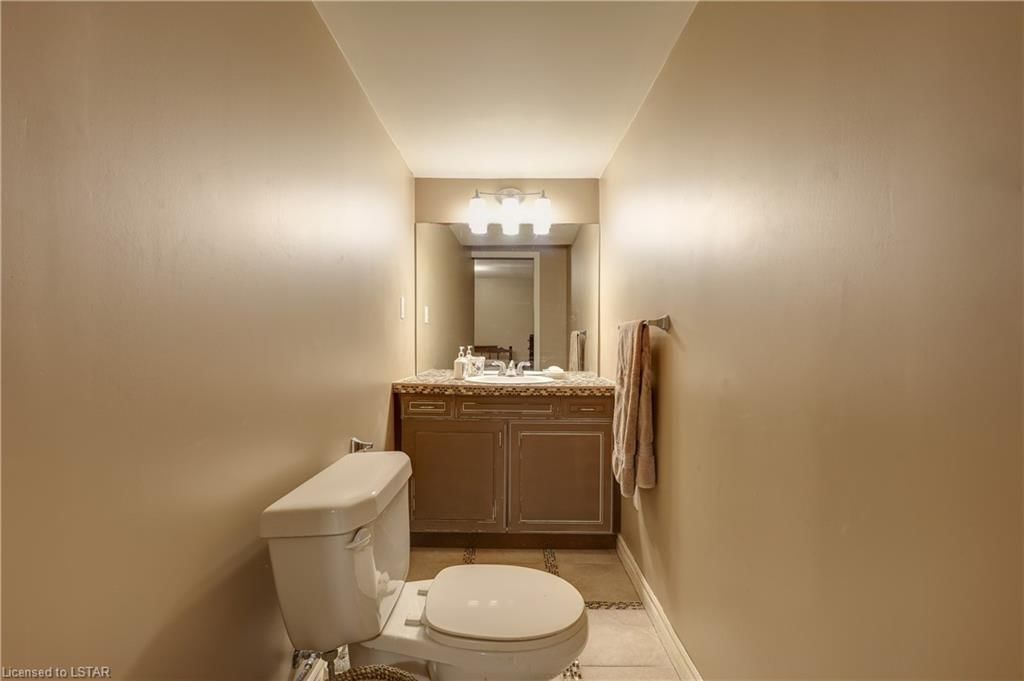
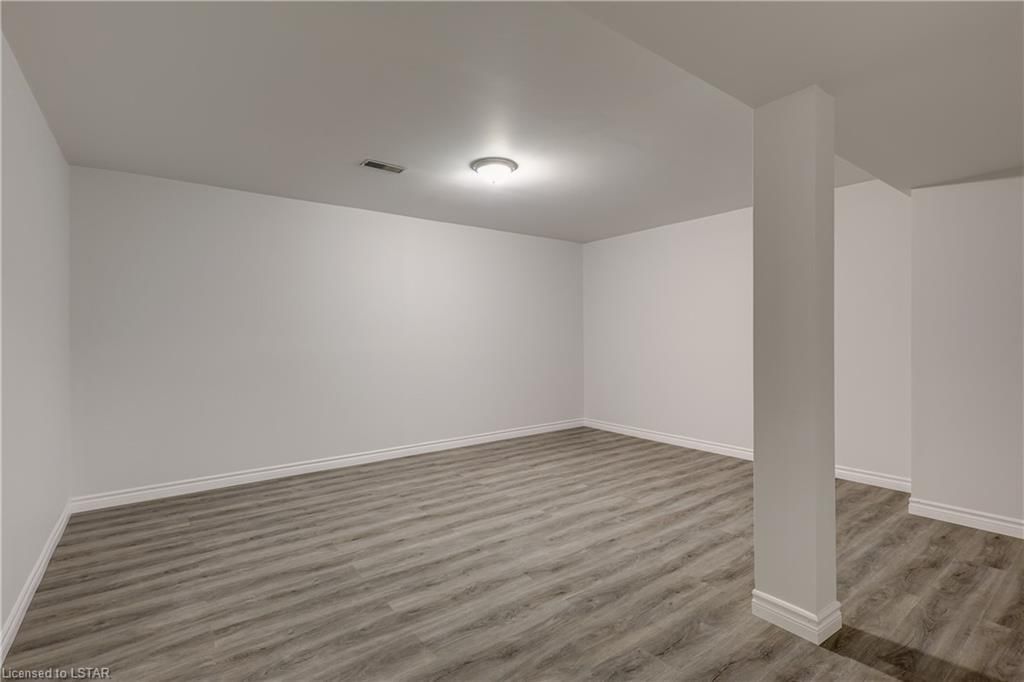
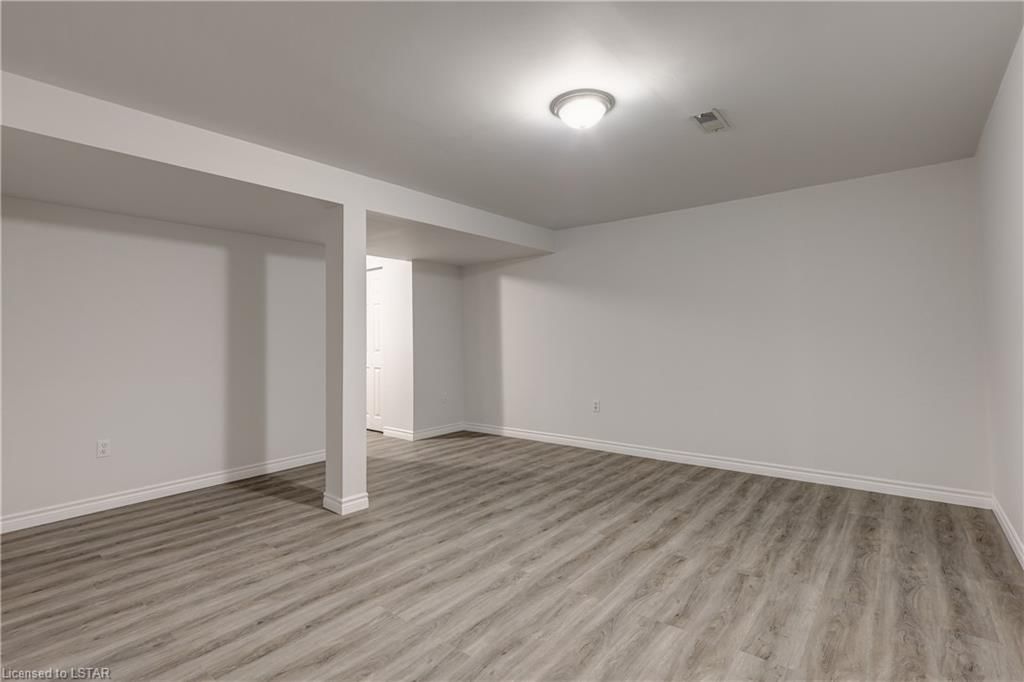
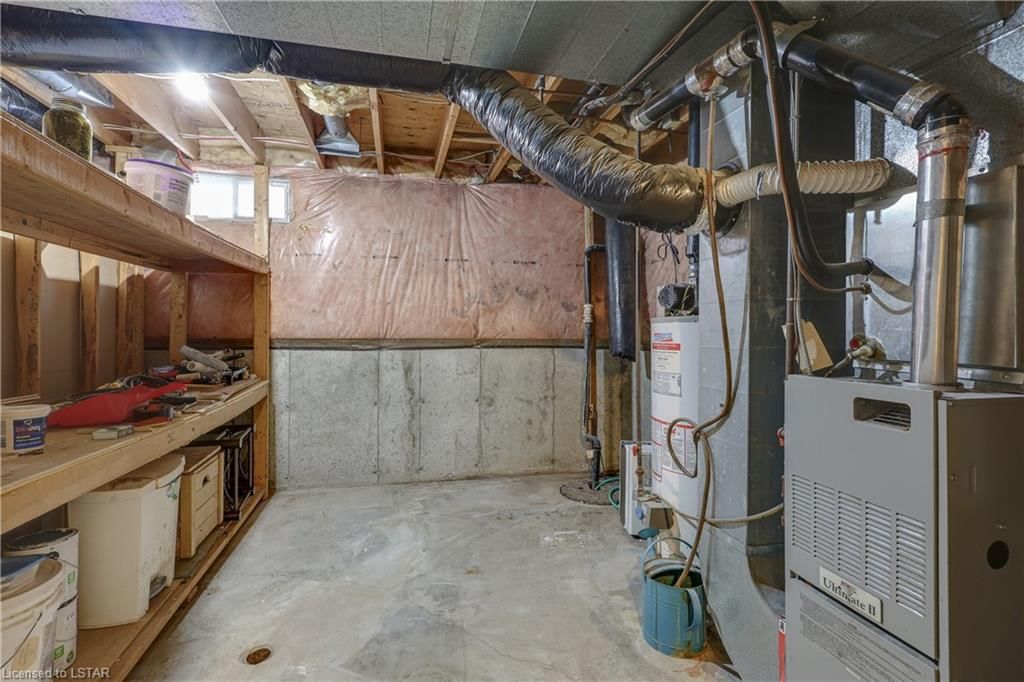
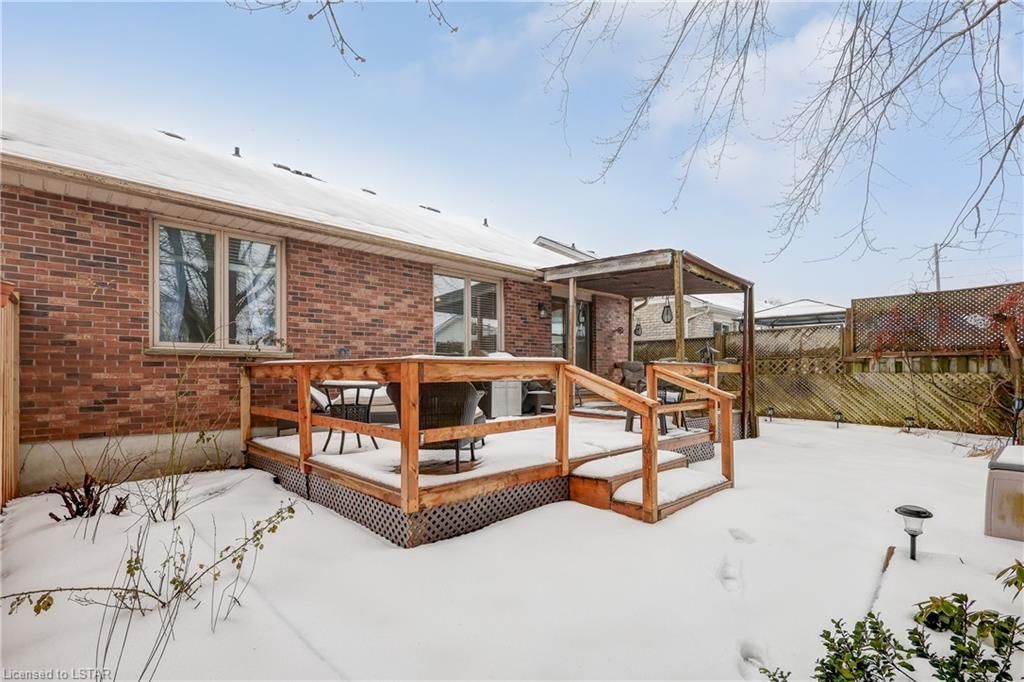
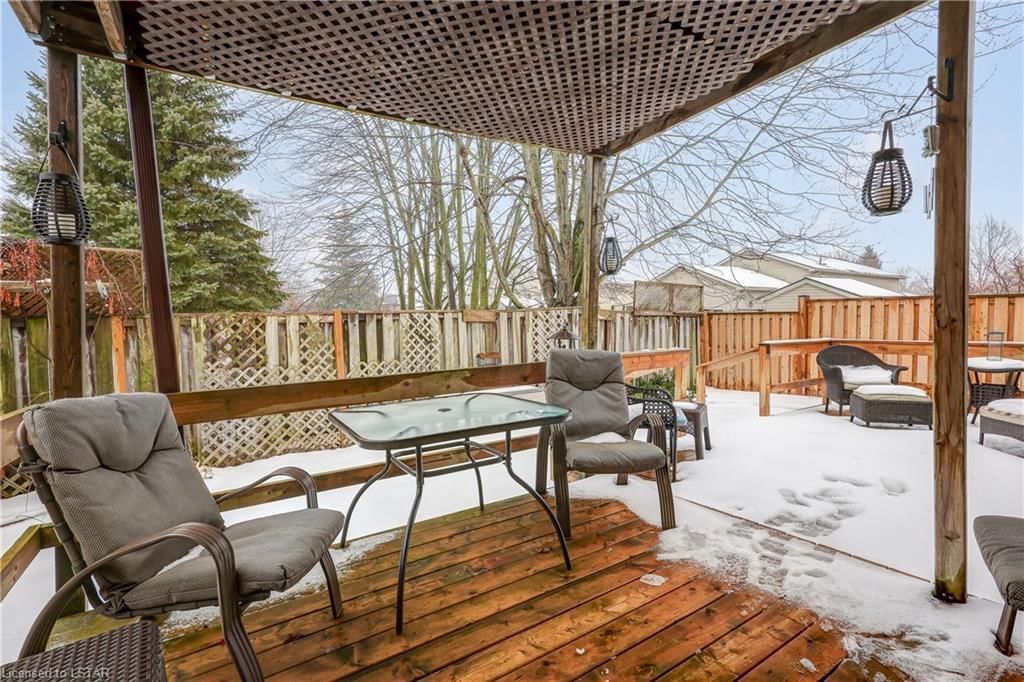
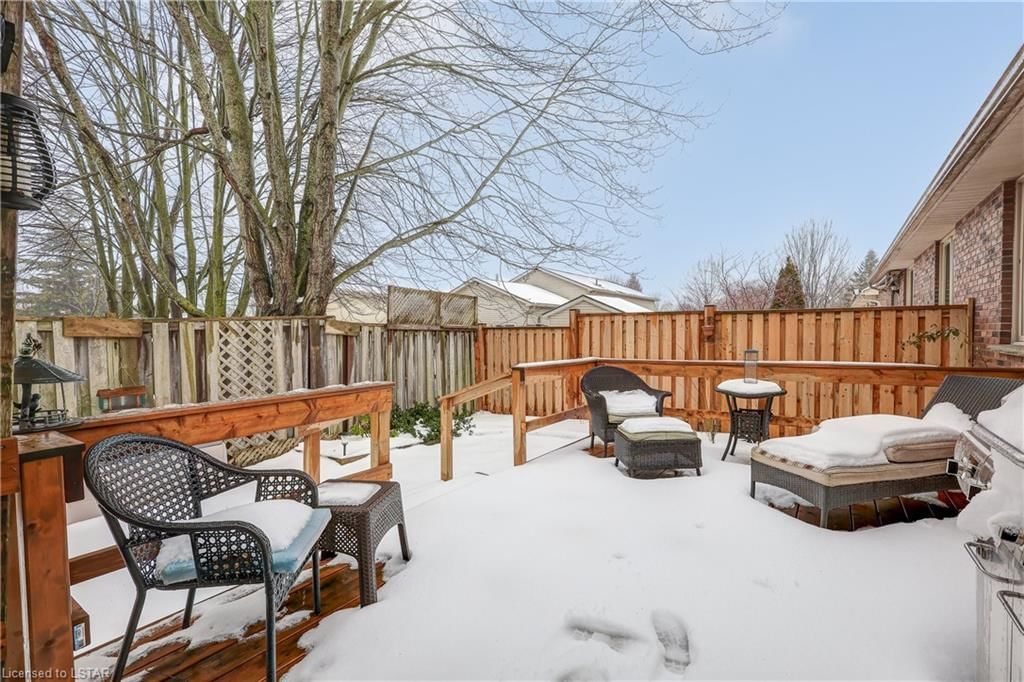
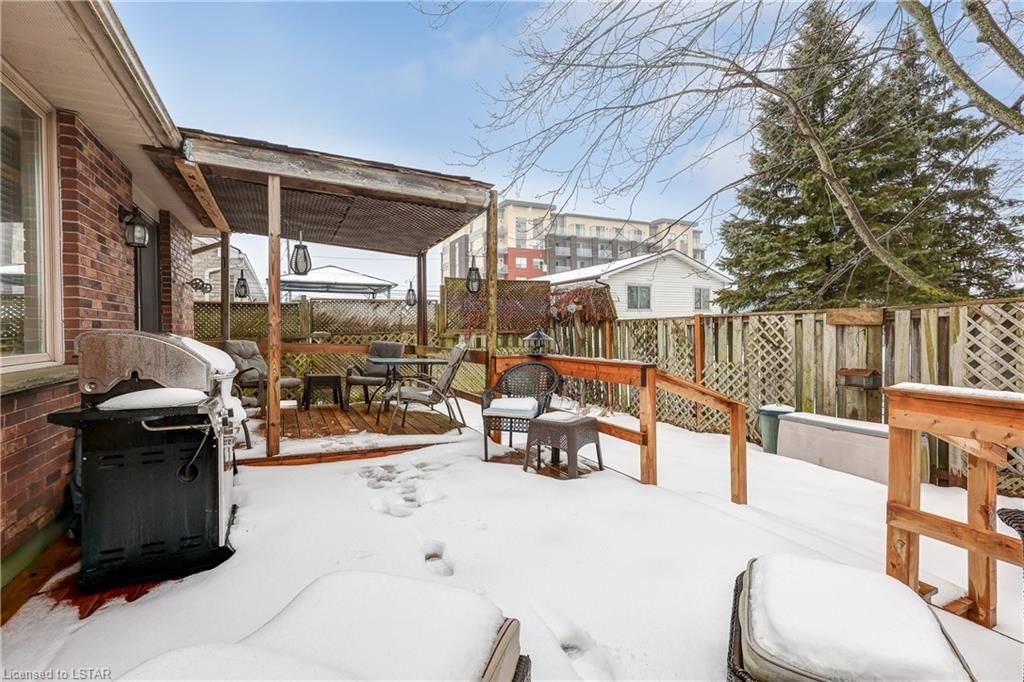
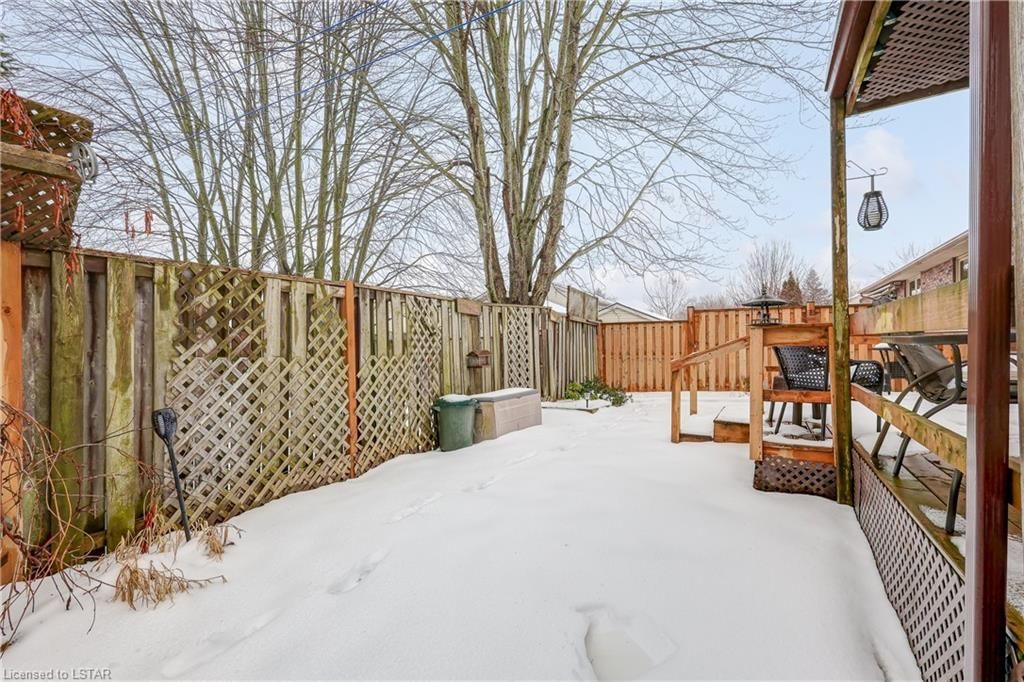
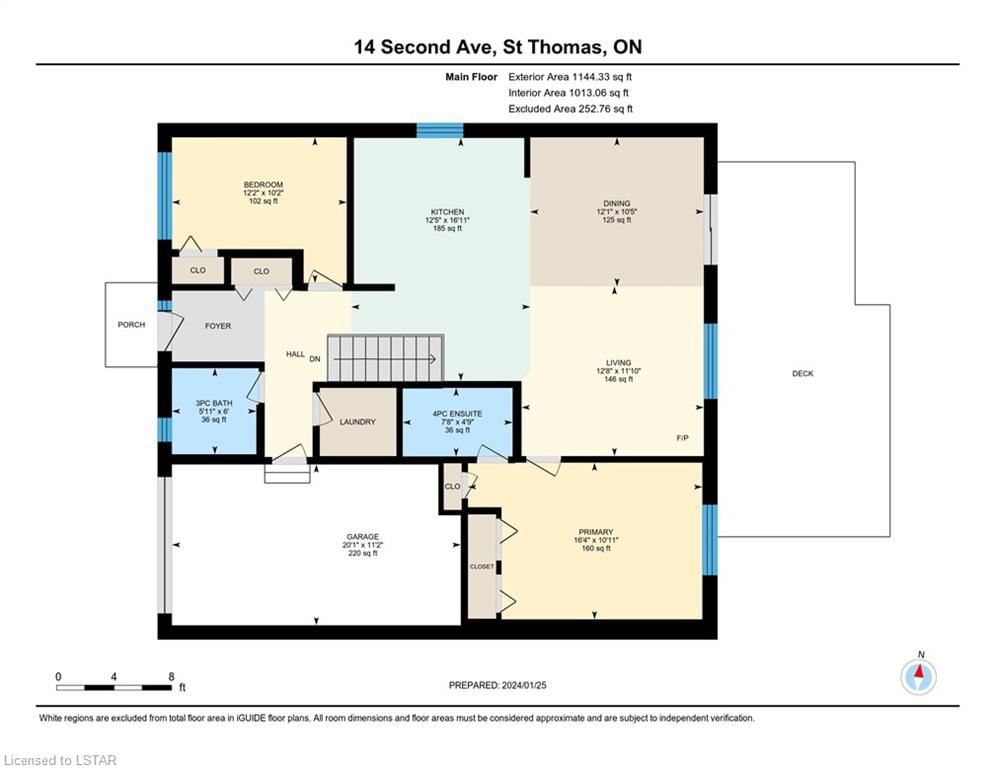
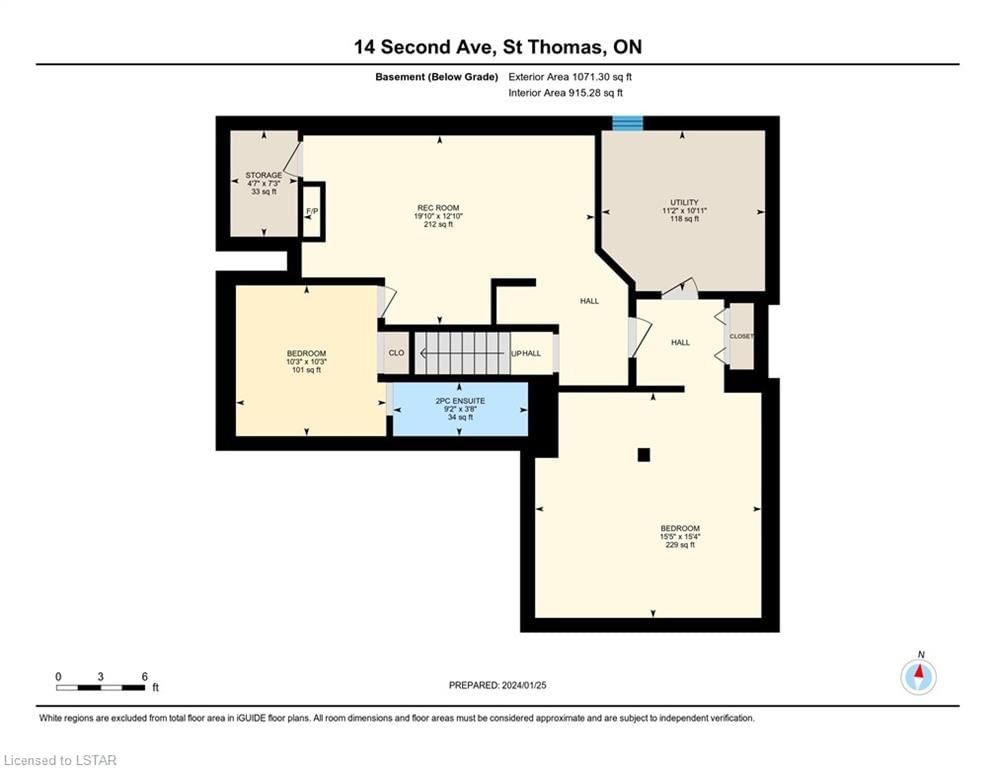
This incredible brick semi-detached bungalow has 2 bedrooms, 2.5 bathrooms and over 1800 sq feet of finished living space. Its an amazing alternative to condo living with everything you could need on the main floor but could also make for an awesome family home with 2 "other" rooms in the basement that could make for a 3rd and 4th bedroom. The main floor features an open concept kitchen/living room/ dining room with stunning hardwood floors and vaulted ceilings. There's patio doors off the dining room to a partially covered deck and fully fenced in backyard with enough greenspace for the pets and kids to play. The primary suite (14.4x 11) has a 4 piece ensuite and ample closet space. The second bedroom on the main floor is currently being used as an office. There is an additional 3 piece bathroom and laundry room also on the main floor and direct access to the single car garage. The lower level is totally finished with generous family room with a fireplace and is an excellent spot to watch the game or watch a movie with the kids. The recently finished bonus room is available to use an office, playroom, work shop or work out room. The "other" room in the lower level has been used as a bedroom and has a 2 piece bathroom attached. Don't miss out on your opportunity to own this incredible home, at a great price in the ideal south side location in St. Thomas. Walking distance to shopping, schools, parks and Churches.
Dishwasher,Dryer,Refrigerator,Stove,Washer
Copyright 2025 Information Technology Systems Ontario, Inc. The information provided herein must only be used by consumers that have a bona fide interest in the purchase, sale, or lease of real estate and may not be used for any commercial purpose or any other purpose.
Living Room
Dining Room
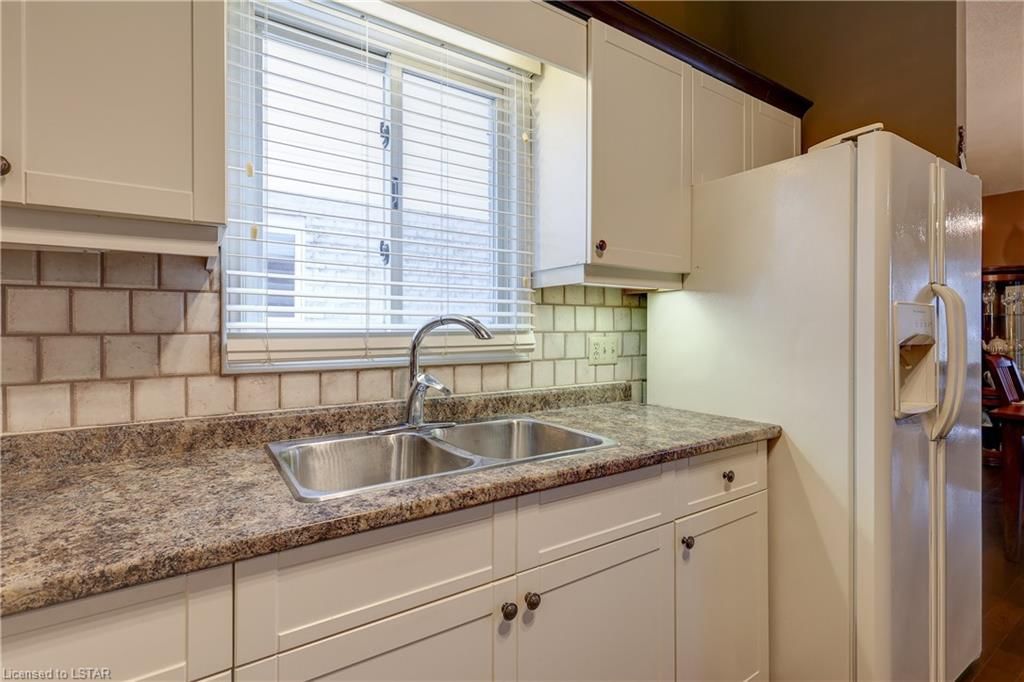
Kitchen
Bedroom
Laundry
Bedroom Primary
Family Room
Other
Other
The graph below compares the average list price and average sale price of homes in this neighborhood by month for the last 24 months. When average sale price is greater than average list price, this may suggest a buyer's market. When average sale price is lower than the average list price this may suggest a seller's market.
The graph below illustrates the average days on market for homes in this neighborhood. The yellow area may indicate a buyer's market, the green area may indicate a balanced market and the red area may indicate a seller's market.
Sales Representative, Century 21 People’s Choice Realty Inc., Brokerage
(647) 576 - 2100