


Re/max Premier Inc., Brokerage
9100 Jane St
Concord, ON
L4K 0A4


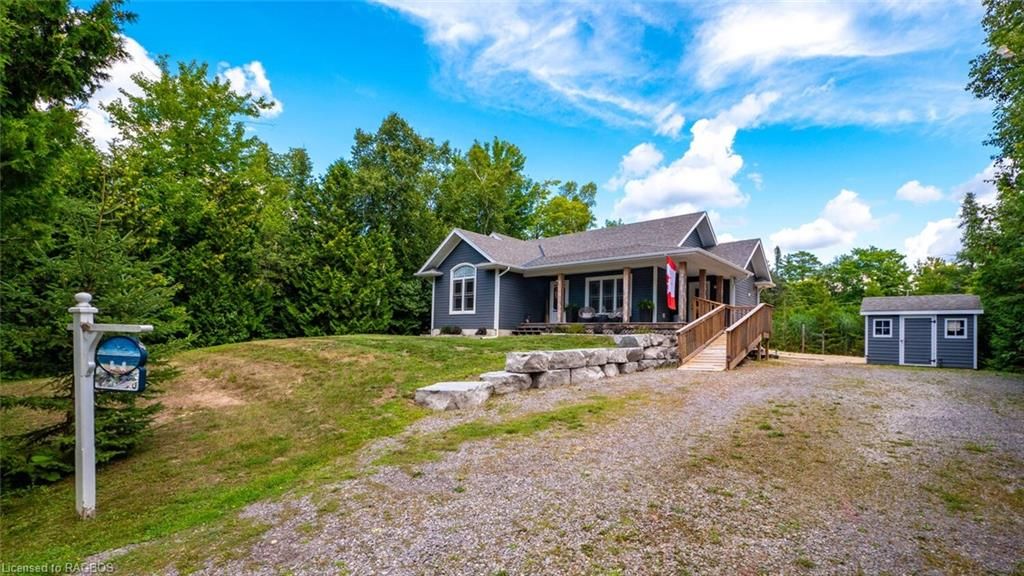
Sauble Beach, South Bruce Peninsula, N0H 2G0
$799,900$000000
Listed by RE/MAX GREY BRUCE REALTY INC Brokerage (S.B.).
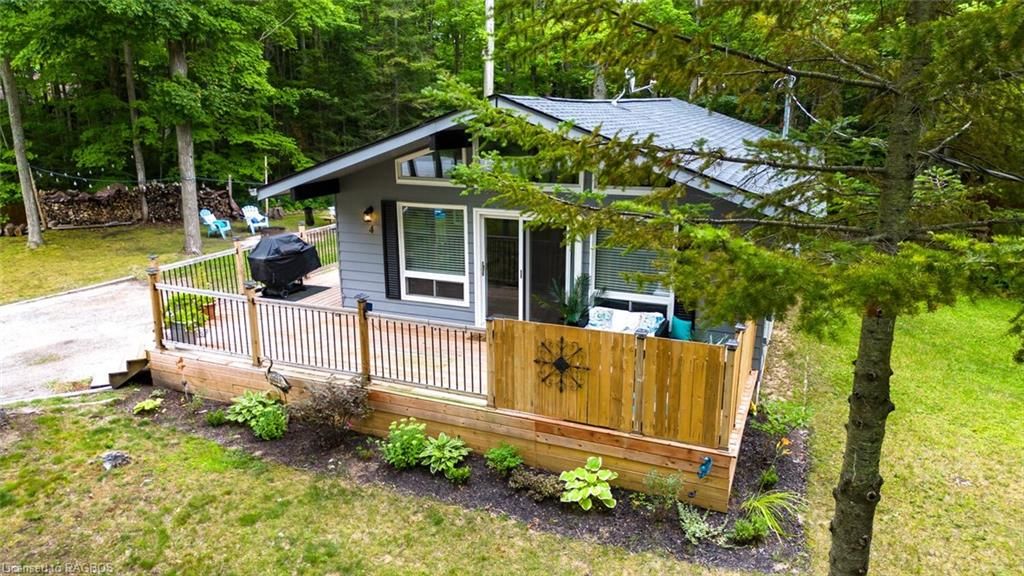
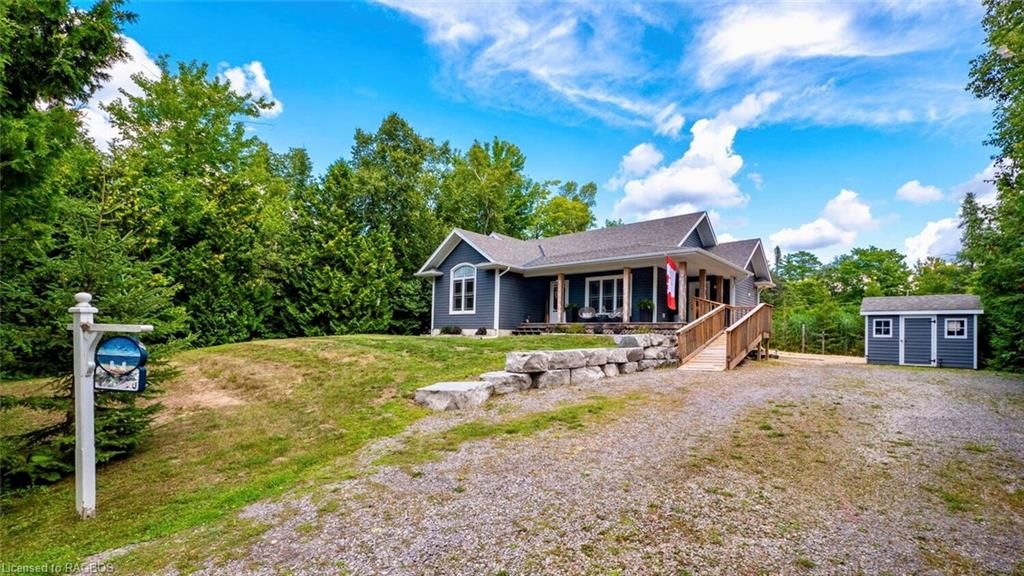
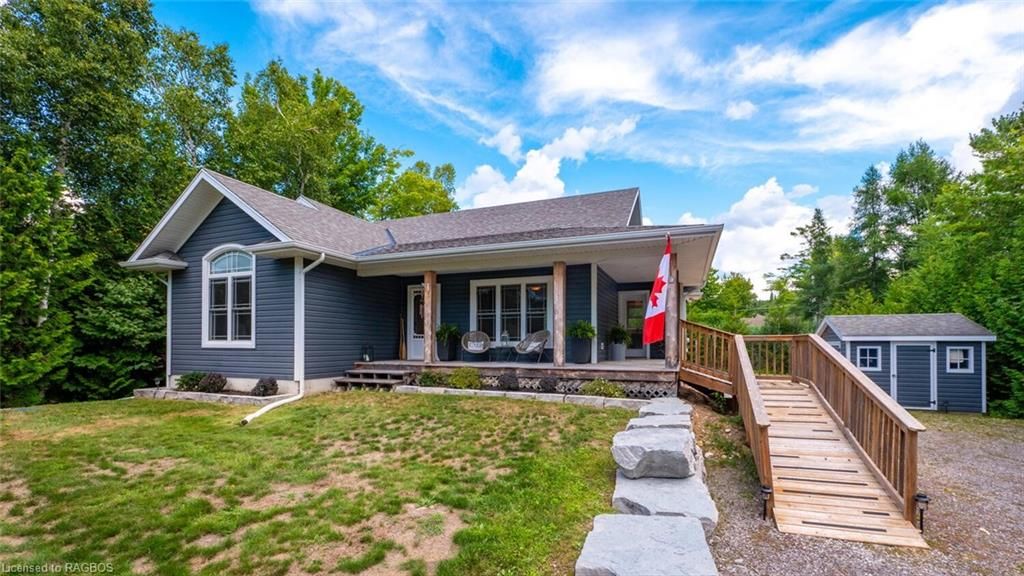
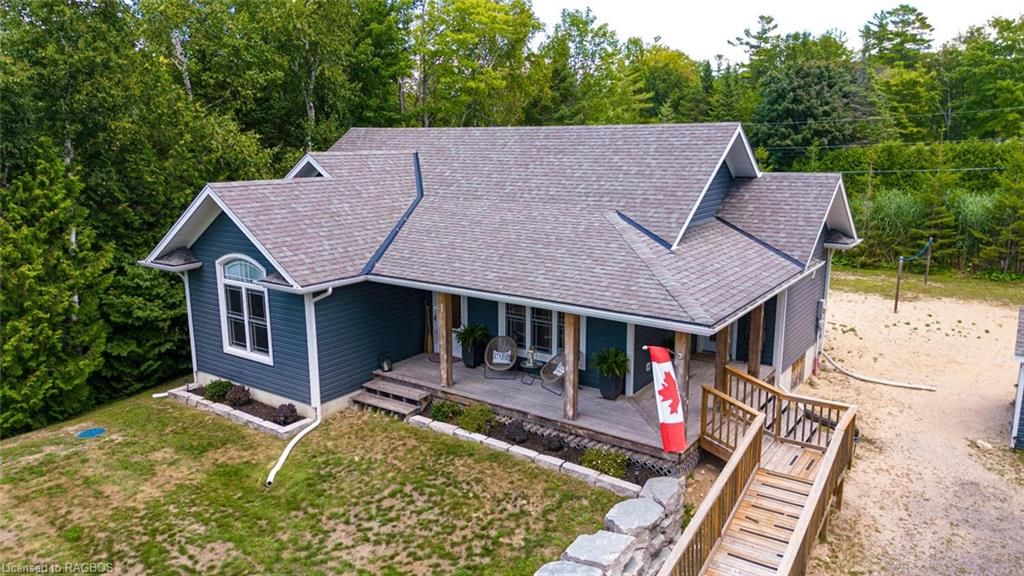
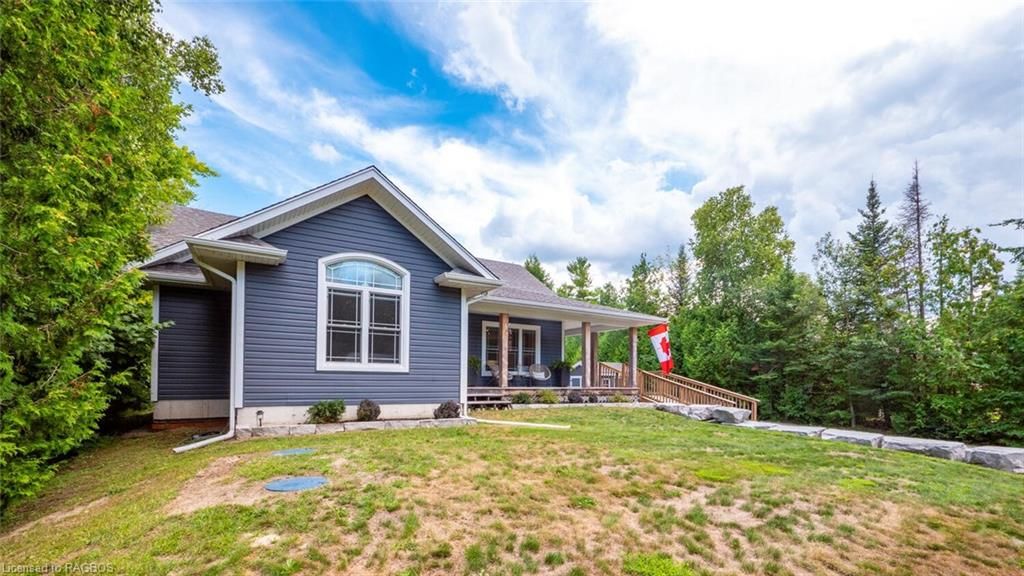
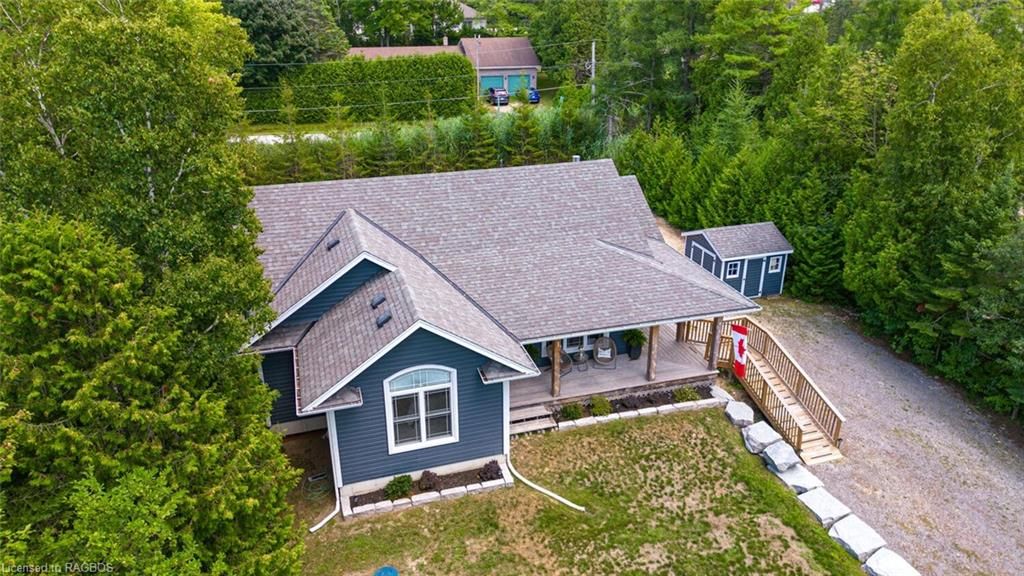
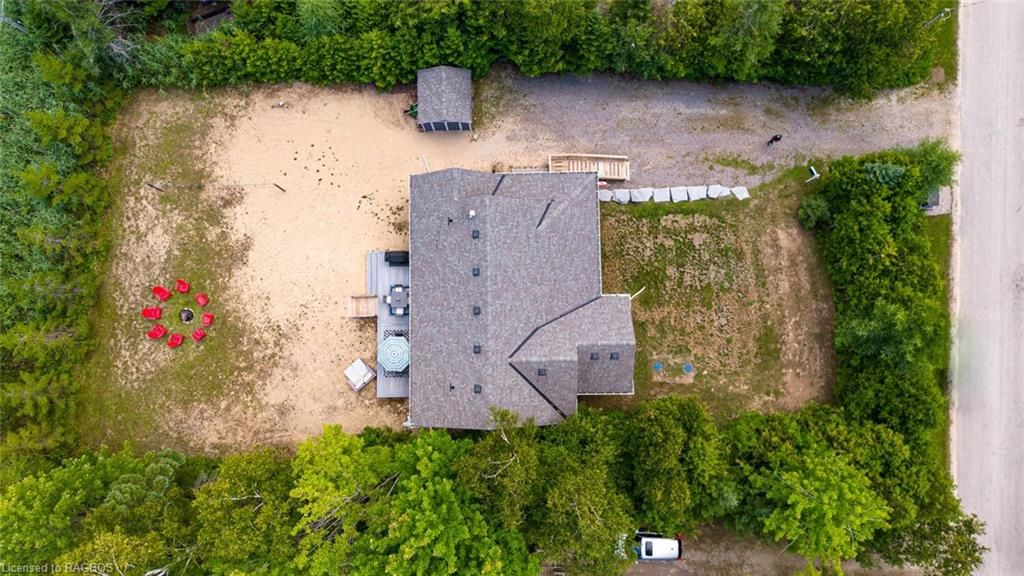
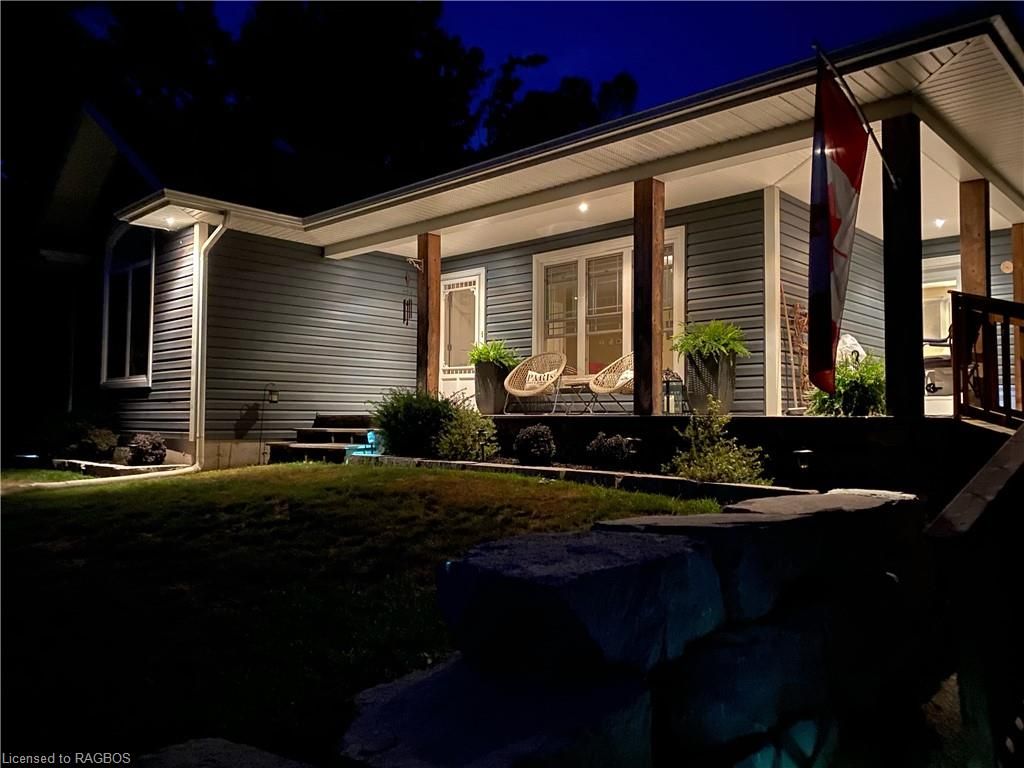
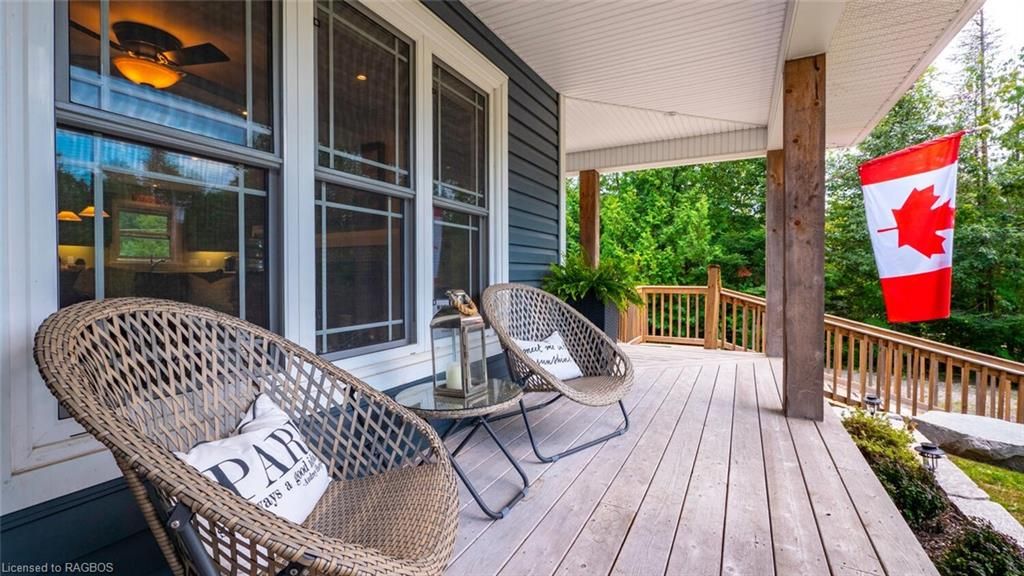
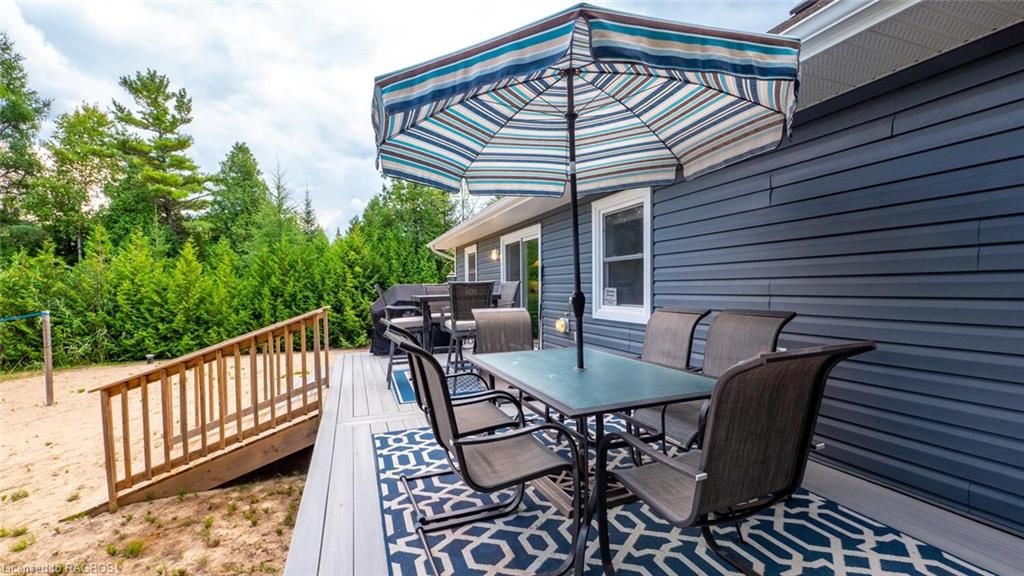
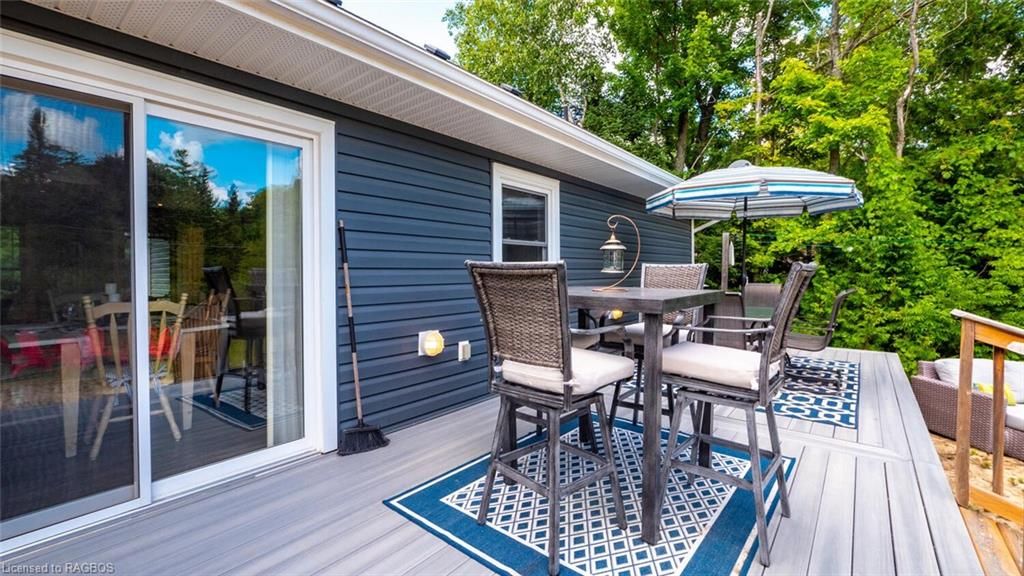
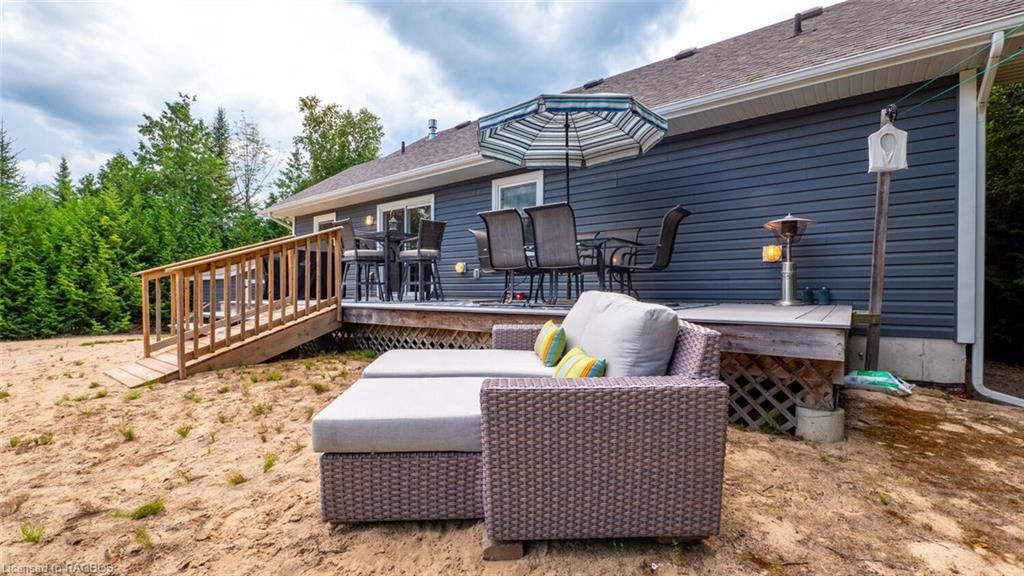
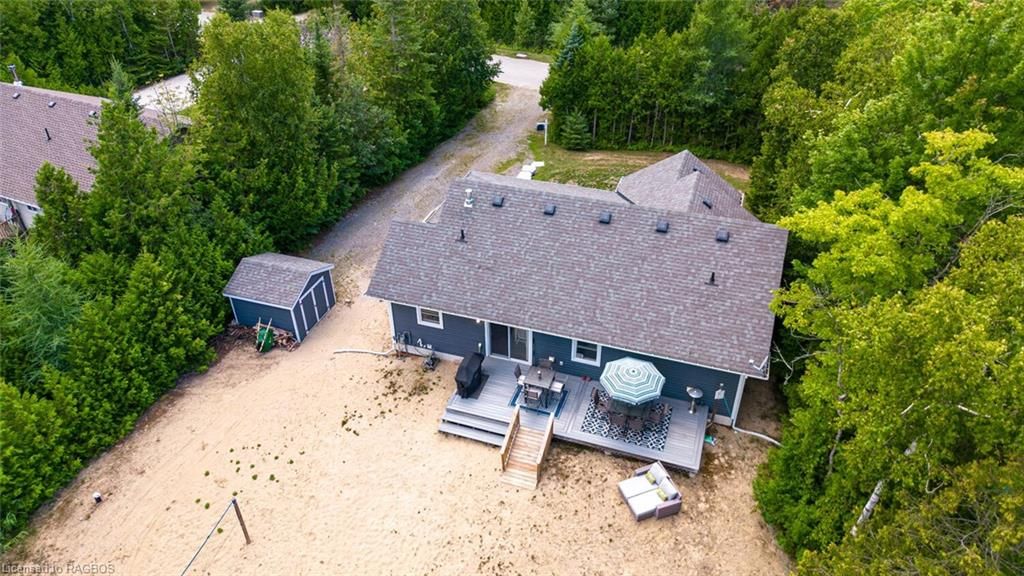
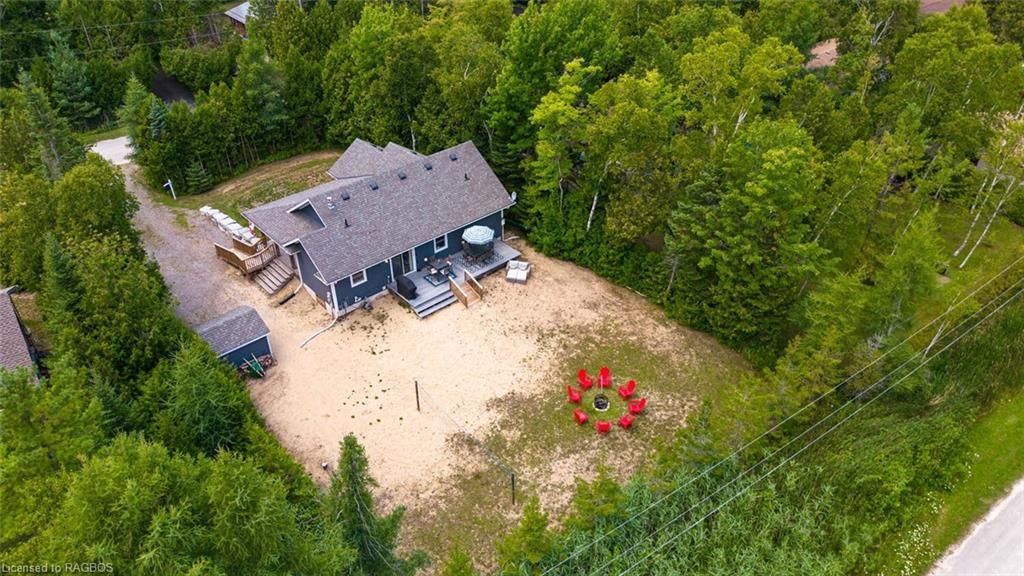
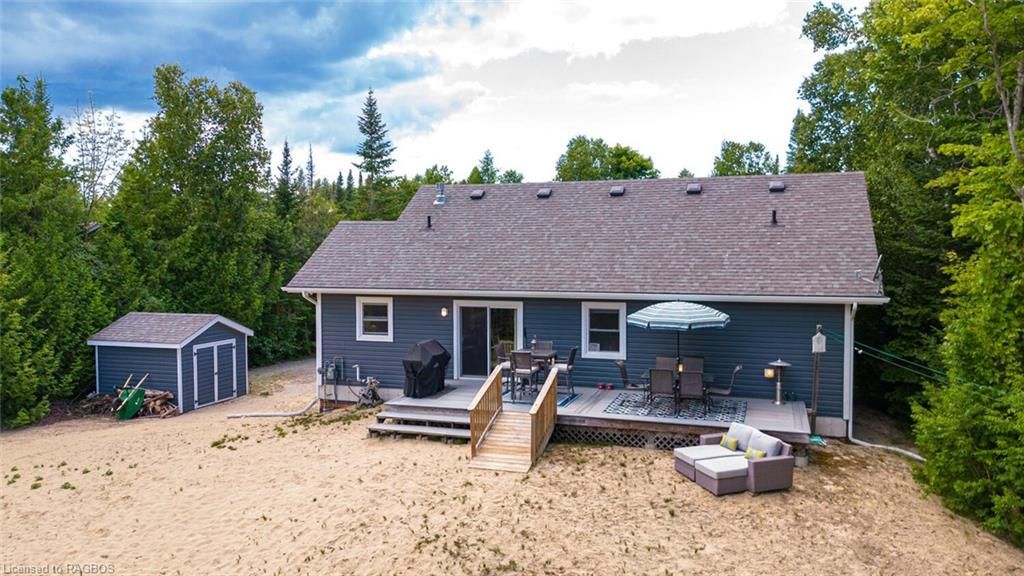
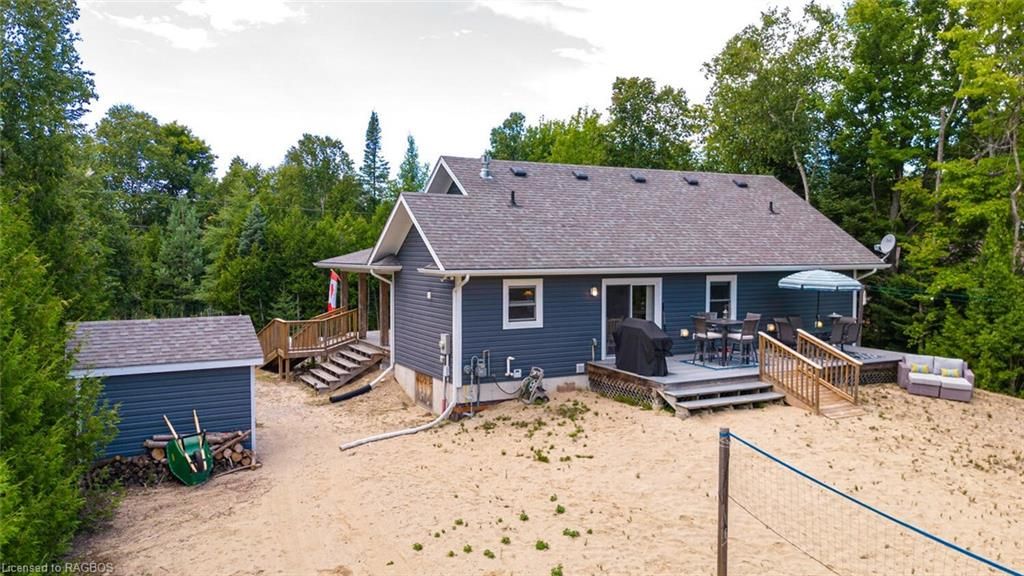
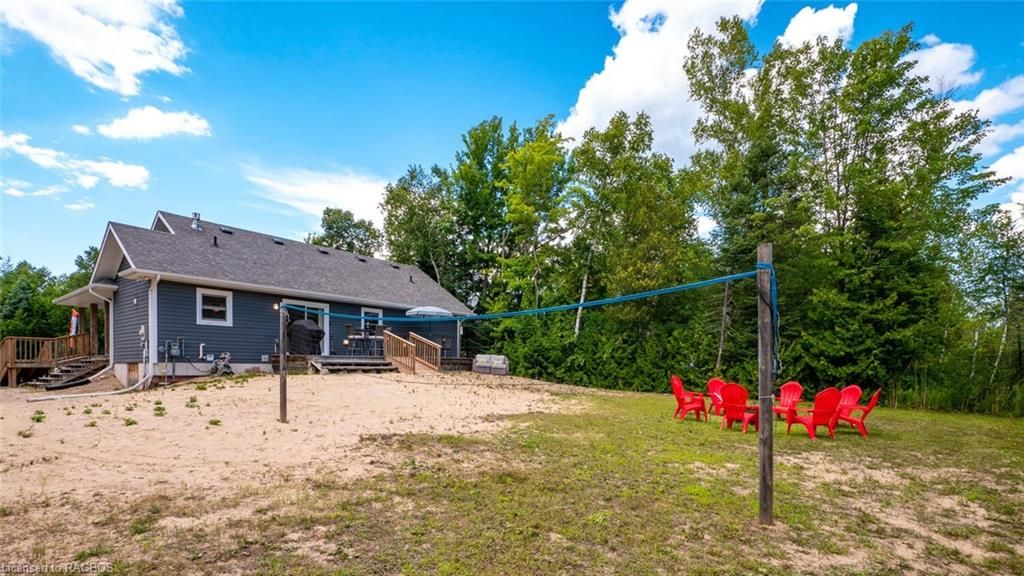
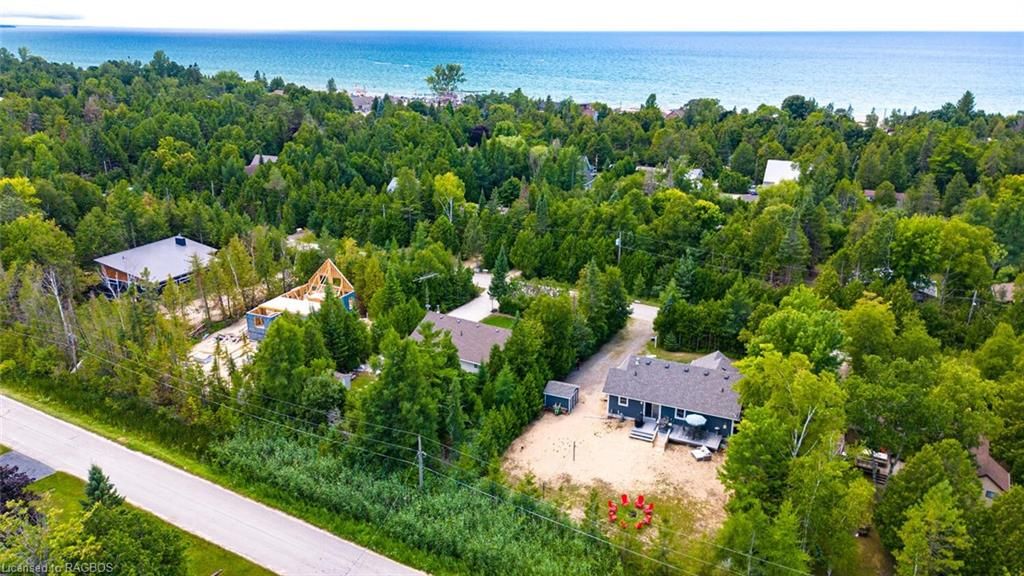
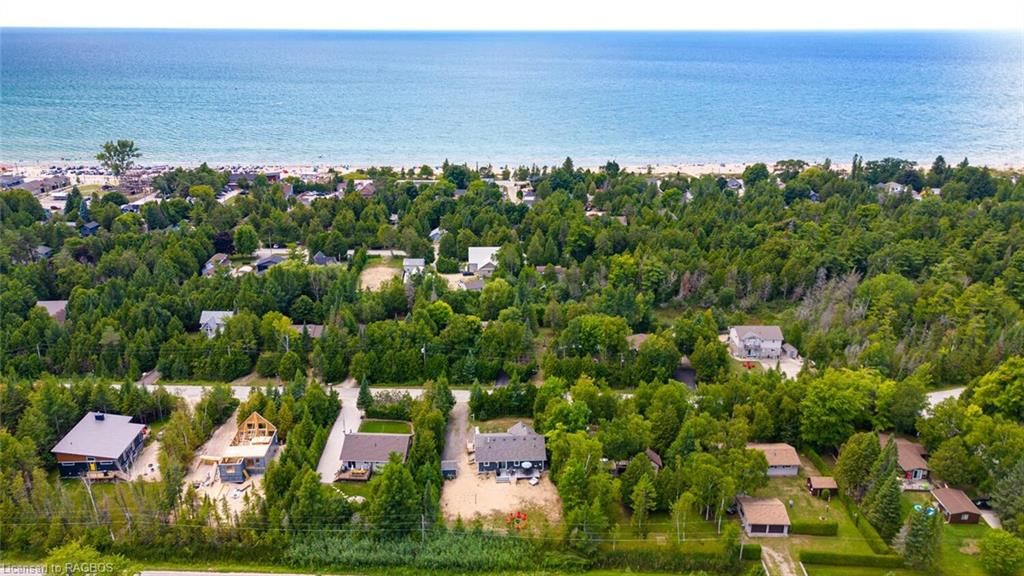
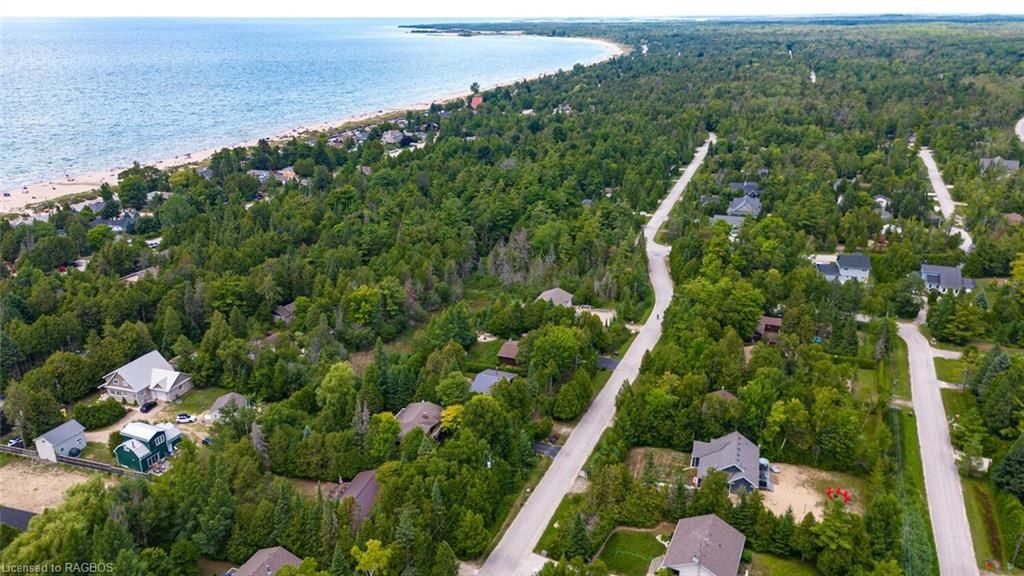
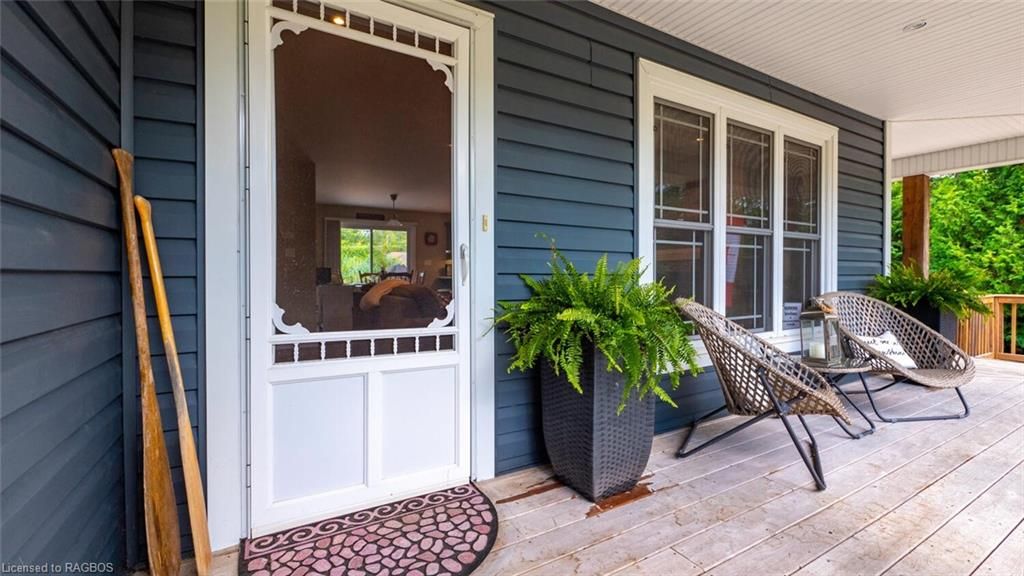
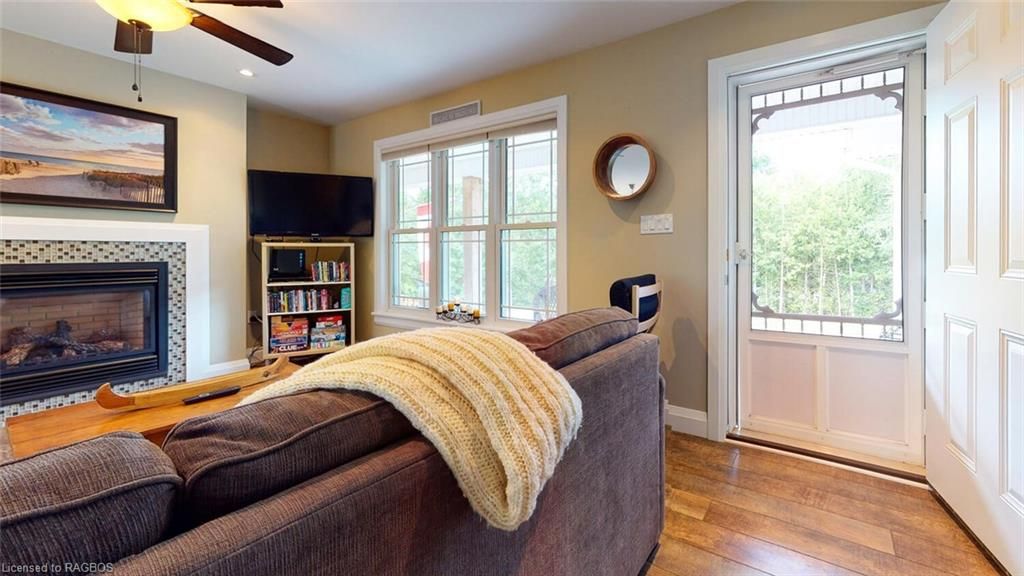
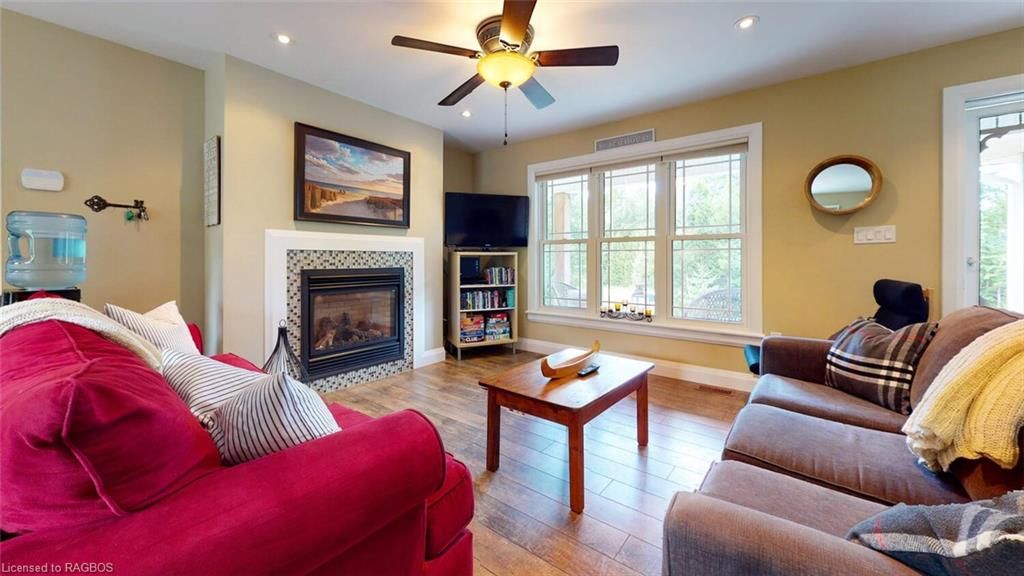
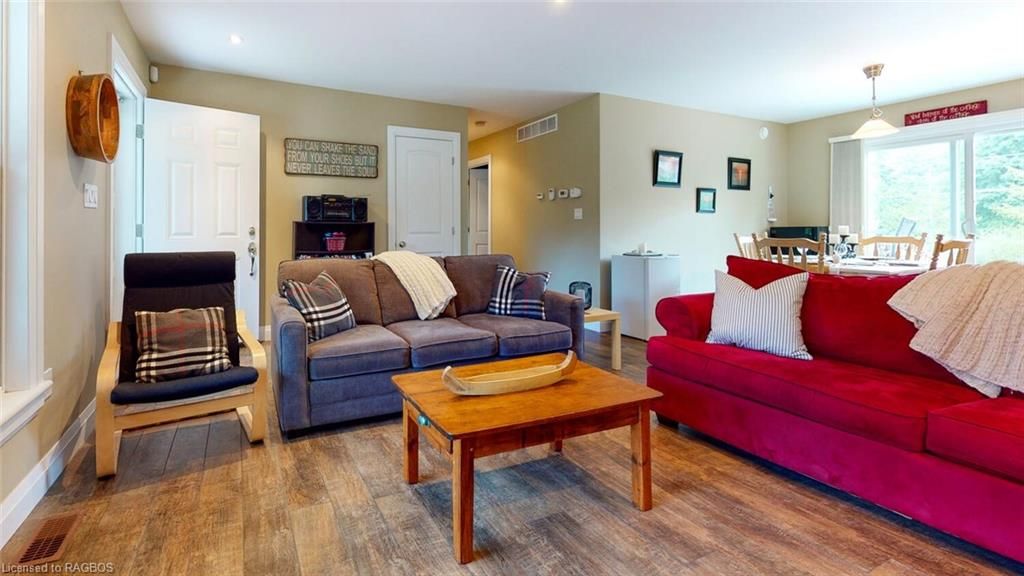
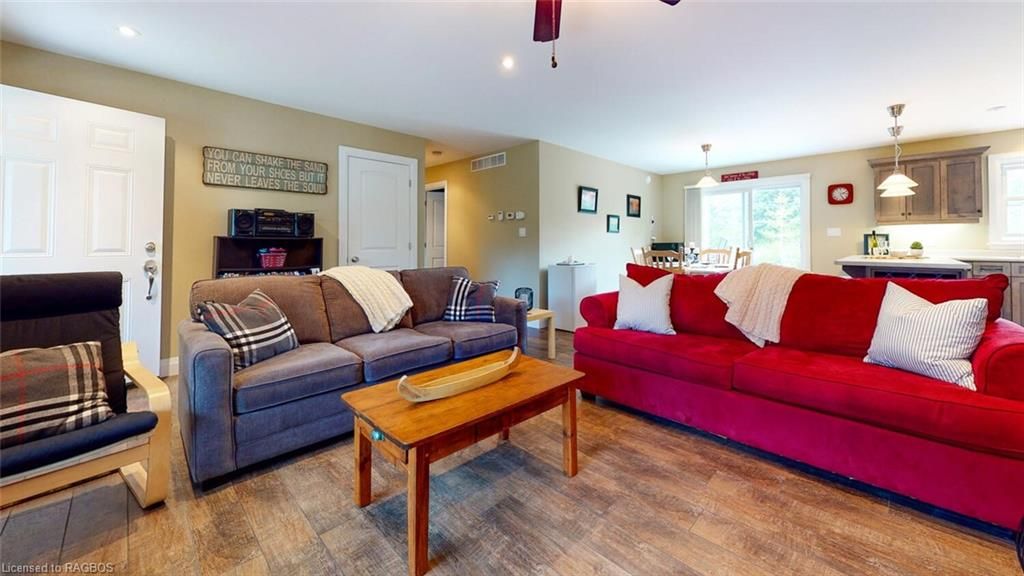
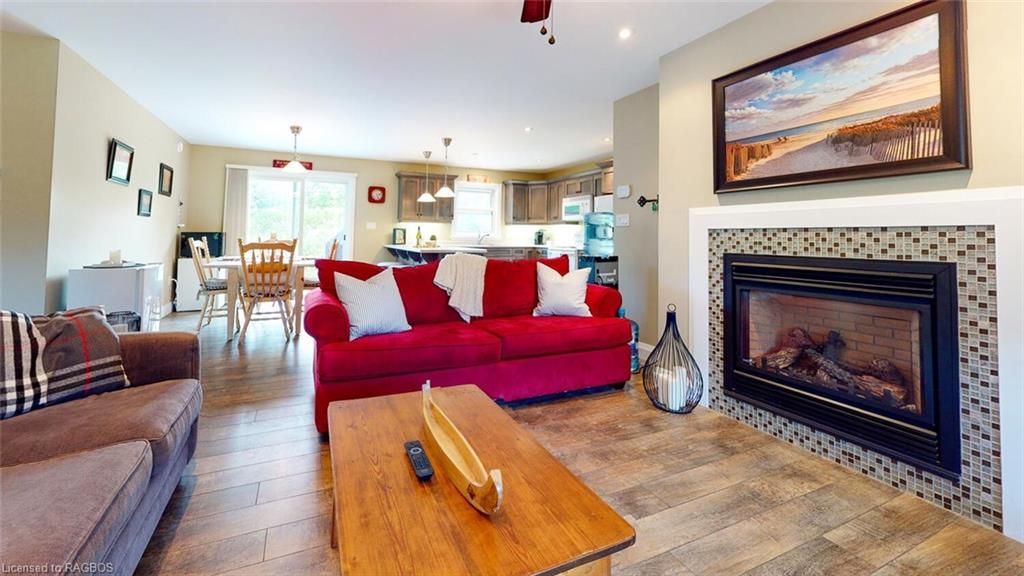
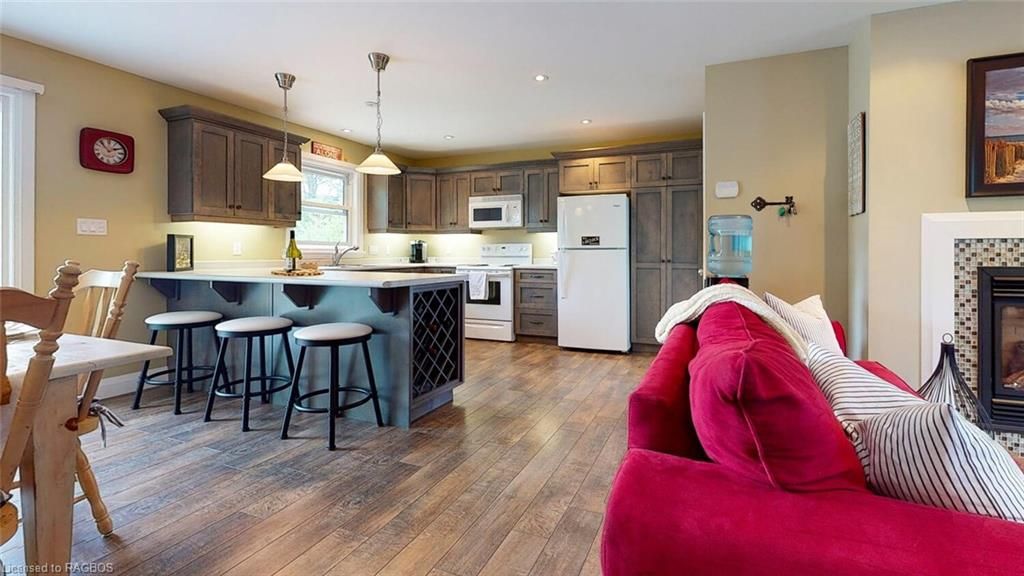
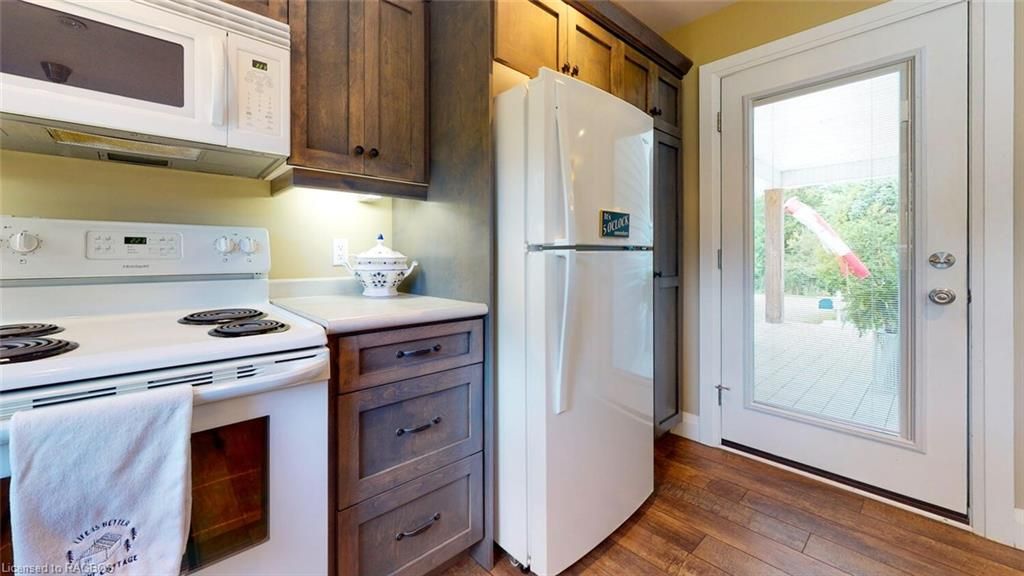
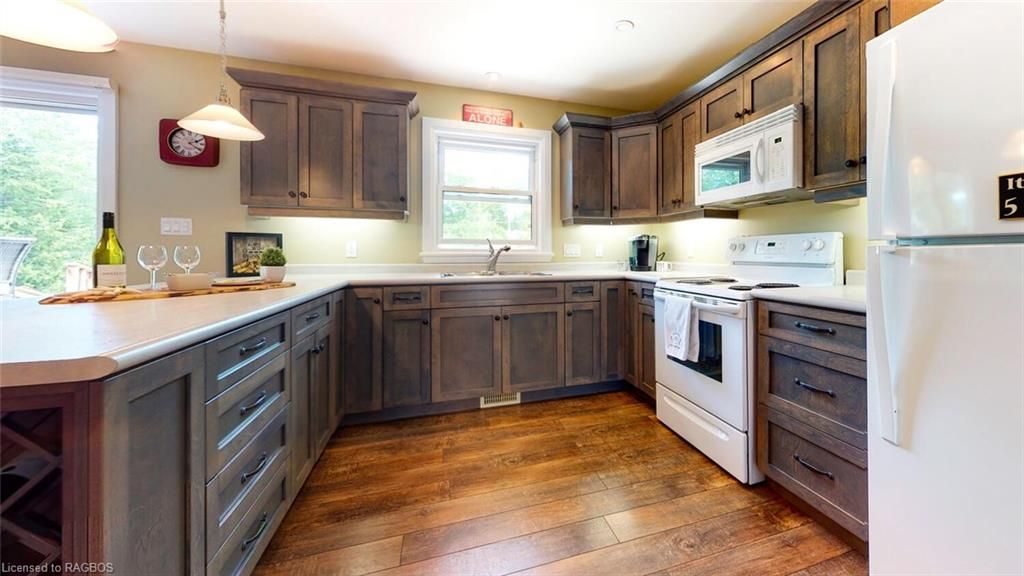
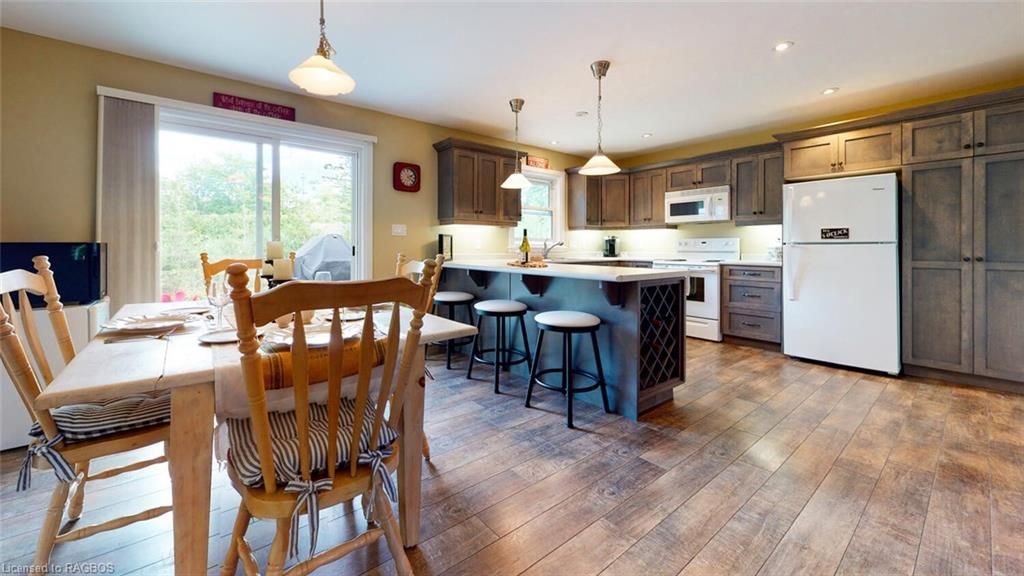
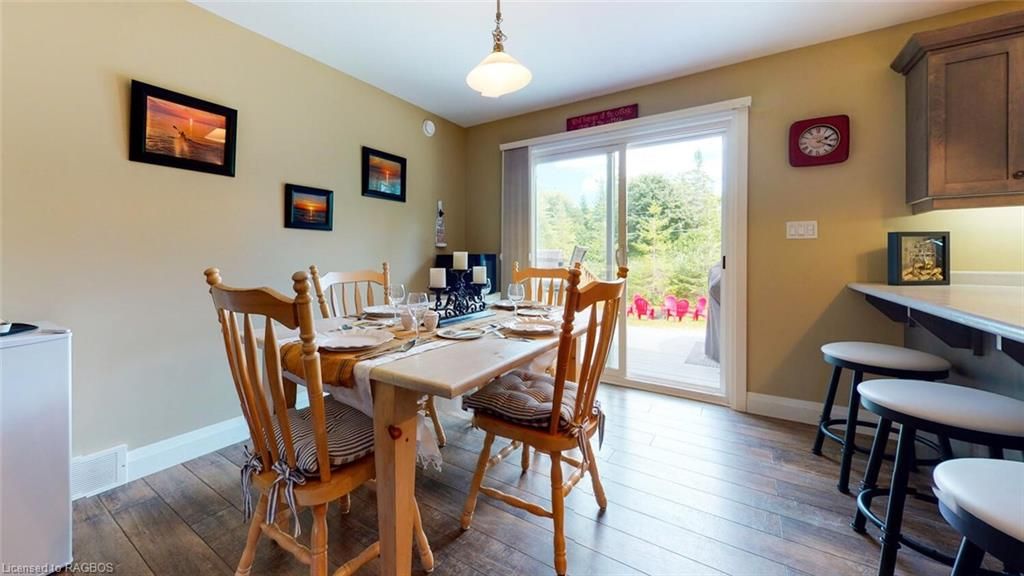
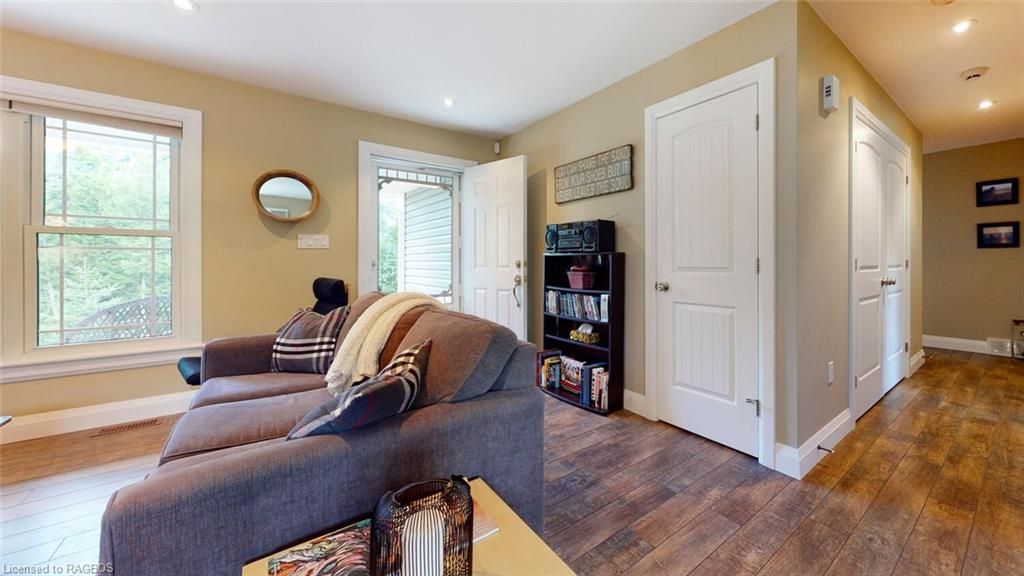
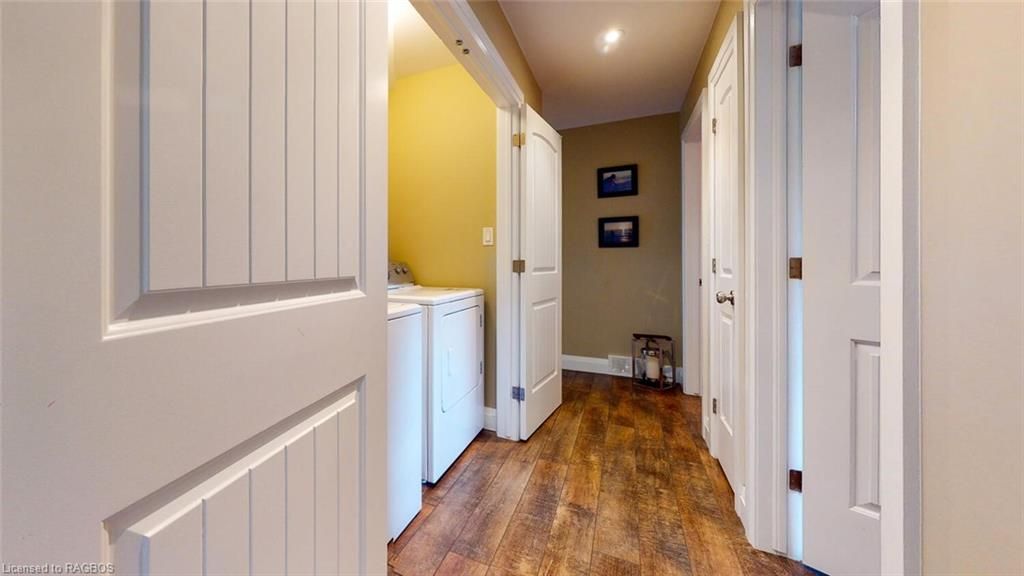
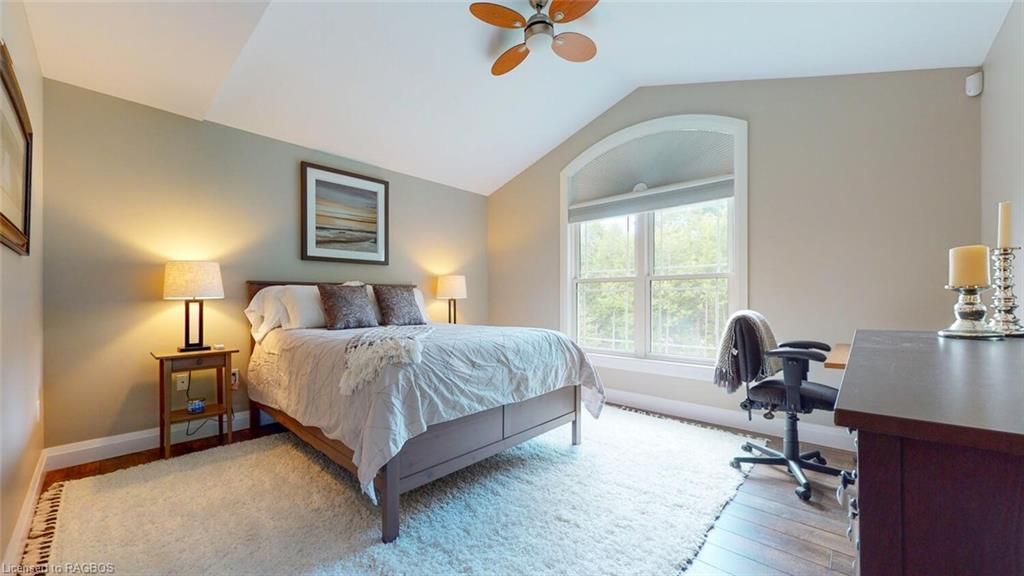
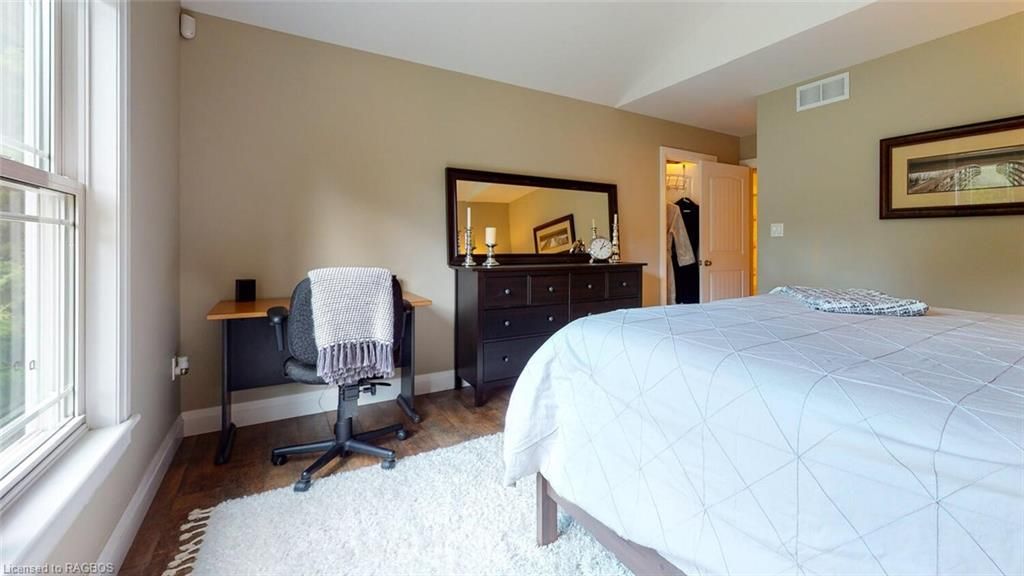
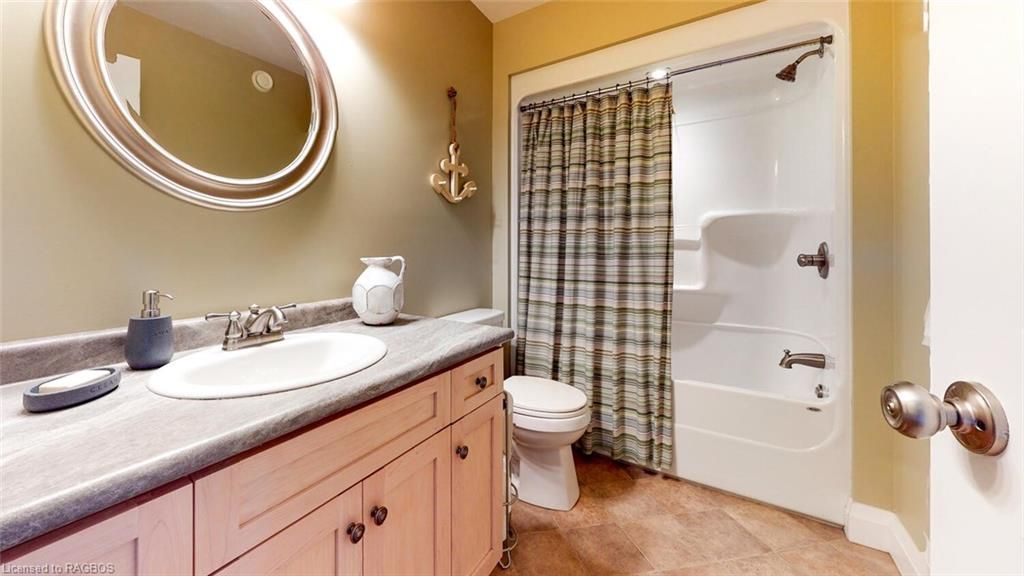
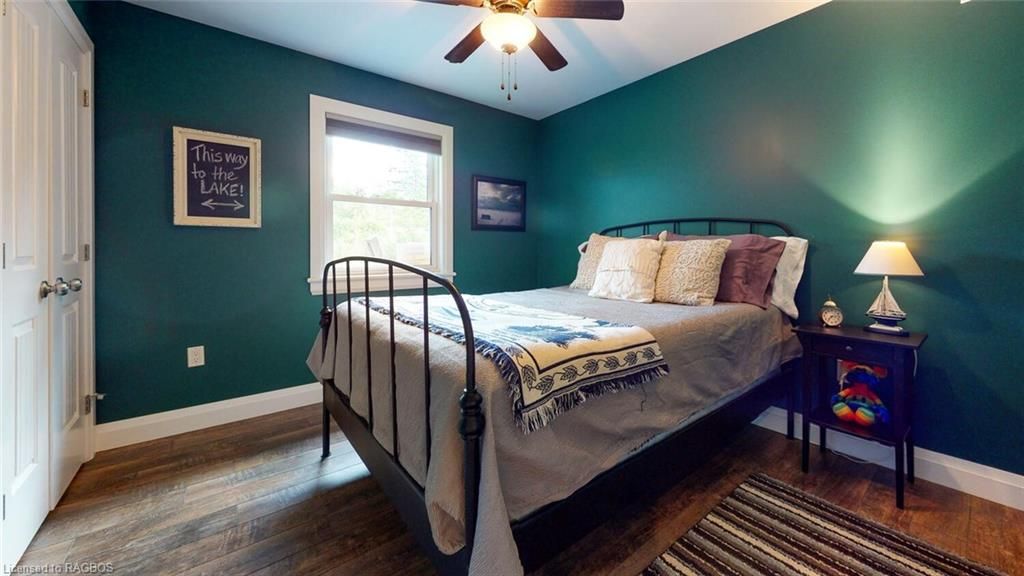
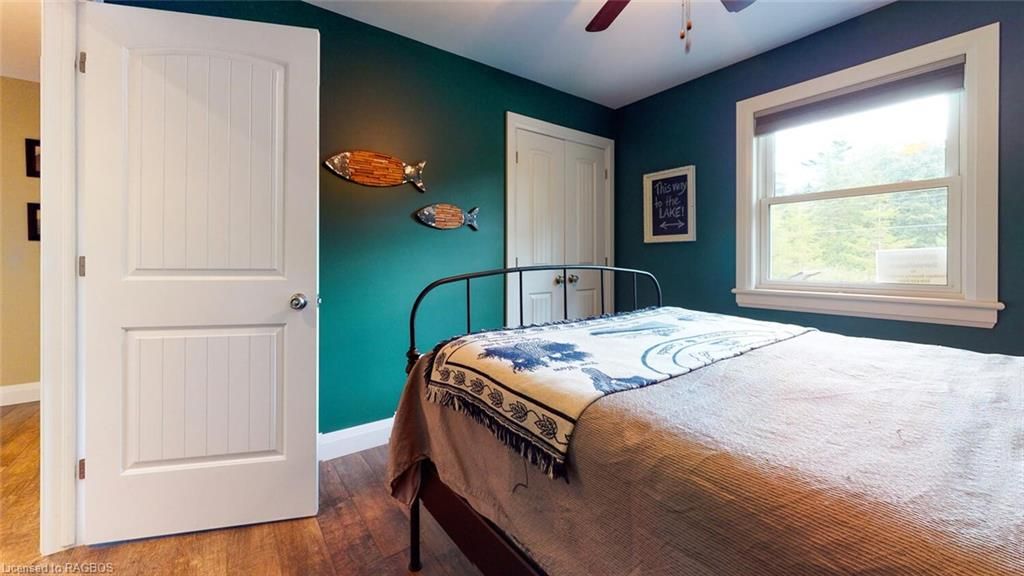
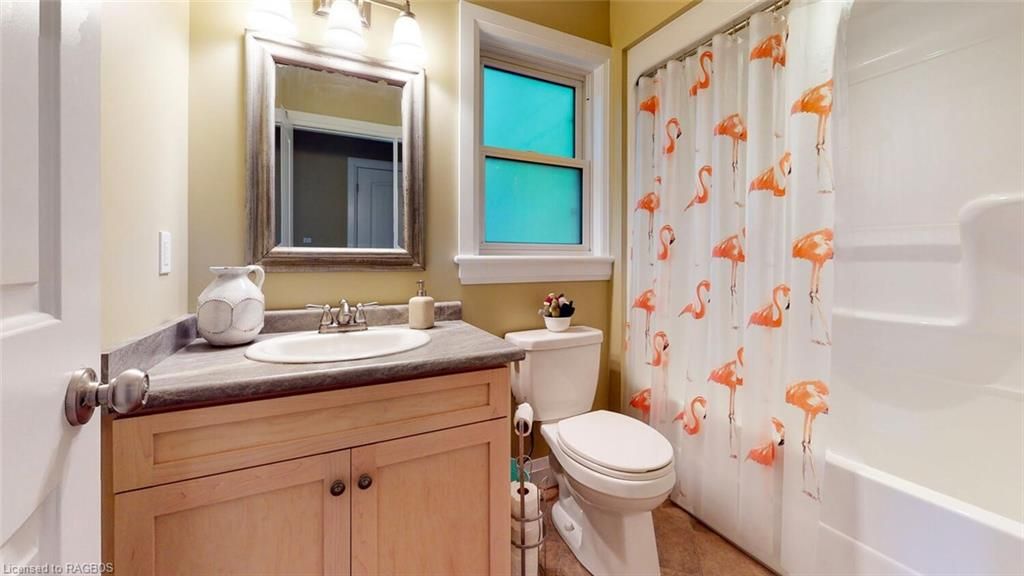
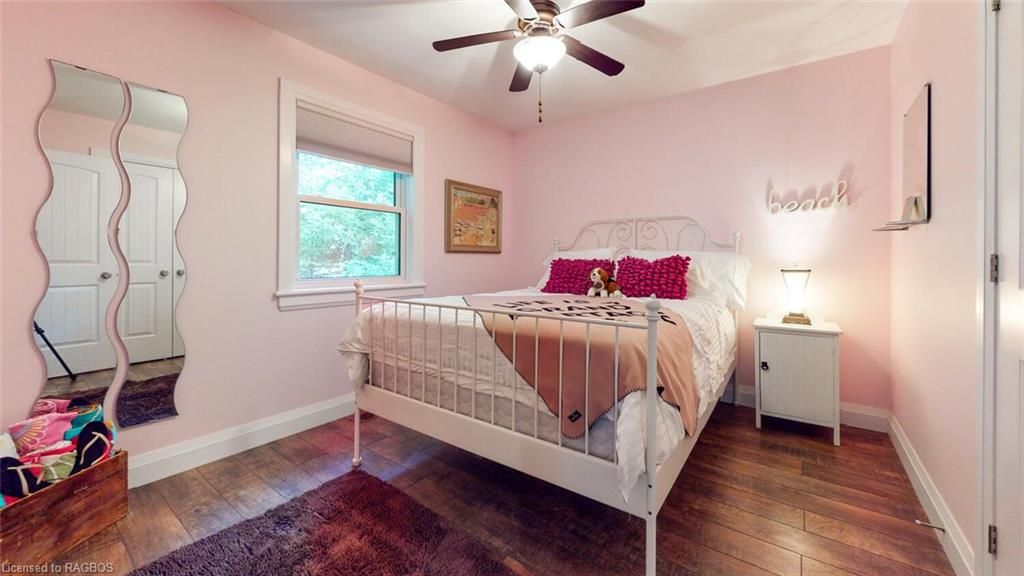
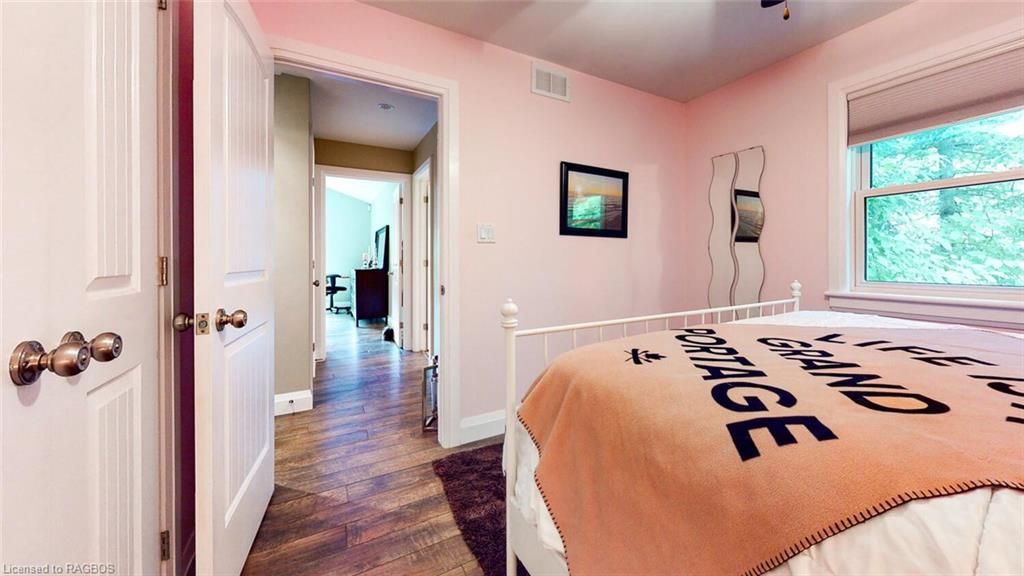
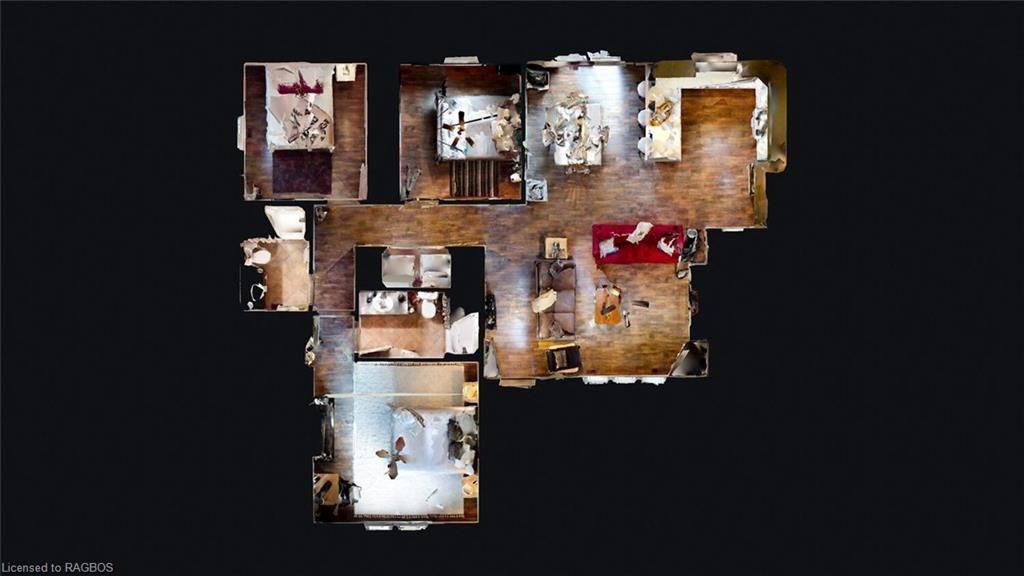
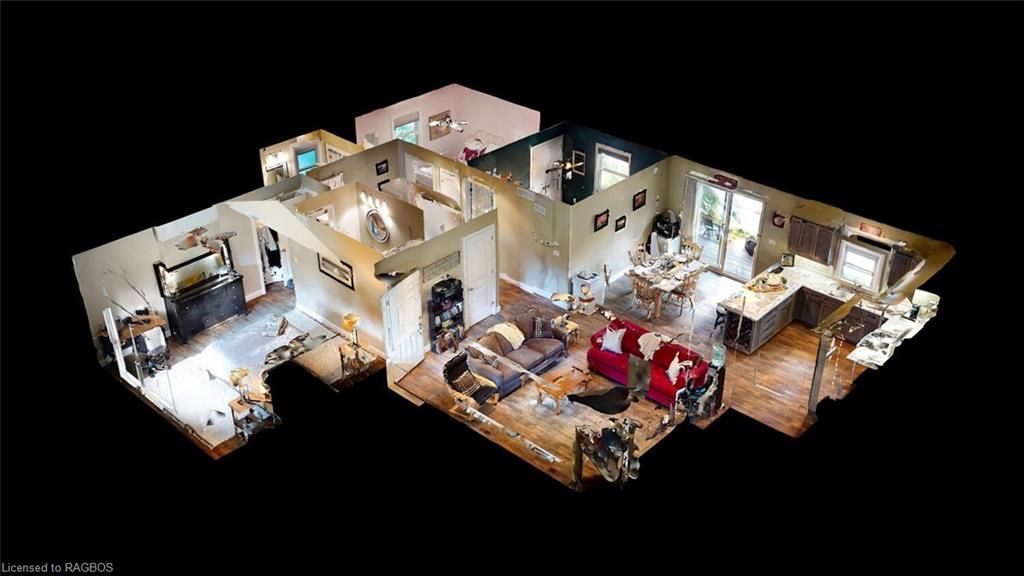
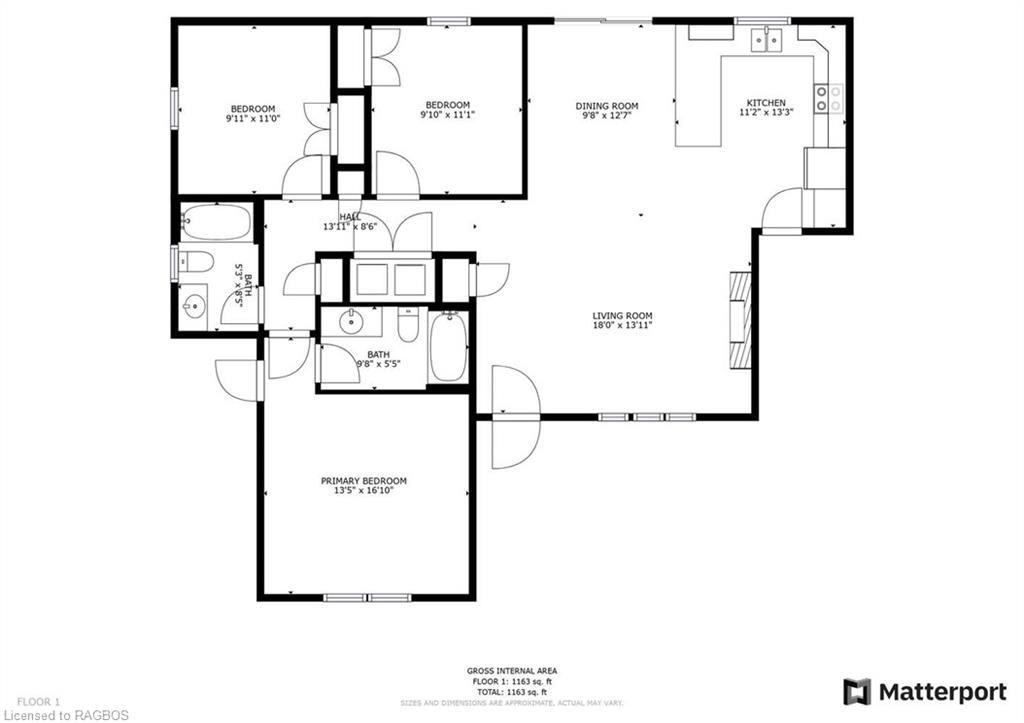
Custom Built 10 years ago and only three blocks from famous Sauble Beach. 3 bedrooms, 2 full baths and laundry closet, open concept kitchen & dining area with access to large back deck and living room with lots of windows and gas fireplace. Principal bedroom with walk-in closets and 4 pc ensuite bath. 2 additional bedrooms and another full bath. This great 4 season bungalow has all upgrades: gas forced air furnace, HRV, water system, composite decking out back and covered porch front entrance, great for when the sun is just too bright. The deck out back is a great spot to sit and watch others play in the low maintenance yard, it's sandy and perfect for volleyball or badminton and when the day is done you can enjoy the fire pit! Lots of interior storage with closets throughout the house and the crawl space is warm & dry. (utilities: gas Aug 21 to July 22 =$771.23; hydro Aug 21 to July 22=$934.32). Check out the walk-thru virtual tour.
Carbon Monoxide Detector,Dryer,Refrigerator,Smoke Detector,Stove,Washer,Window Coverings,Other,Negotiable,Water Cooler, Window Coverings, Ceiling Light Fixtures, All Bed Frames, Mattresses & Box Springs, All Bed Side Tables, Dining Room Table & Chairs, 2 Sofa Beds, Napoleon Gas Bbq, Outdoor Patio Set, Water Softener System, Security System.
Copyright 2025 Information Technology Systems Ontario, Inc. The information provided herein must only be used by consumers that have a bona fide interest in the purchase, sale, or lease of real estate and may not be used for any commercial purpose or any other purpose.
Laundry
Bathroom
Bedroom
Bedroom
Bedroom Primary
Kitchen
Dining Room
Living Room
The graph below compares the average list price and average sale price of homes in this neighborhood by month for the last 24 months. When average sale price is greater than average list price, this may suggest a buyer's market. When average sale price is lower than the average list price this may suggest a seller's market.
The graph below illustrates the average days on market for homes in this neighborhood. The yellow area may indicate a buyer's market, the green area may indicate a balanced market and the red area may indicate a seller's market.
Saugeen Indian Reserve #29, Native Leased Lands, N0H 2G0
Saugeen Indian Reserve #29, Native Leased Lands, N0H 2L0
Chief's Point Indian Reserve #28, Native Leased Lands, N0H 2G0
Saugeen Indian Reserve #29, Native Leased Lands, N0H 2G0
Saugeen Indian Reserve #29, Native Leased Lands, N0H 2G0
Chief's Point Indian Reserve #28, Native Leased Lands, N0H 2G0
Chief's Point Indian Reserve #28, Native Leased Lands, N0H 2G0
Chief's Point Indian Reserve #28, Native Leased Lands, N0H 2G0
Chief's Point Indian Reserve #28, Native Leased Lands, N0H 2G0
Saugeen Indian Reserve #29, Native Leased Lands, N0H 2G0