
Re/max Premier Inc., Brokerage
9100 Jane St
Concord, ON
L4K 0A4


Prince Edward County, Picton, K0K 2T0
$731,000
Listed by EXP REALTY.
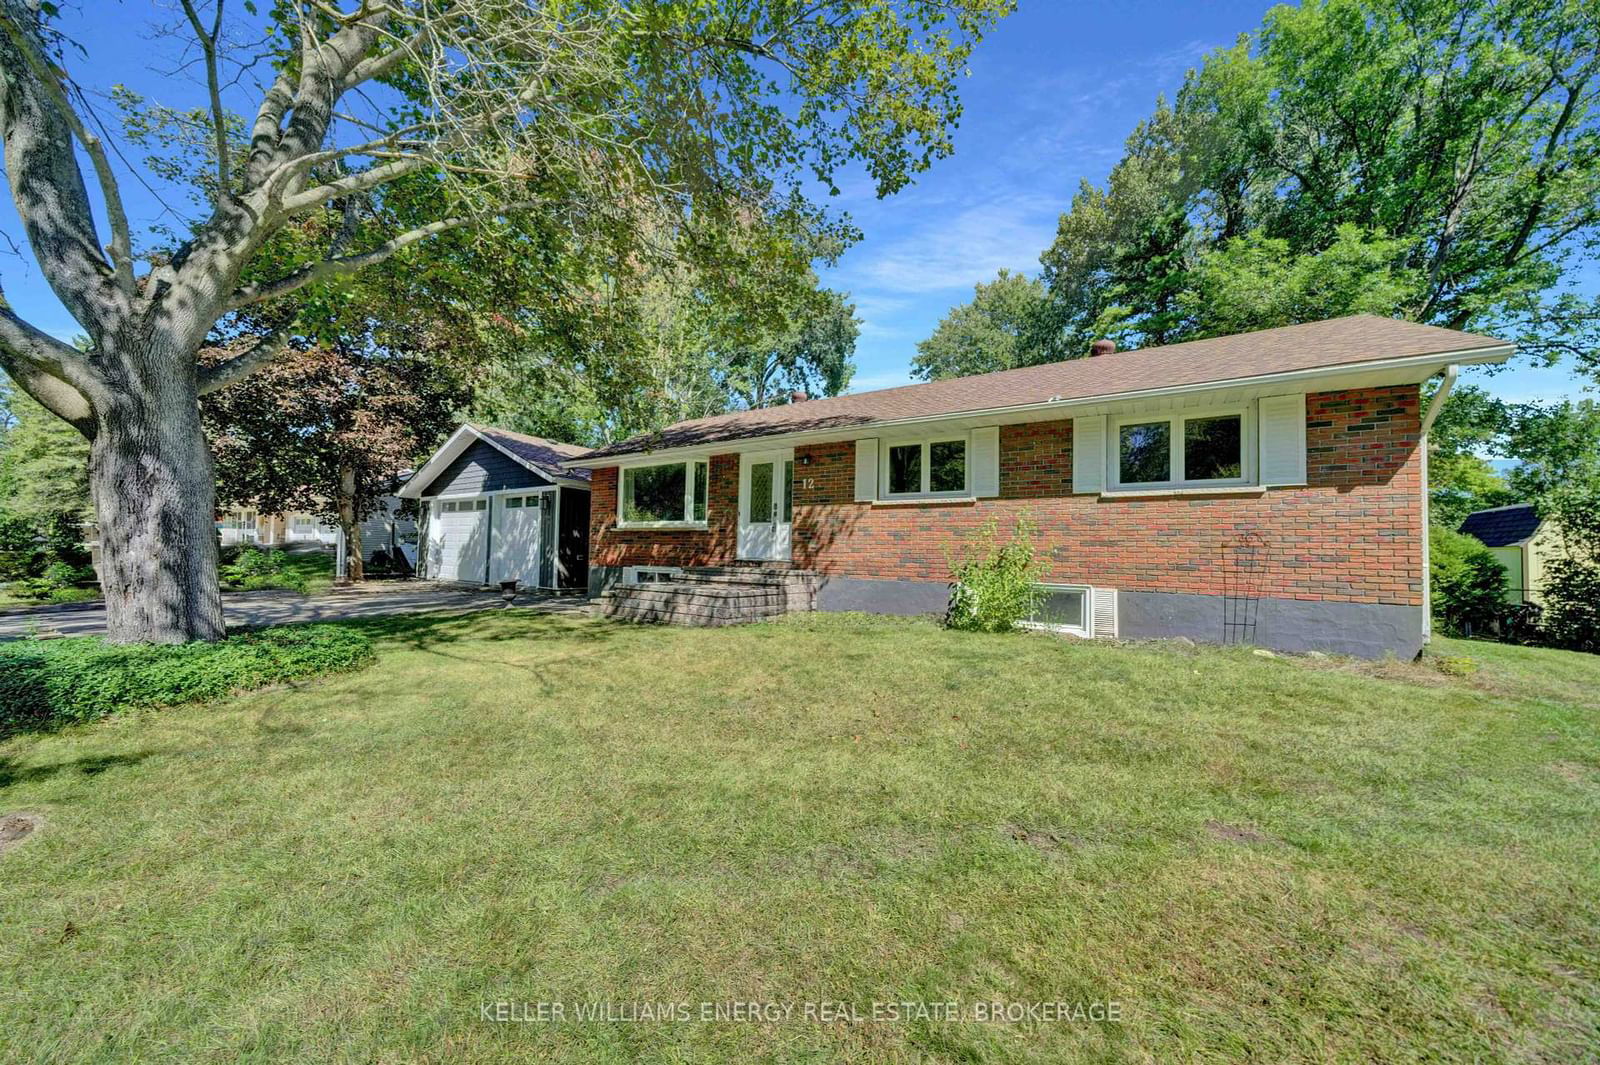
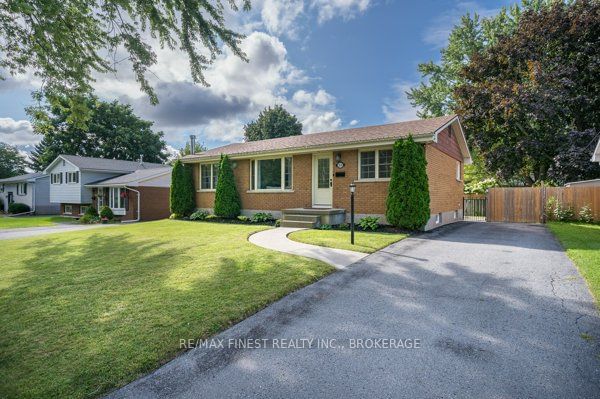
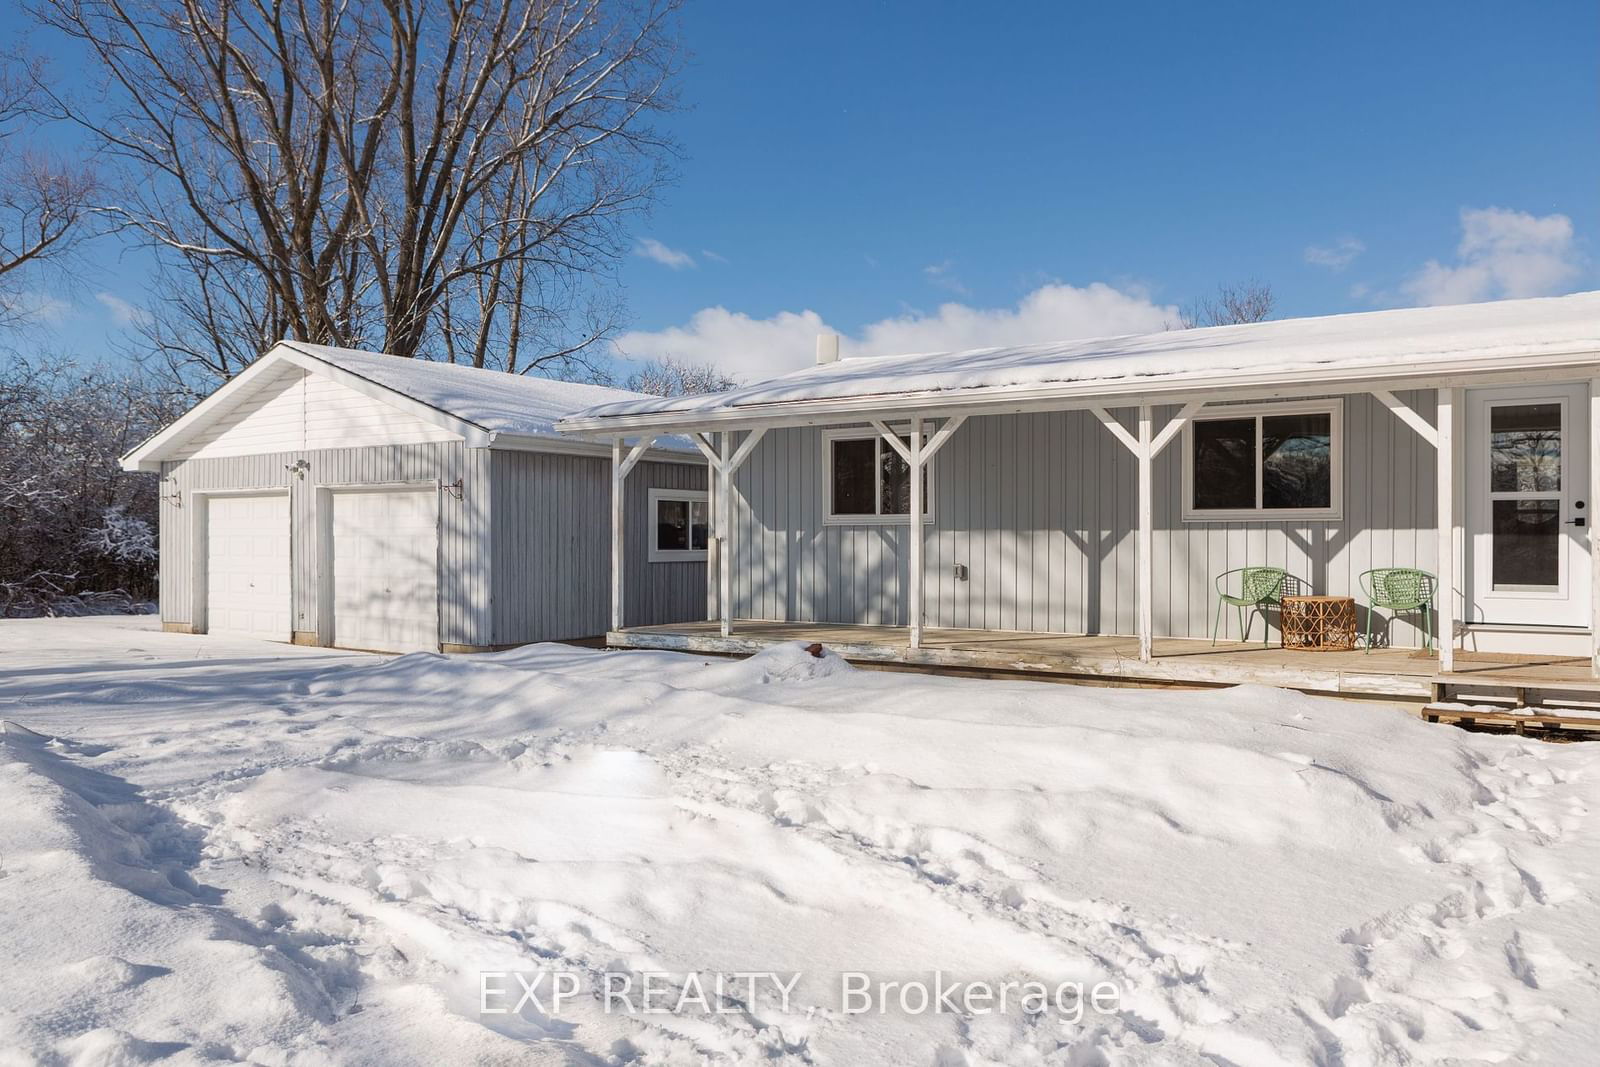
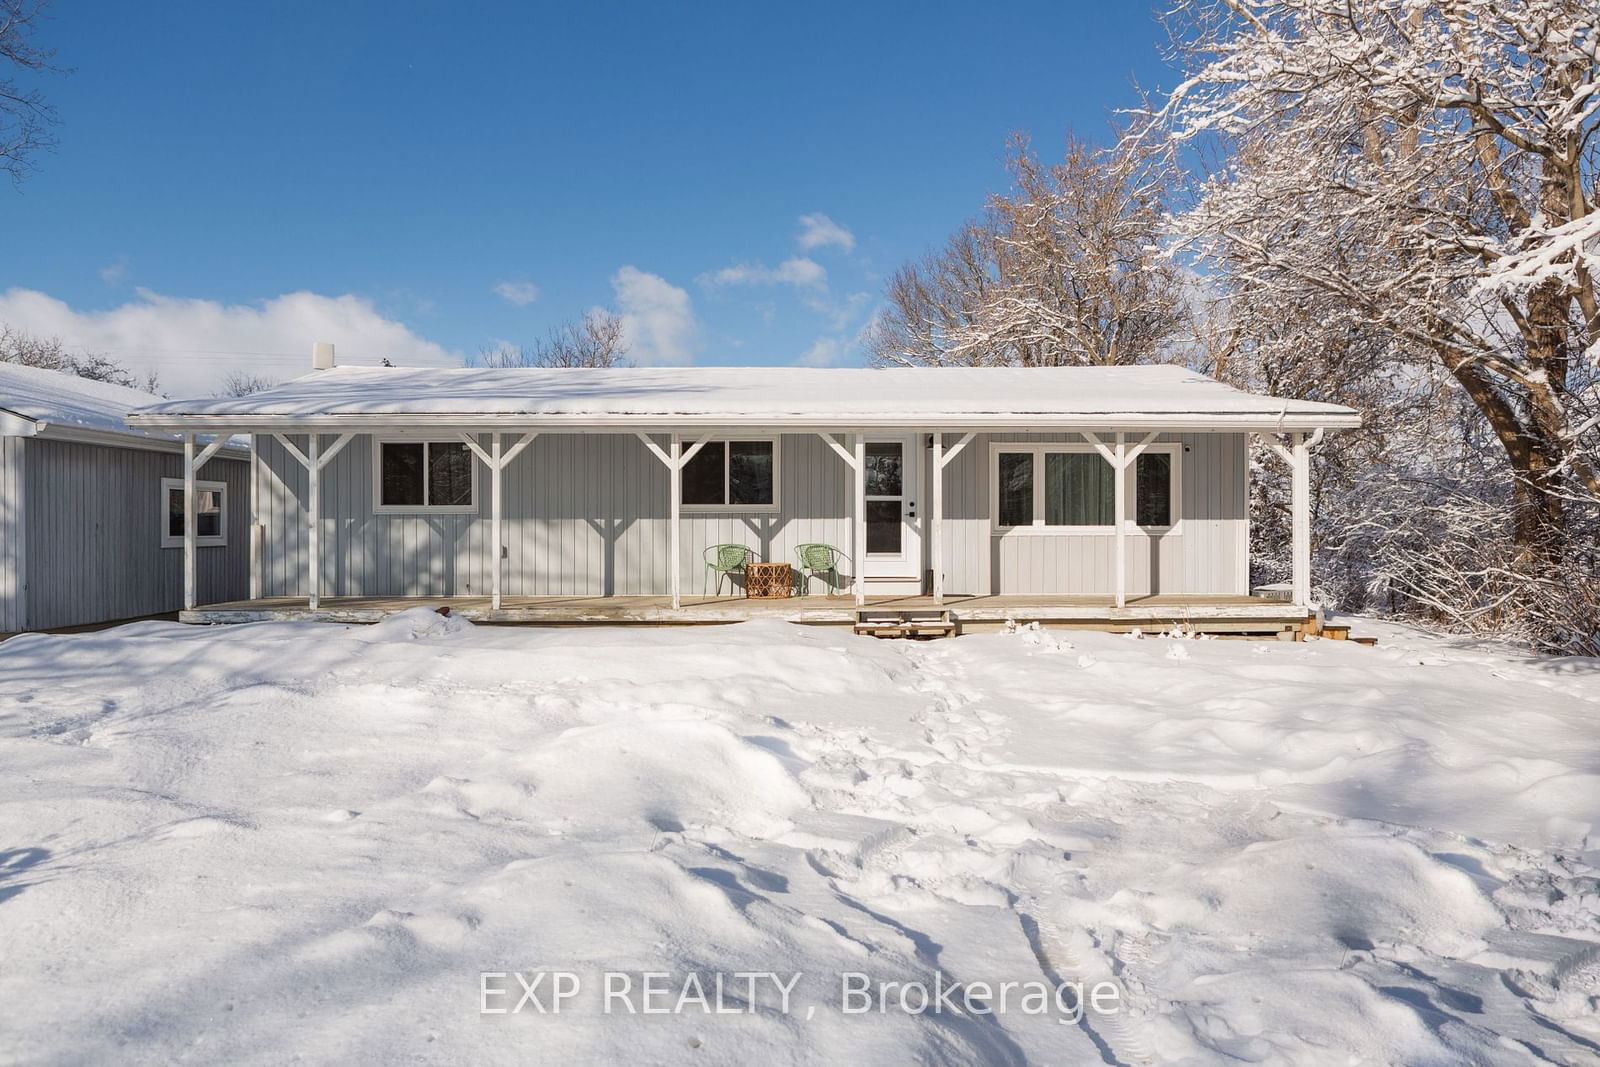
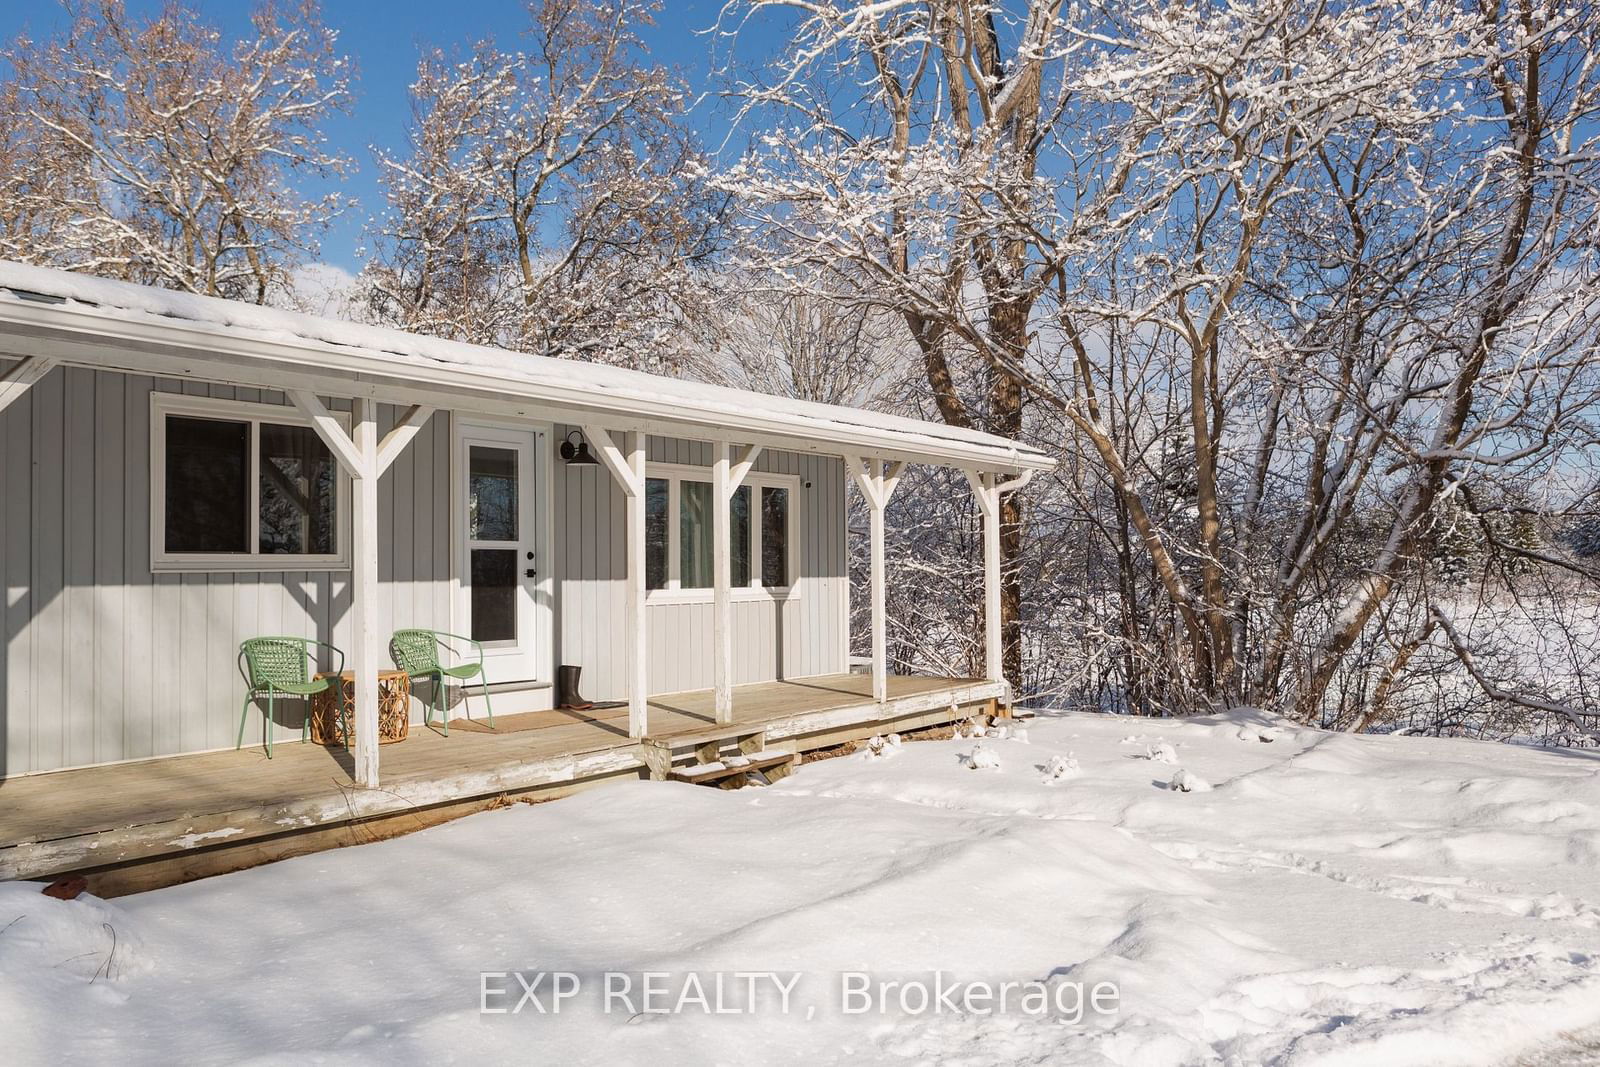
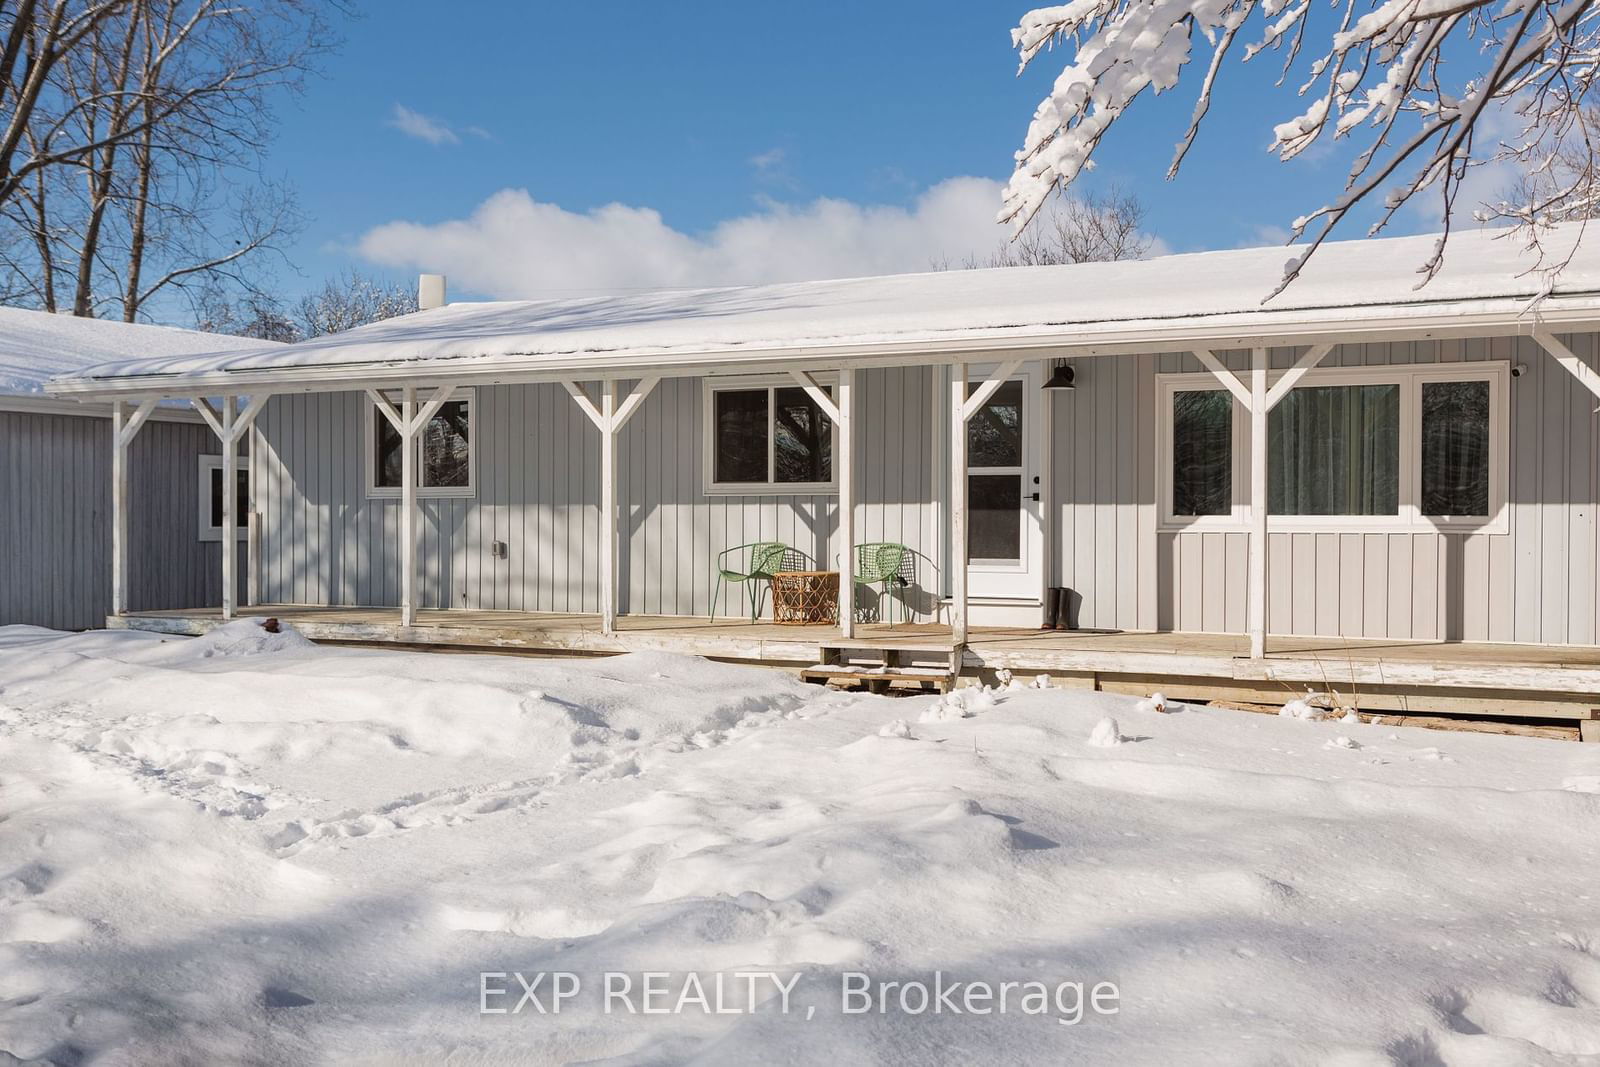
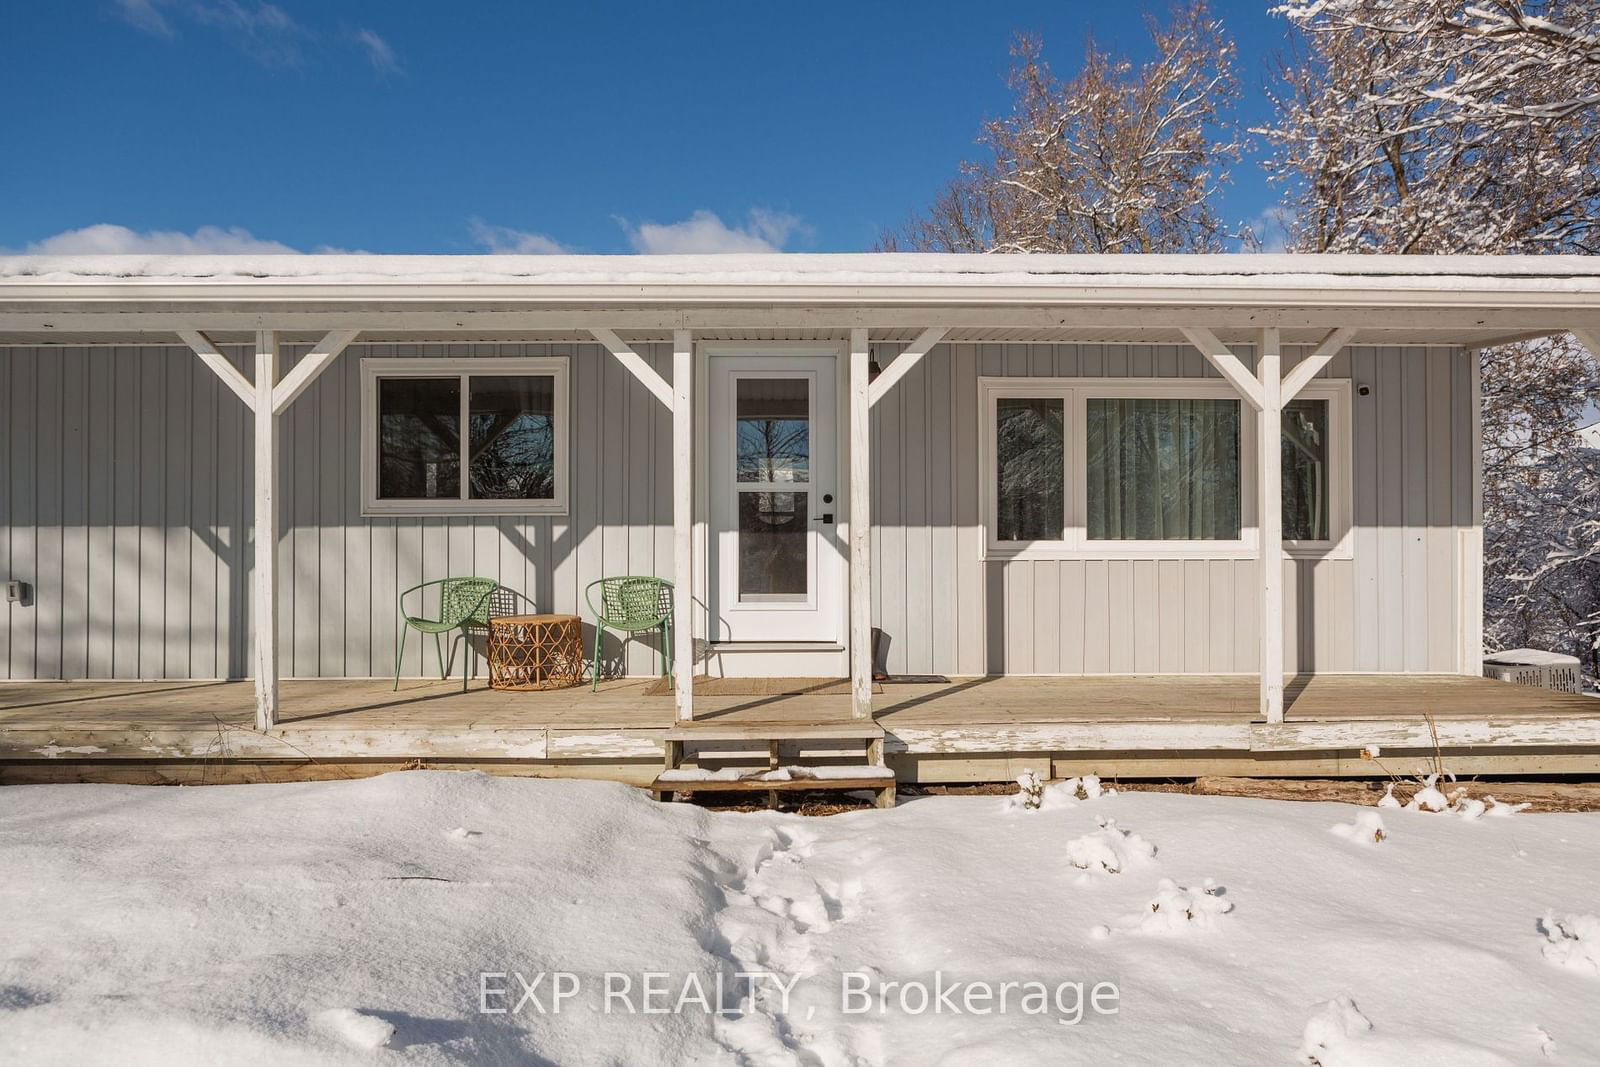
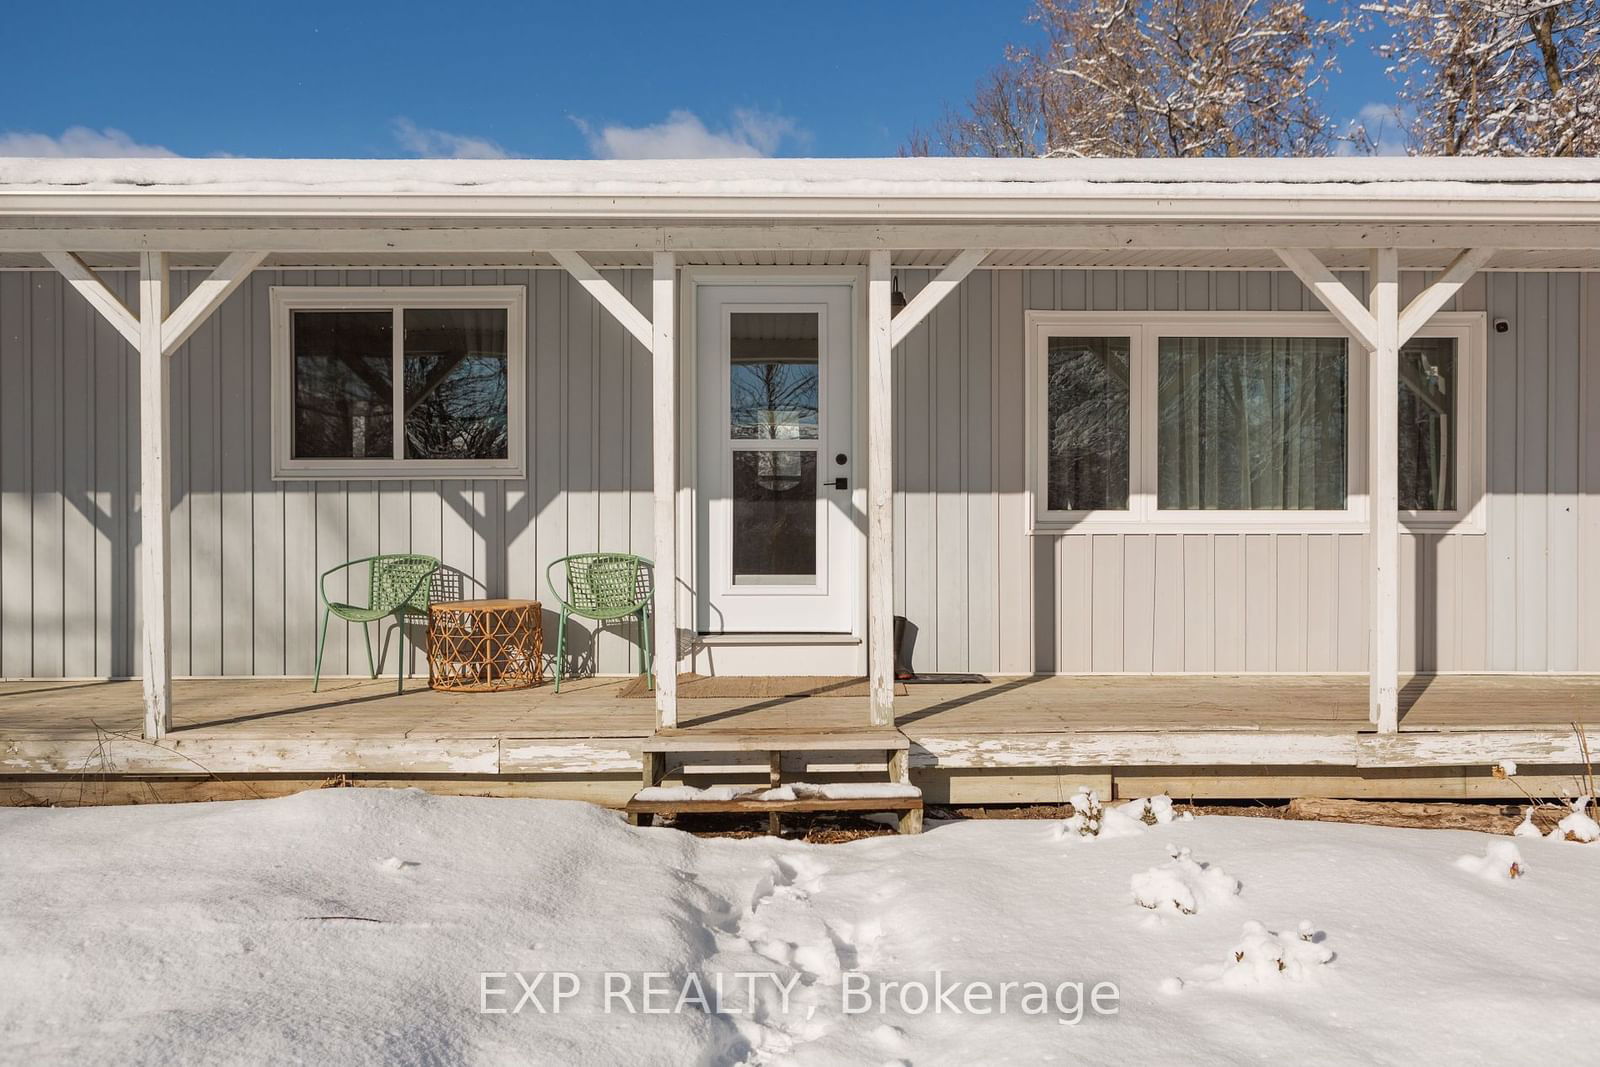
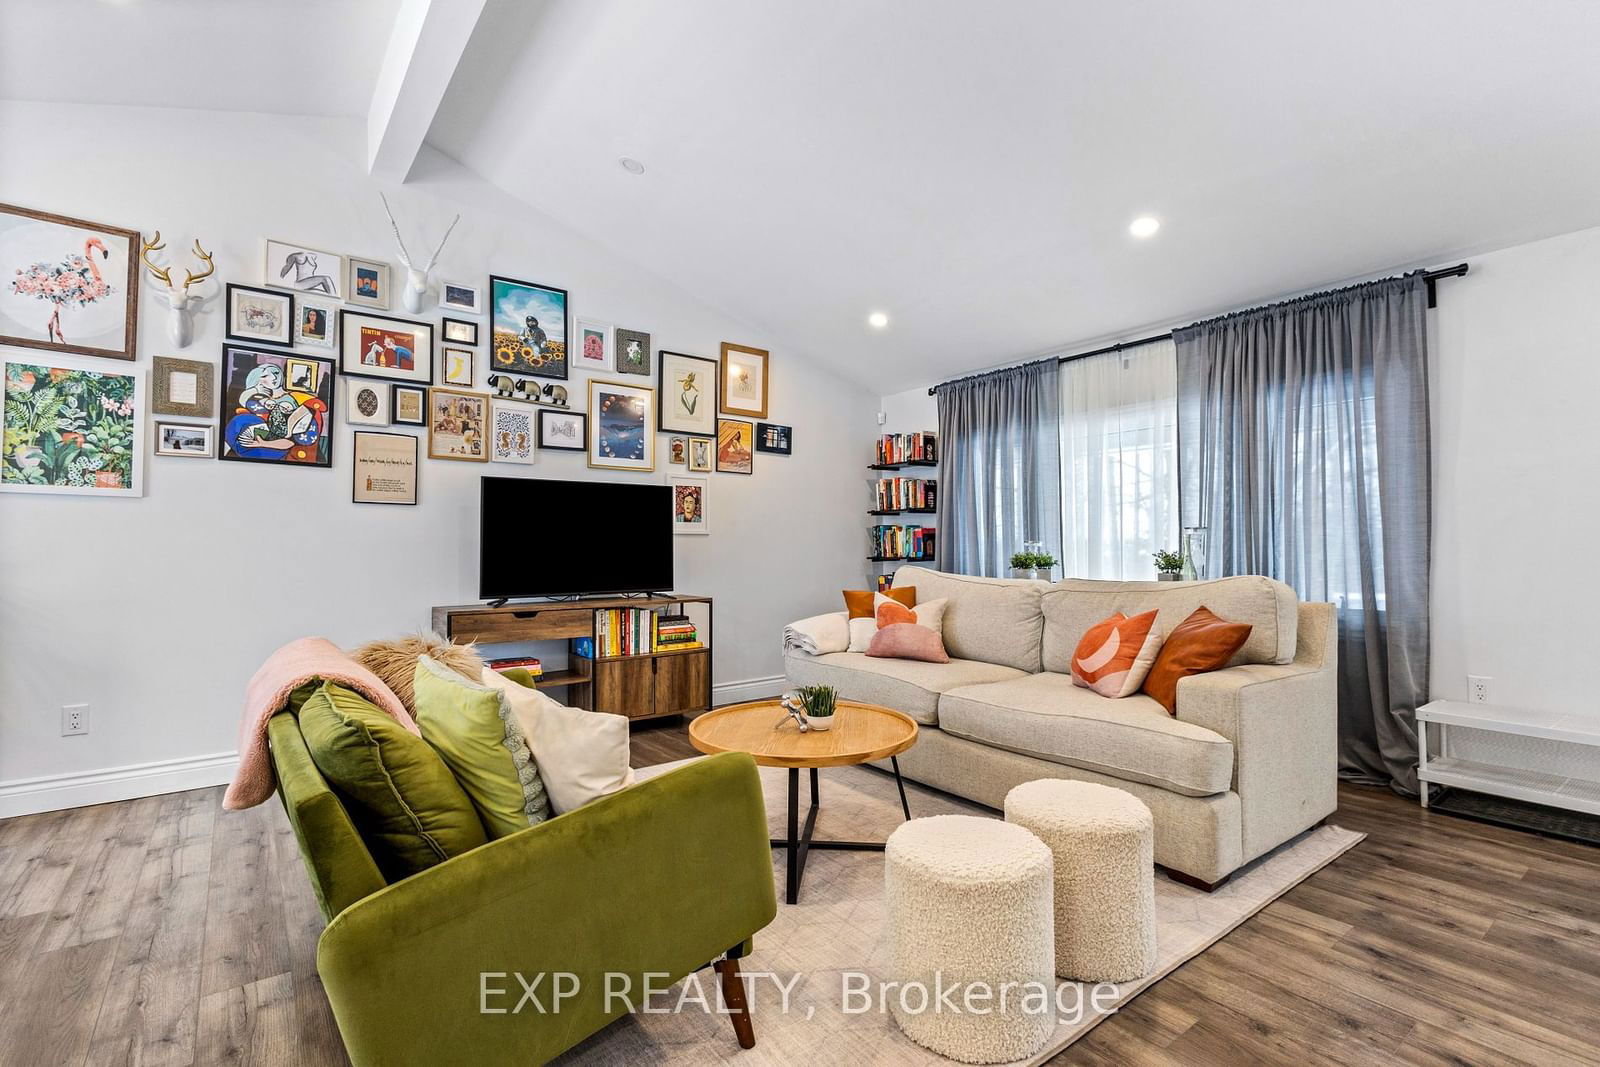
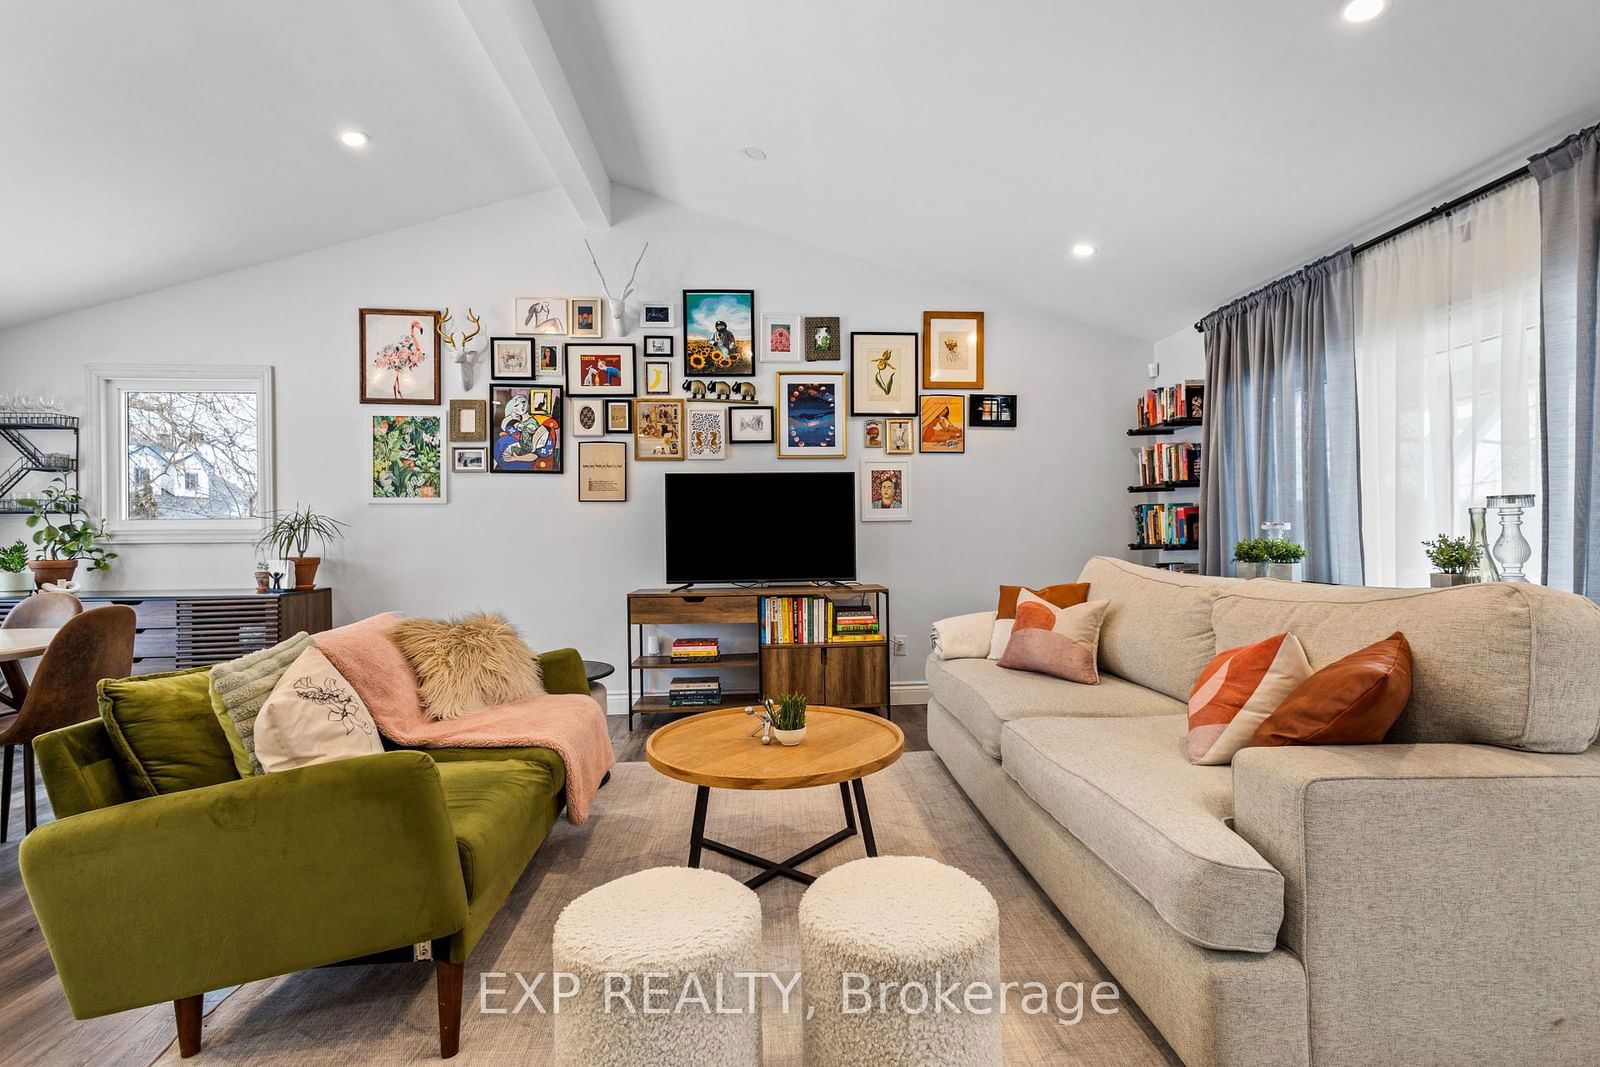
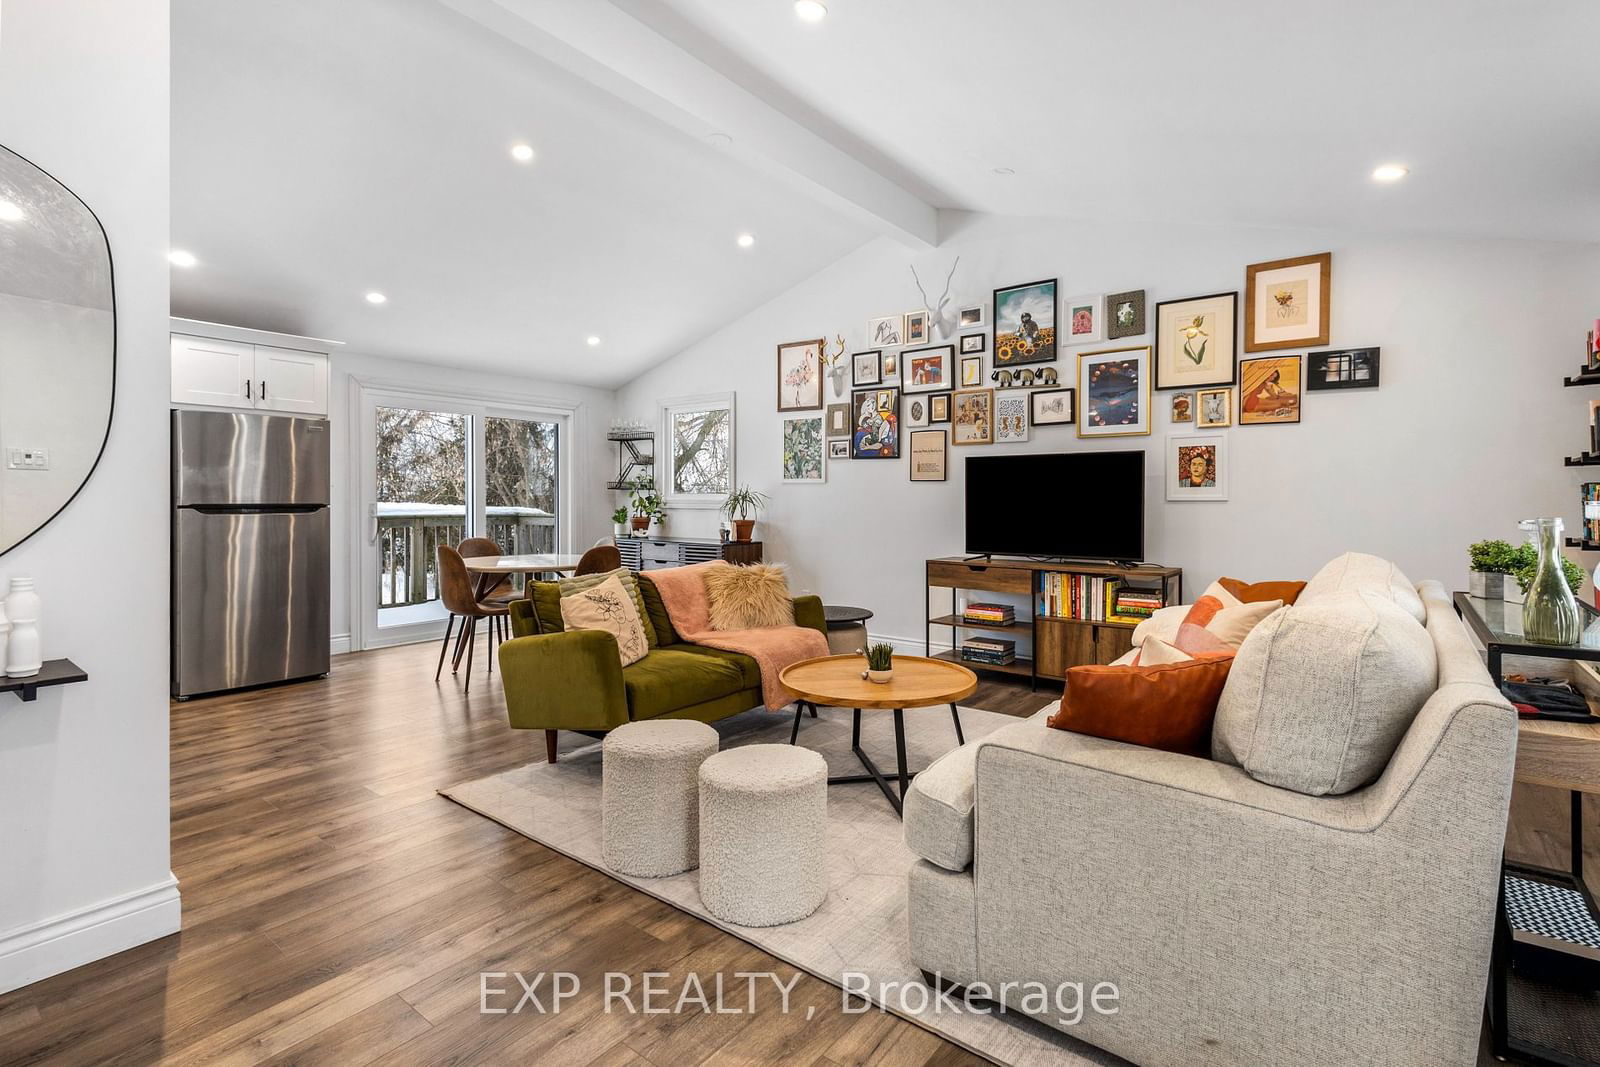
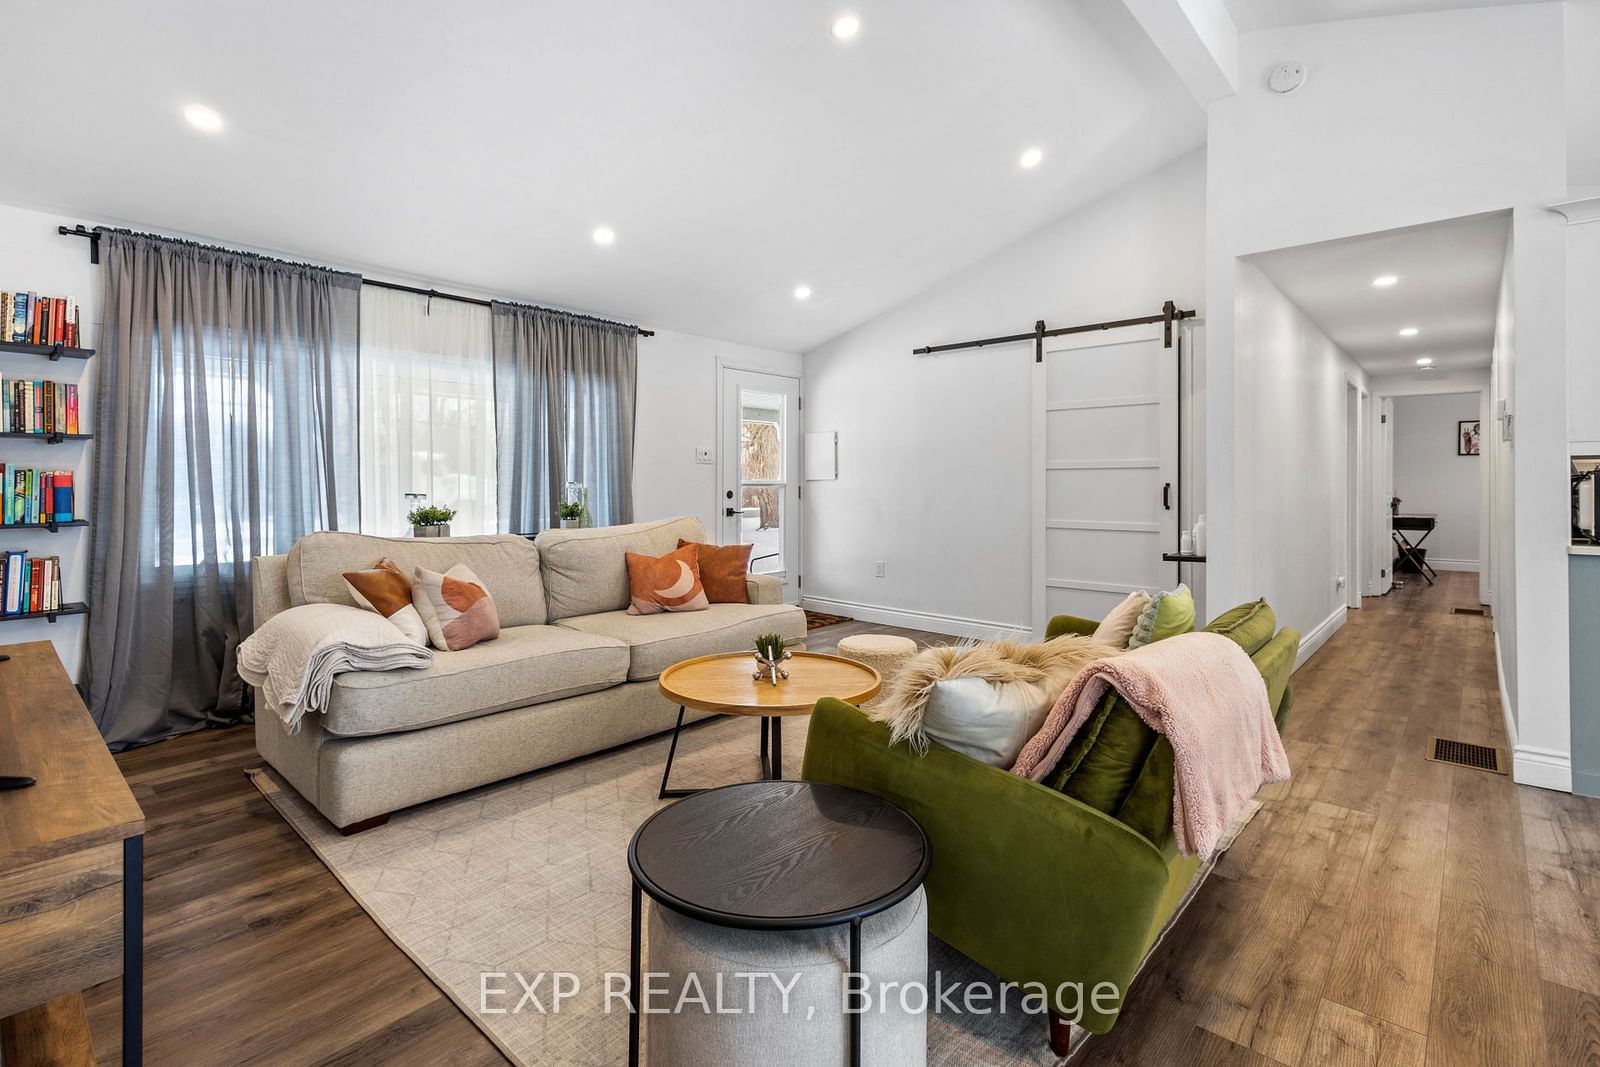
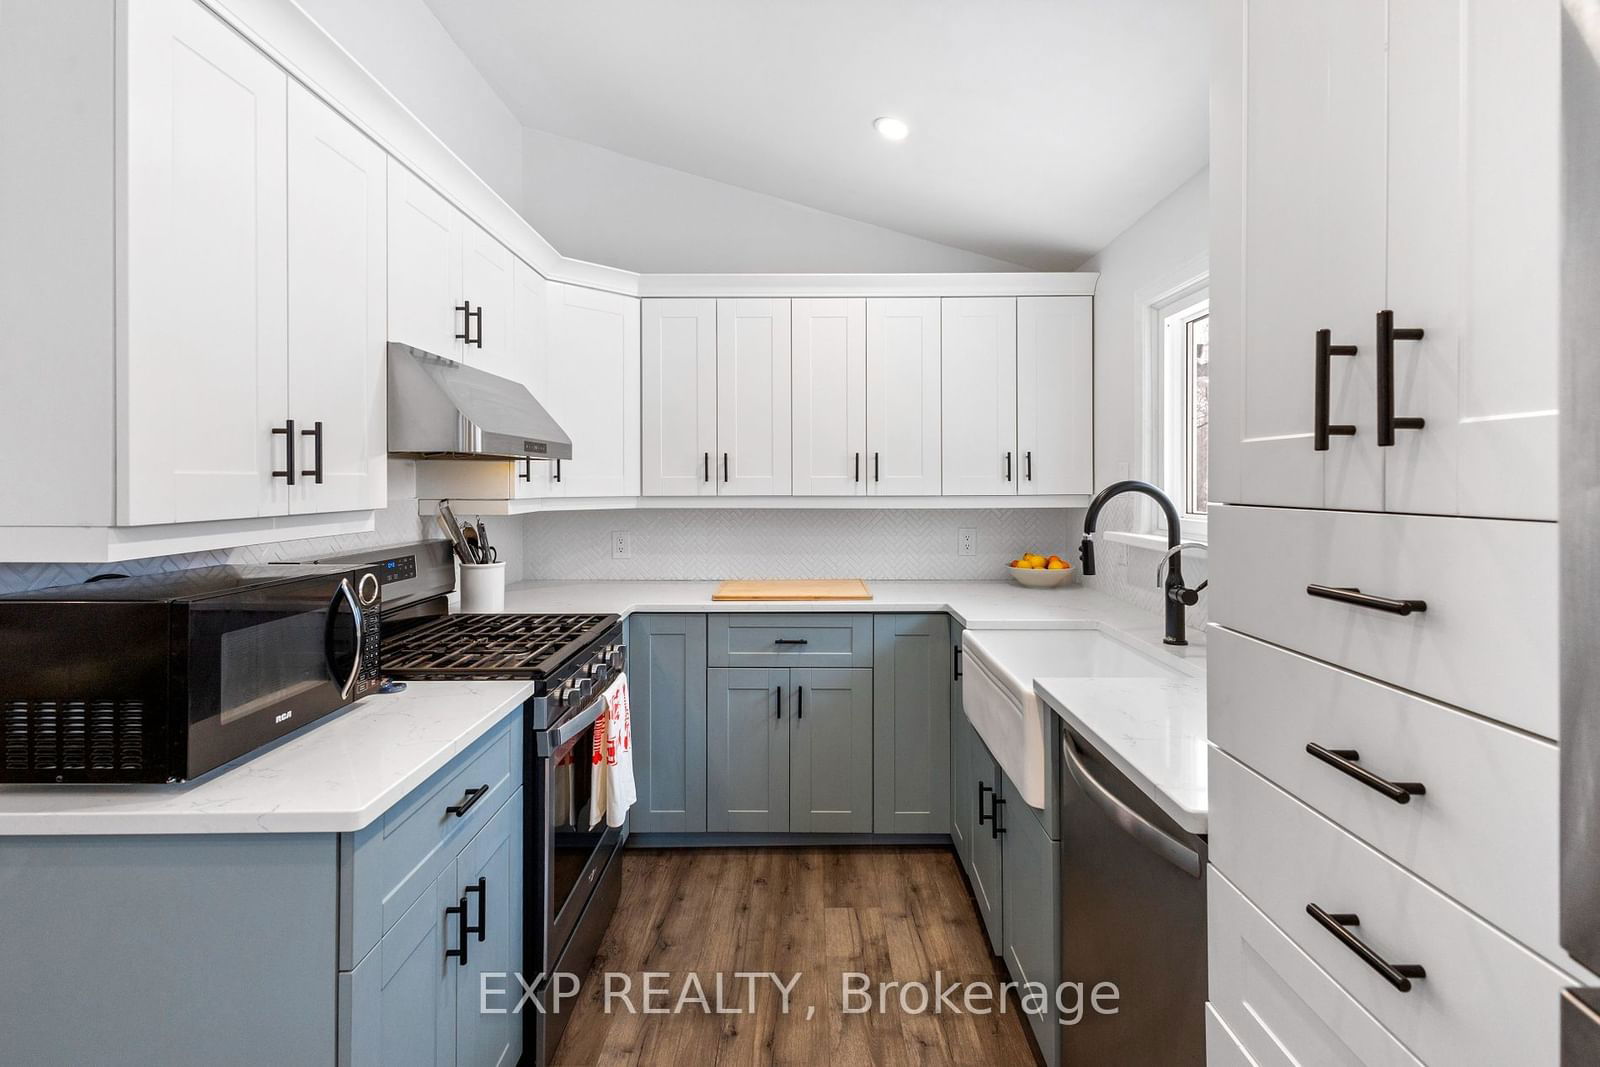
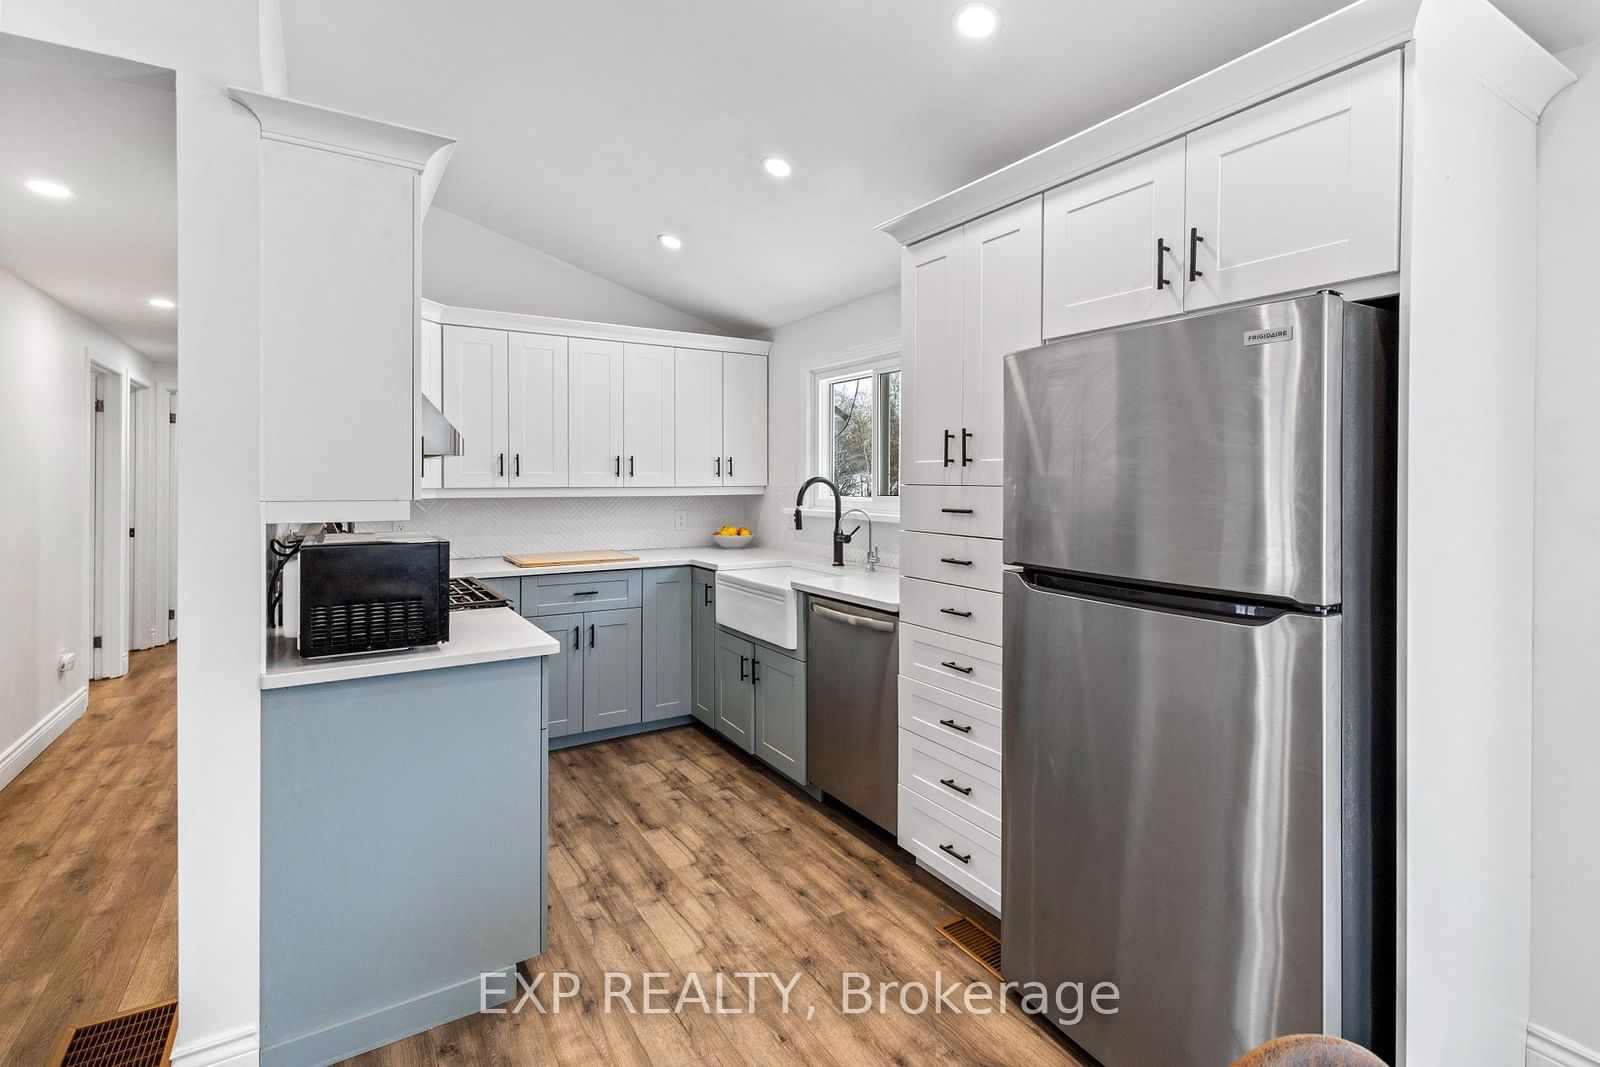
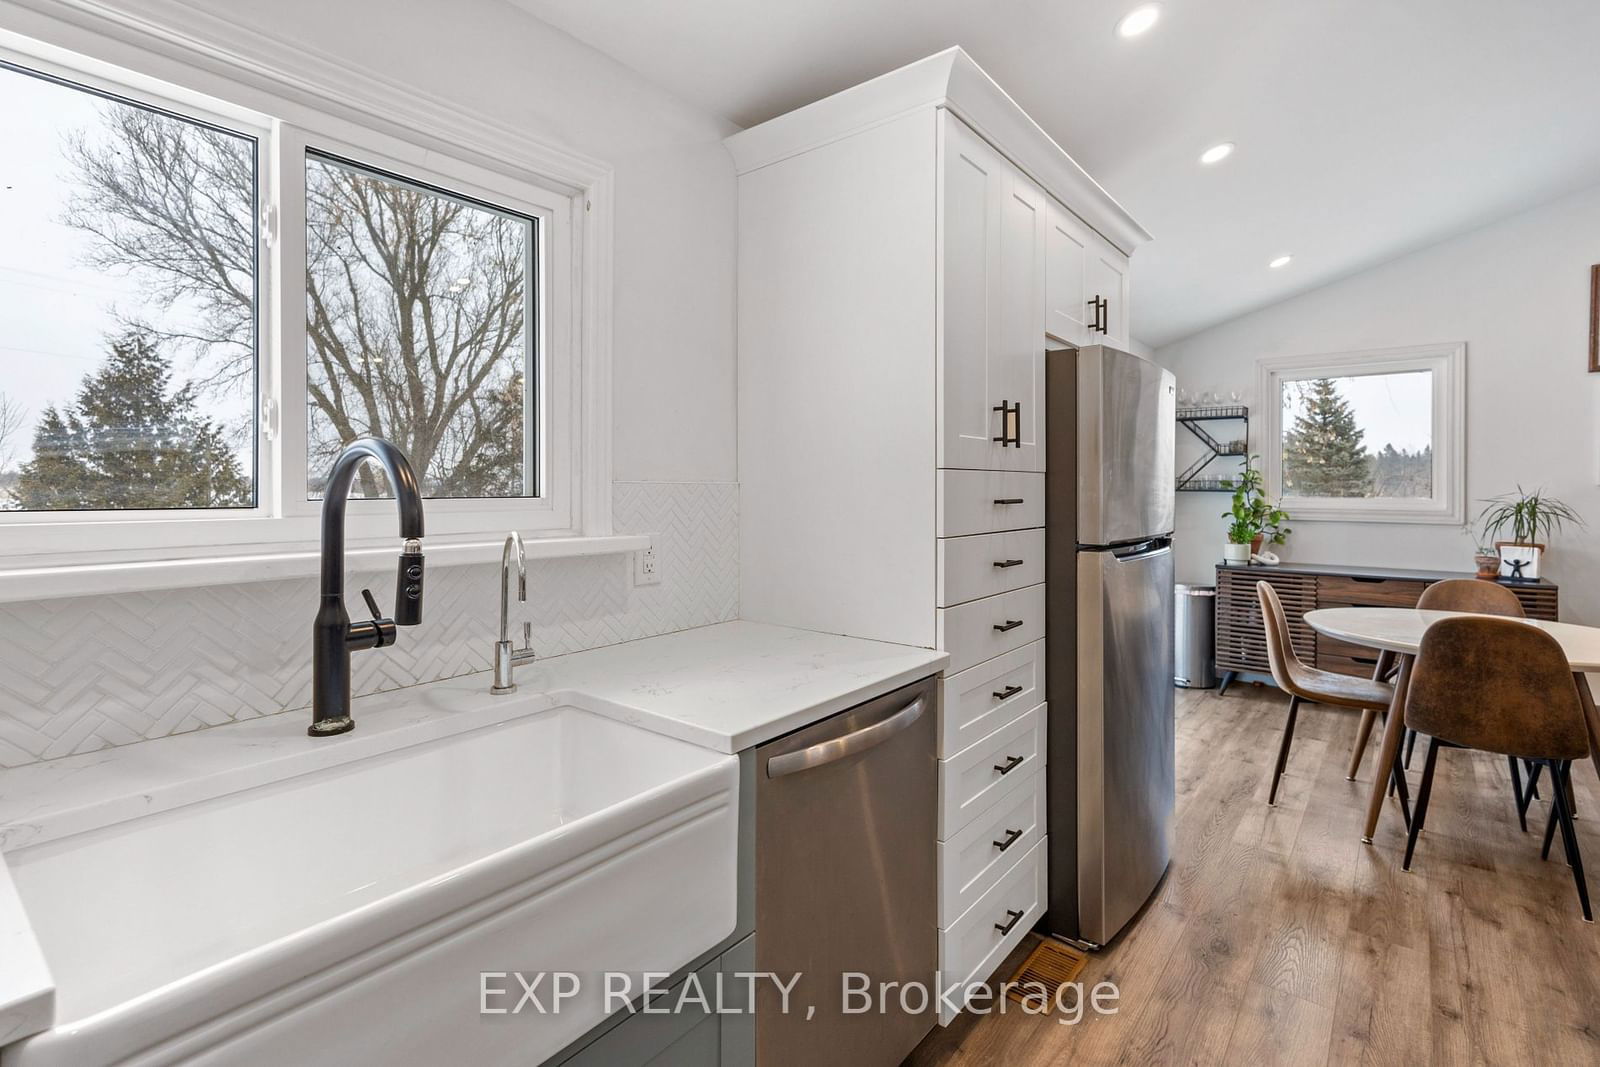
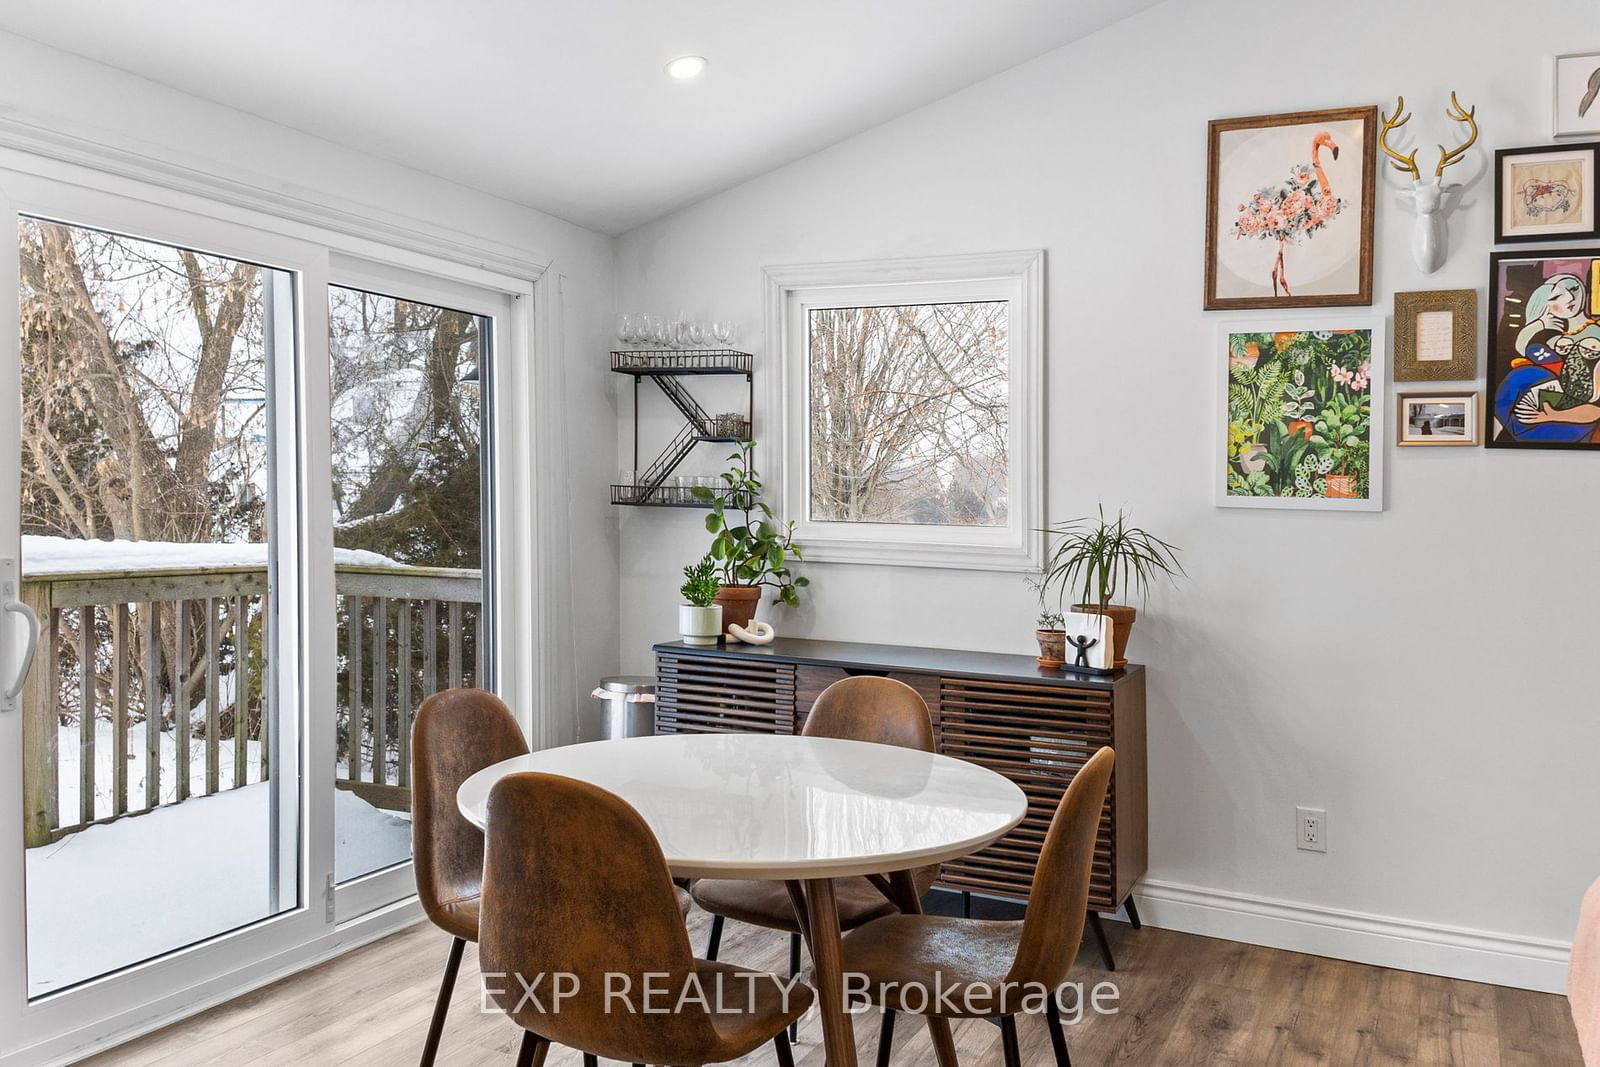
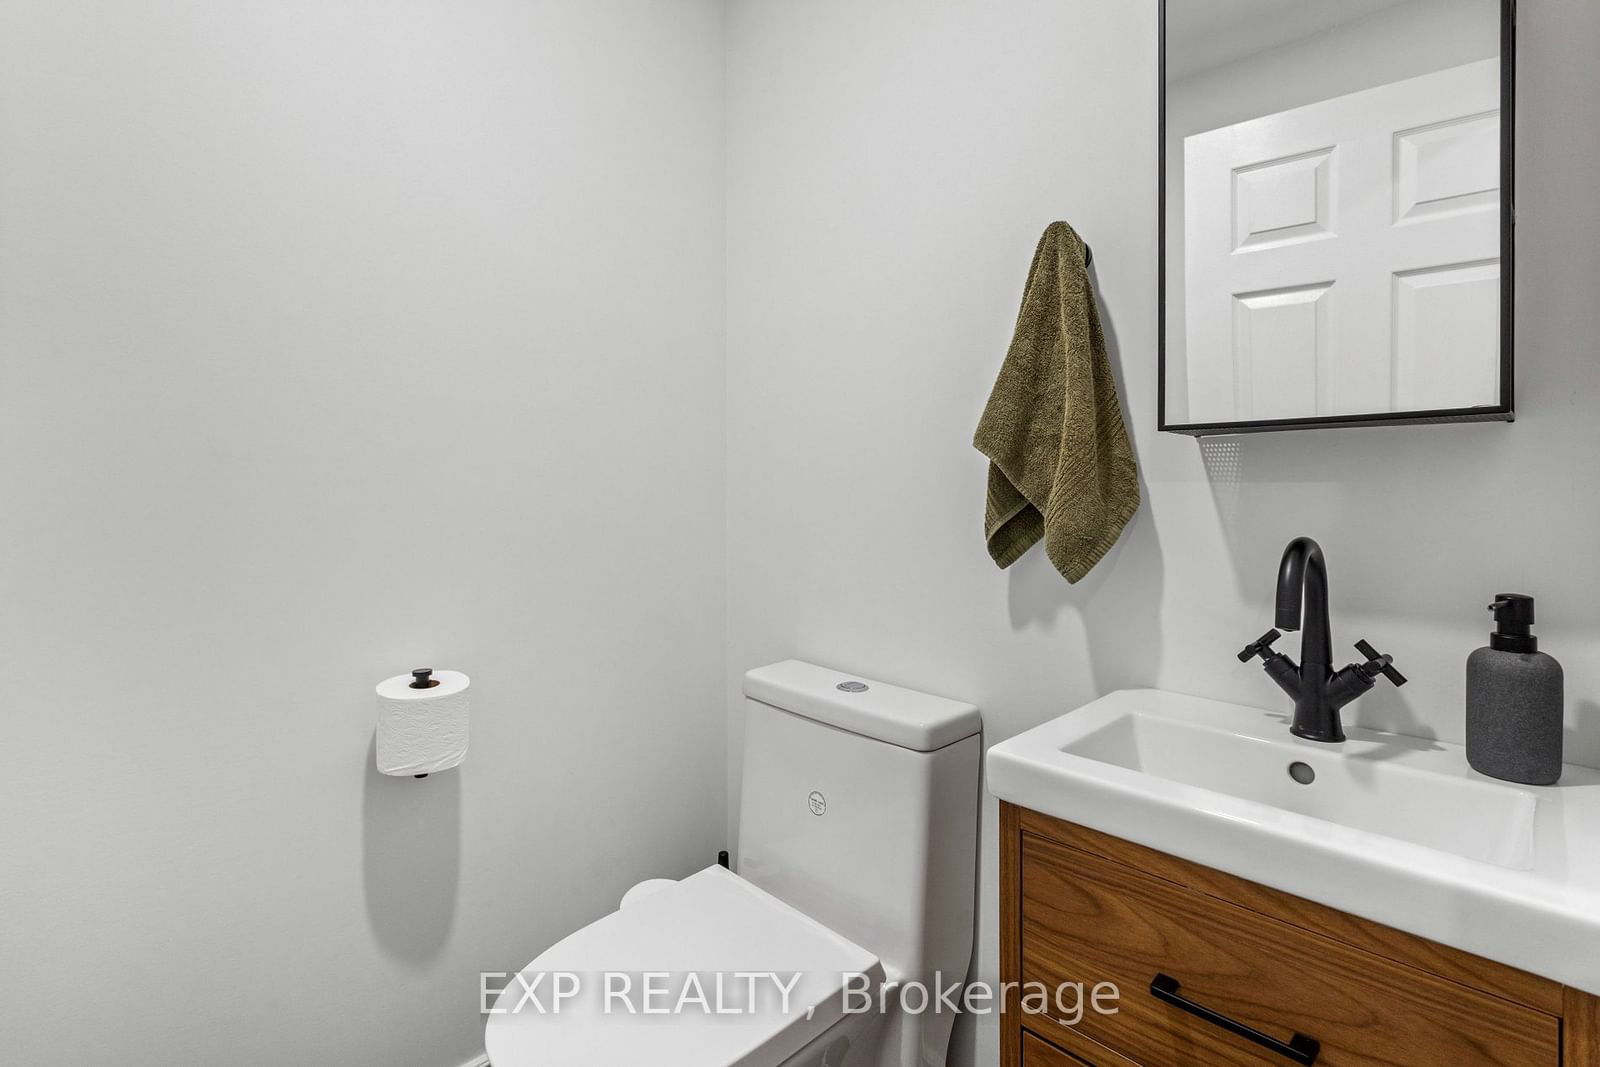
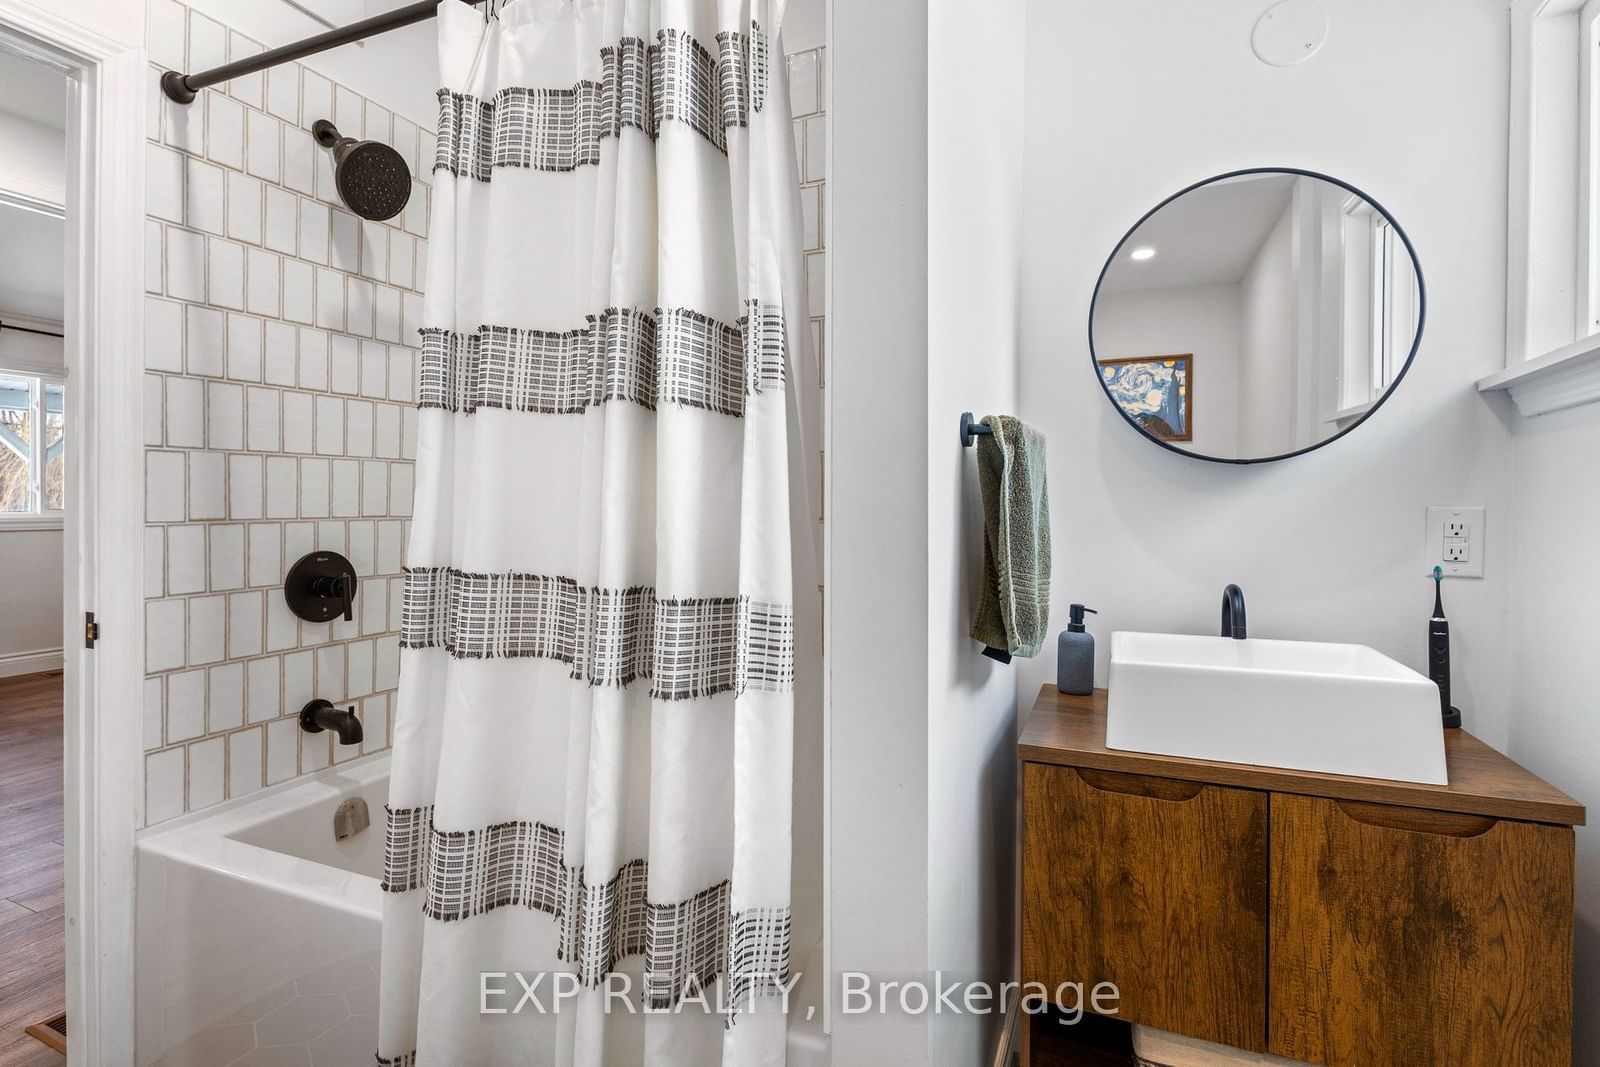
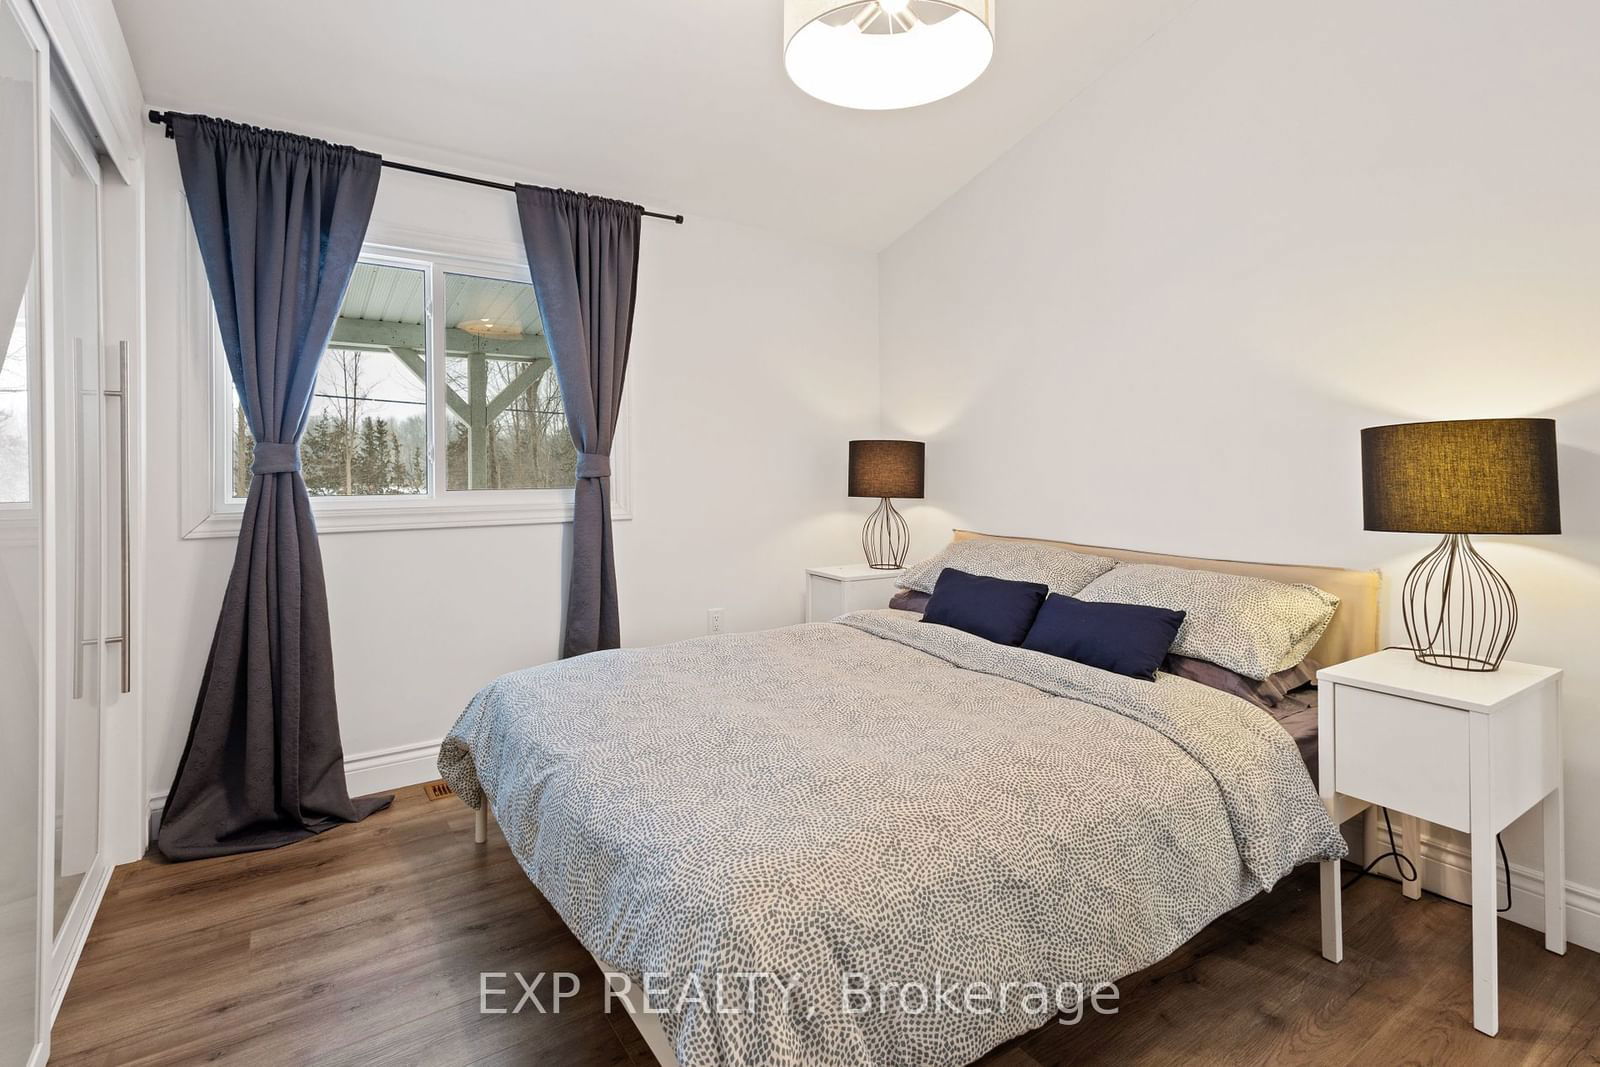
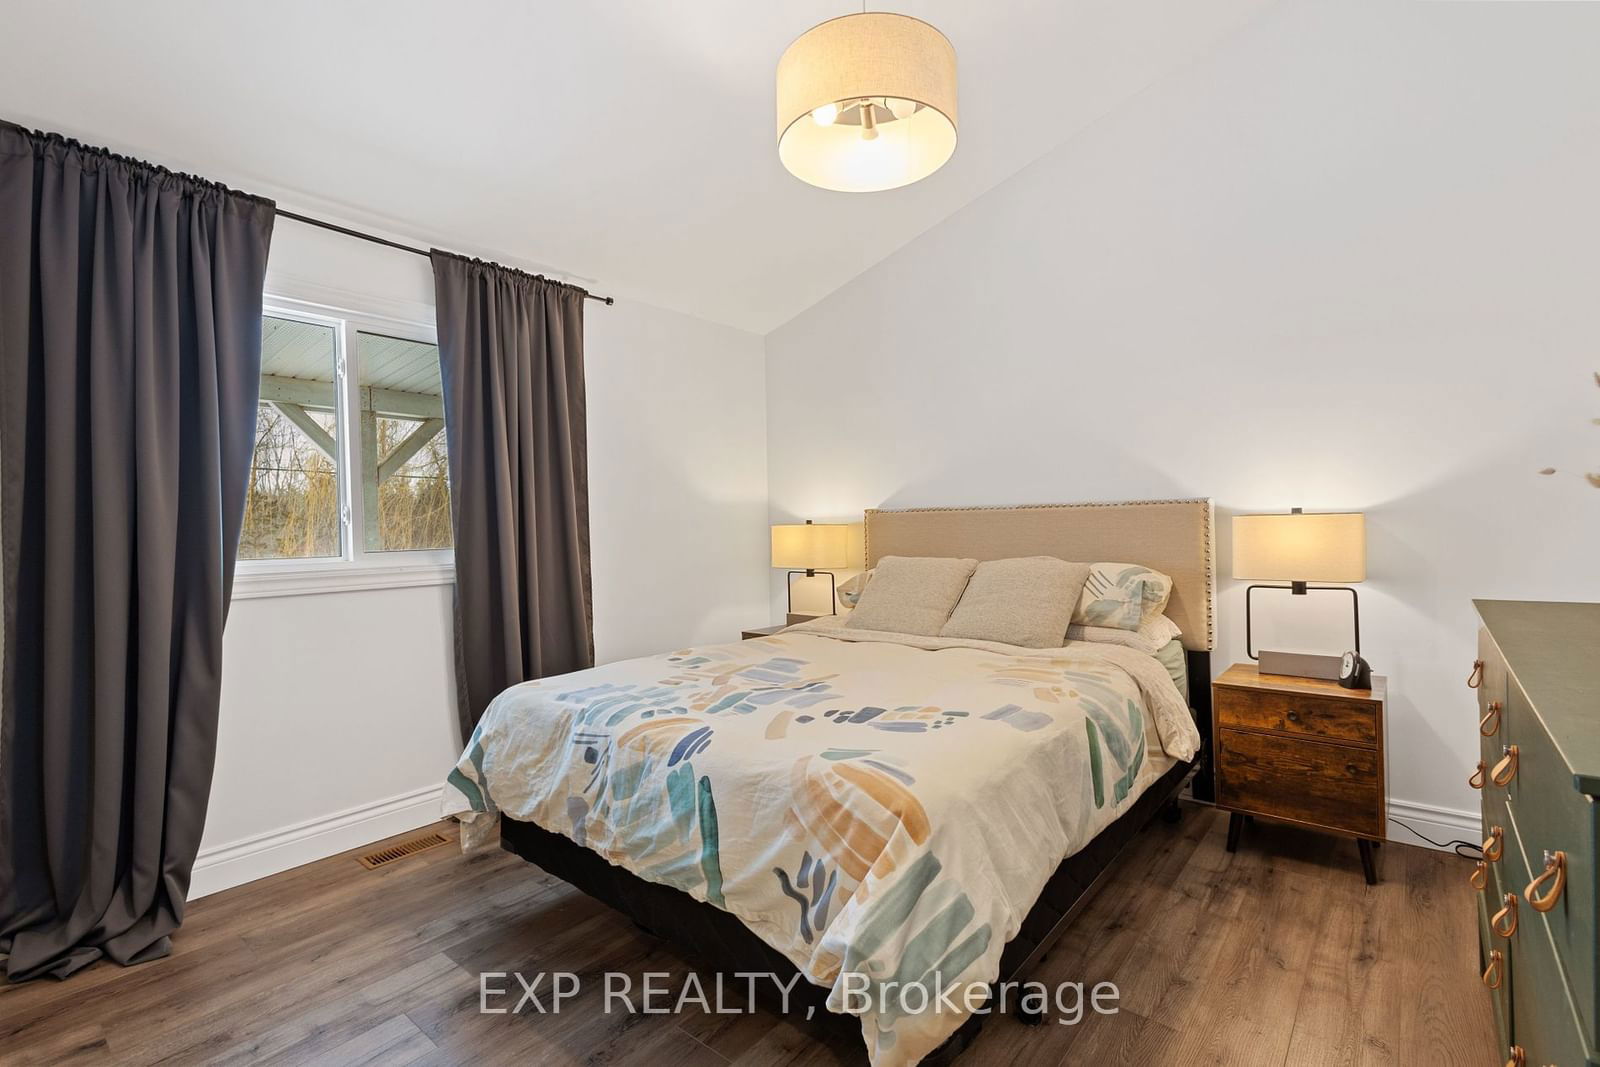
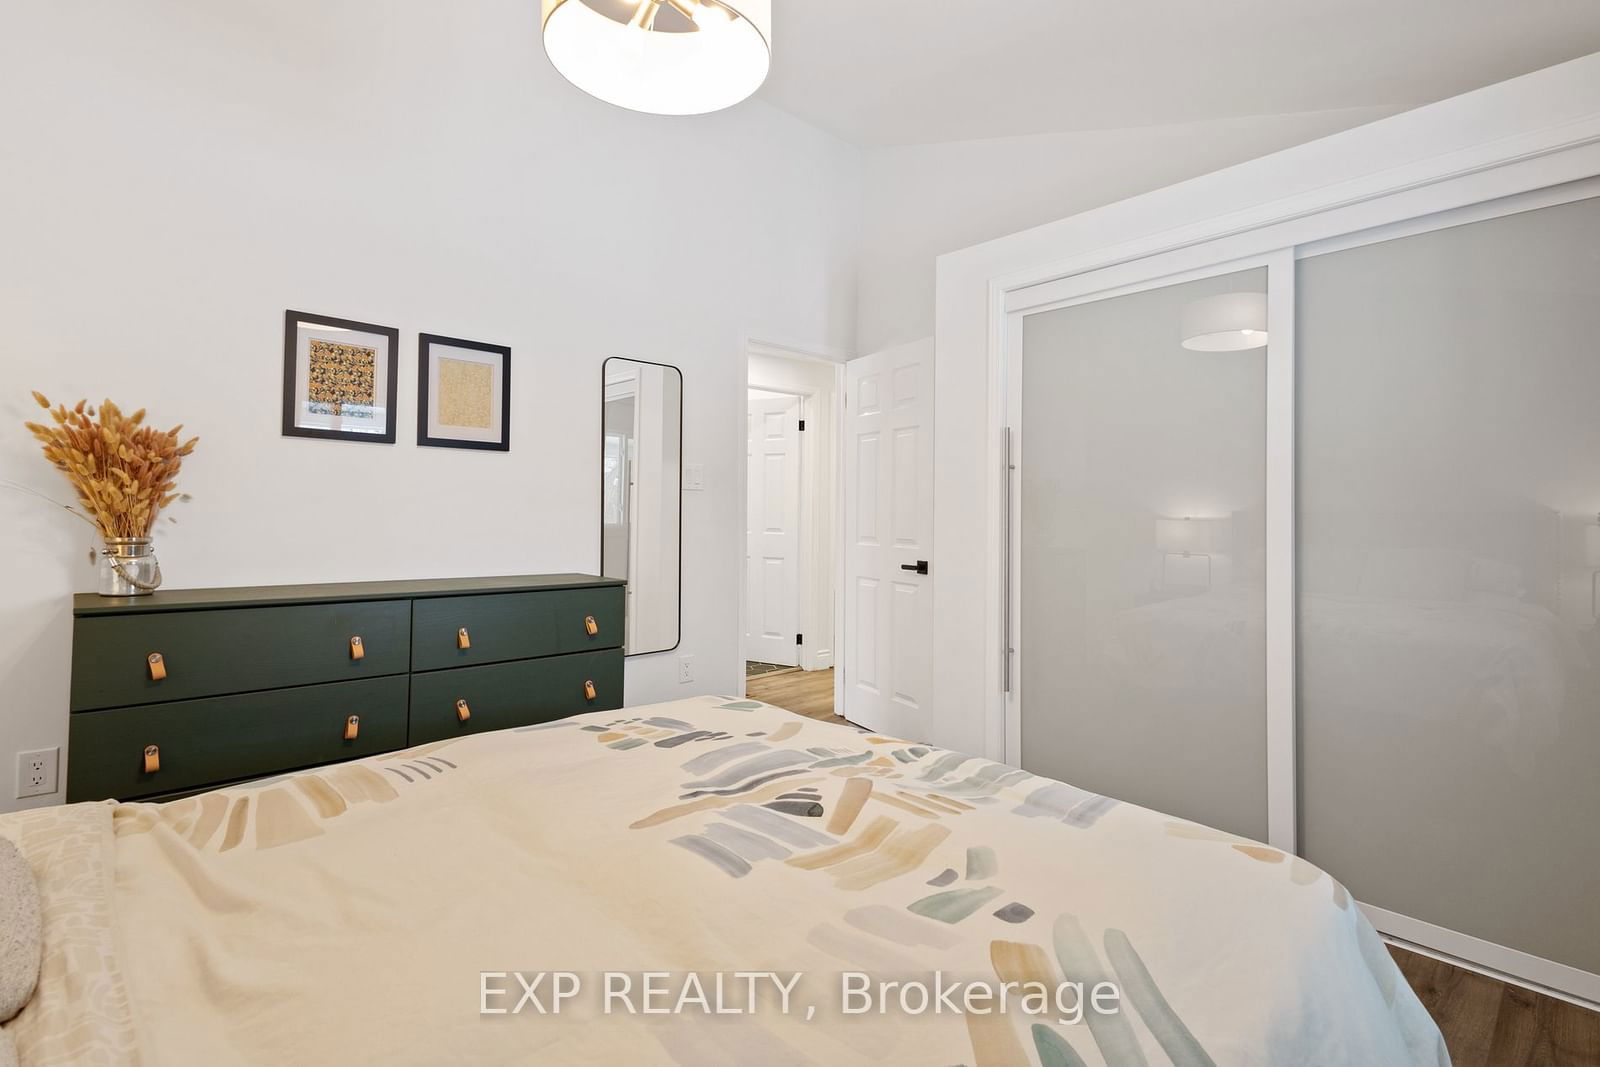
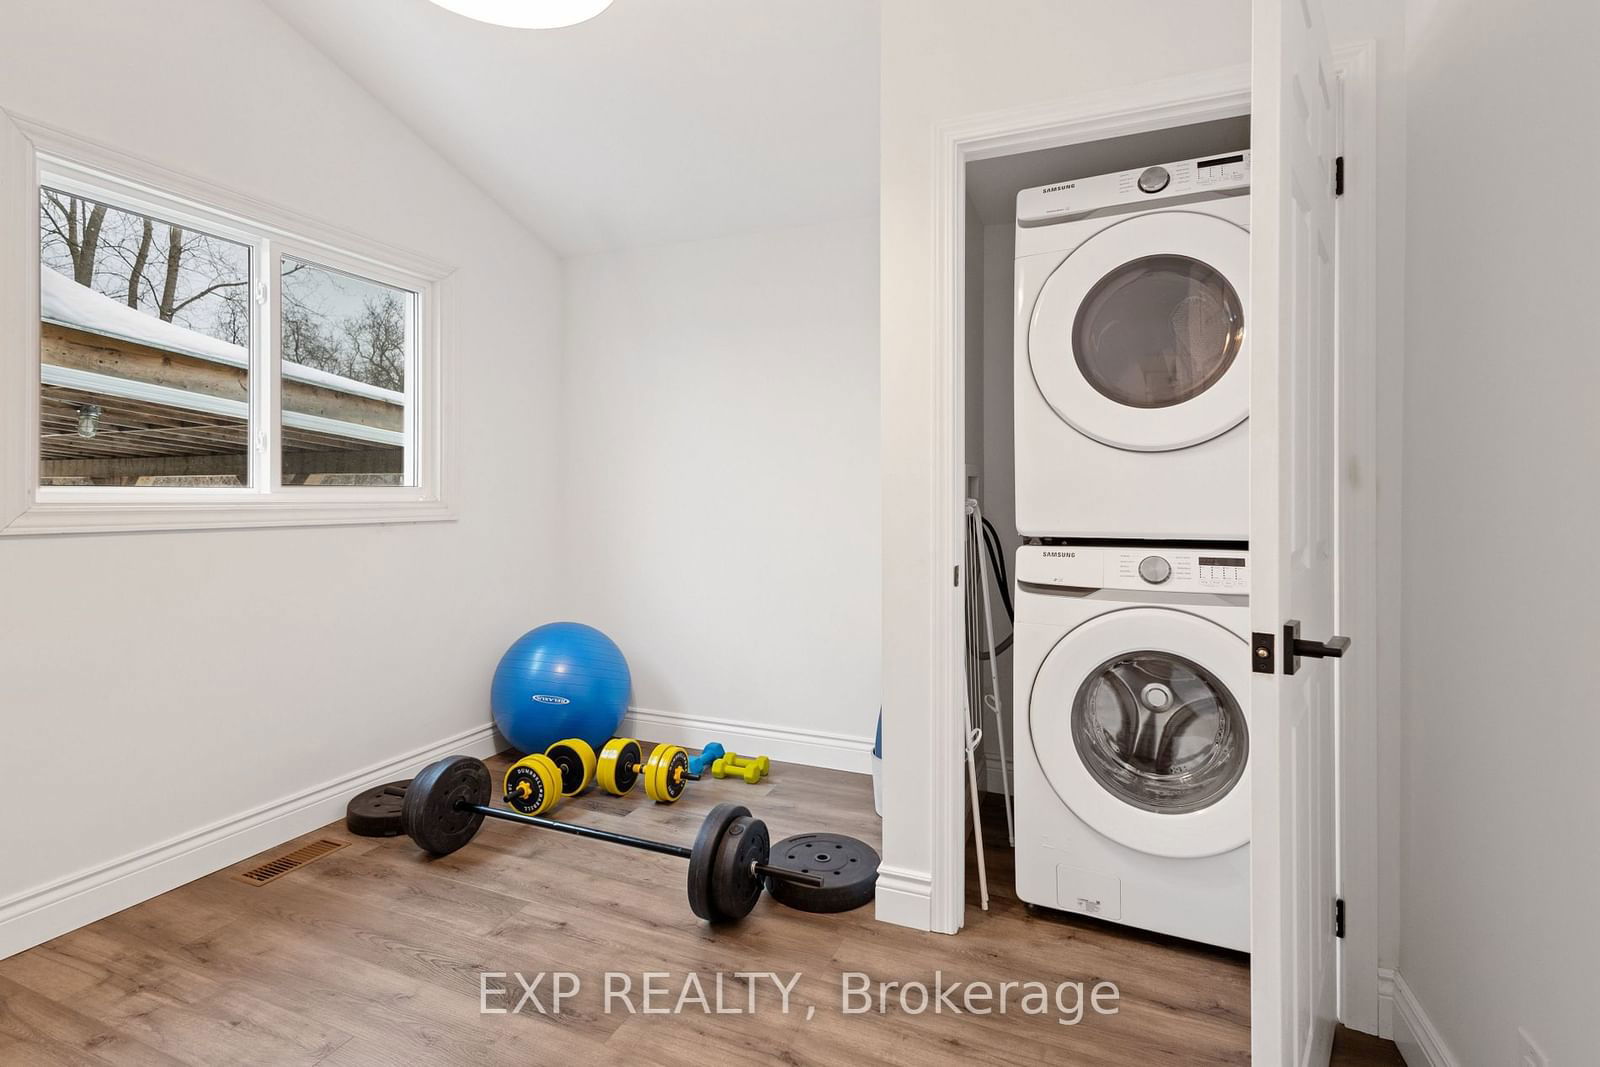
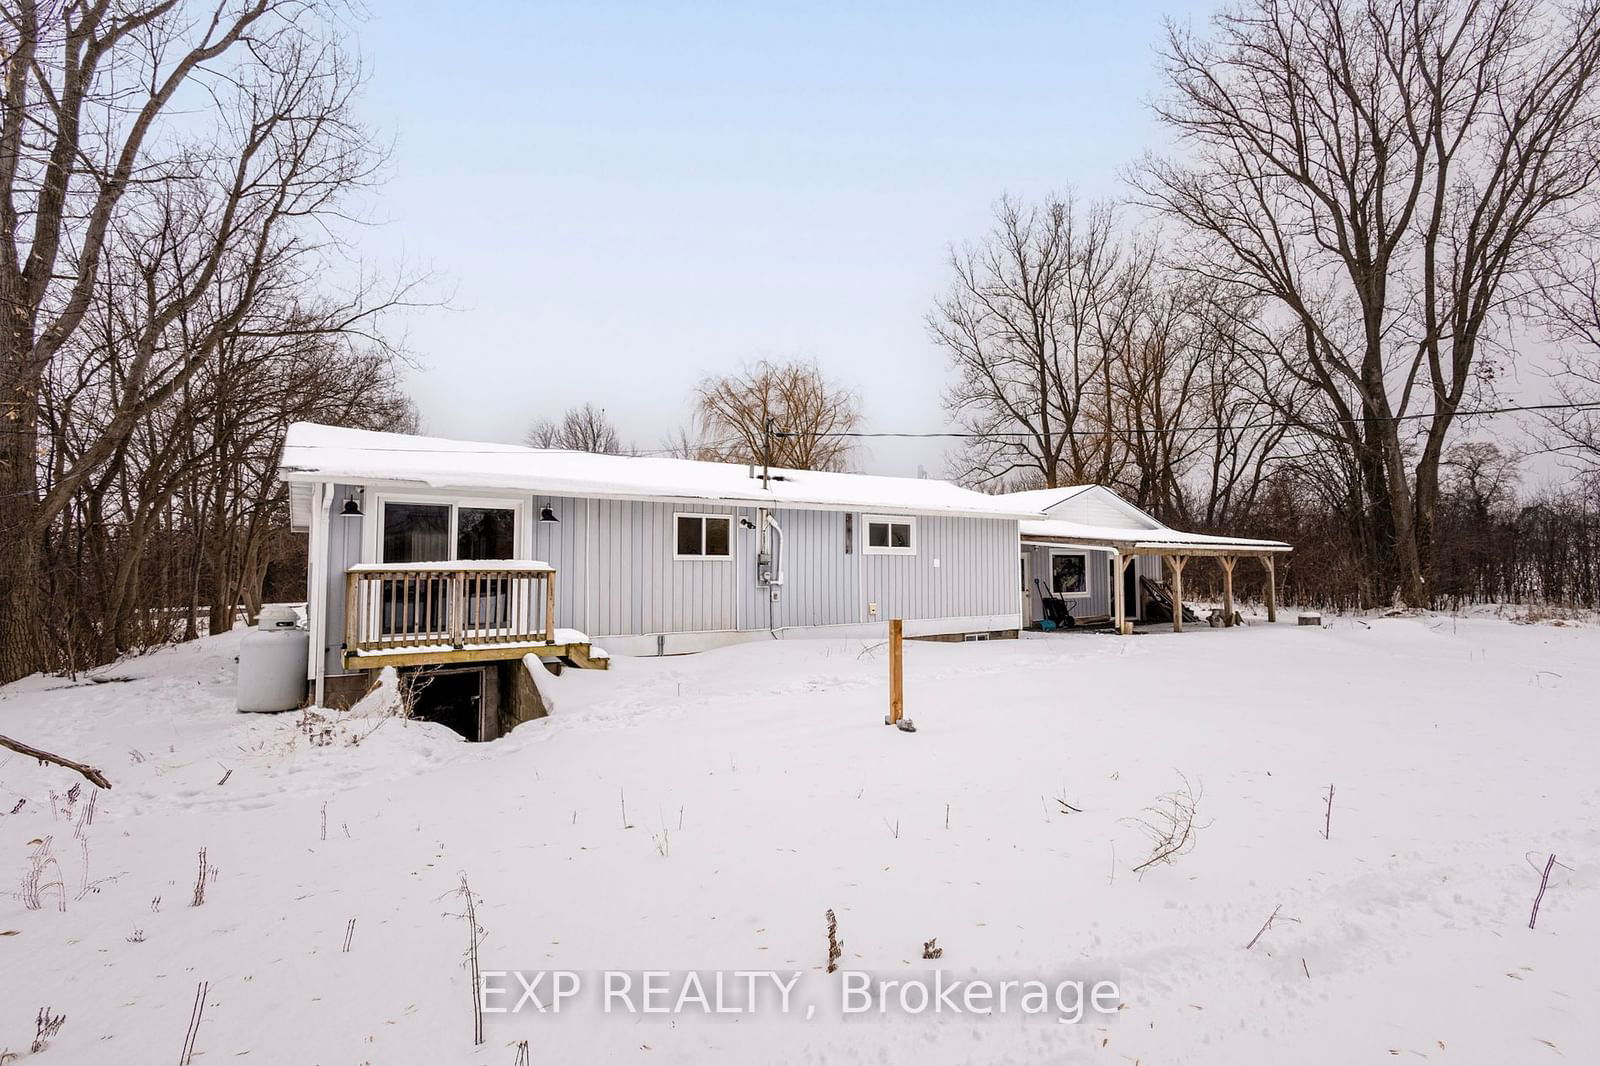
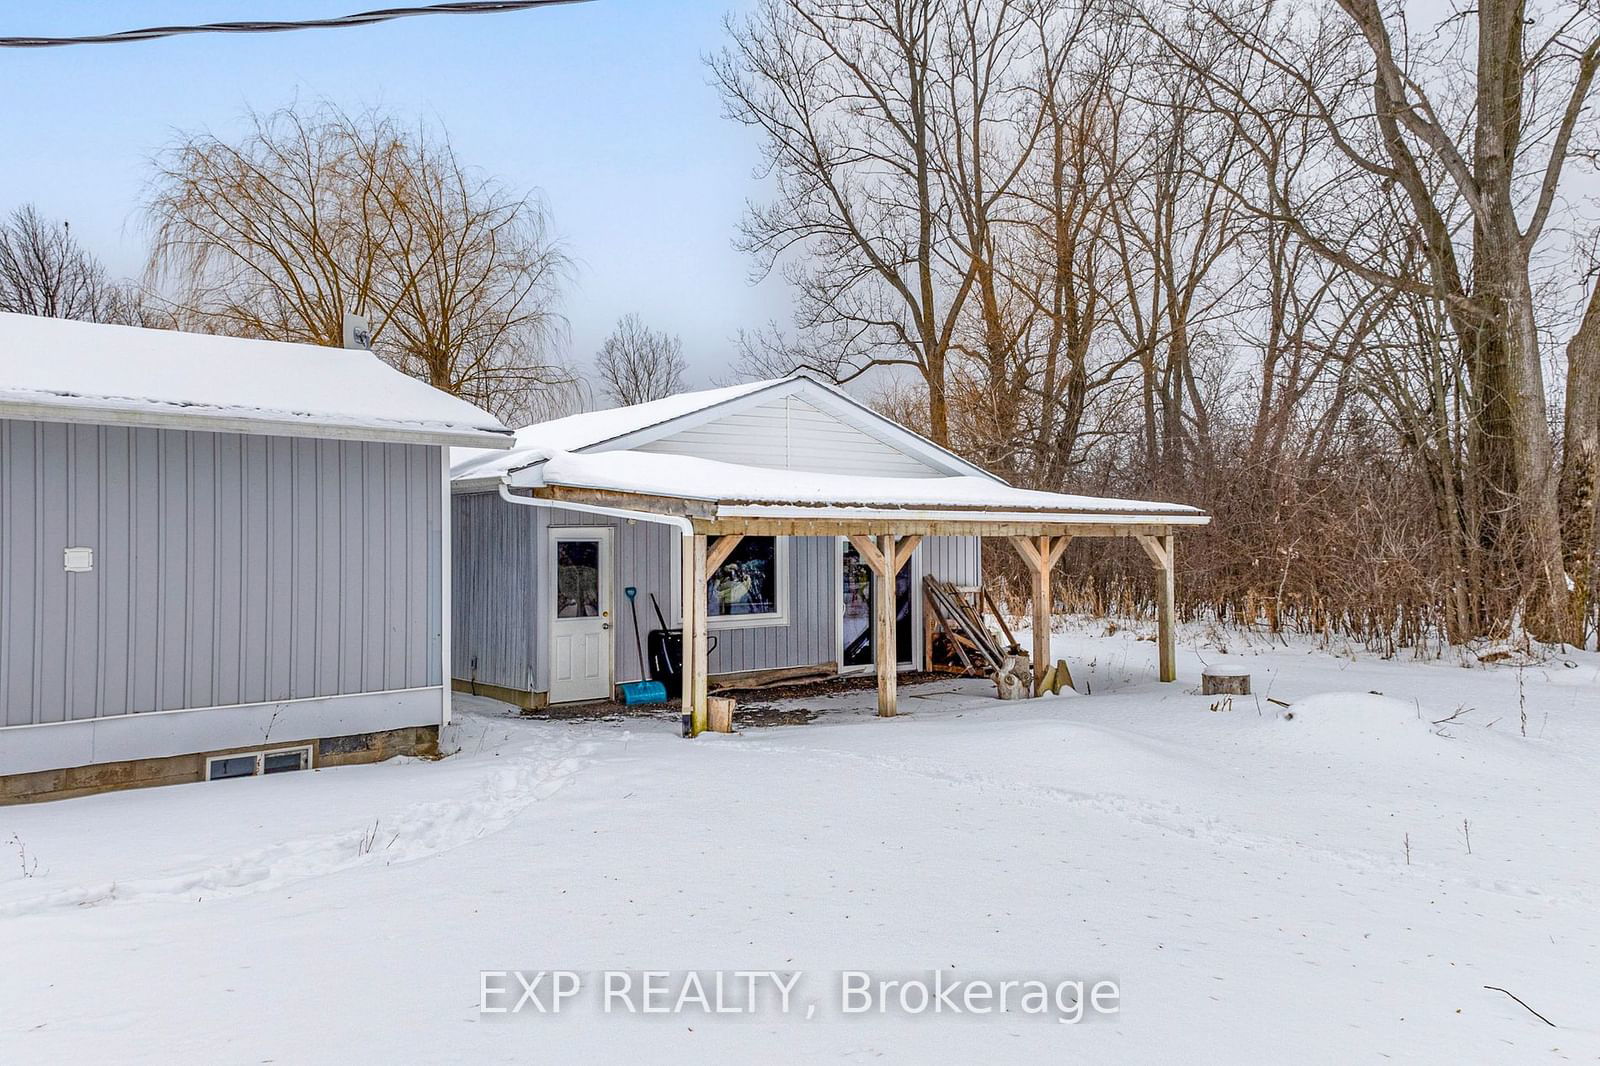
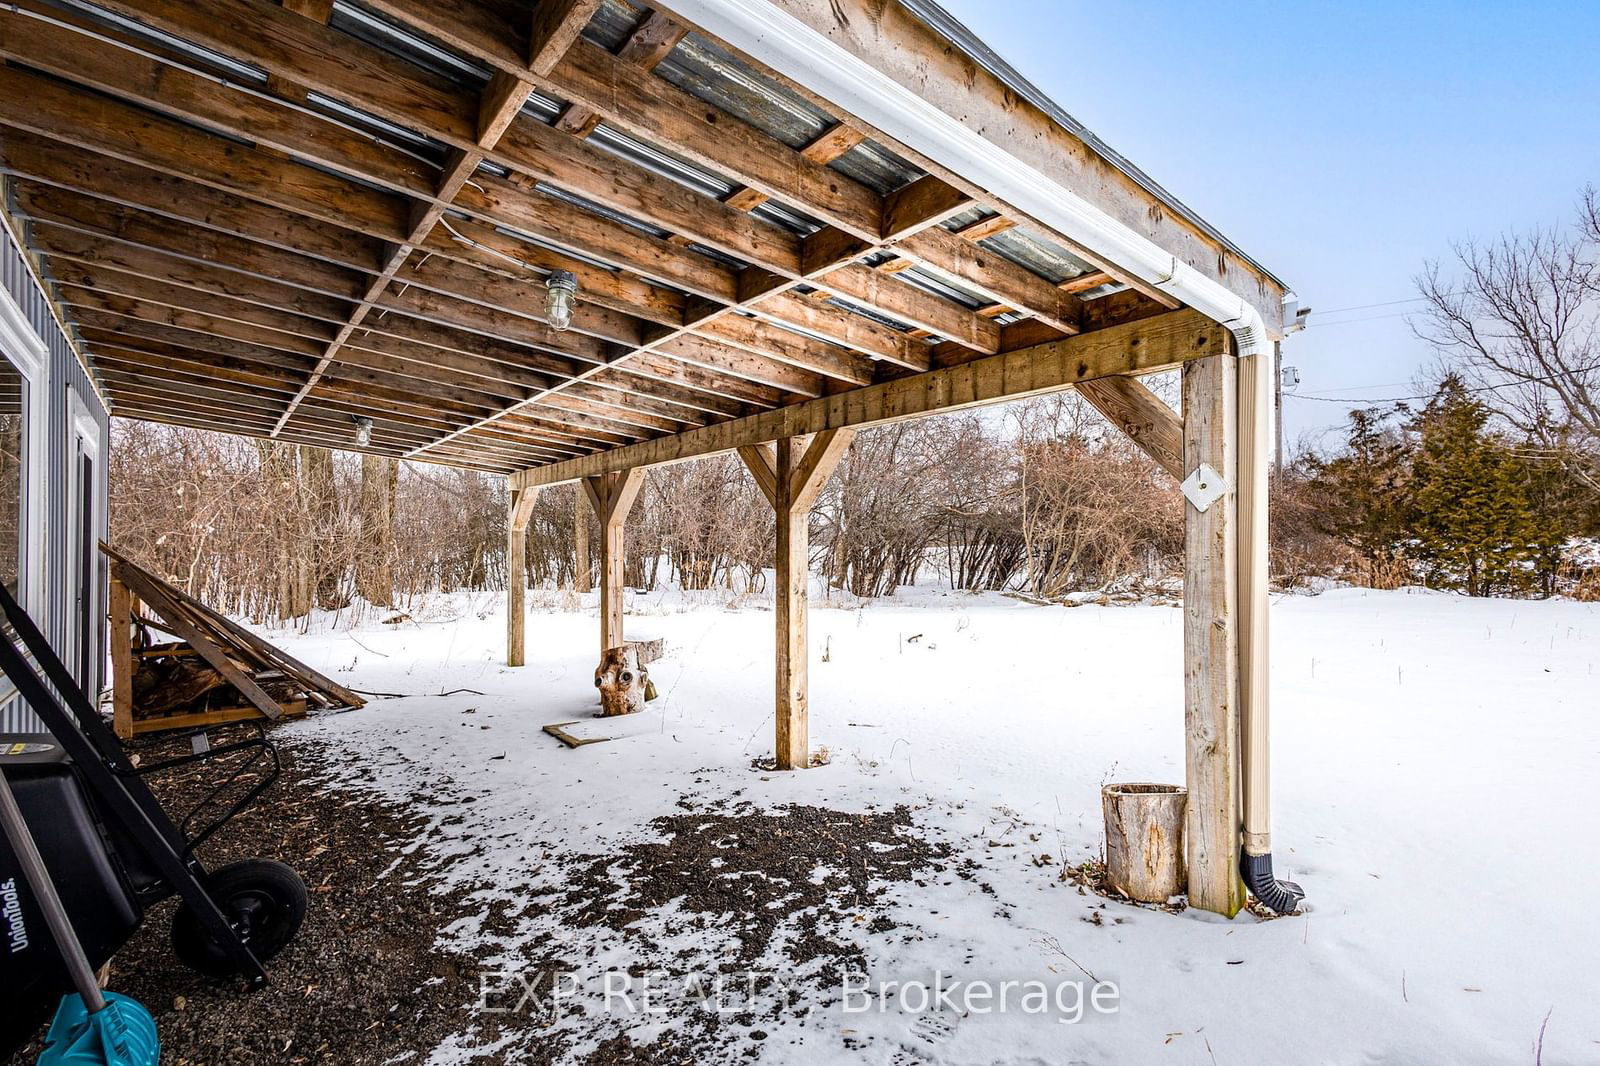
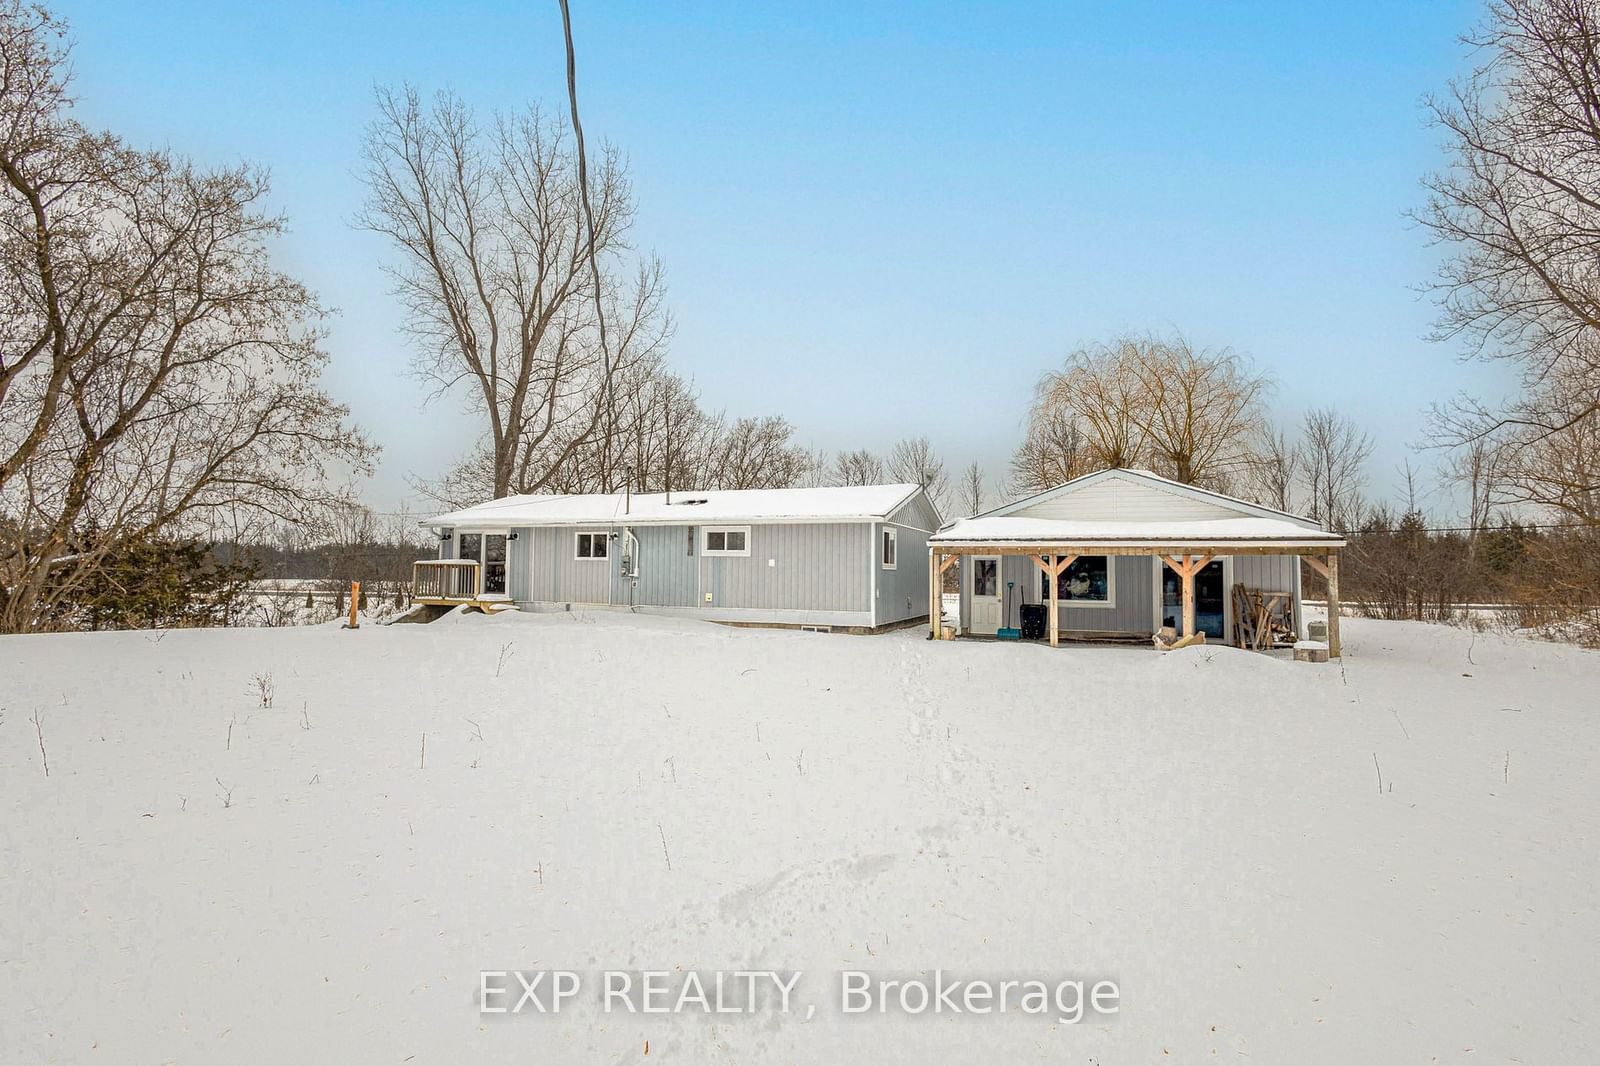
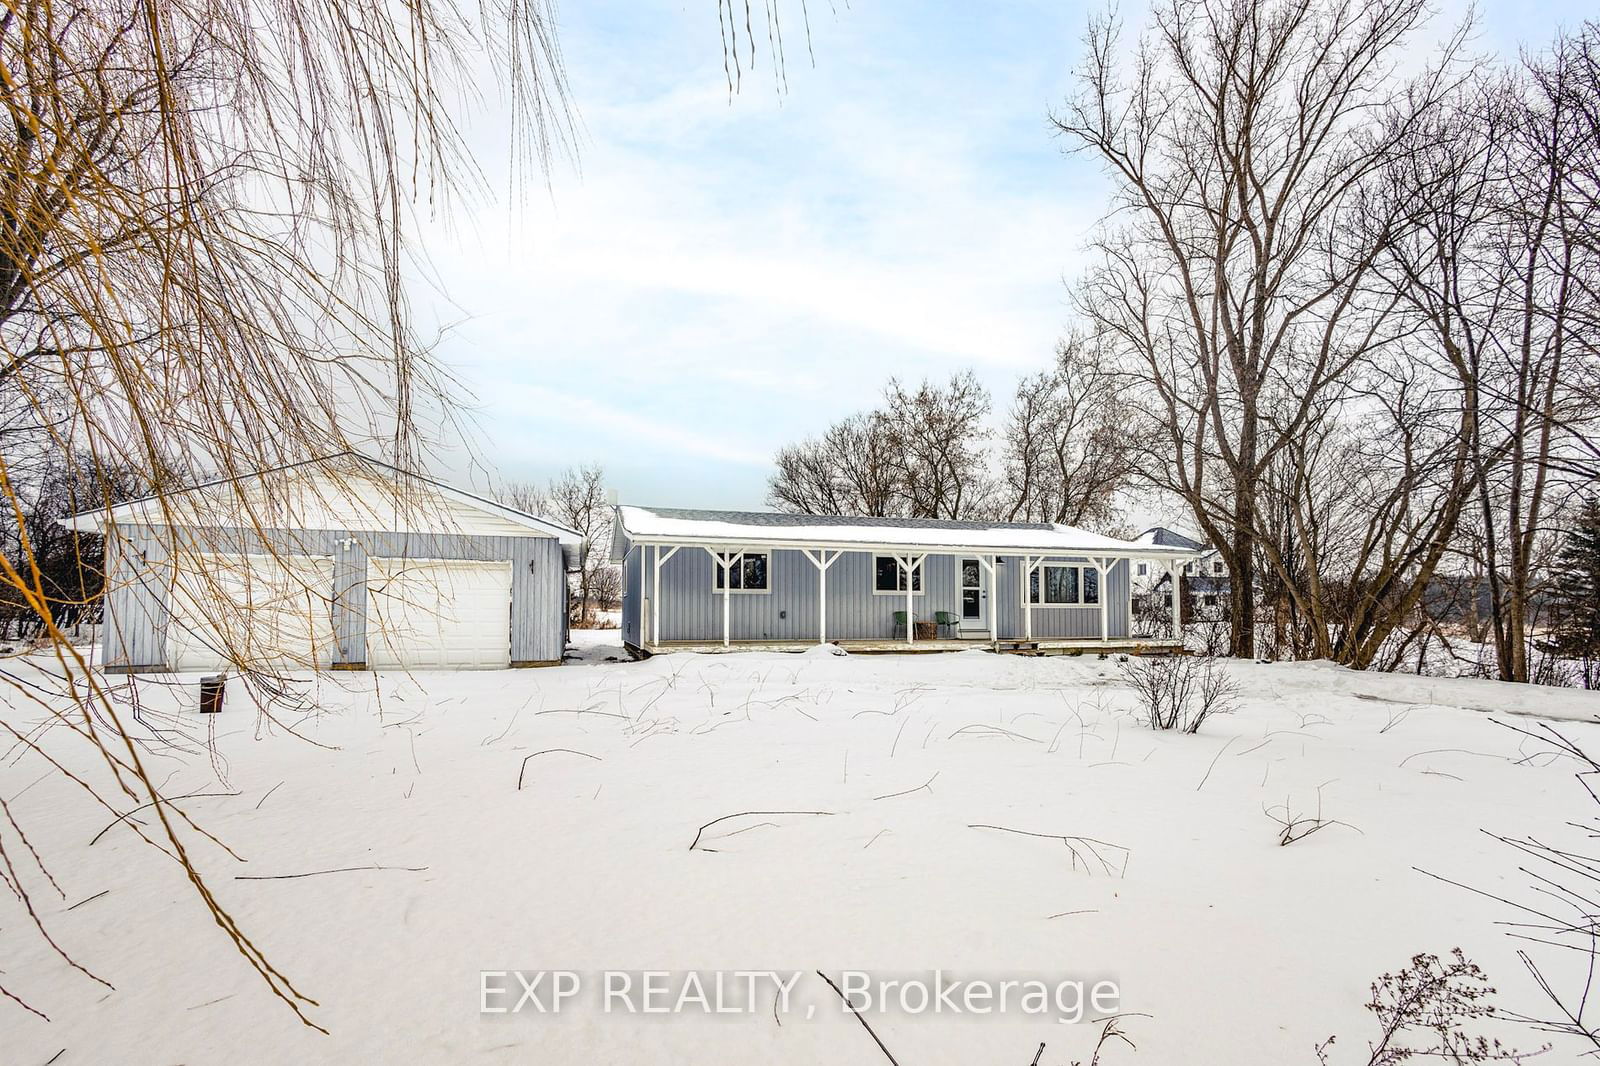
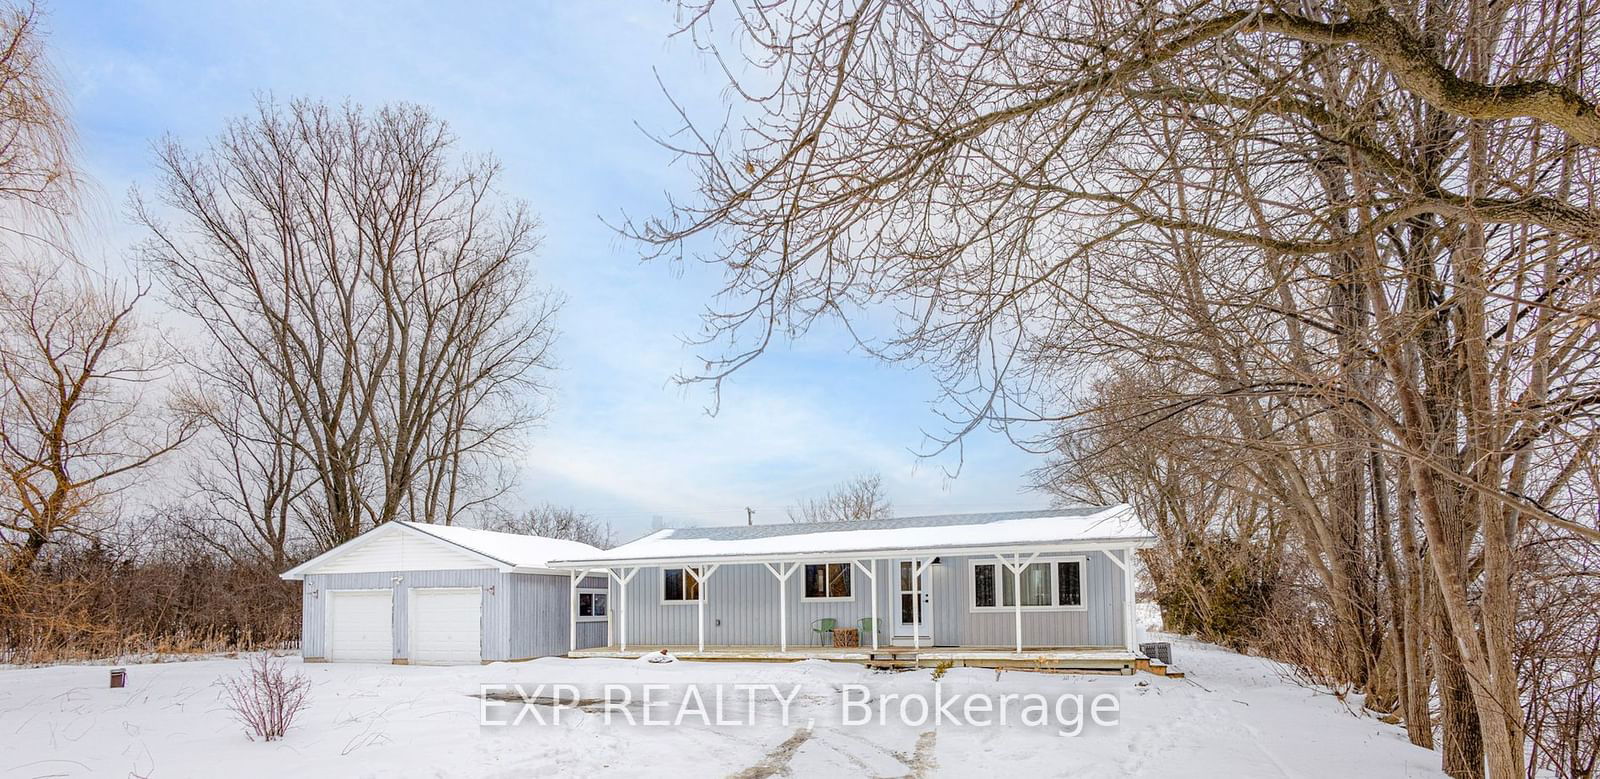
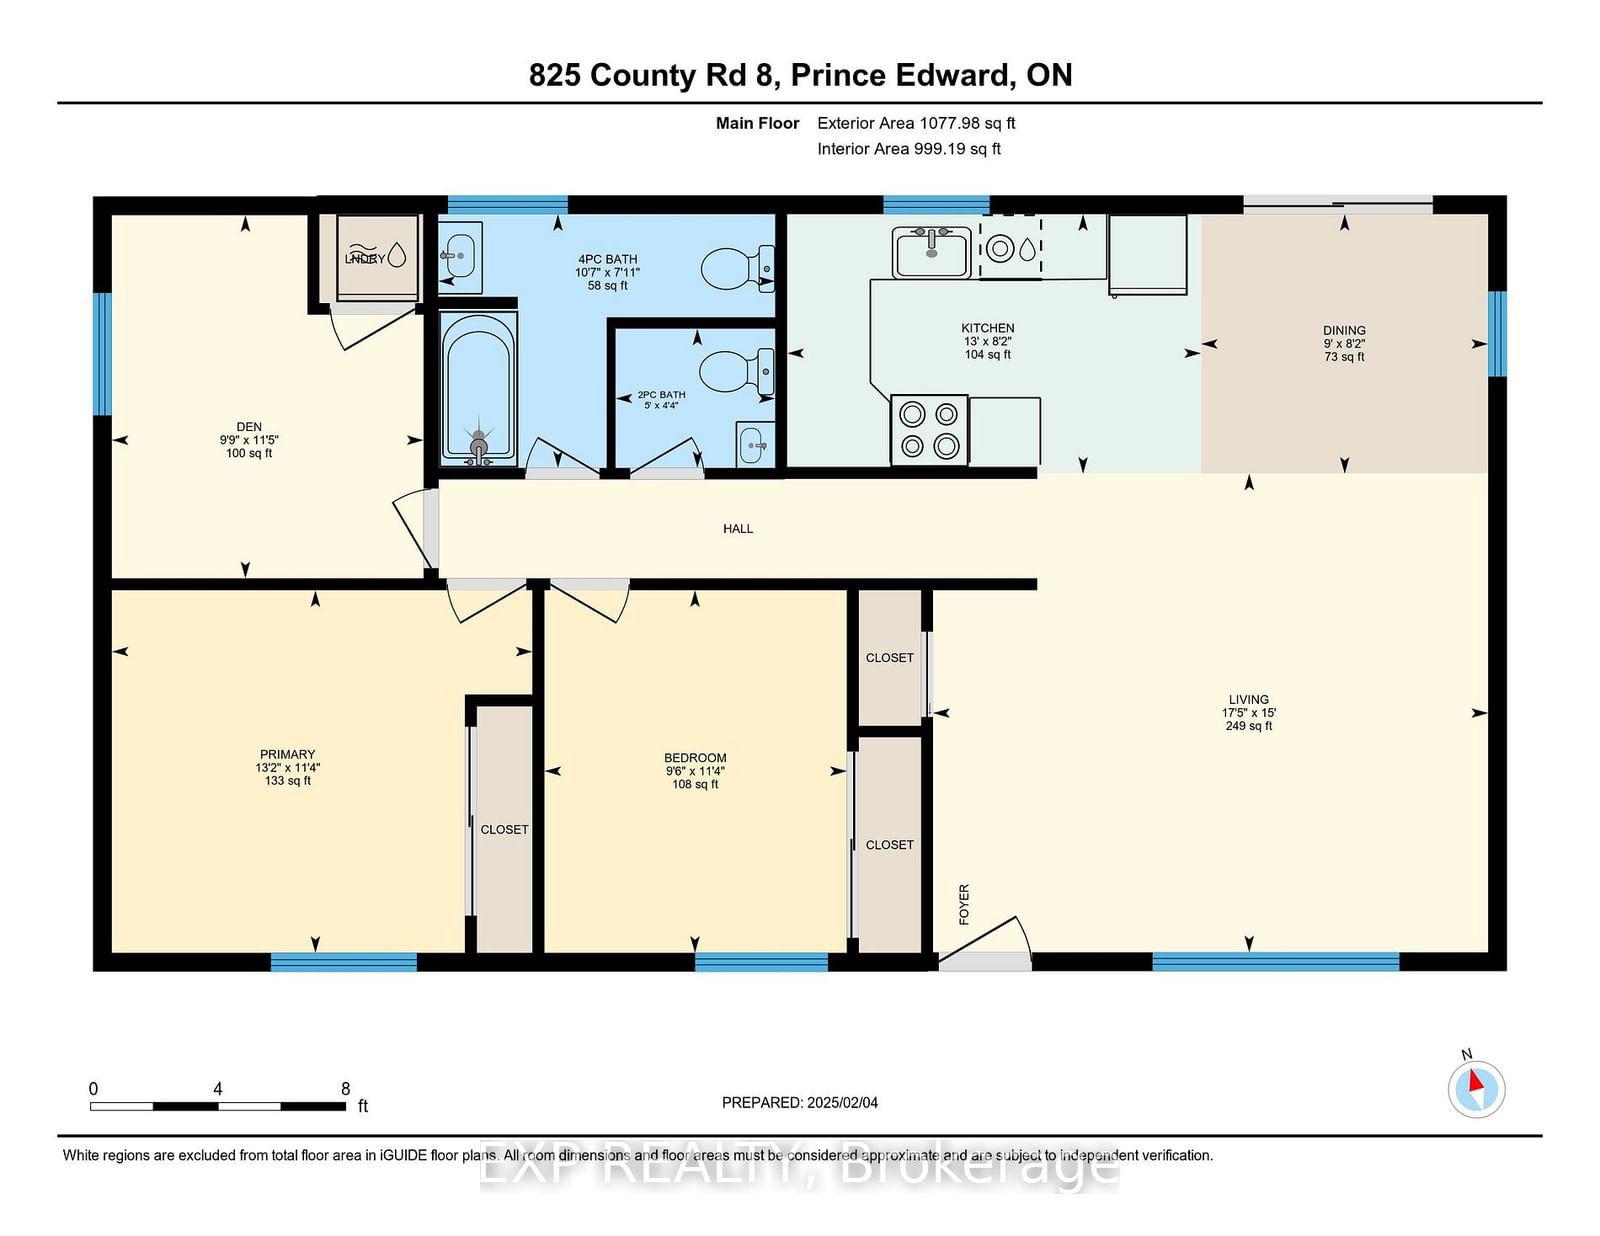
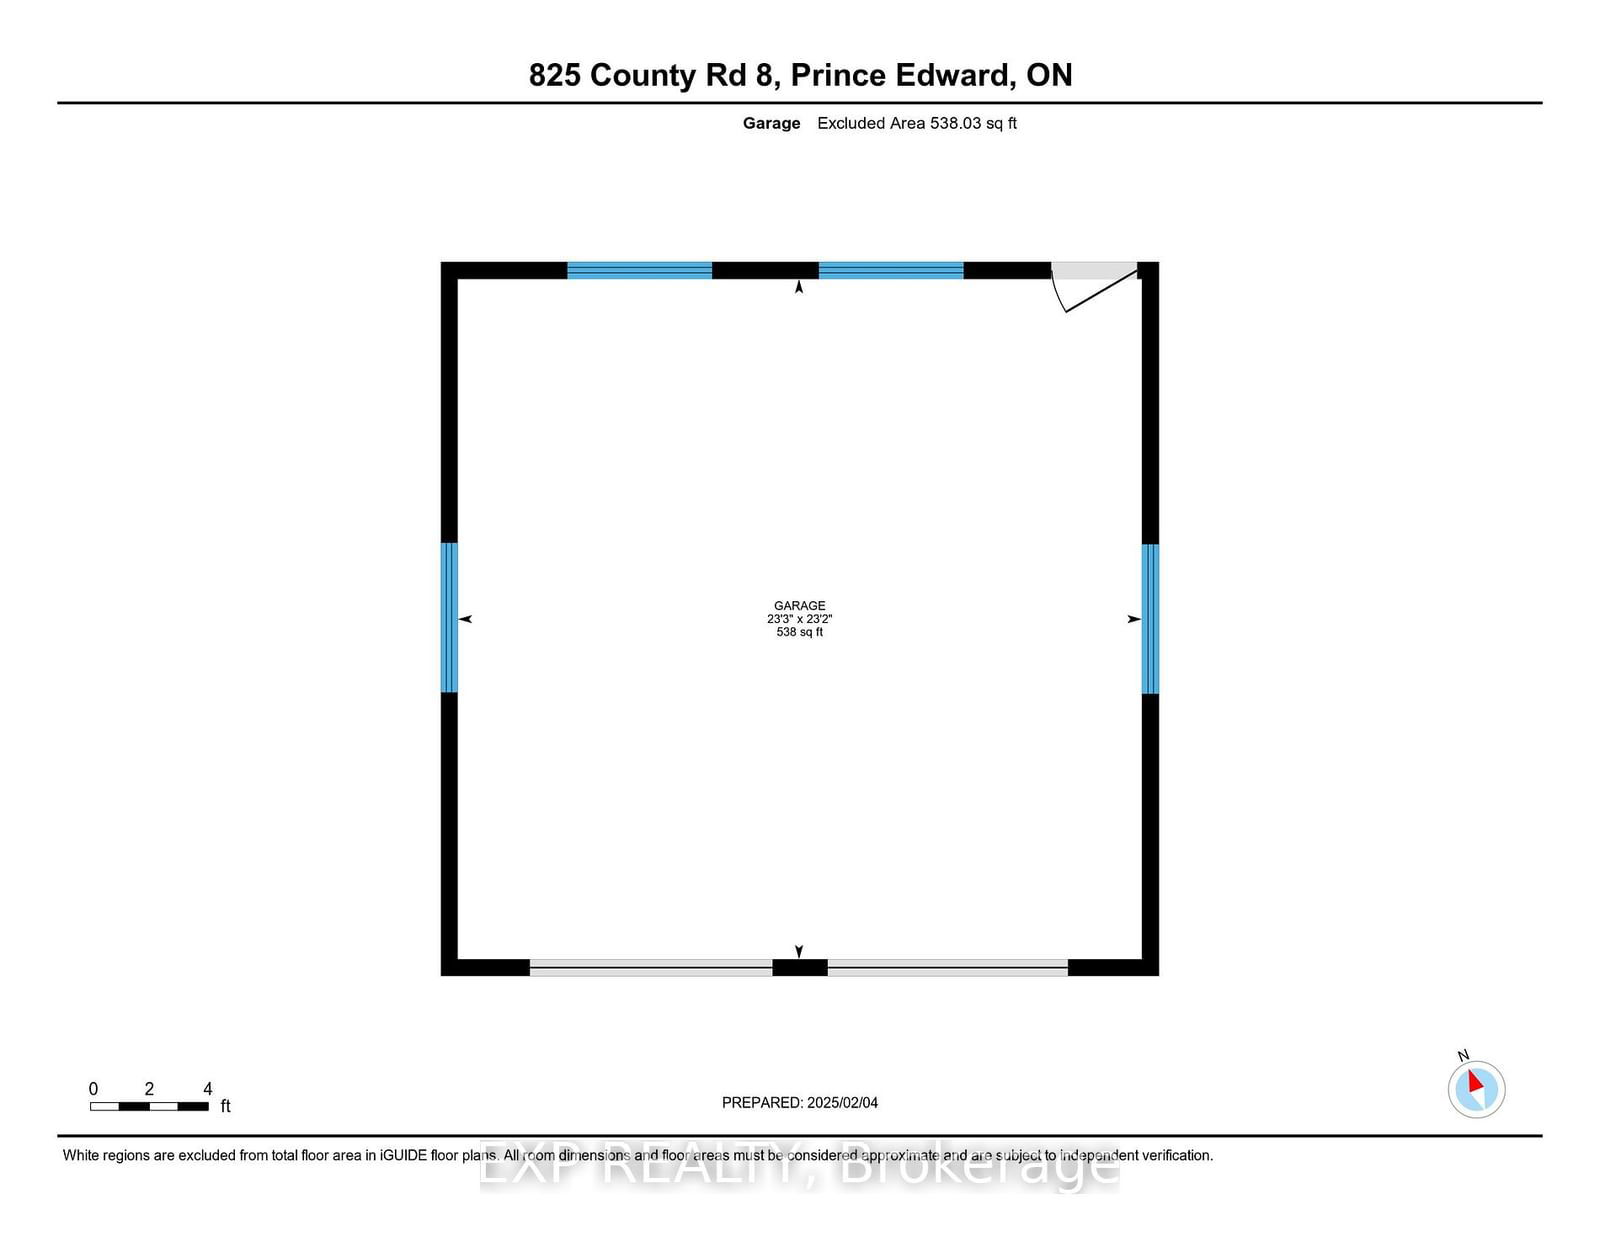
Welcome to this beautifully remodelled 1,000 sq. ft. bungalow with sweeping rural views. Perfectly situated on a half-acre lot this home is truly move-in ready. This charming property features 3 bedrooms and 1.5 bathrooms, all updated with stylish, modern finishes that blend functionality with a cozy, inviting atmosphere. Inside, you'll find an open-concept living area with all new flooring and a sleek kitchen complete with stainless steel appliances, farmhouse sink, two-tone cabinetry, and plenty of counter space for meal preparation. With cathedral ceilings throughout, the living and dining areas are bathed in natural light, creating an airy and welcoming environment. Outside, the half-acre lot provides plenty of room for gardening, relaxing, and outdoor activities, with a sense of privacy and tranquil views. If you are looking for more living space, the detached double garage (538 sq.ft) is fully insulated with power, updated windows, and a covered rear patio space offering so much potential. Whether you're looking for a workshop, studio, or planning to convert it into a second unit (subject to zoning approval), the possibilities here are endless with lots of parking in the double-entrance circular drive. Recent updates include new stainless steel appliances (2022), basement waterproofing & sump (August 2022), septic tank (October 2023), all new windows and doors (July 2023), new propane furnace with central air (December 2021), updated electrical and plumbing (January 2022), new roof shingles (October 2024). There really is nothing for you to do here but to plan your garden for this spring!!
Bathroom
Bathroom
Br
2nd Br
Kitchen
3rd Br
Dining
Living
The graph below compares the average list price and average sale price of homes in this neighborhood by month for the last 24 months. When average sale price is greater than average list price, this may suggest a buyer's market. When average sale price is lower than the average list price this may suggest a seller's market.
The graph below illustrates the average days on market for homes in this neighborhood. The yellow area may indicate a buyer's market, the green area may indicate a balanced market and the red area may indicate a seller's market.