
Century 21 People’s Choice Realty Inc., Brokerage
120 MATHESON BLVD E #103
MISSISSAUGA, Ontario
L4Z 1X1
Pelham, Fonthill, L0S 1E3
$1,750
Listed by RE/MAX GARDEN CITY REALTY INC, BROKERAGE.
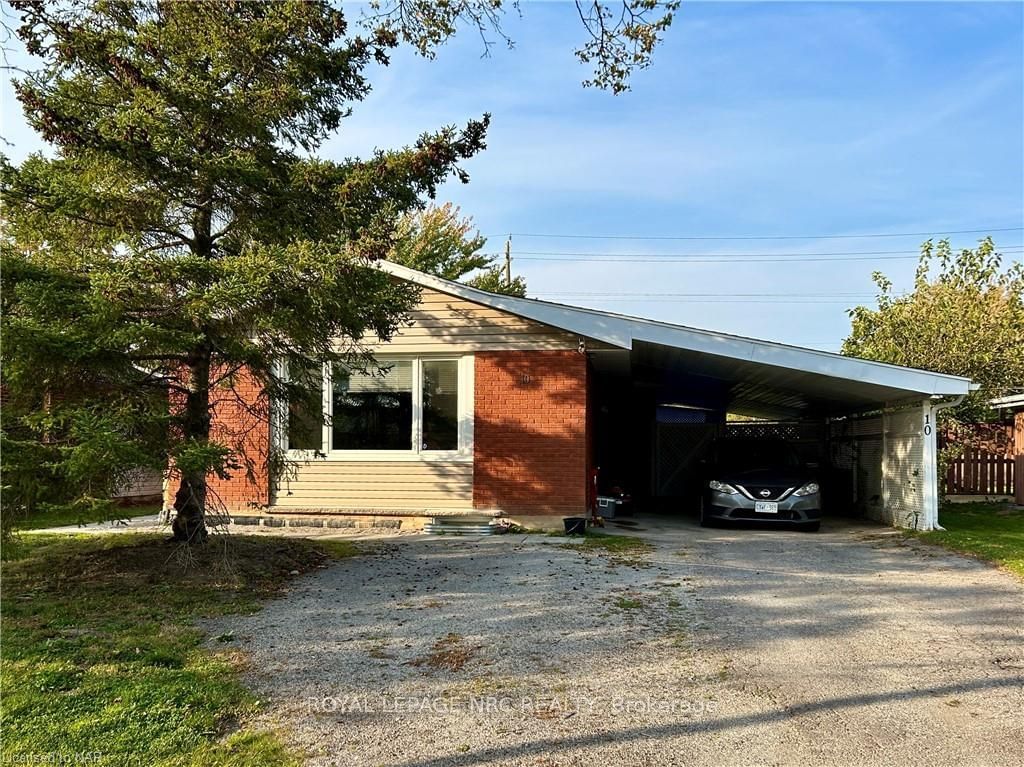
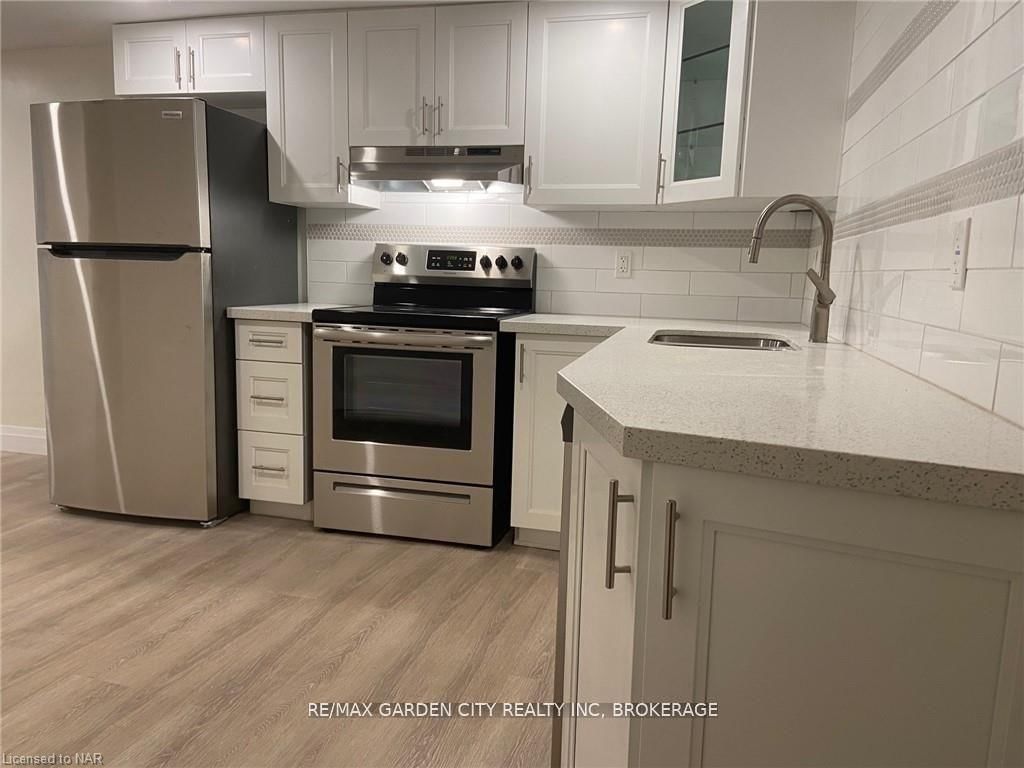
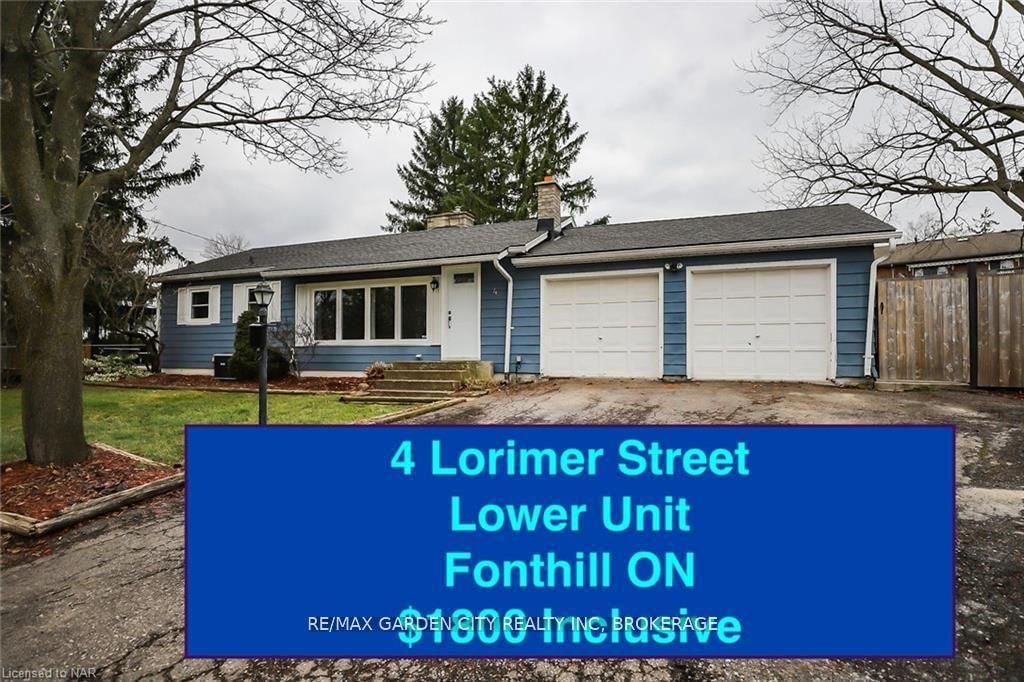
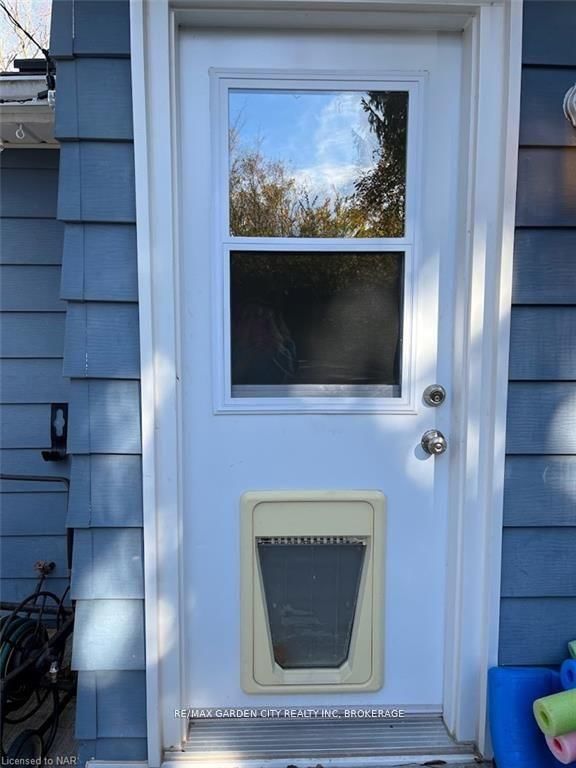
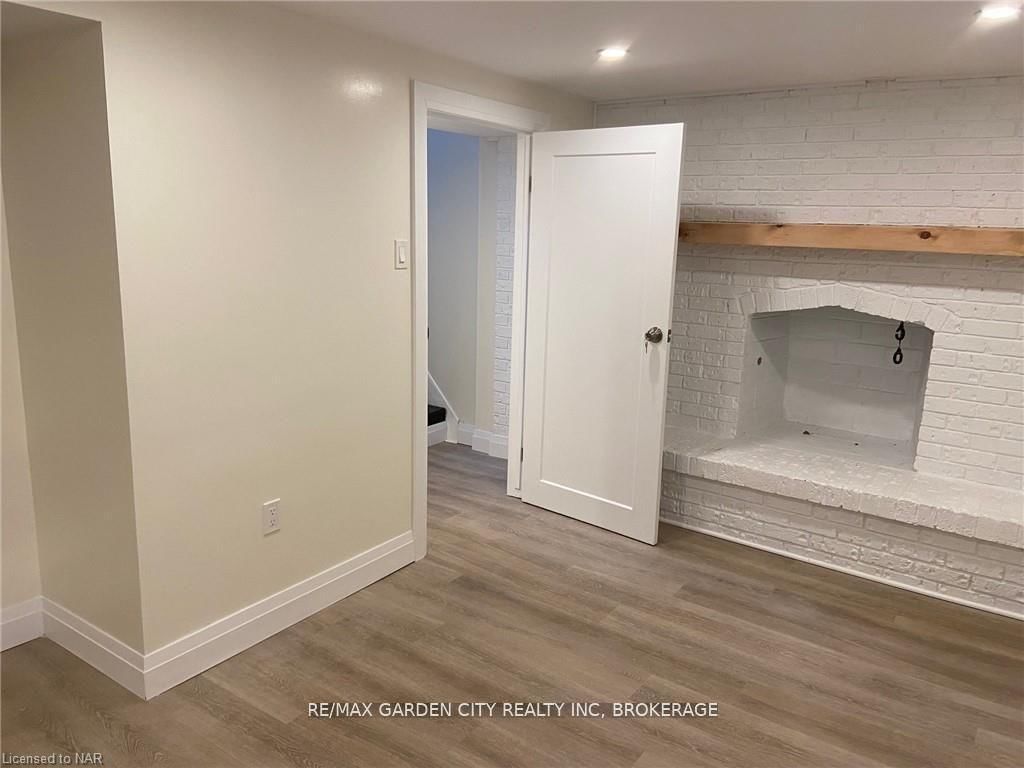
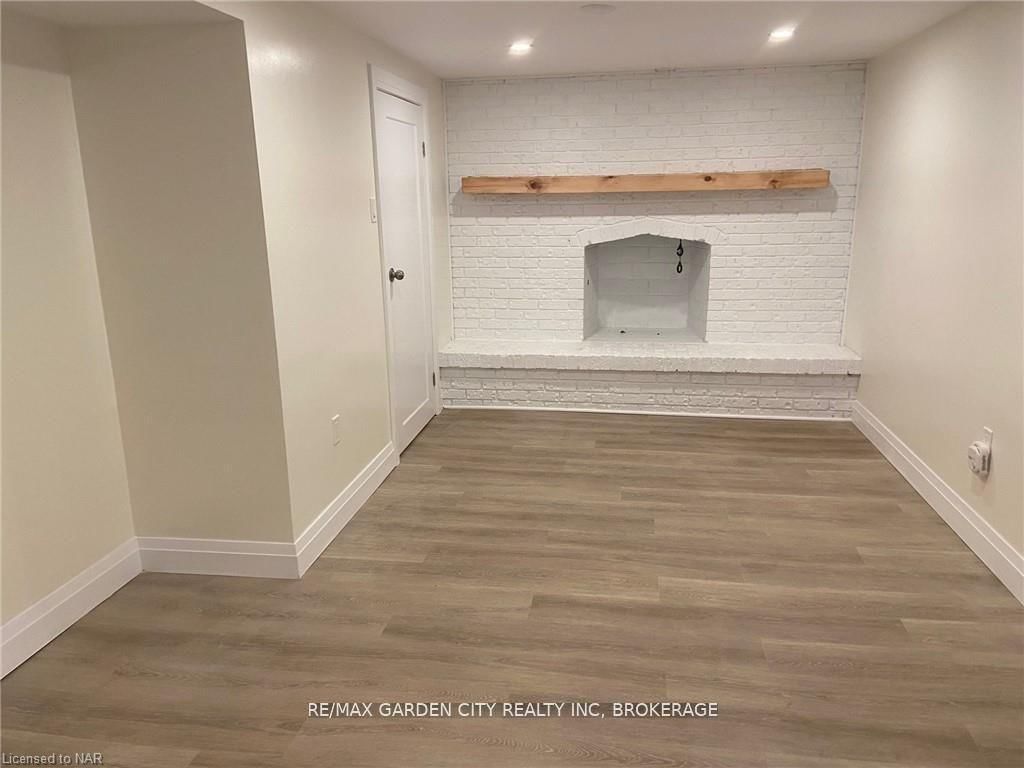
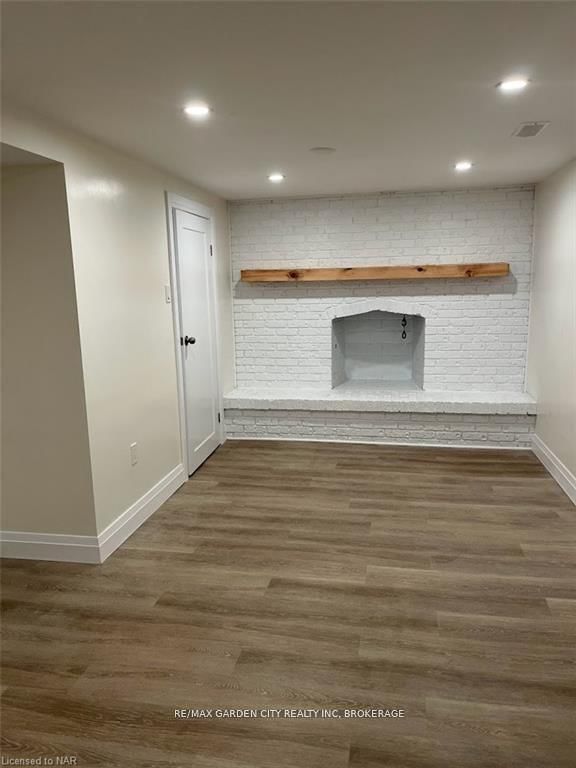
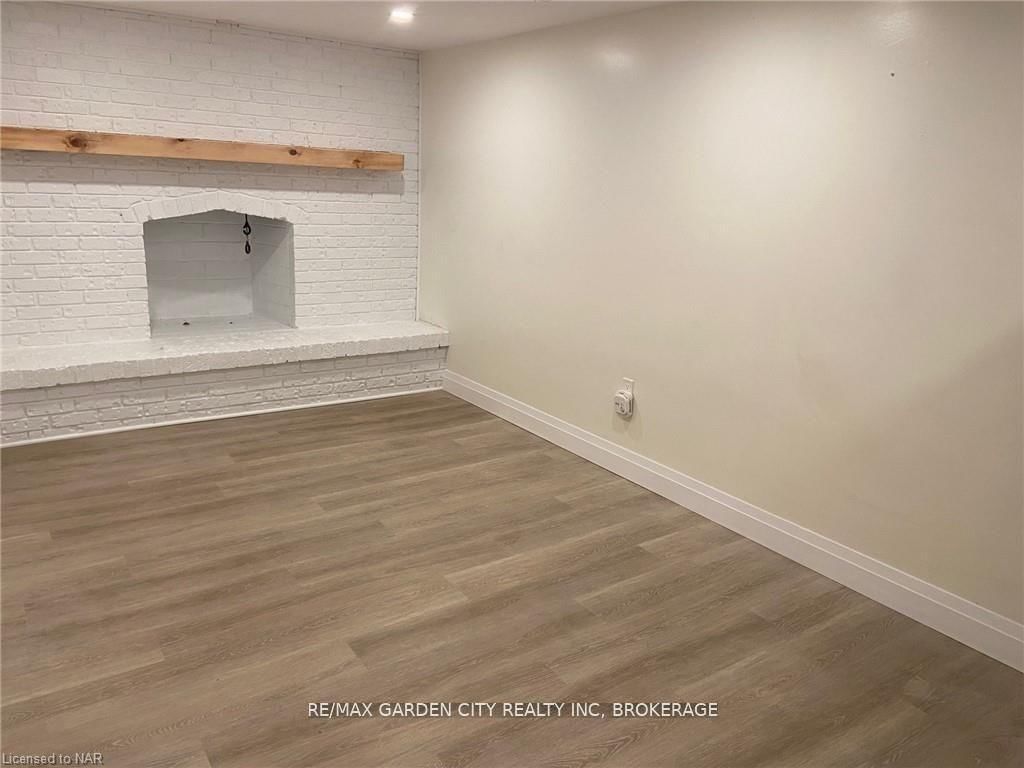
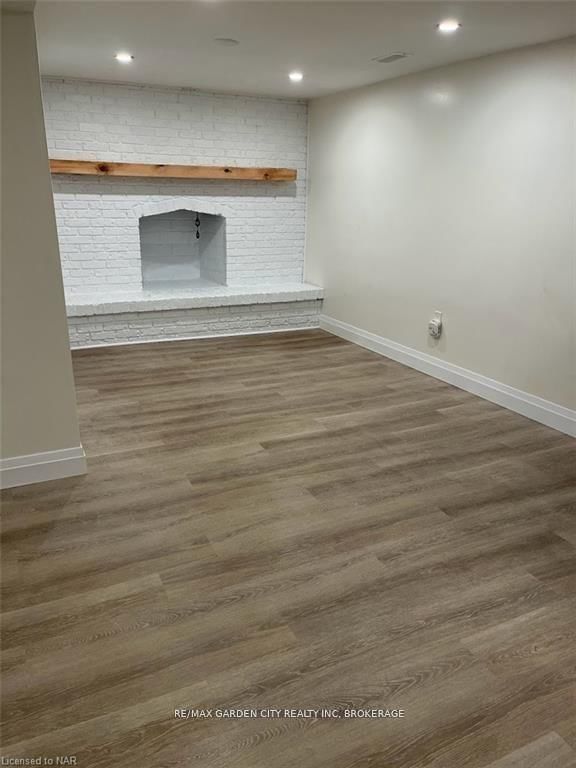
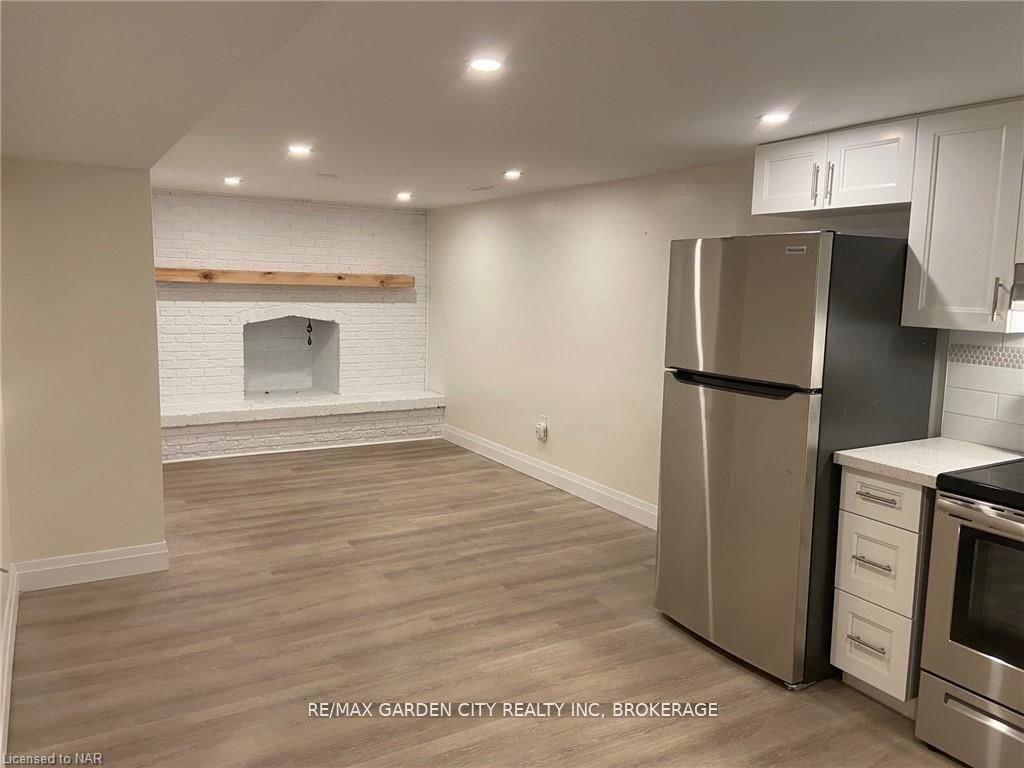
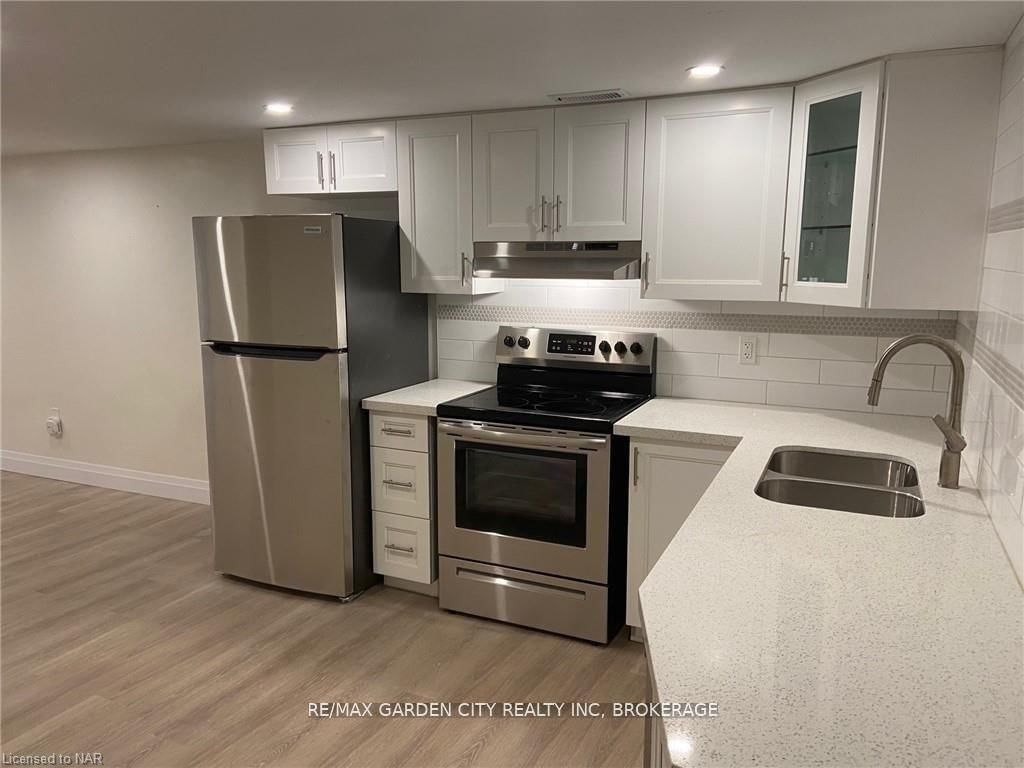
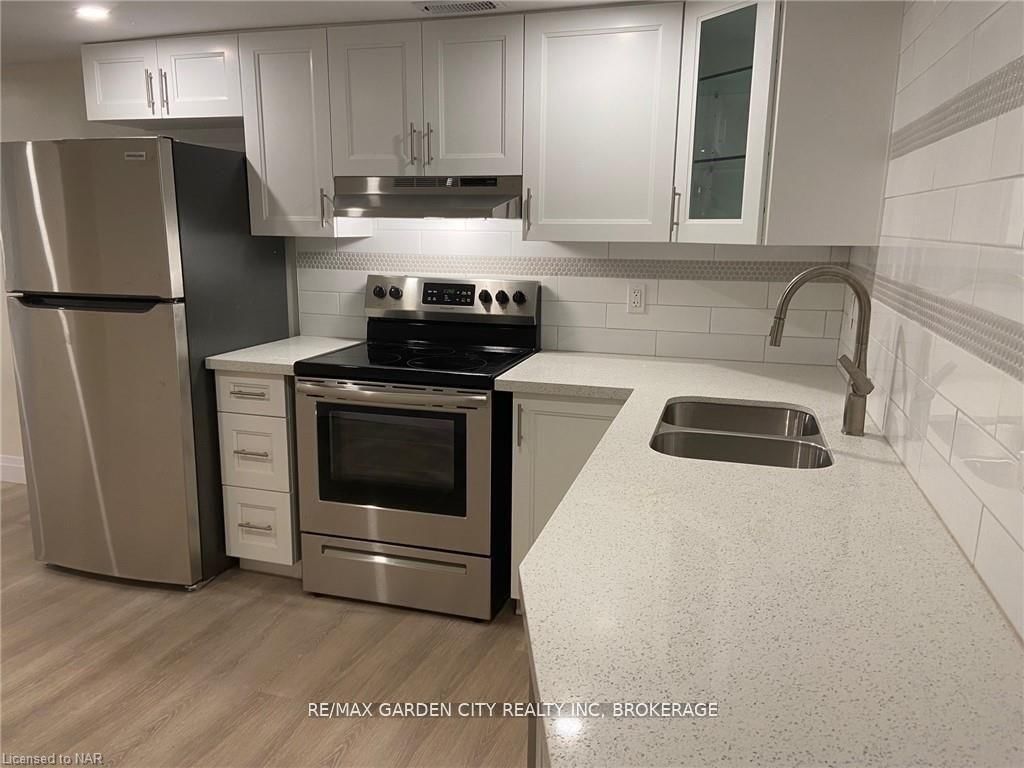
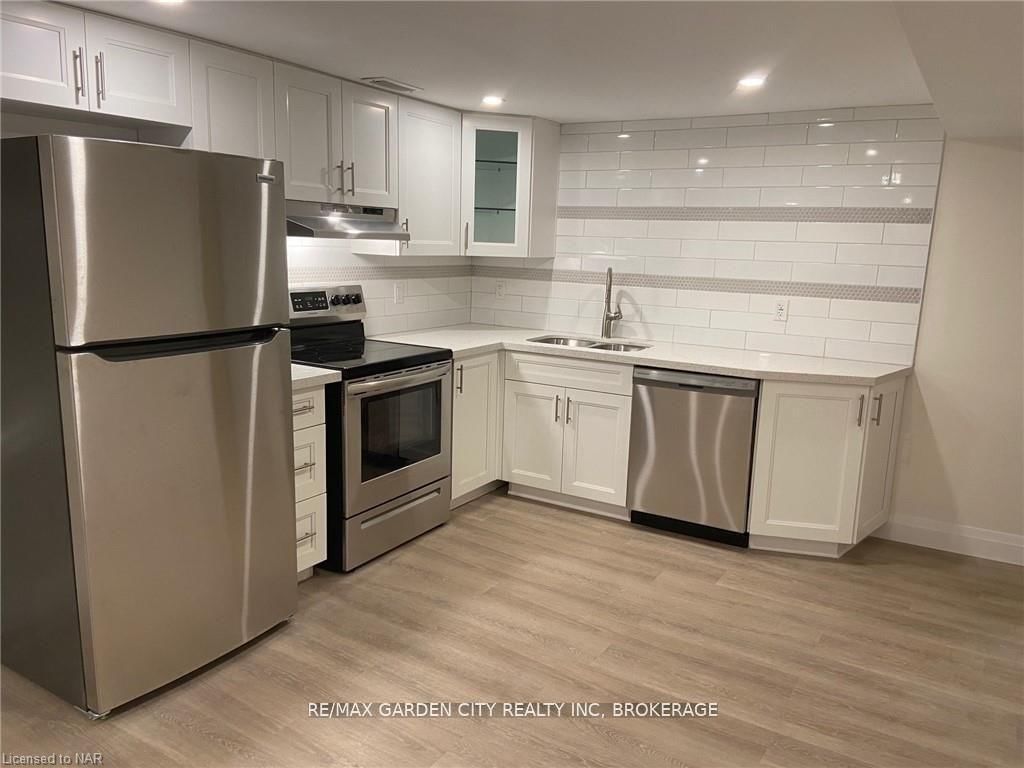
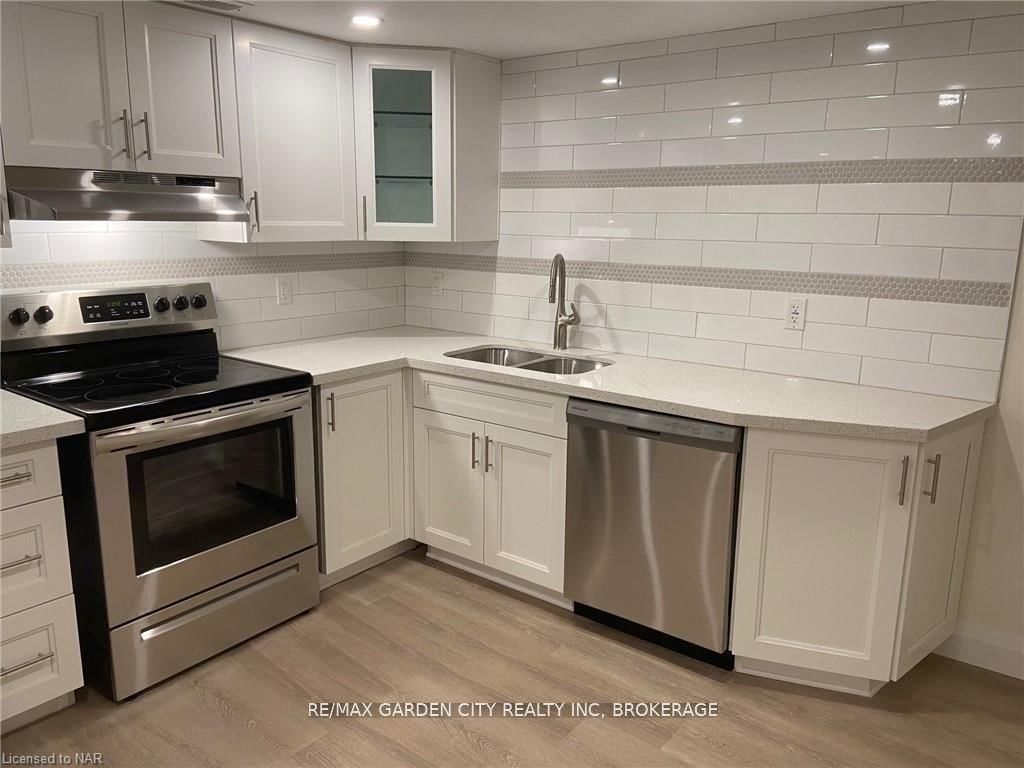
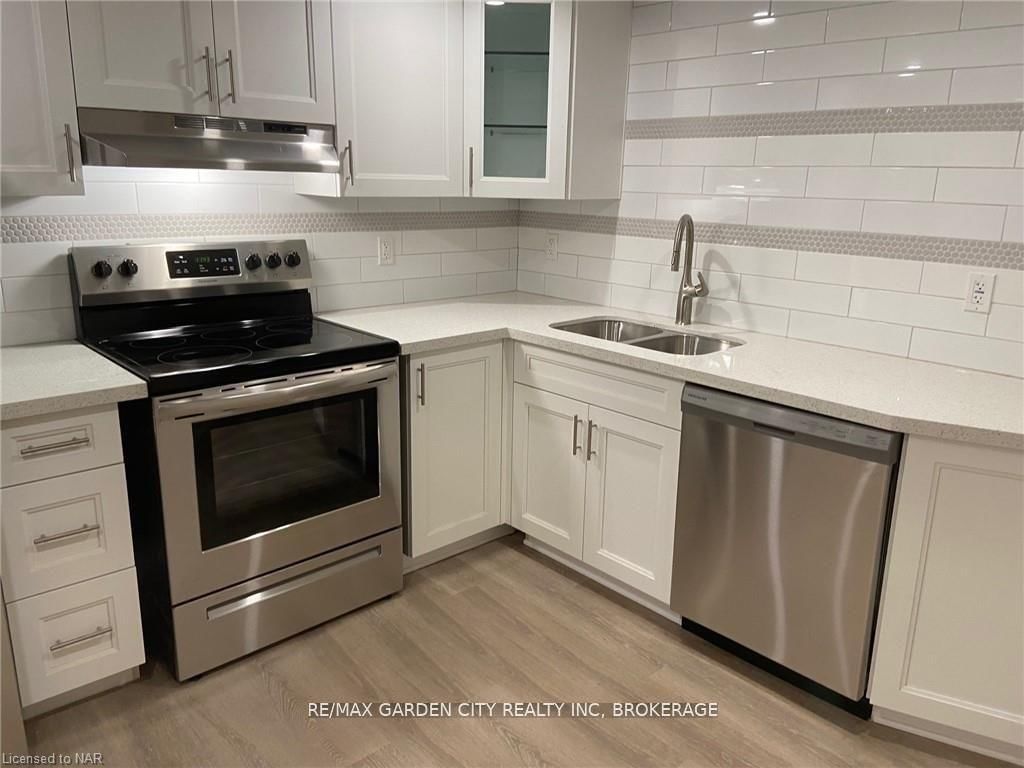
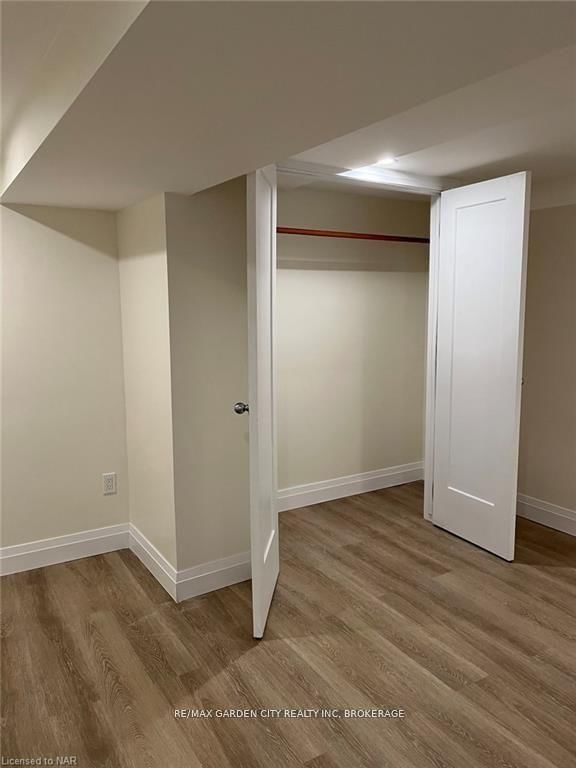
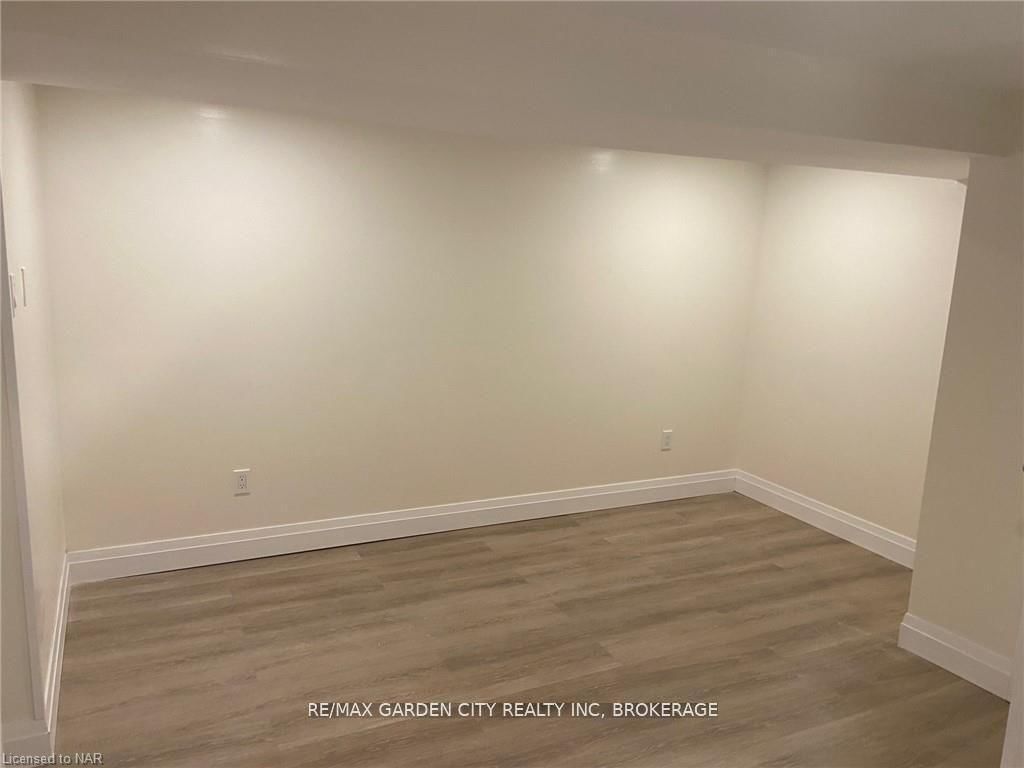
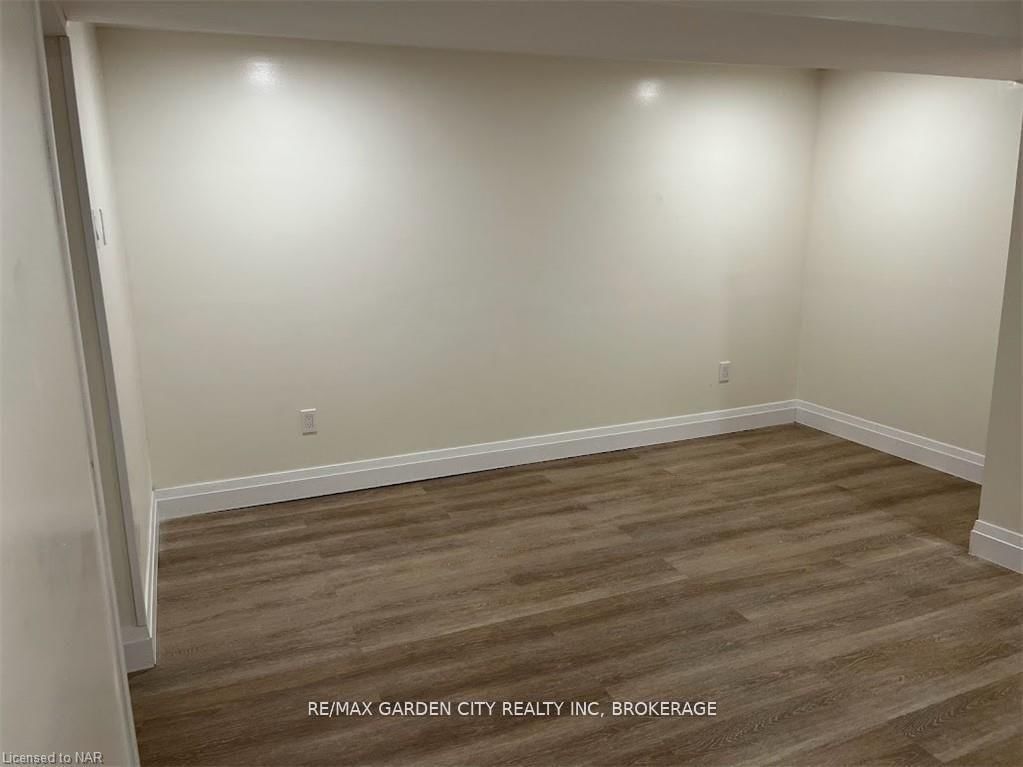
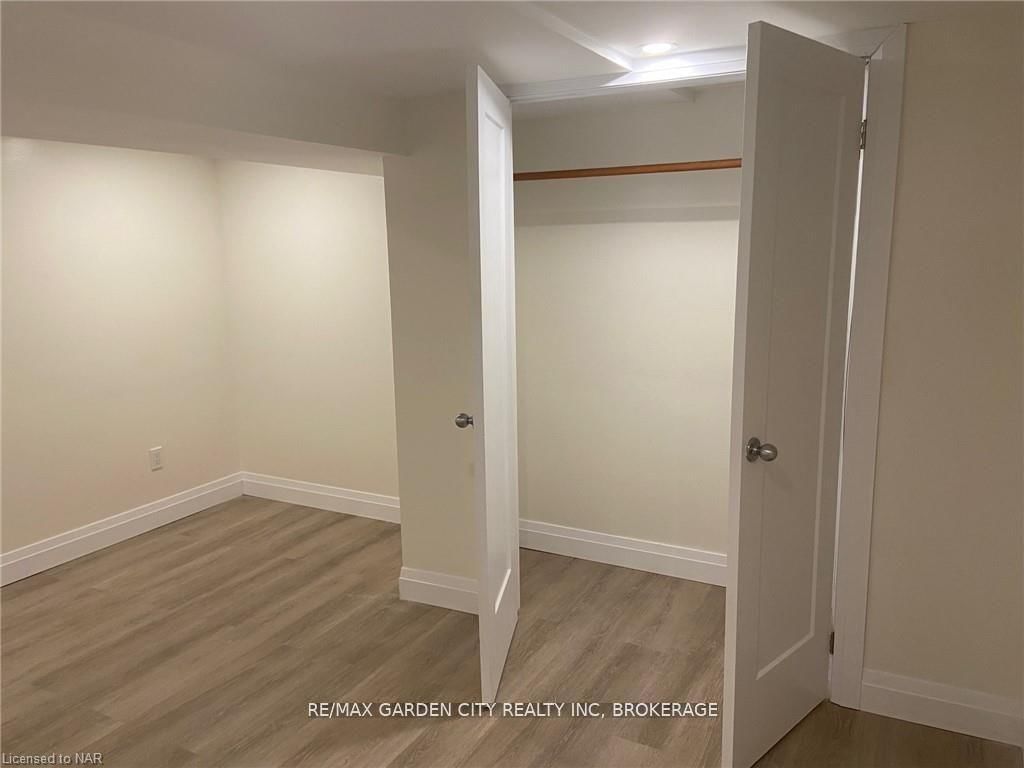
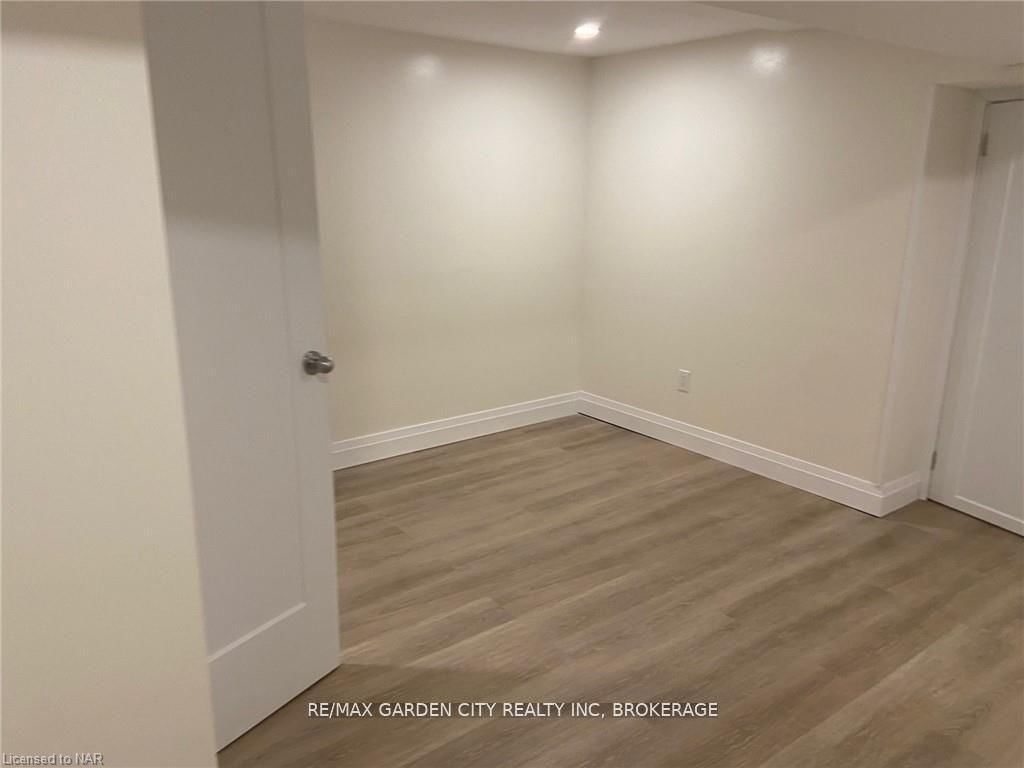
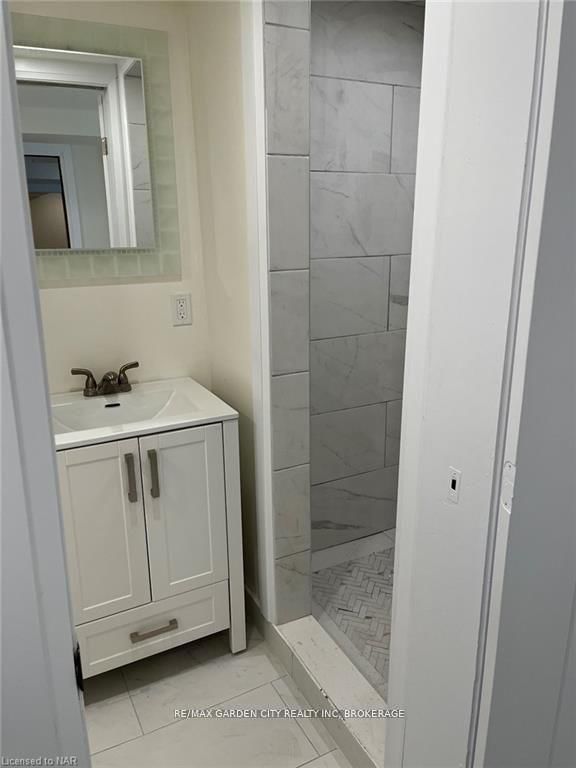
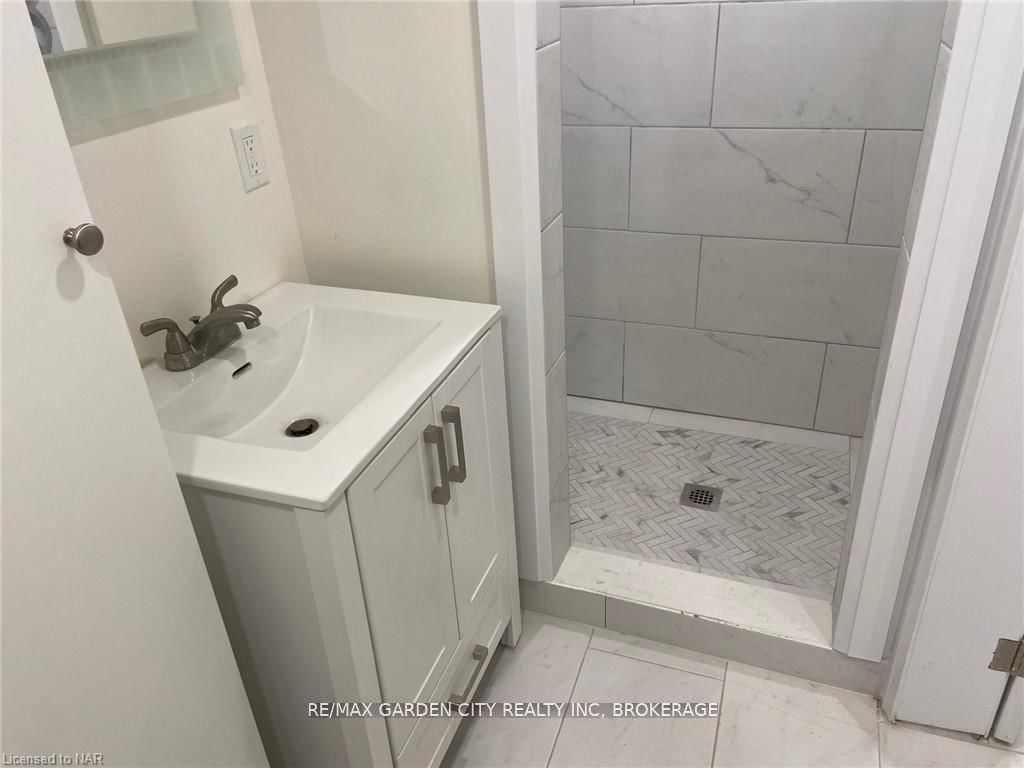
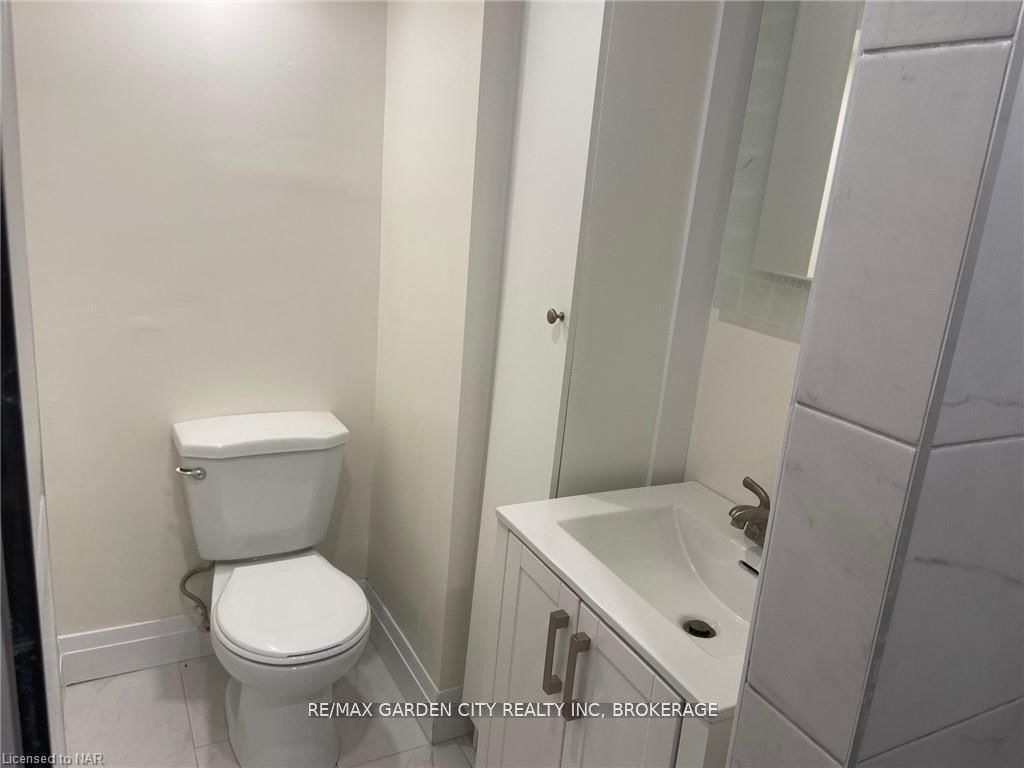
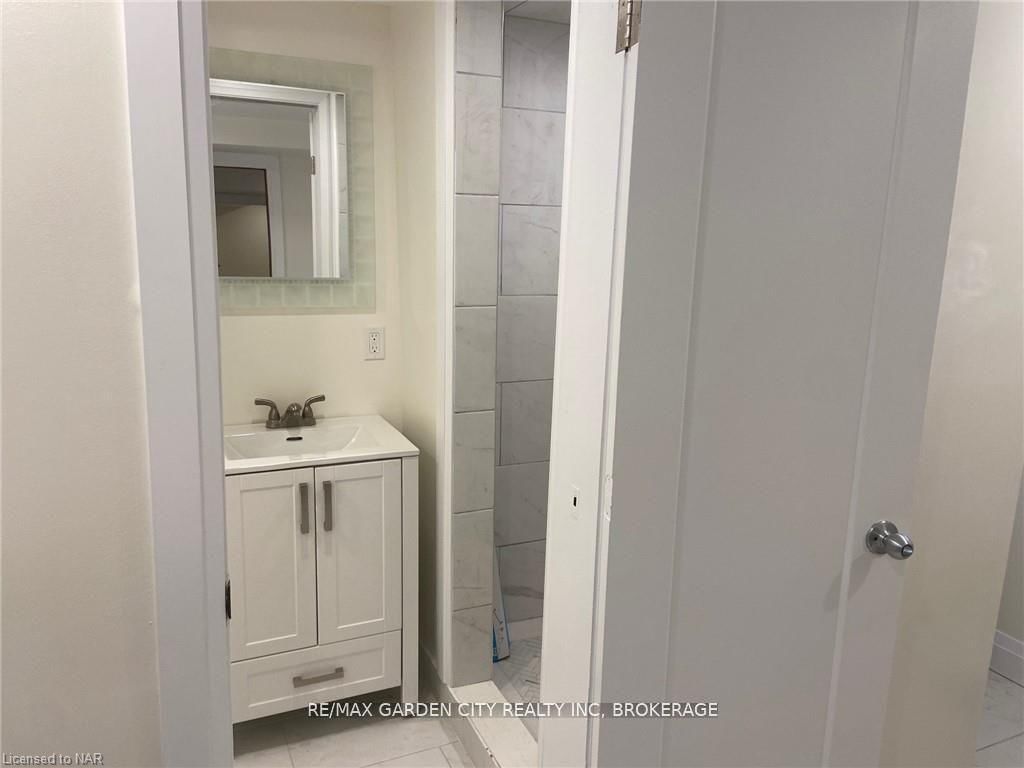
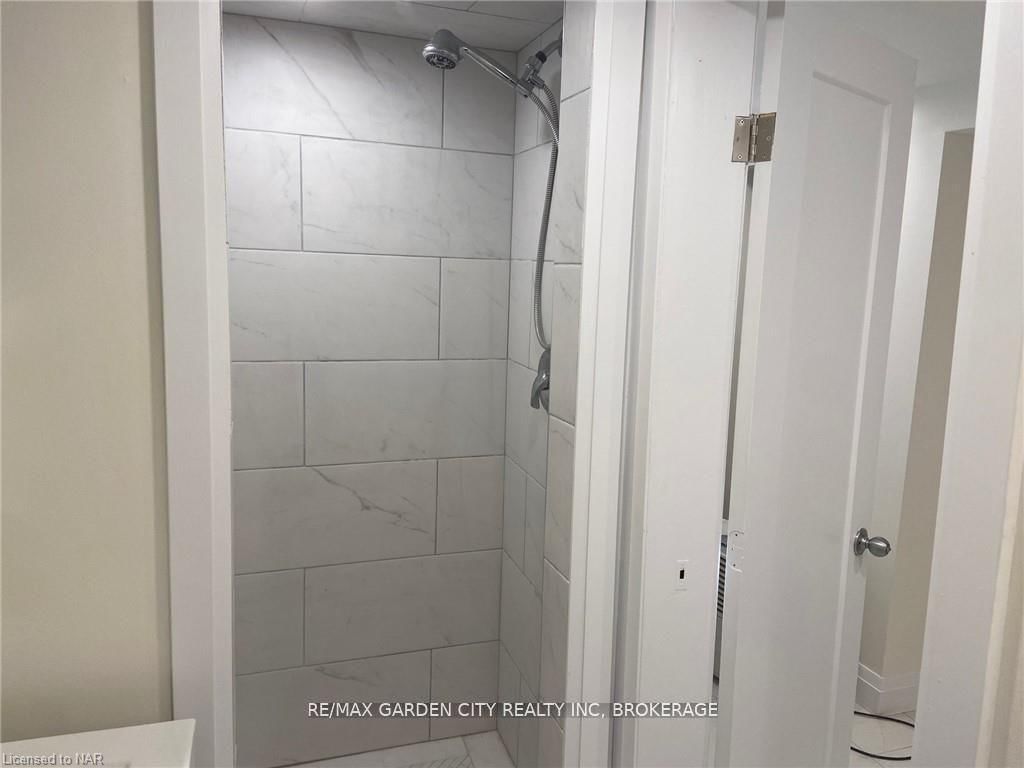
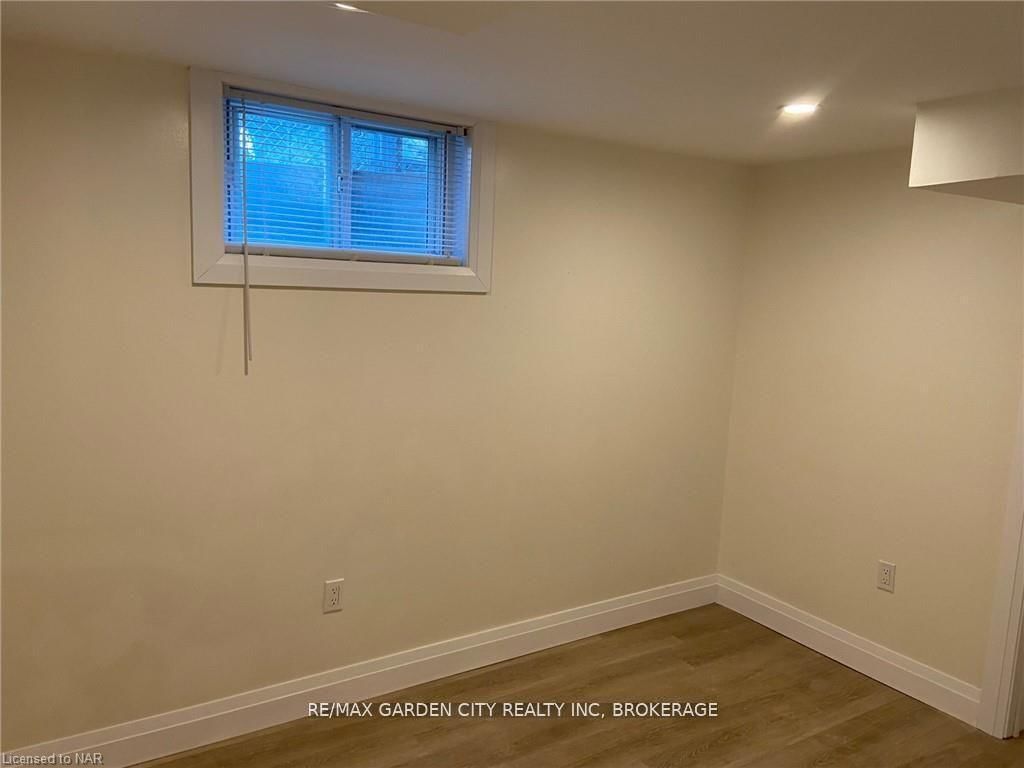
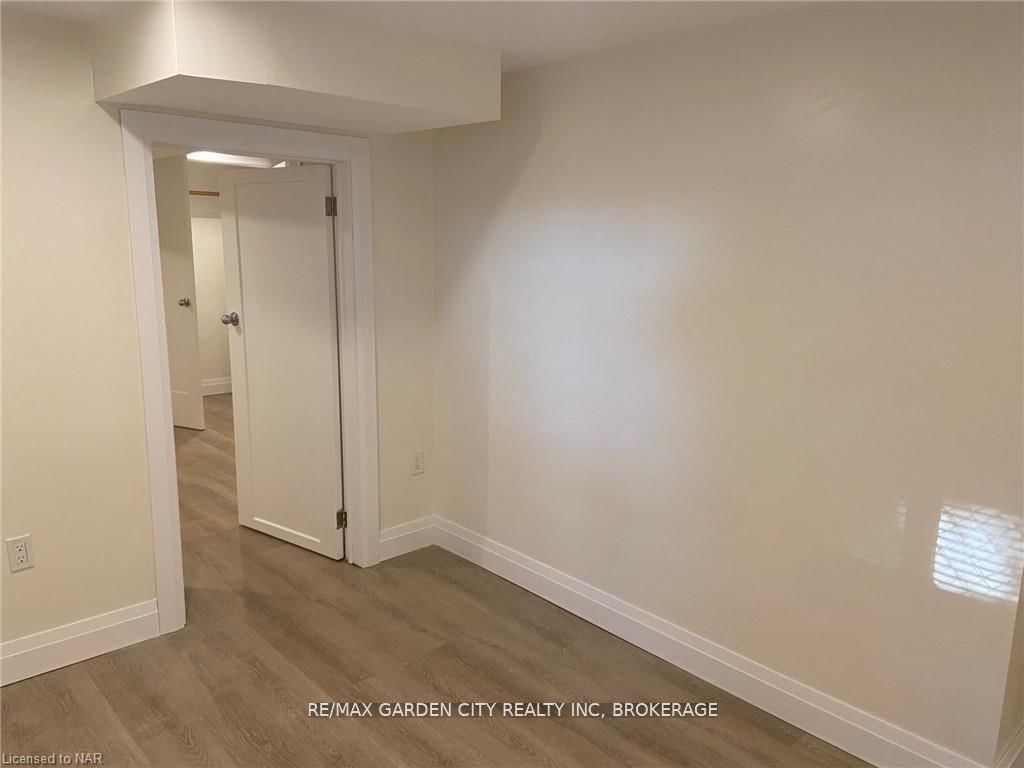
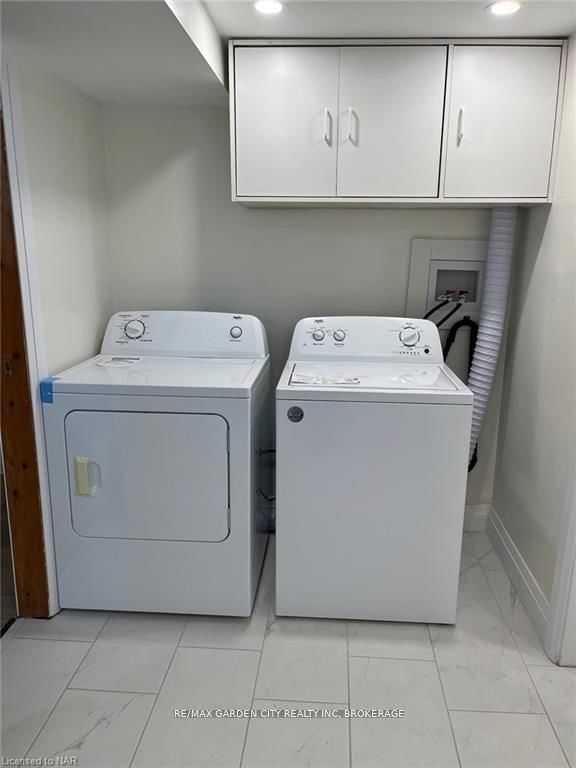
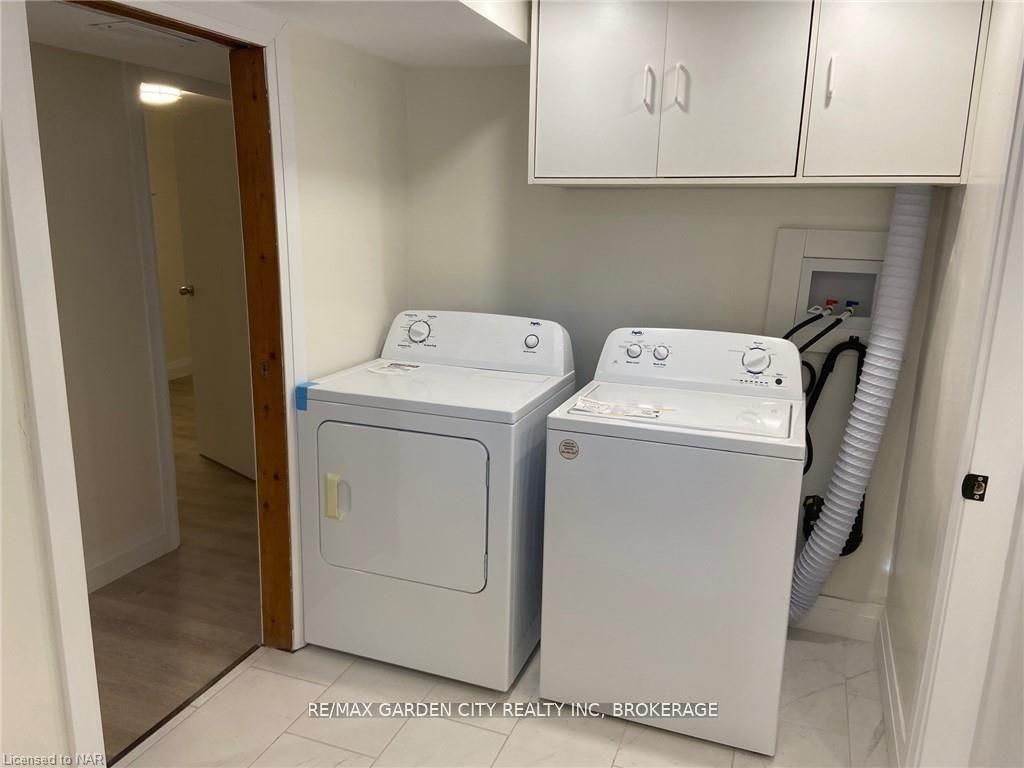
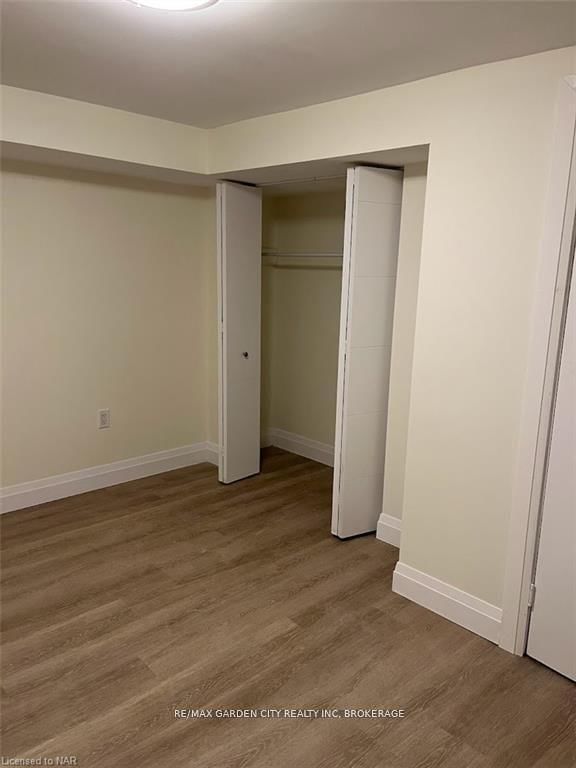
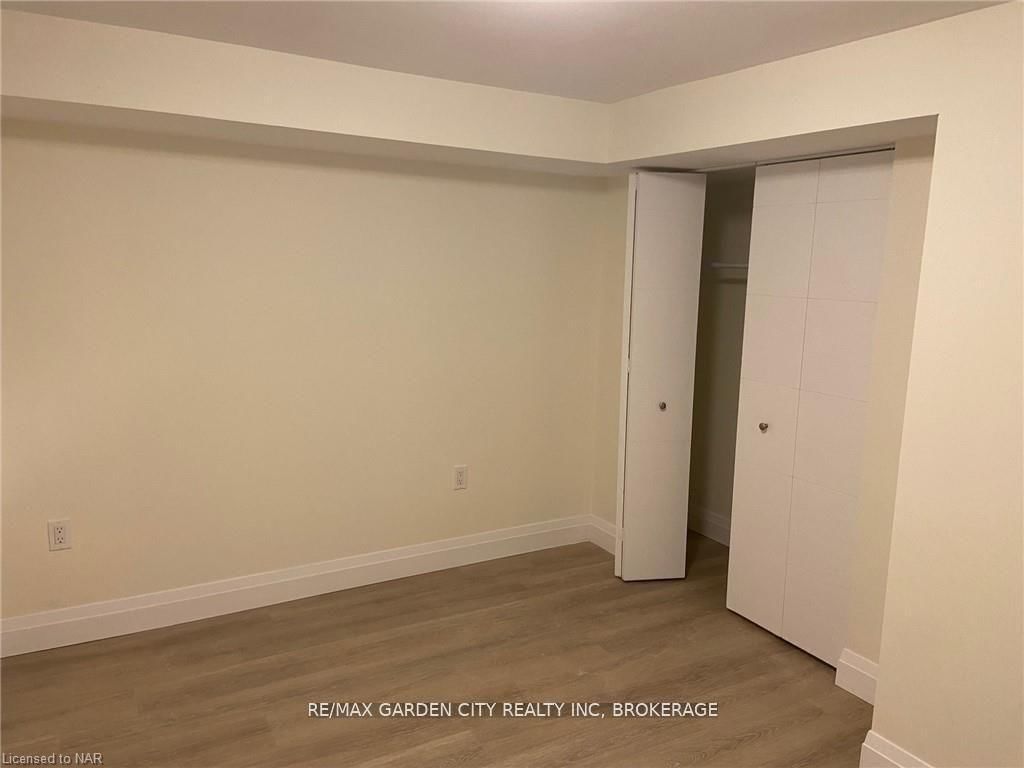
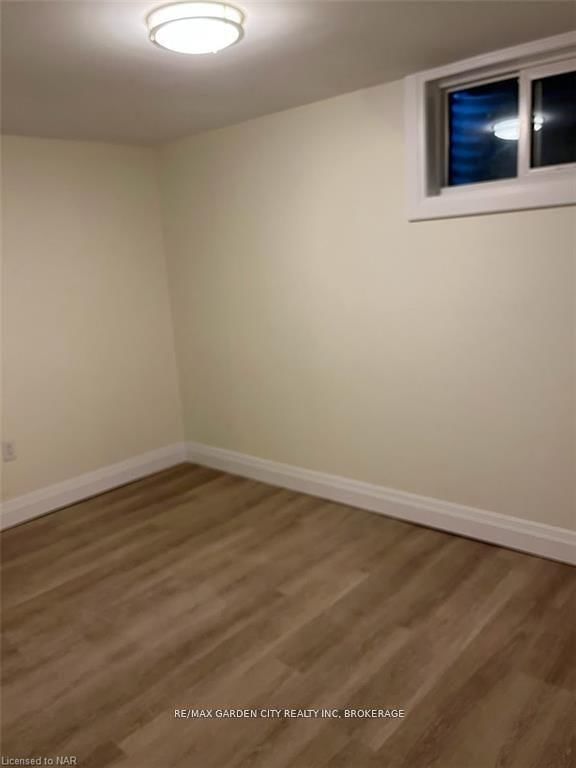
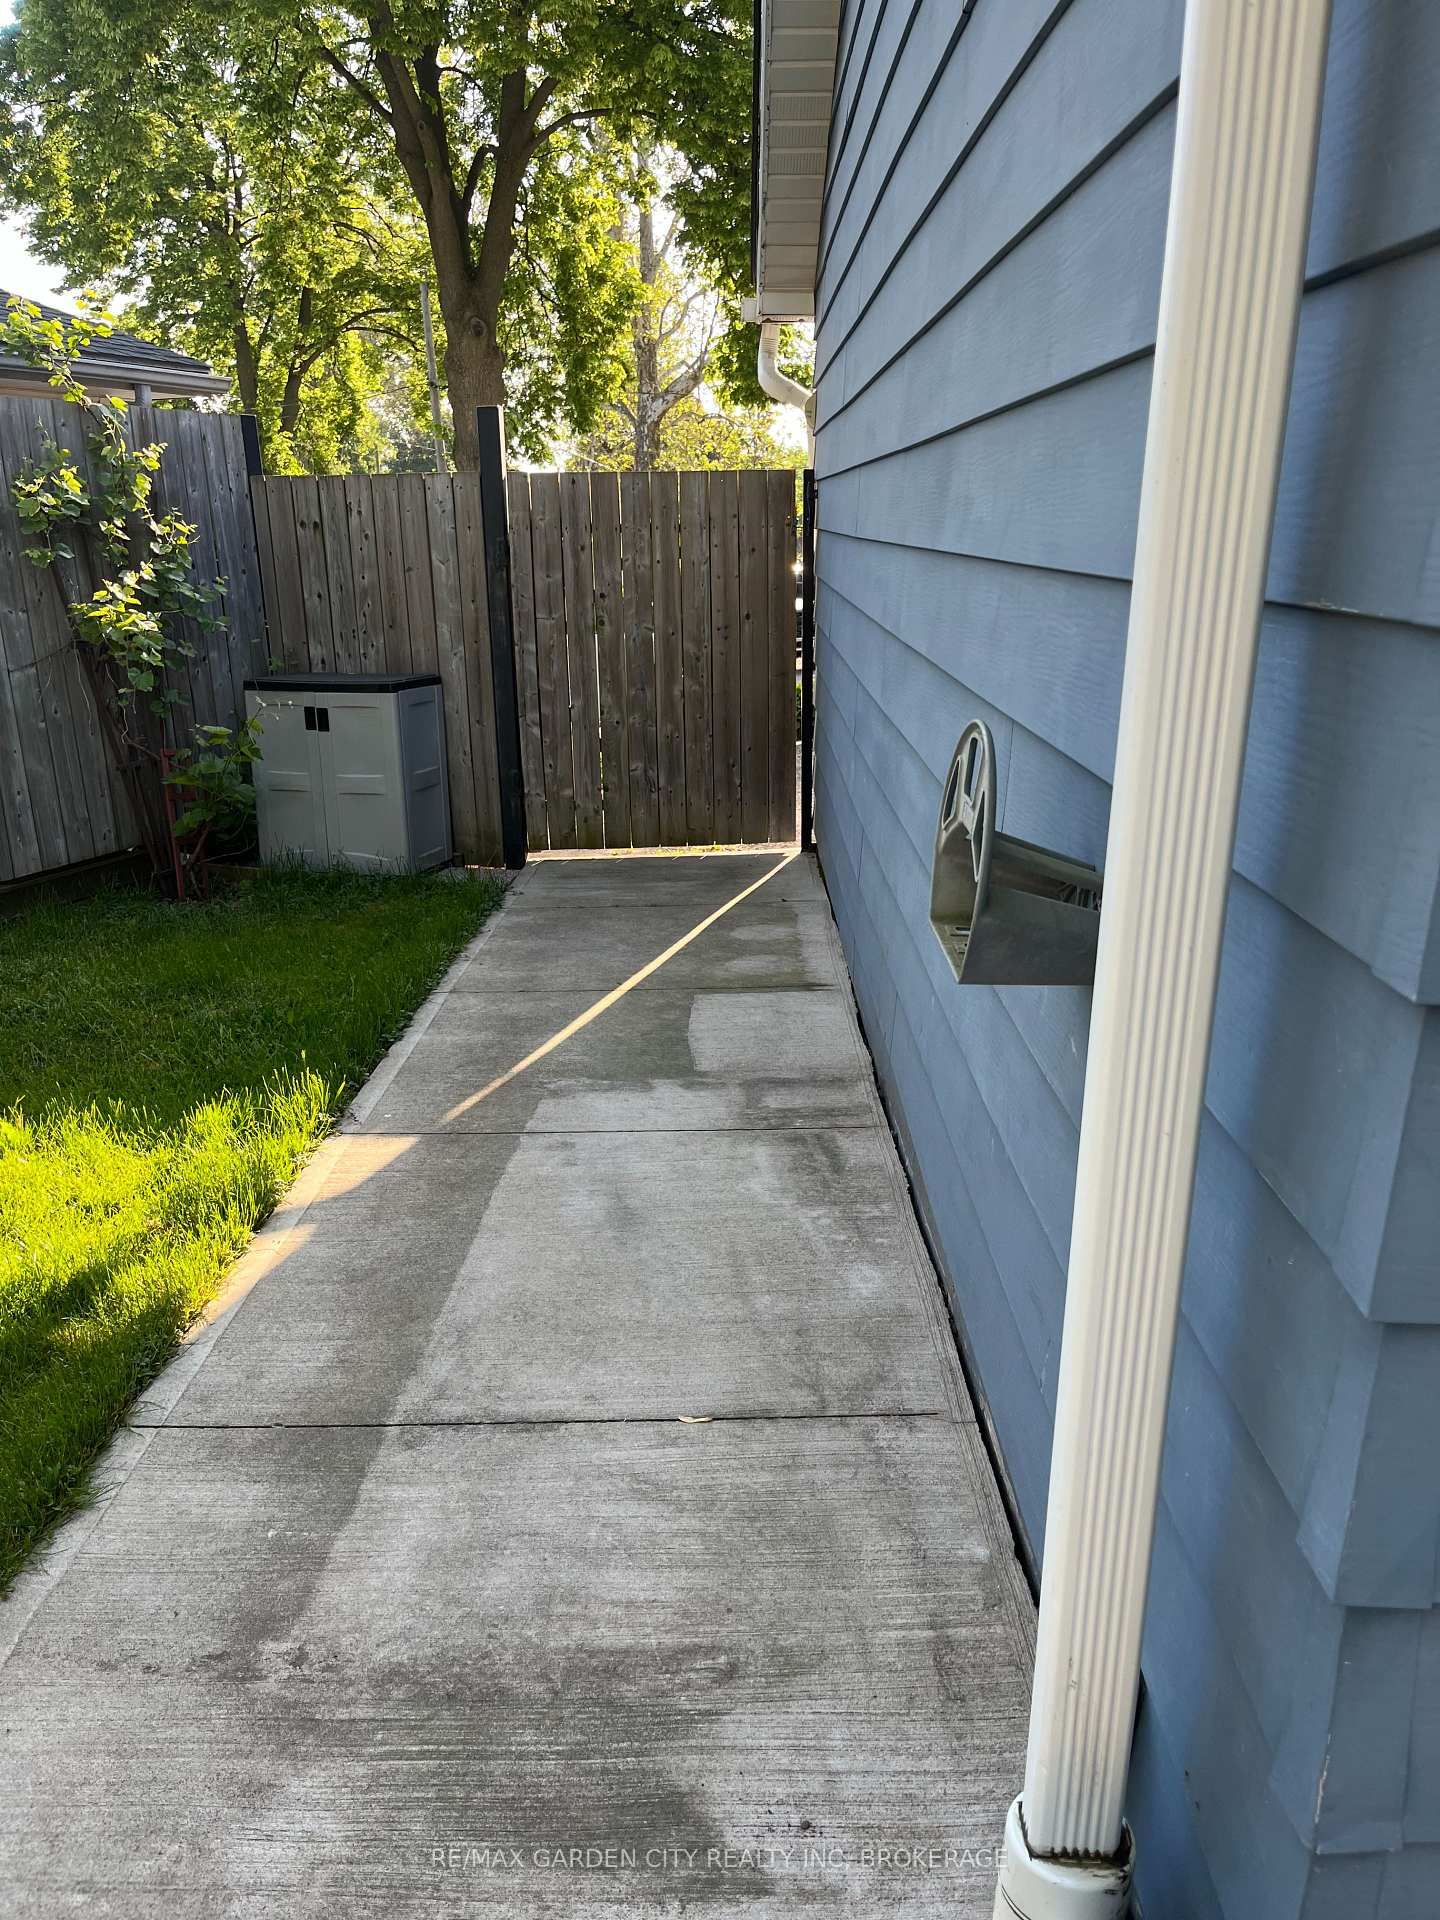
FOR RENT $1750 per mth inclusive (*water/heat/hydro). Ready to call 4 Lorimer Street lower Fonthill home...this unit has been recently updated, carpet free, move in ready!! With so much to offer, 2 bedroom plus a bonus den/office, 1 bathroom. The open concept eat in kitchen, with brand new custom cabinetry, quartz countertop, plenty of storage, SS appliances, opens up to a generous open concept living room with a gorgeous wall to wall decorative fireplace. Both bedrooms are generous, each with large closets, the bonus den/office is perfect bonus space if you work from home, or can be set up as a hobby/craft room, the possibilities are endless! The 3pc bathroom has a large walk in shower with marble tile, vanity and additional storage, the unit has a huge laundry room, exclusive use for this unit. All of this conveniently located in the heart of Fonthill, most anything is walking distance; to the town centre, shops, parks, walking/hiking trails, cycling trails, arena, schools, farmers market, band shell, restaurants & local craft brewery... short drive; to golf, wineries, maple farms, fruit stands, major malls, historical land marks, amenities, green space, beaches and waterways, hwy access & so much more! Tenant is Responsible For: Snow removal for their own walkway/driveway space & securing/maintaining valid tenant insurance at the expense of the tenant. No Smoking permitted. NOTE; $1750 (all inclusive for 1 tenant = gas/water/hydro) OR $1825 (all inclusive for 2 tenants = gas/water/hydro)
DISHWASHER, DRYER, RANGE HOOD, REFRIGERATOR, SMOKE DETECTOR, STOVE,WASHER, CARBON MONOXIDE DETECTOR.
Living
Kitchen
Laundry
Primary
Br
Den
The graph below compares the average list price and average lease price of homes in this neighborhood by month for the last 24 months. When average lease price is greater than average list price, this may suggest a renter's market. When average lease price is lower than the average list price this may suggest a landlord's market.
The graph below illustrates the average days on market for homes in this neighborhood. The yellow area may indicate a renter's market, the green area may indicate a balanced market and the red area may indicate a landlord's market.
Sales Representative, Century 21 People’s Choice Realty Inc., Brokerage
(647) 576 - 2100