

Century 21 People’s Choice Realty Inc., Brokerage
120 MATHESON BLVD E #103
MISSISSAUGA, Ontario
L4K 0A4

Ottawa, Springridge/East Village, K4A 0X1
$699,900
Listed by DETAILS REALTY INC..
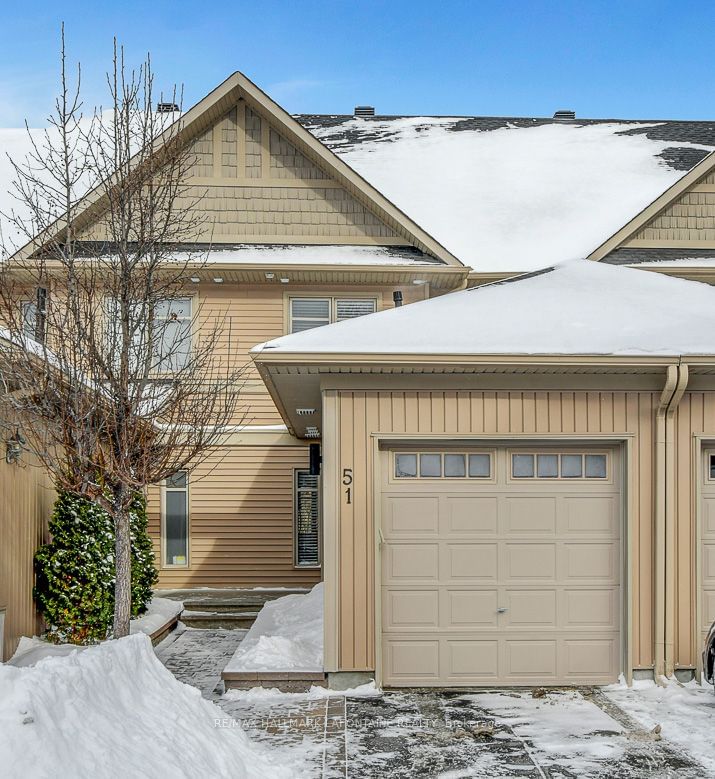
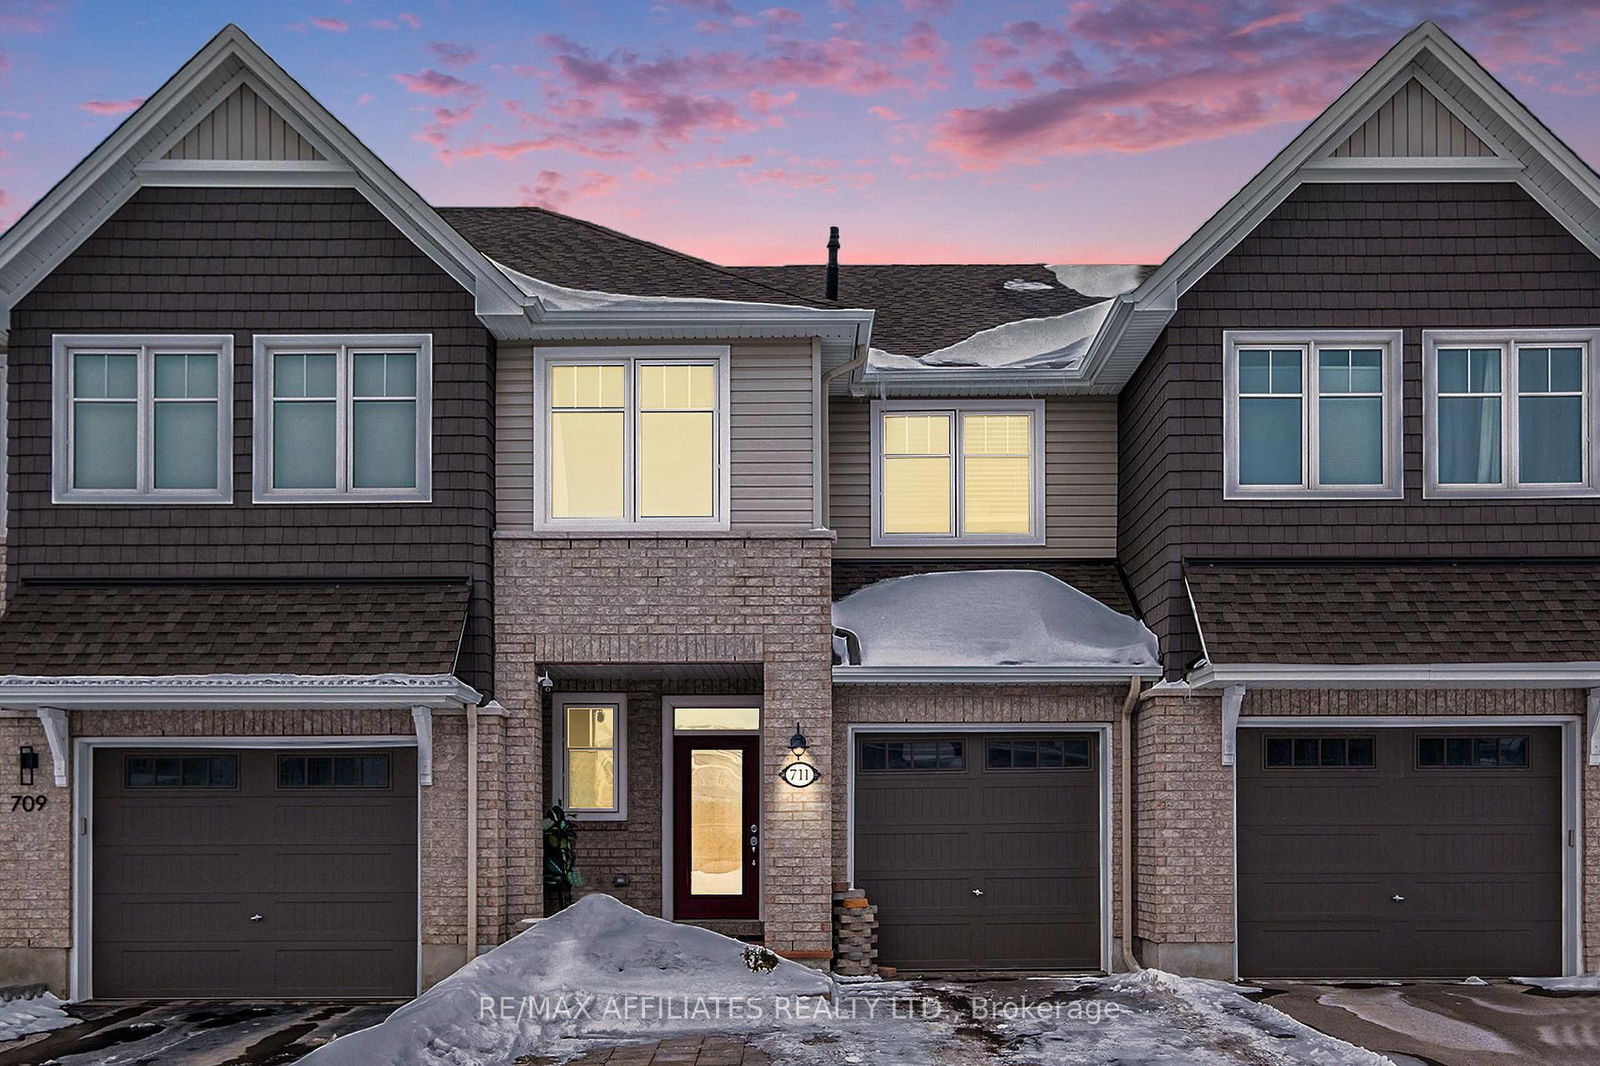
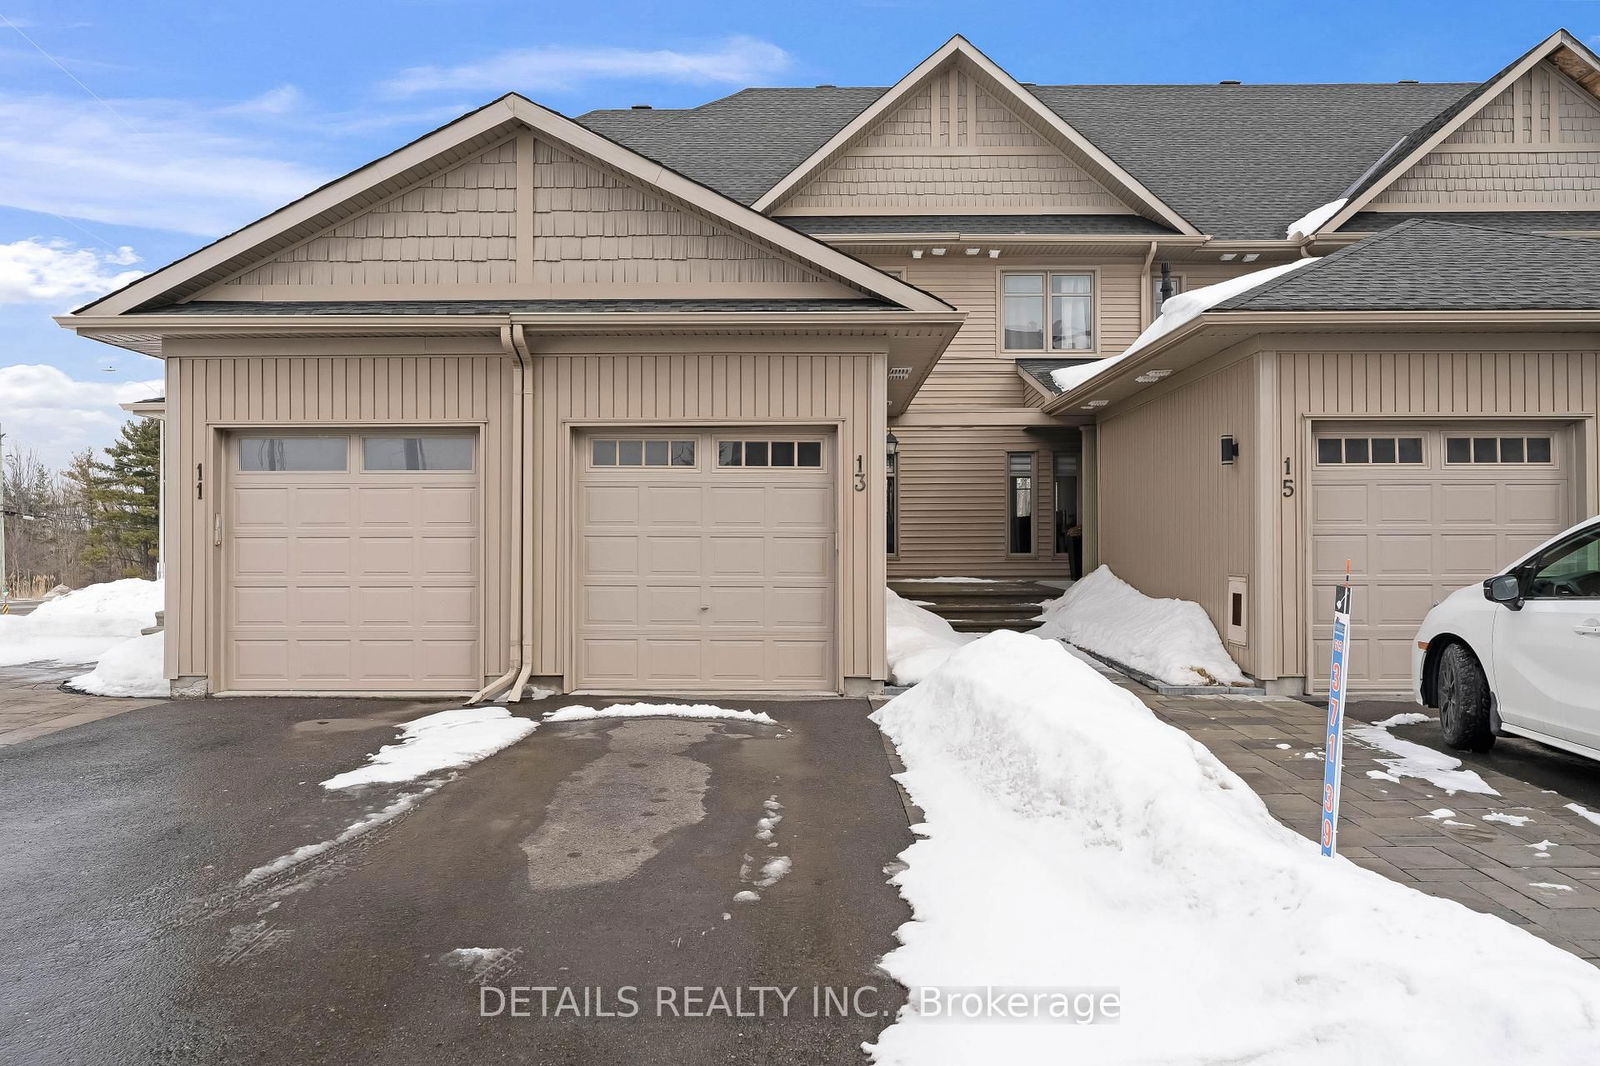
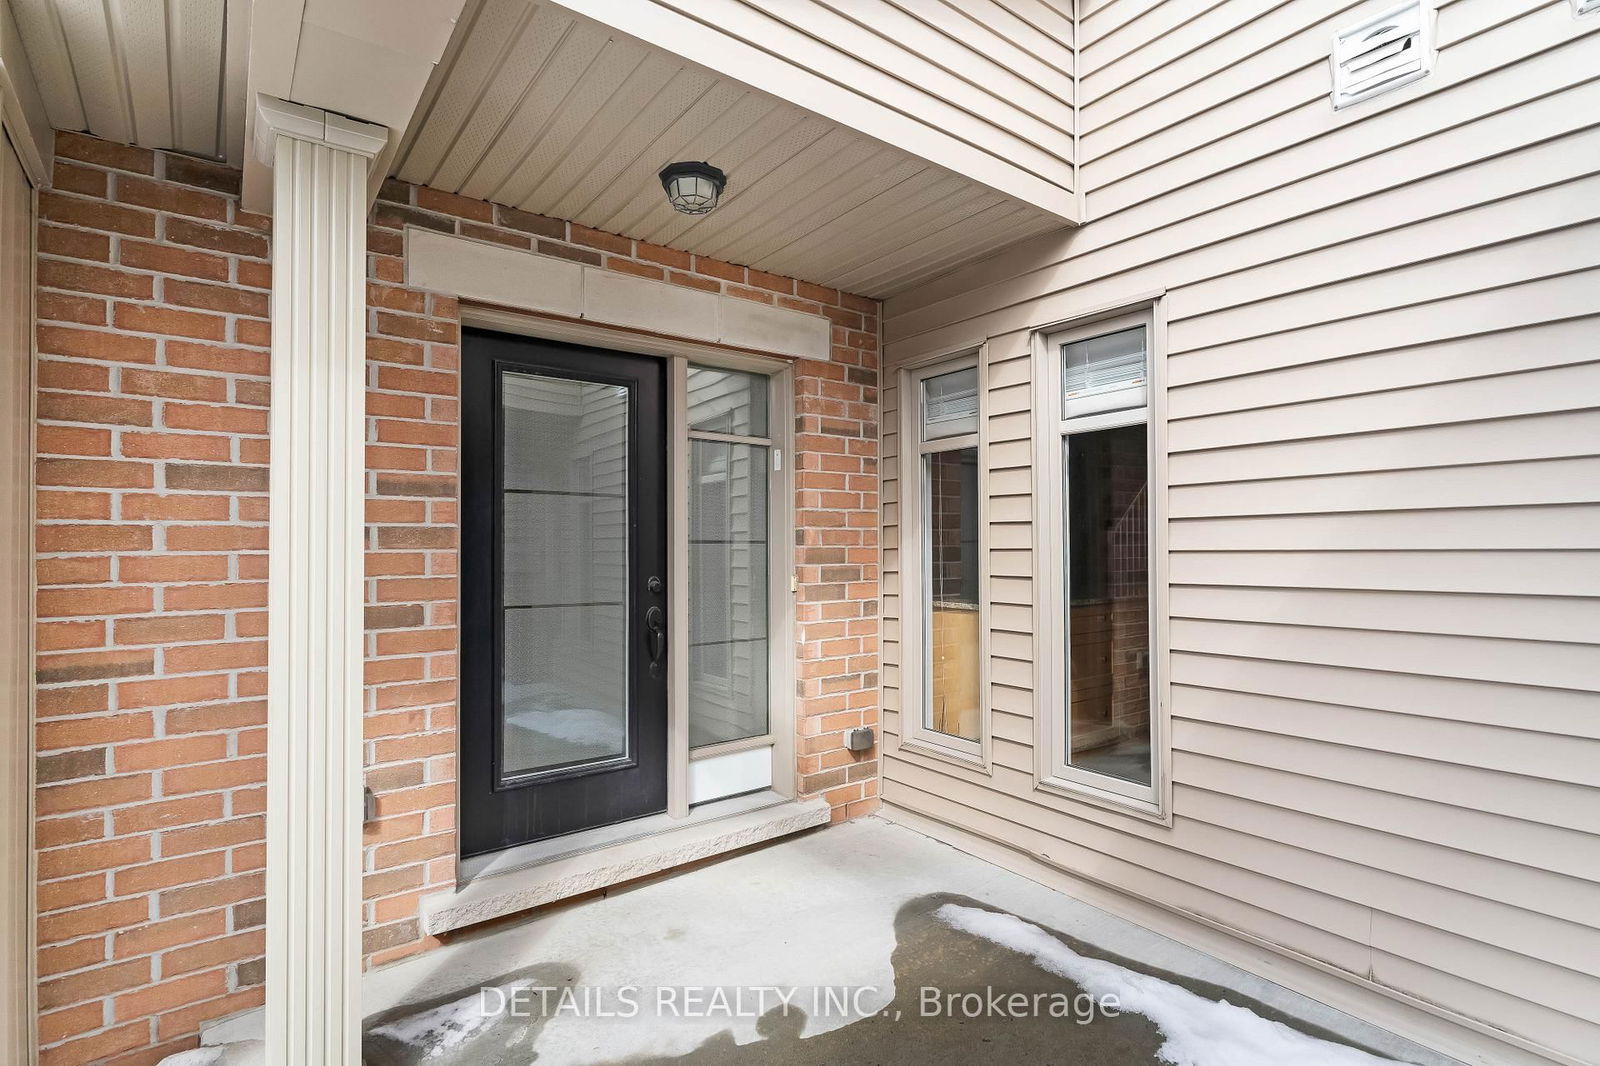
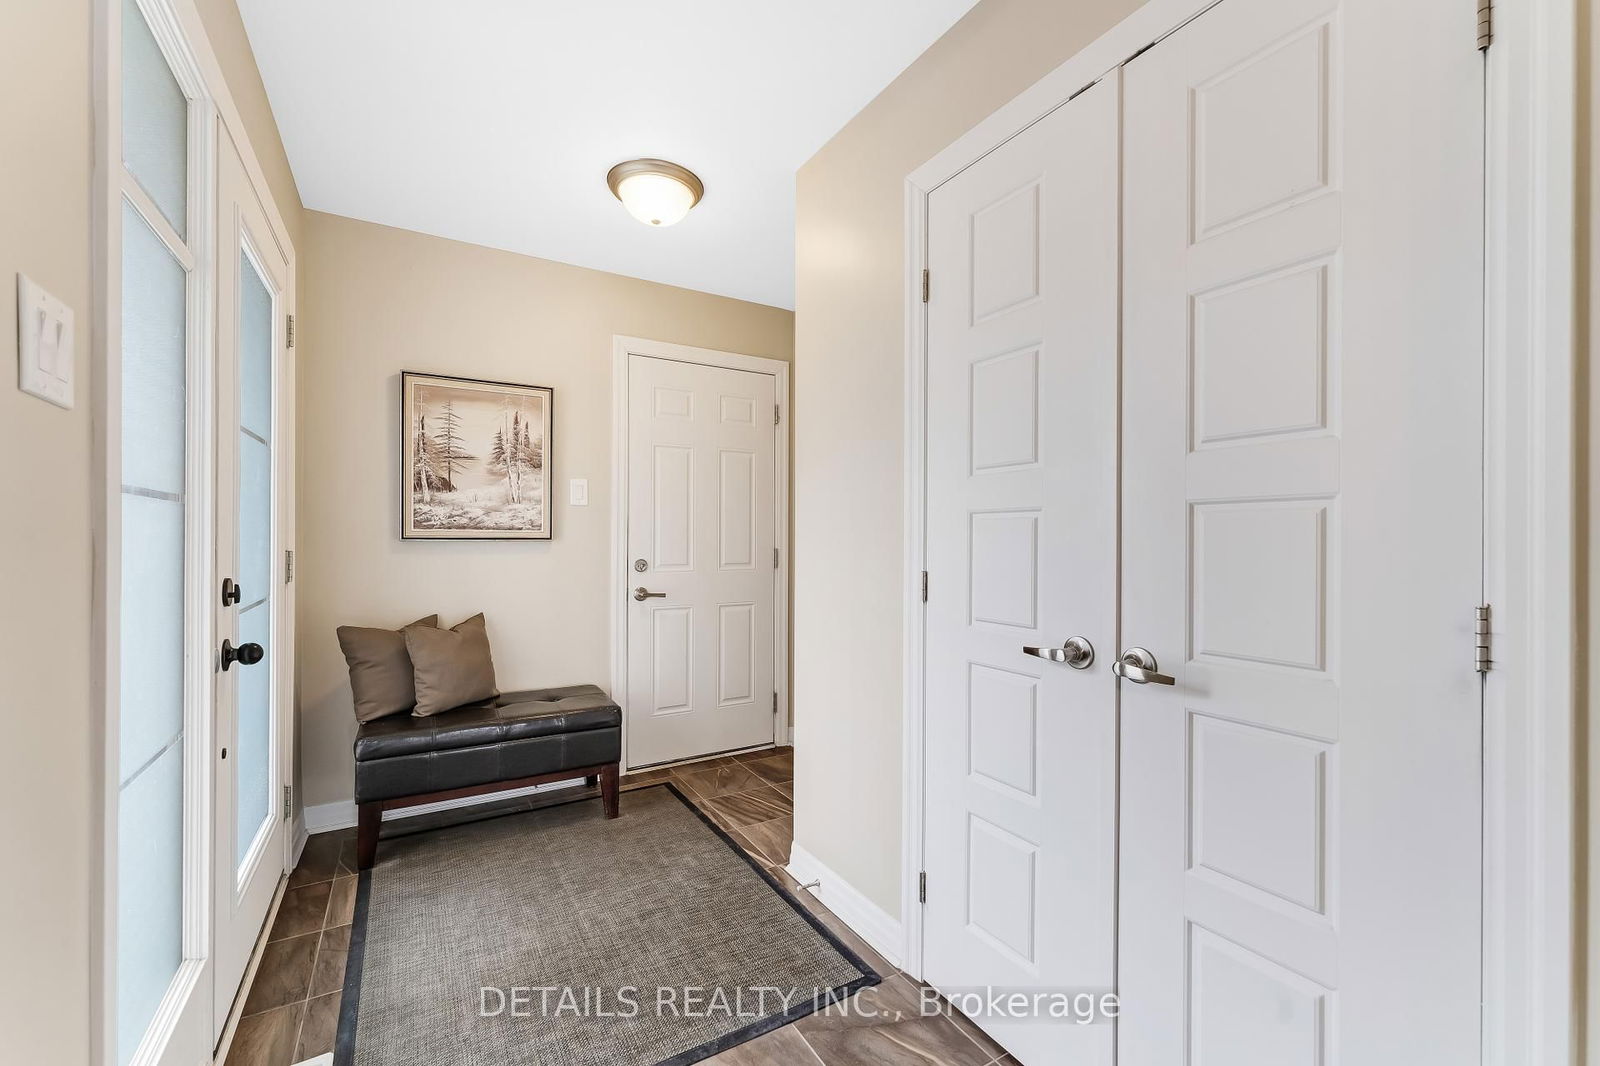
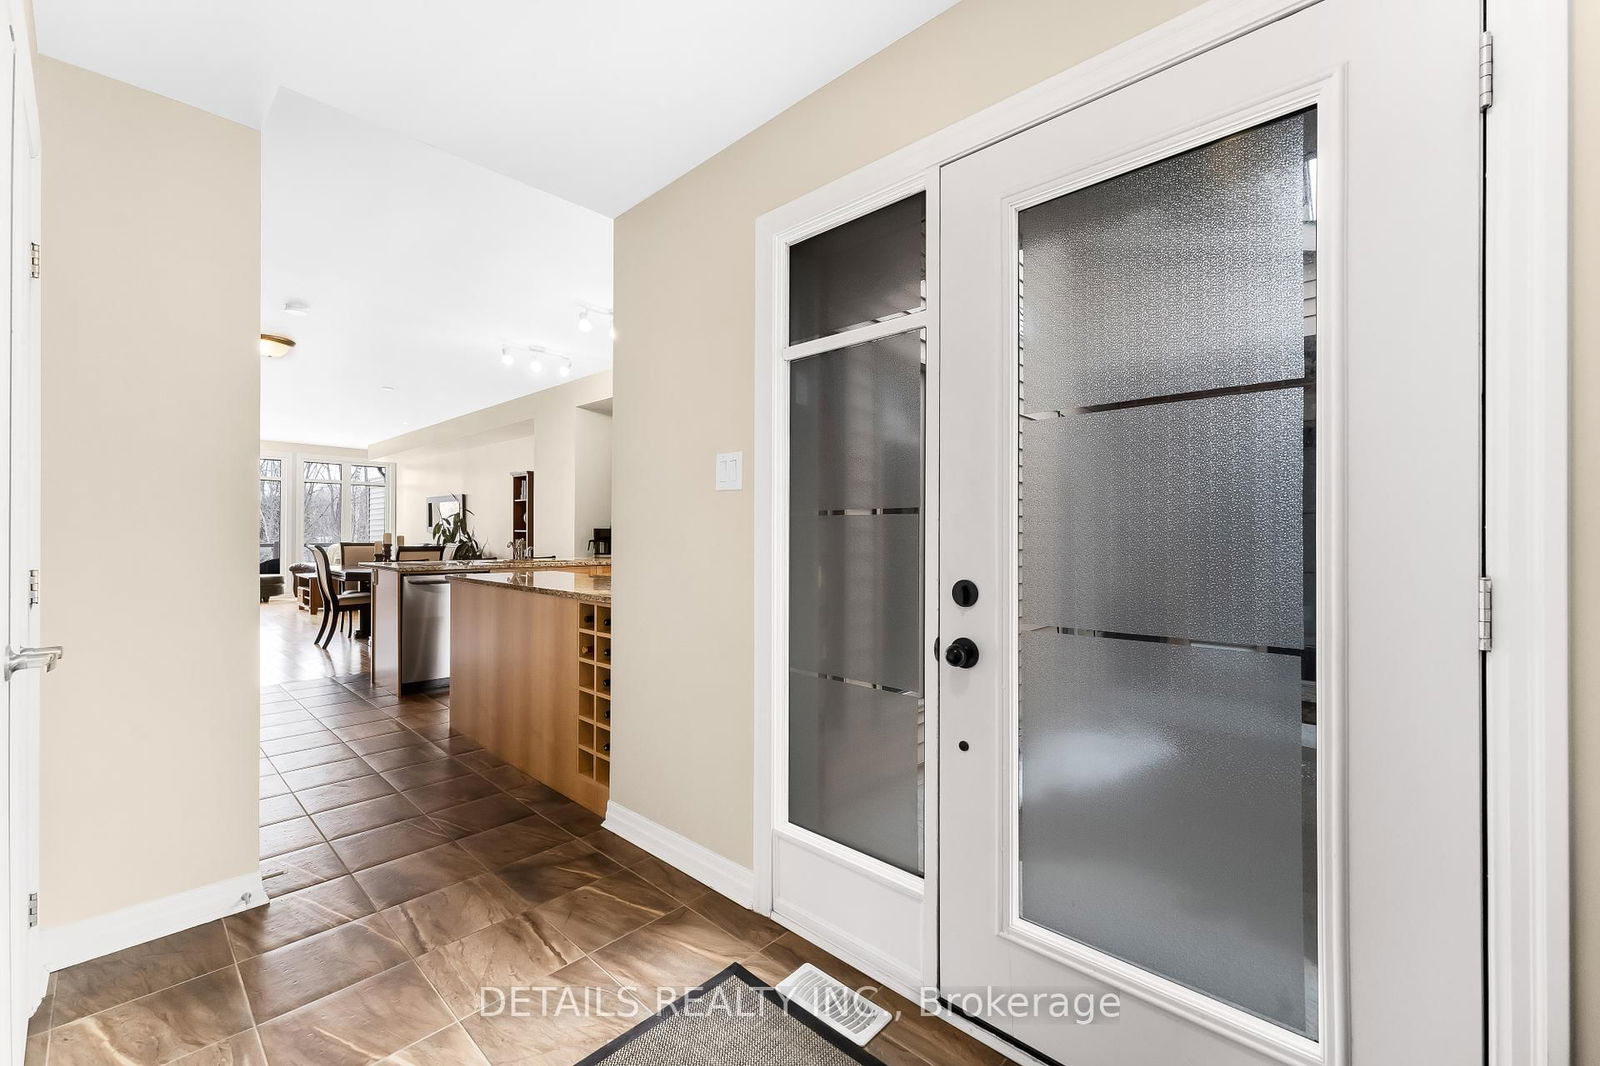
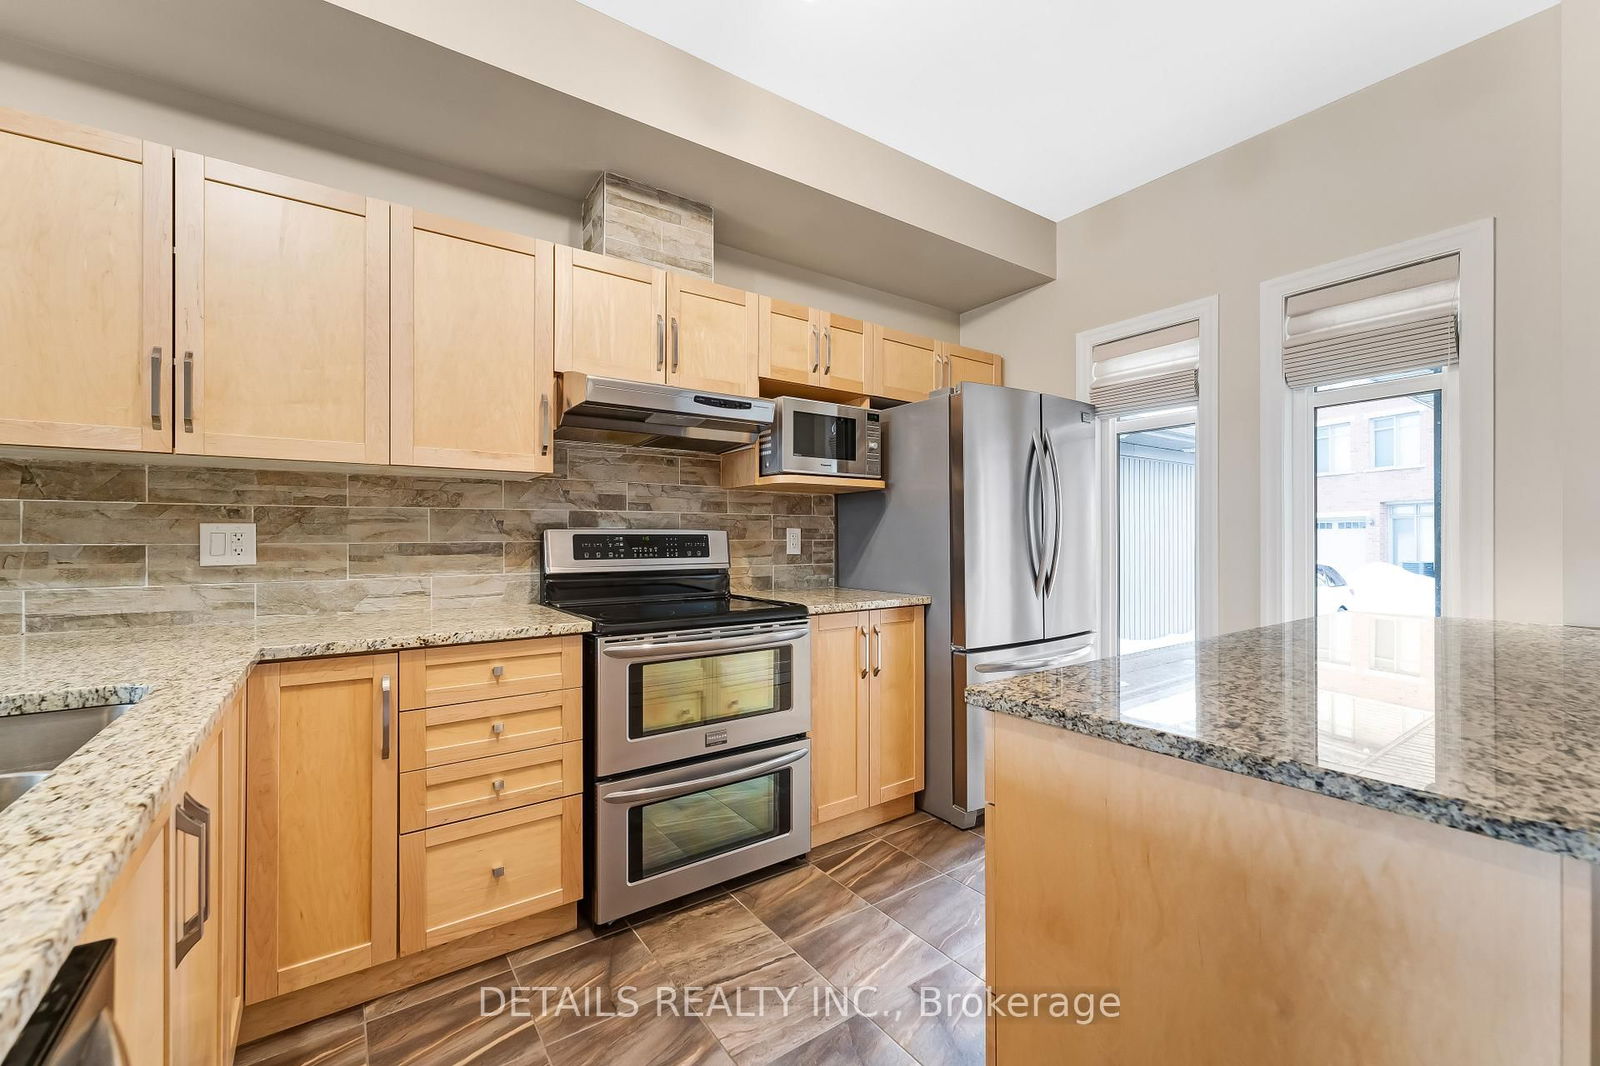
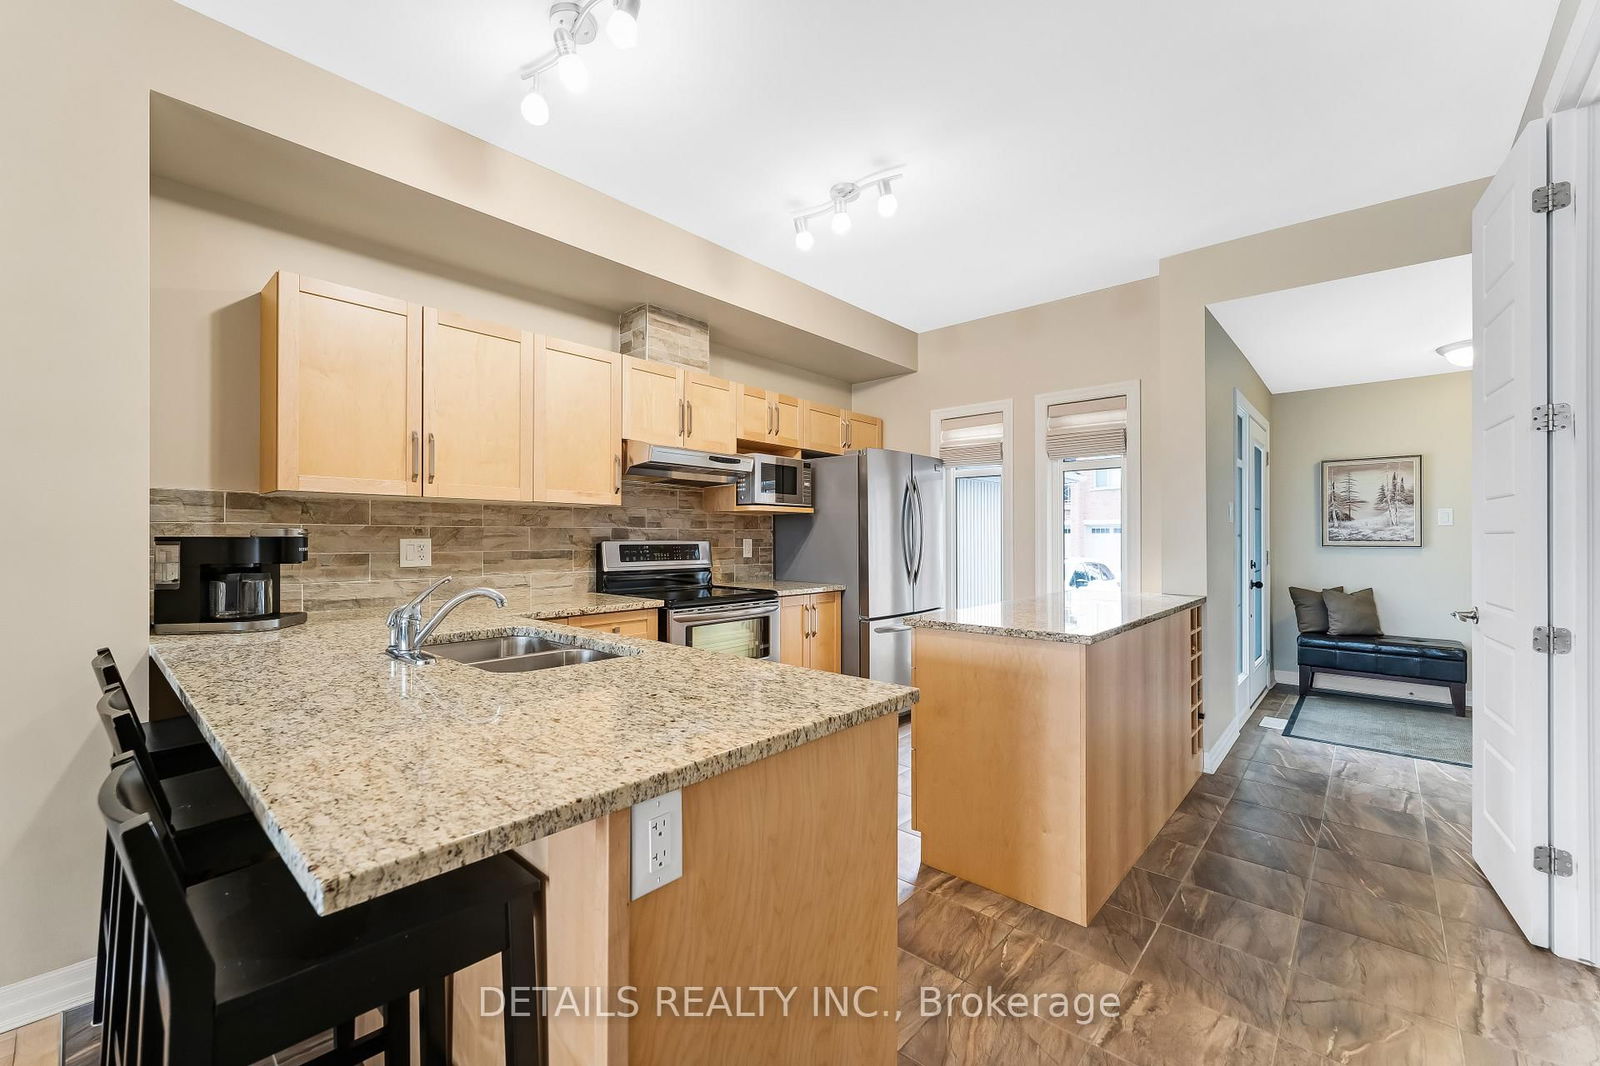
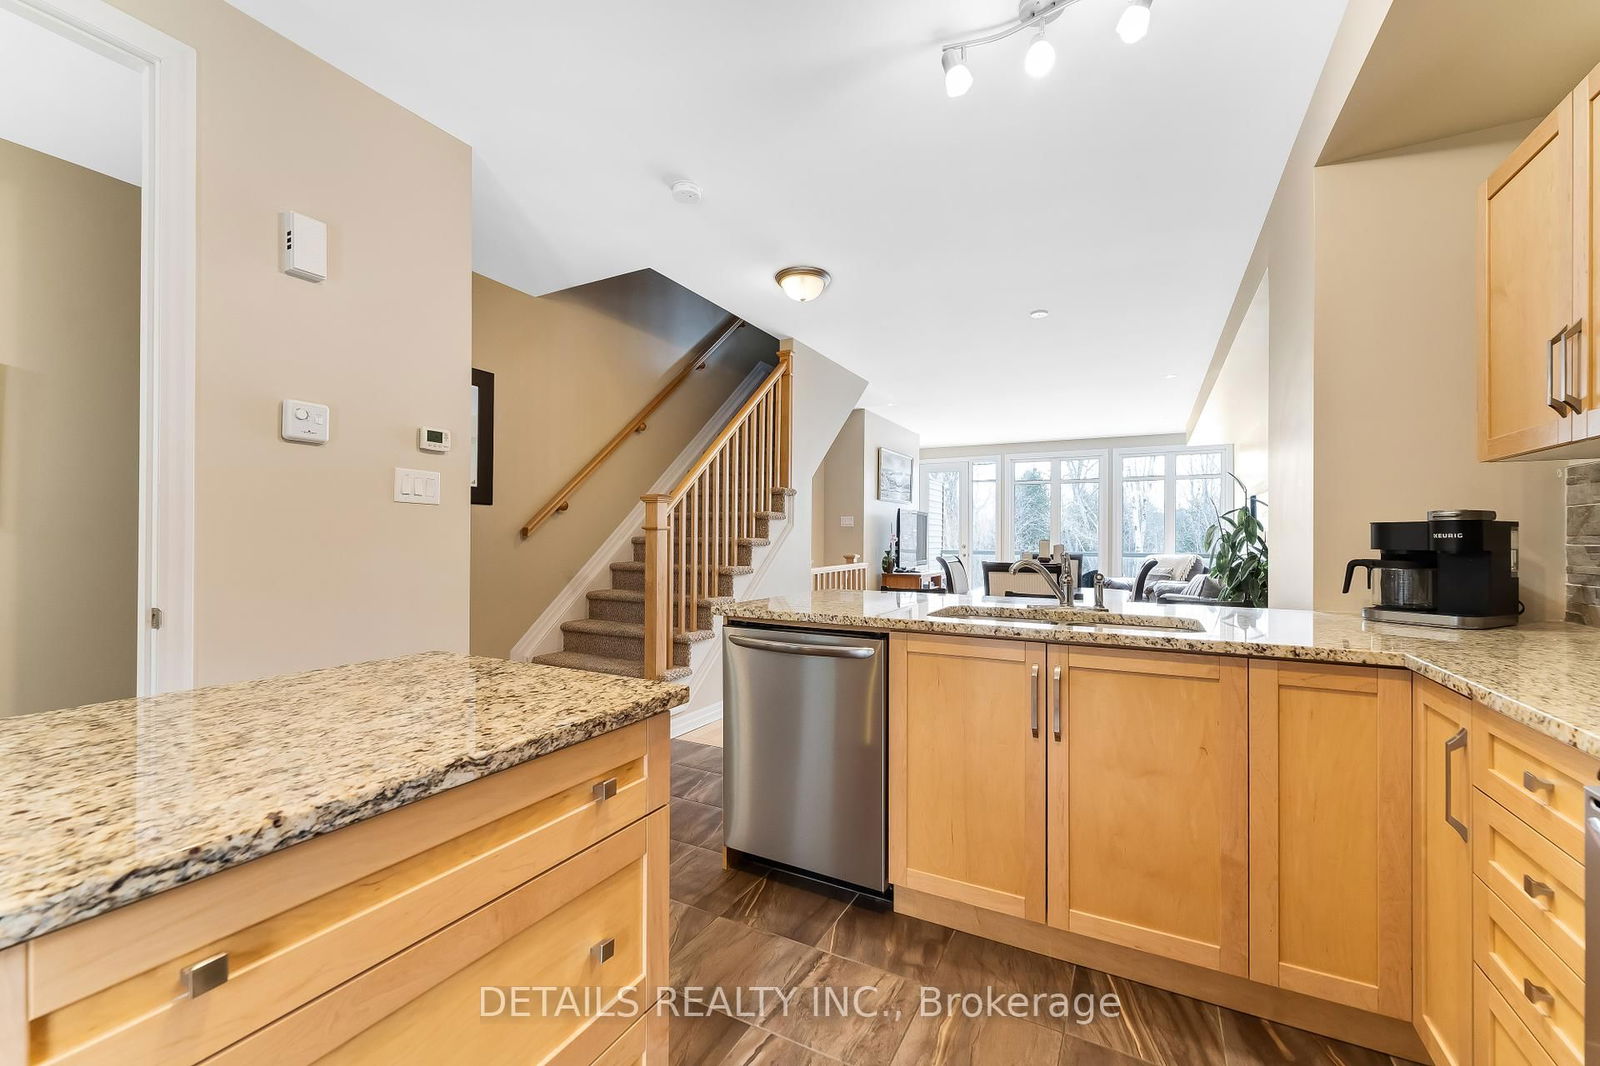
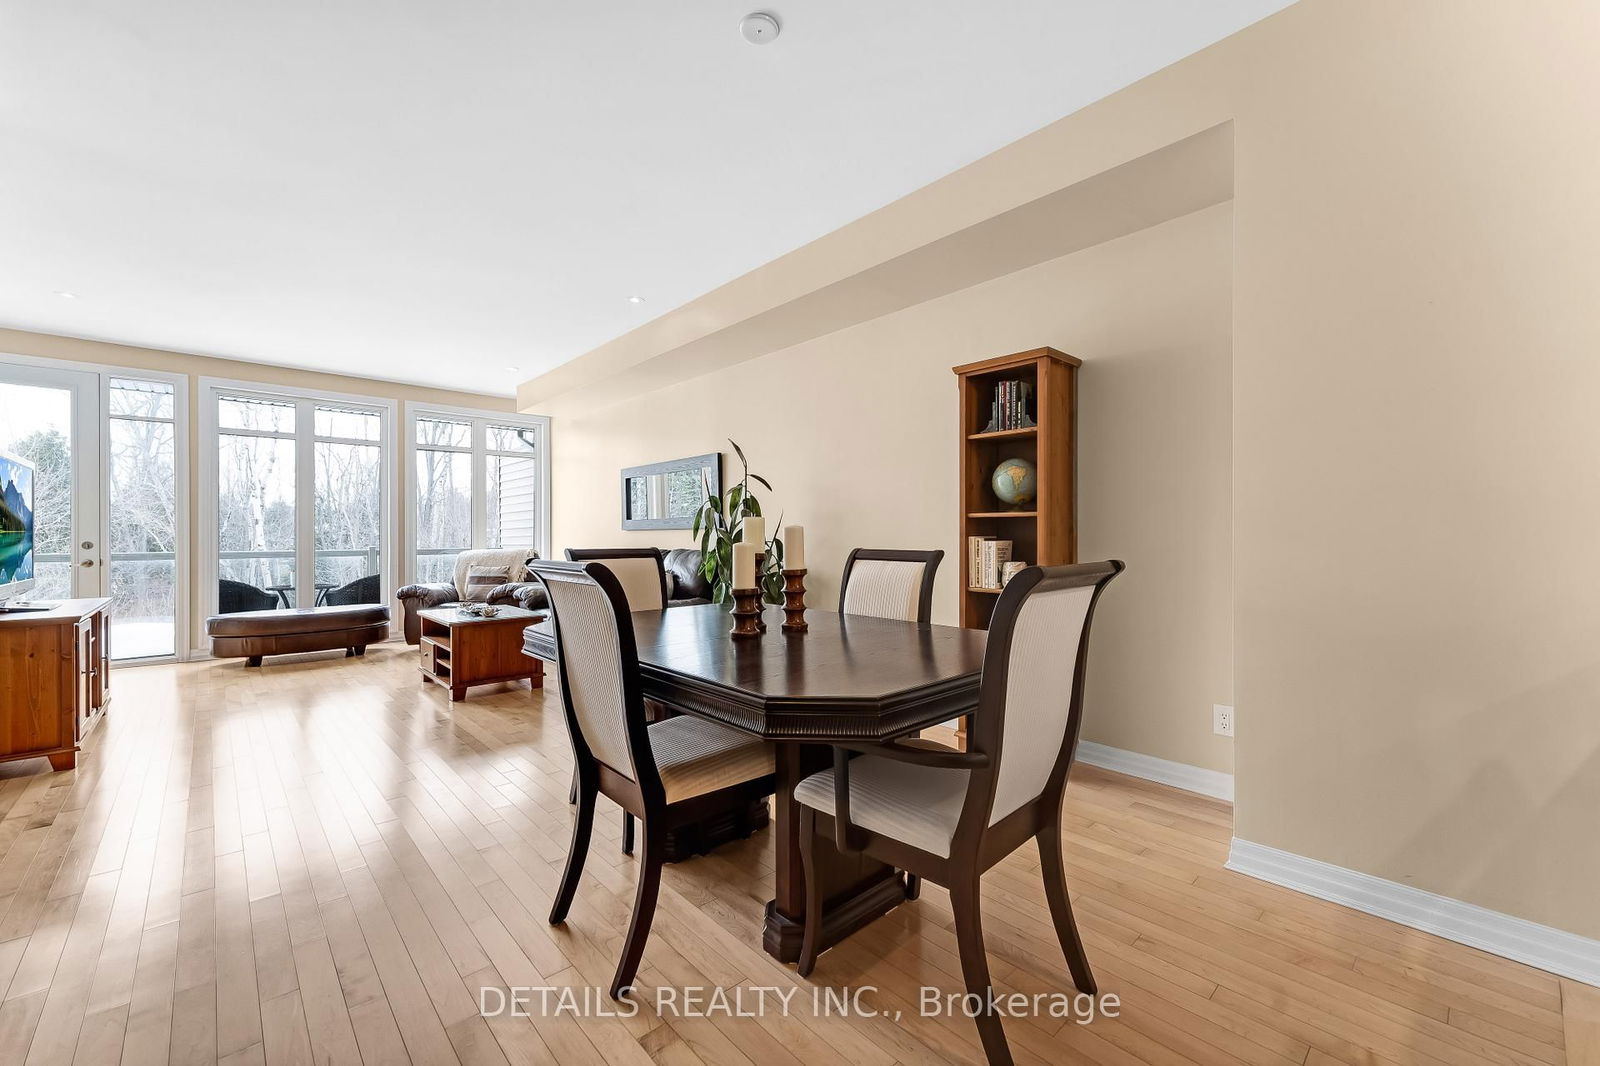
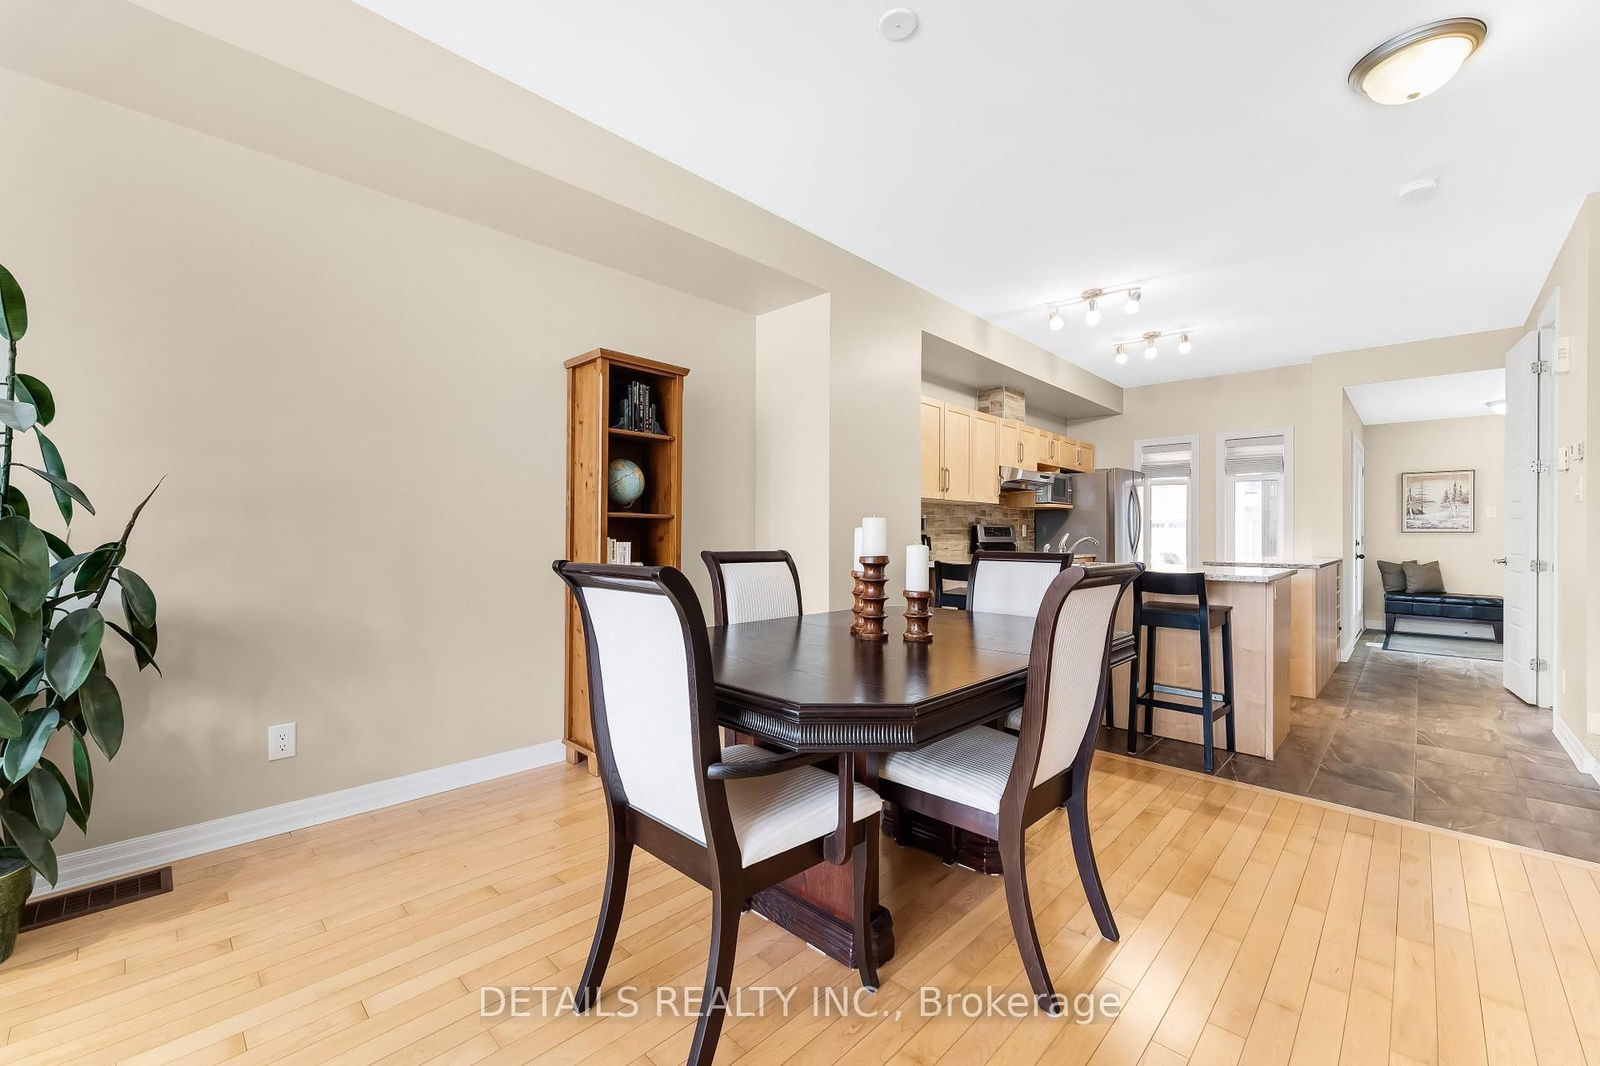
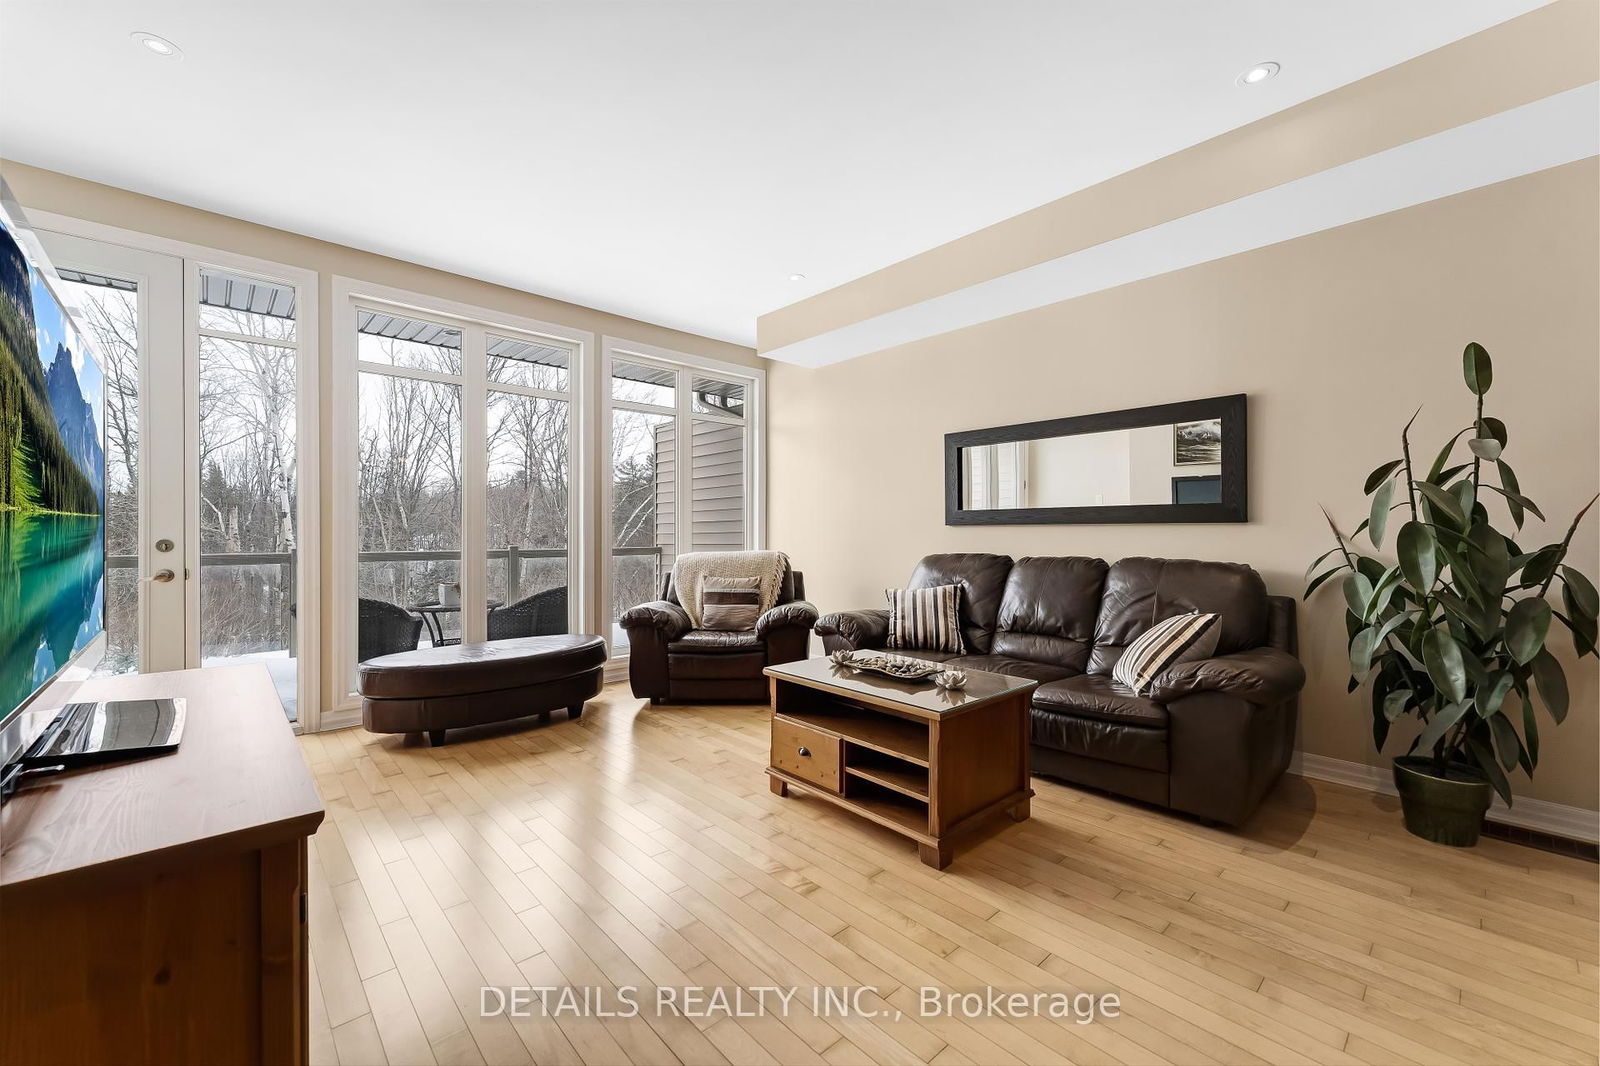
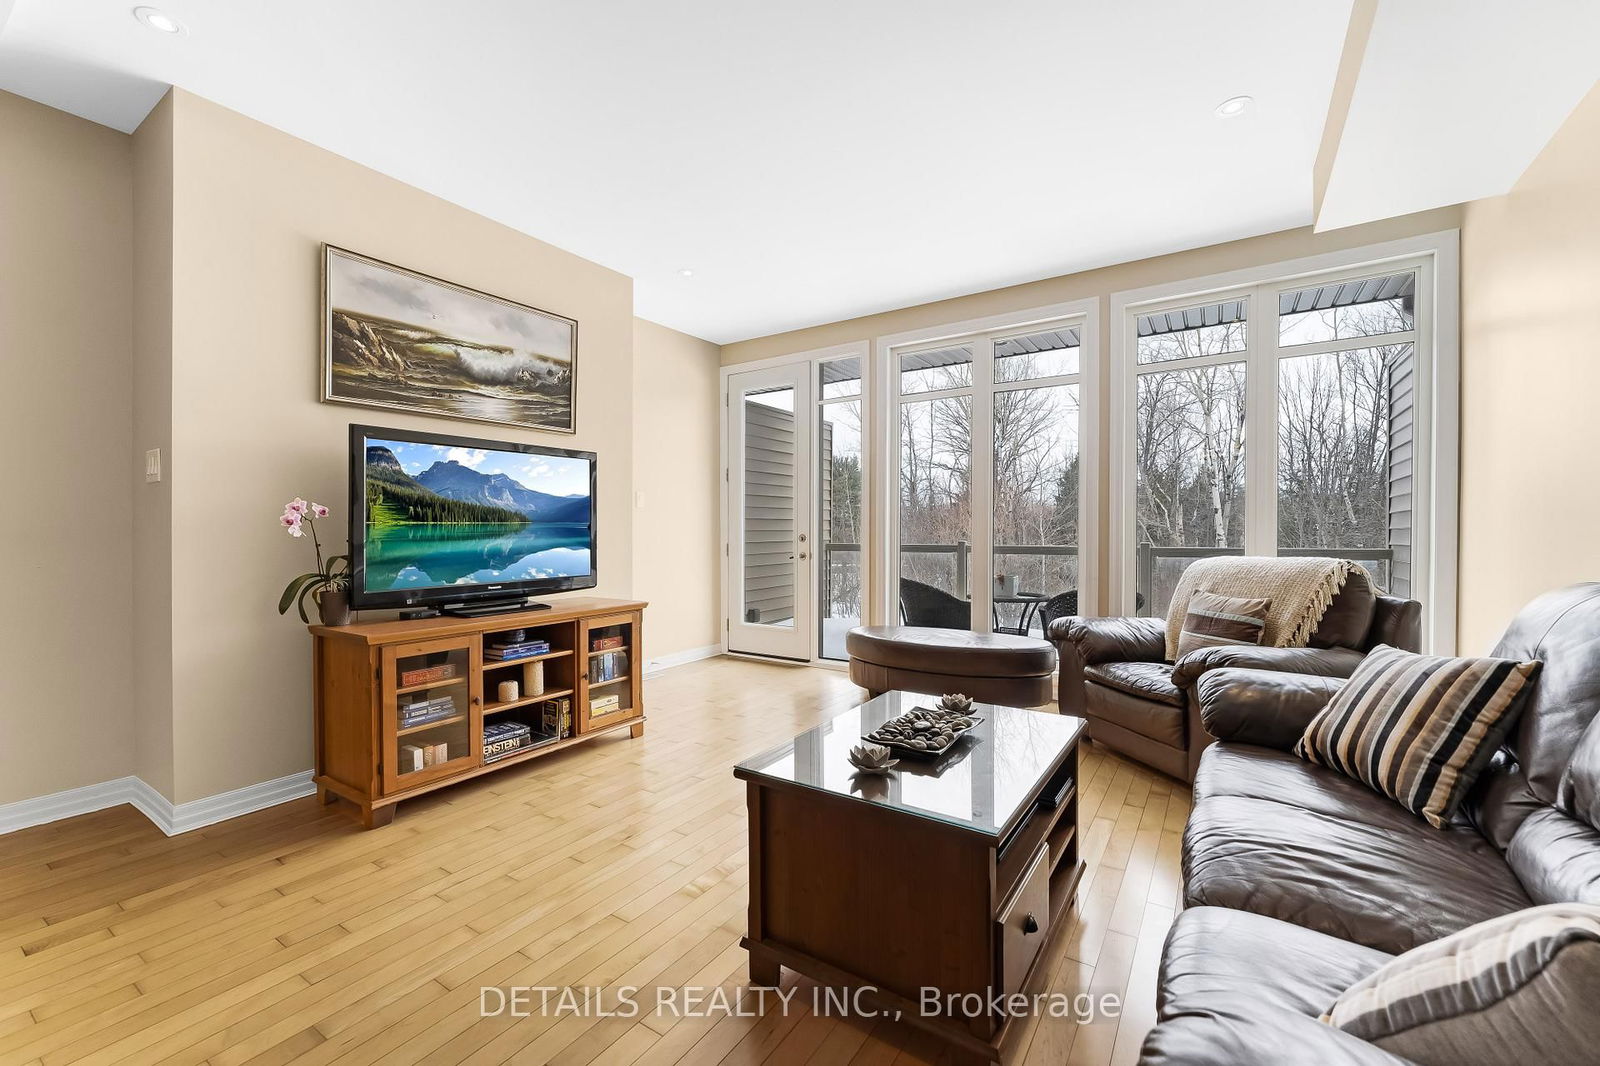
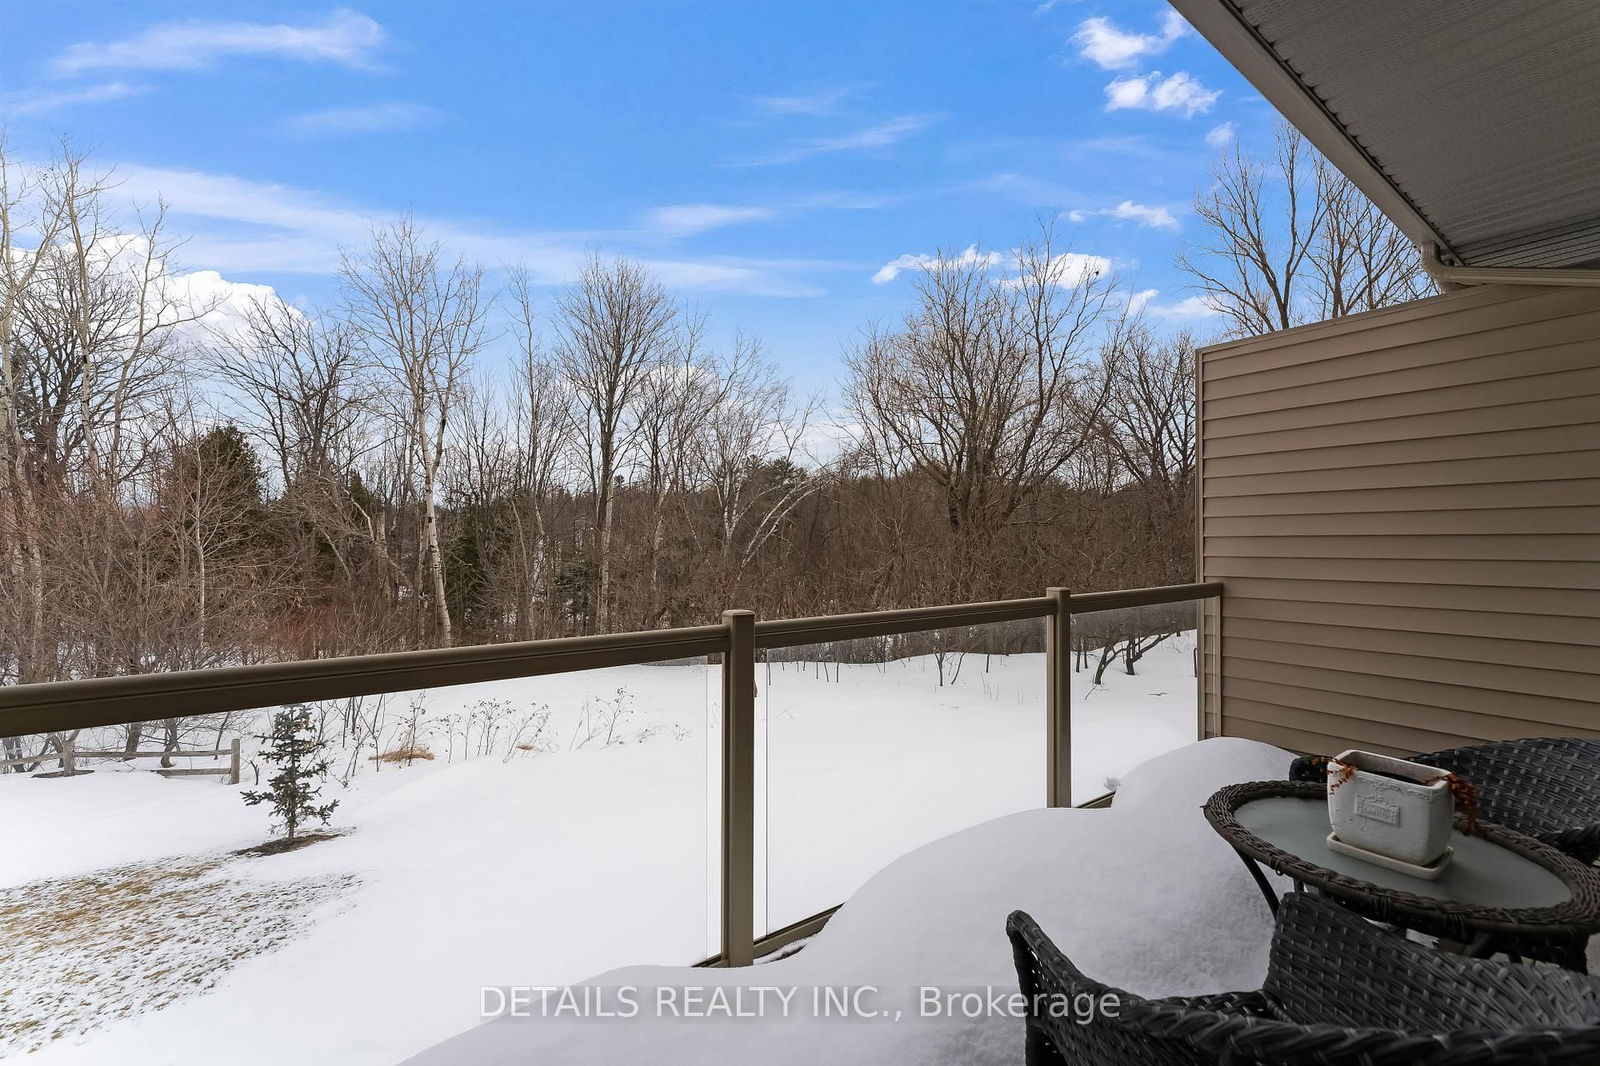
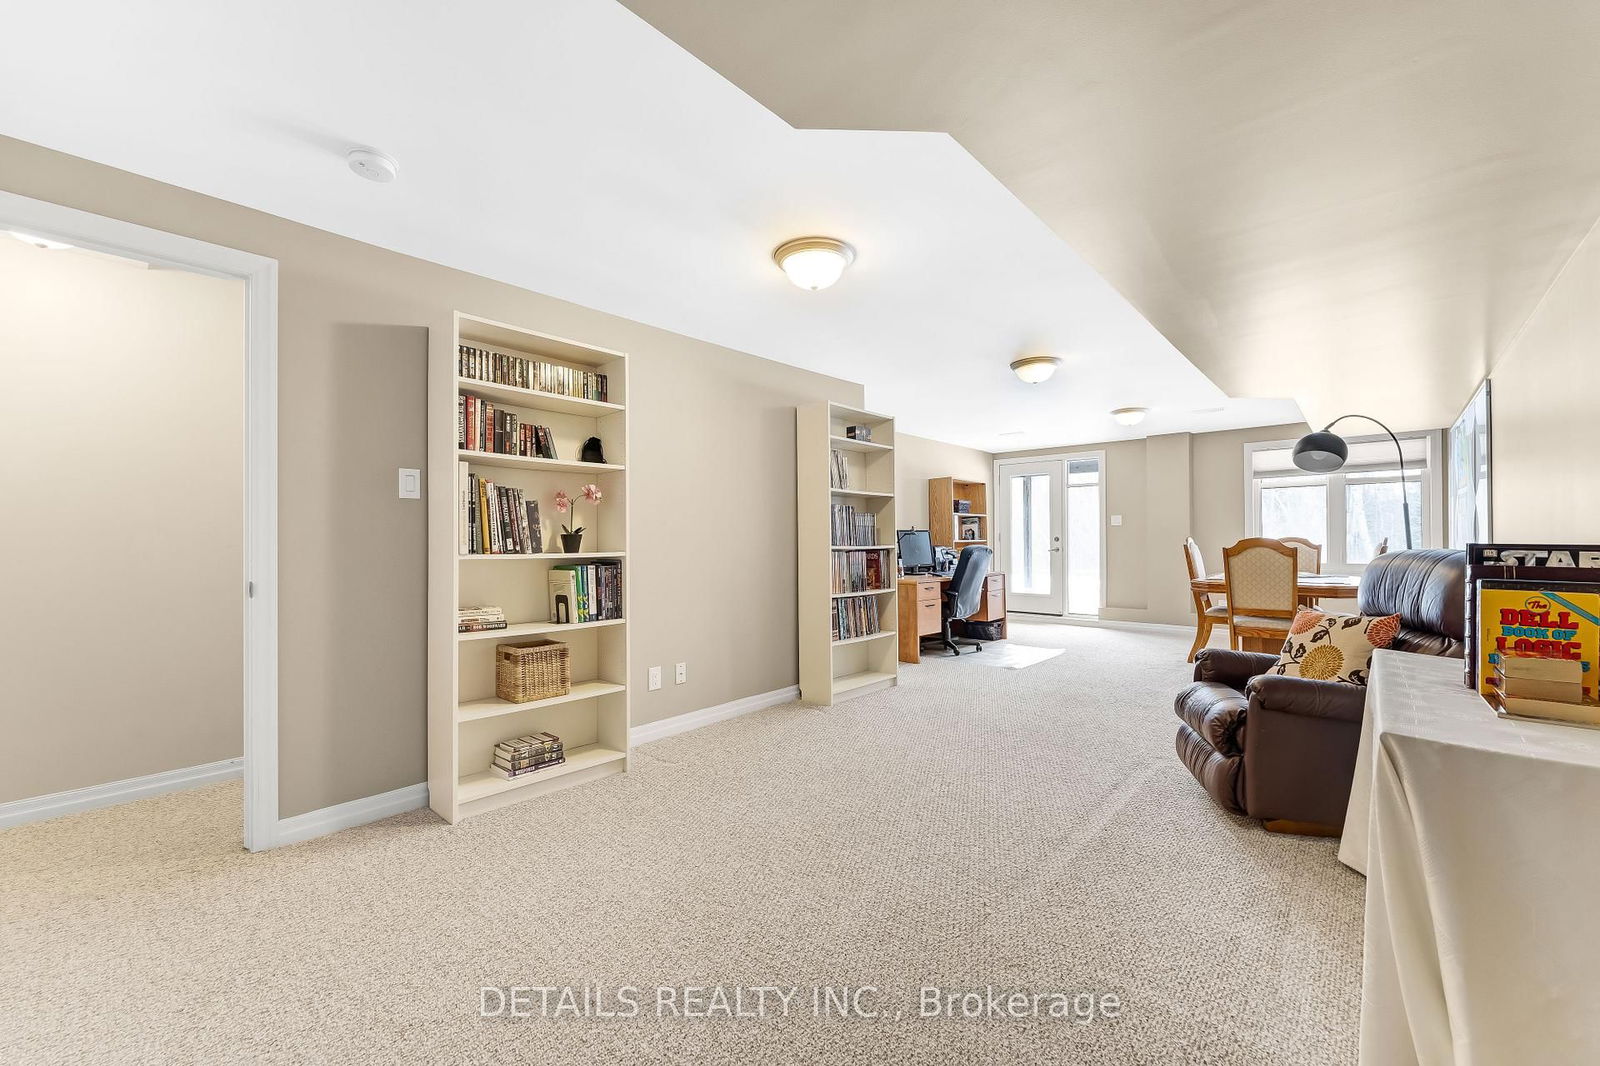
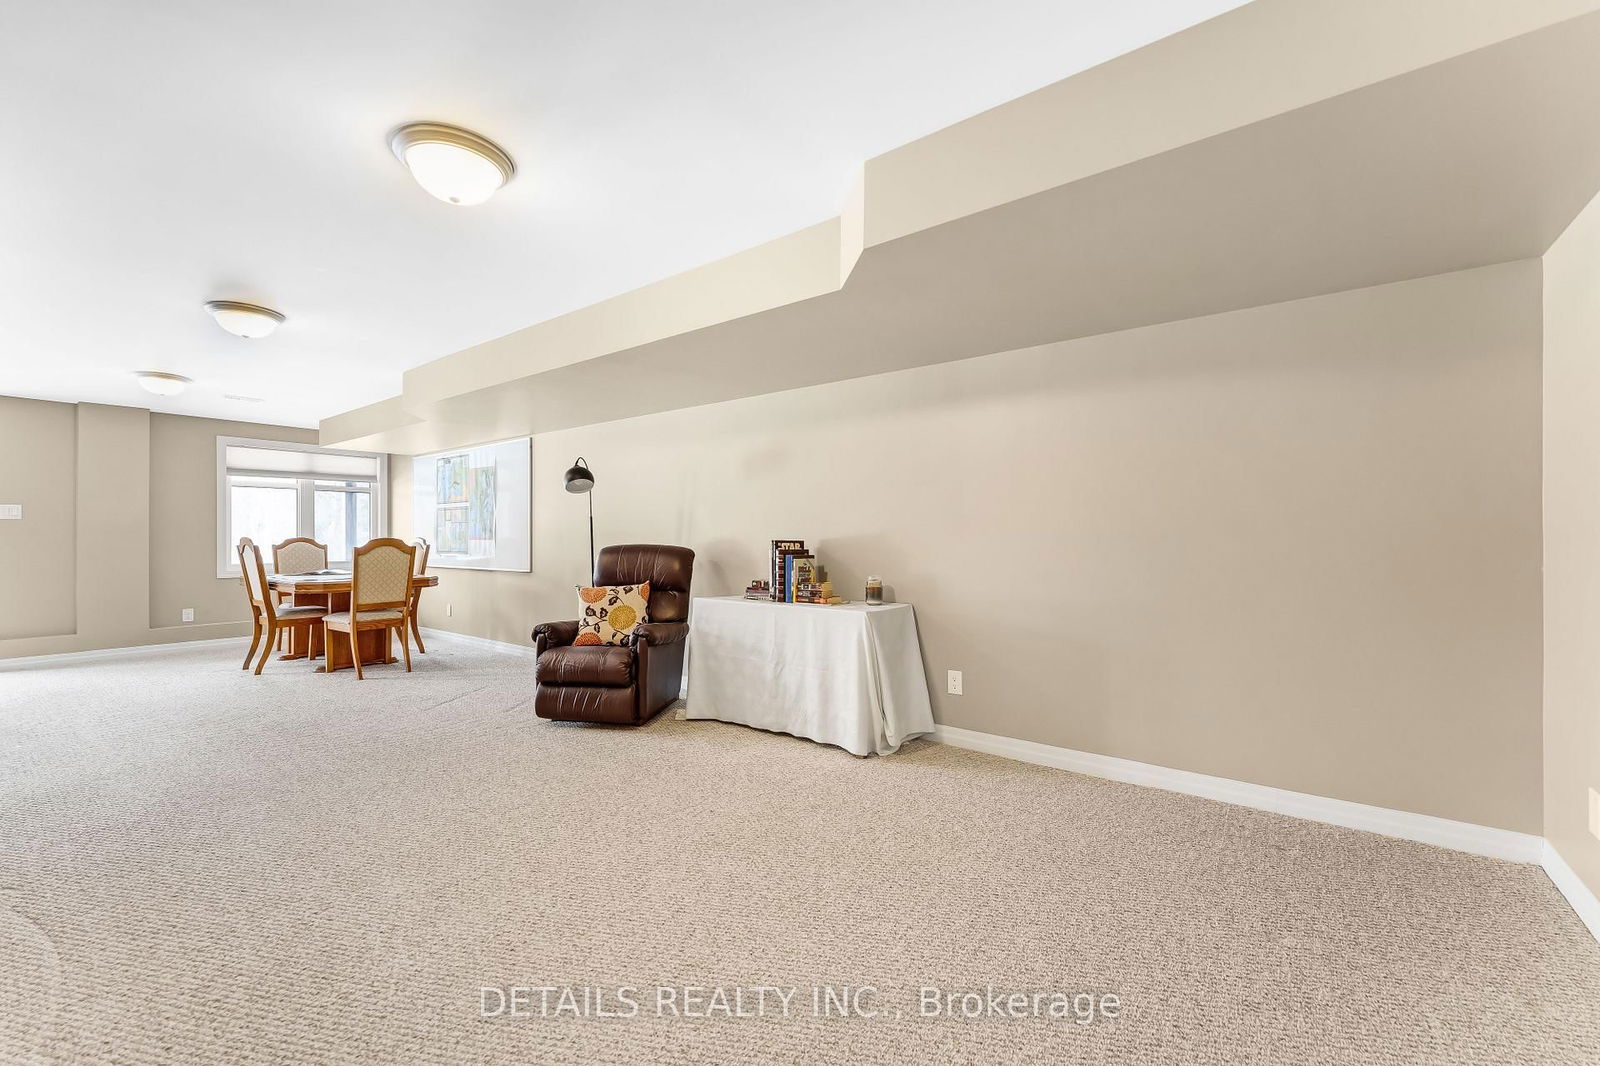
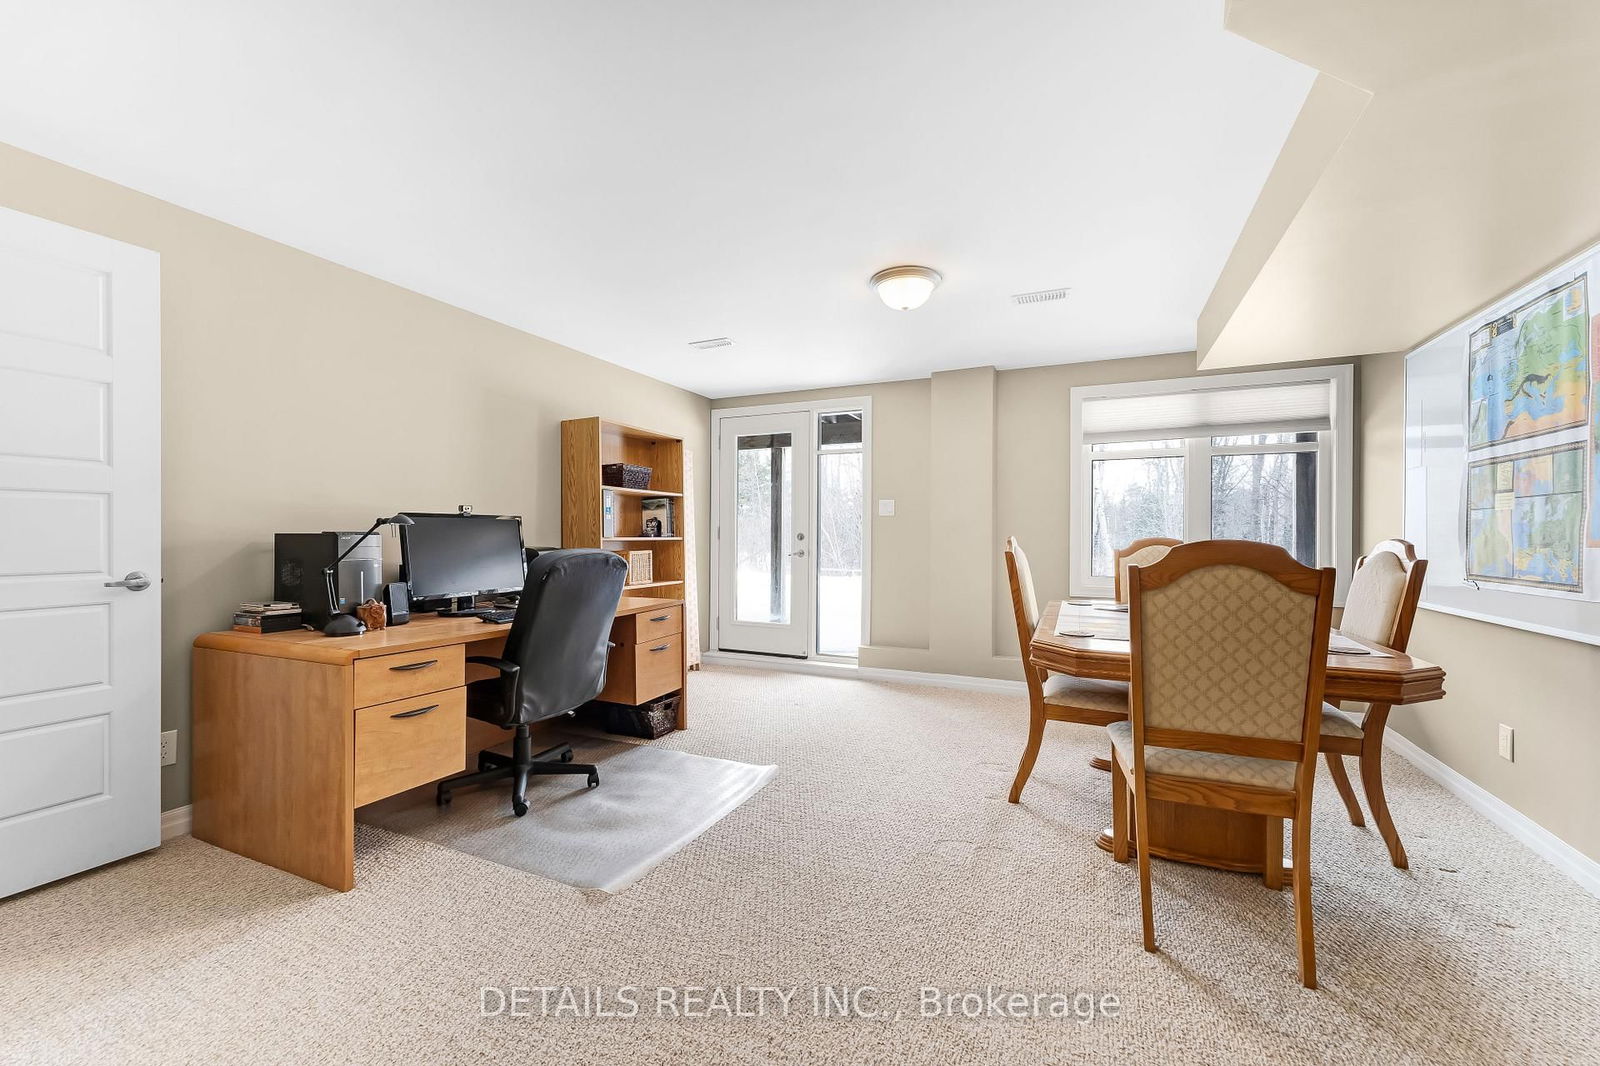
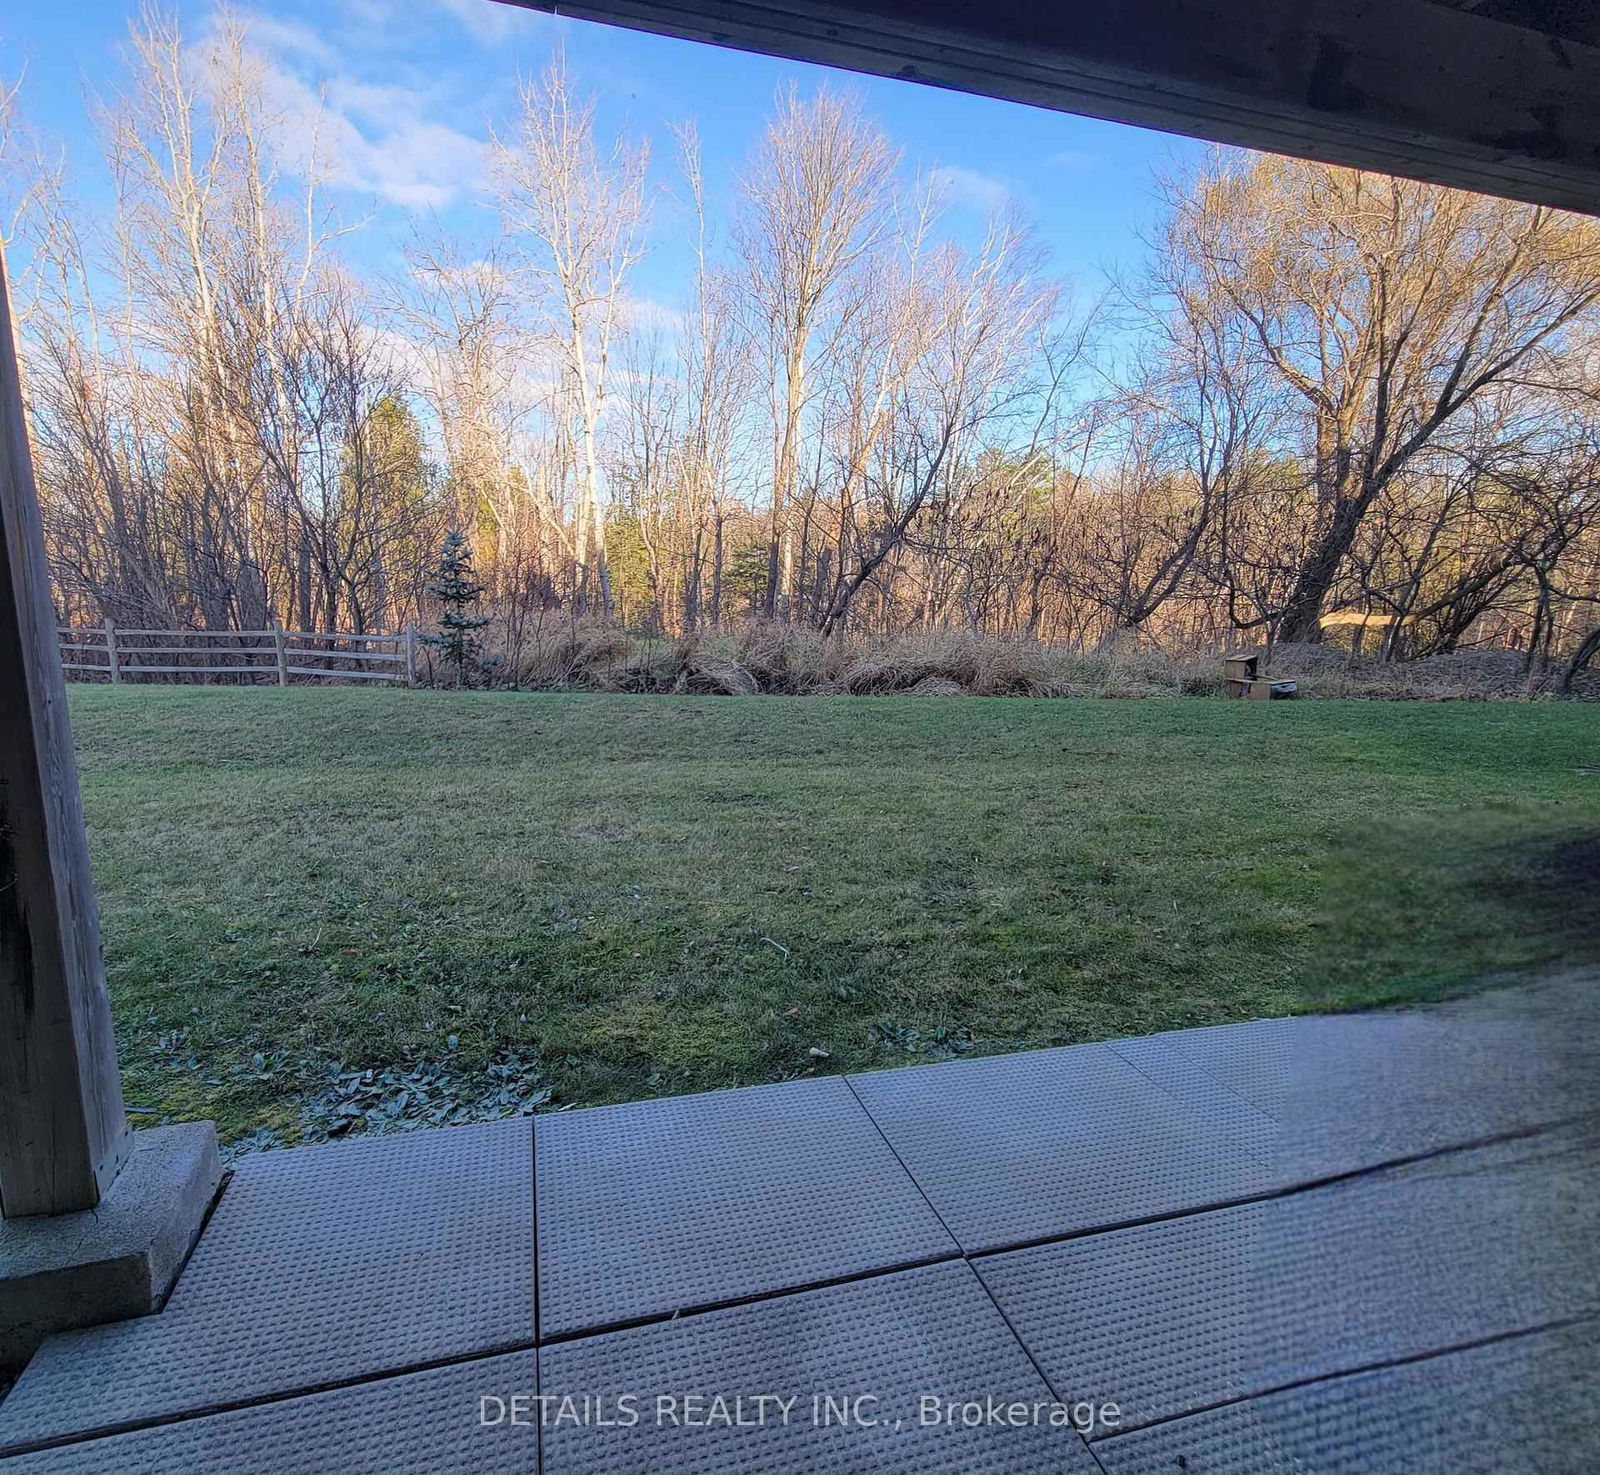
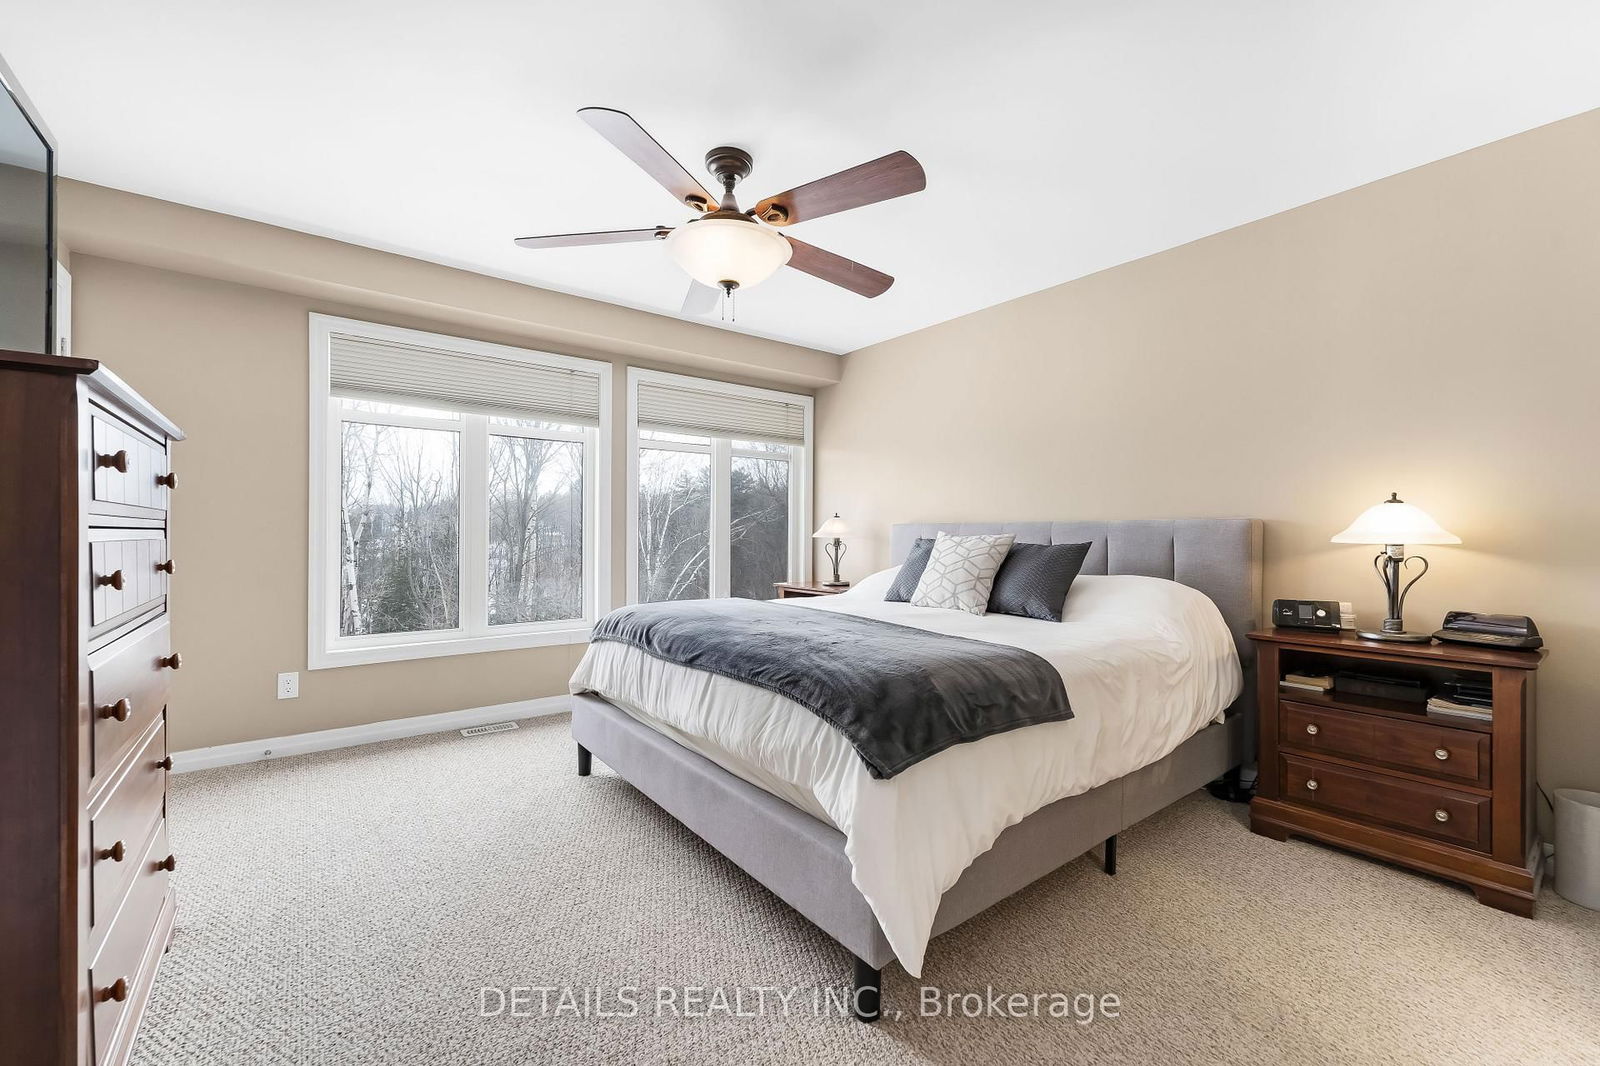
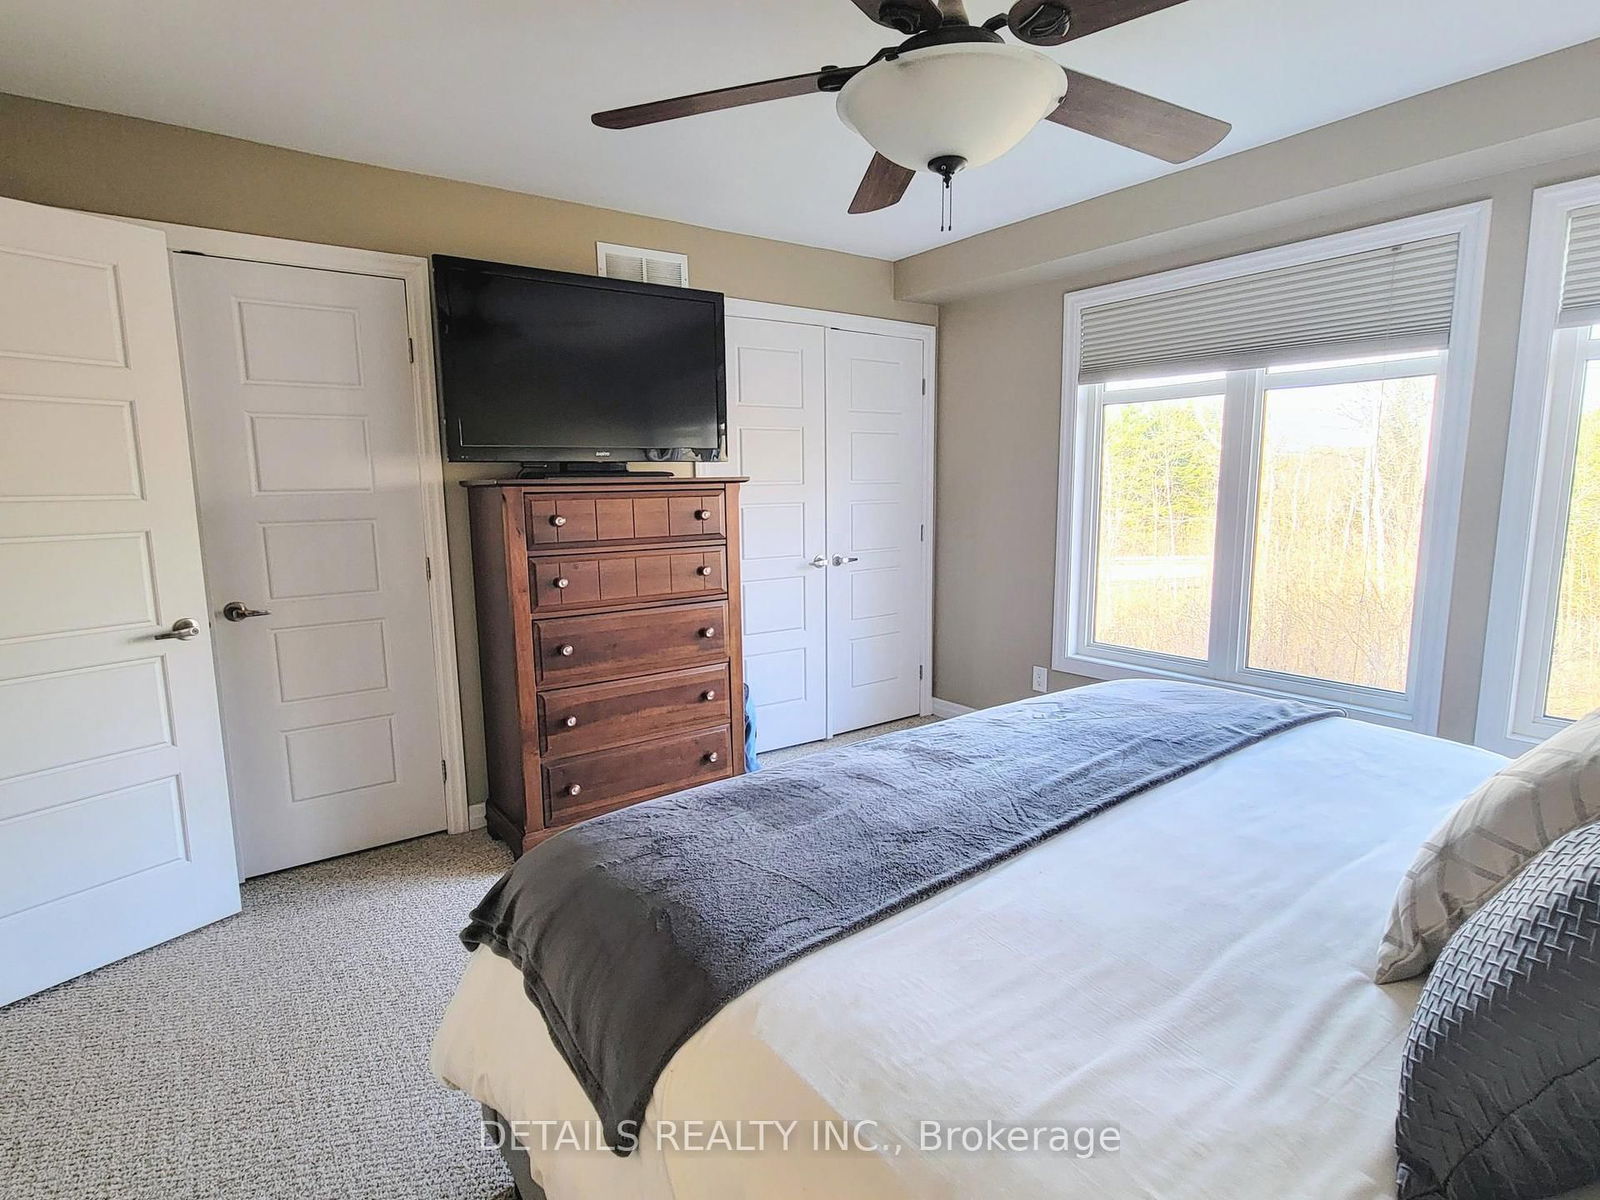
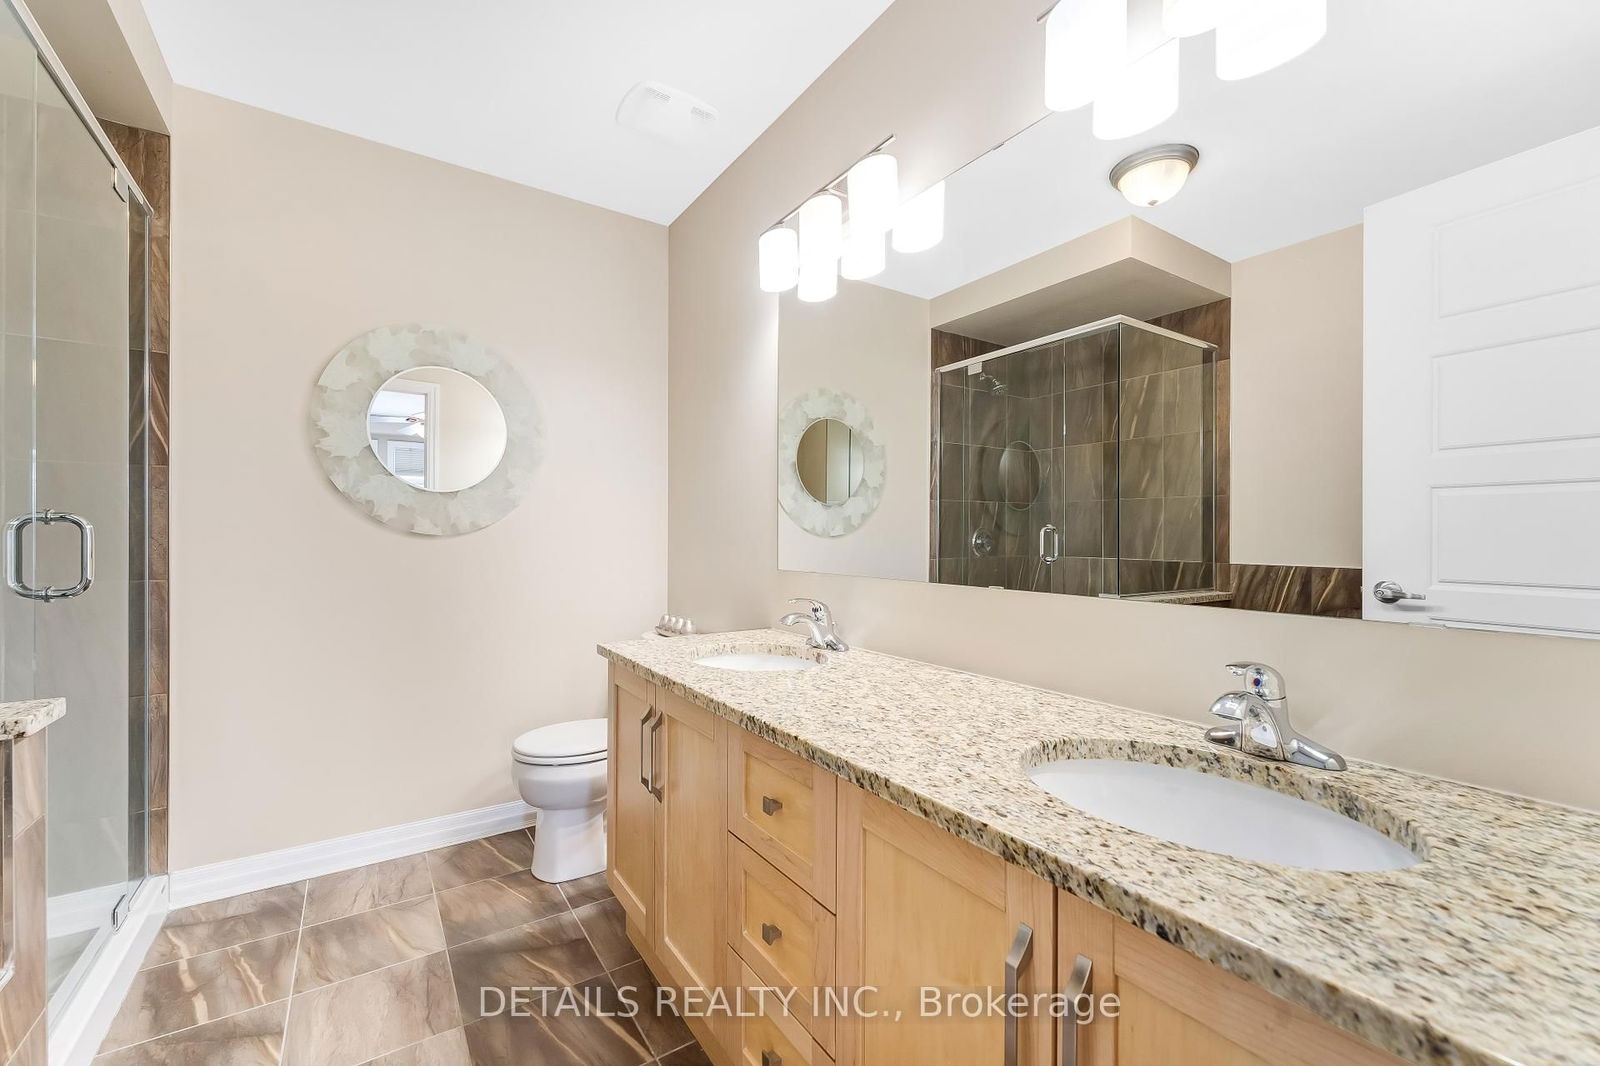
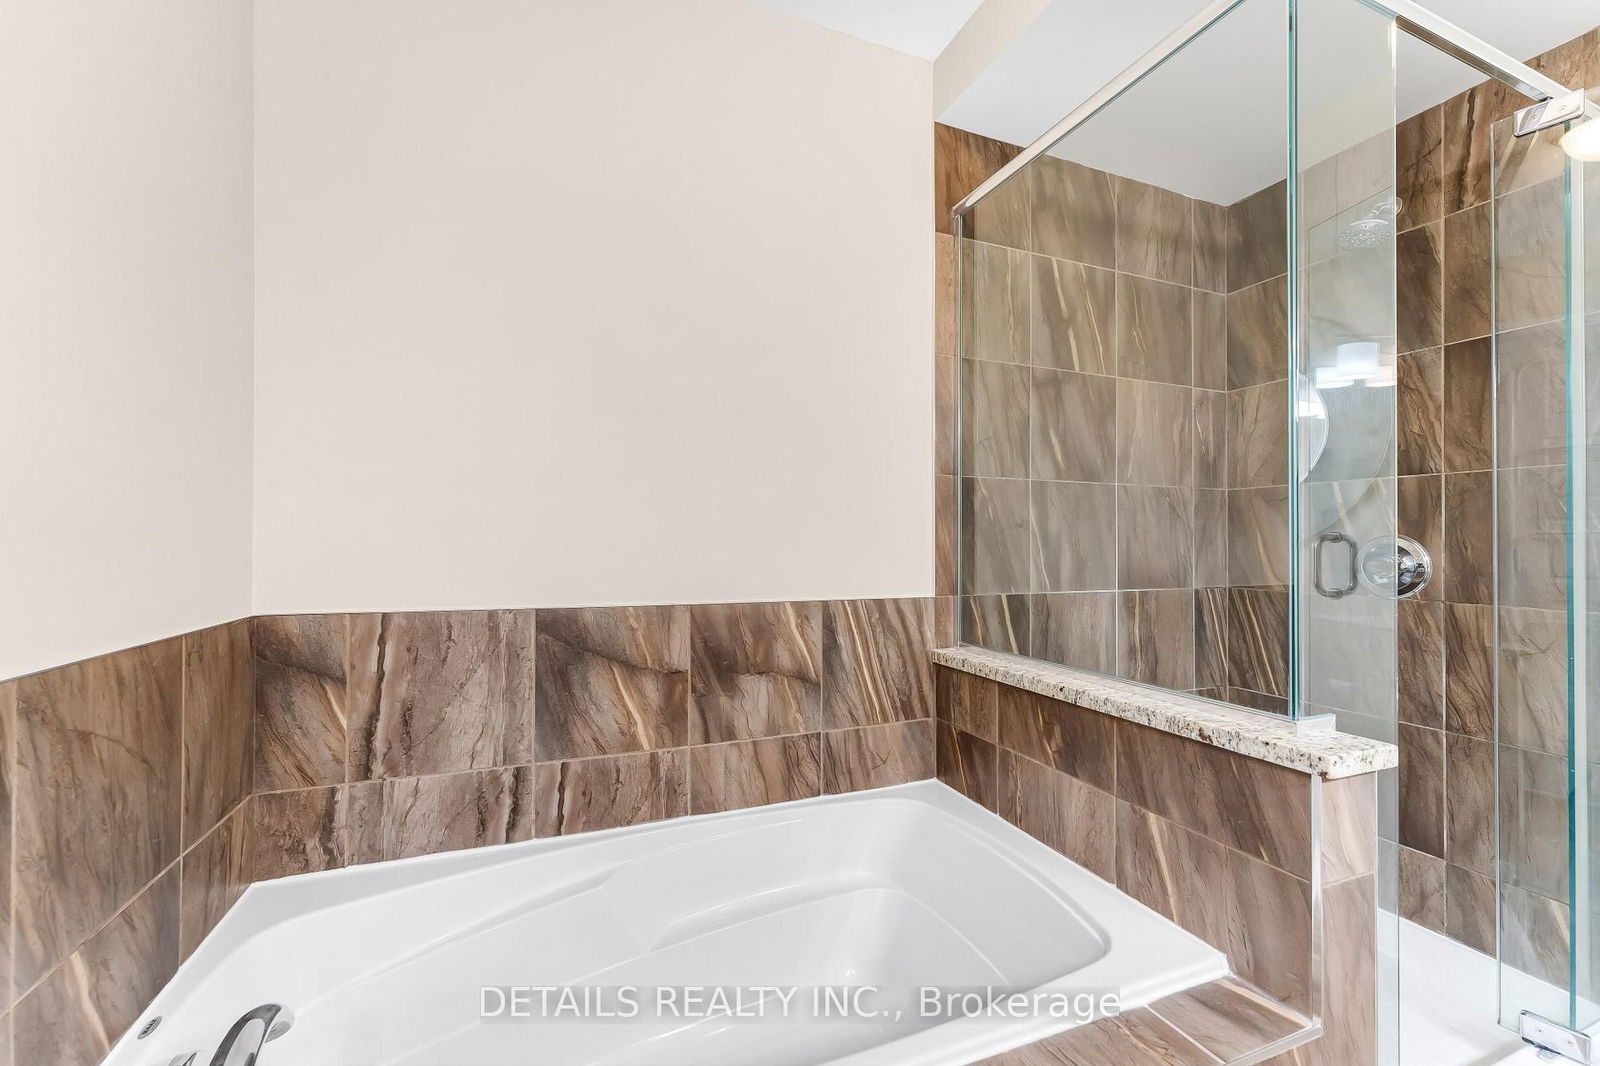
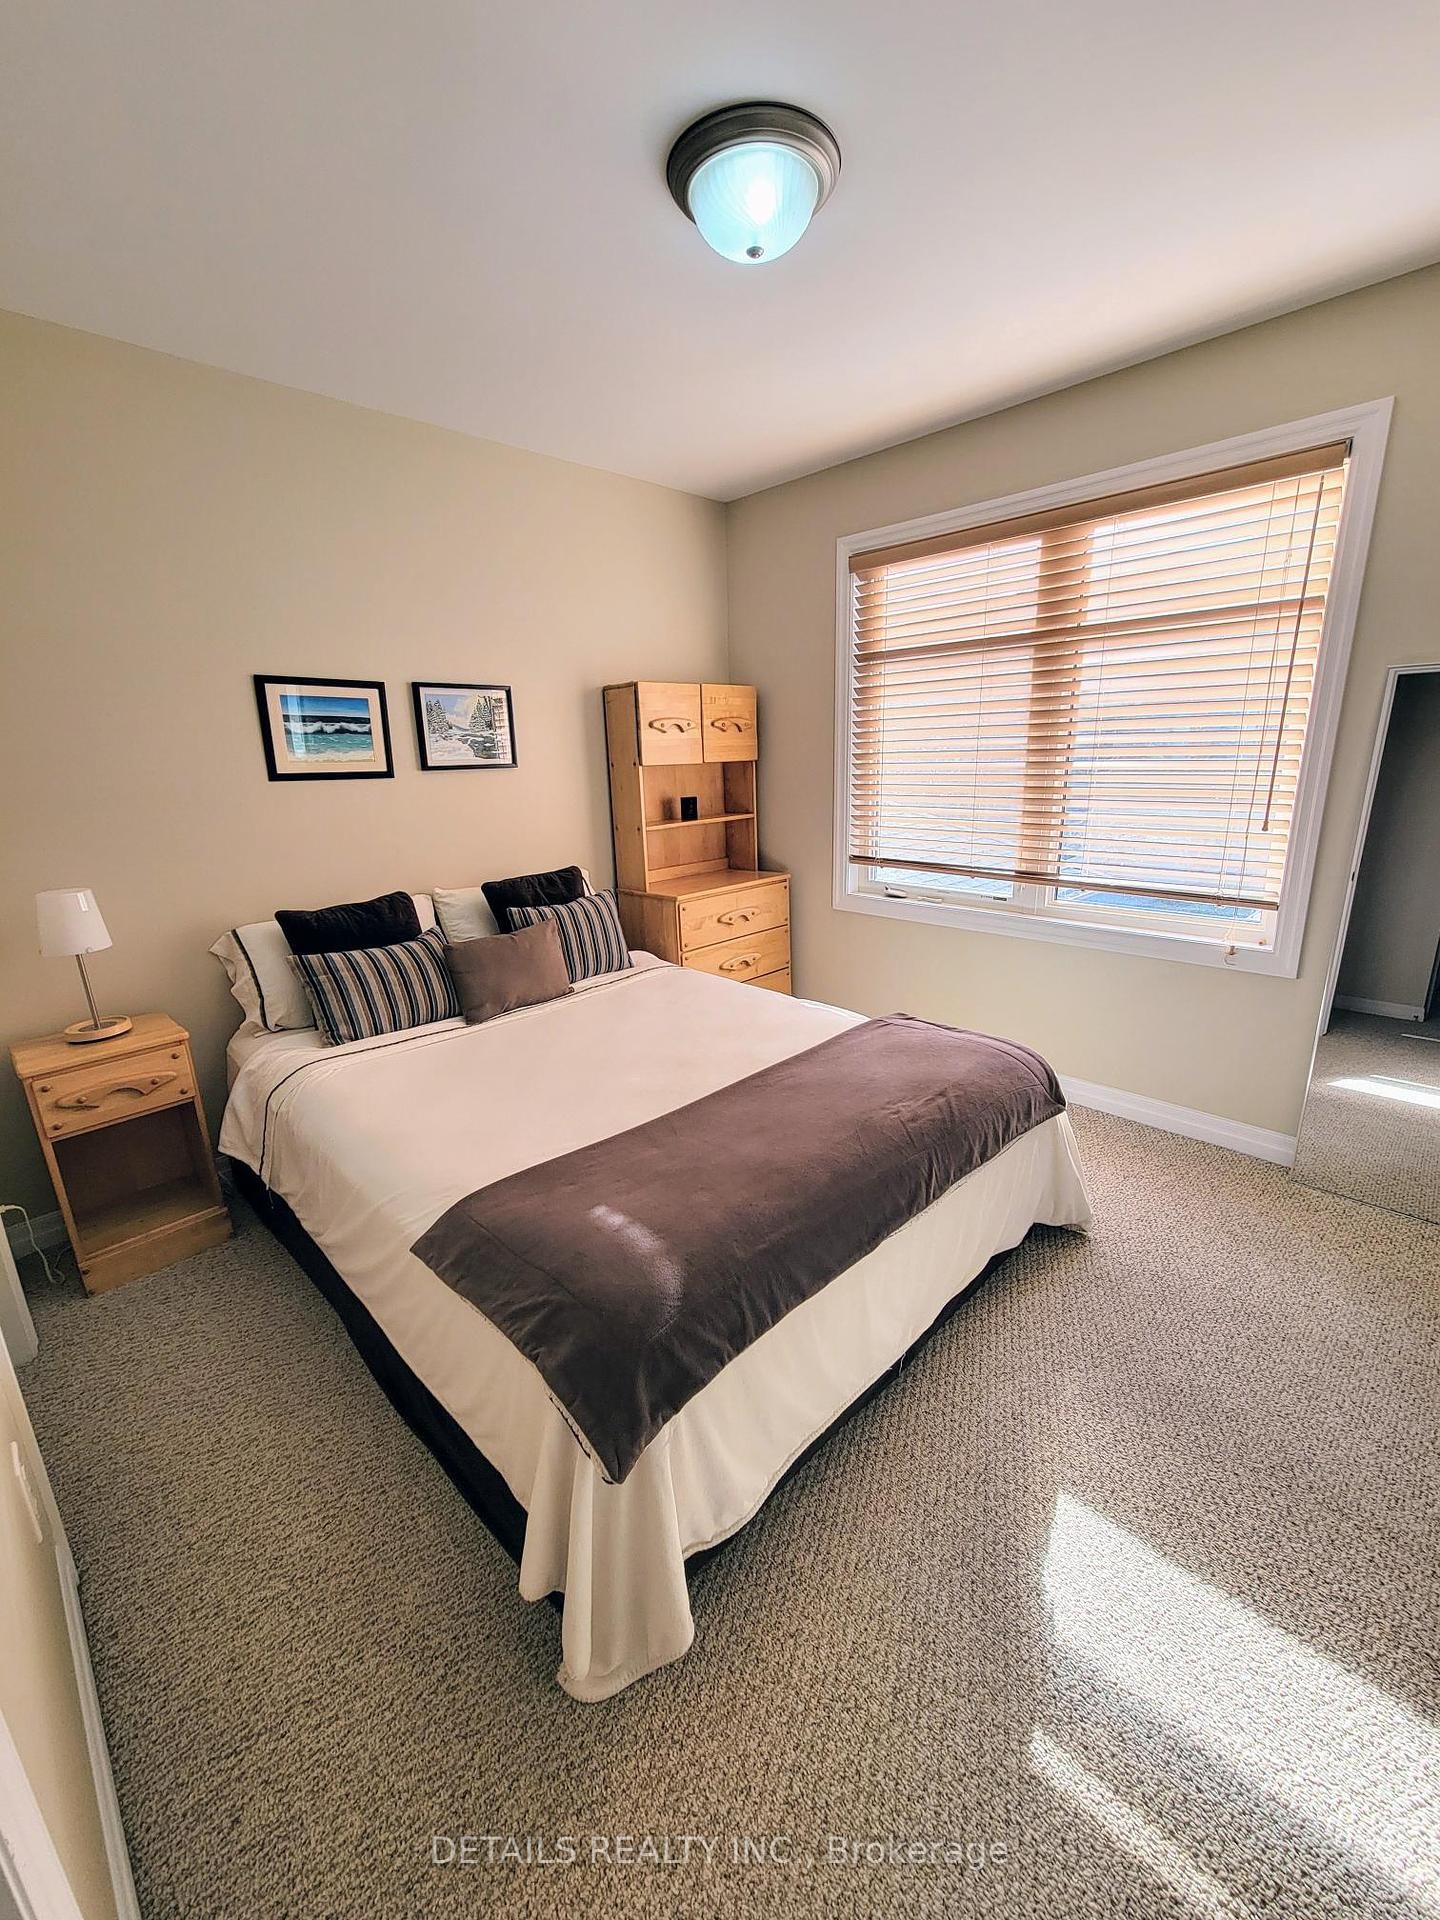
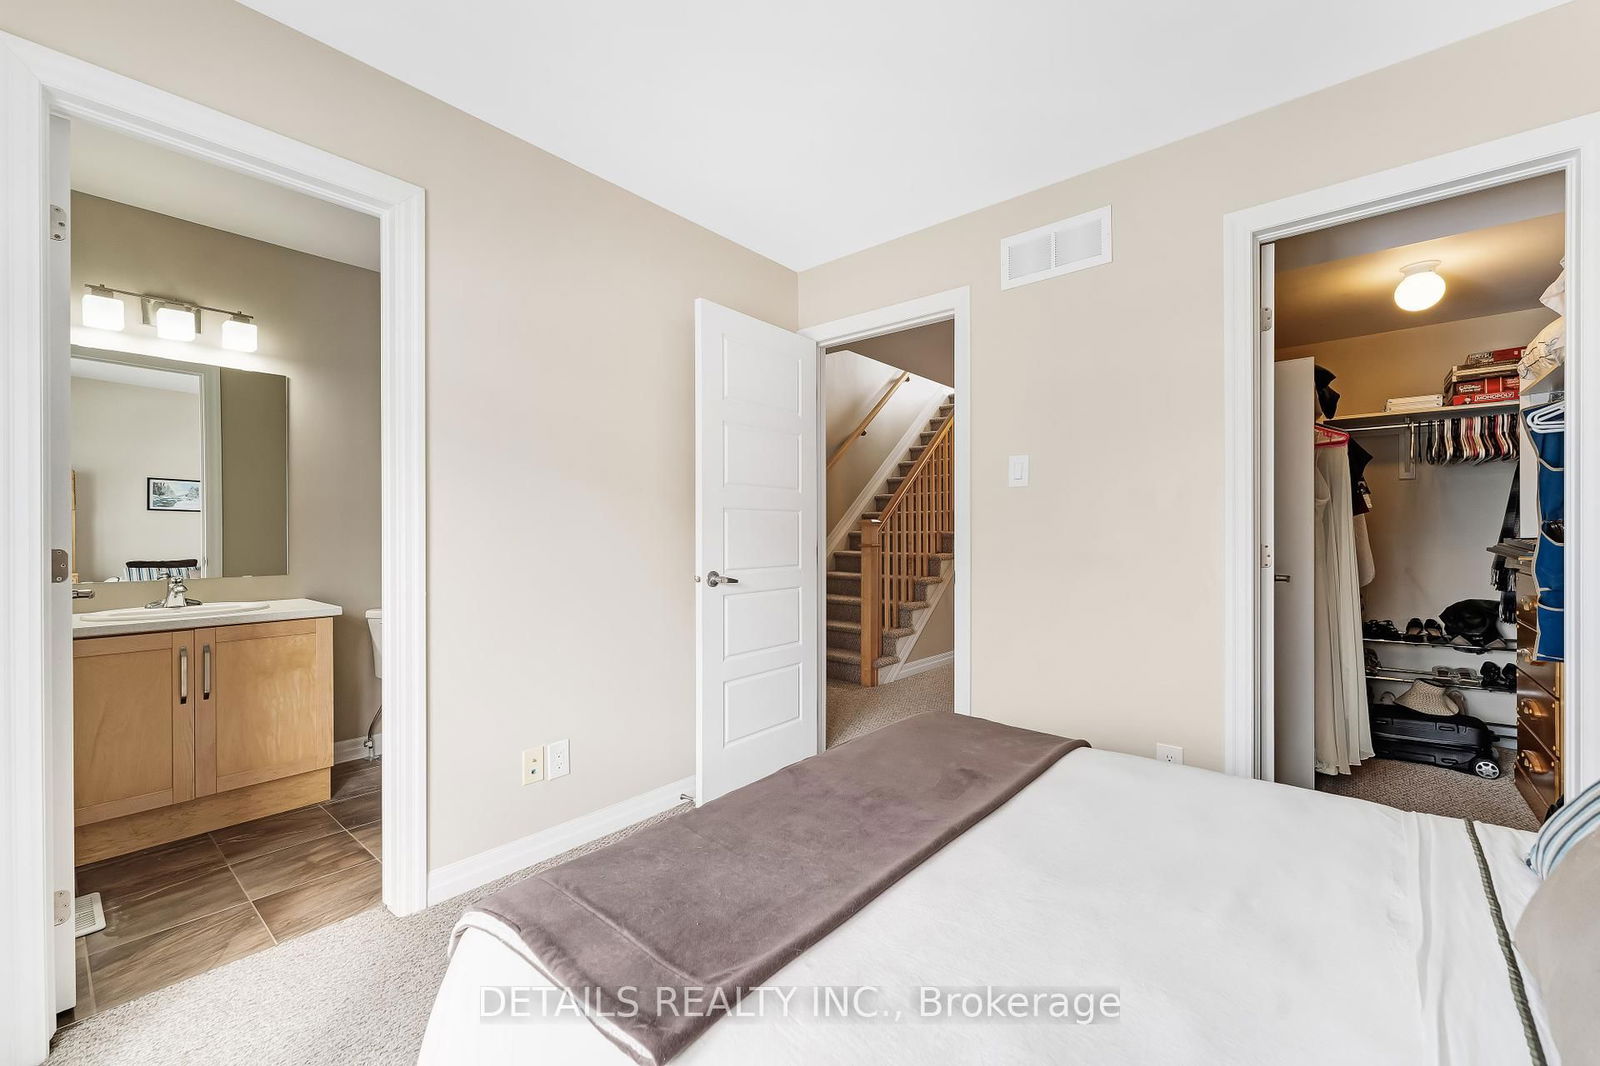
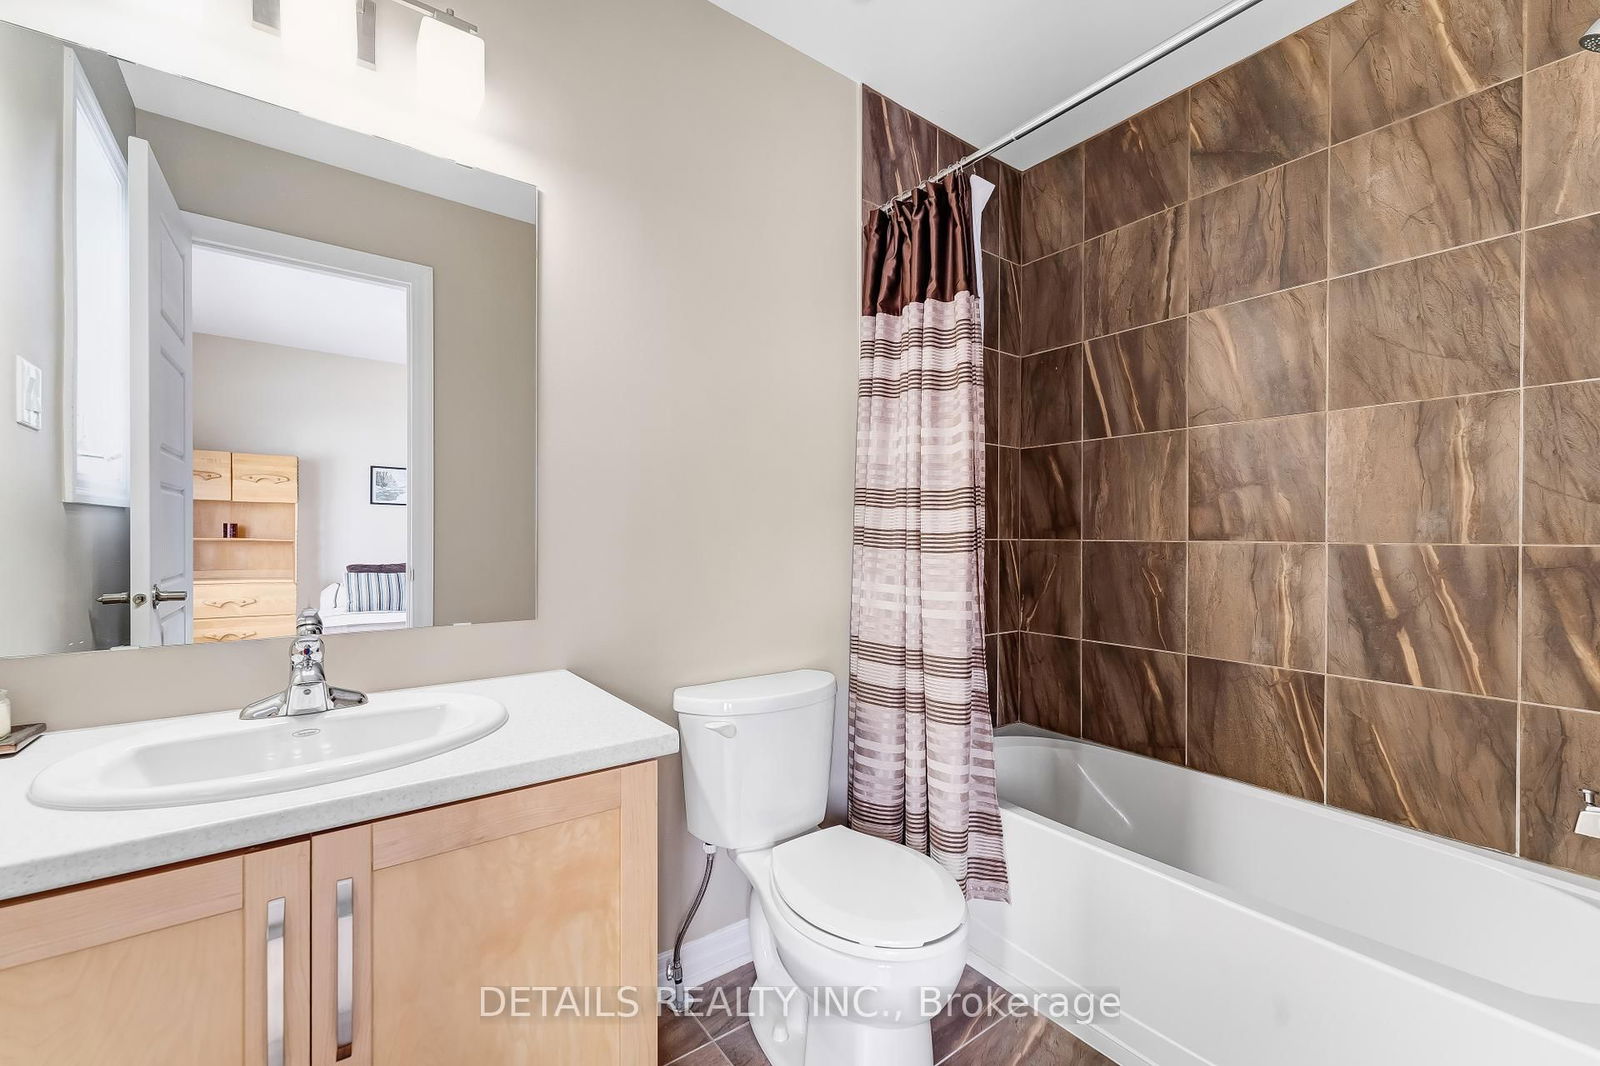
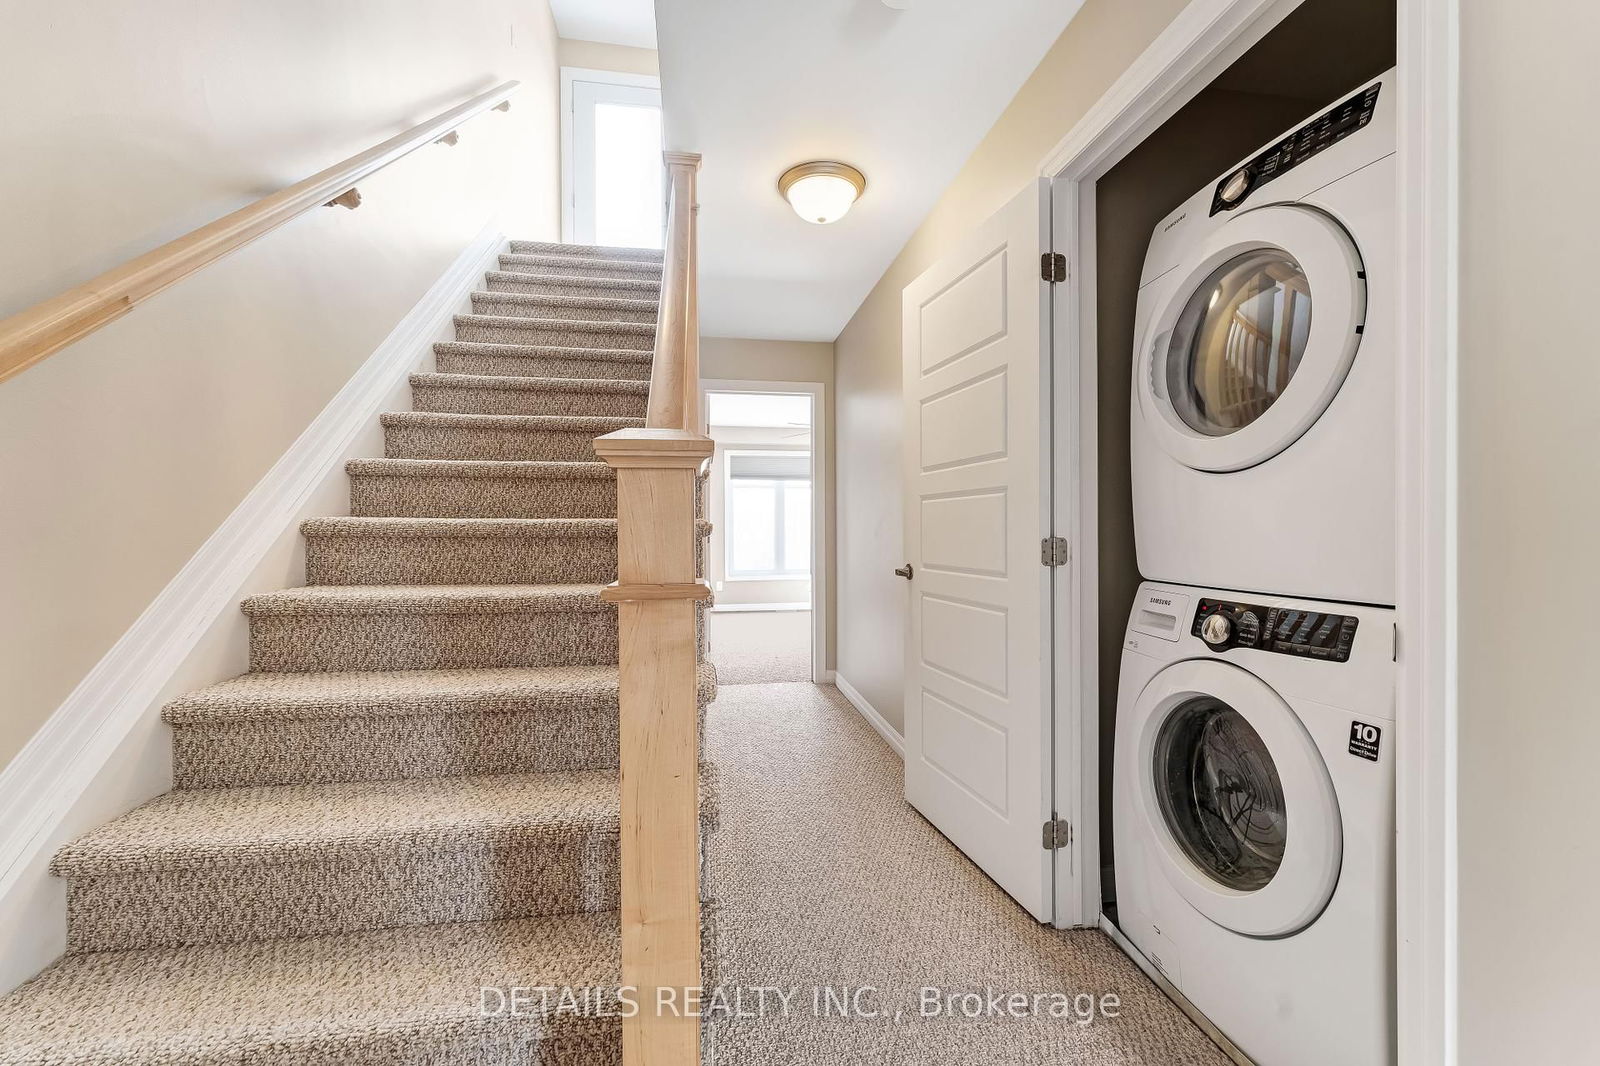
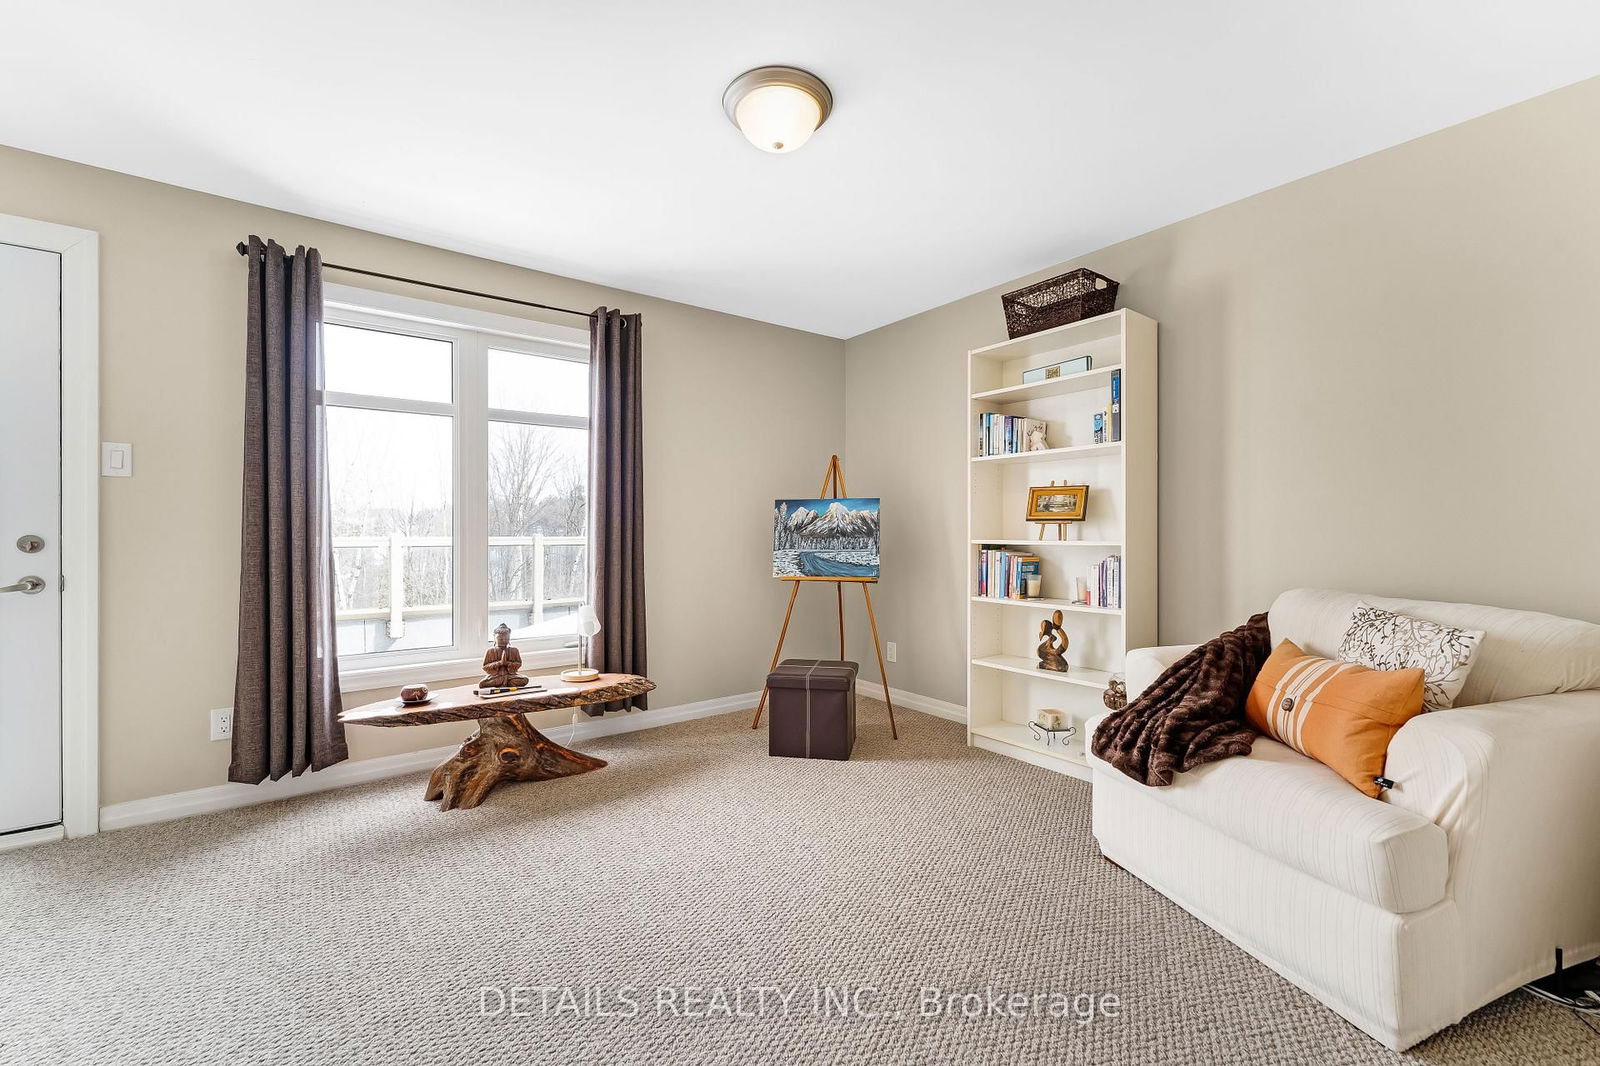
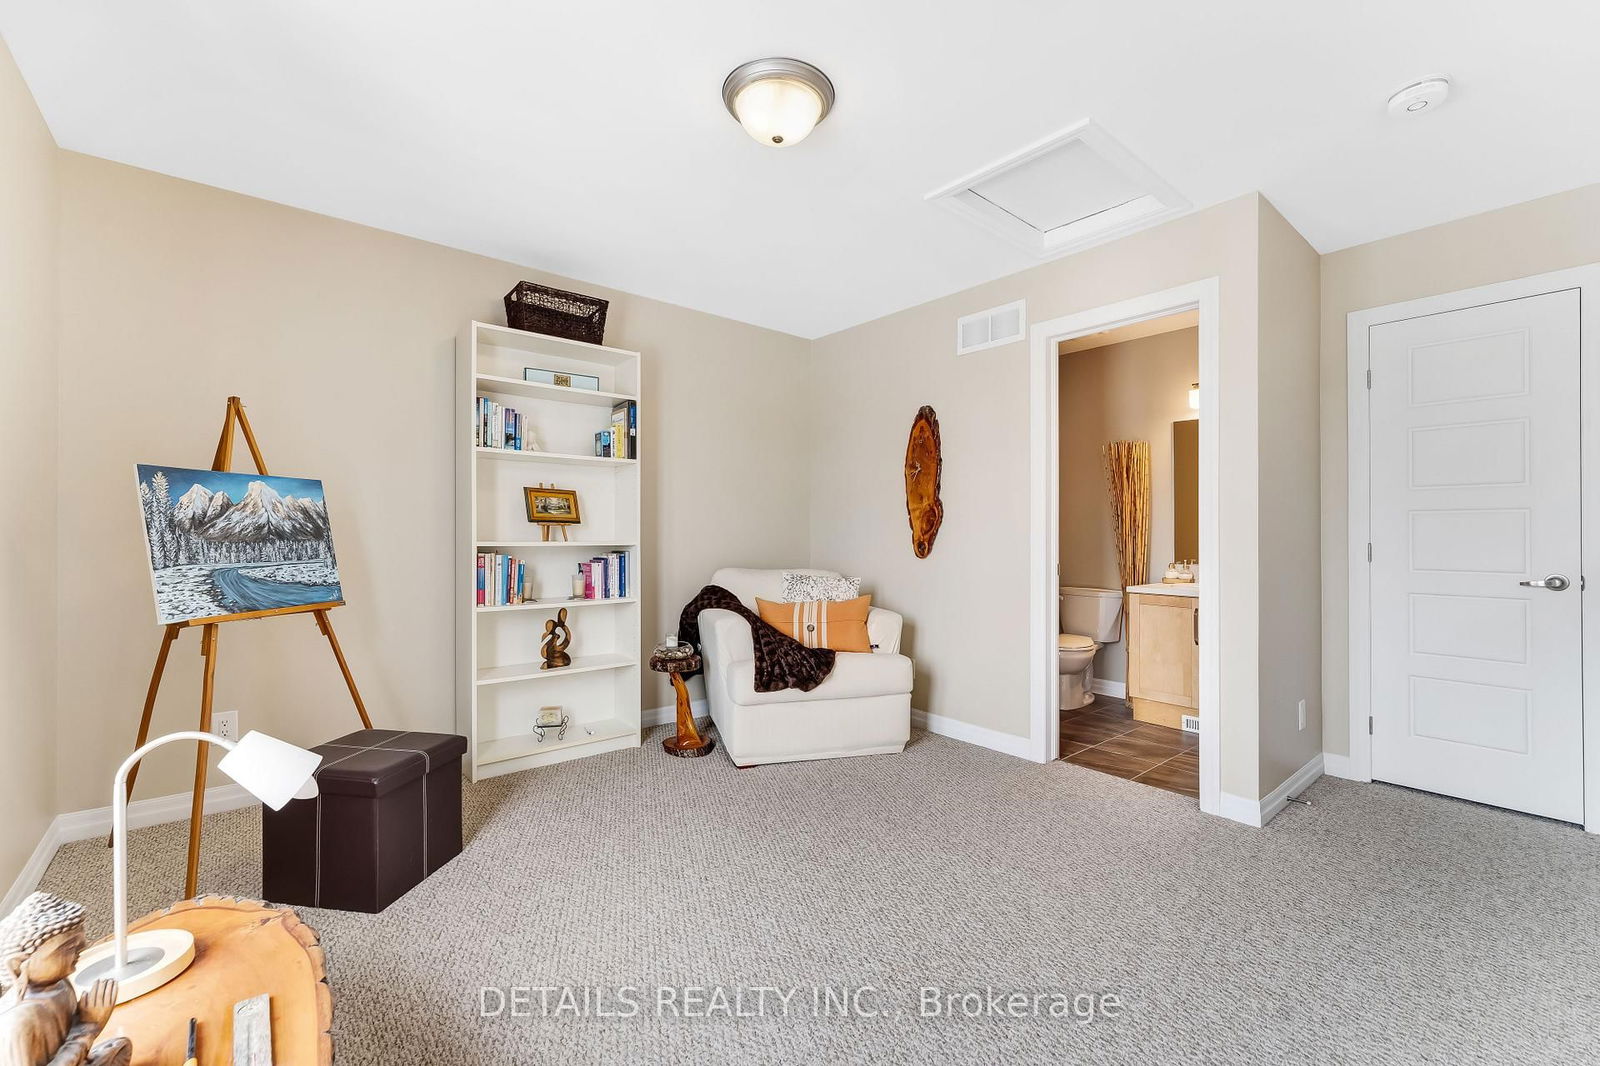
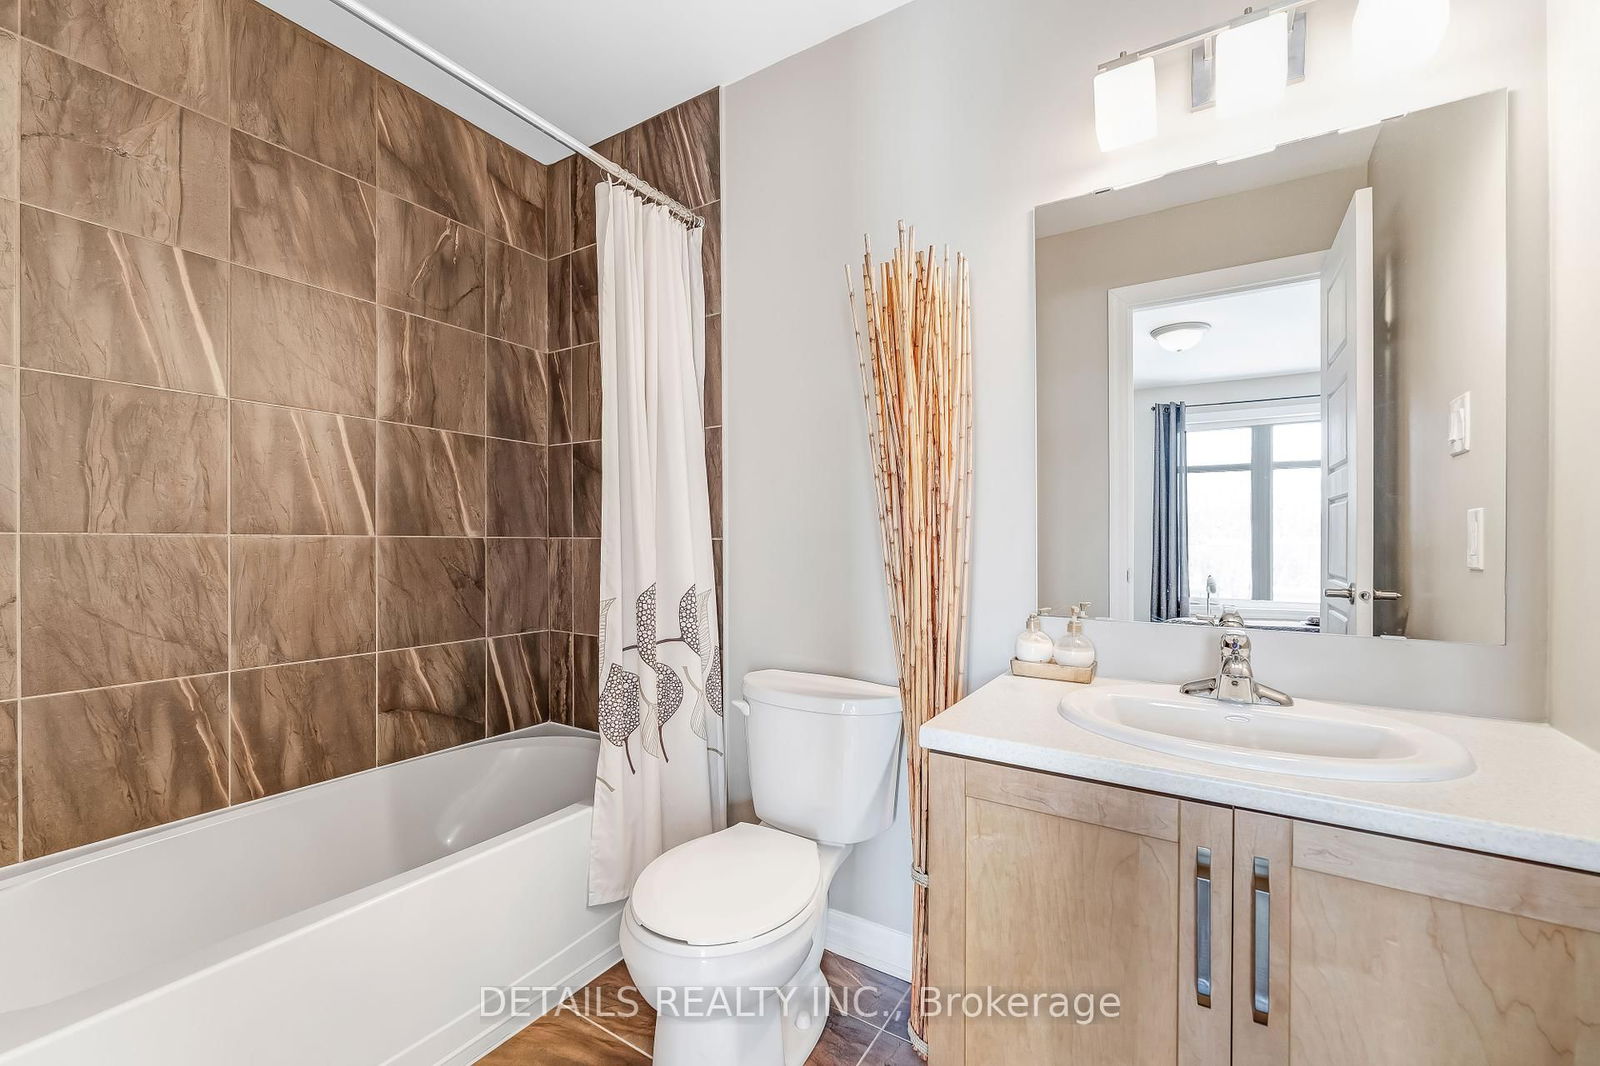
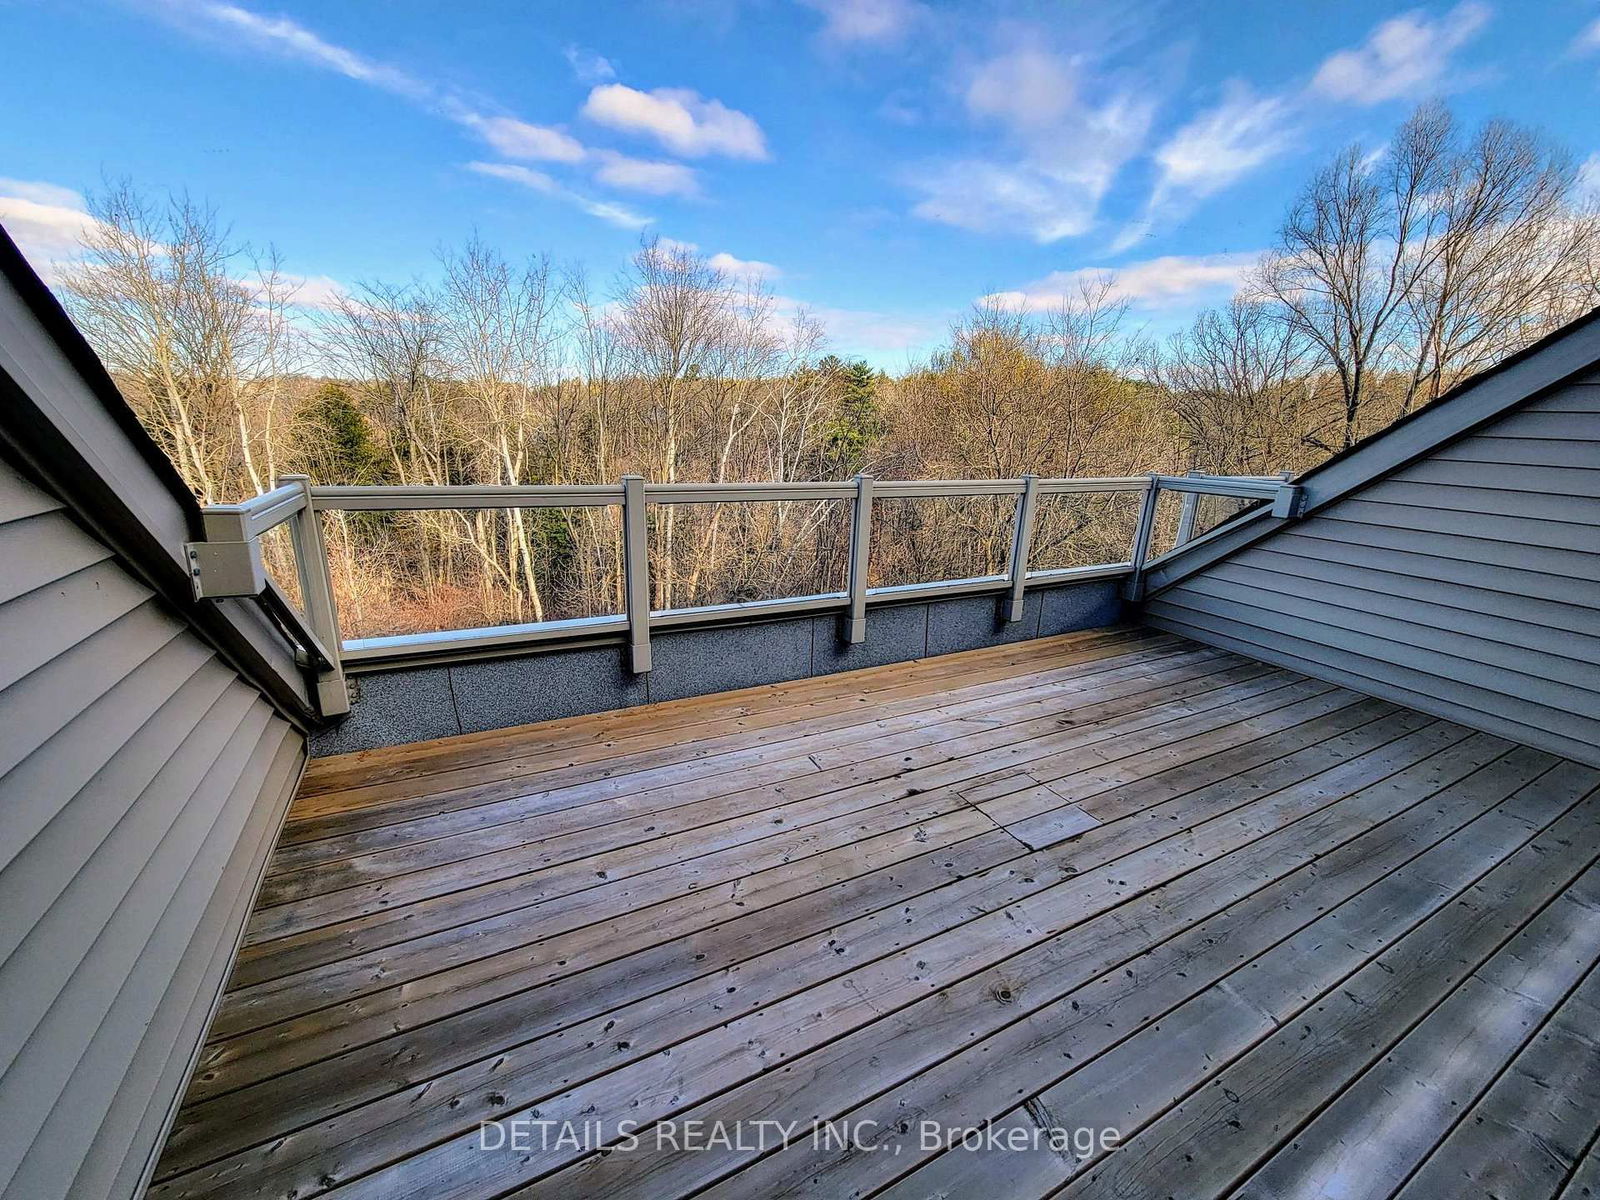
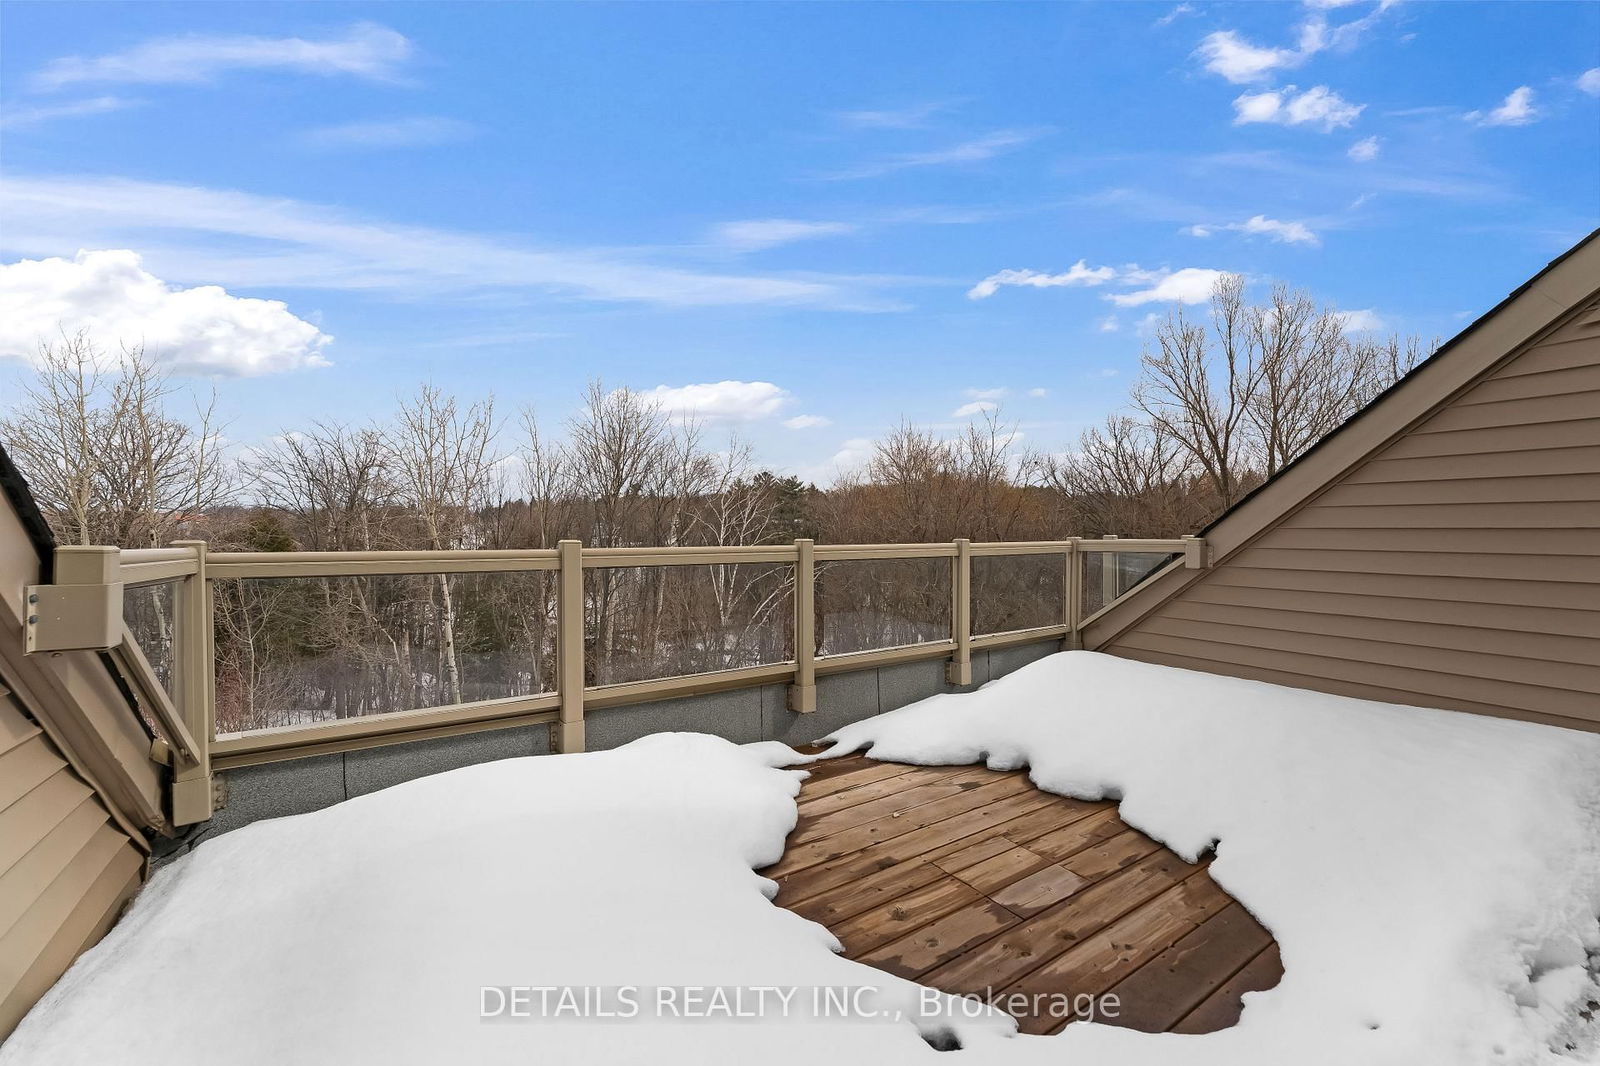
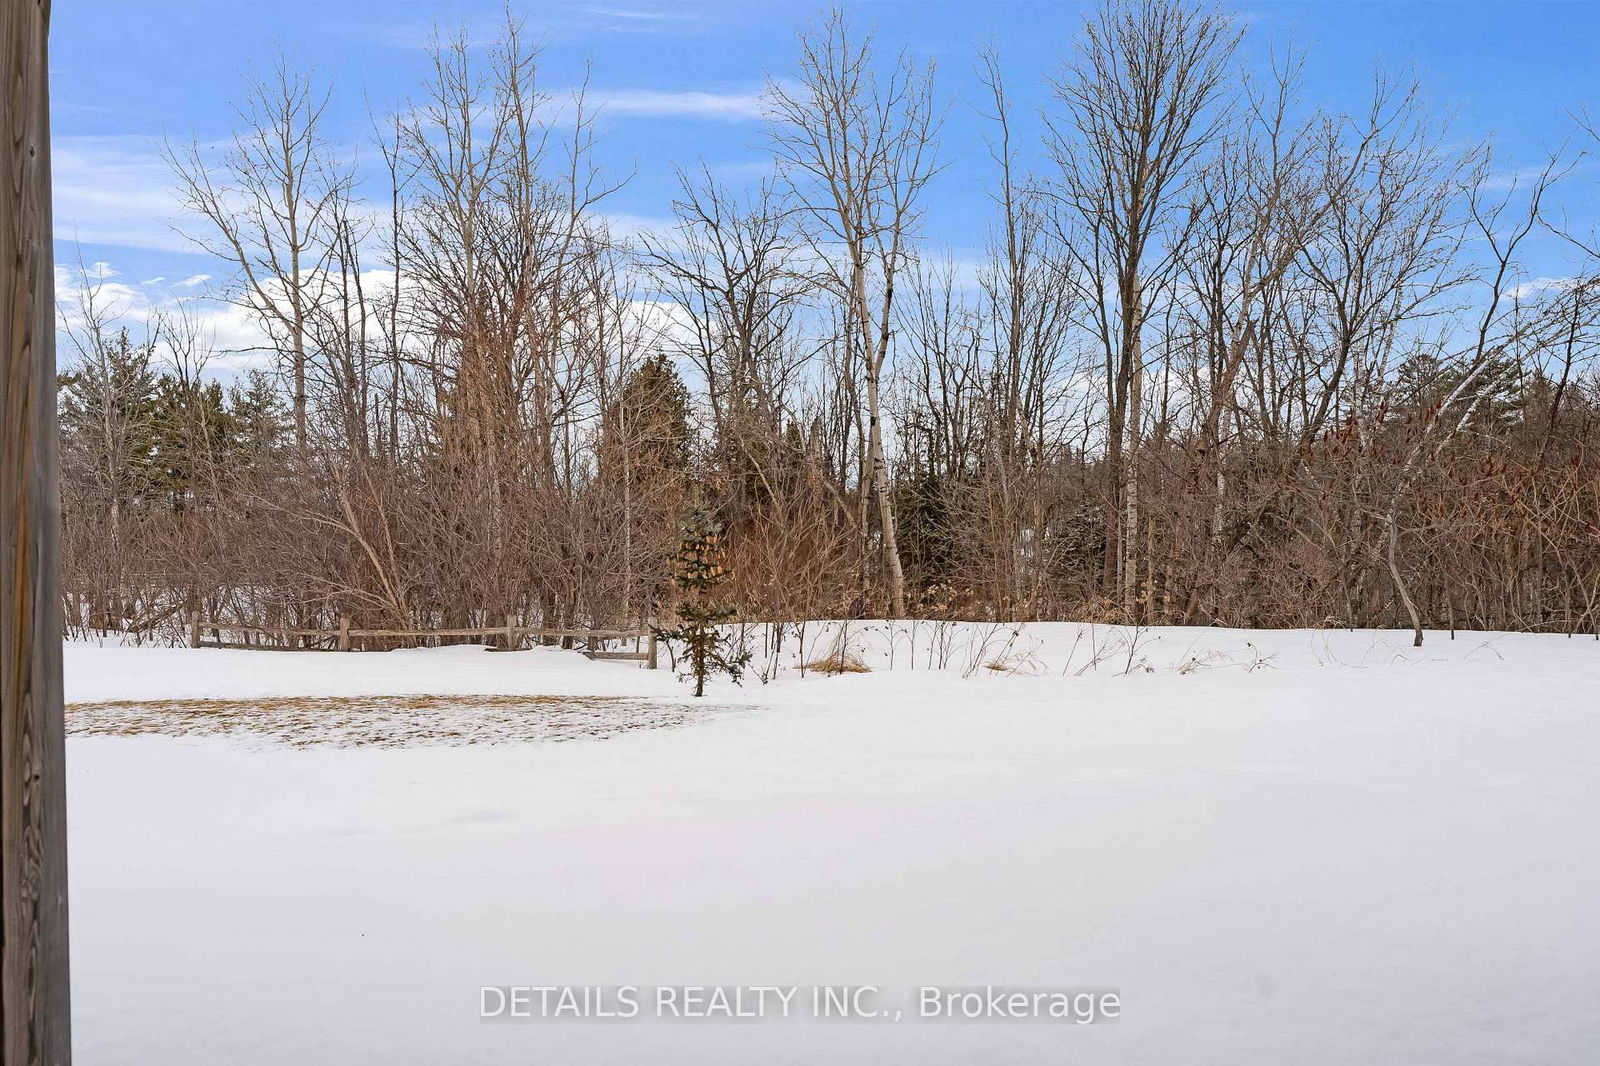
This beautifully designed freehold townhouse, featuring over 2,100 square feet of living space, was created by architect Barry J. Hobin. It backs onto a spacious, treed ravine, offering spectacular, unobstructed views of nature from every level. The townhouse includes 3 bedrooms, each with its own full ensuite bath. Nestled in a quiet enclave just 5 minutes from grocery stores, Place d'Orléans, and Petrie Island, it is also a short 5-minute walk to Trim Station, where the O-Train will be coming later this year. The main floor features an open concept kitchen, dining room, and living room, with 9-foot ceilings and gleaming hardwood floors. A full wall of windows overlooks the private treed ravine and provides access to a large balcony. The gourmet kitchen boasts granite countertops, a large island, ample cupboard space, and a breakfast bar. Additionally, there is a powder room on this floor and an inside entry from a good-sized single-car garage. On the second floor, you will find a spacious primary bedroom with a 5-piece ensuite, oversized windows that also overlook the treed ravine, as well as laundry facilities and a second bedroom/office with a full 4-piece ensuite and a walk-in closet. The third floor features a loft/bedroom with a full ensuite and walk-in closet, along with a large rooftop terrace that provides stunning views of the ravine and the Gatineau Hills. The walk-out lower level family room is open, bright, and very spacious, with a storage area and a mechanical room, plus walkout access to a patio. The monthly association fee is $120, which covers grass and snow maintenance.
2 Fridges, Stove, Hood Fan, Dishwasher, Washer & Dryer, Central-air, H Vac, Auto-Garage door opener and remote, all Blinds
Kitchen
Dining
Living
Family
Primary
2nd Br
3rd Br
Foyer
Utility
The graph below compares the average list price and average sale price of homes in this neighborhood by month for the last 24 months. When average sale price is greater than average list price, this may suggest a buyer's market. When average sale price is lower than the average list price this may suggest a seller's market.
The graph below illustrates the average days on market for homes in this neighborhood. The yellow area may indicate a buyer's market, the green area may indicate a balanced market and the red area may indicate a seller's market.
Orleans - Convent Glen and Area, 2013 - Mer Bleue/Bradley Estates/Anderson Park, K1W 0C7
$664,900
$000000
Sales Representative, Century 21 People’s Choice Realty Inc., Brokerage
(647) 576 - 2100