Century 21 People’s Choice Realty Inc., Brokerage
120 MATHESON BLVD E #103
MISSISSAUGA, Ontario
L4Z 1X1


Oshawa, Taunton, L1H 8L7
$1,499,000$000000
Listed by CENTURY 21 INNOVATIVE REALTY INC..
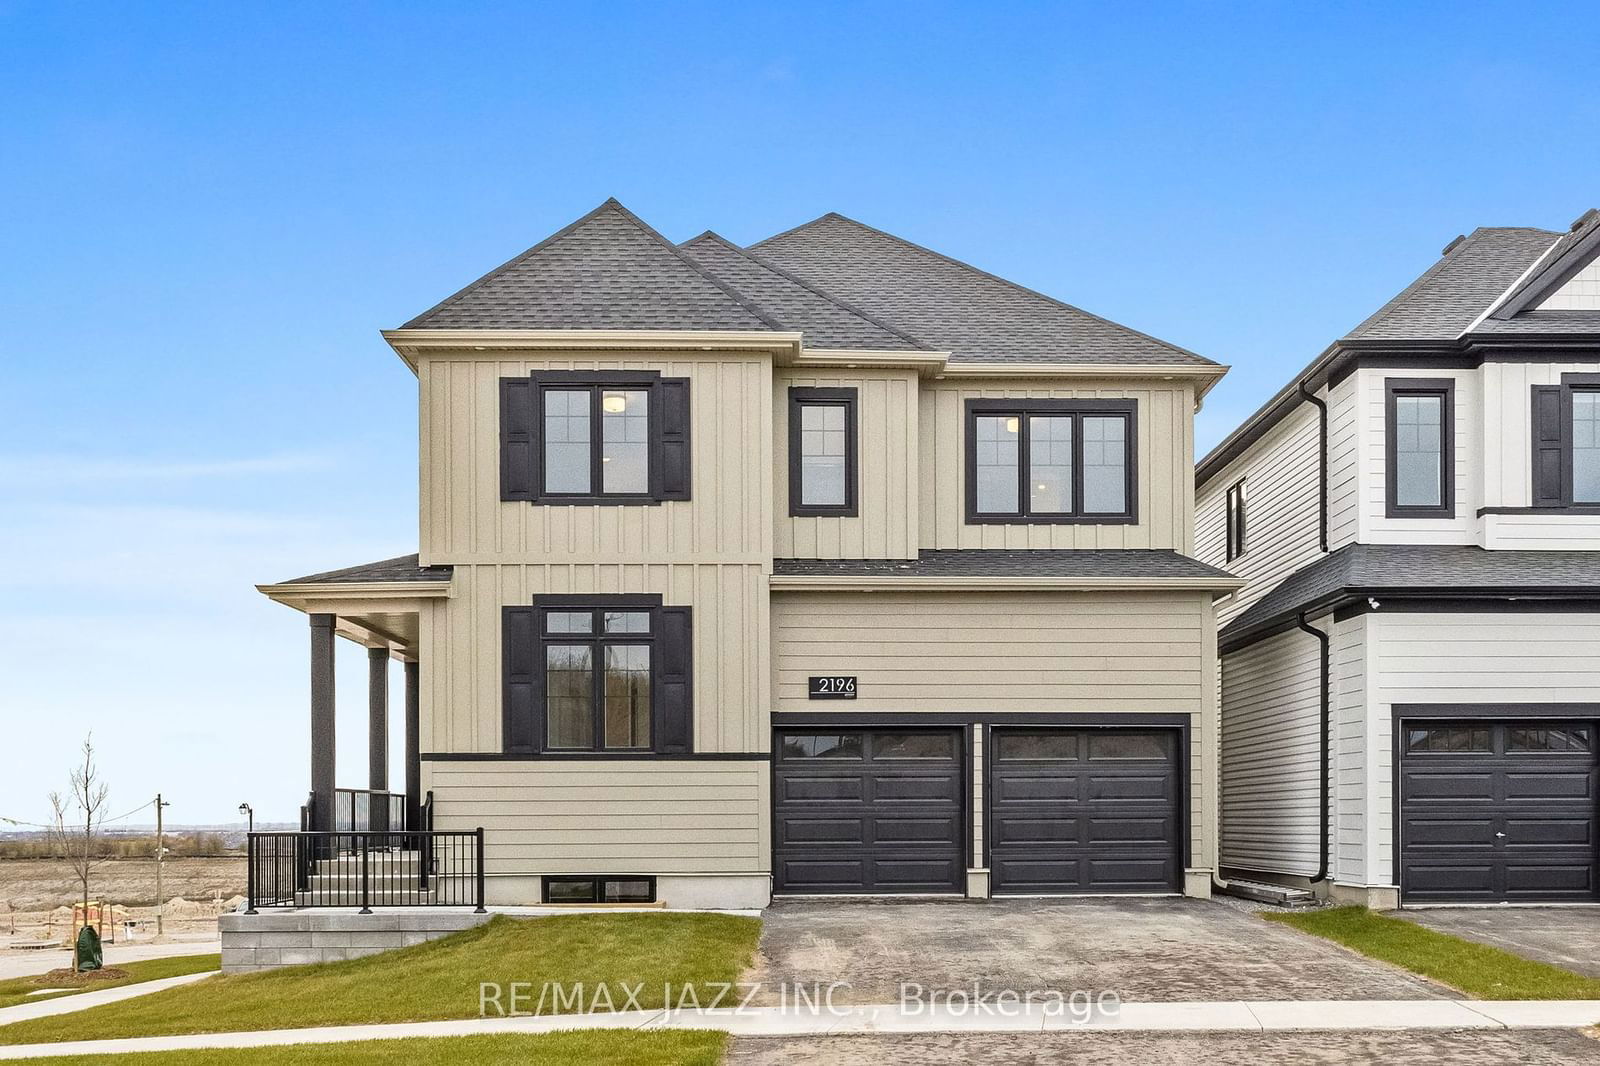
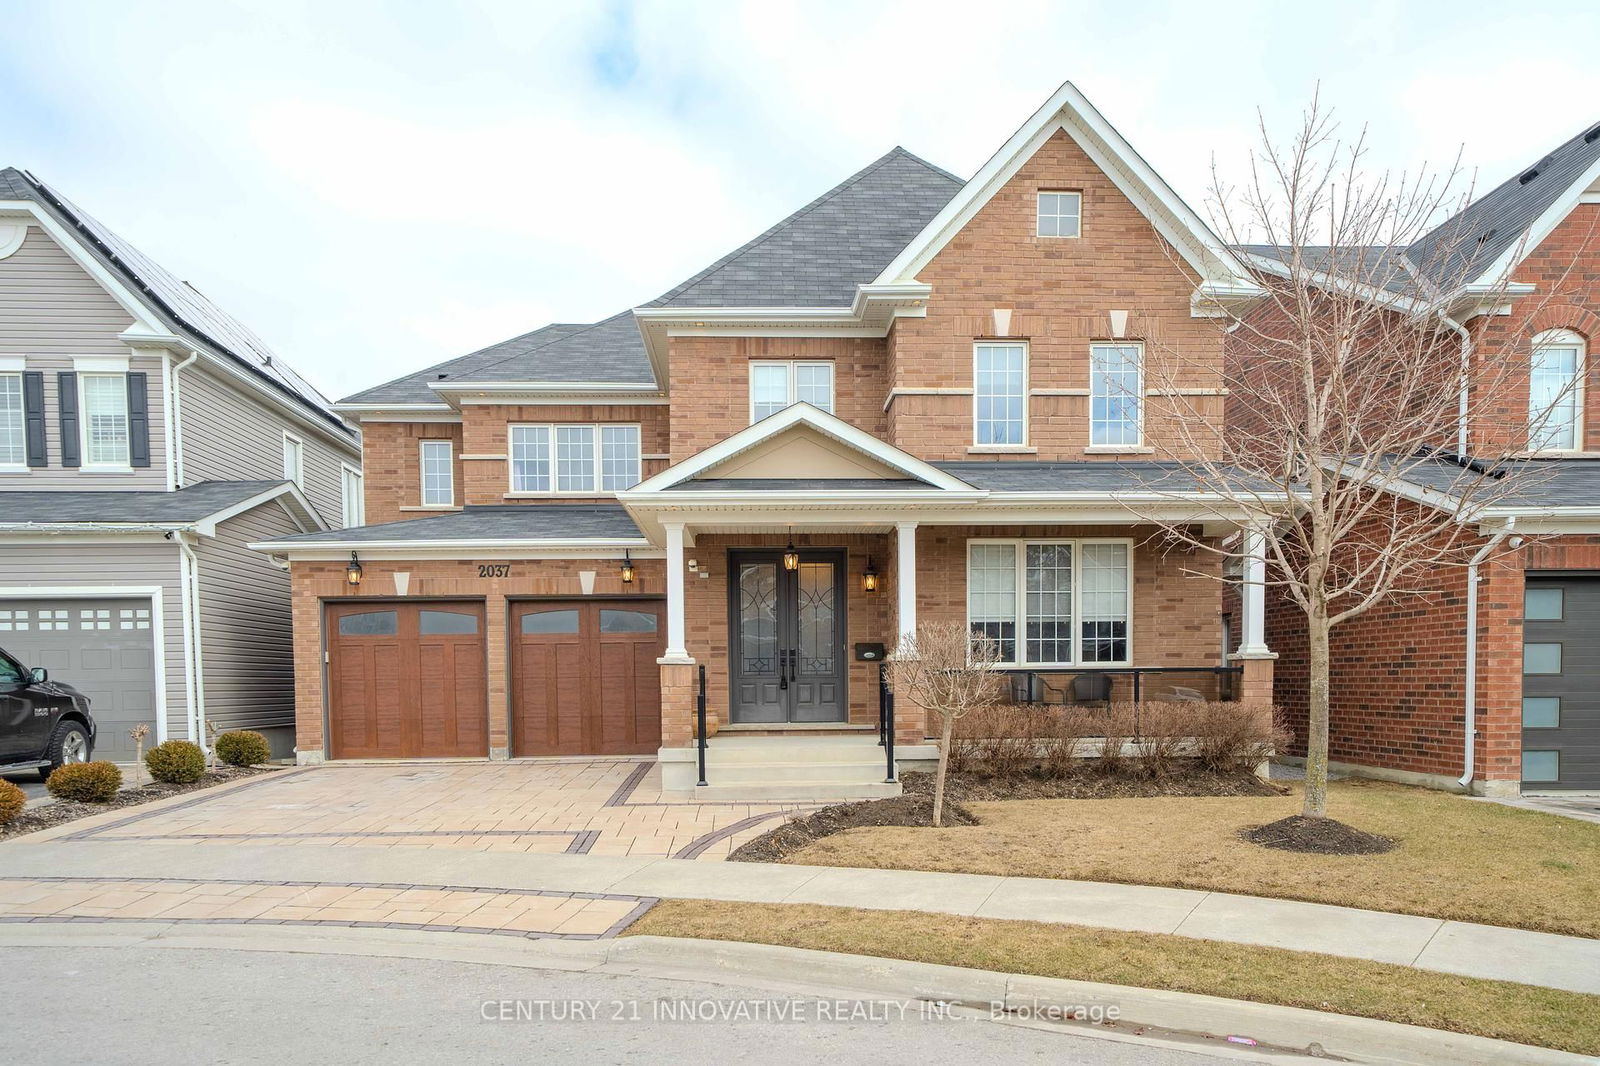
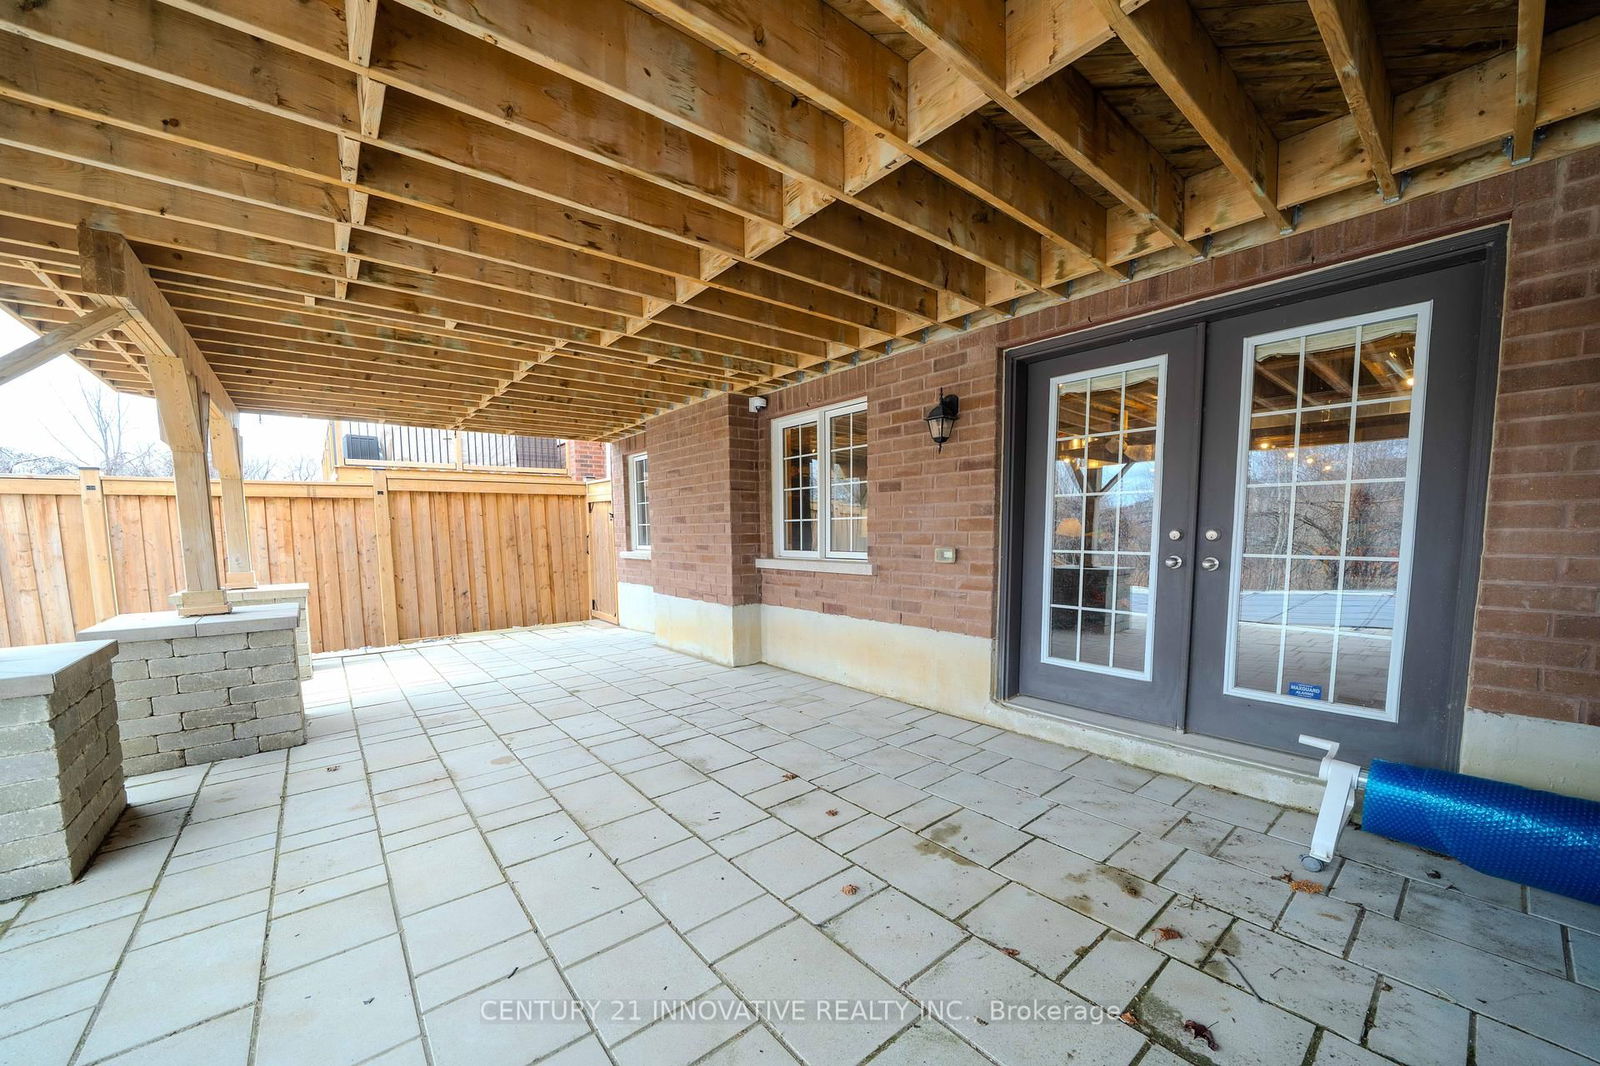
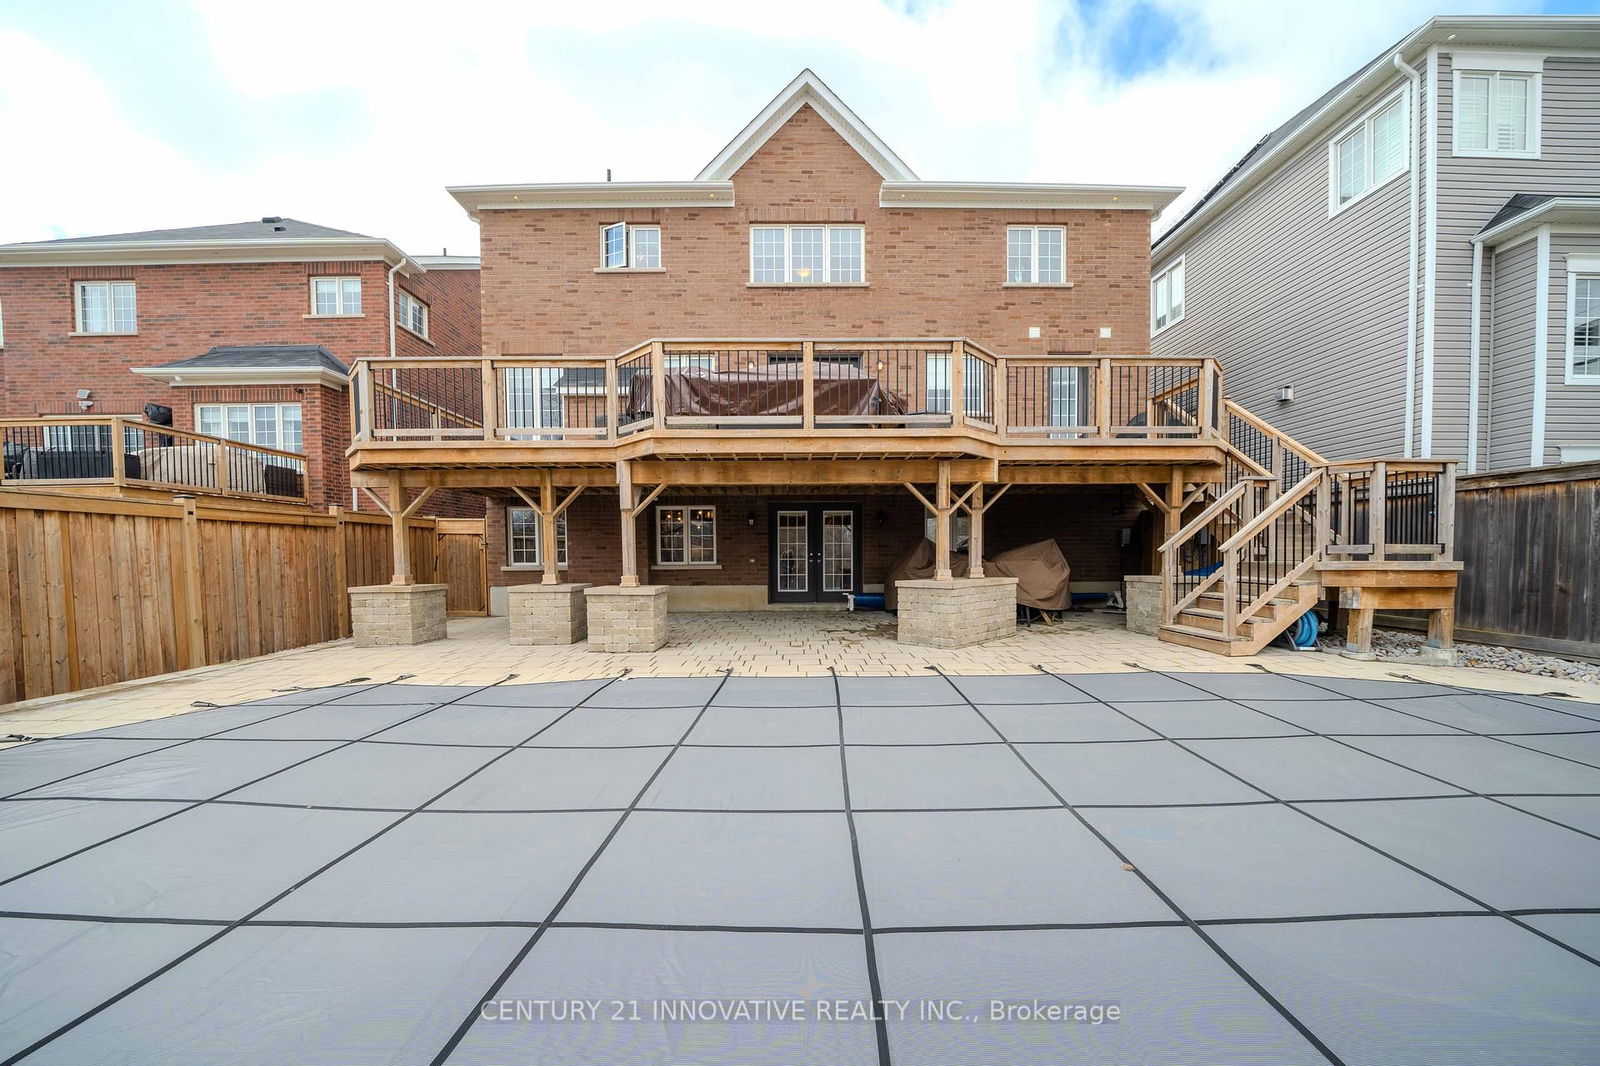
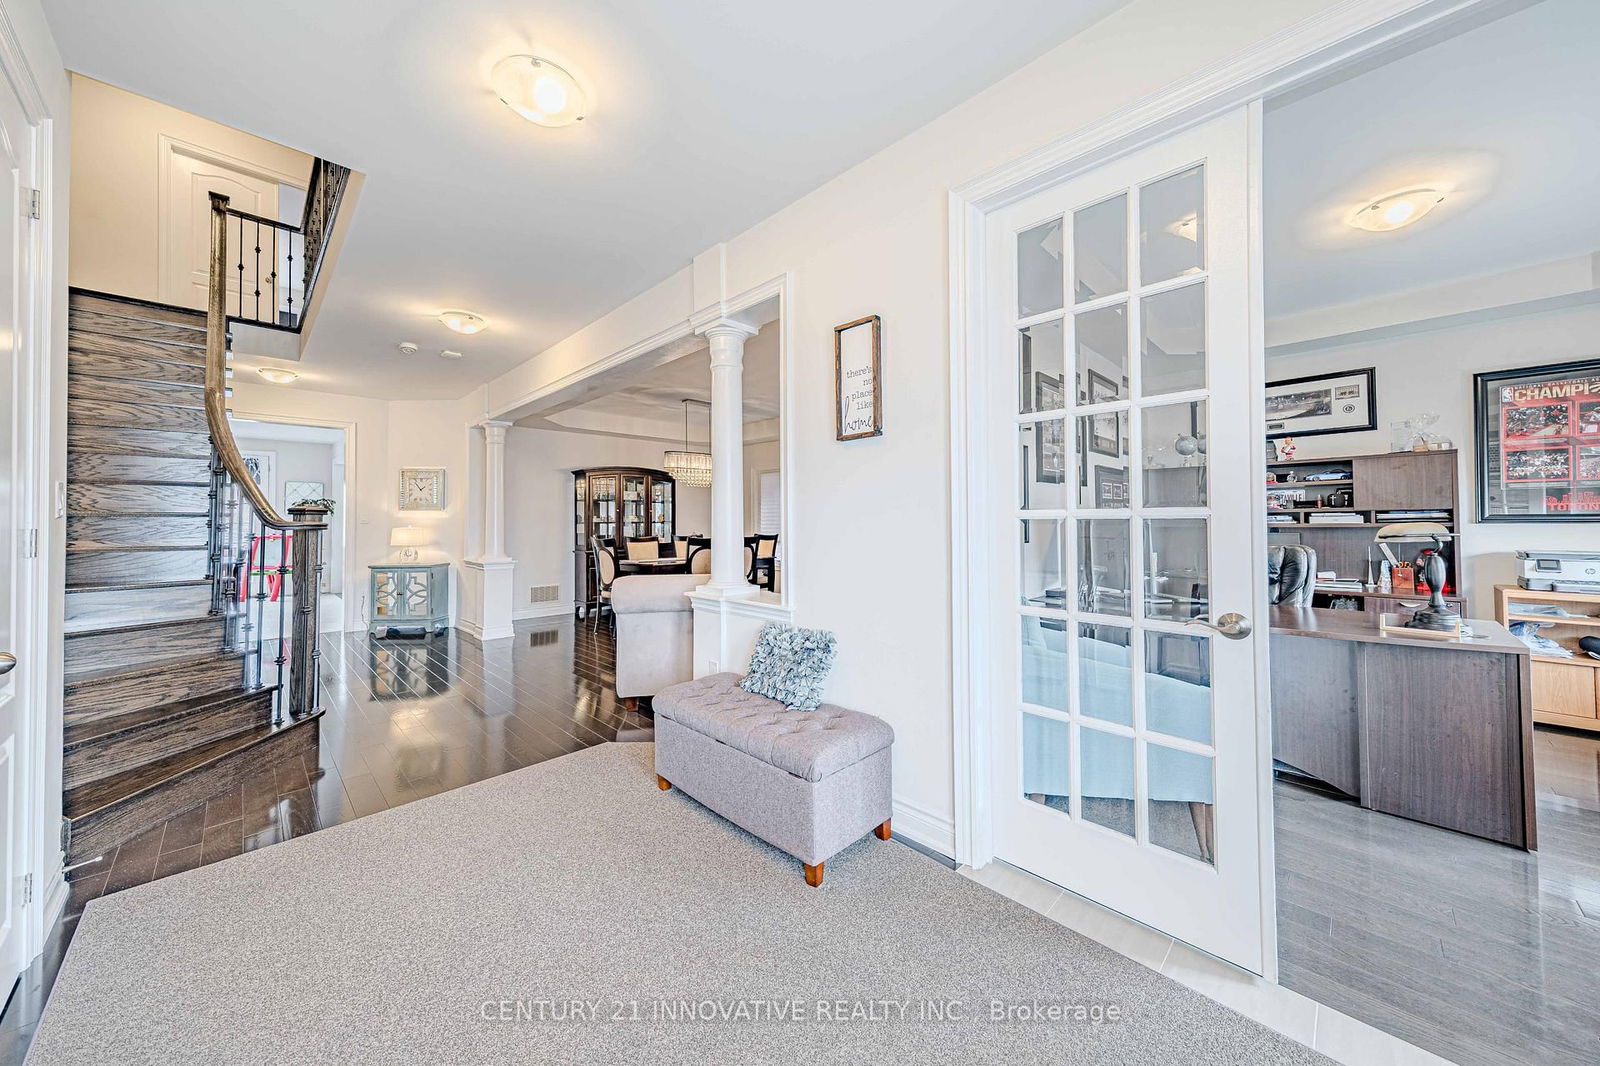
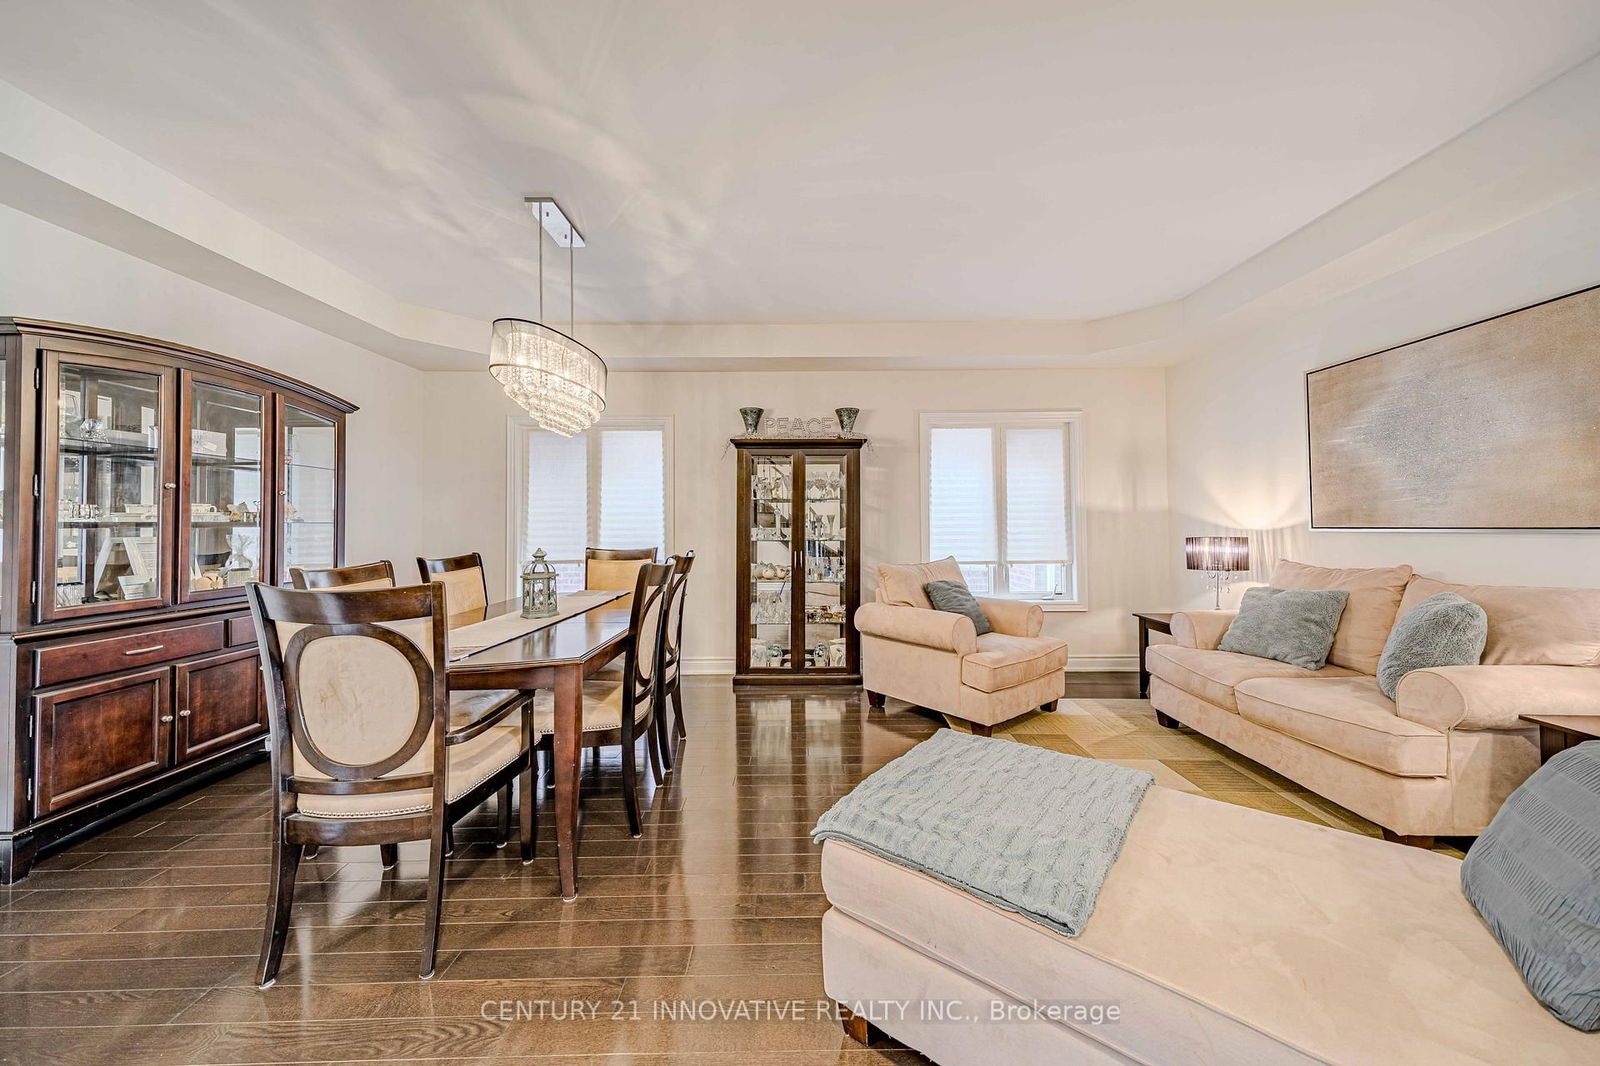
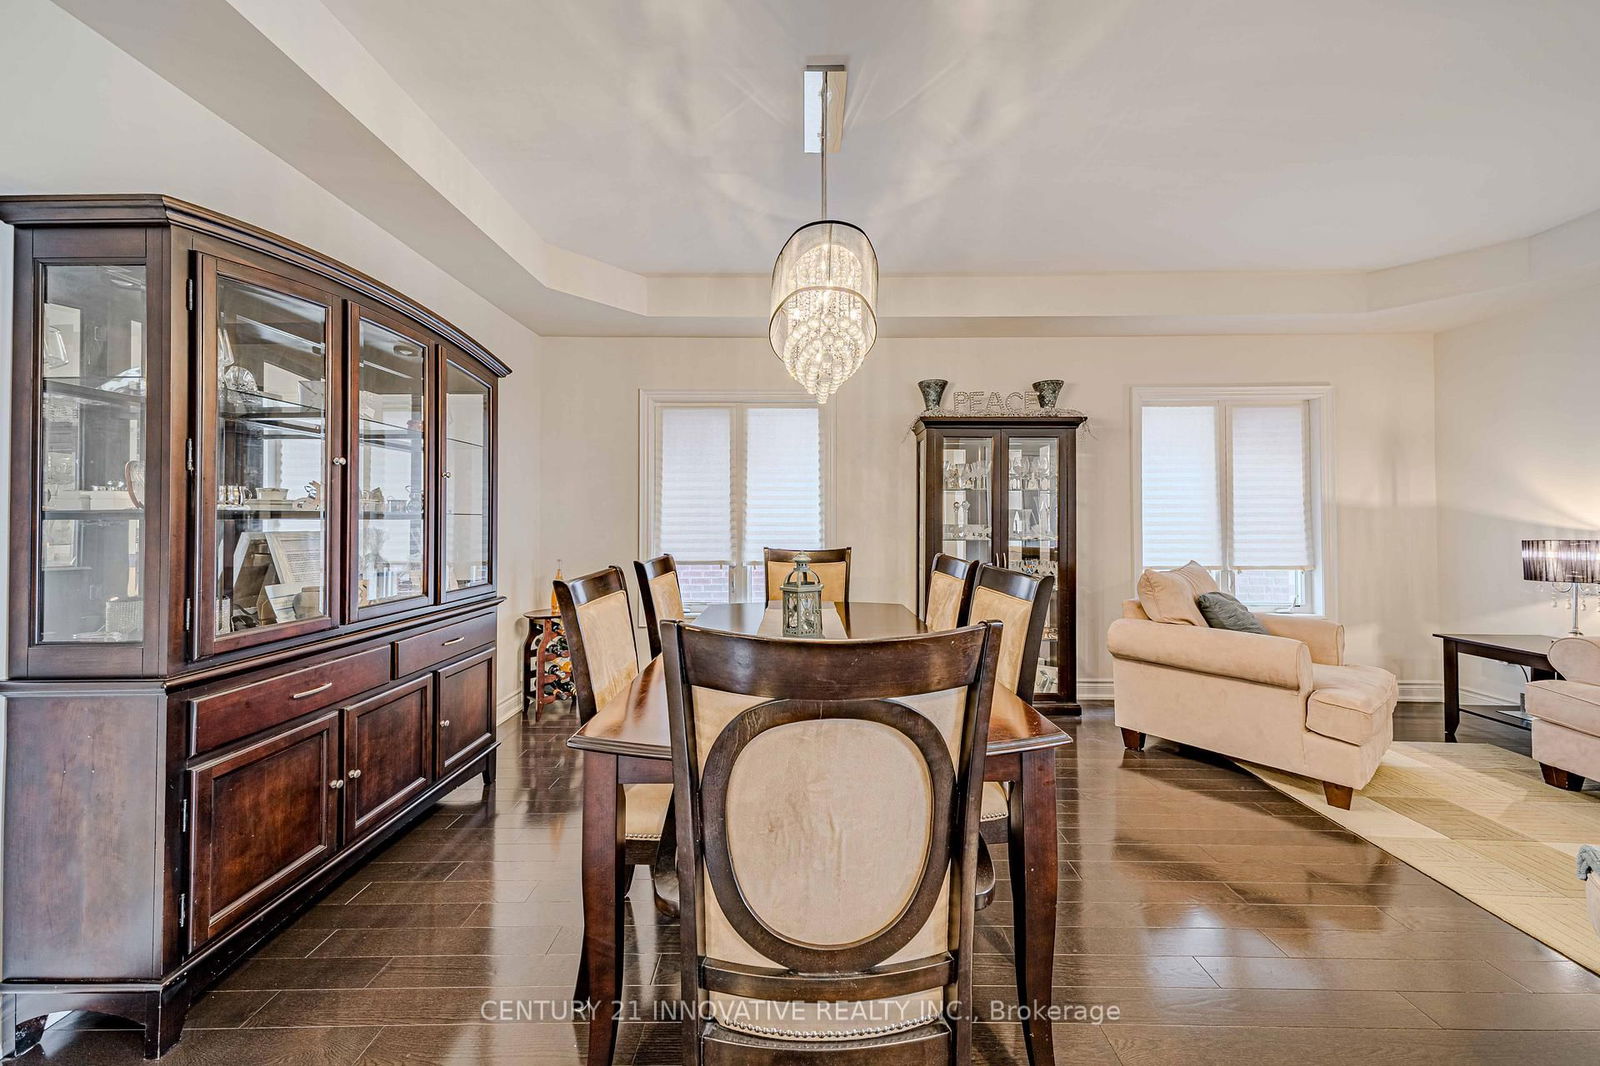
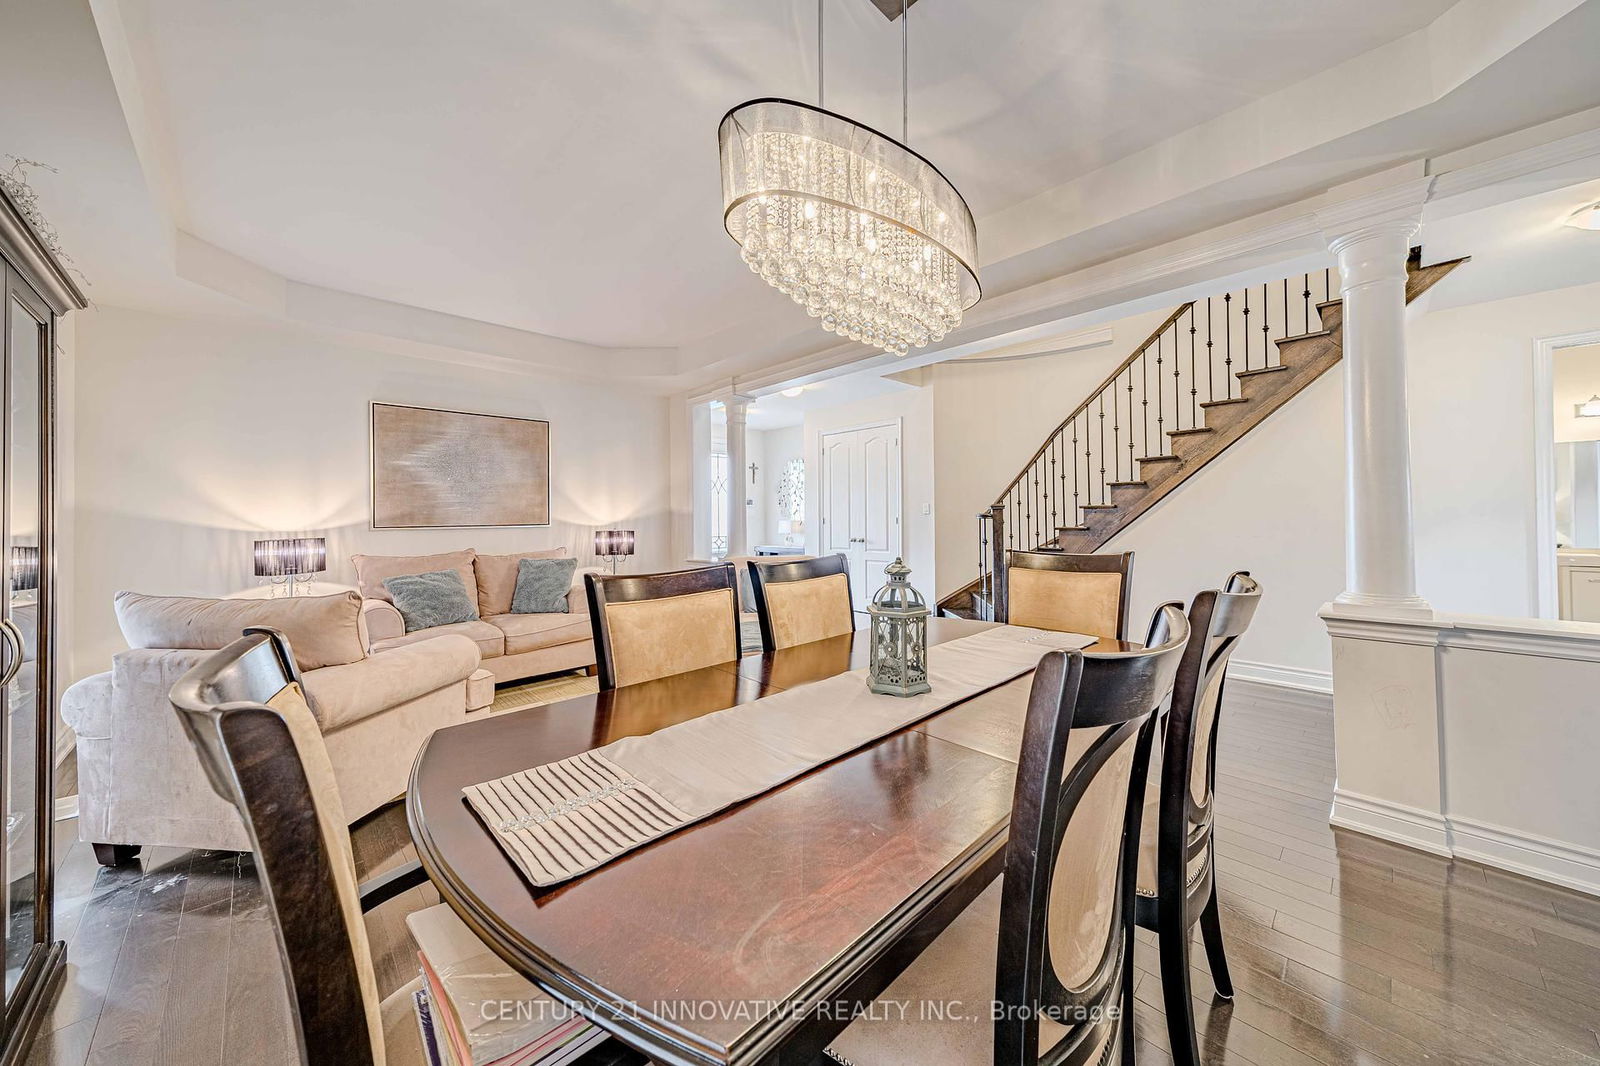
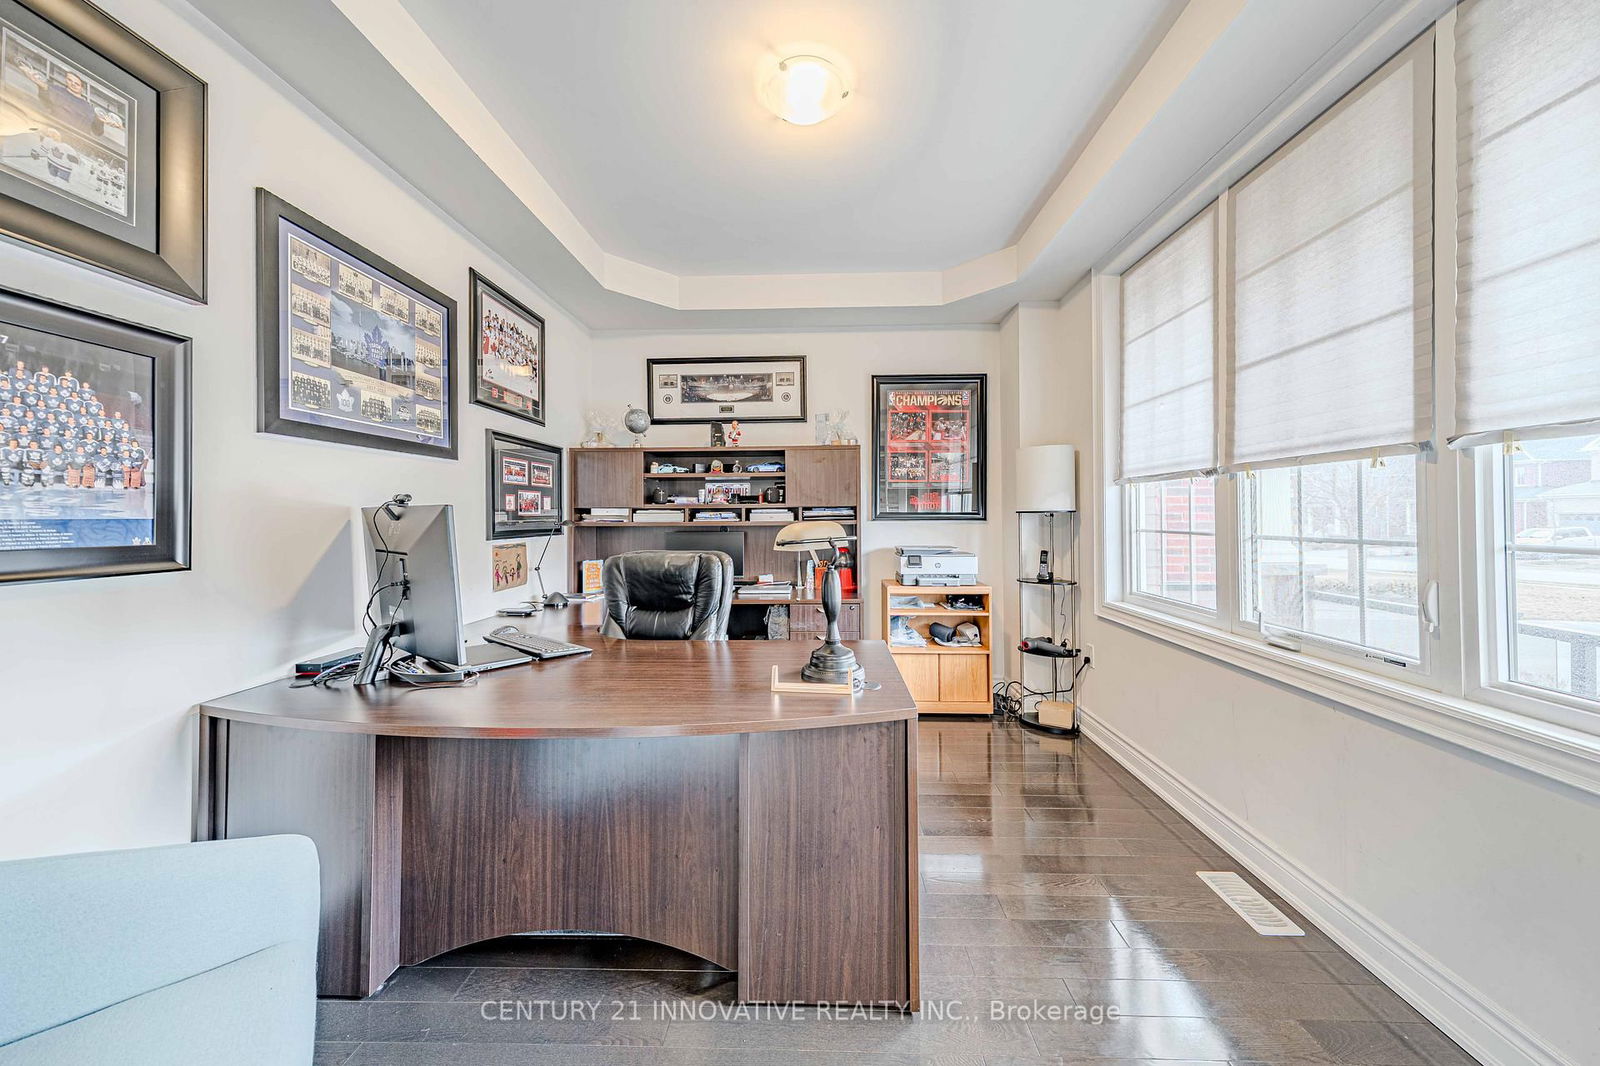
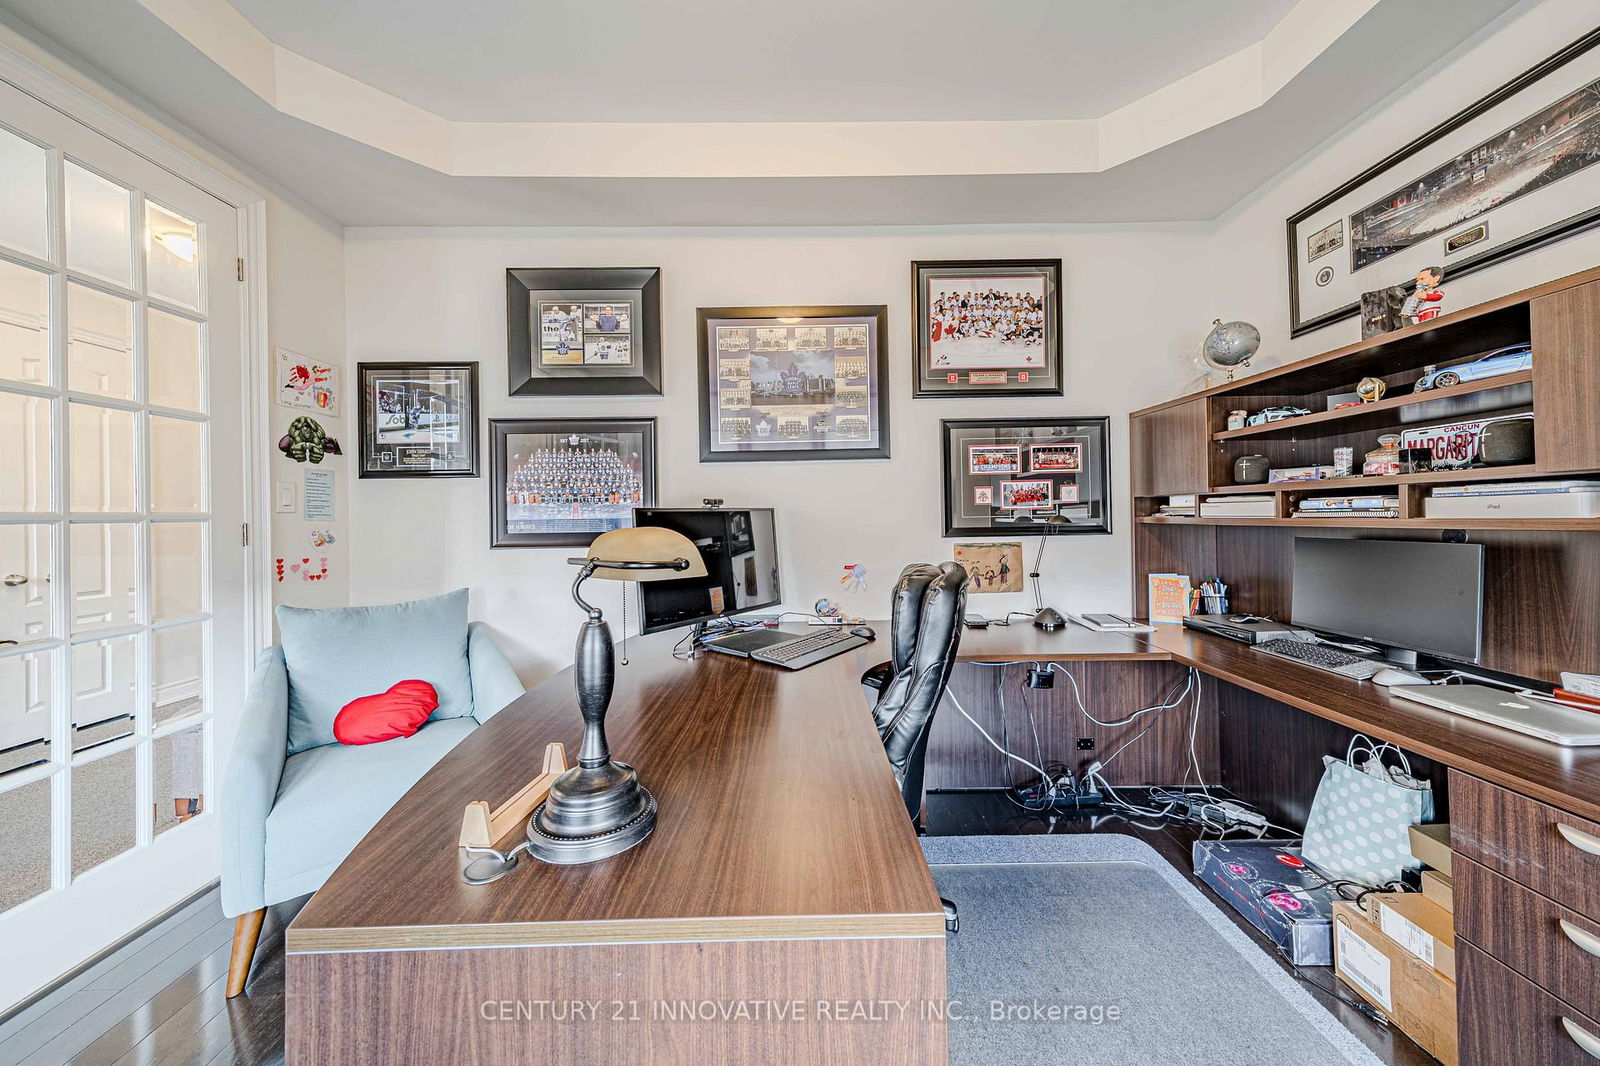
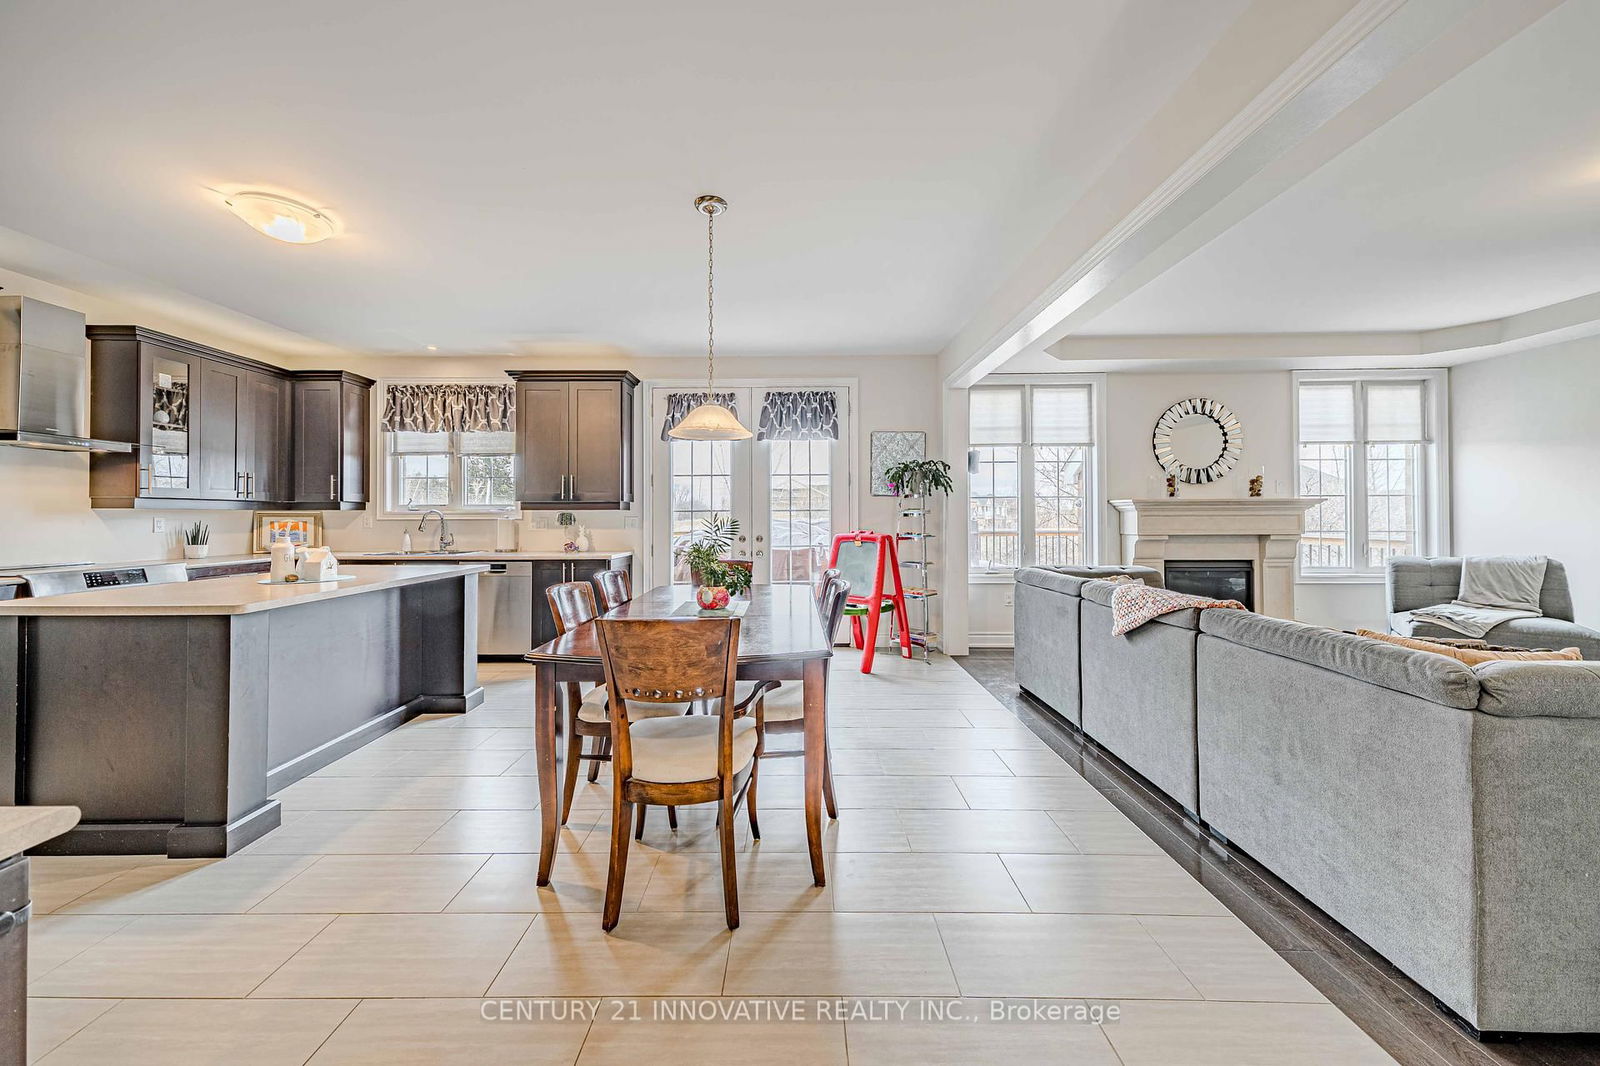
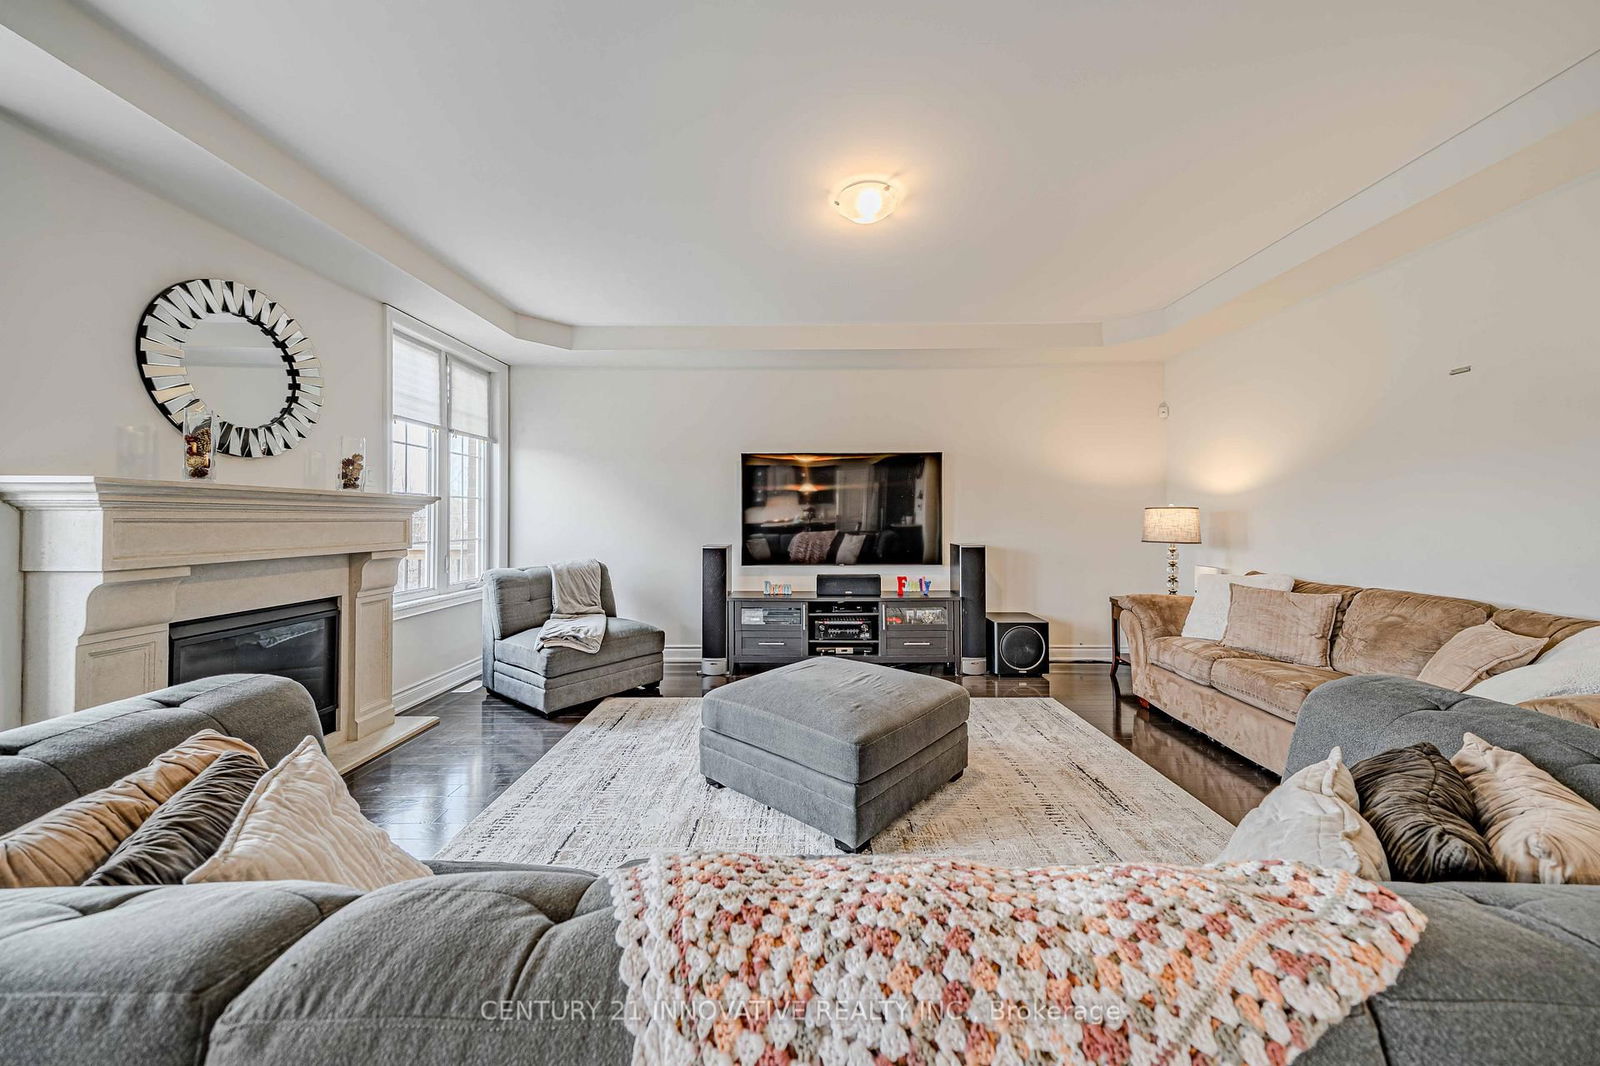
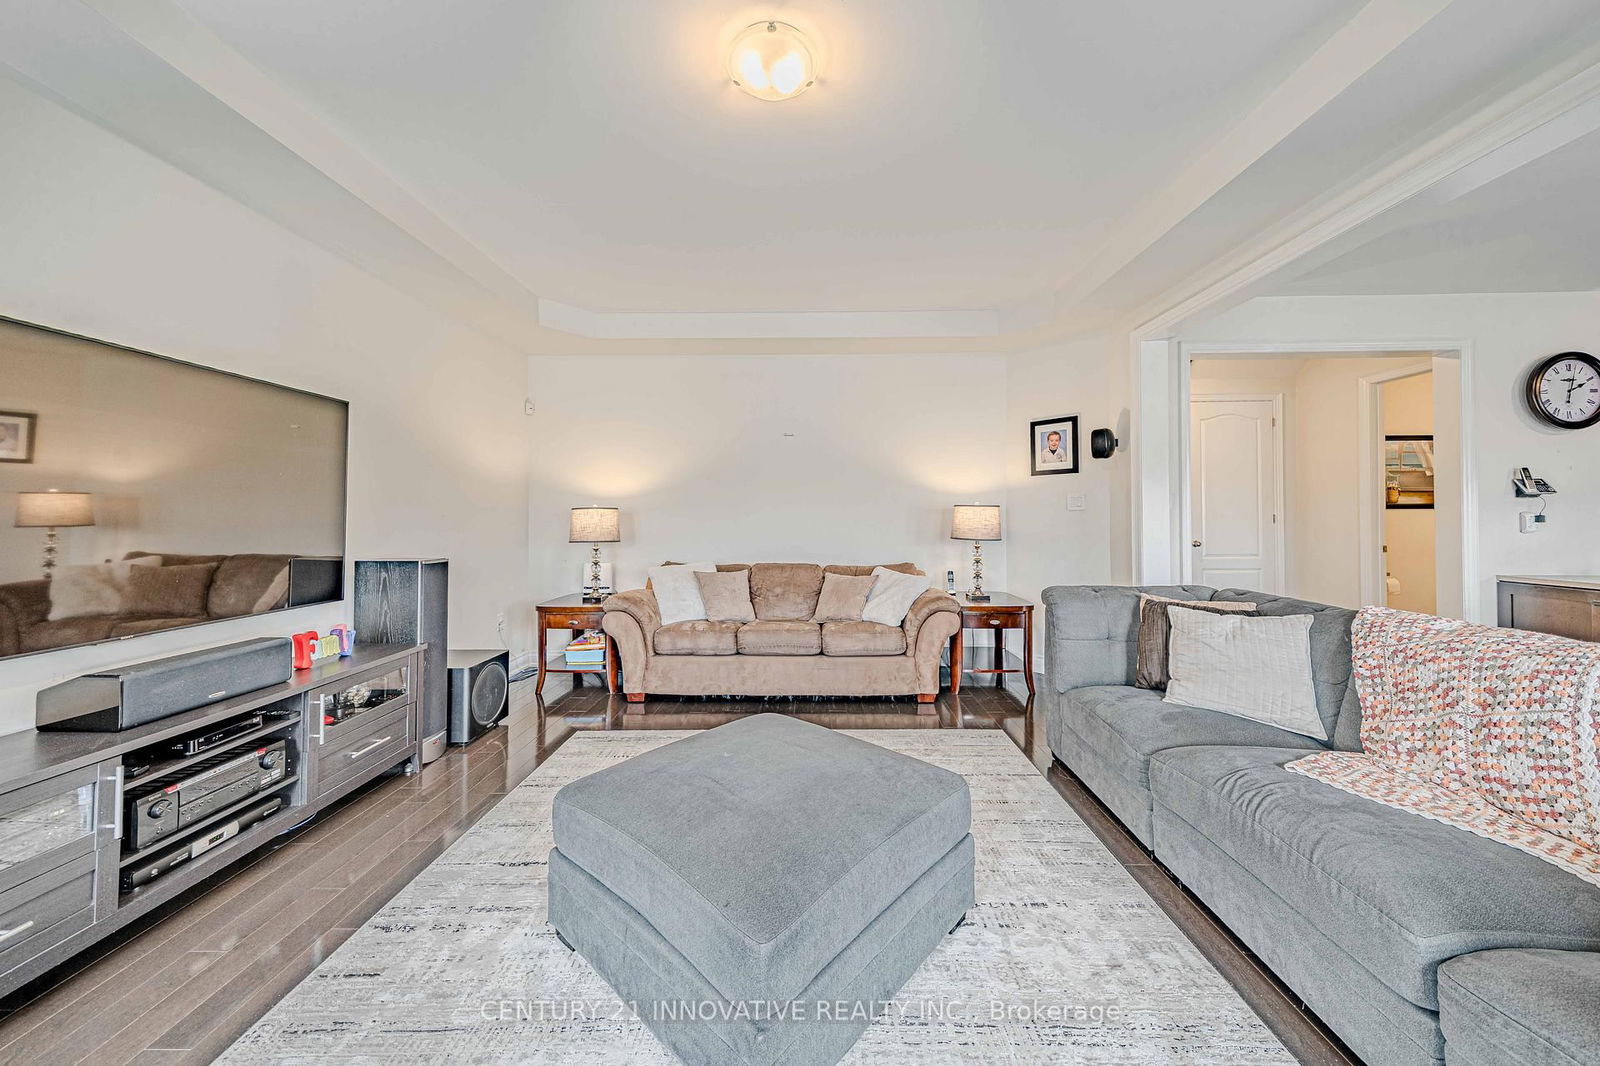
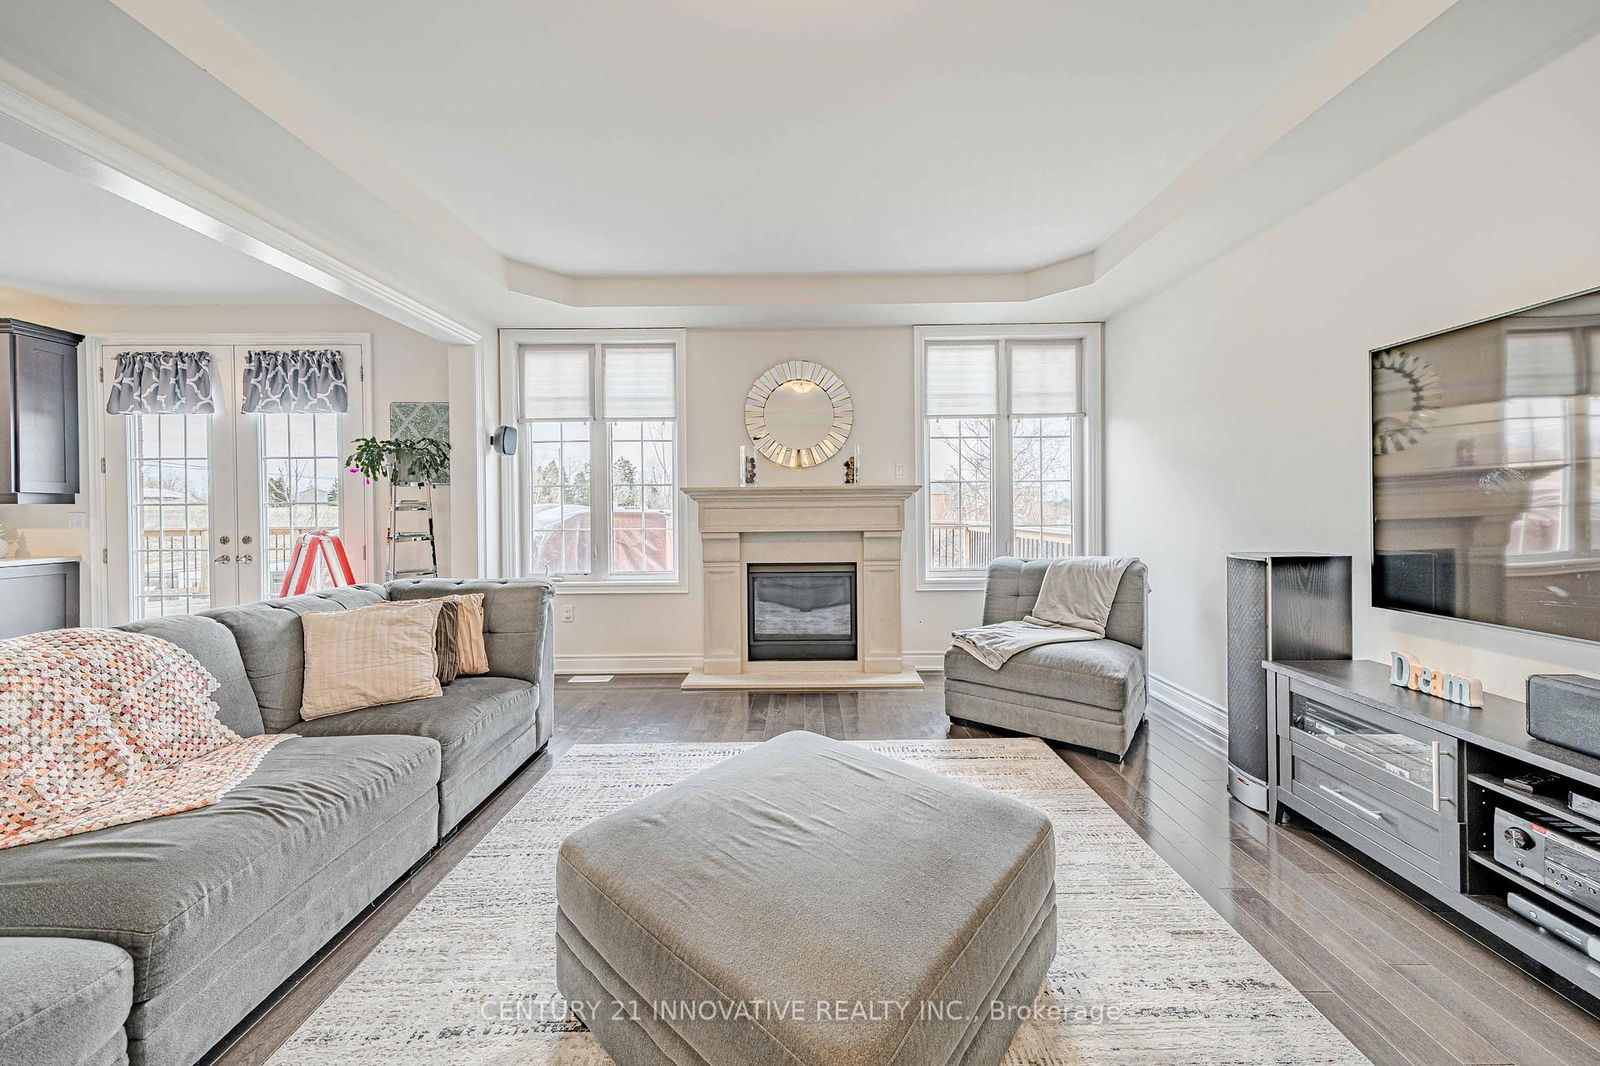
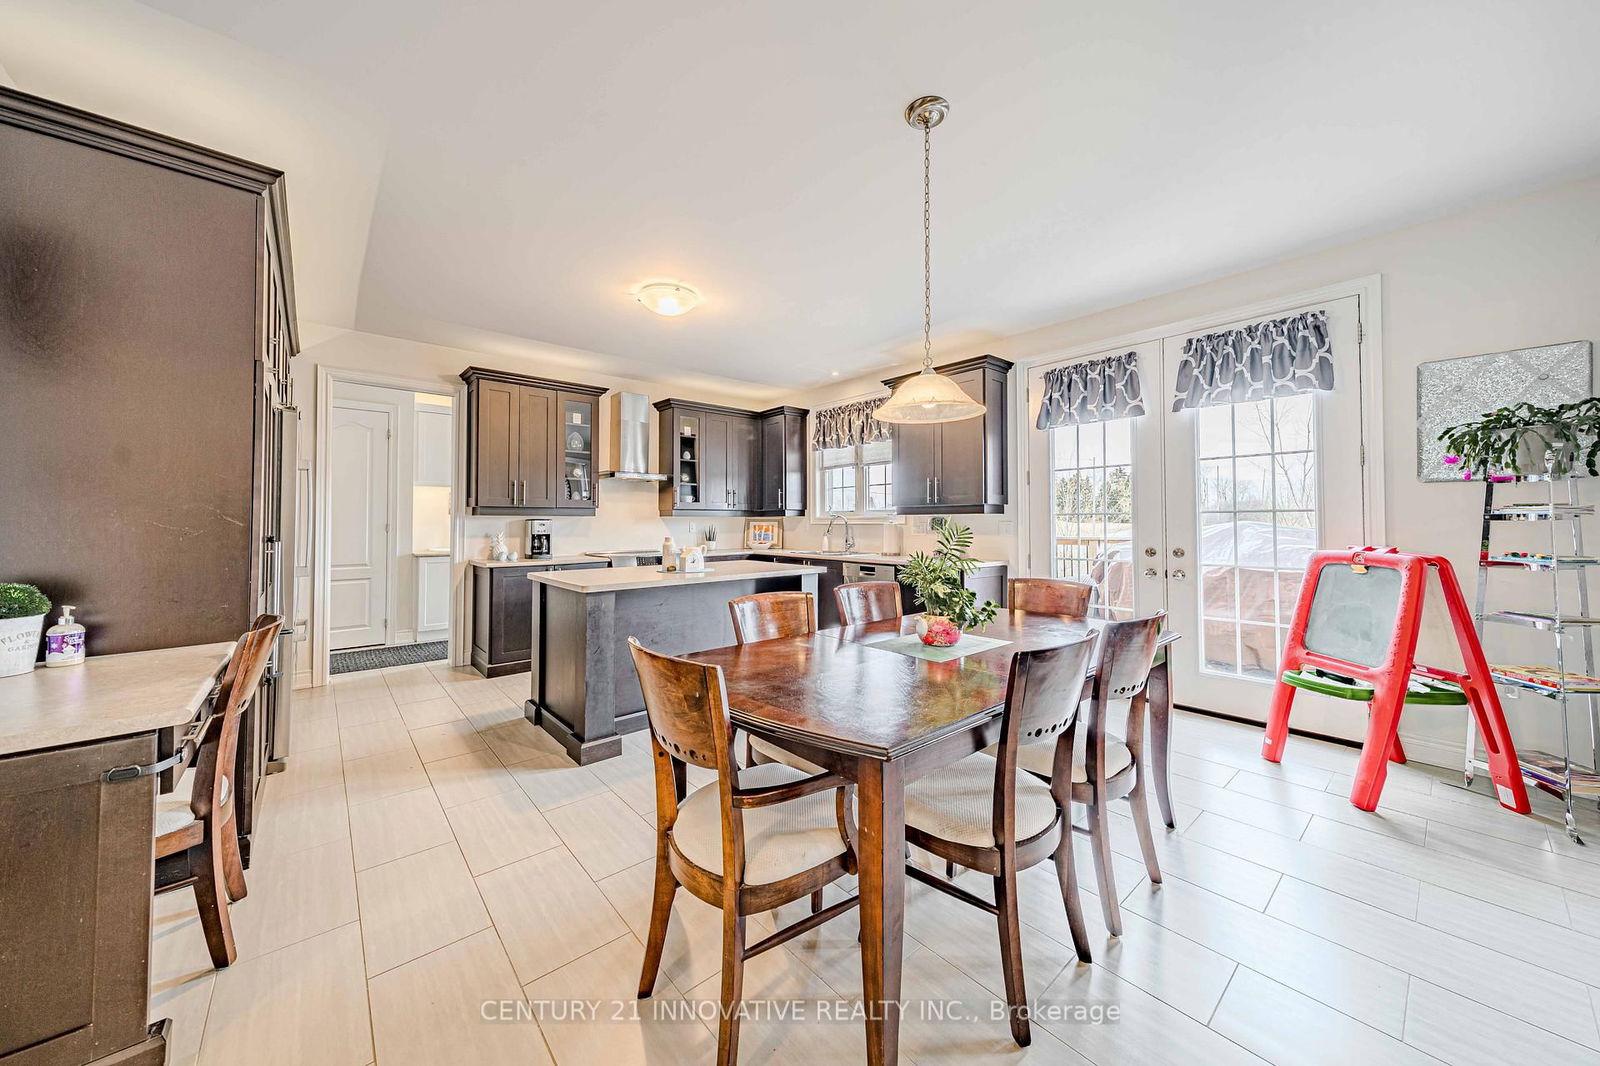
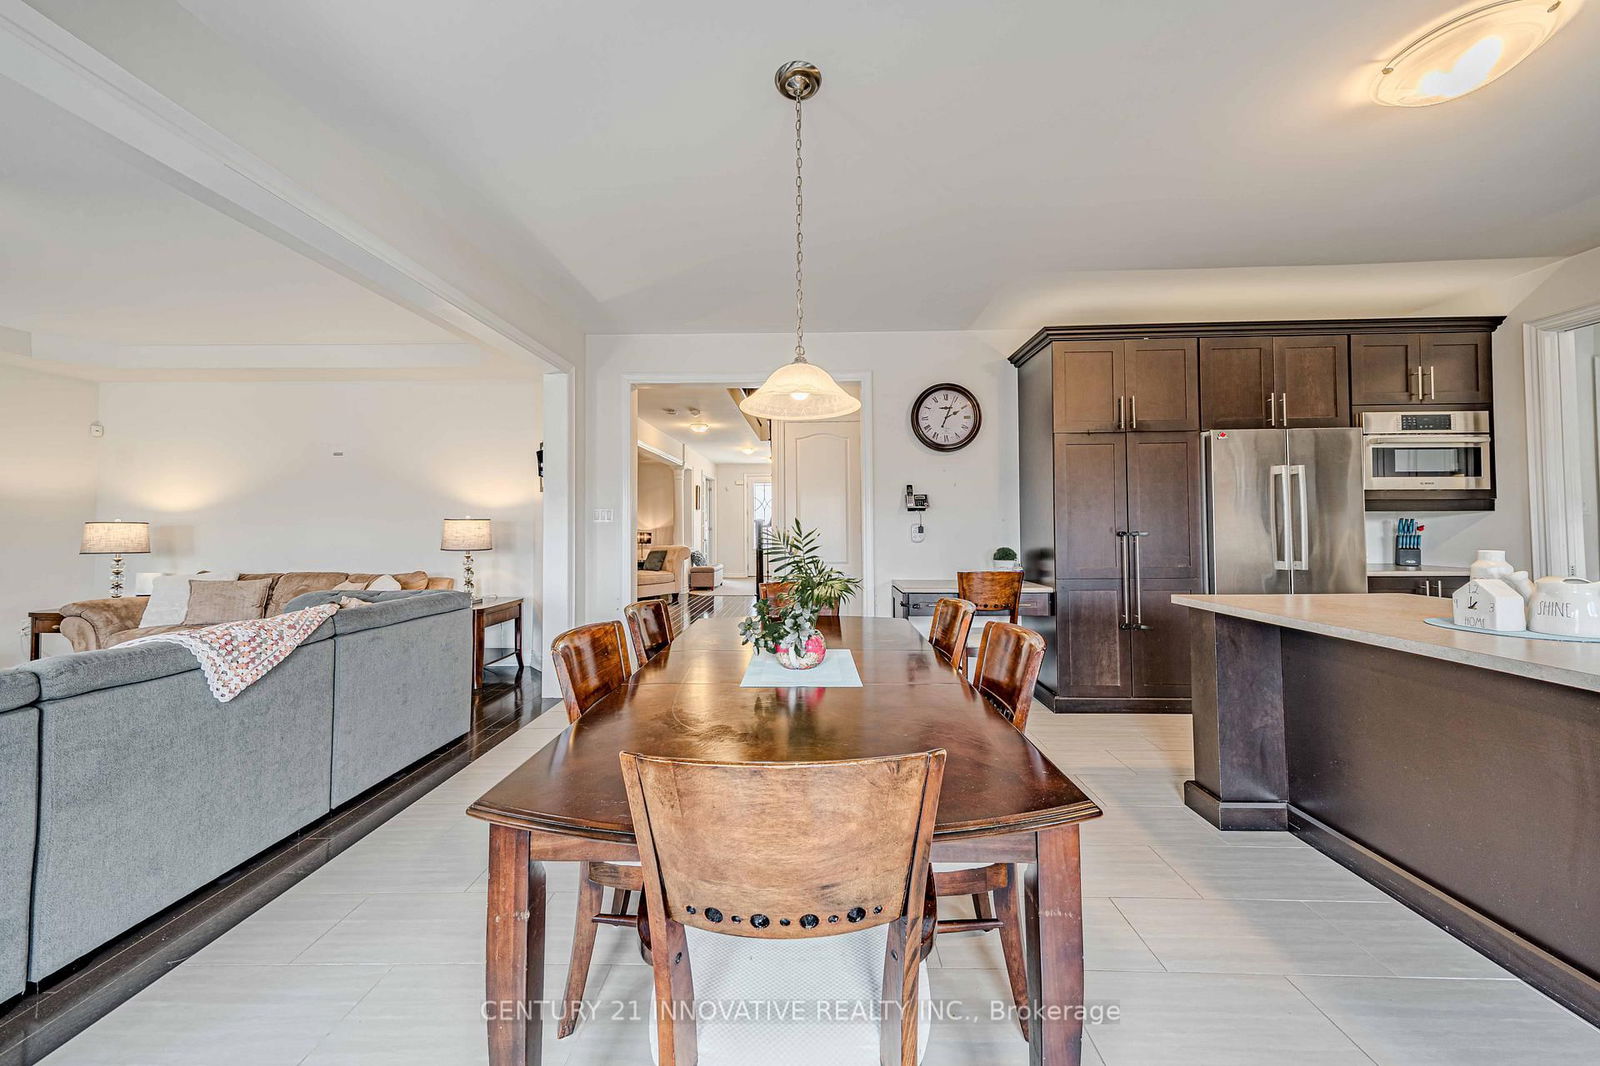
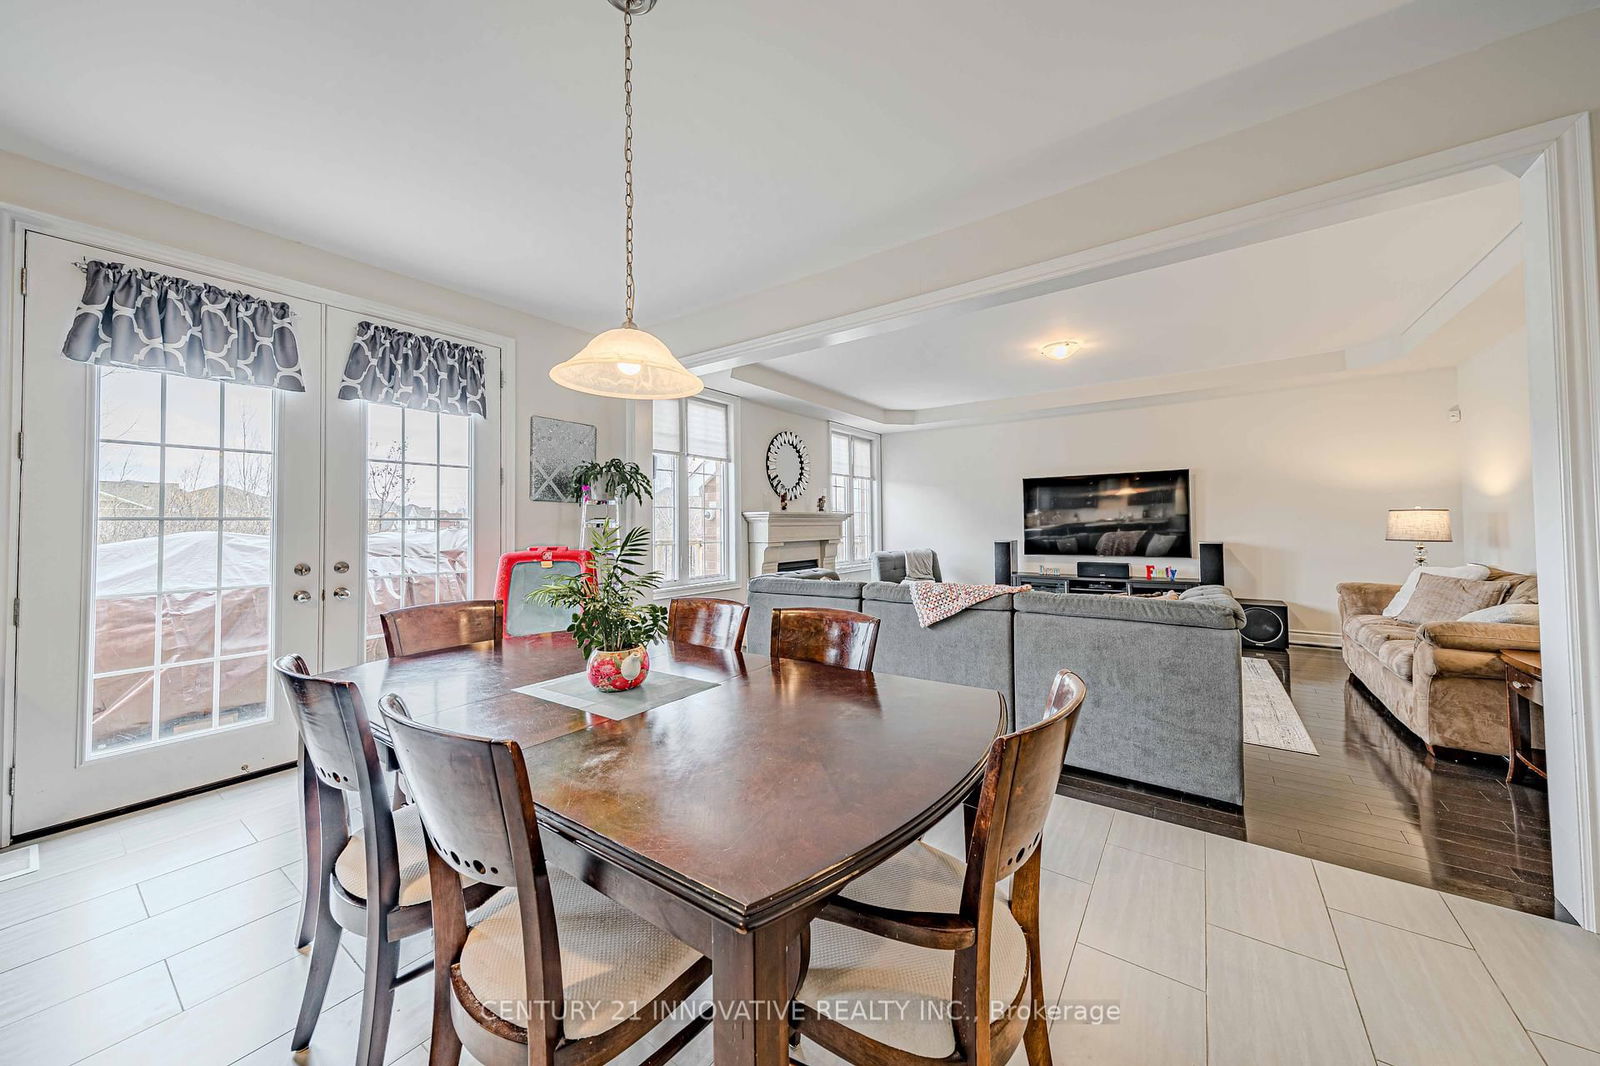
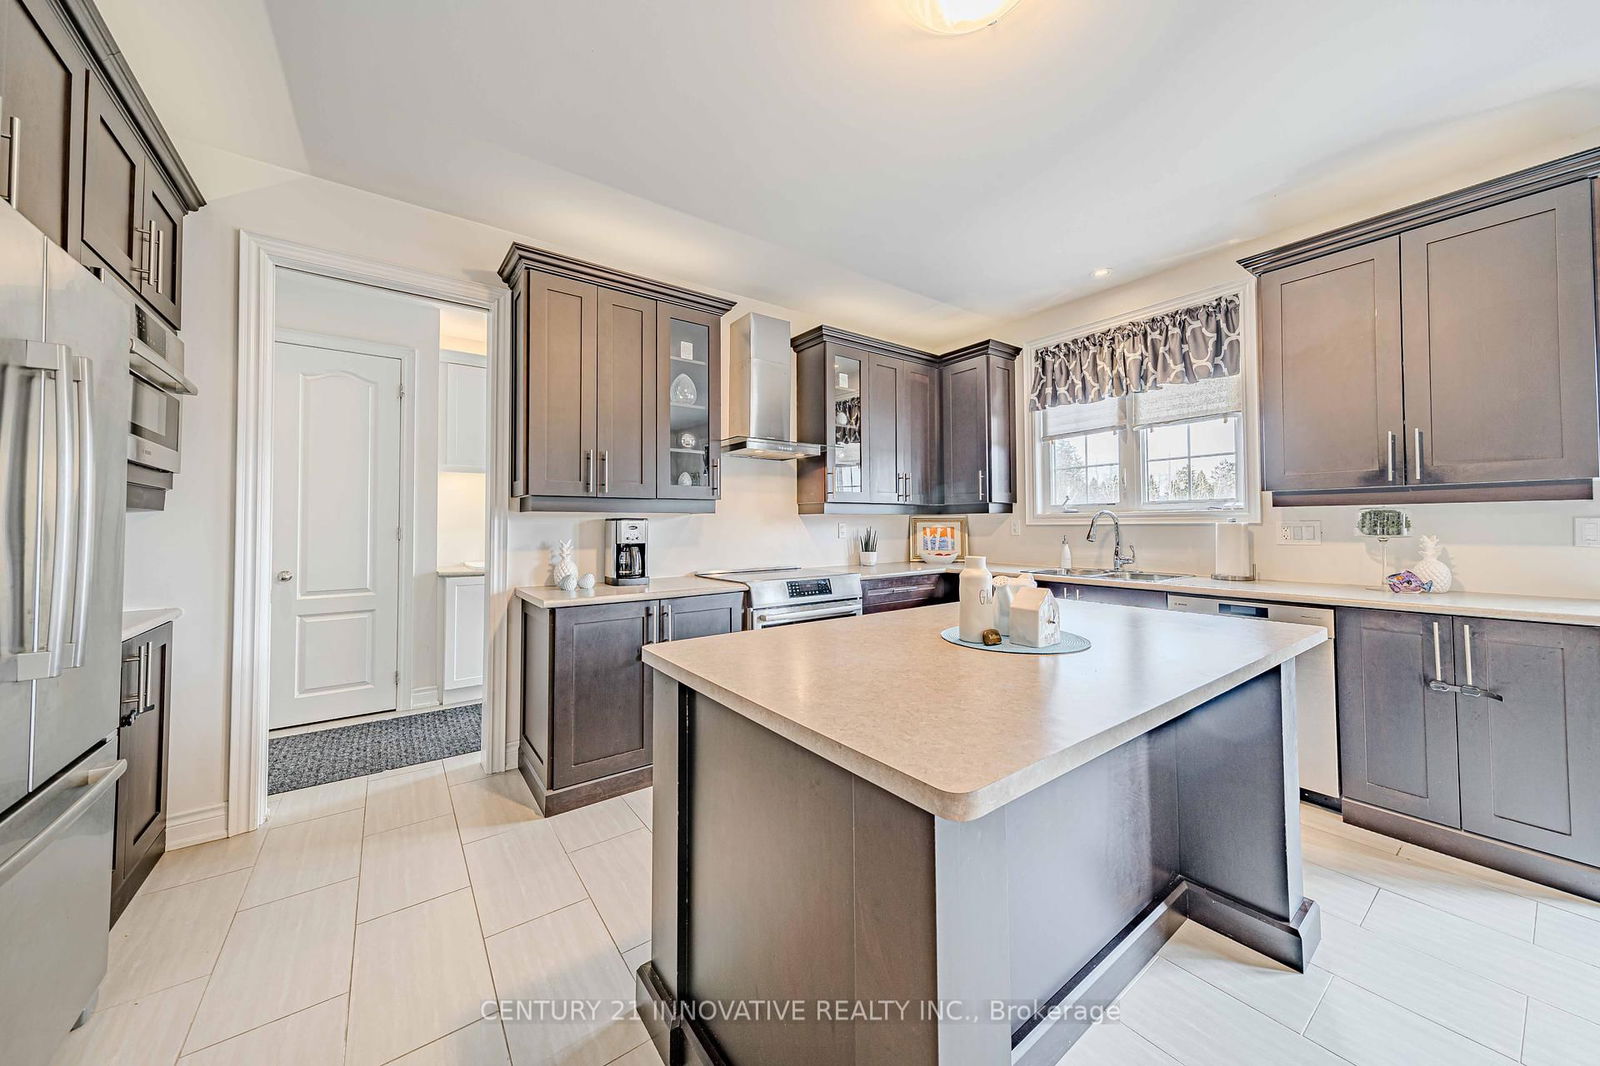
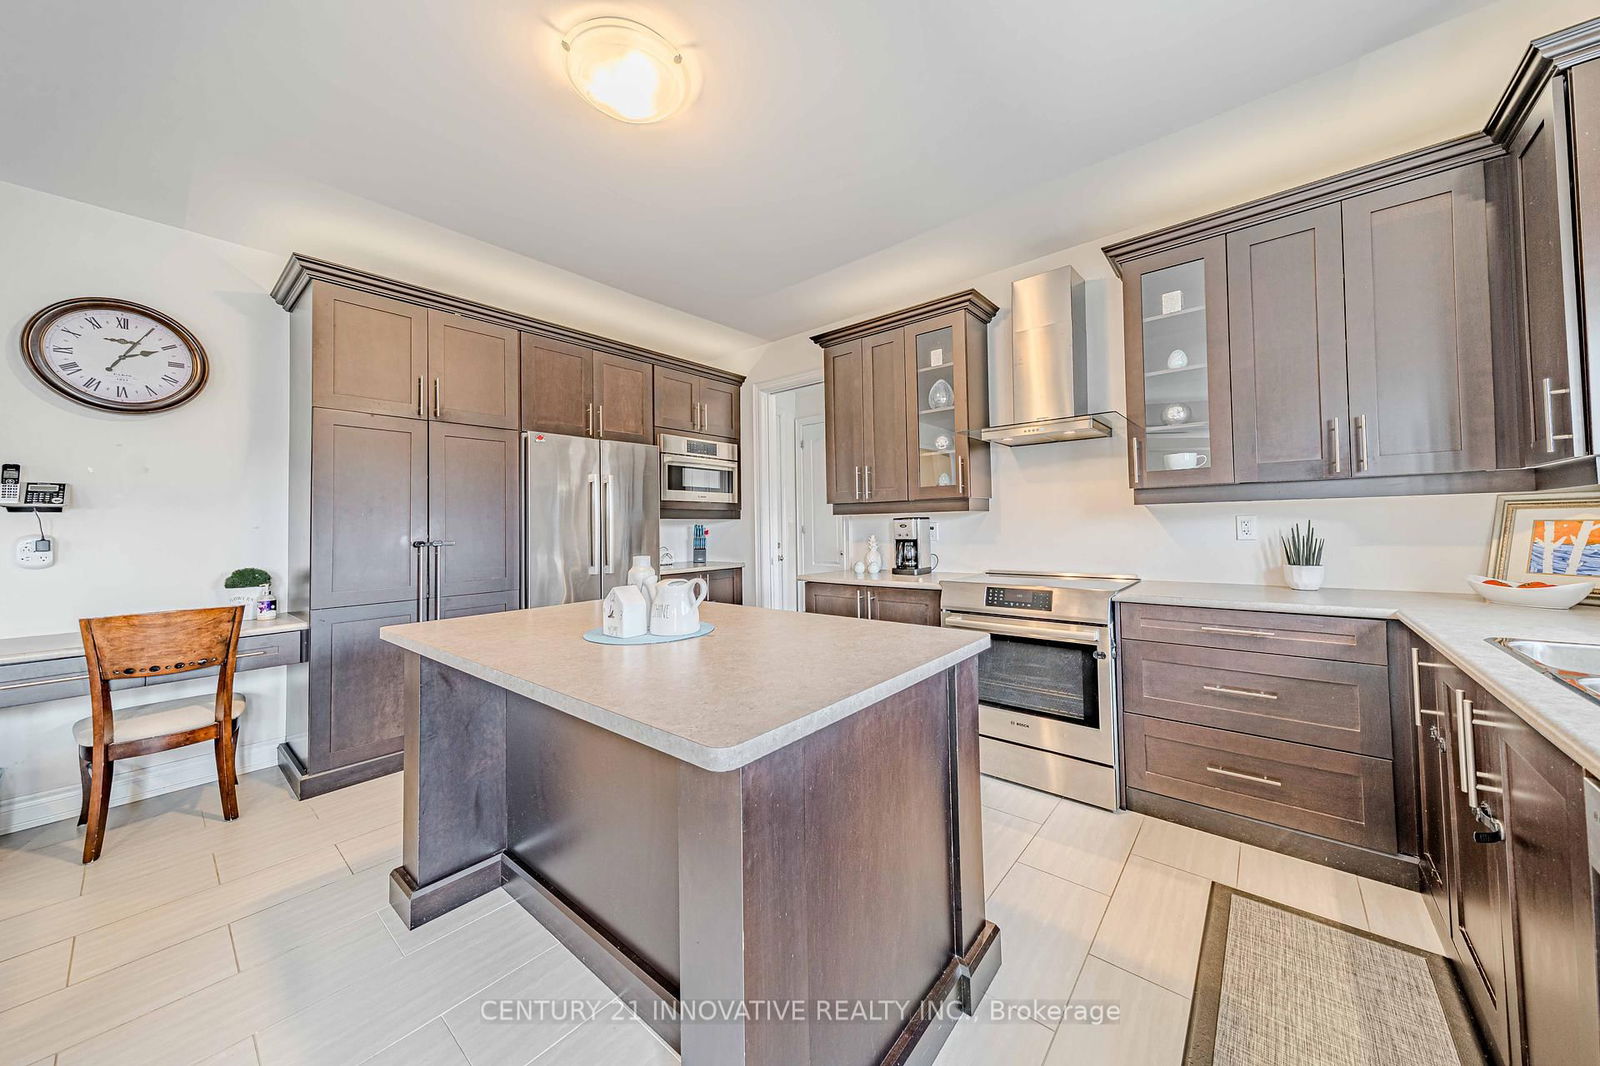
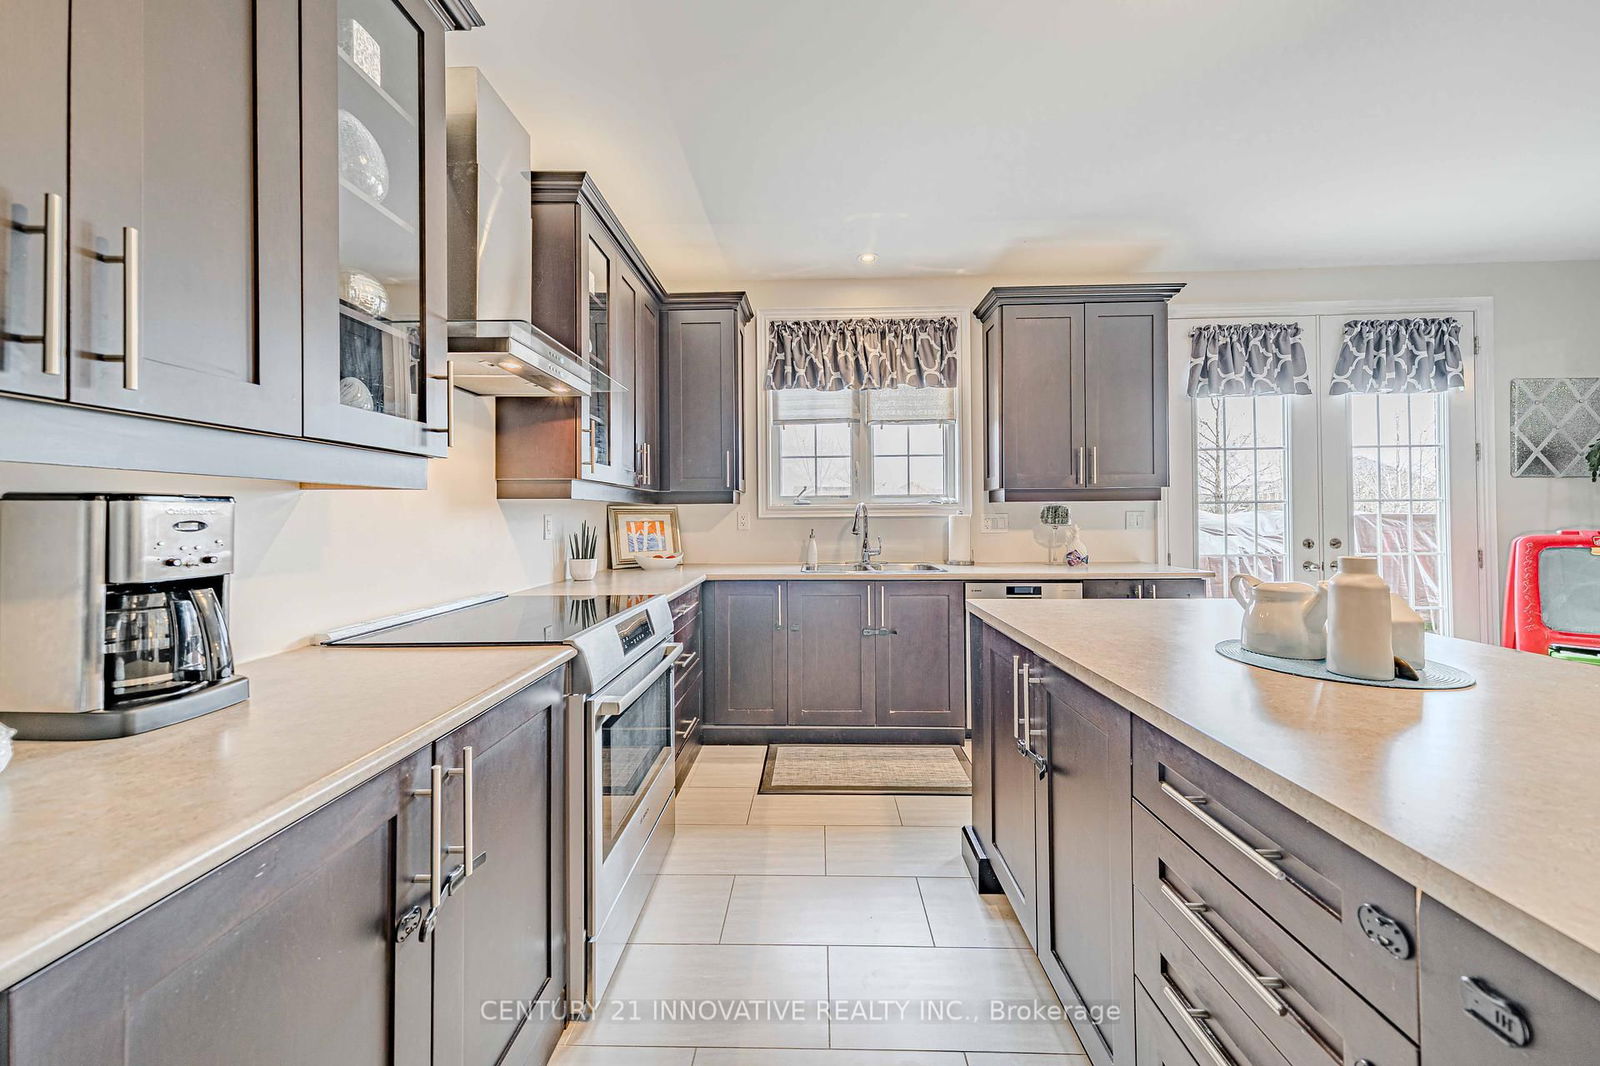
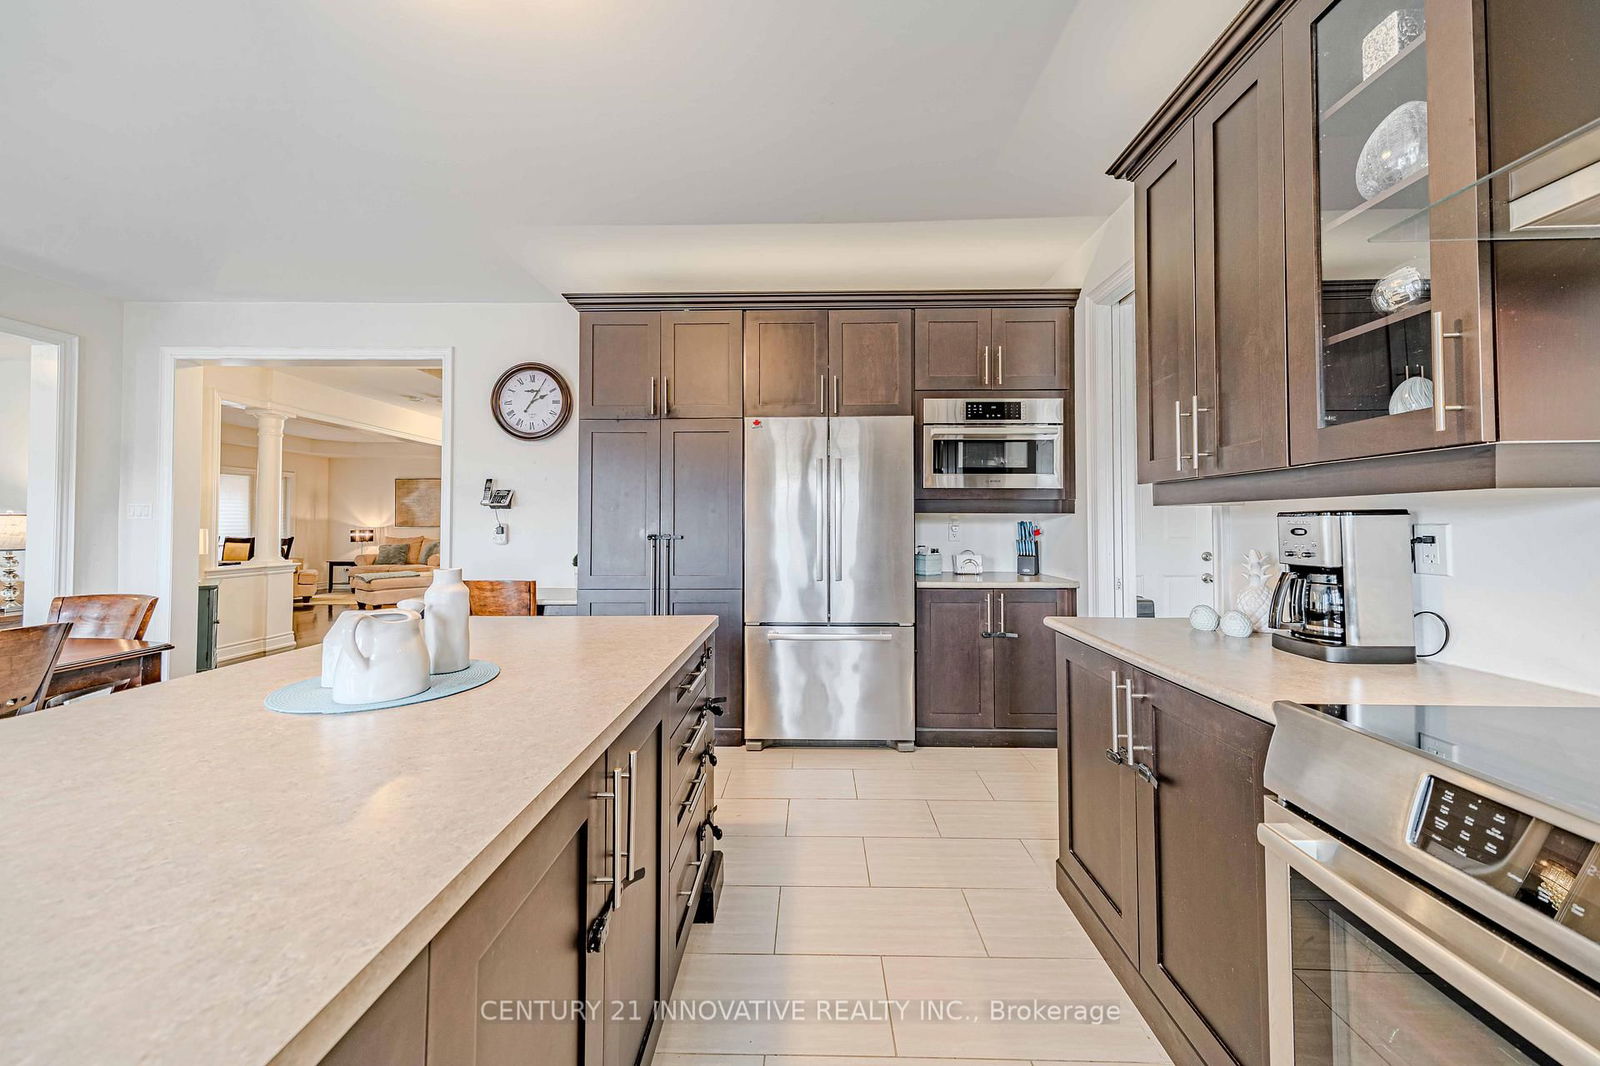
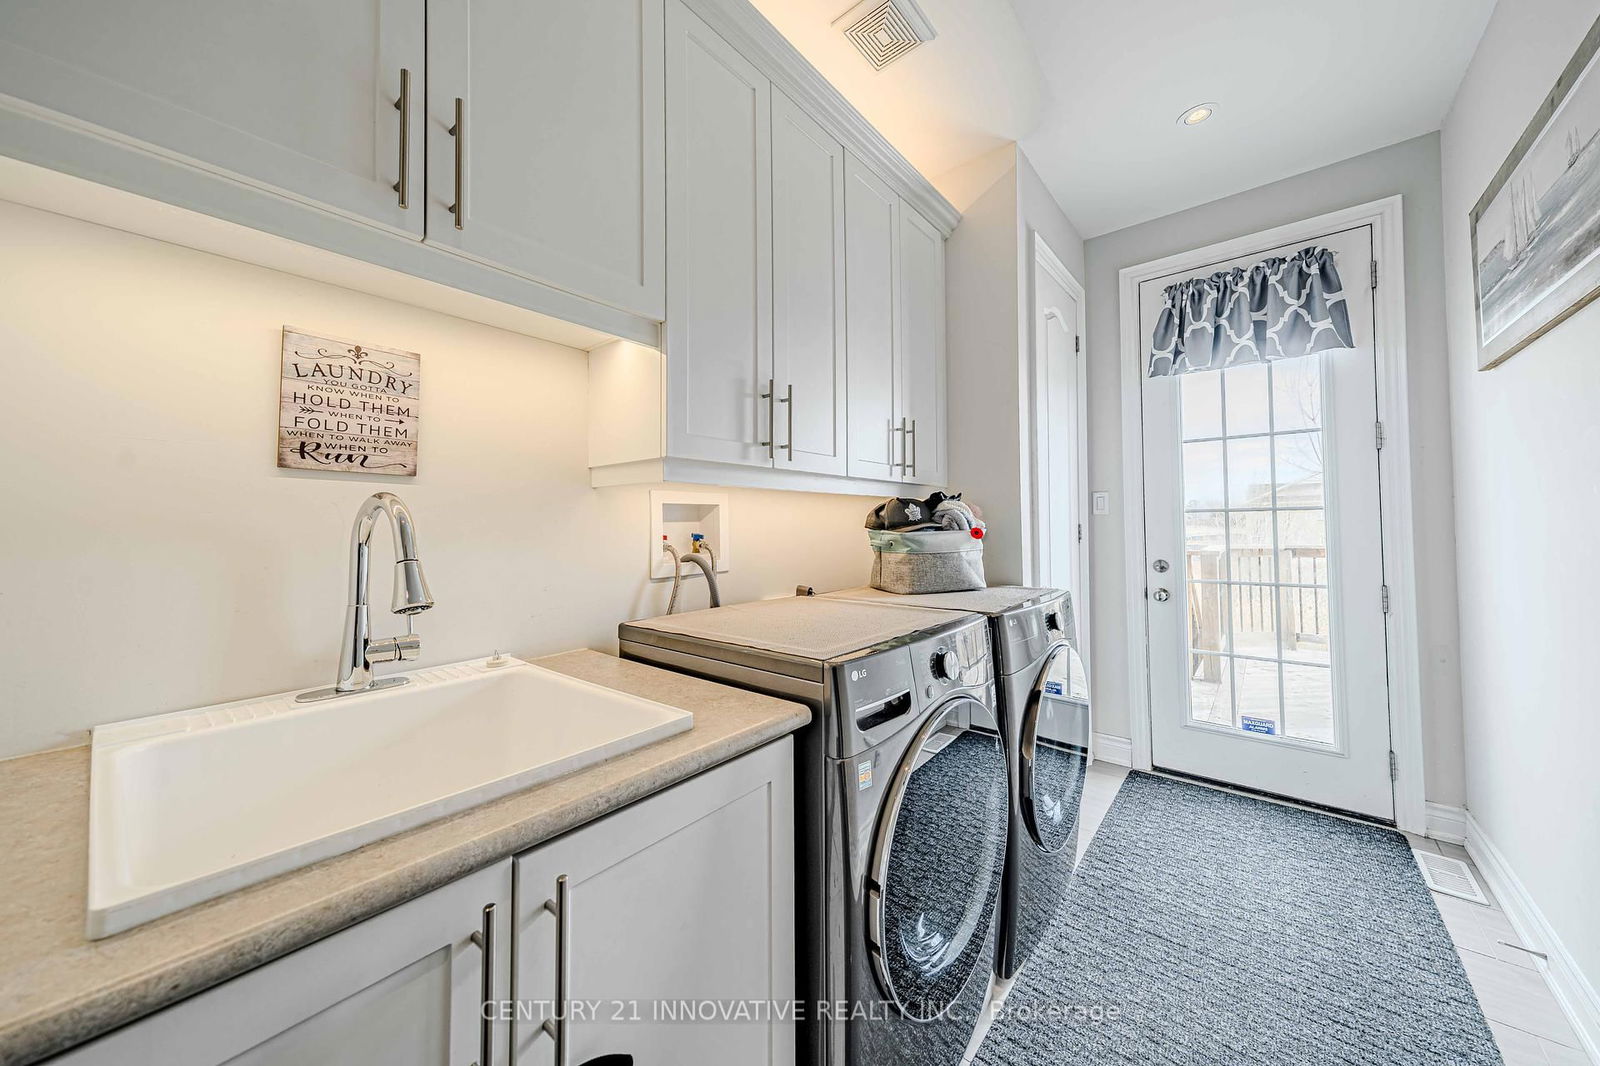
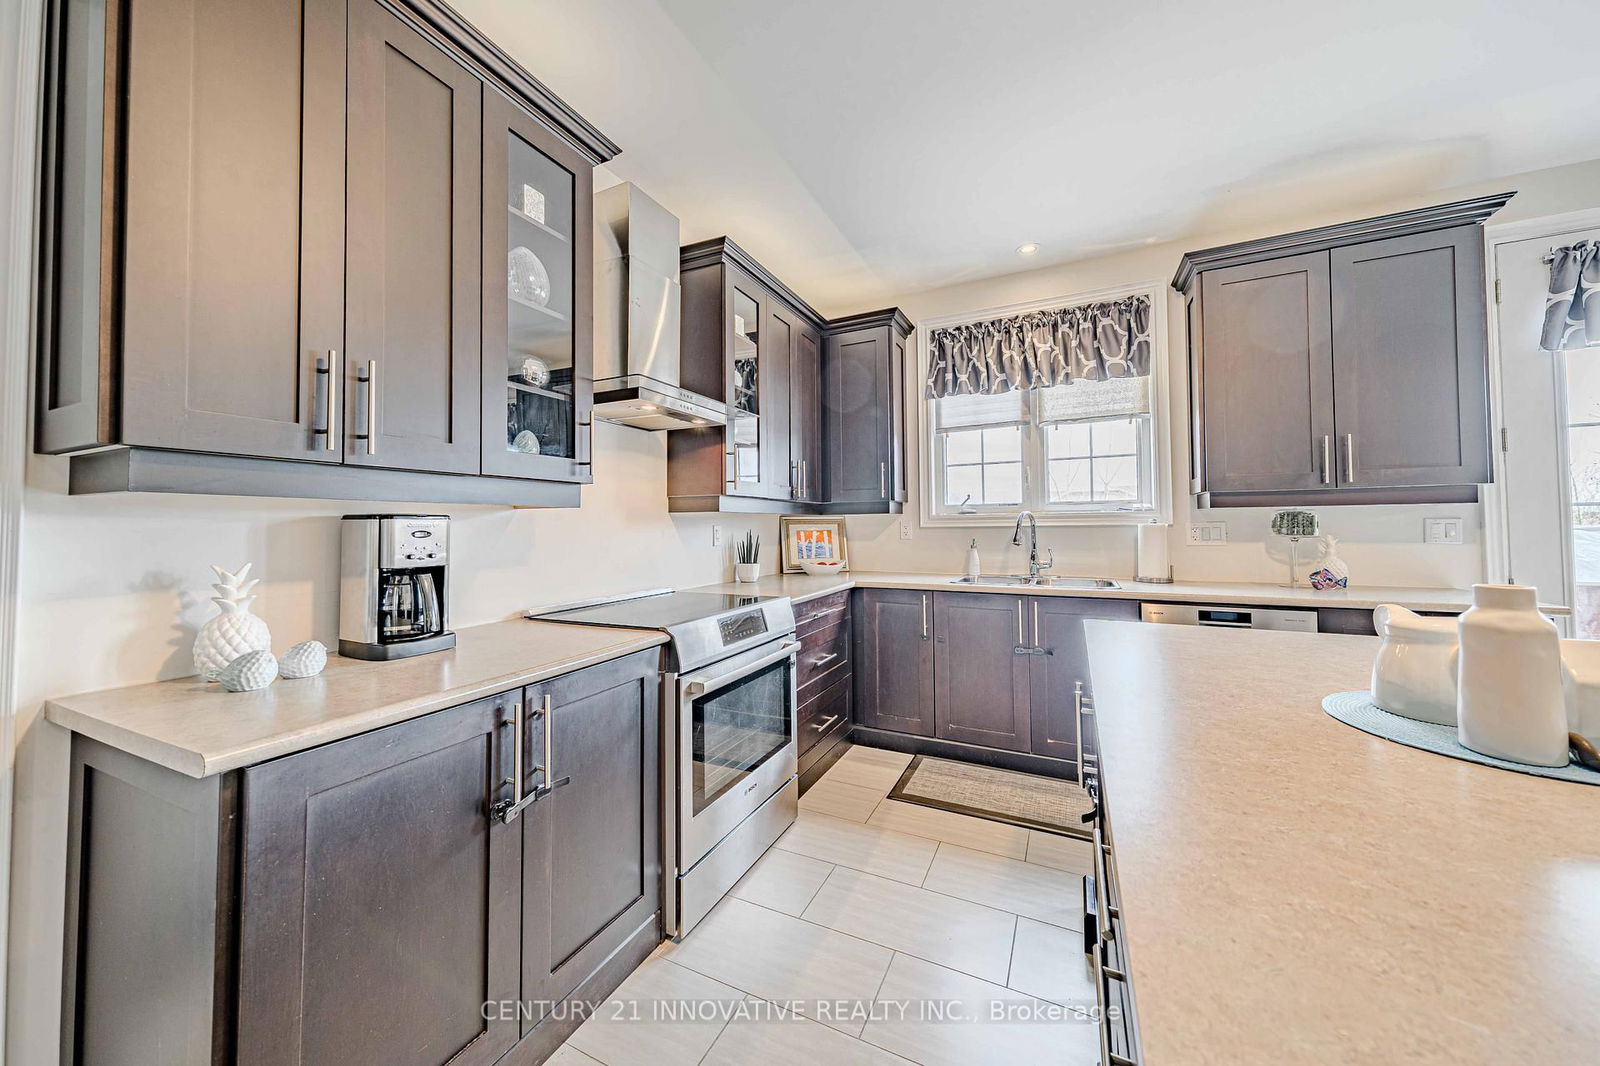
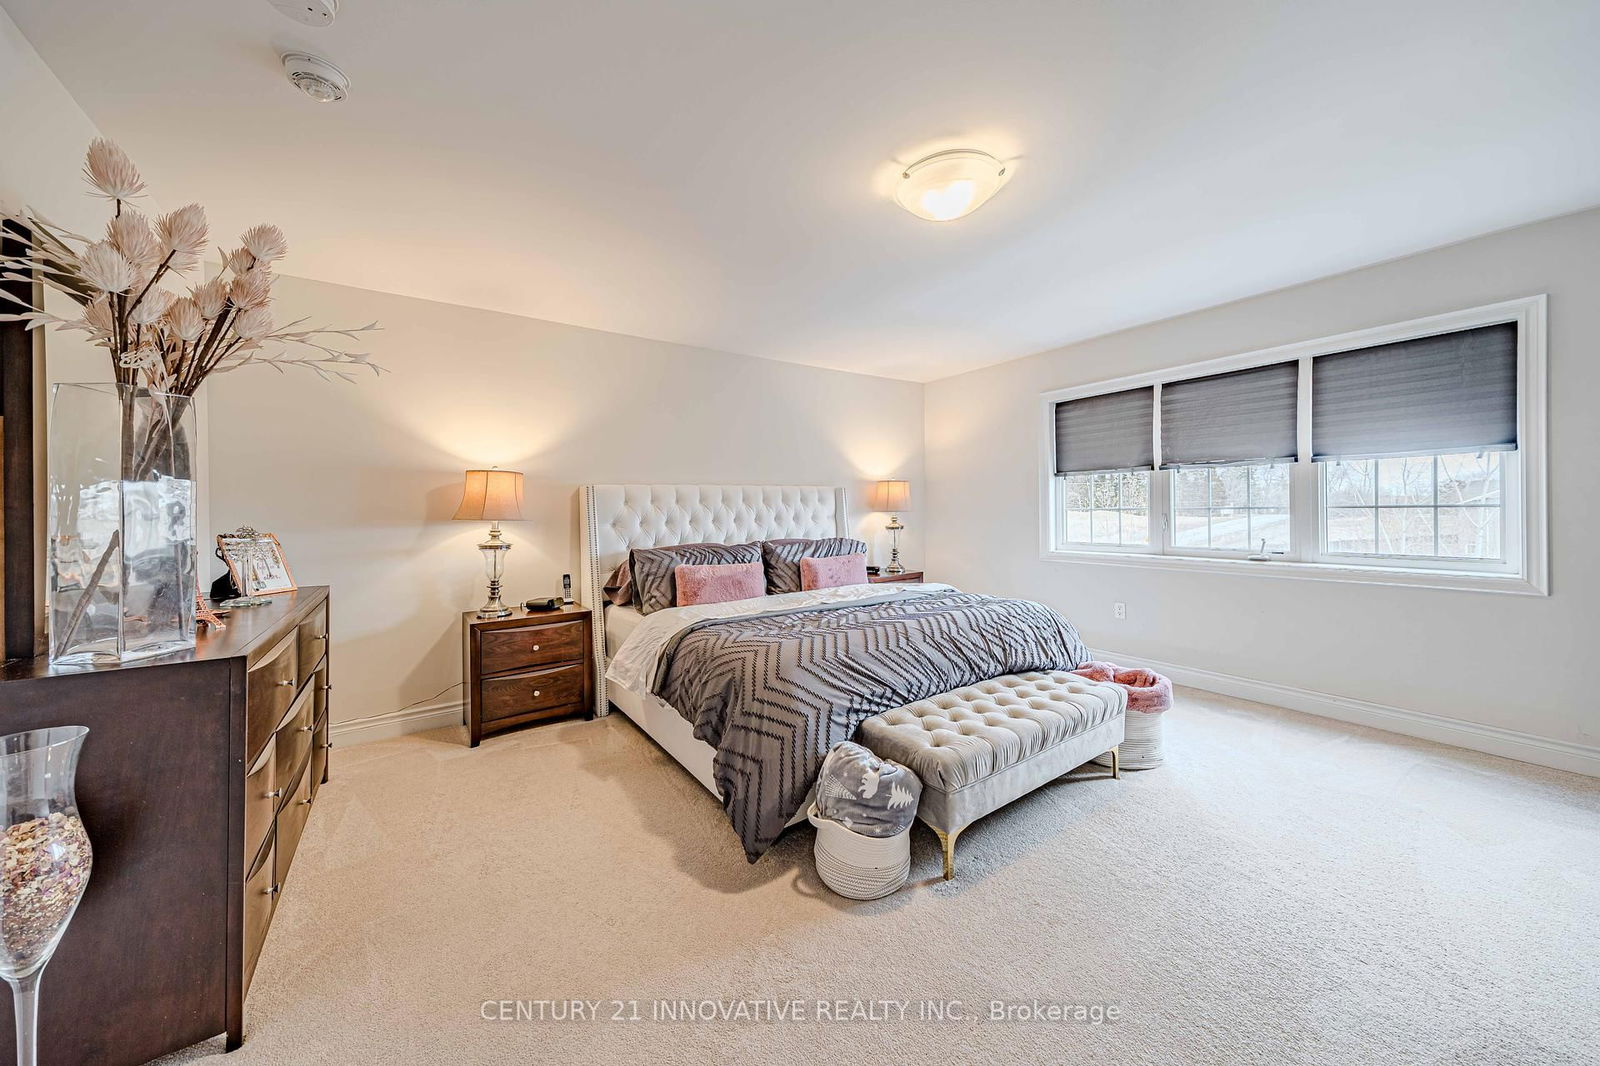
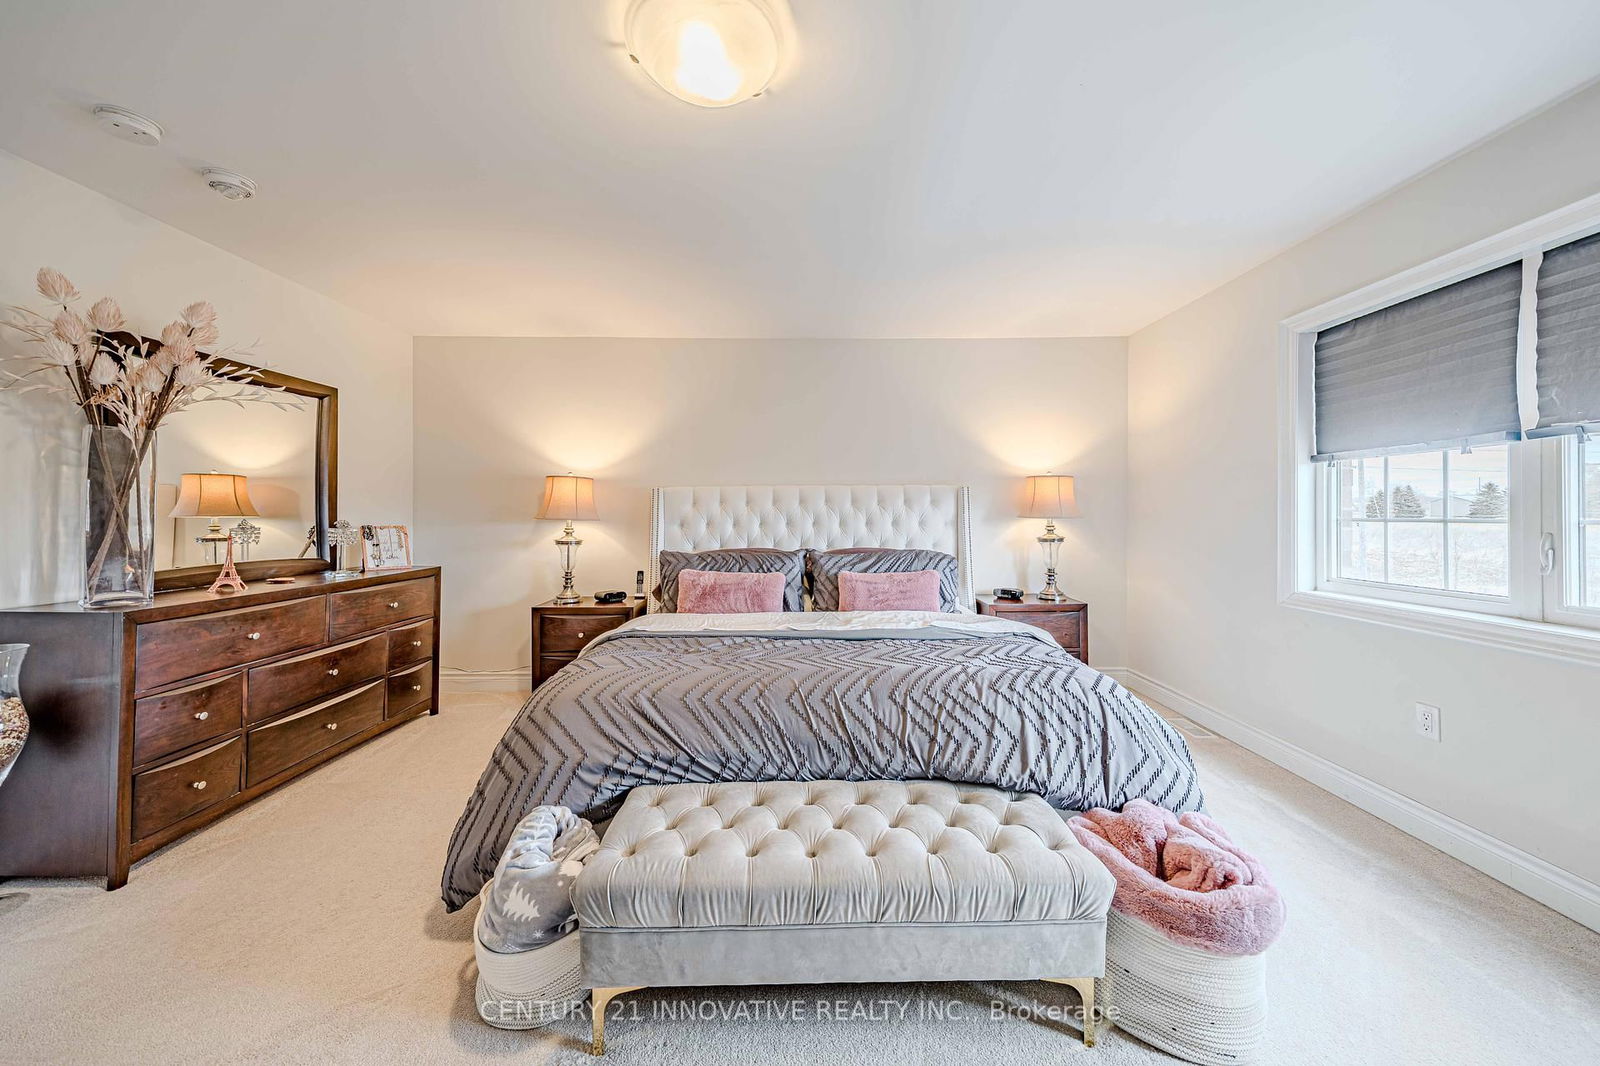
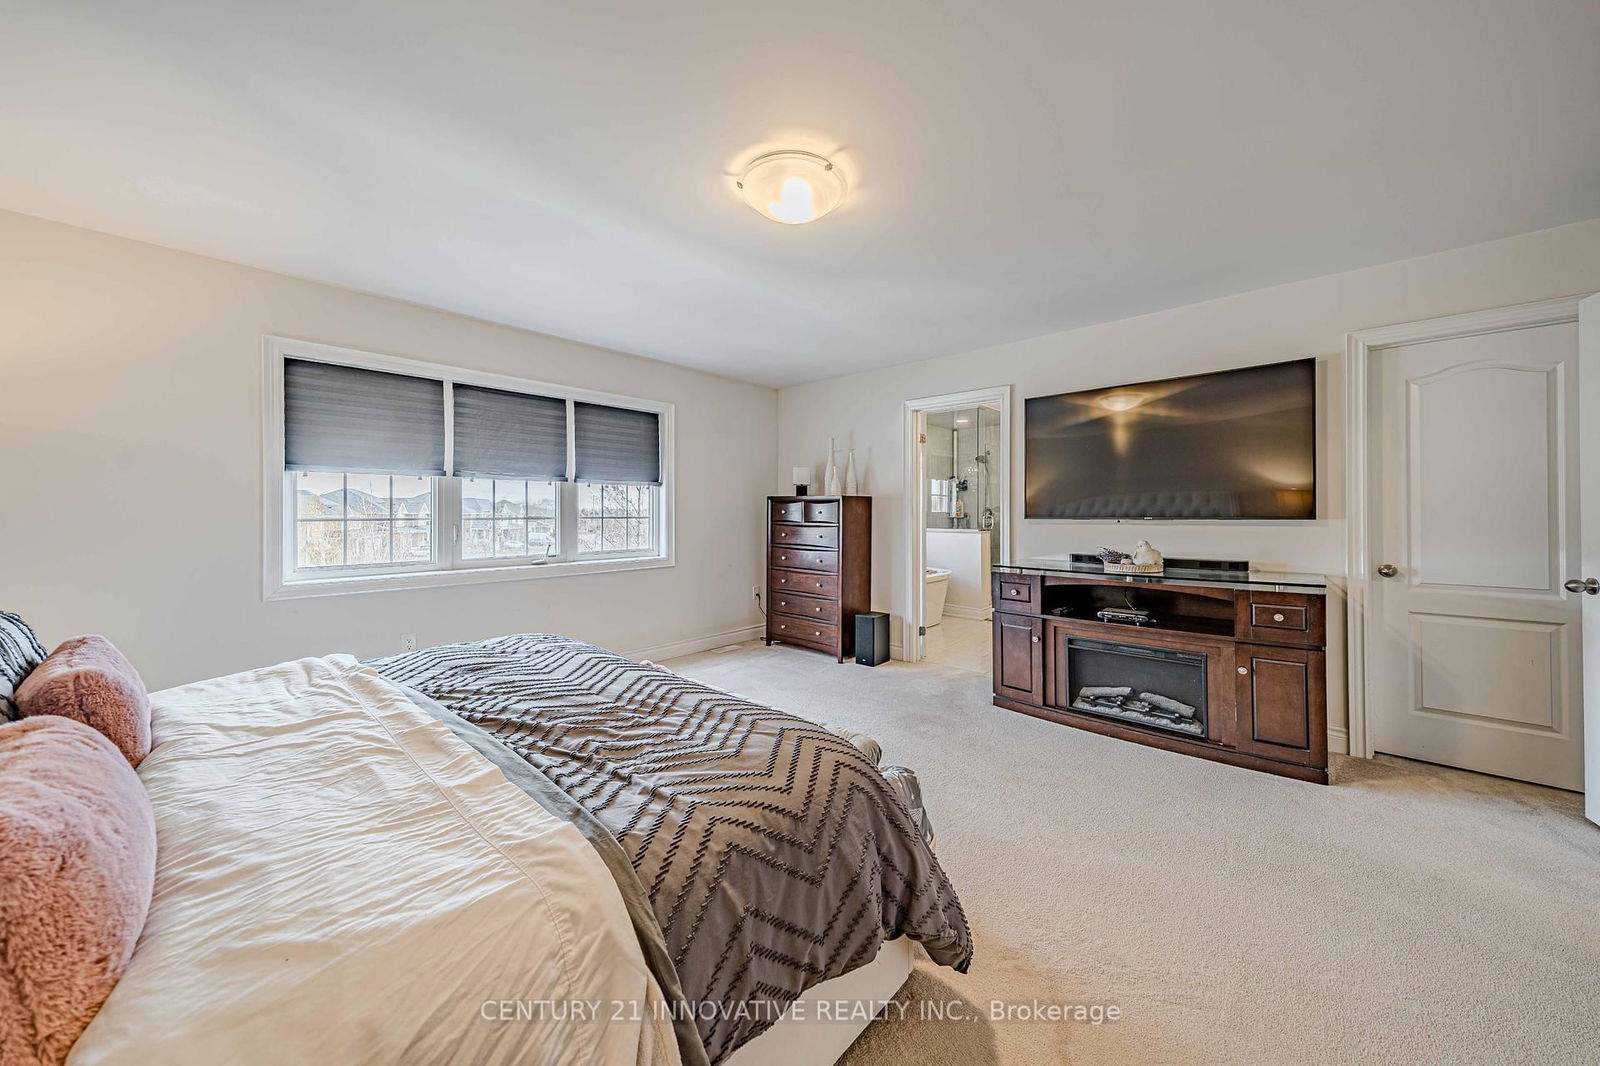
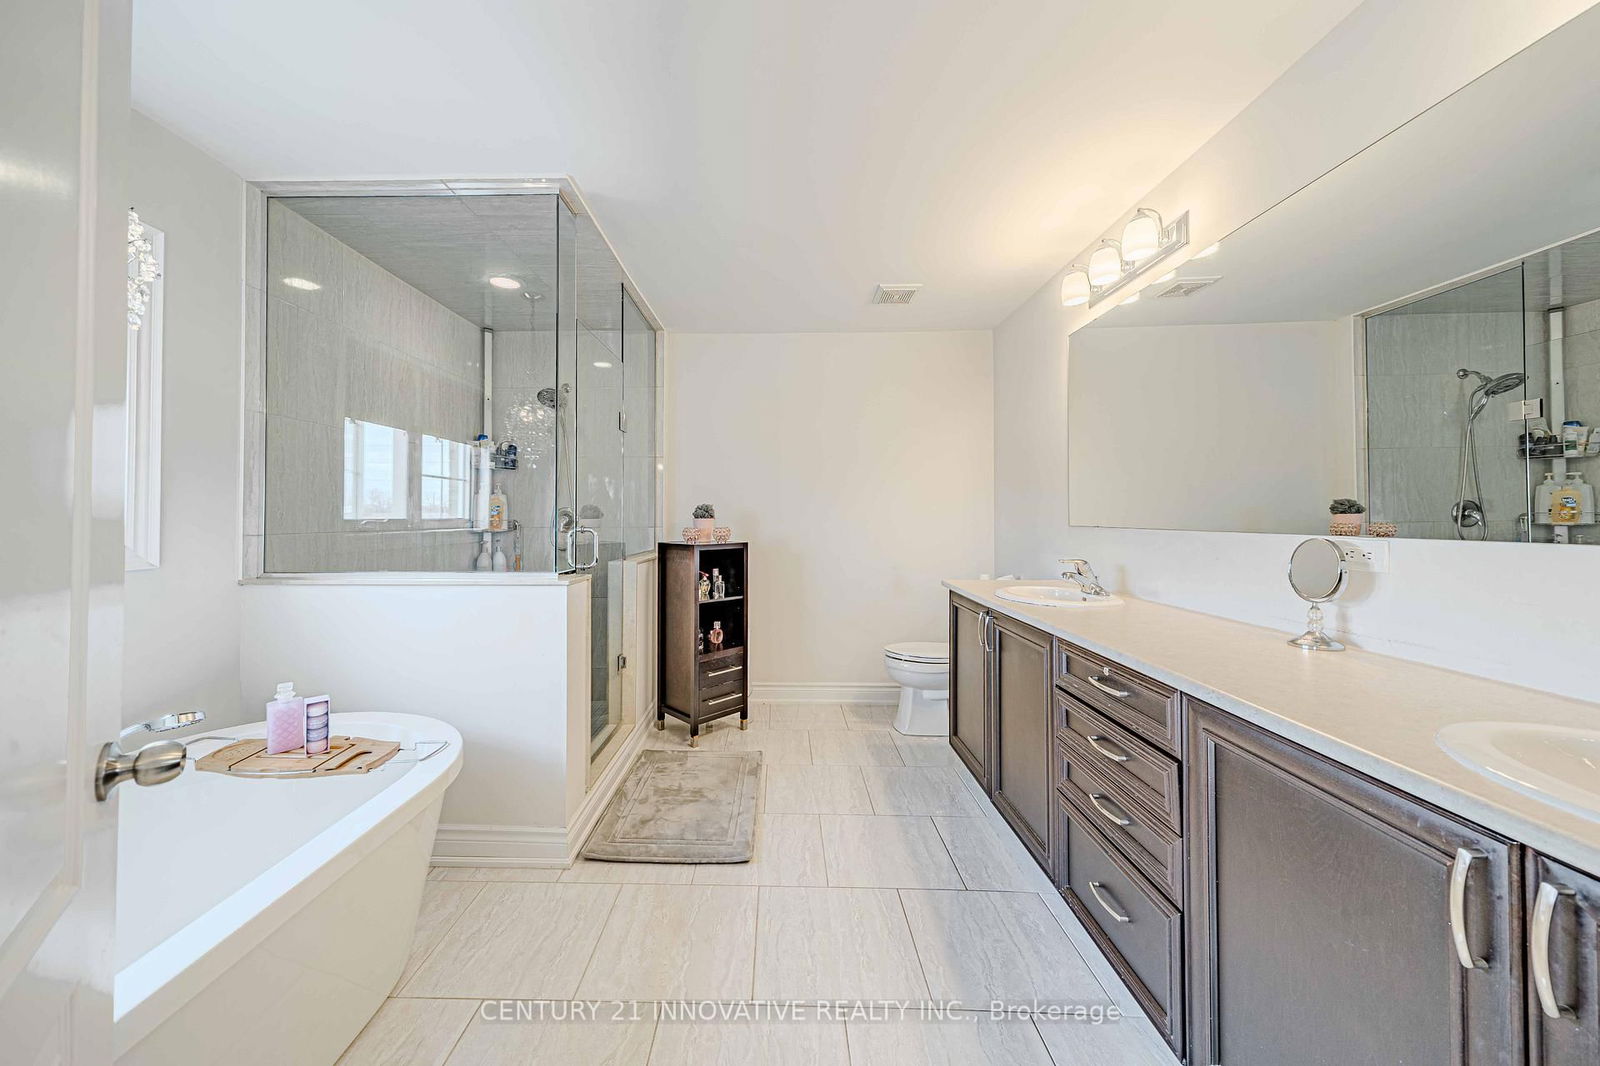
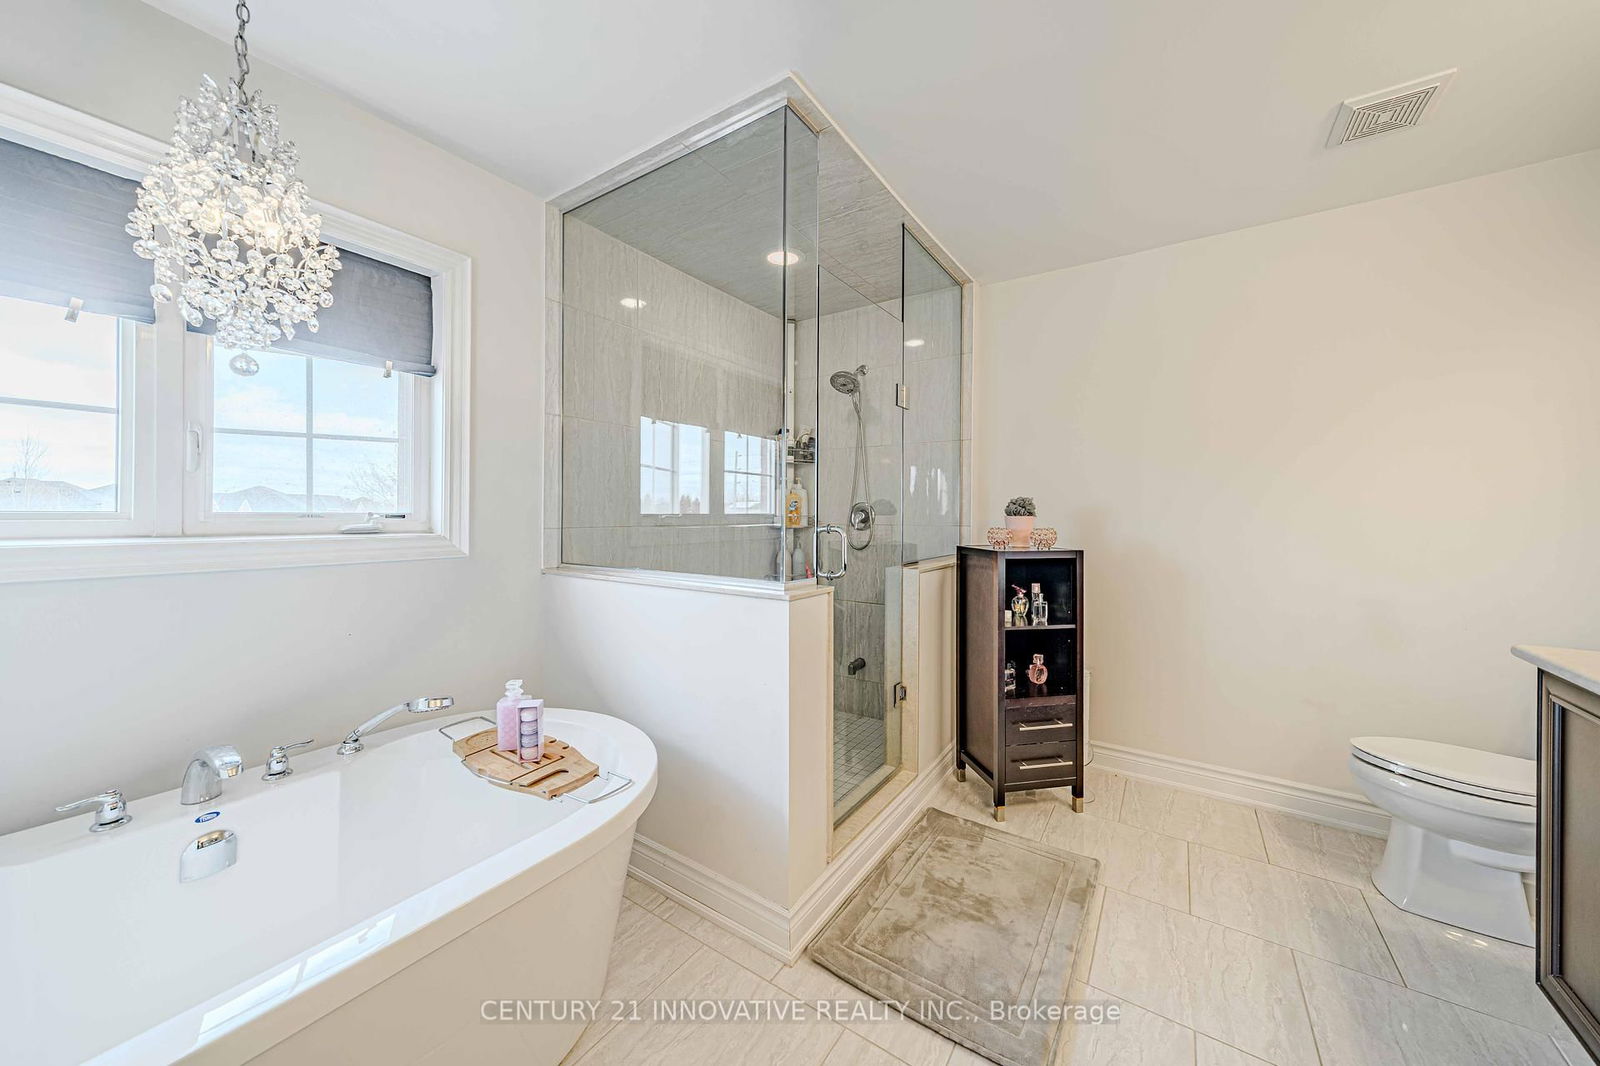
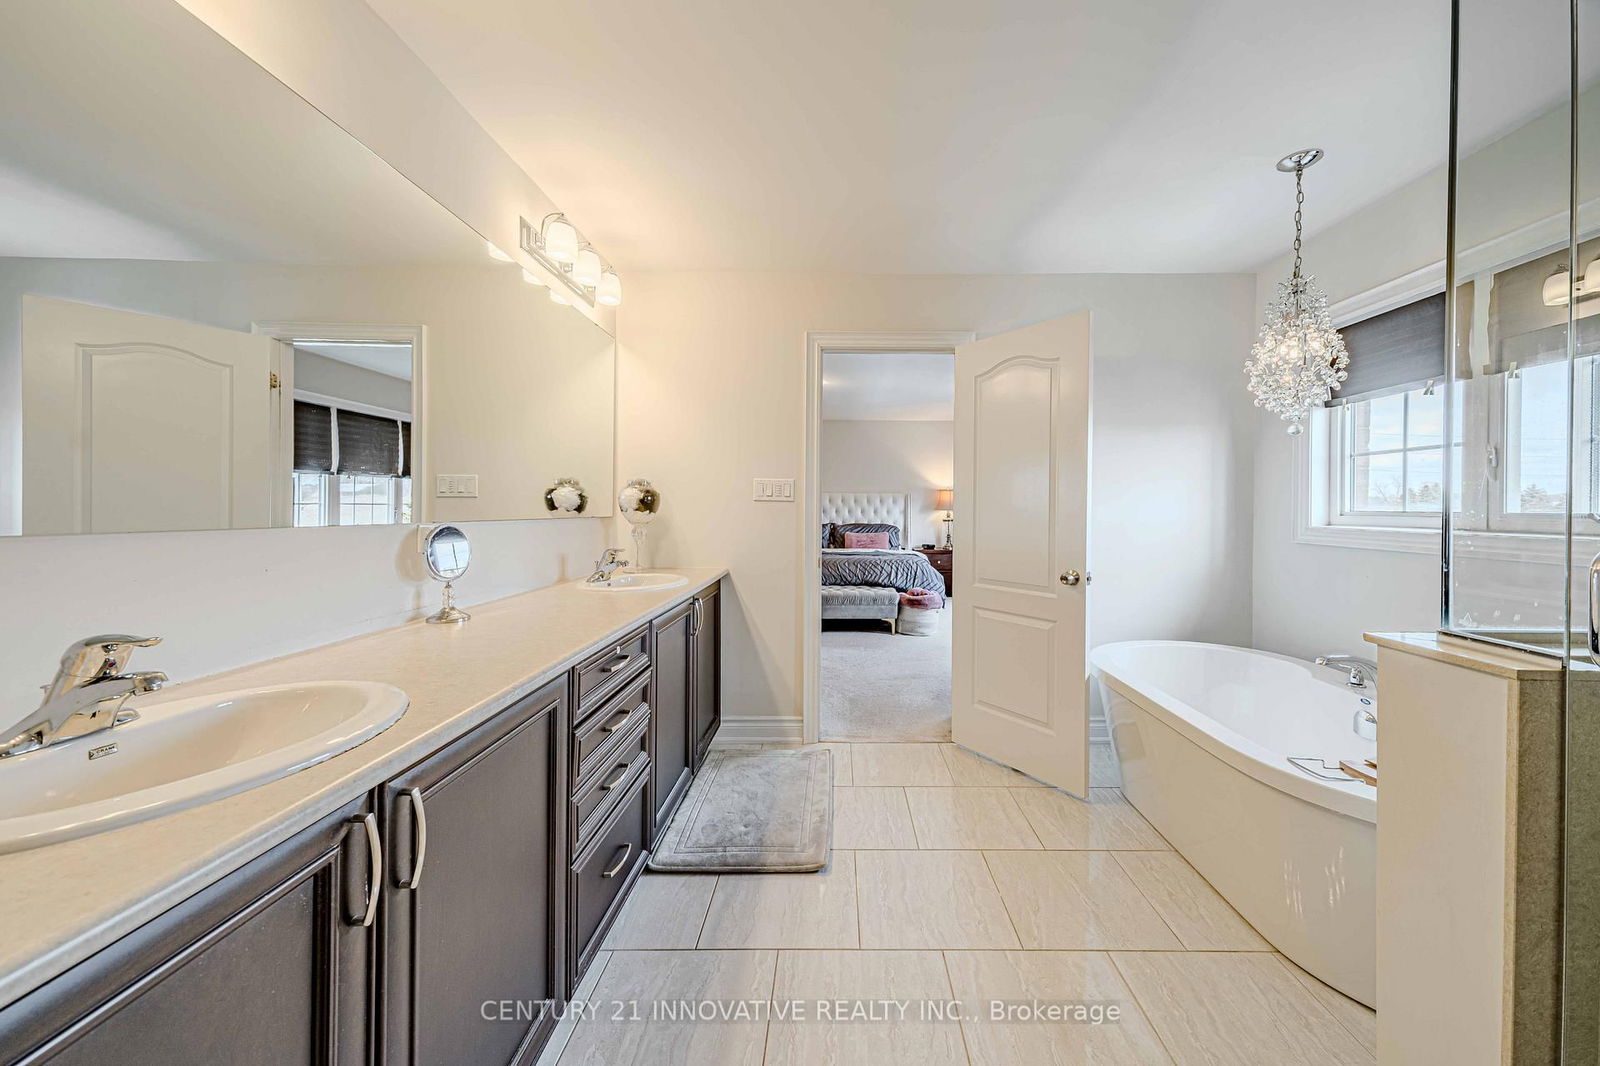
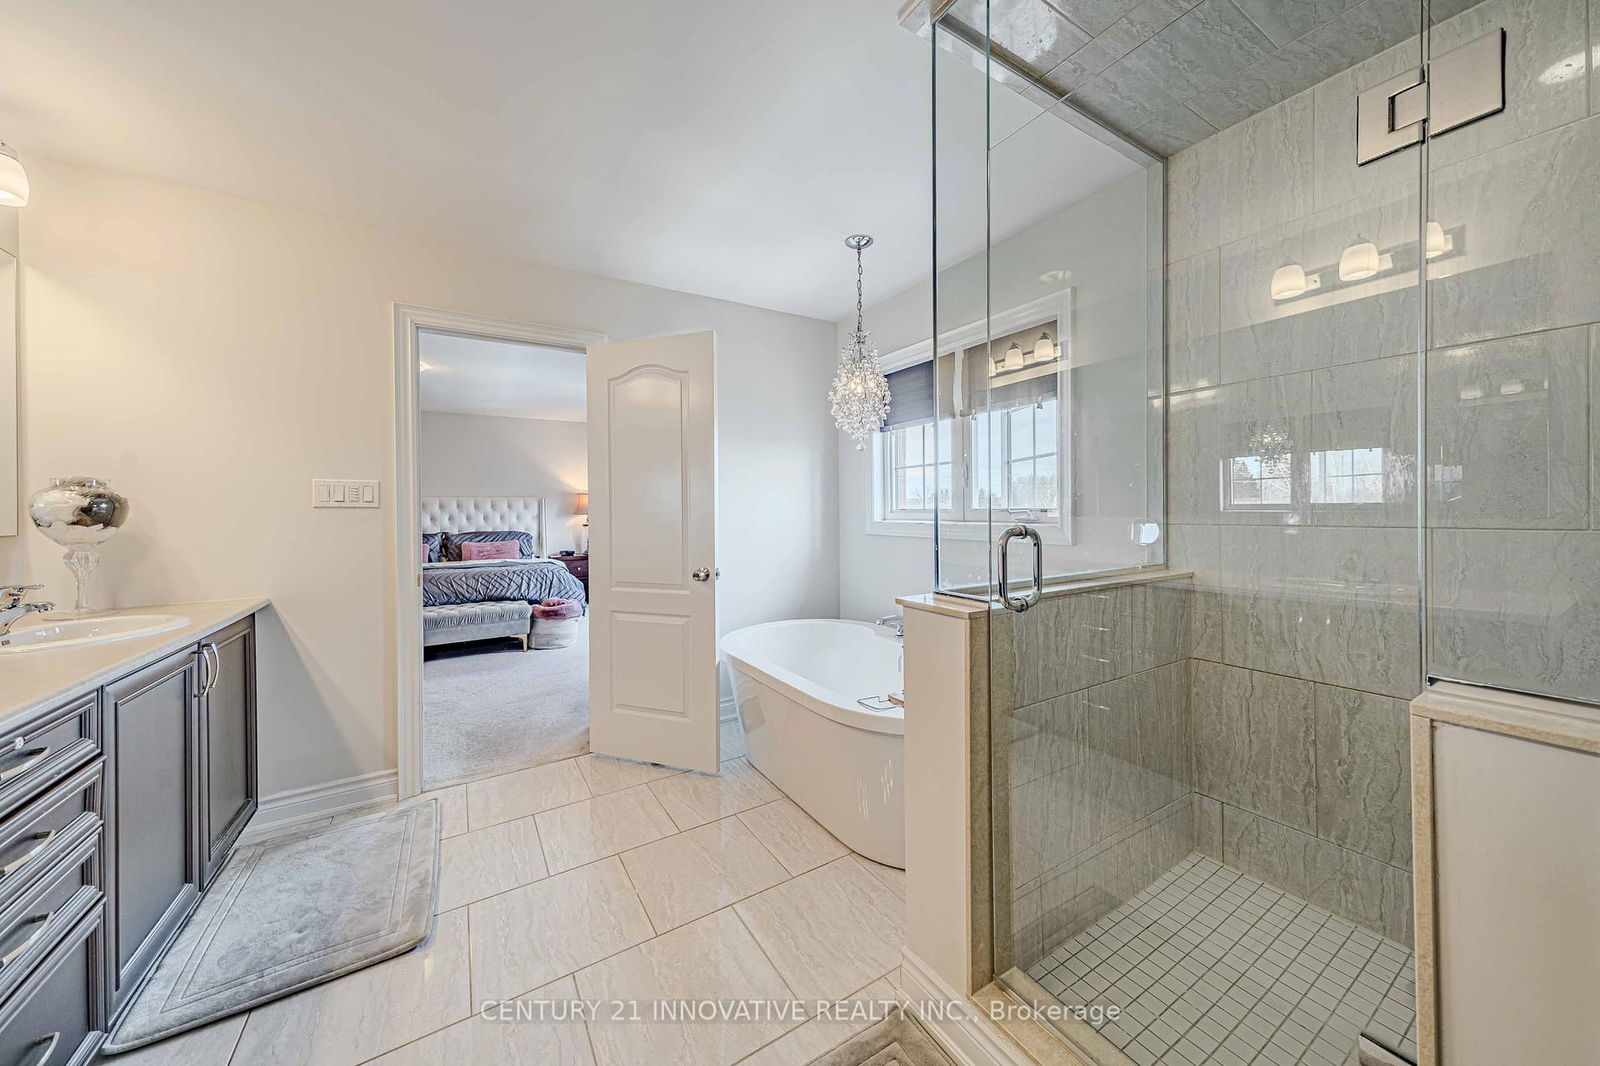
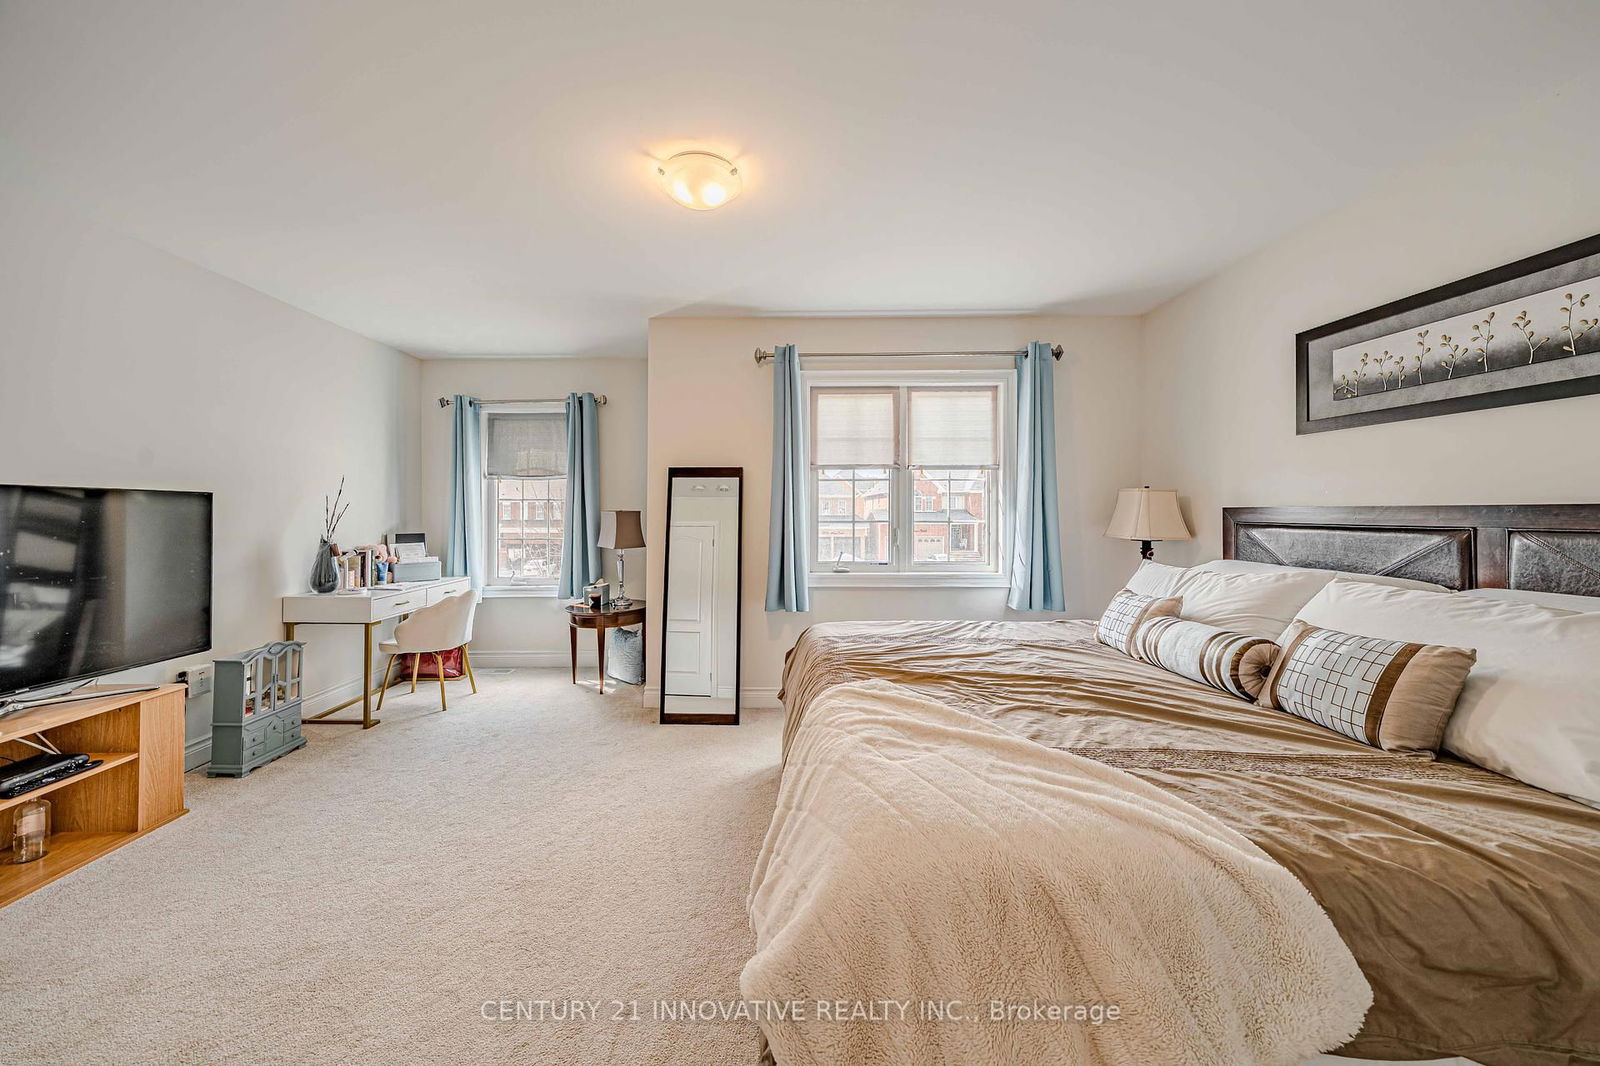
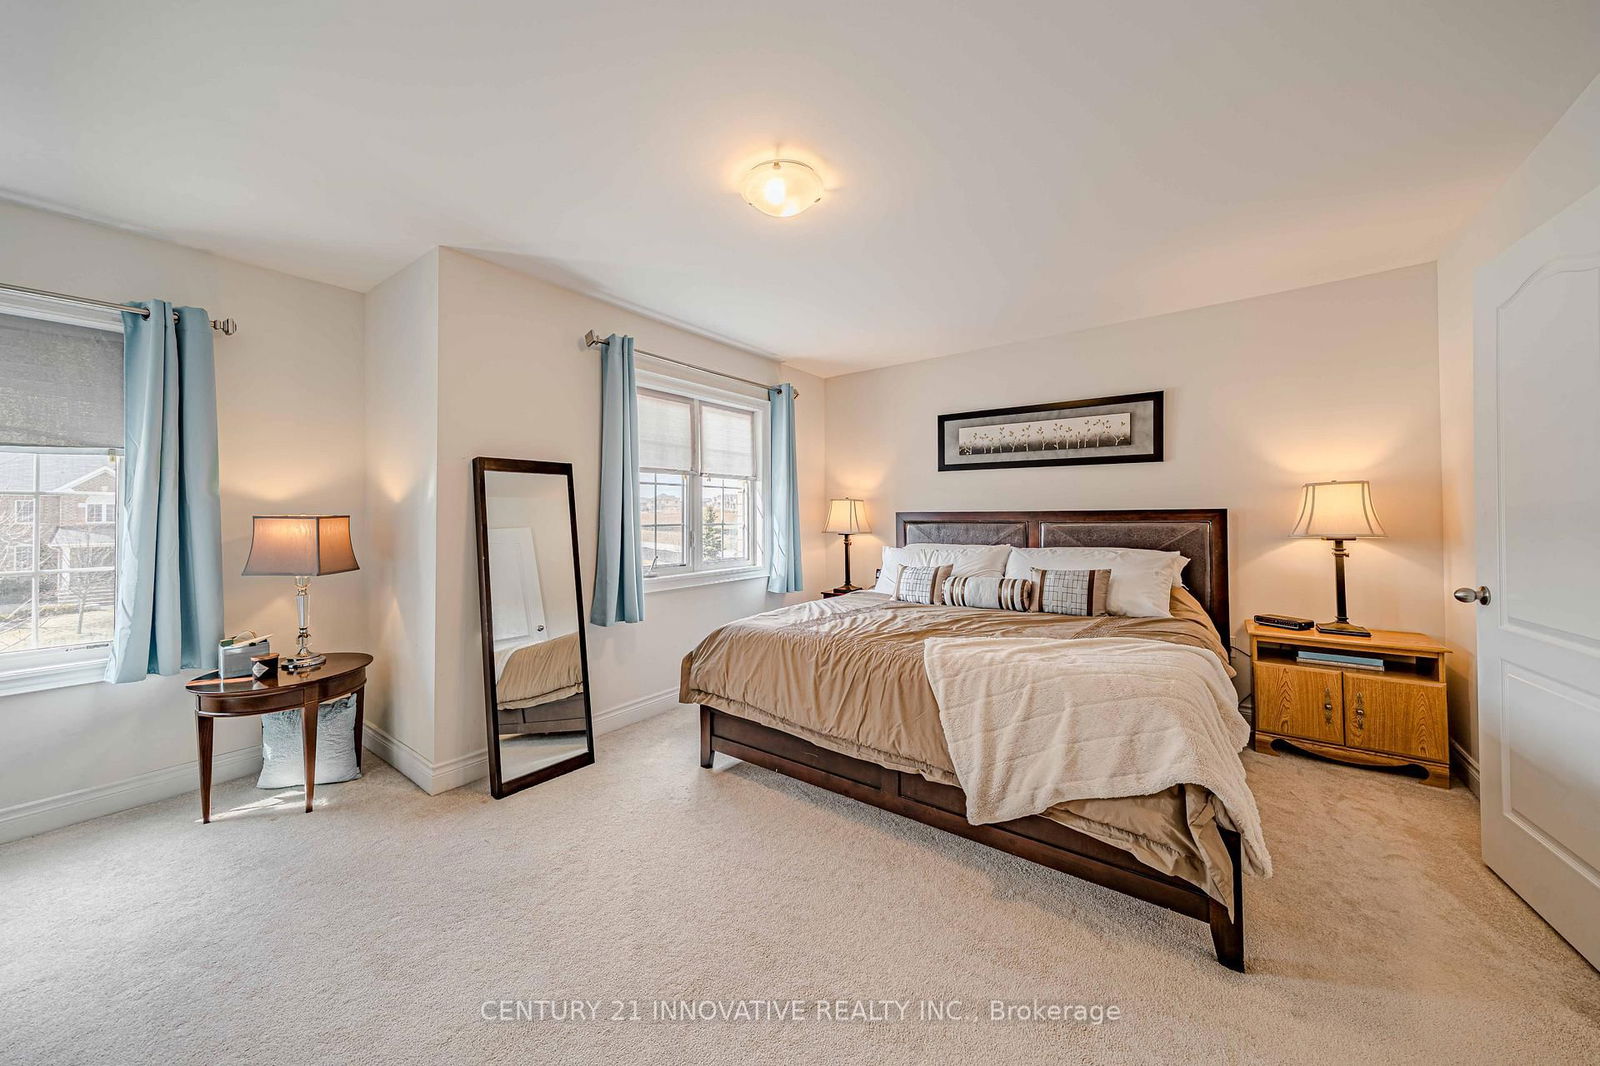
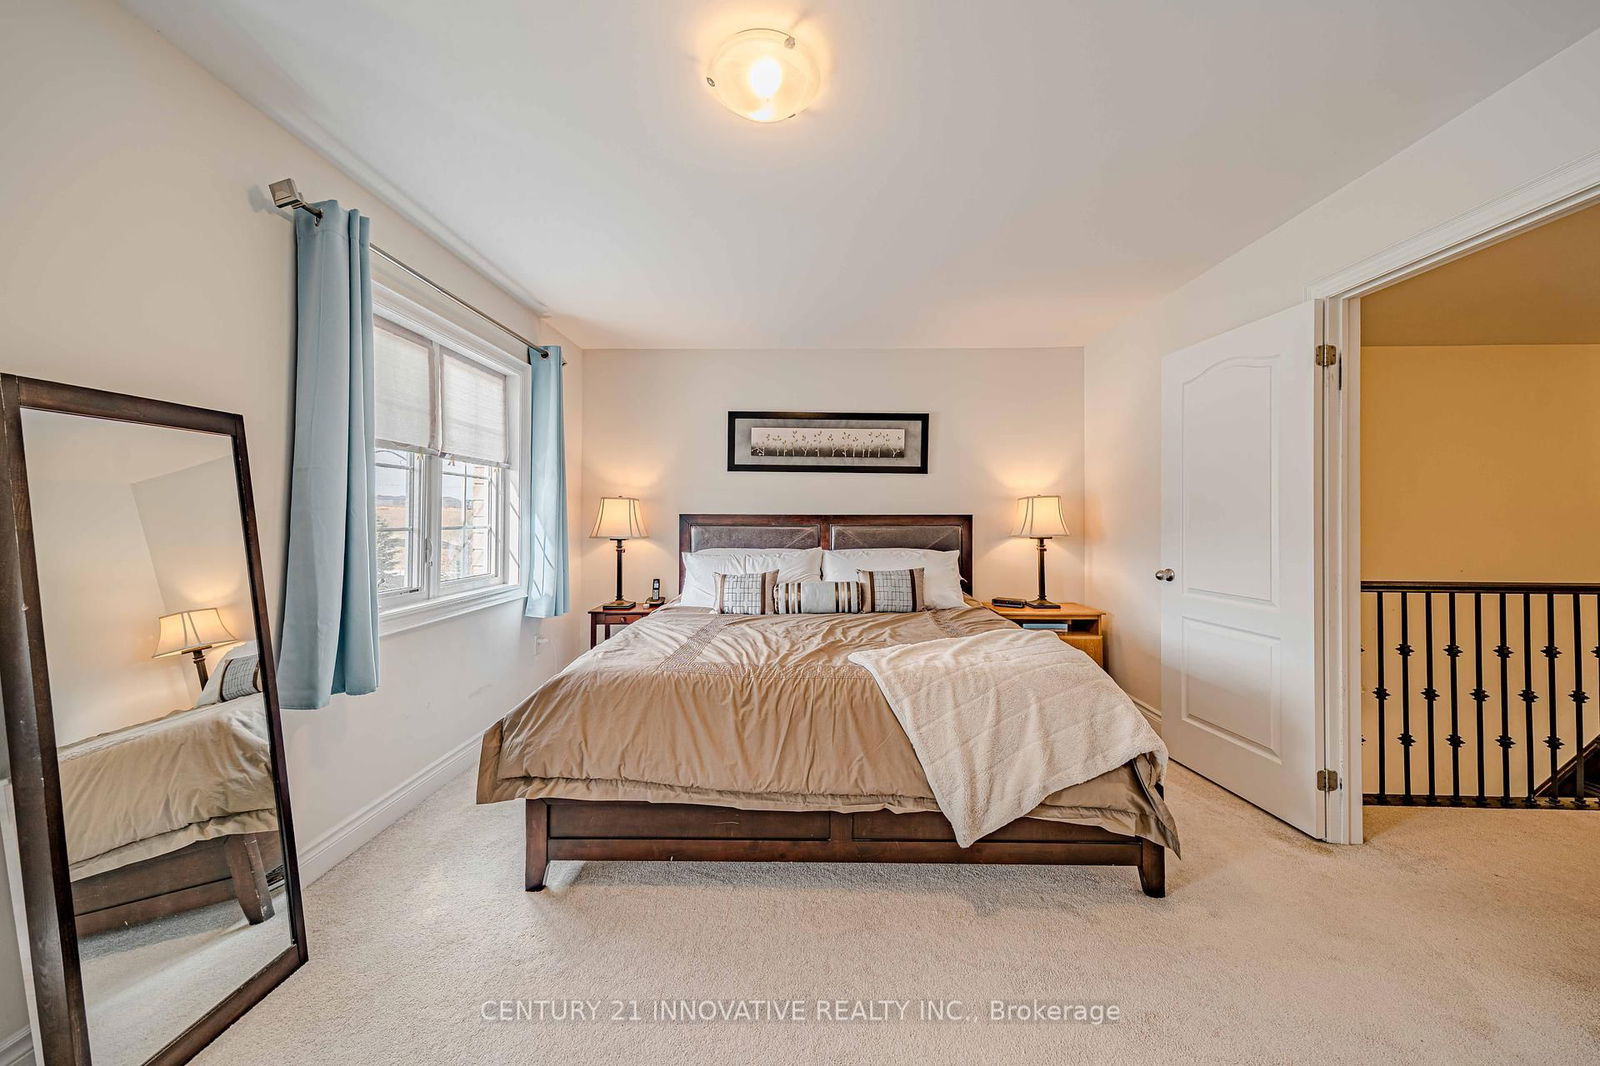
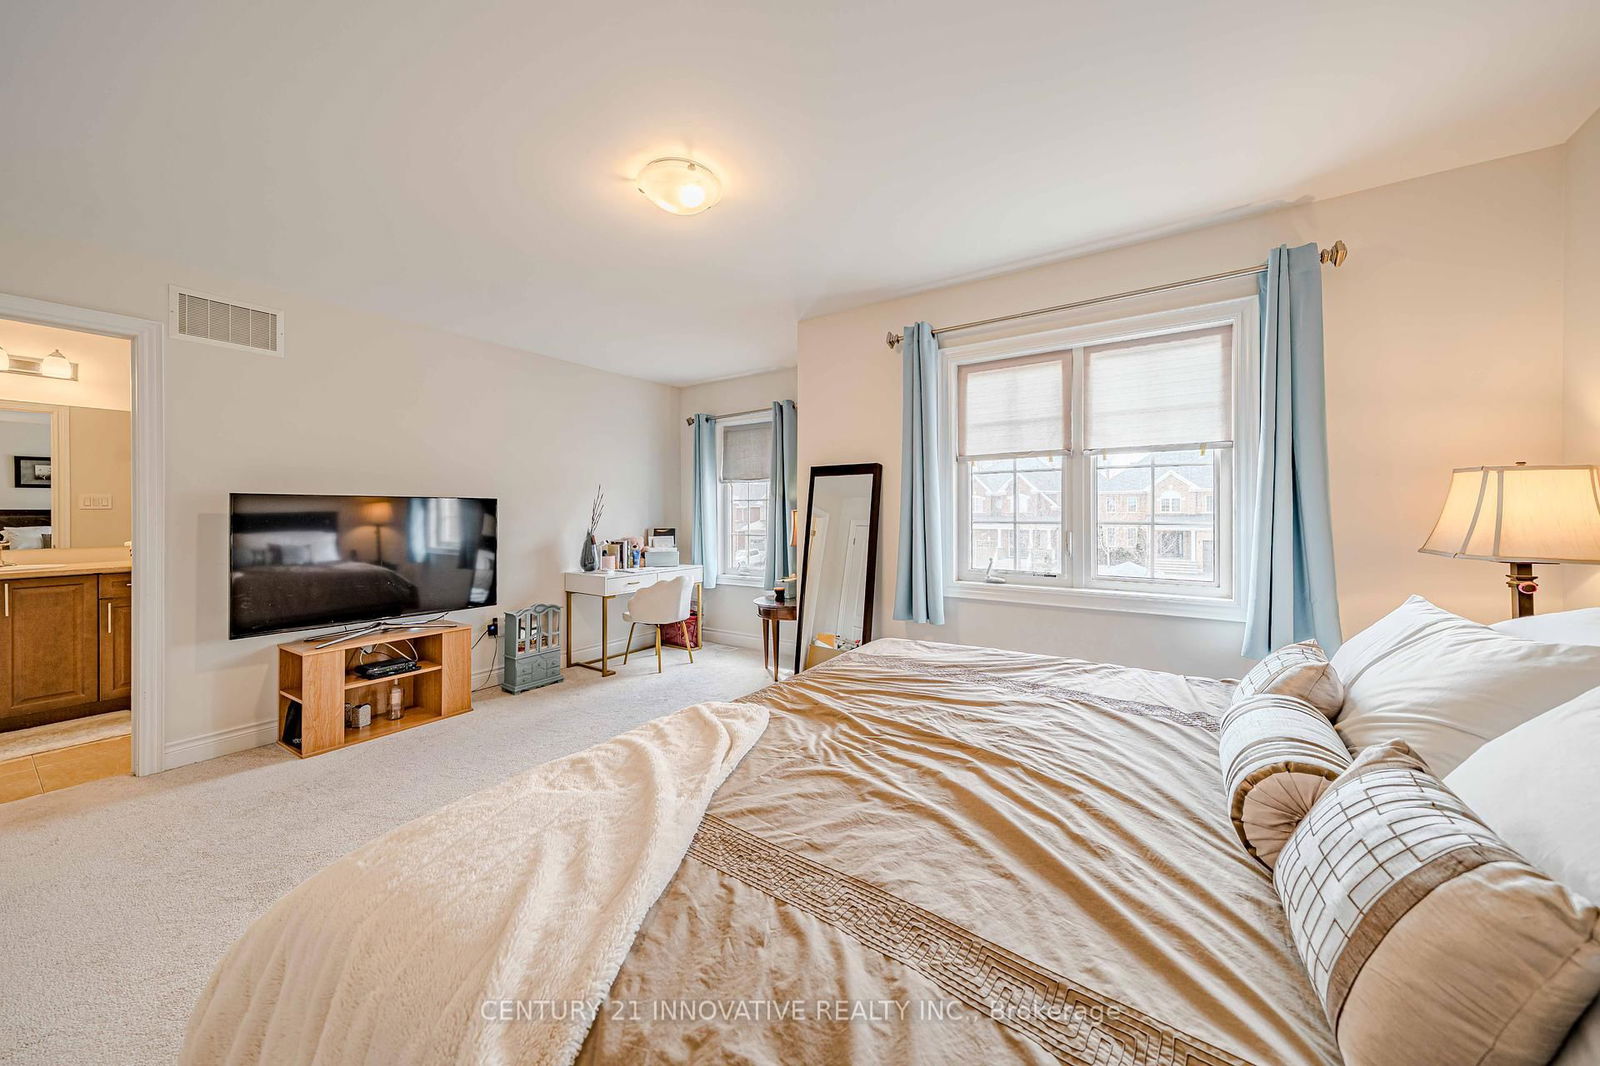
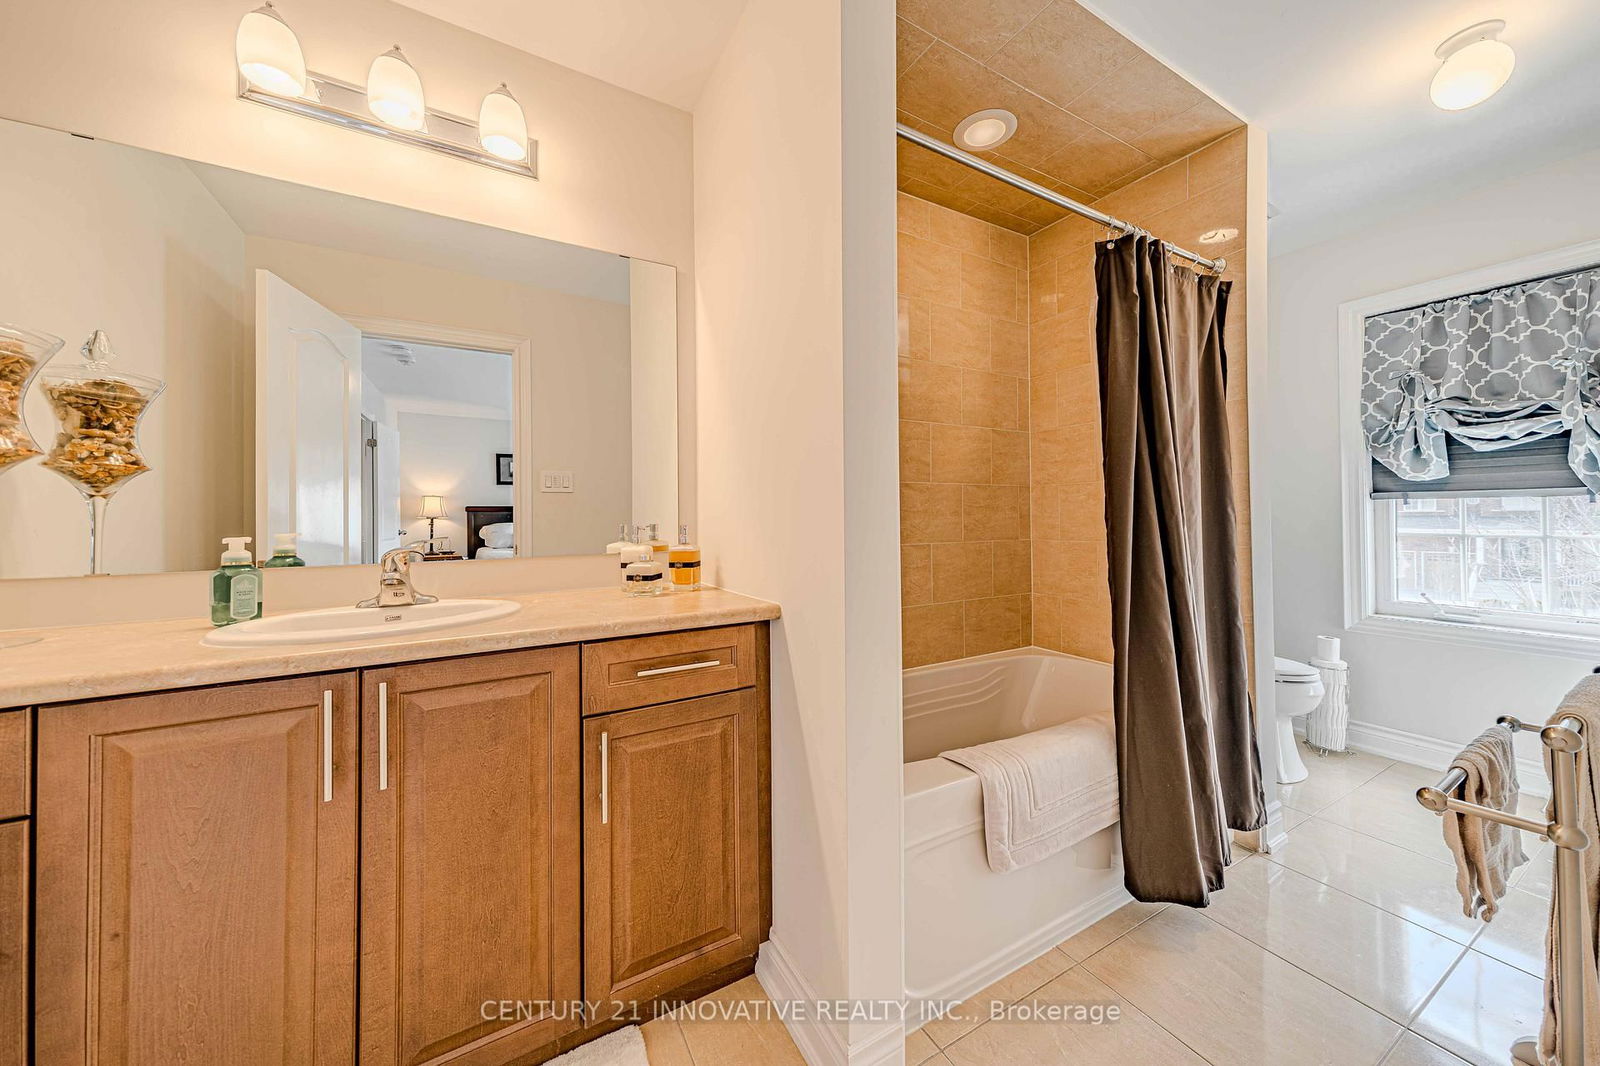
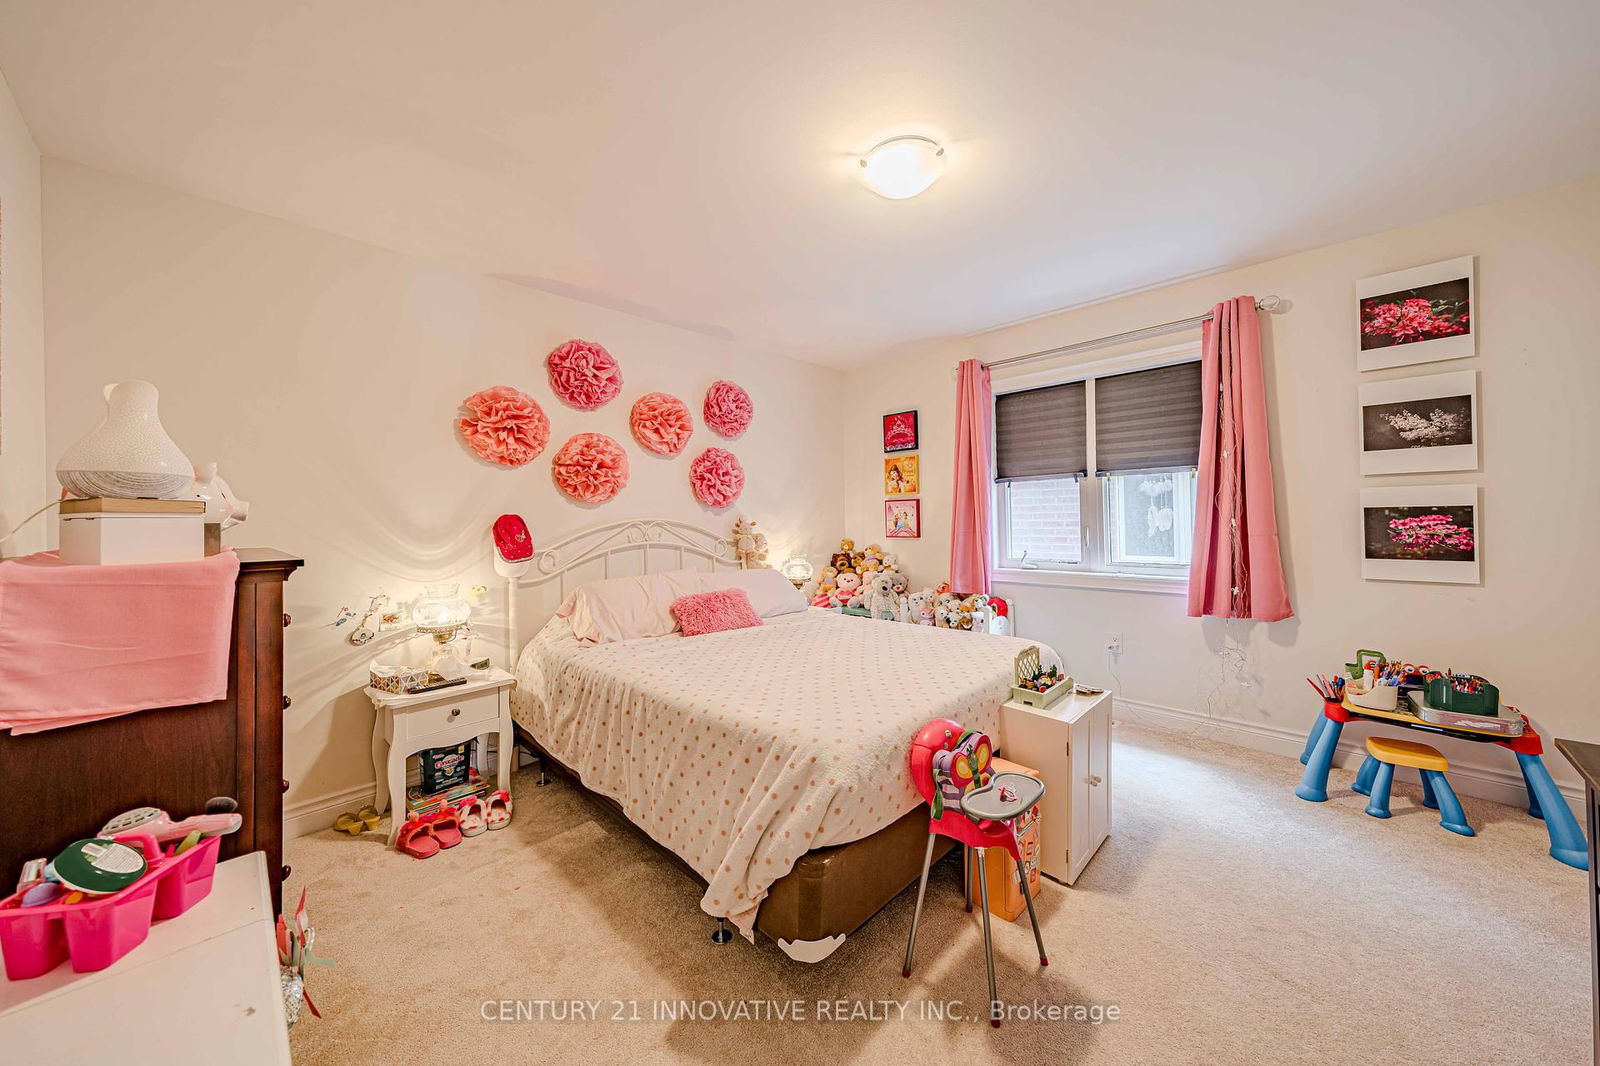
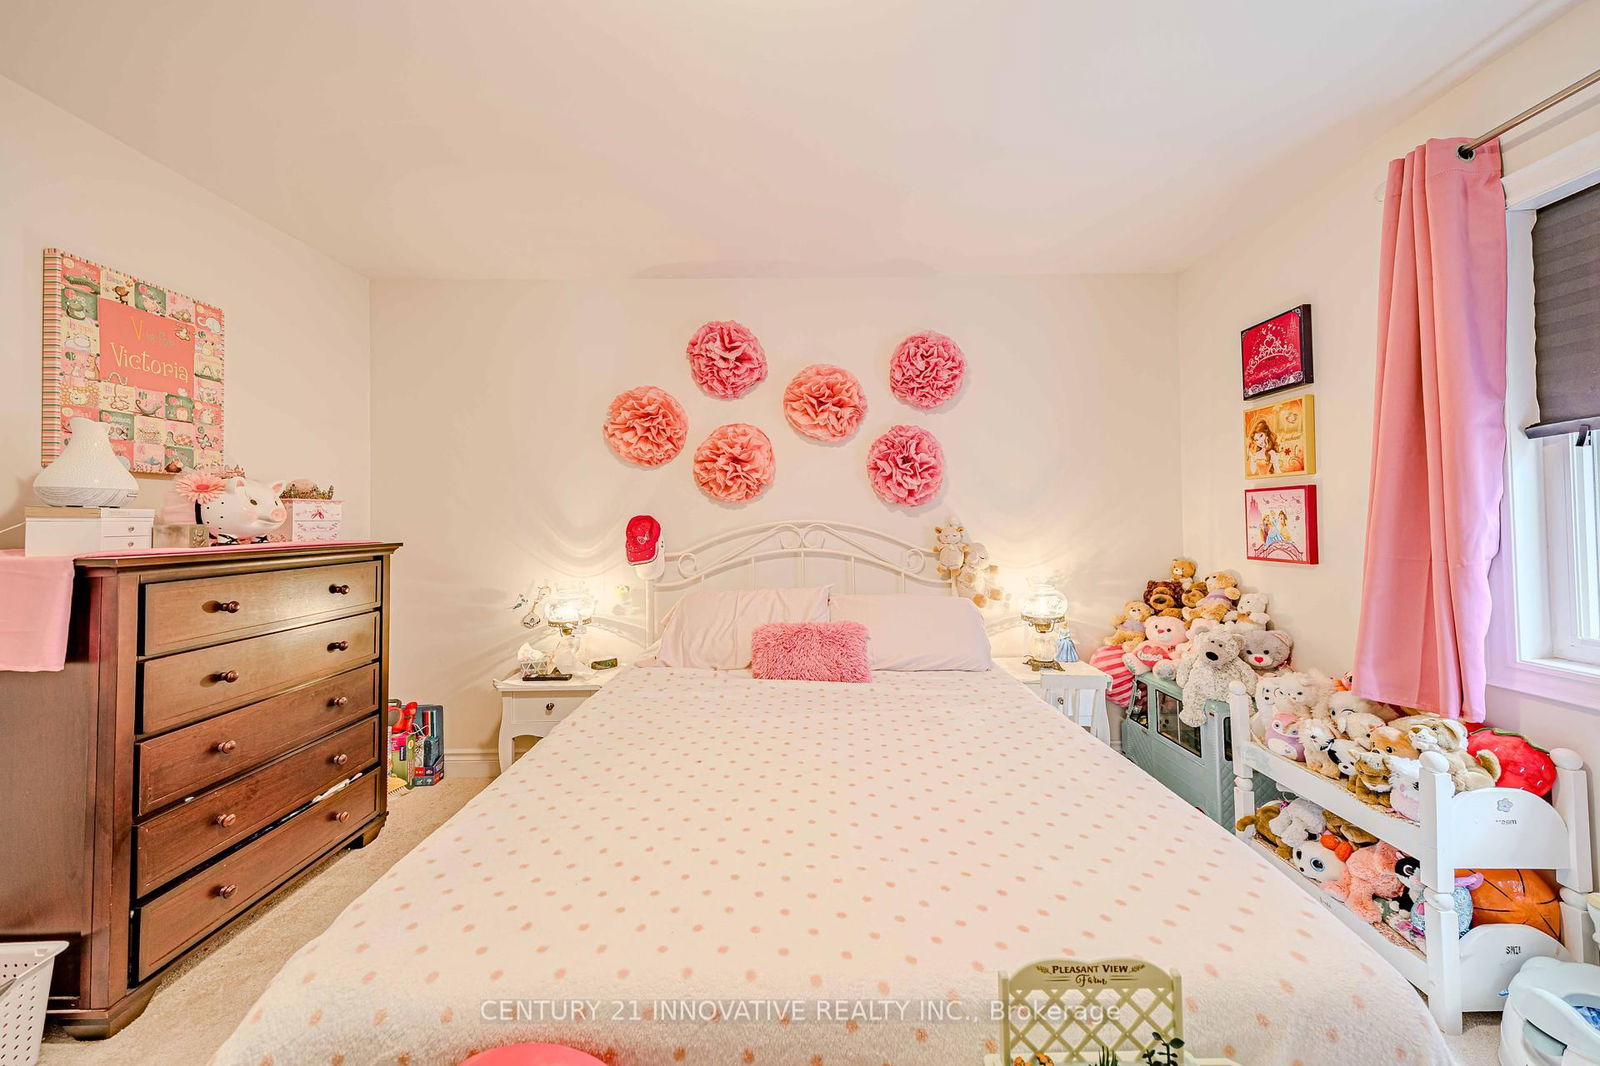
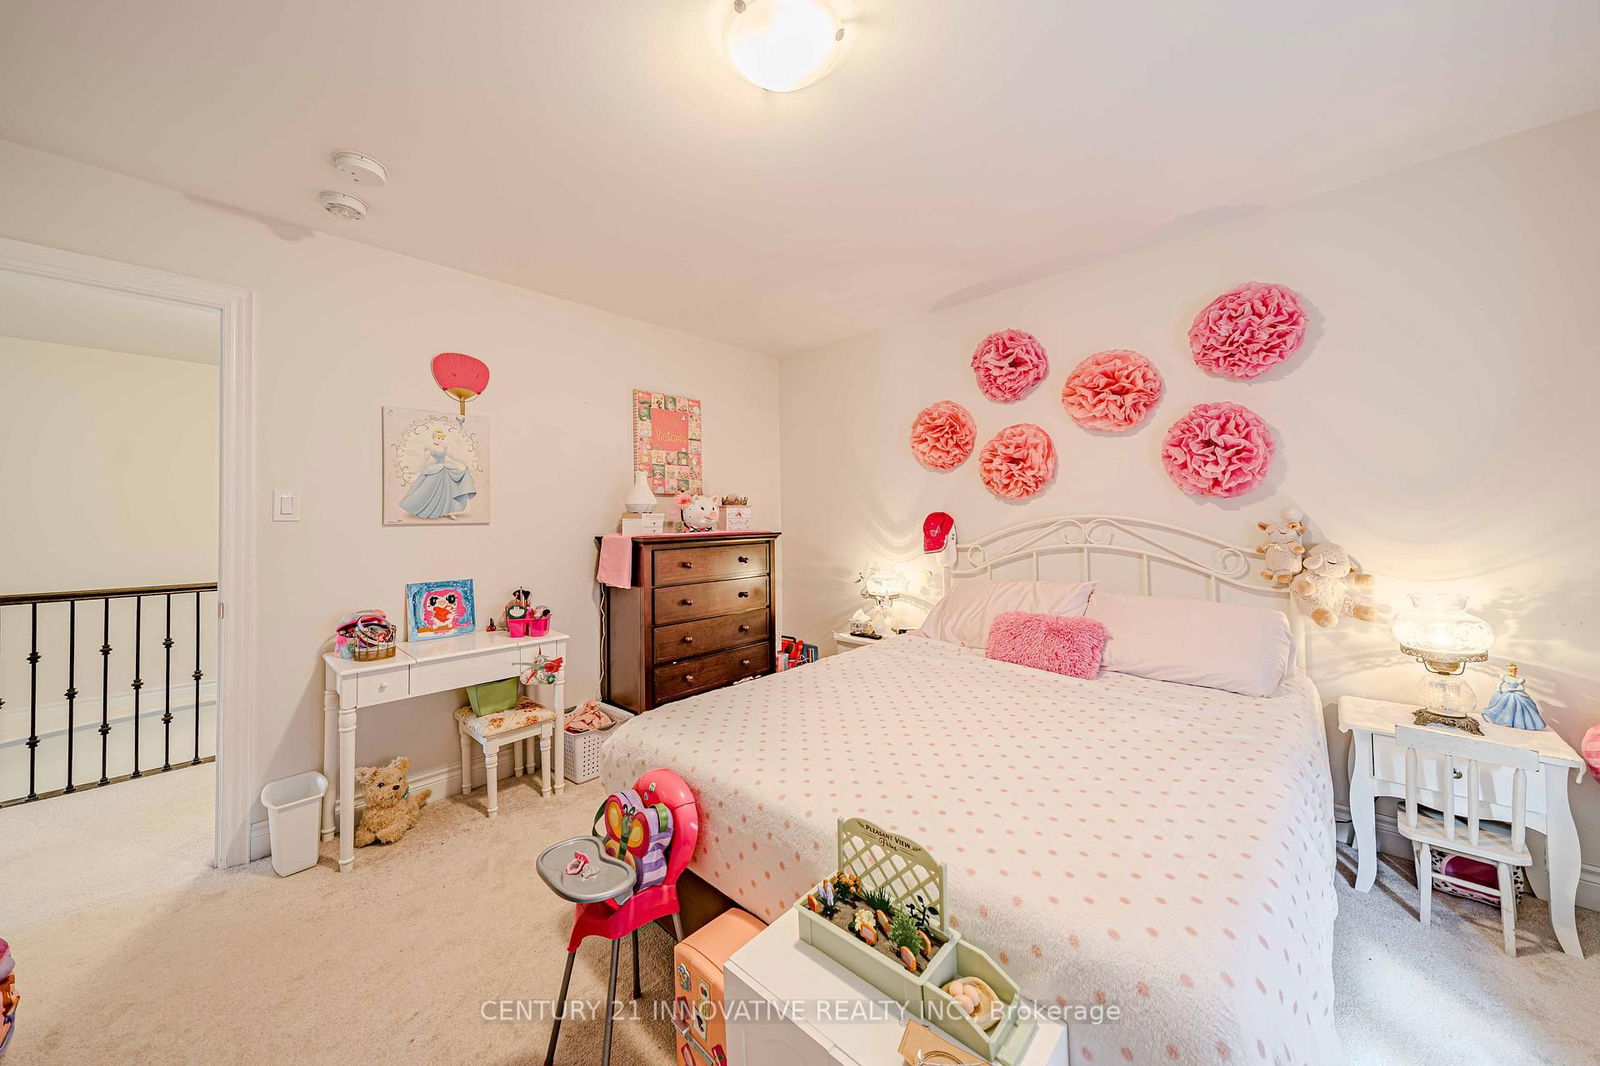
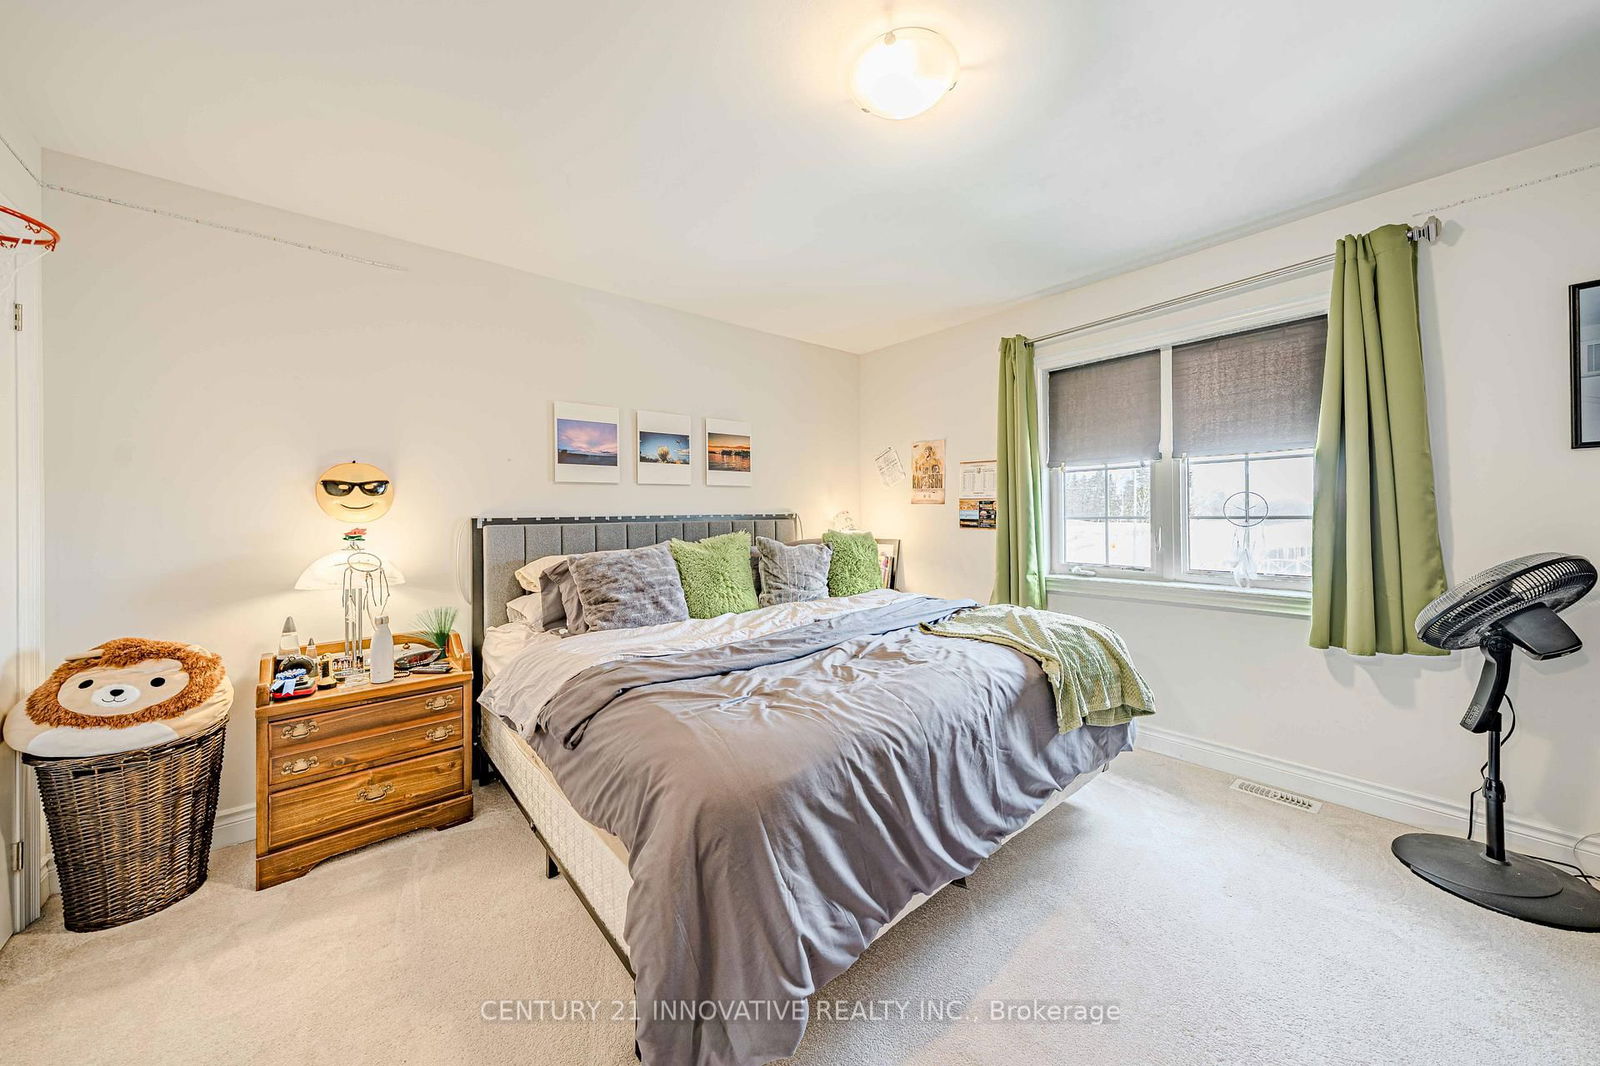
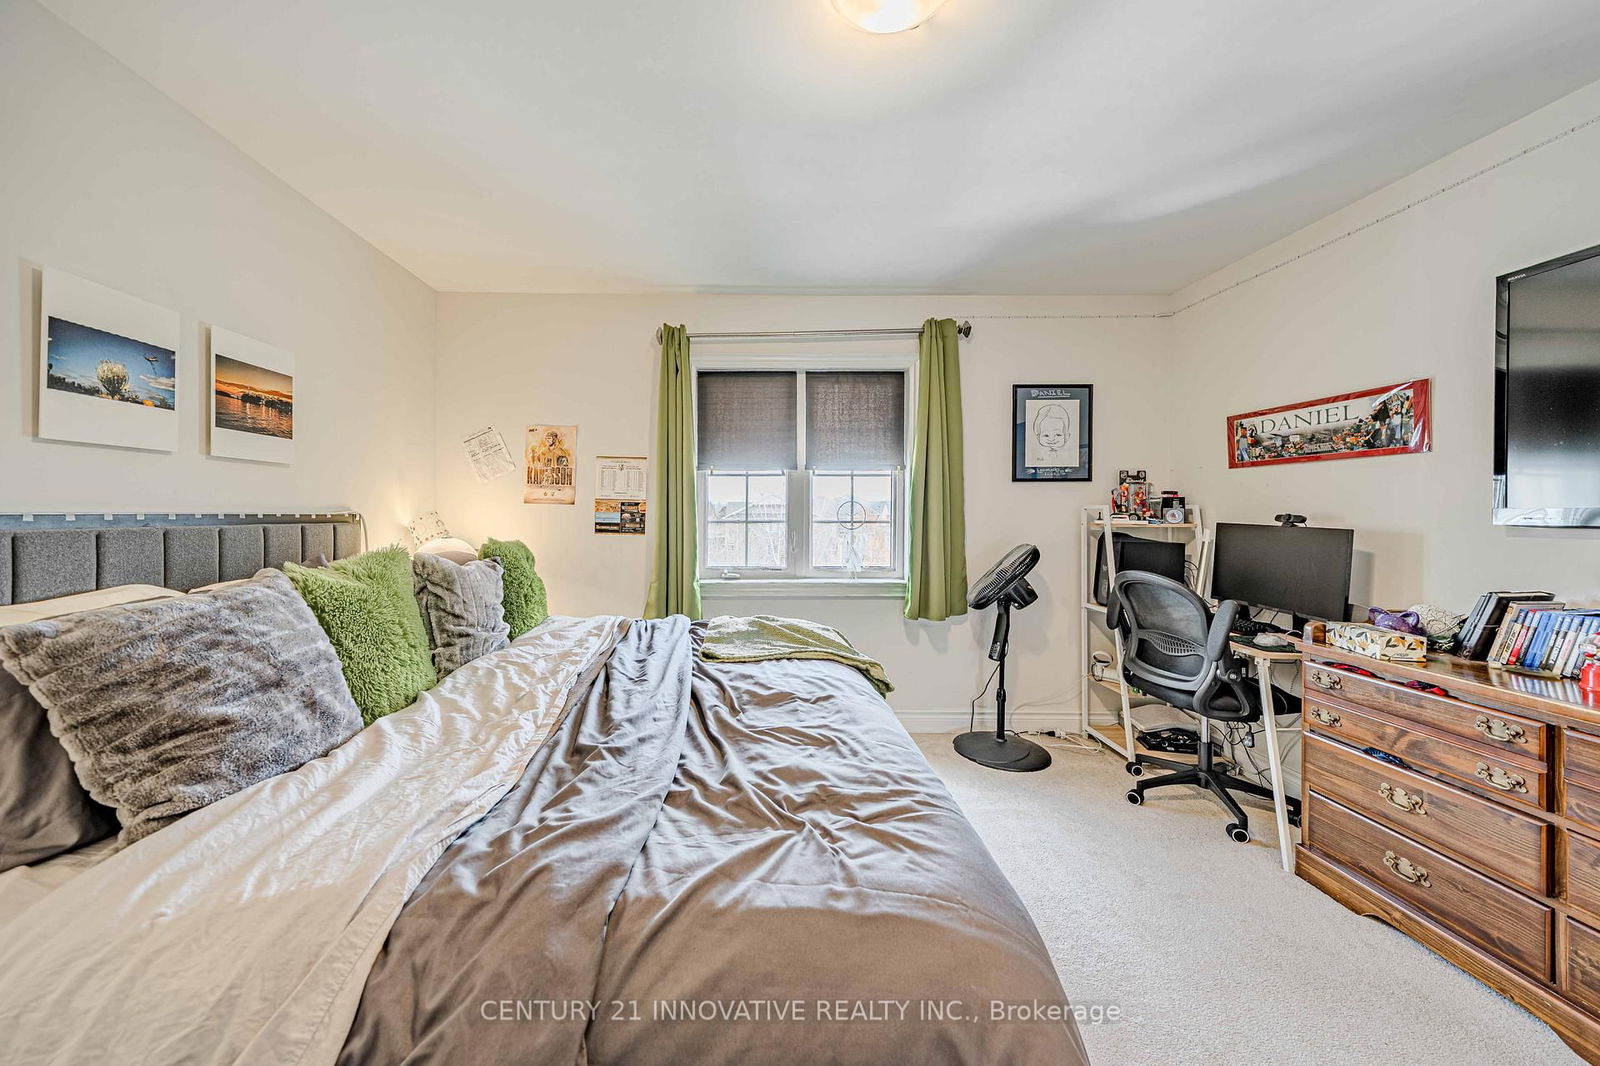
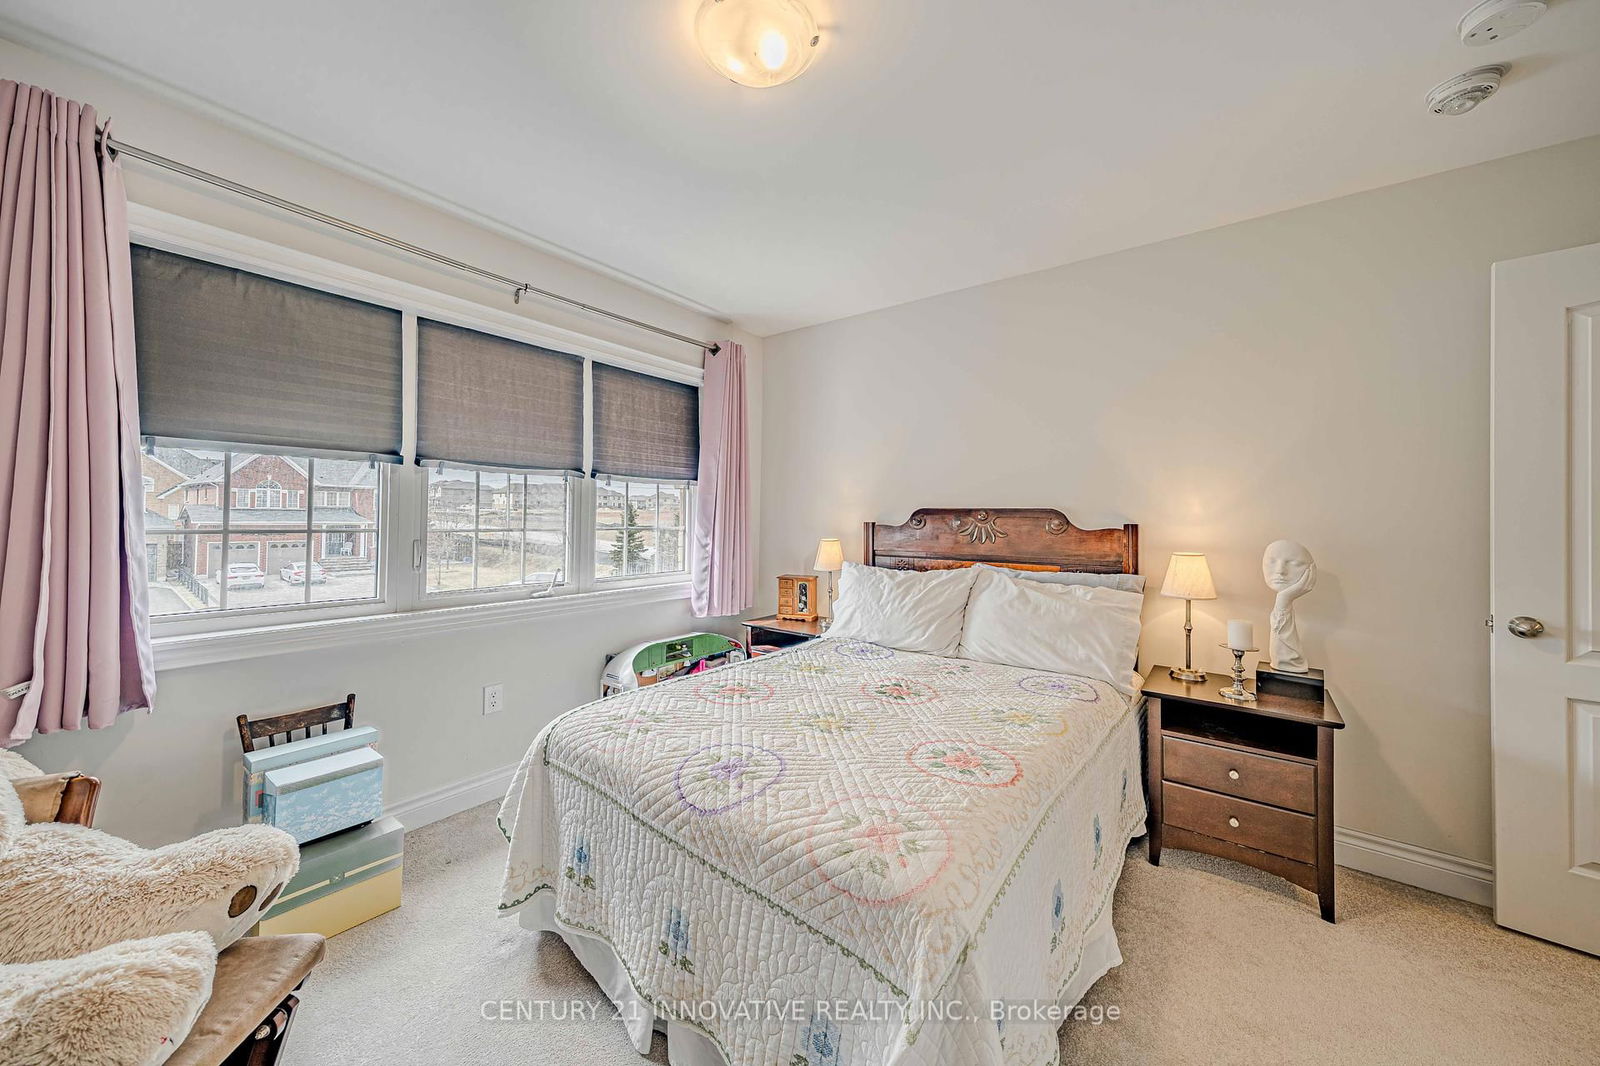
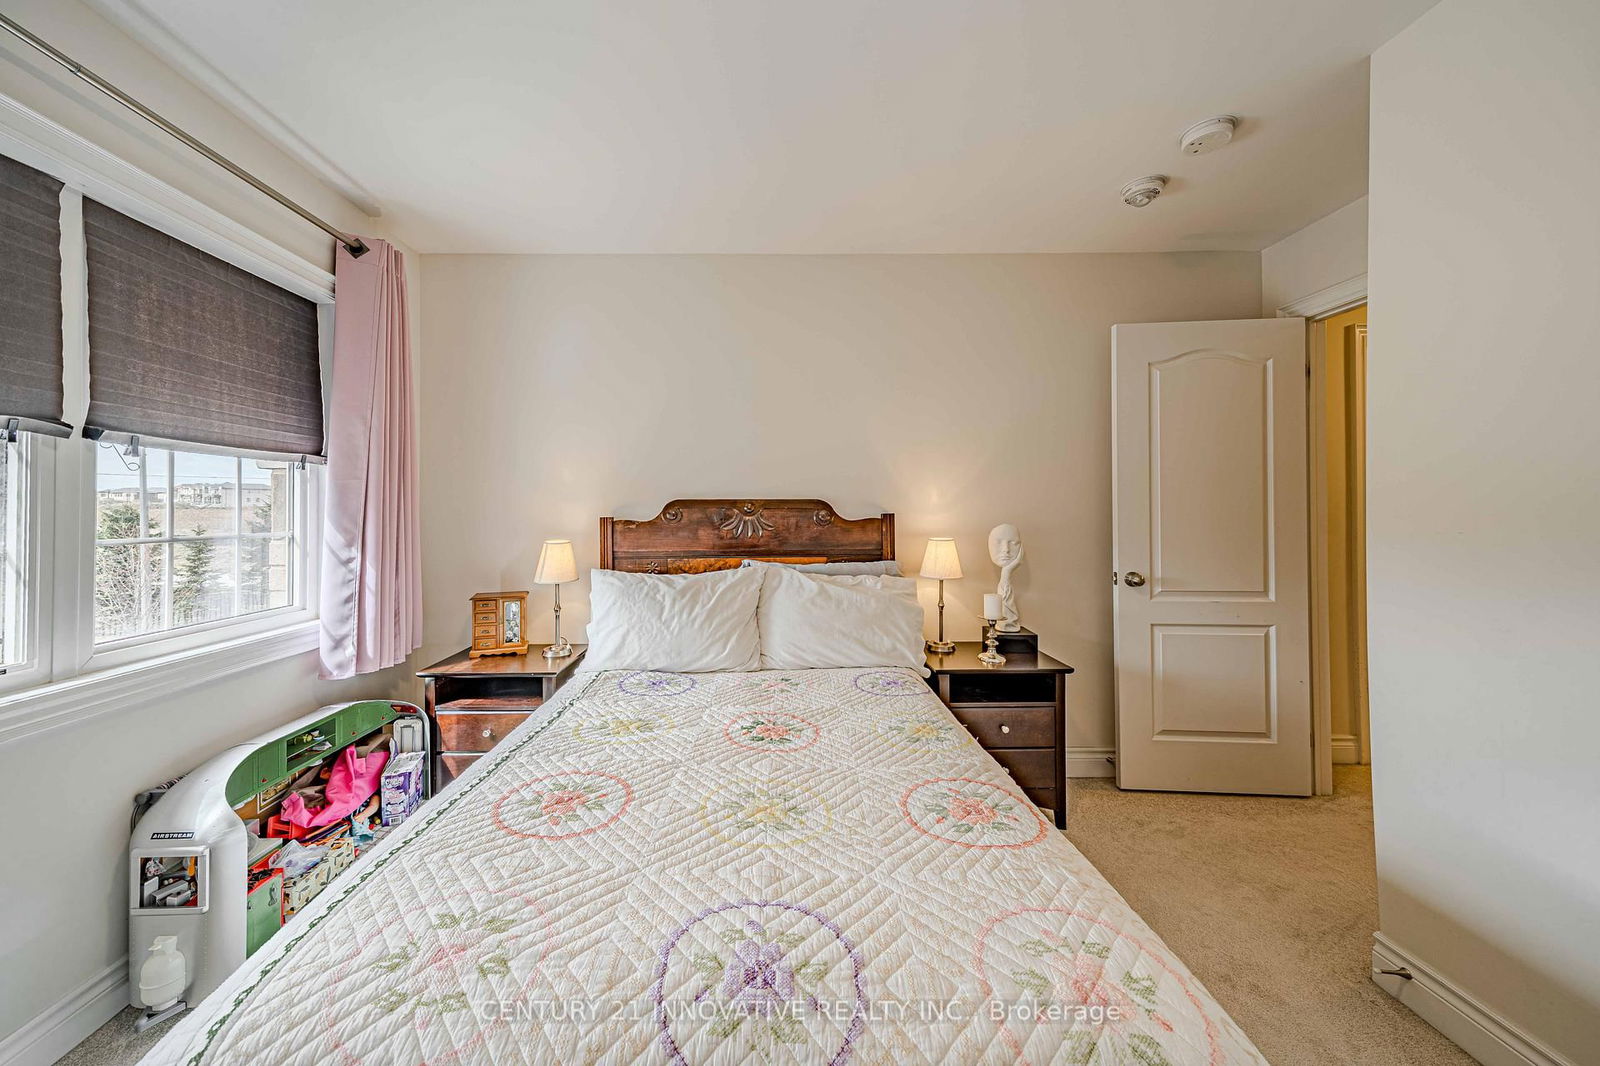
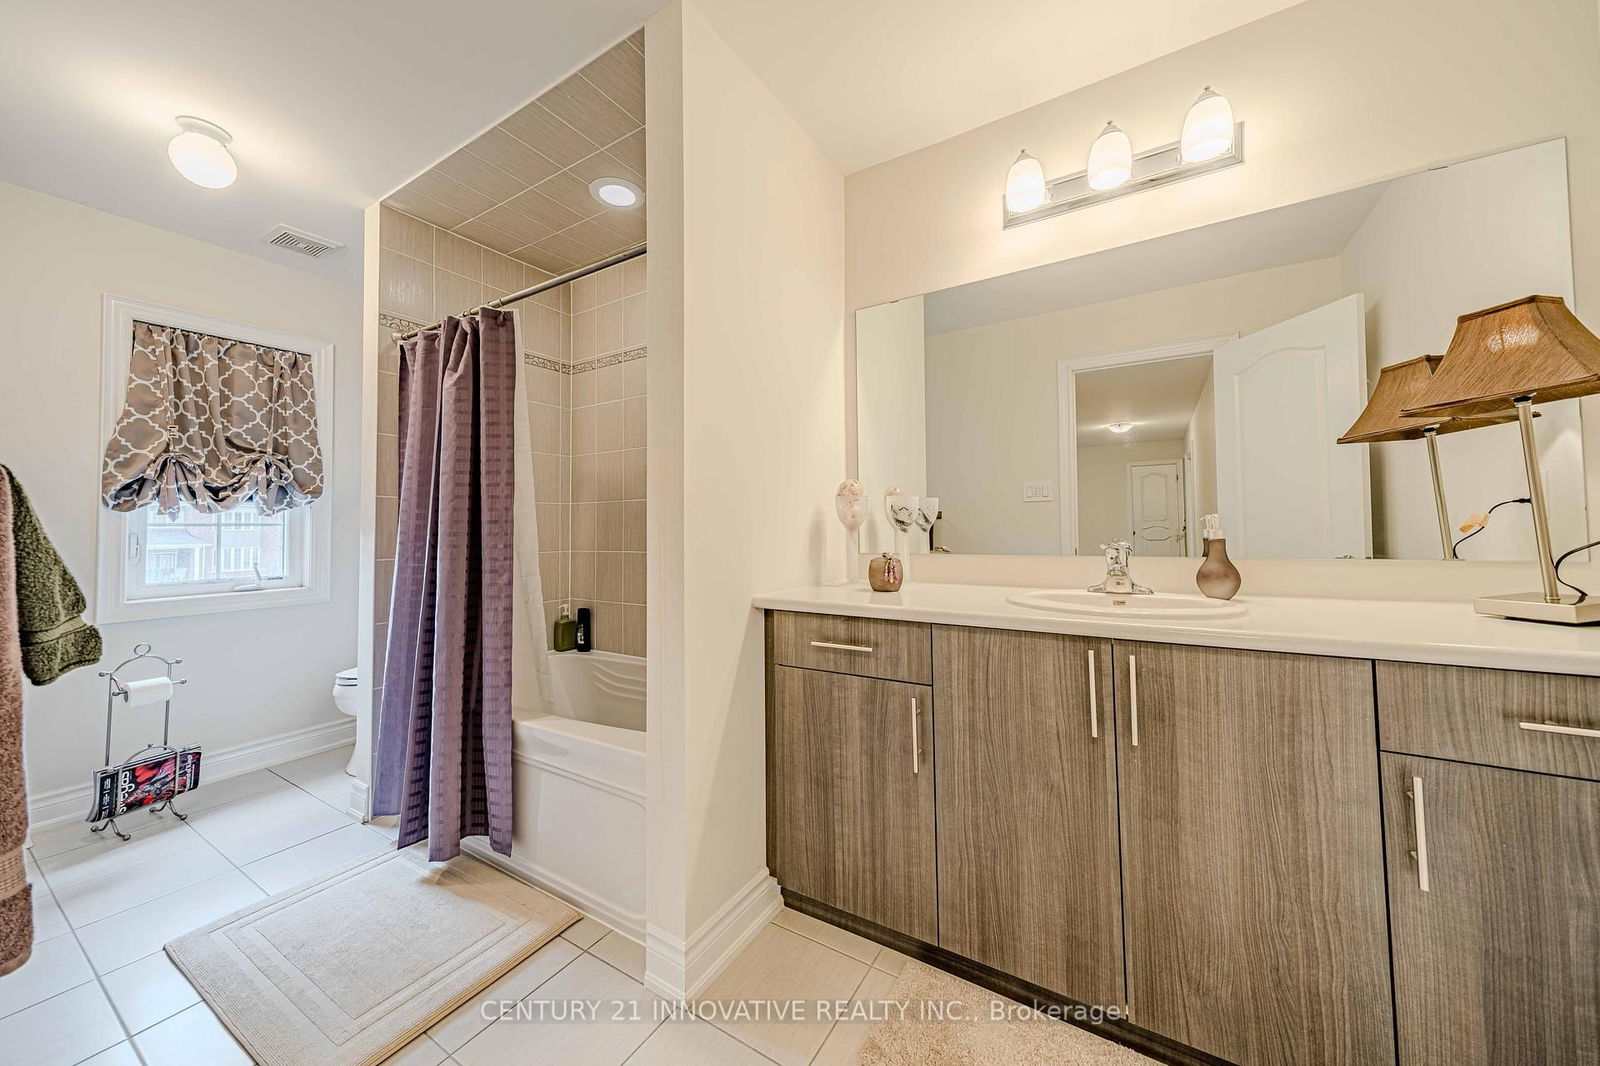
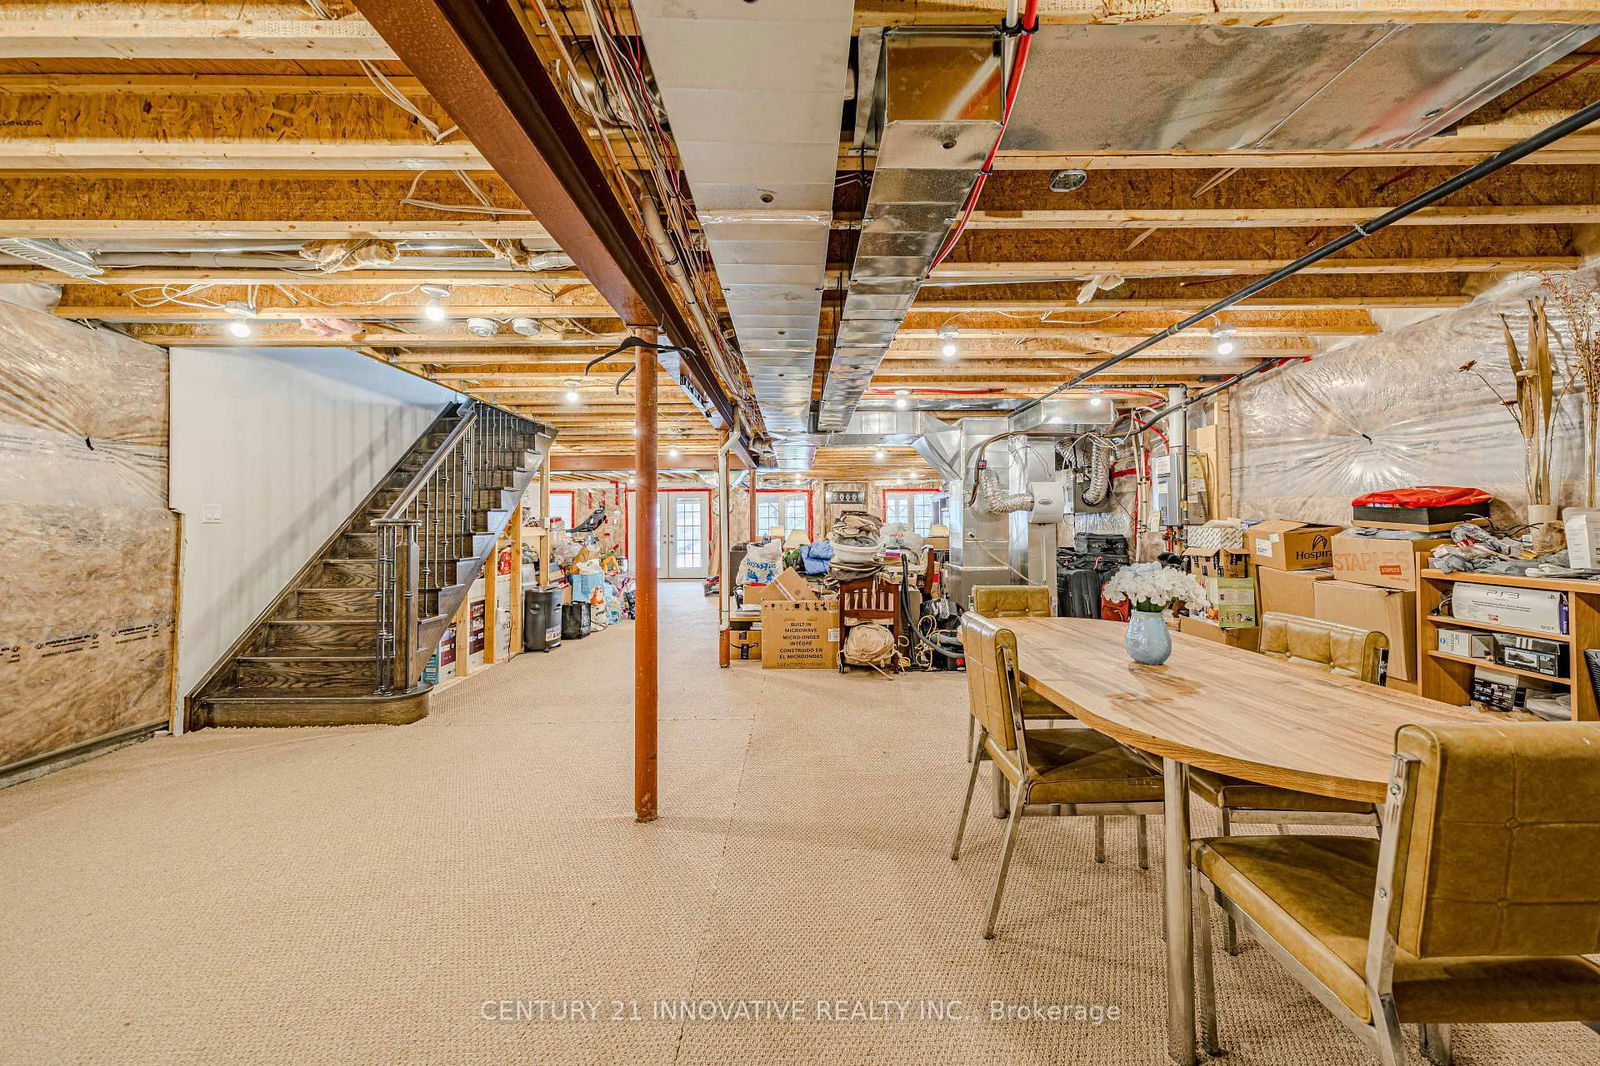
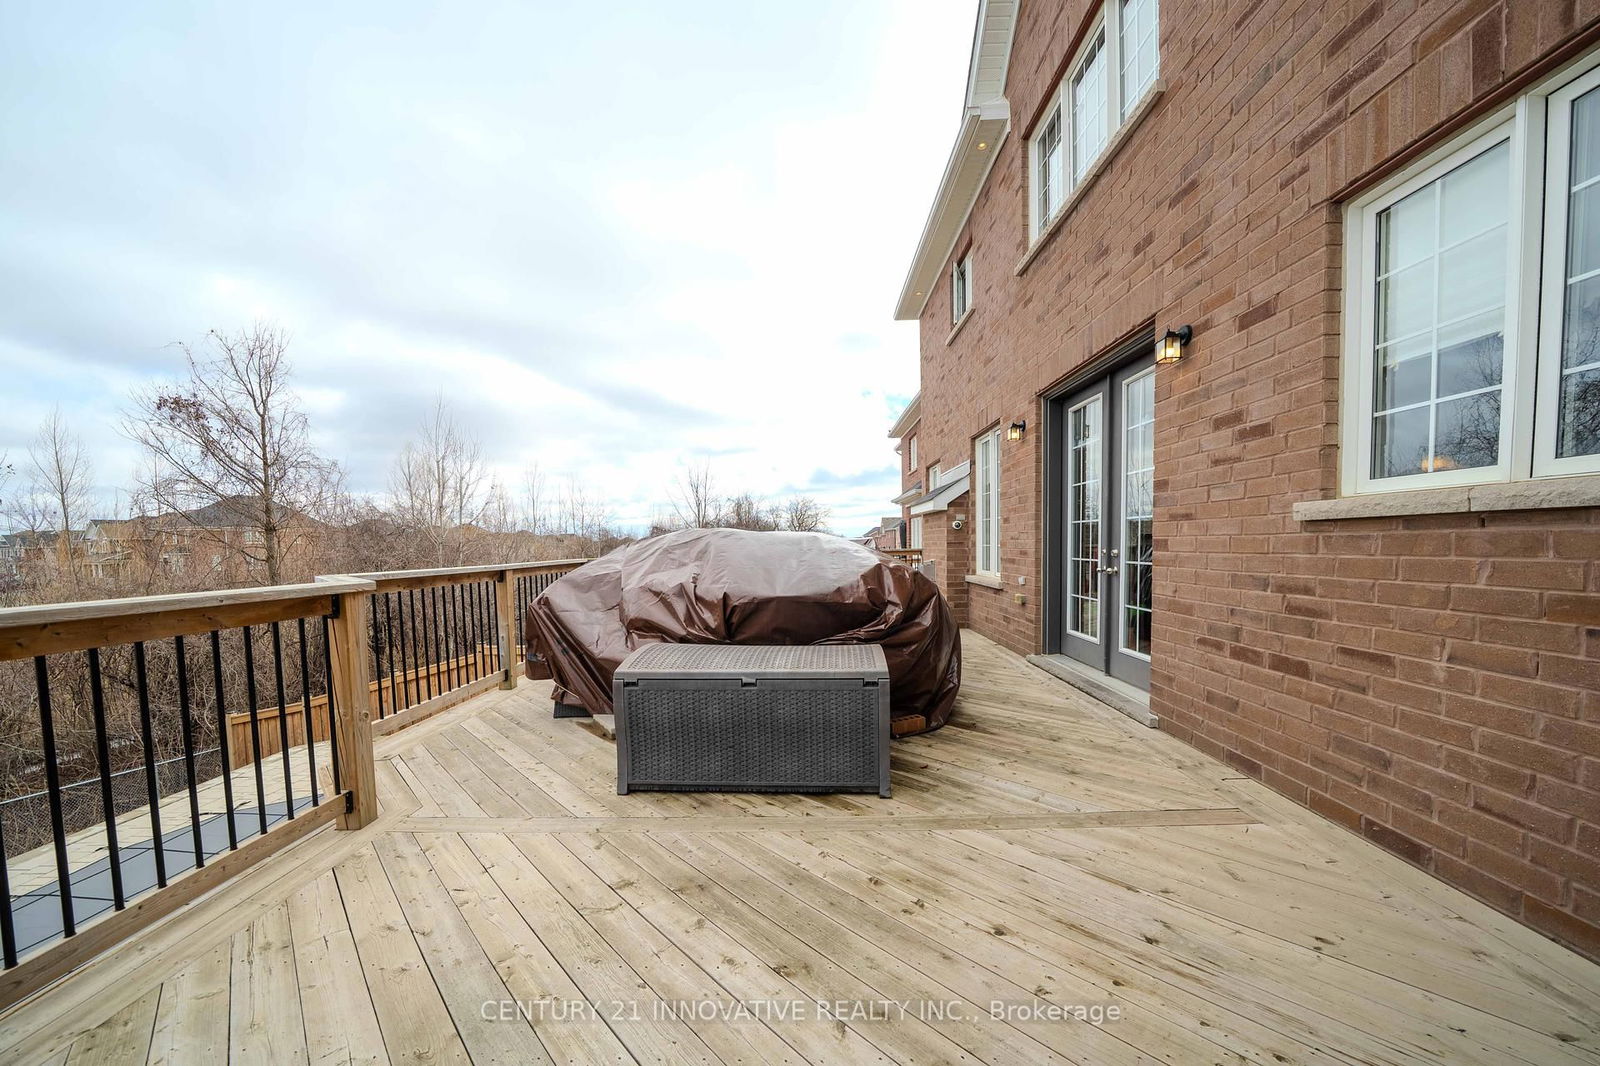
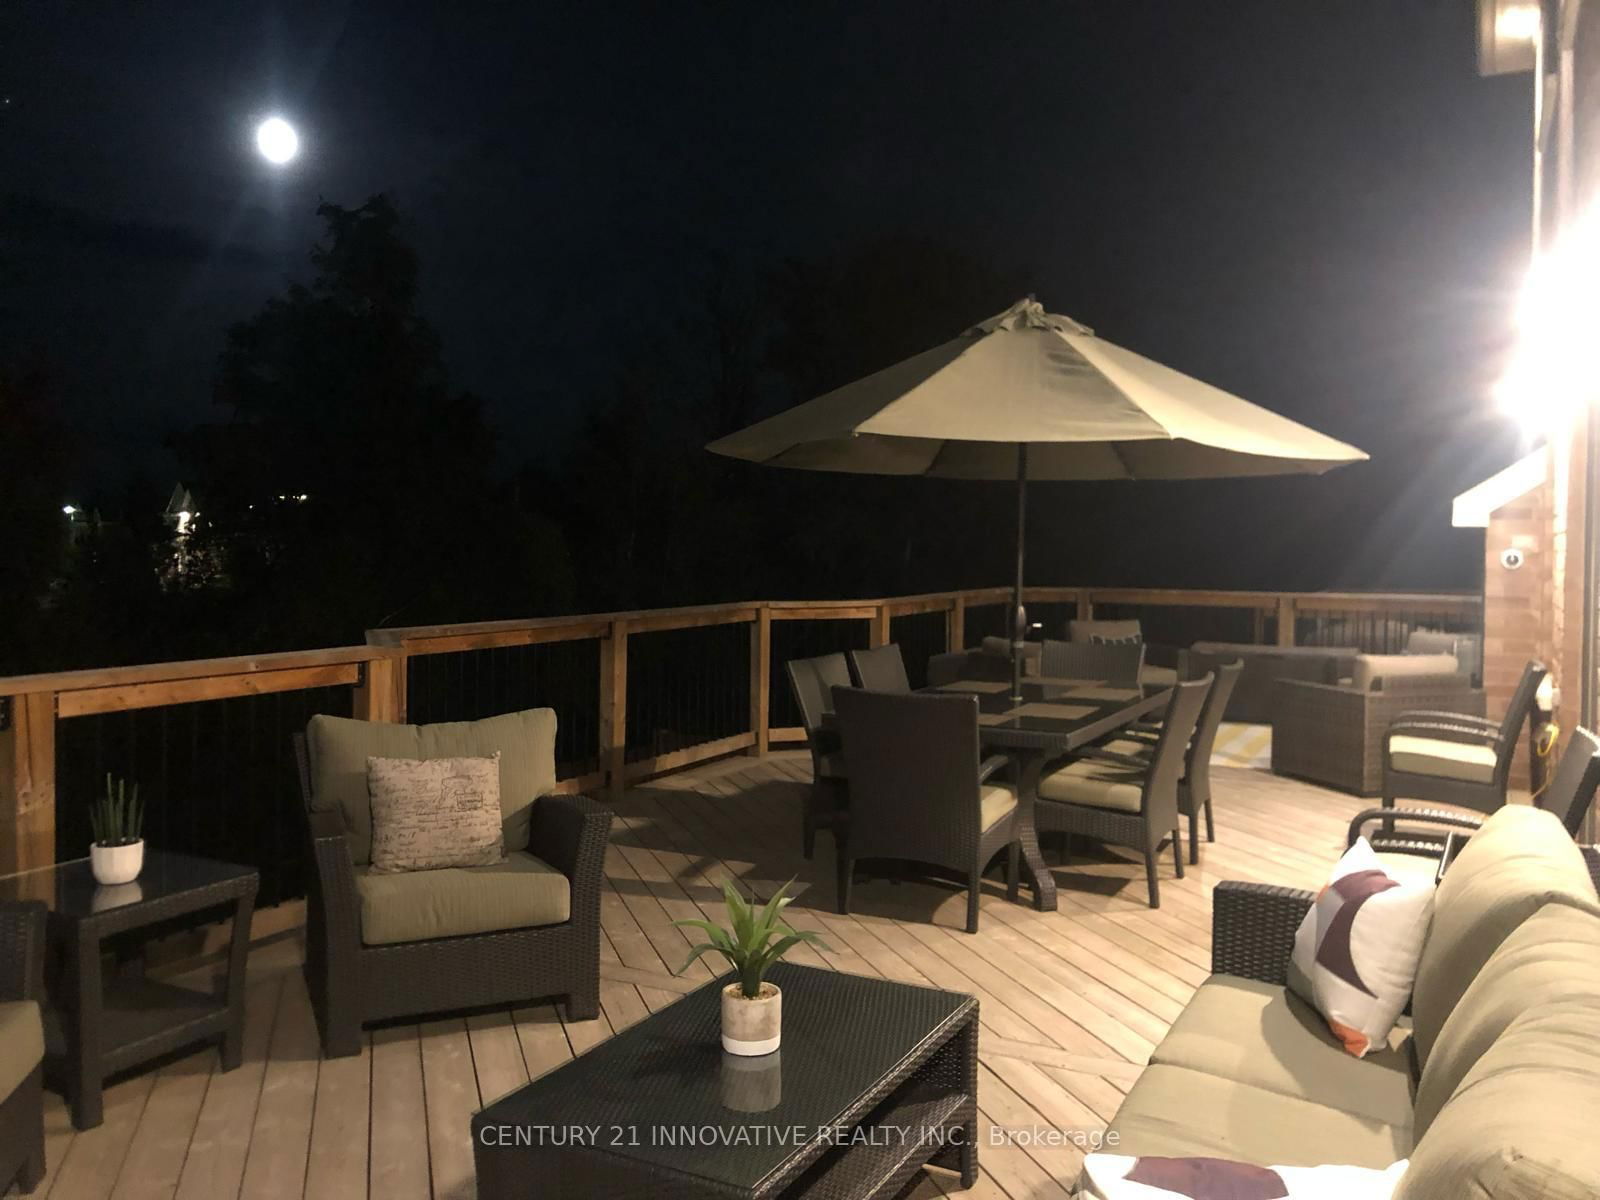
Elevate Your Lifestyle in This Executive Masterpiece! Discover 3,840 sq. ft. of pure elegance in this executive luxury home, perched on a premium ravine lot with a walkout basement, nestled on a serene cul-de-sac. Designed for the discerning buyer, it blends sophistication with modern convenience. The main floor features a gourmet kitchen with included appliances-fridge, stove, dishwasher, microwave, and stand-up freezer-plus a great room with a gas fireplace, dining, and living areas. A private office/library with an executive desk suits the professional. Step outside to a 16'x32' saltwater swimming pool with equipment, and a wood deck overlooking the ravine. The second floor boasts a lavish master bedroom (16'0" x 16'0") with an ensuite and walk-in closet, plus four additional bedrooms-Bedroom 2 (13'0" x 12'6"), Bedroom 3 (12'0" x 10'6"), Bedroom 4 ( 14' 7" x 11' 6") , and Bedroom 5 ( 13' 0" x 12' 5" )-with two full bathrooms and an optional fifth bedroom. CCTV cameras, all electric light fixtures (ELFs), laundry, dryer, and a walkout basement for customization. Minutes from top schools, transit, and shopping, this exclusive enclave awaits. Epoxy Garage . All counters throughout house are above standards measurement (height)
Fridge, stove, dishwasher, microwave, stand up freezer, laundry, dryer, exec desk in office, swimming pool(l6'x32' - saltwater) & equipment, cctv cameras, unfinished walkout basement, tankless water heater(rental $SB/month) gas fireplace, wood deck, ravine lot, all elfs, -Gdo- ( 1 (Remote)
Great Rm
Kitchen
Breakfast
Living
Office
Primary
2nd Br
3rd Br
4th Br
5th Br
Laundry
The graph below compares the average list price and average sale price of homes in this neighborhood by month for the last 24 months. When average sale price is greater than average list price, this may suggest a buyer's market. When average sale price is lower than the average list price this may suggest a seller's market.
The graph below illustrates the average days on market for homes in this neighborhood. The yellow area may indicate a buyer's market, the green area may indicate a balanced market and the red area may indicate a seller's market.
Sales Representative, Century 21 People’s Choice Realty Inc., Brokerage
(647) 576 - 2100