


Century 21 People’s Choice Realty Inc., Brokerage
120 MATHESON BLVD E #103
MISSISSAUGA, Ontario
L4K 0A4


Orillia, West Ward, L3V 8K3
$869,900$000000
Listed by RE/MAX Crosstown Realty Inc. Brokerage.
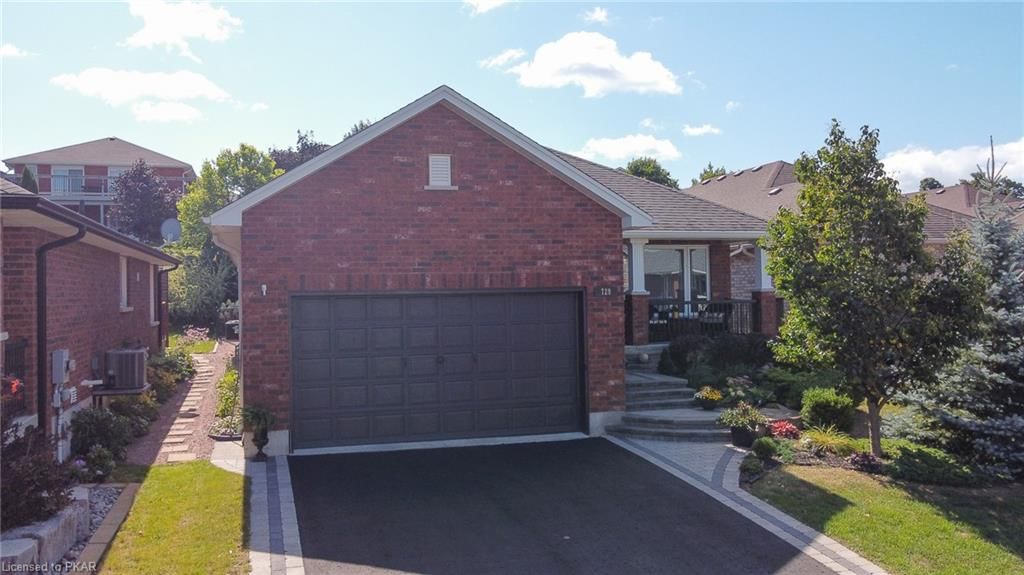
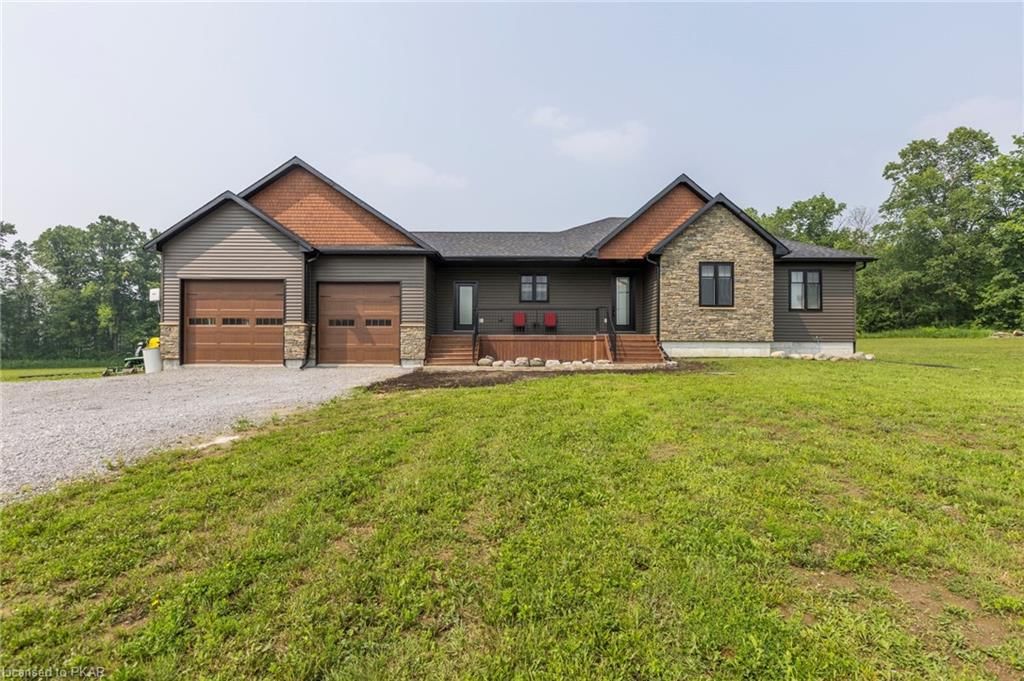
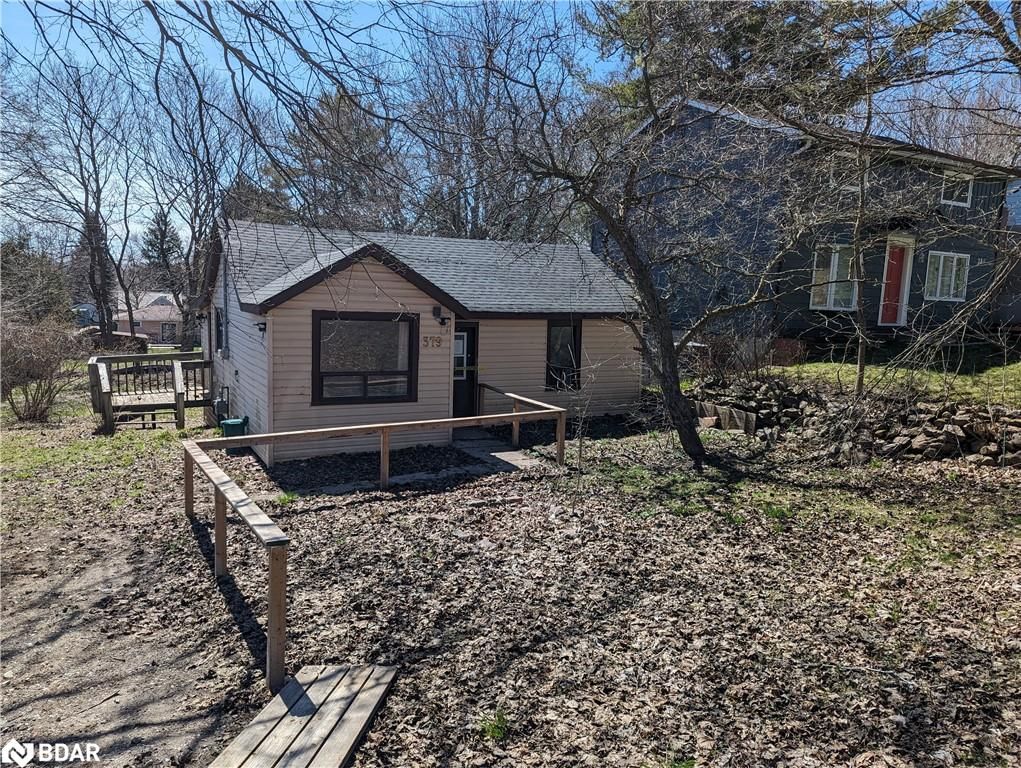
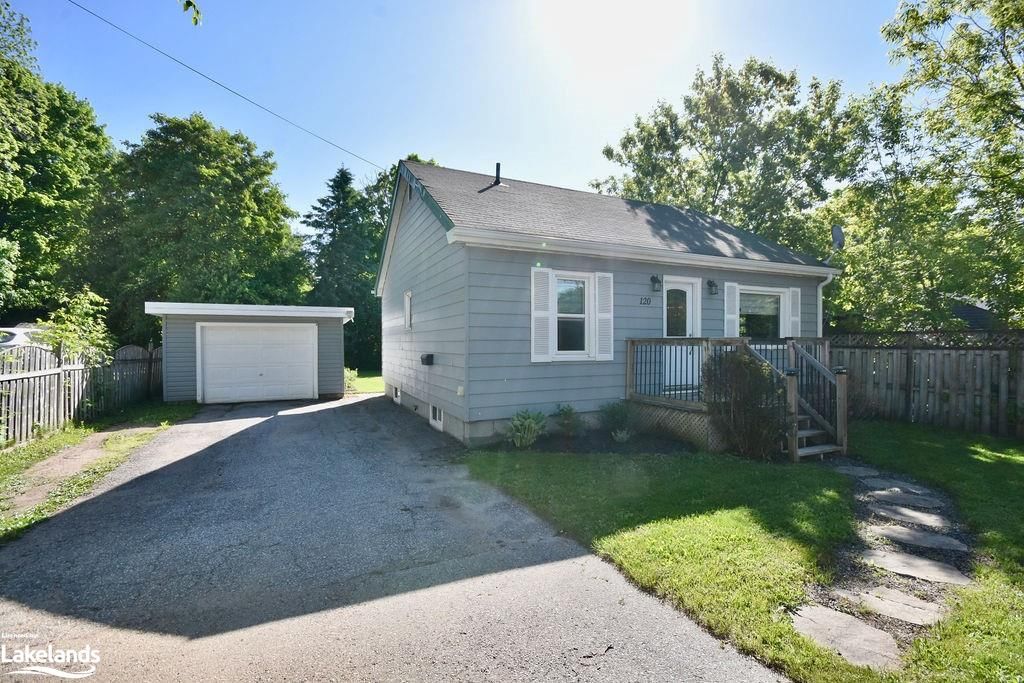
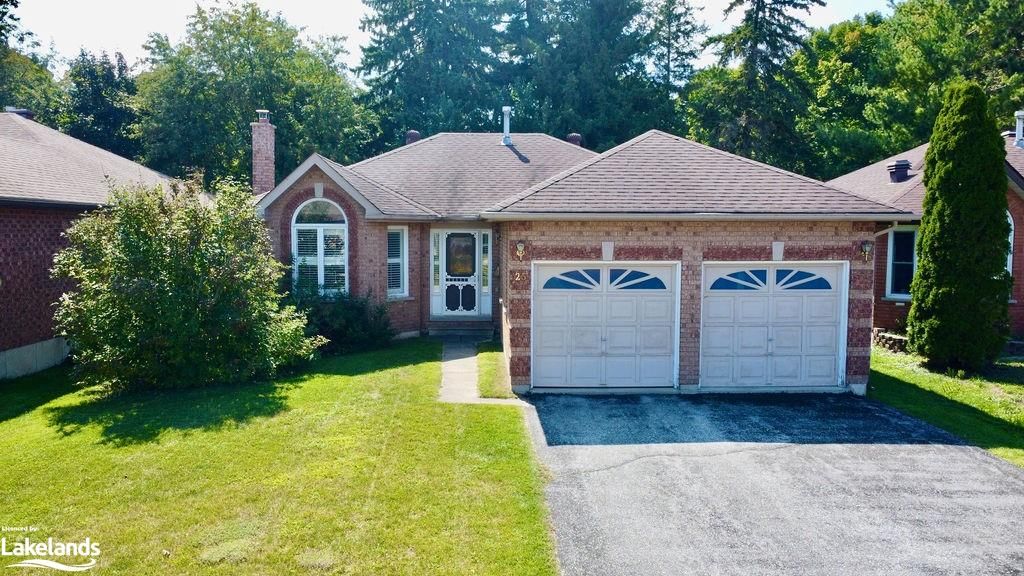
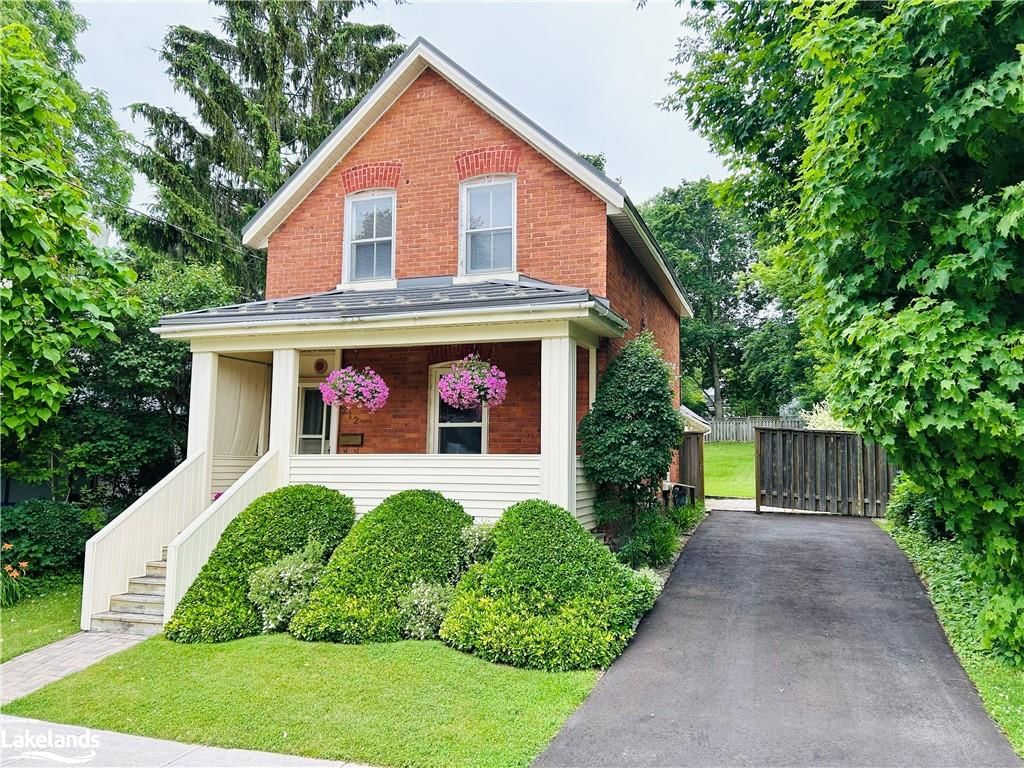
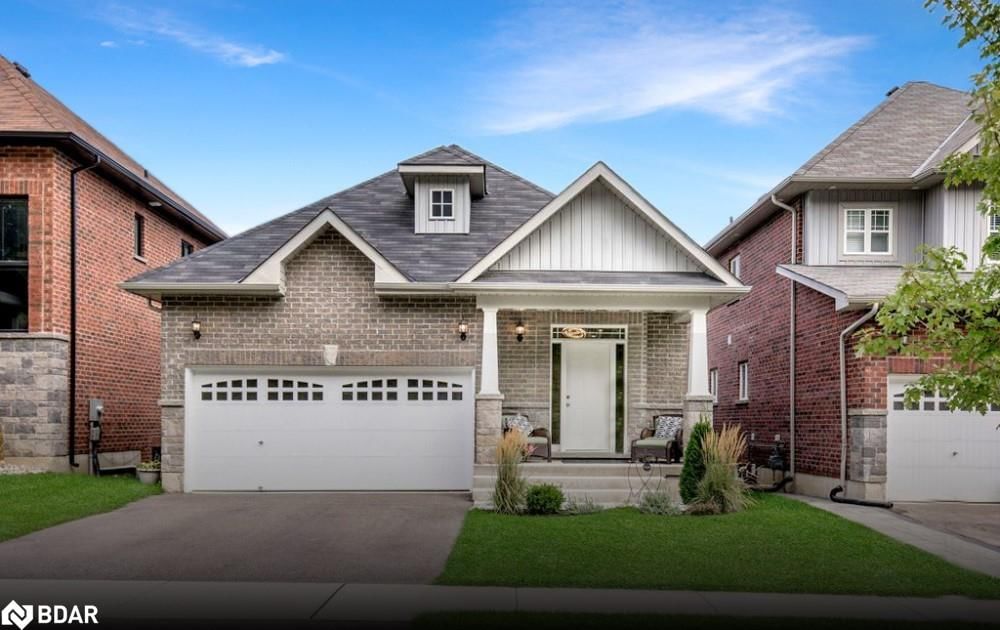
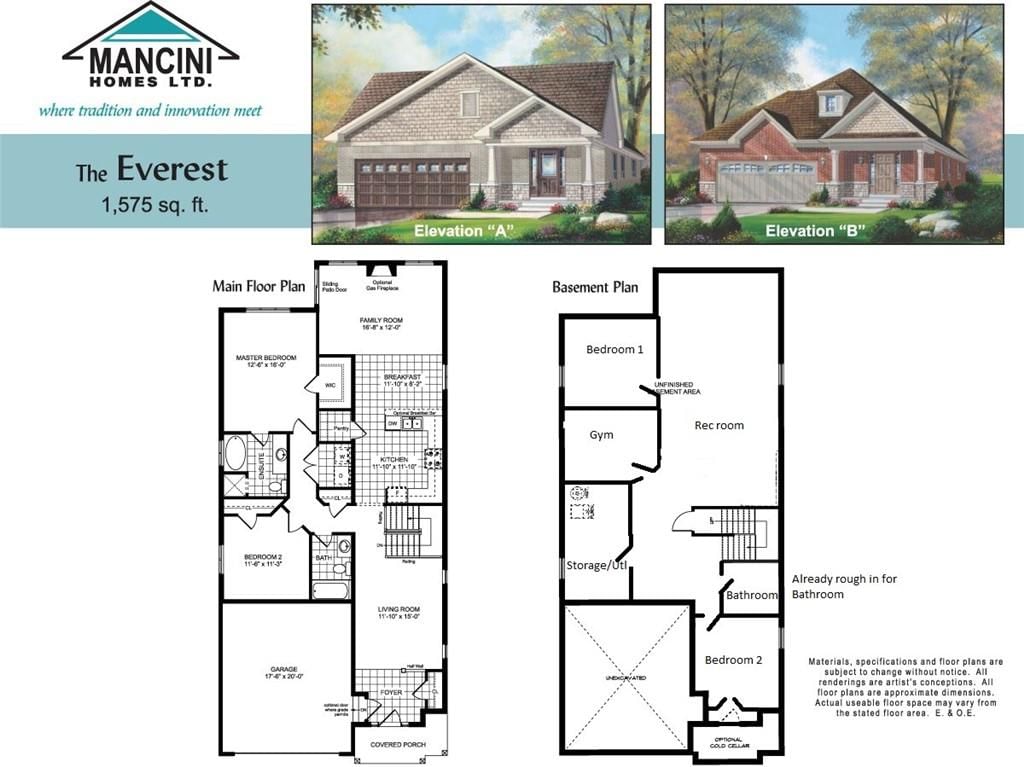
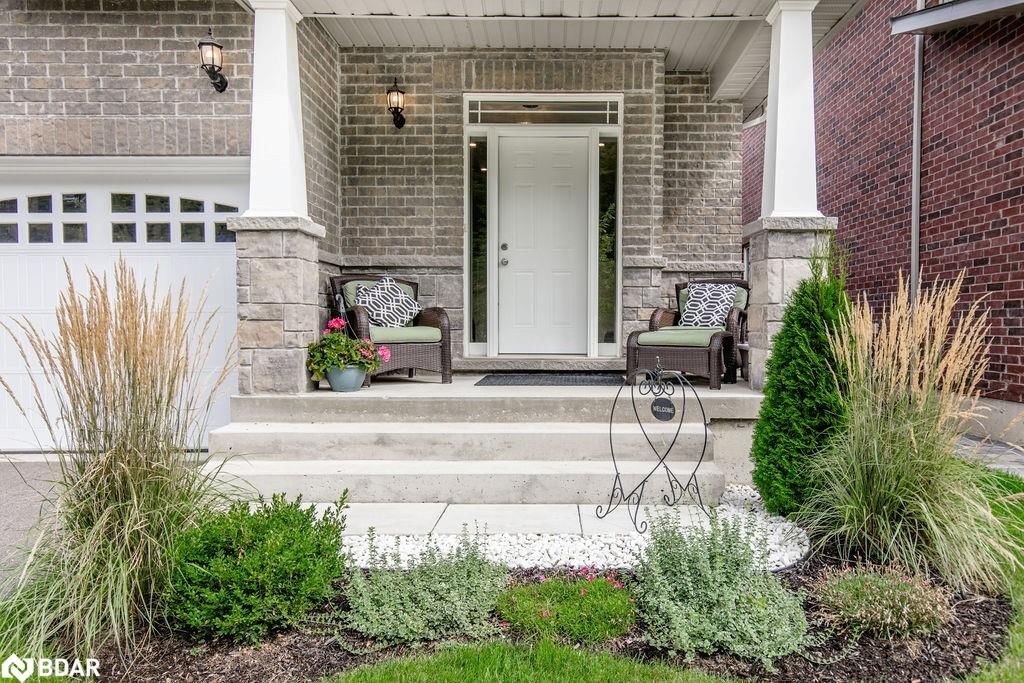
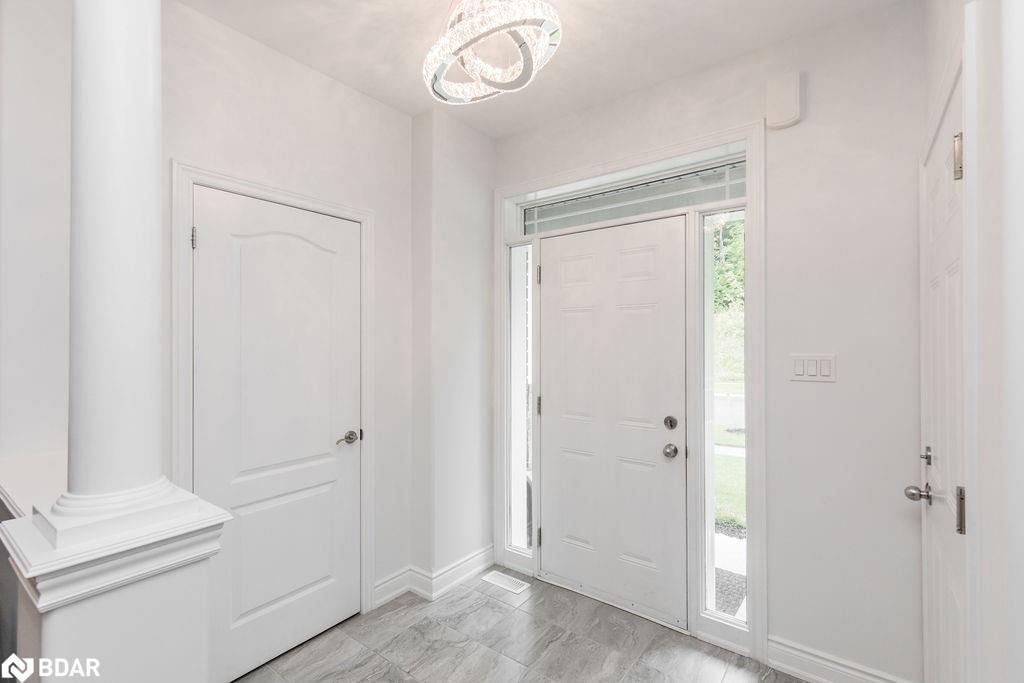
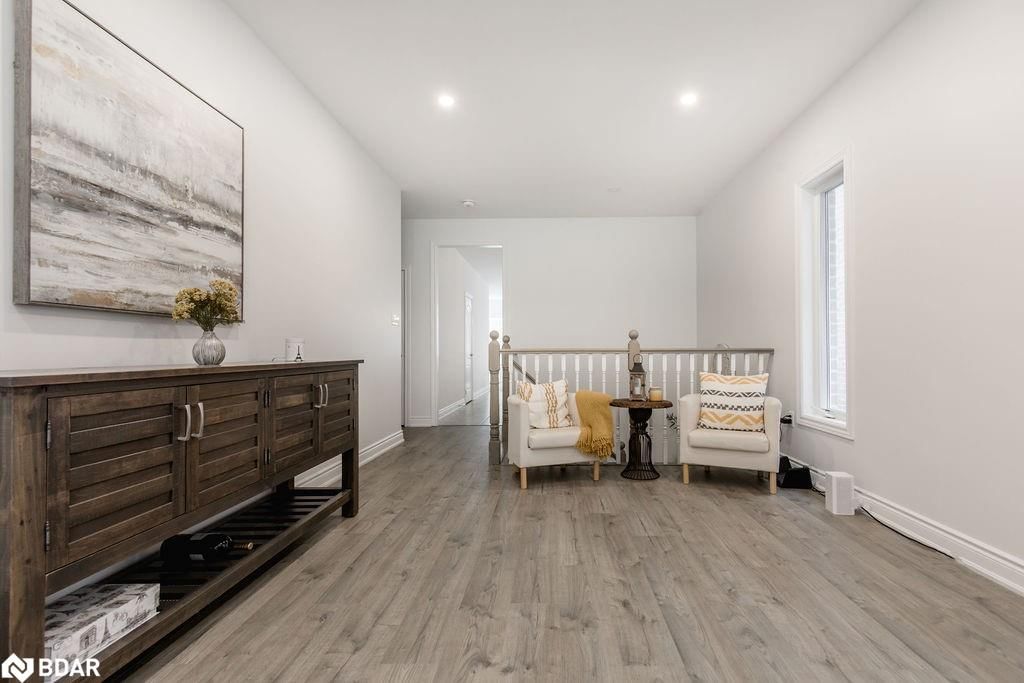
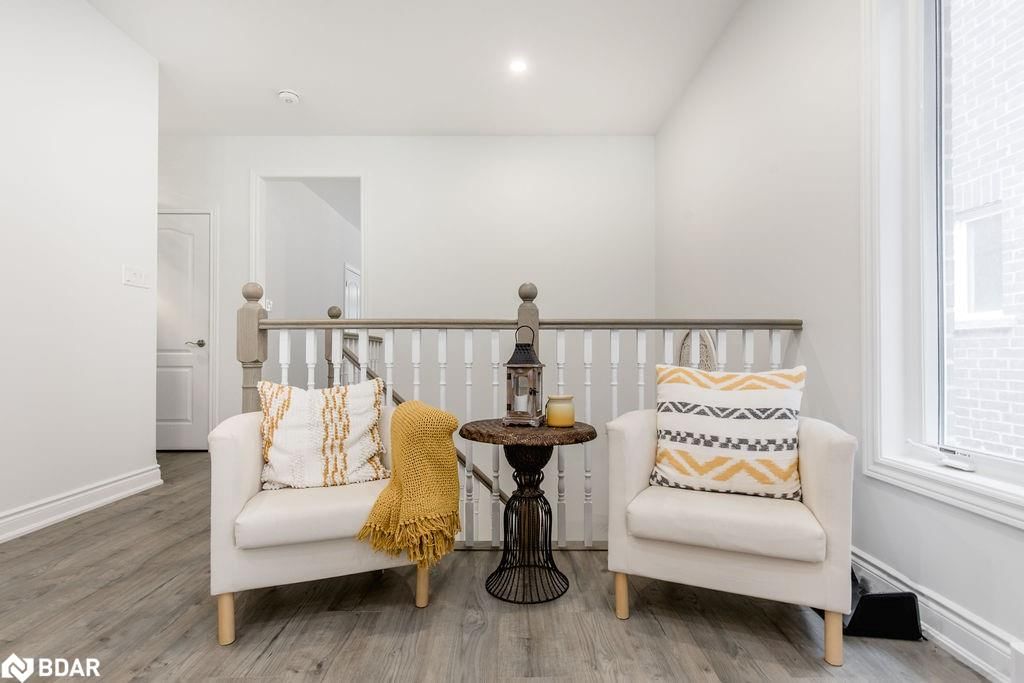
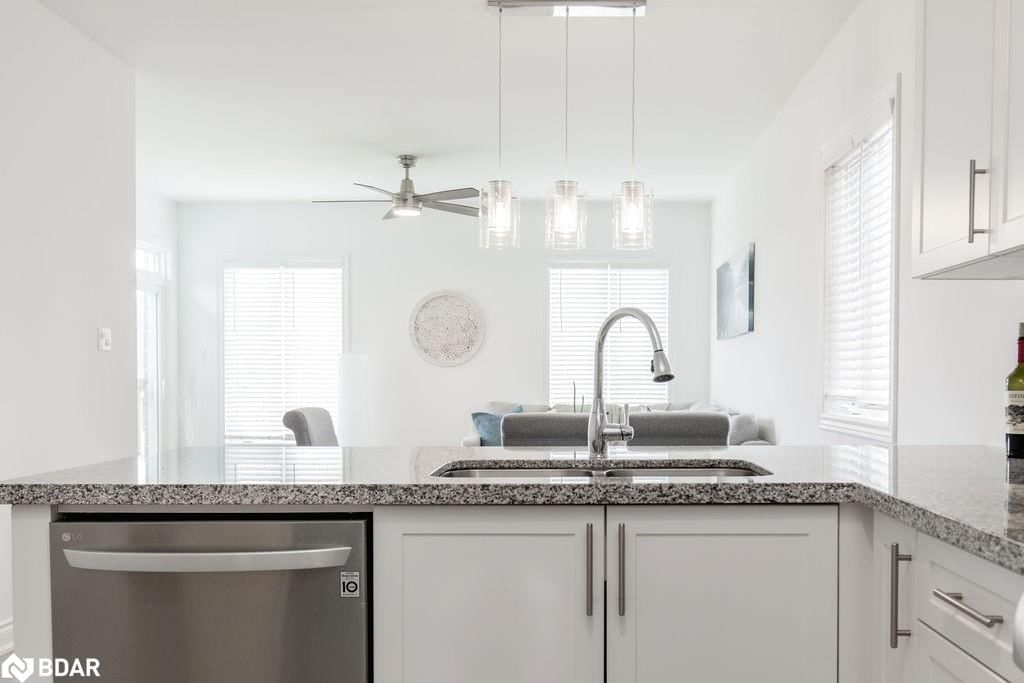
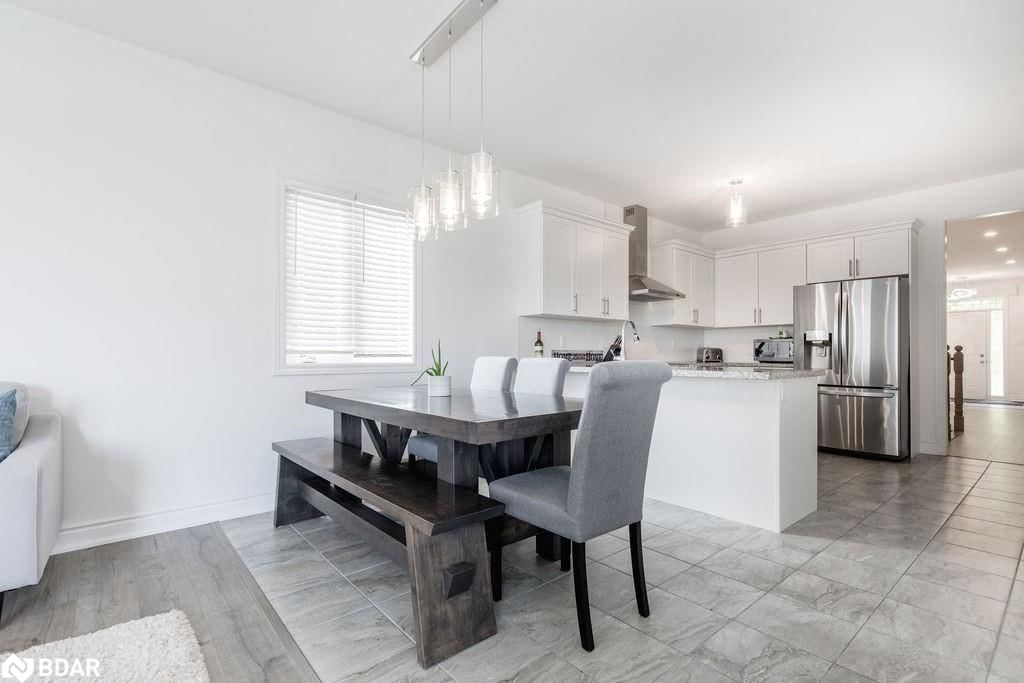
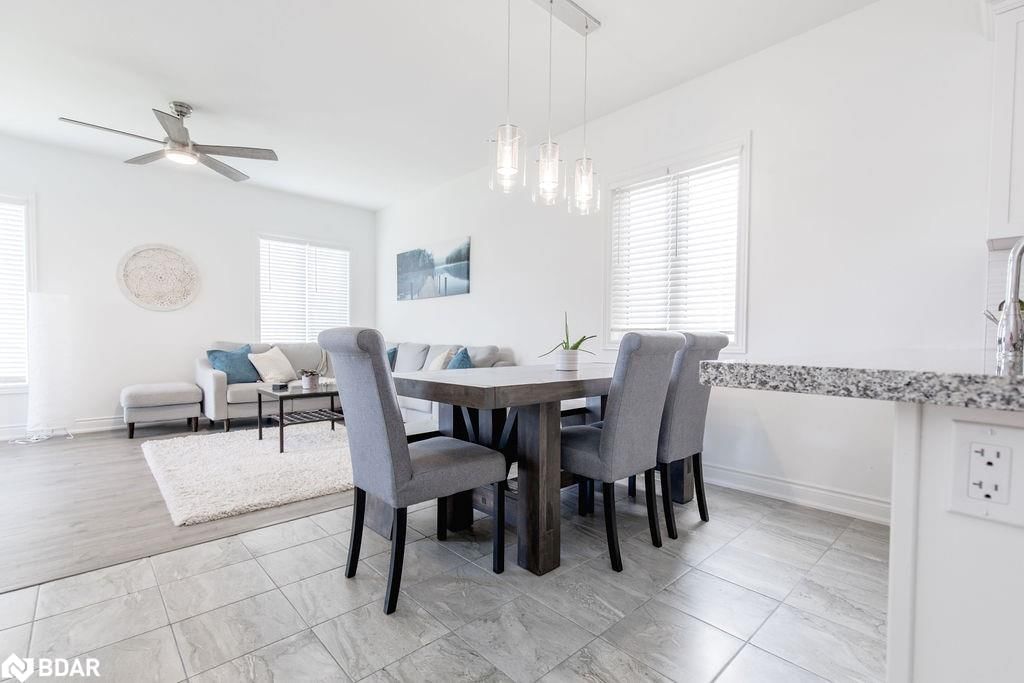
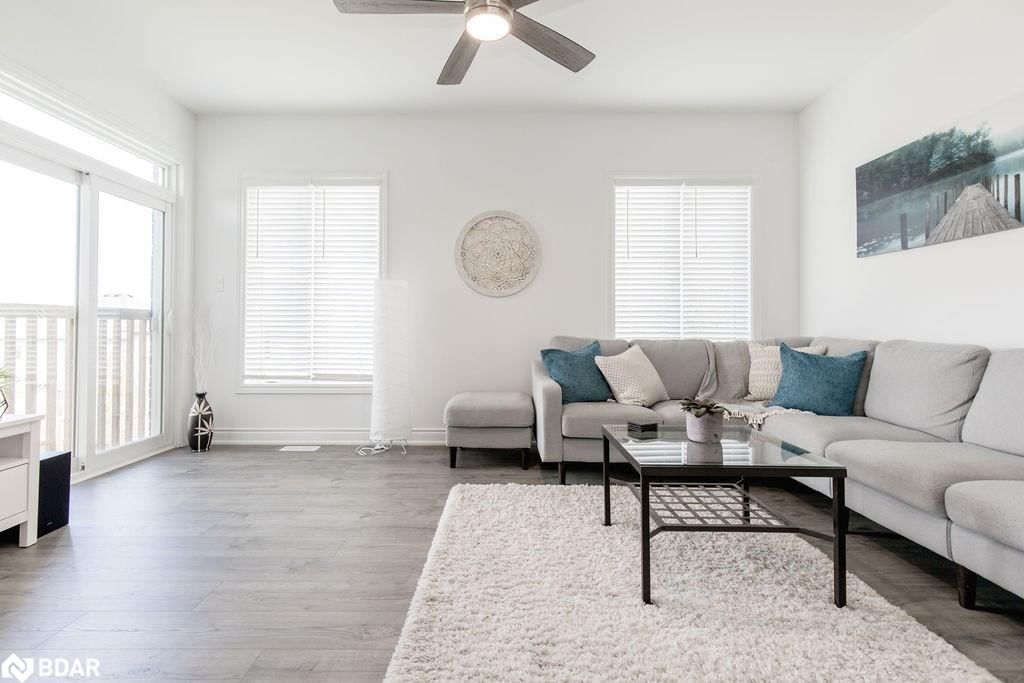
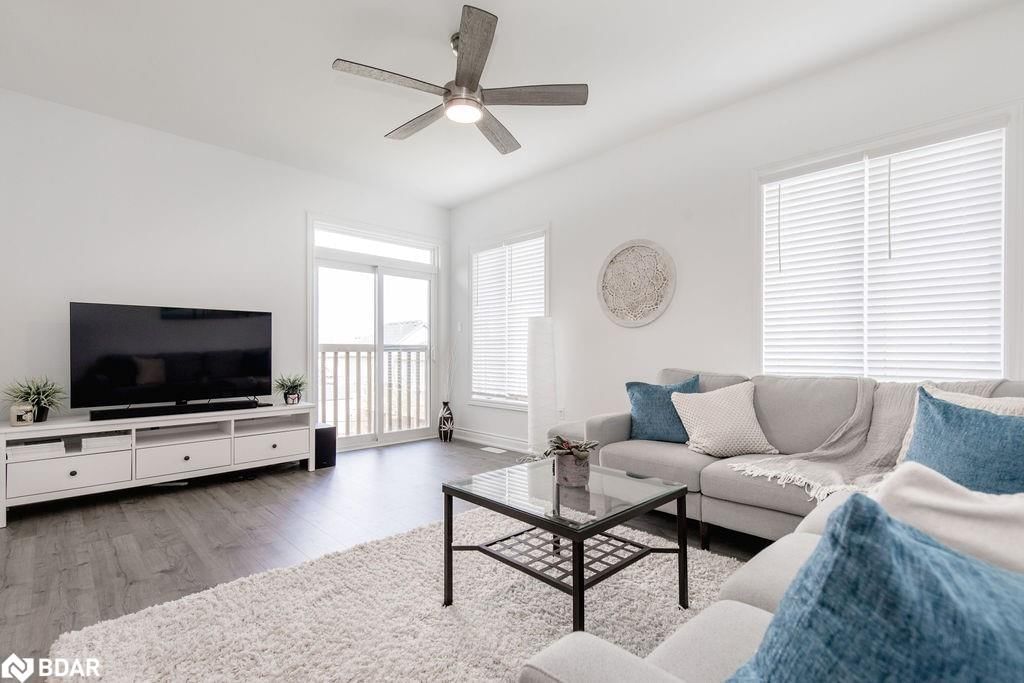
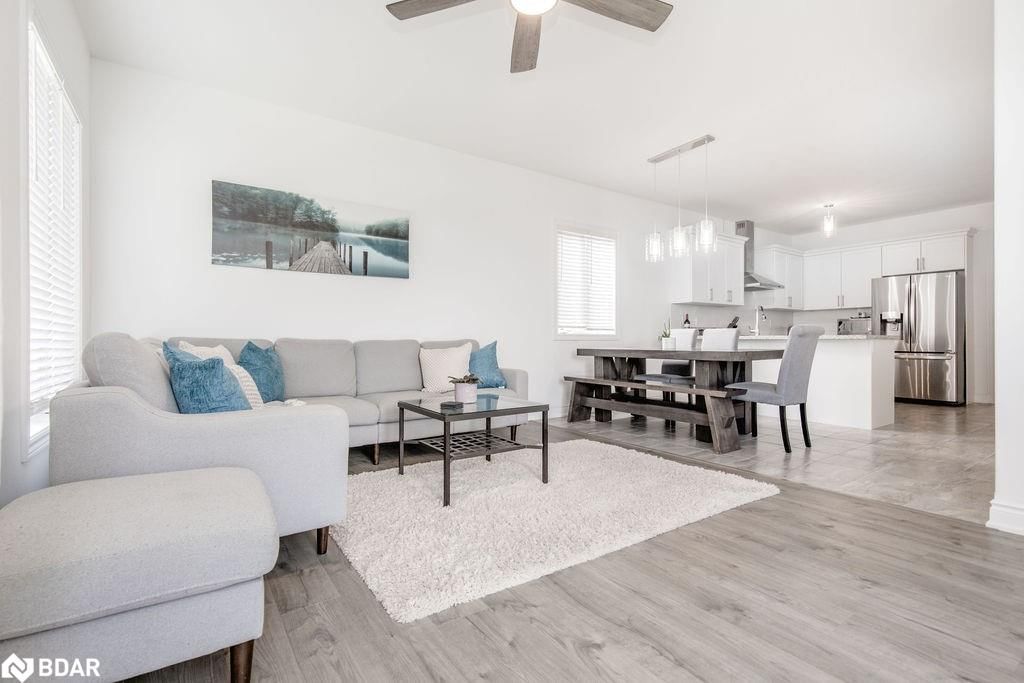
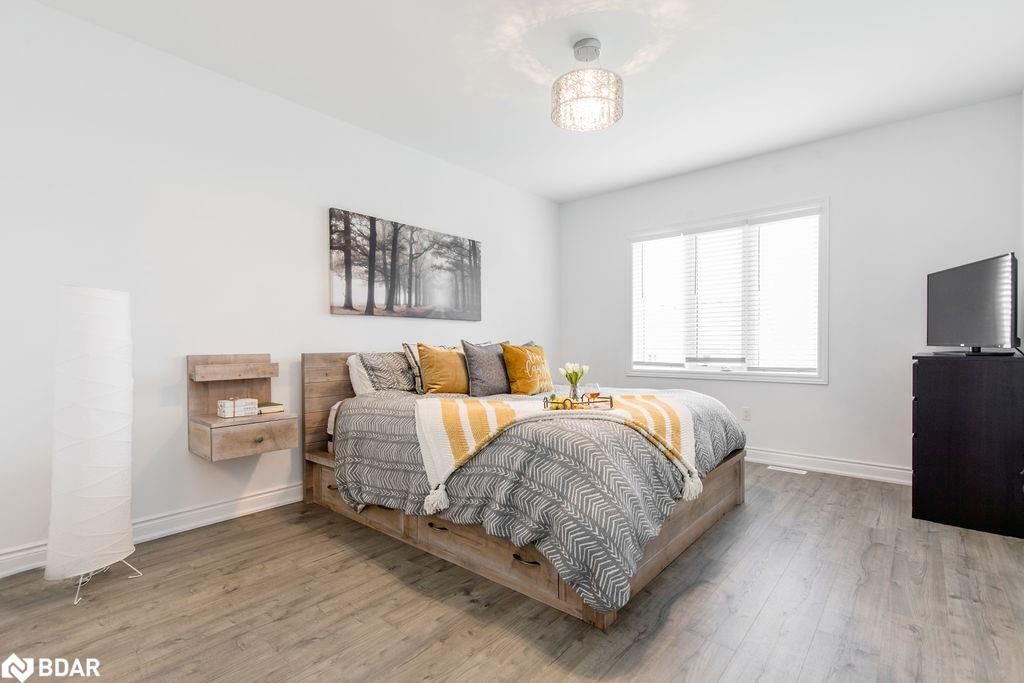
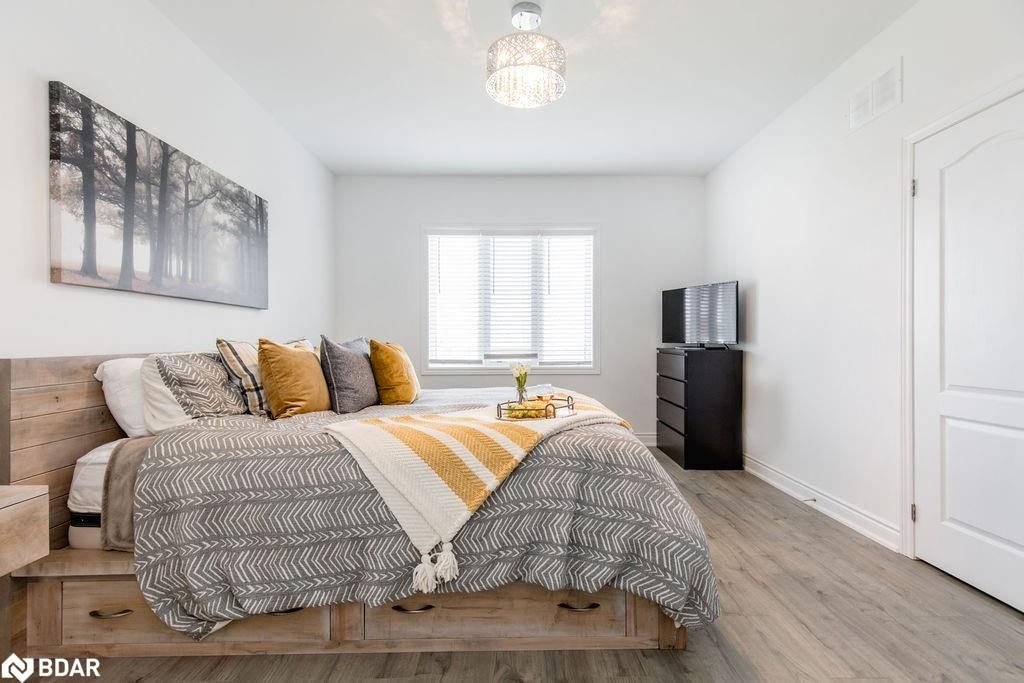
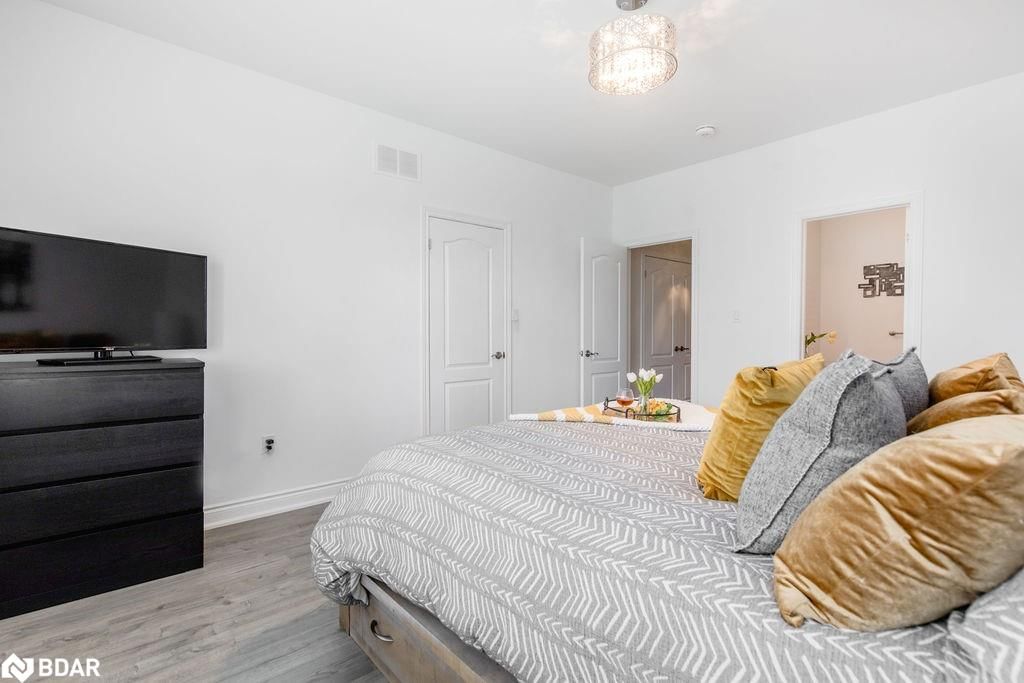
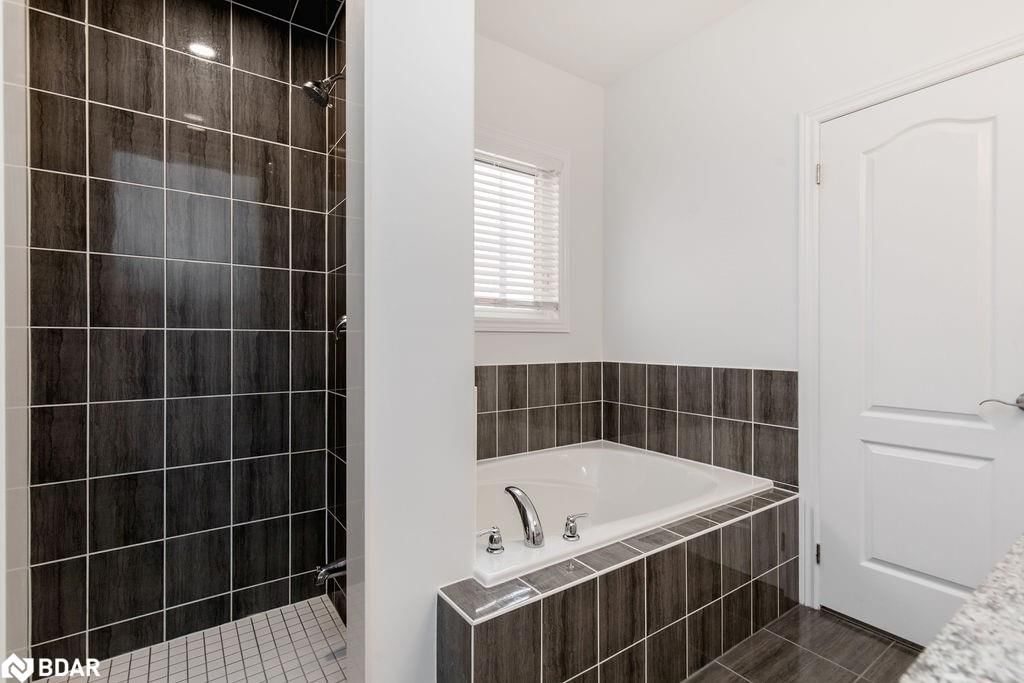
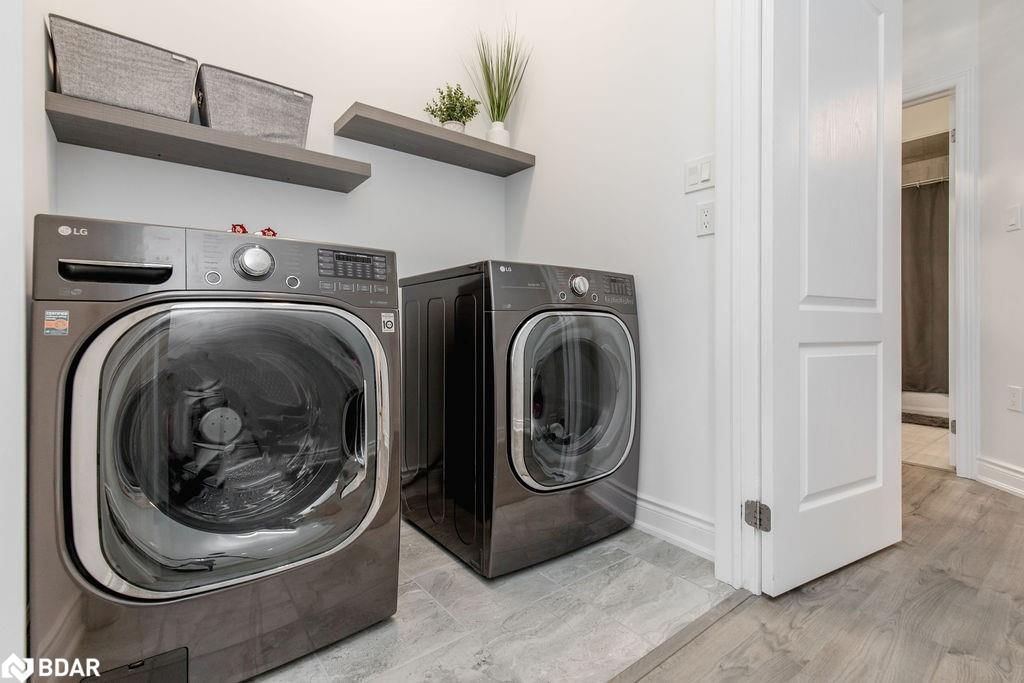
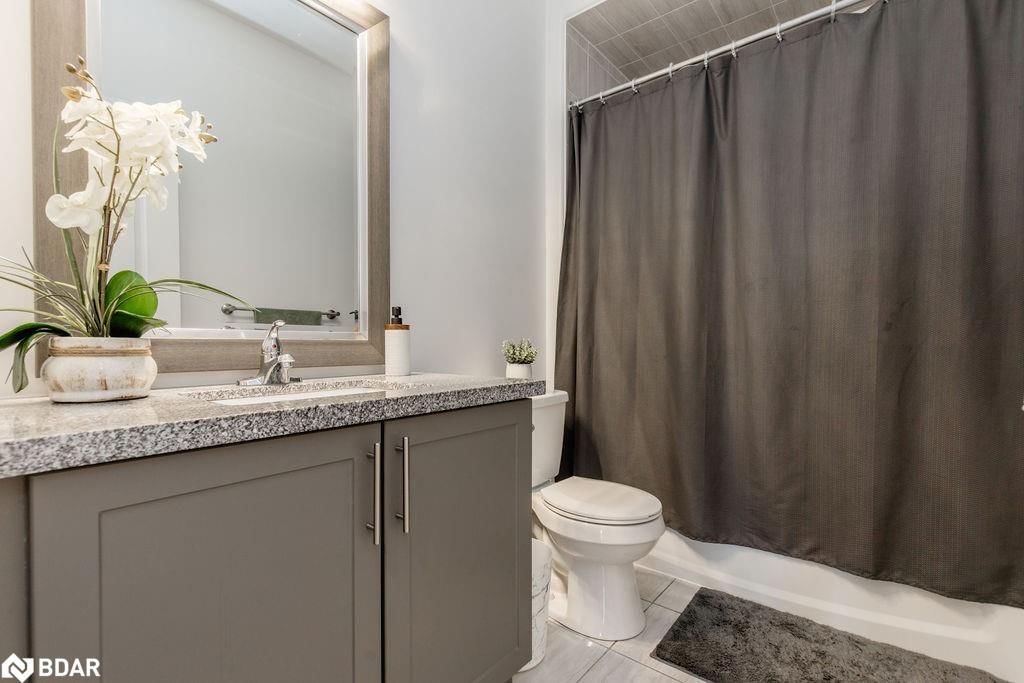
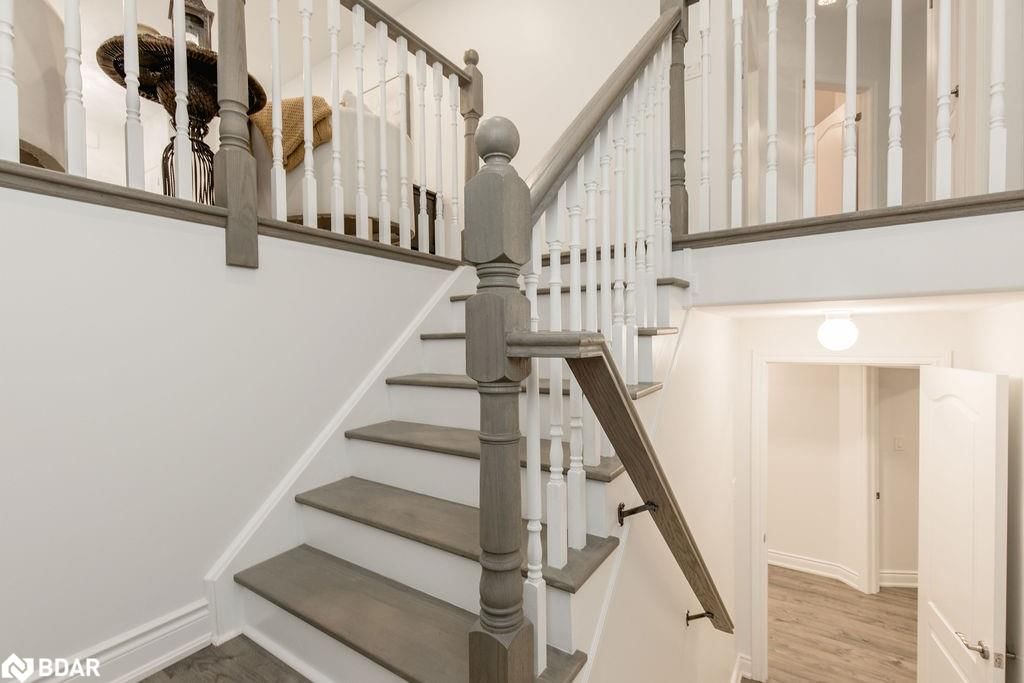
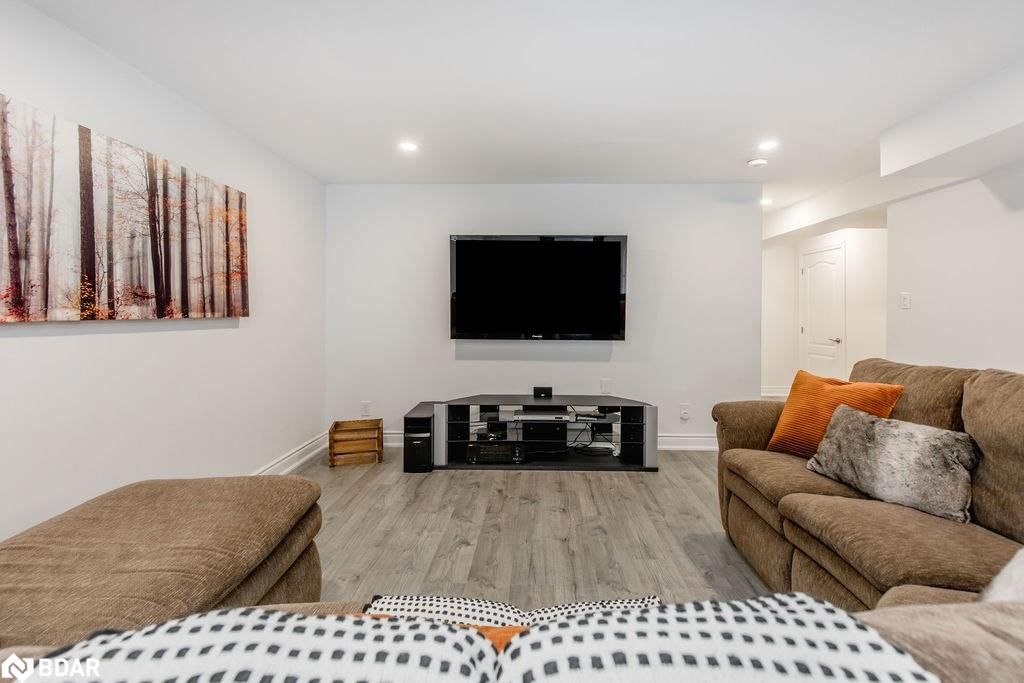
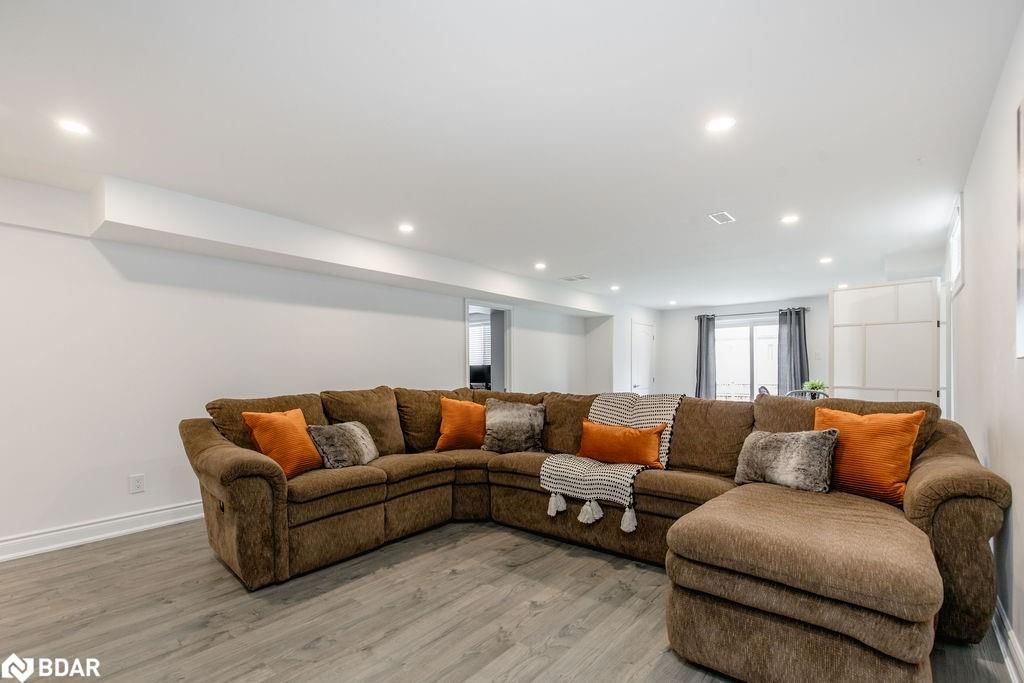
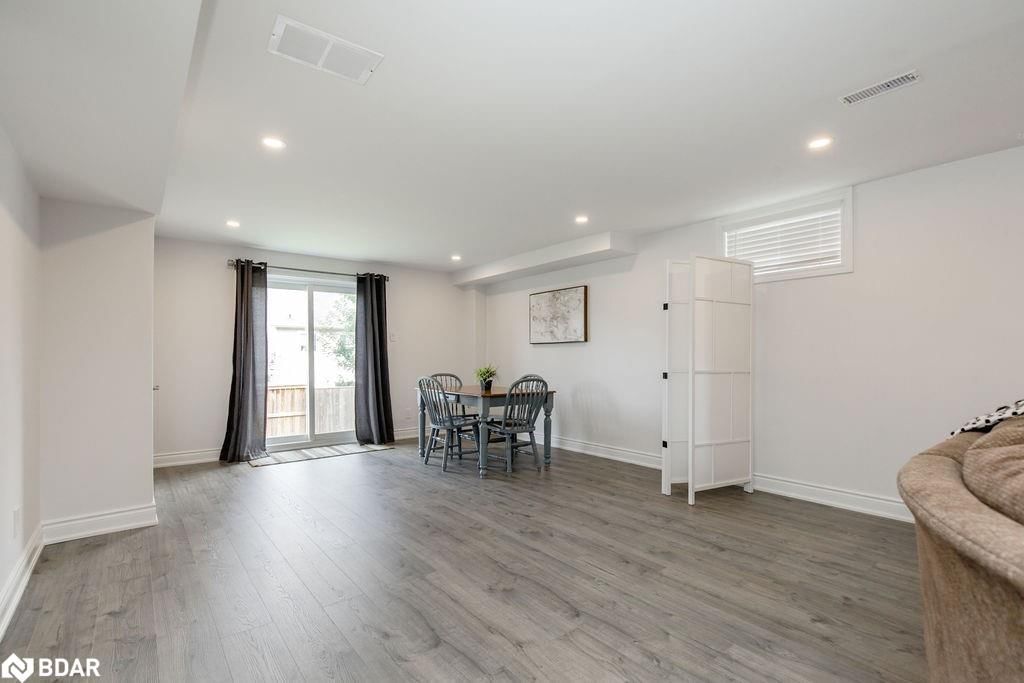
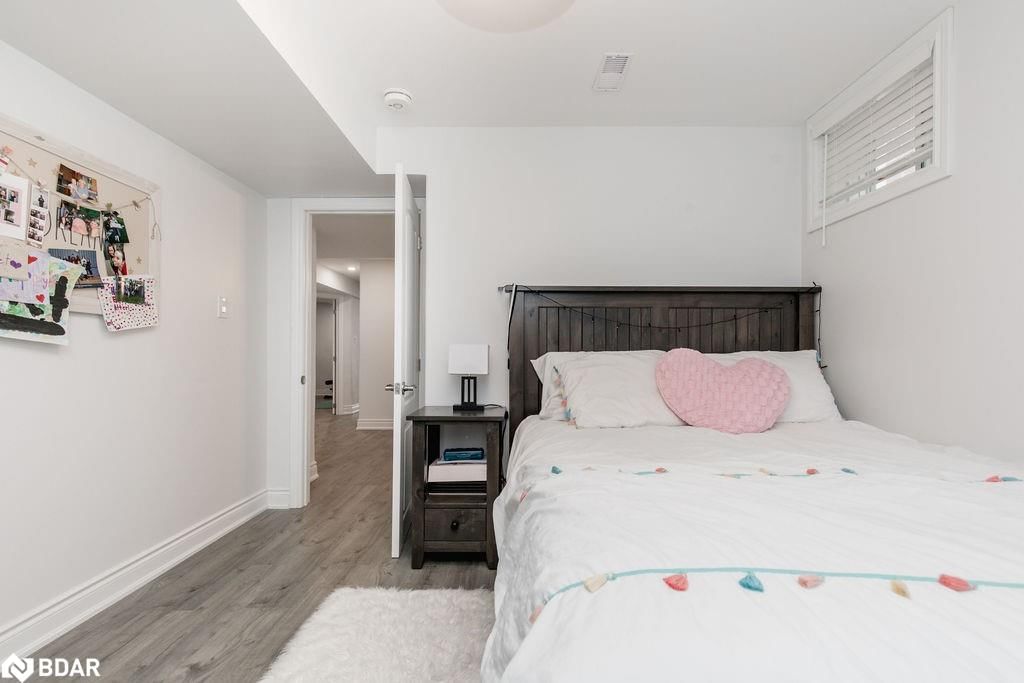
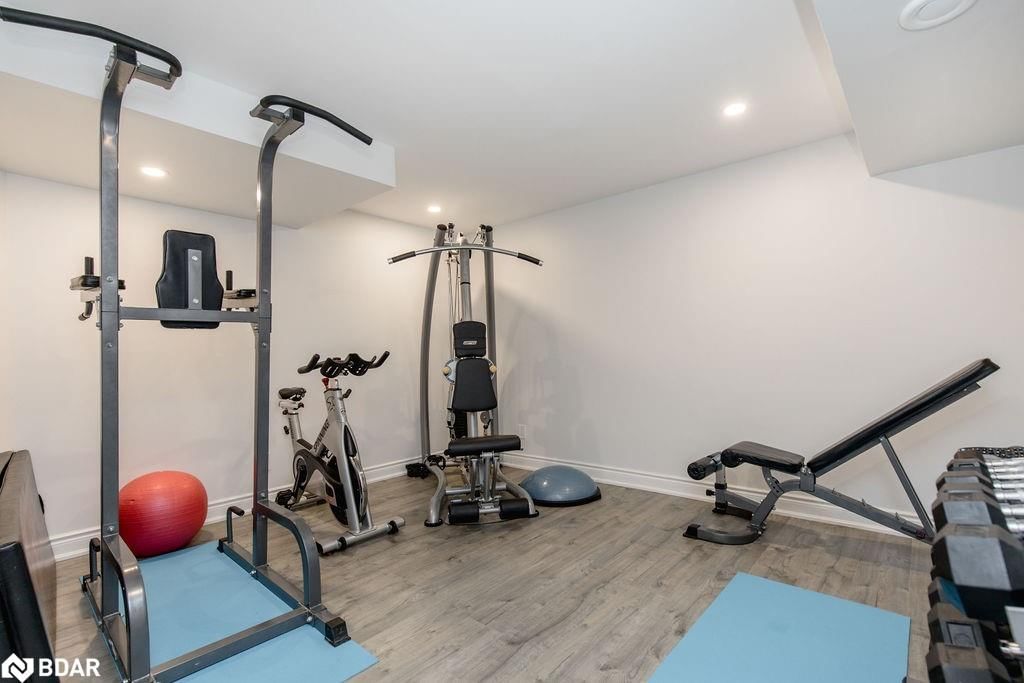
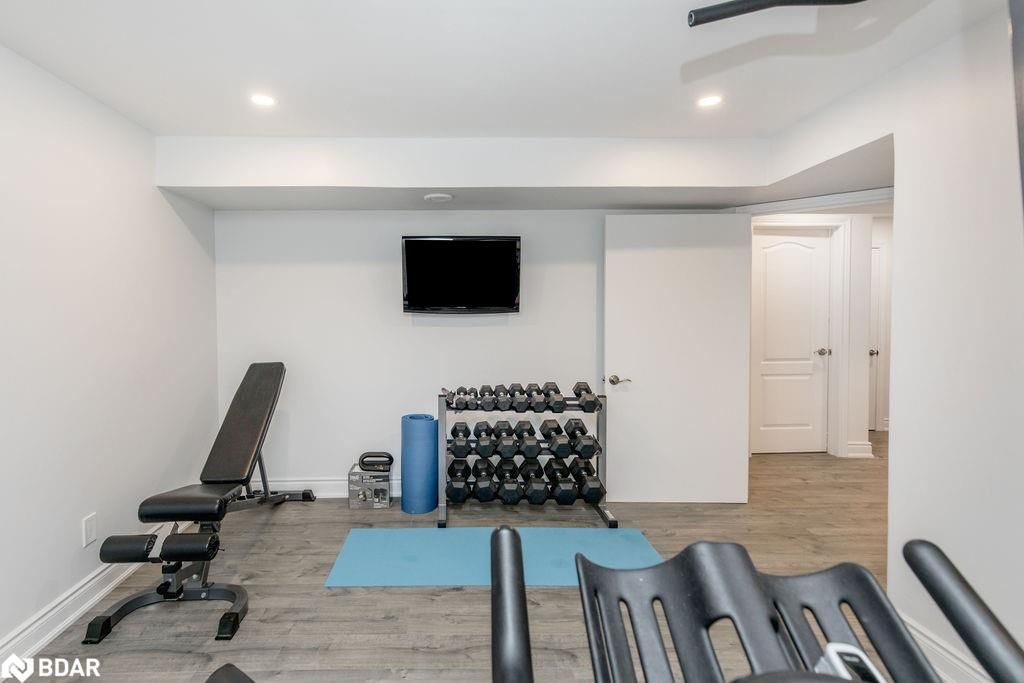
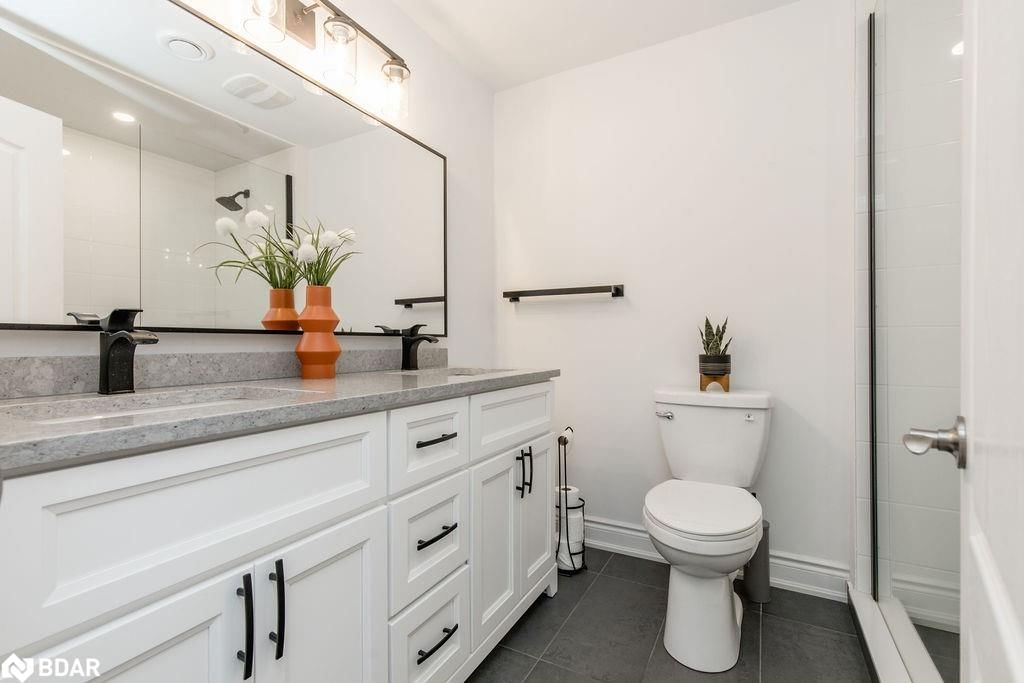
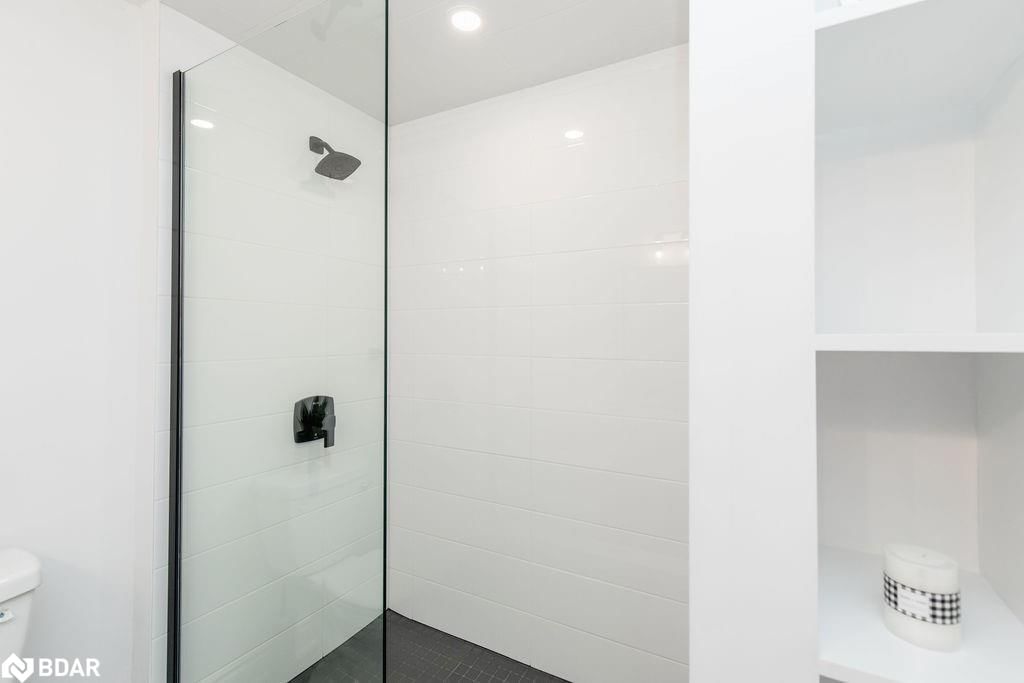
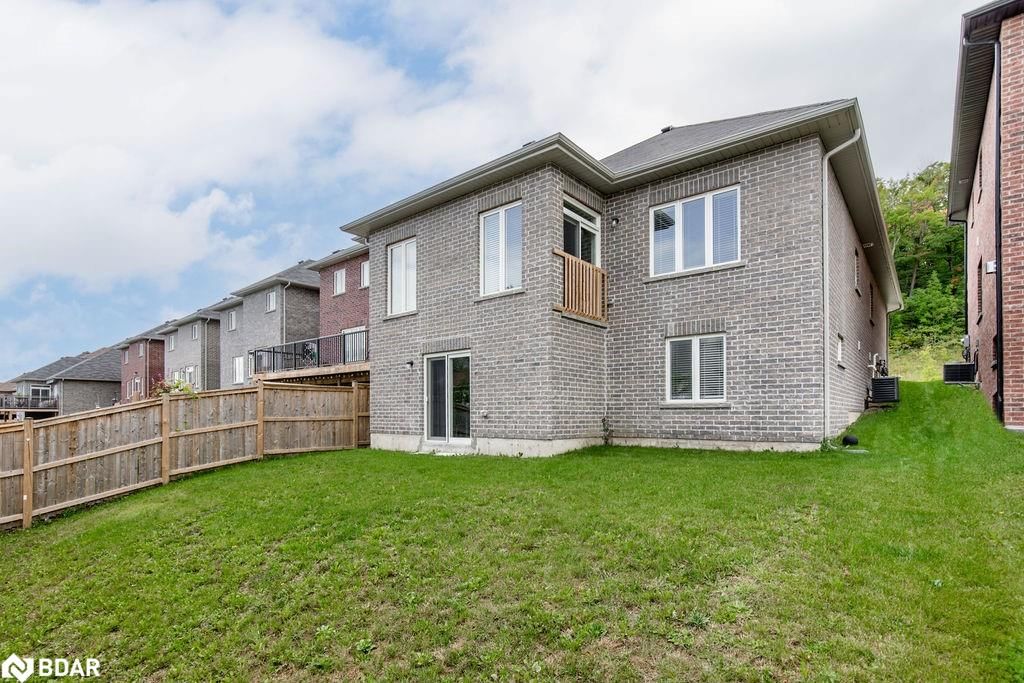
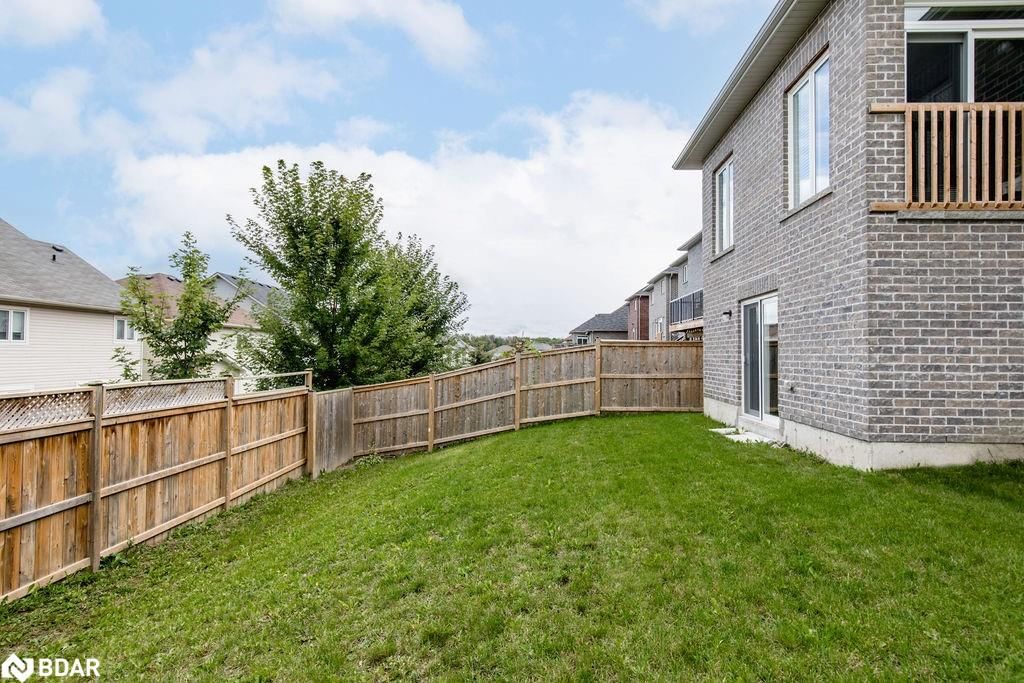
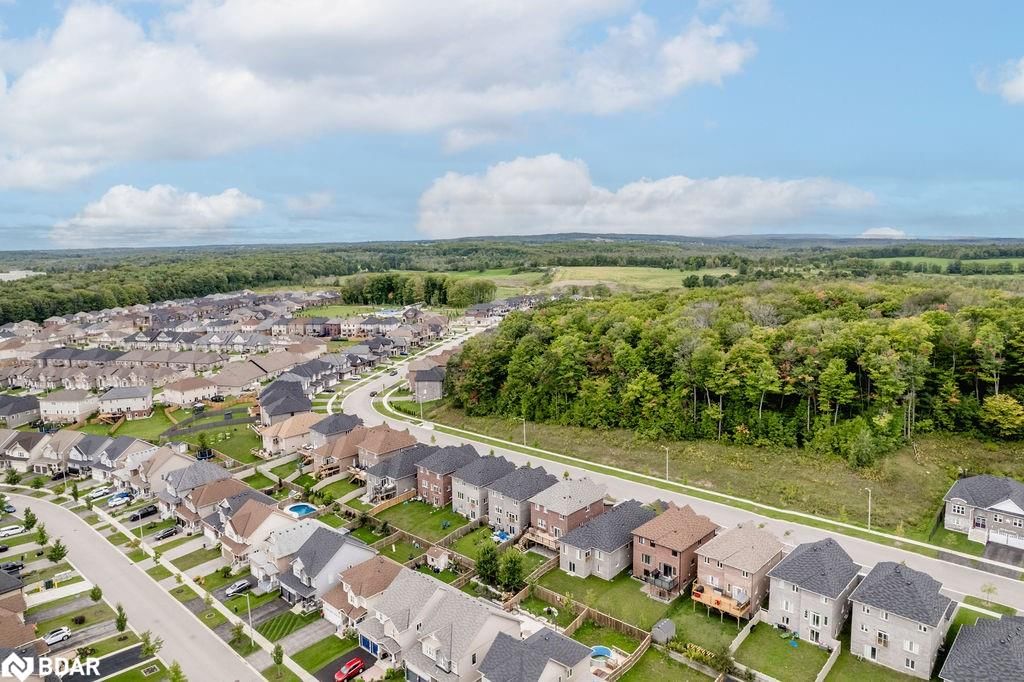
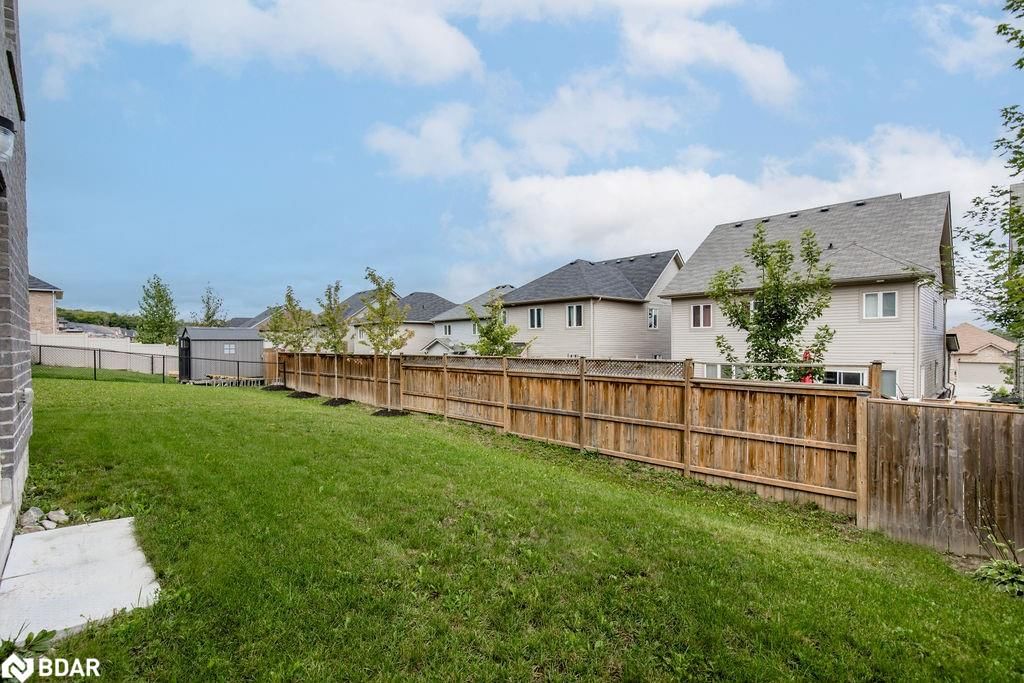
This immaculately kept bungalow is a mere 4 year young and is nestled in one of Orillia's most sought-after & modern developments. Just mins away from Hwy 11, the bustling shopping district w/ Costco, Home Depot, Walmart, & HomeSense, making your daily errands a breeze. Walking distance to restaurants & the movies! It also has a brand-new state of the art community park that is sure to entertain your family for hours. surrounded by lots of walking and biking path that connect across Orillia, close to scout valley, bass lake, orillia lakeshore, This home boasts a spacious 1575 square feet on the main floor. W/ a recently professionally fin. basement w/ 2 more bds, creating a well-thought-out and flowing layout that will cater to your every need. The primary suite, big enough to fit a king-sz bed with ease & luxurious 5-piece ensuite! This home also feats its own gym space or a multi use room. W/ flexibility the name of the game here. You'll appreciate the convenience of having your own dedicated space! This is one of the very few bungalow-styled homes in this community, and it's packed with beautiful modern features. Trust us; you do not want to miss out on this incredible opportunity!
Dishwasher,Dryer,Refrigerator,Stove,Washer,Reliance Water Heater Rental Is $ 55.51/Month.
Copyright 2025 Information Technology Systems Ontario, Inc. The information provided herein must only be used by consumers that have a bona fide interest in the purchase, sale, or lease of real estate and may not be used for any commercial purpose or any other purpose.
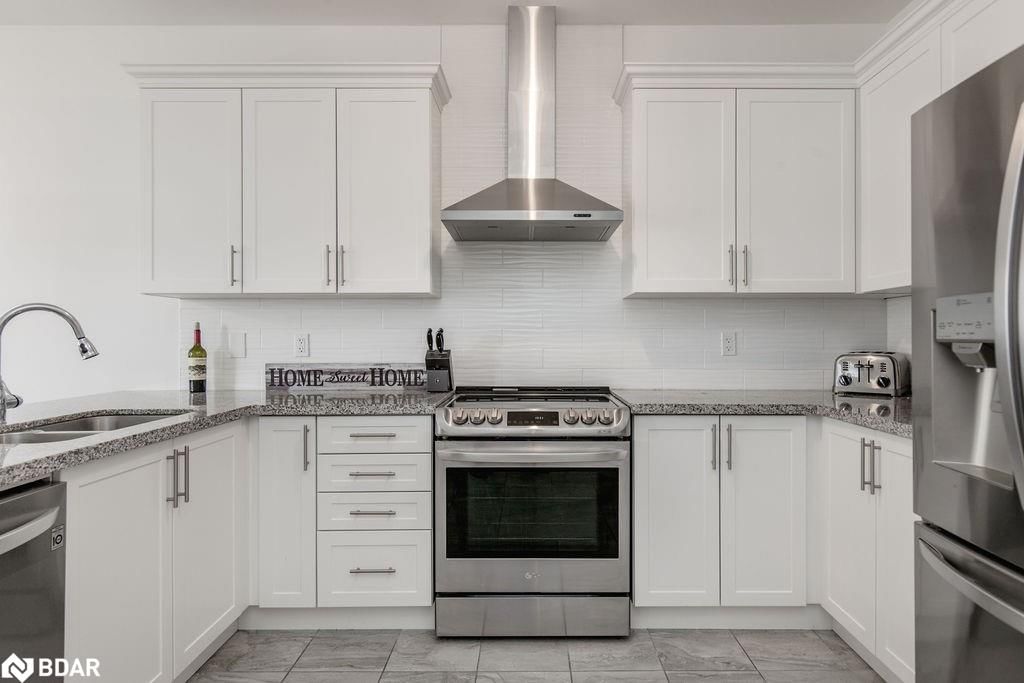
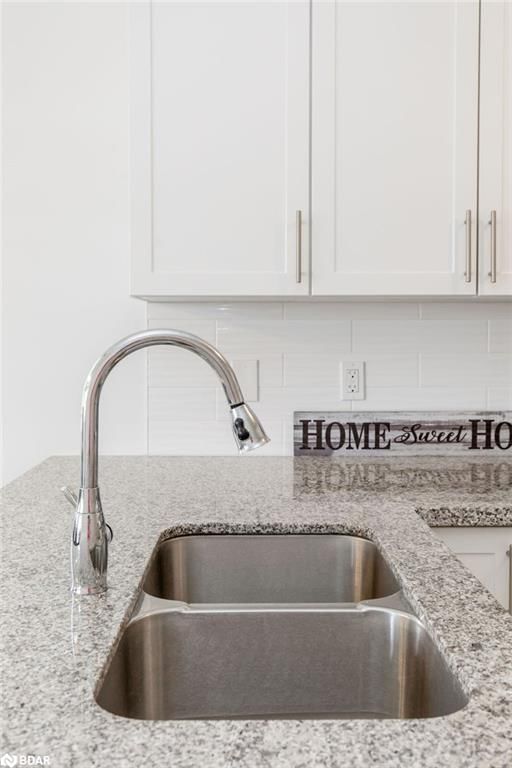
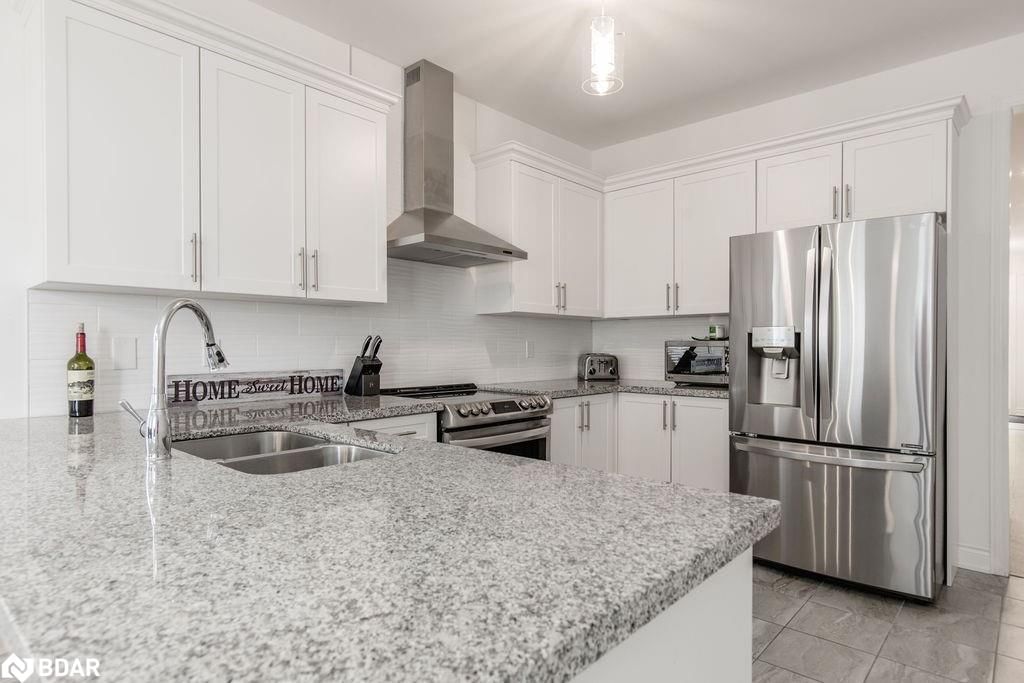
Kitchen
Breakfast Room
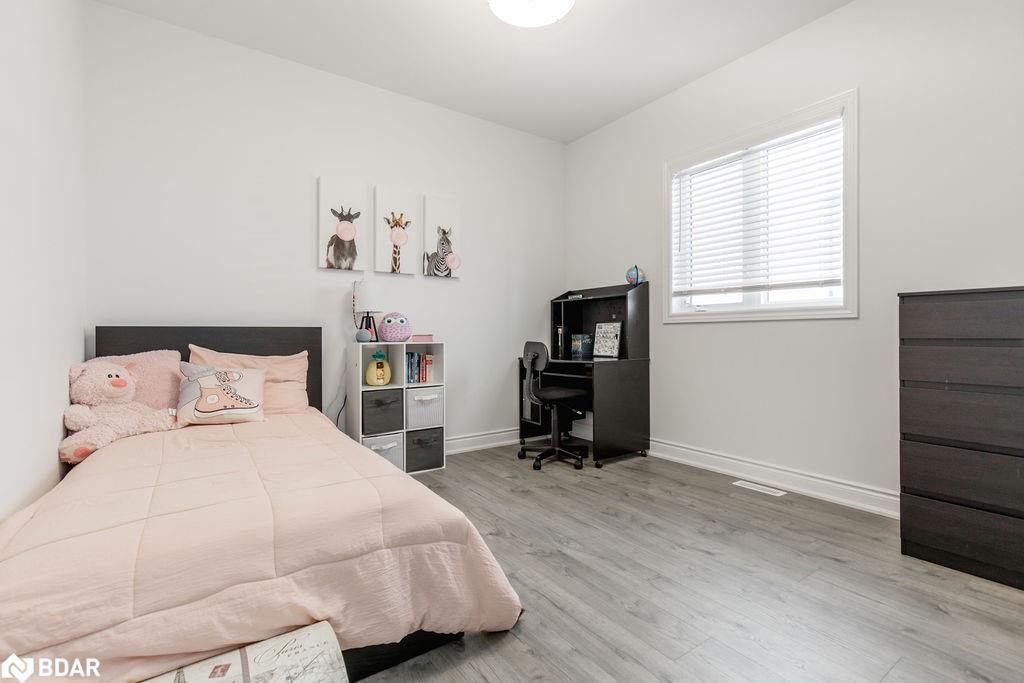
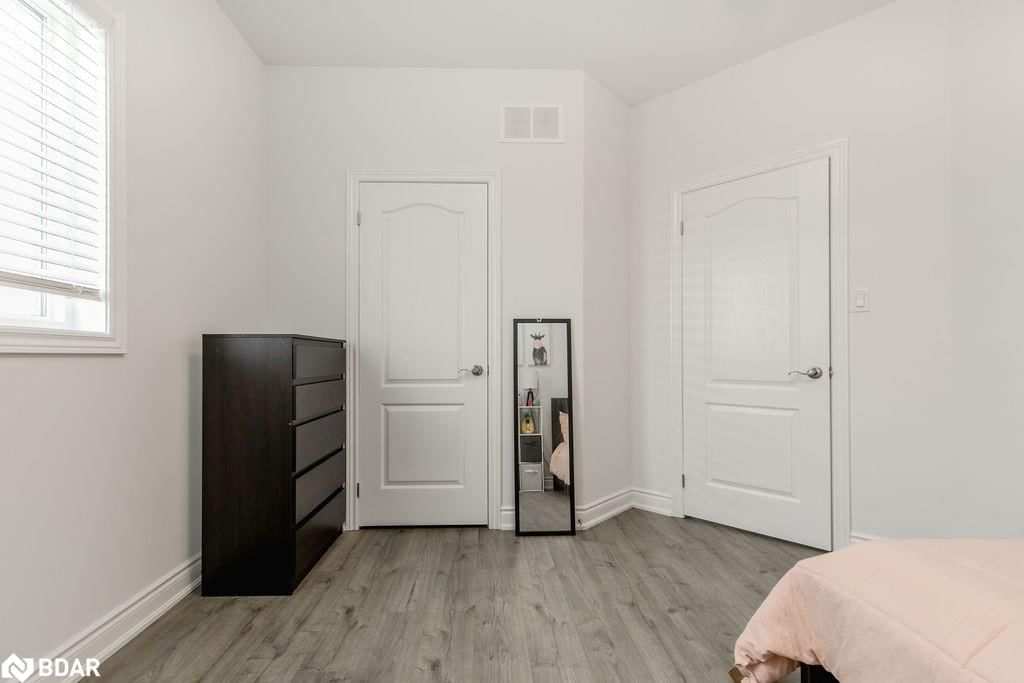
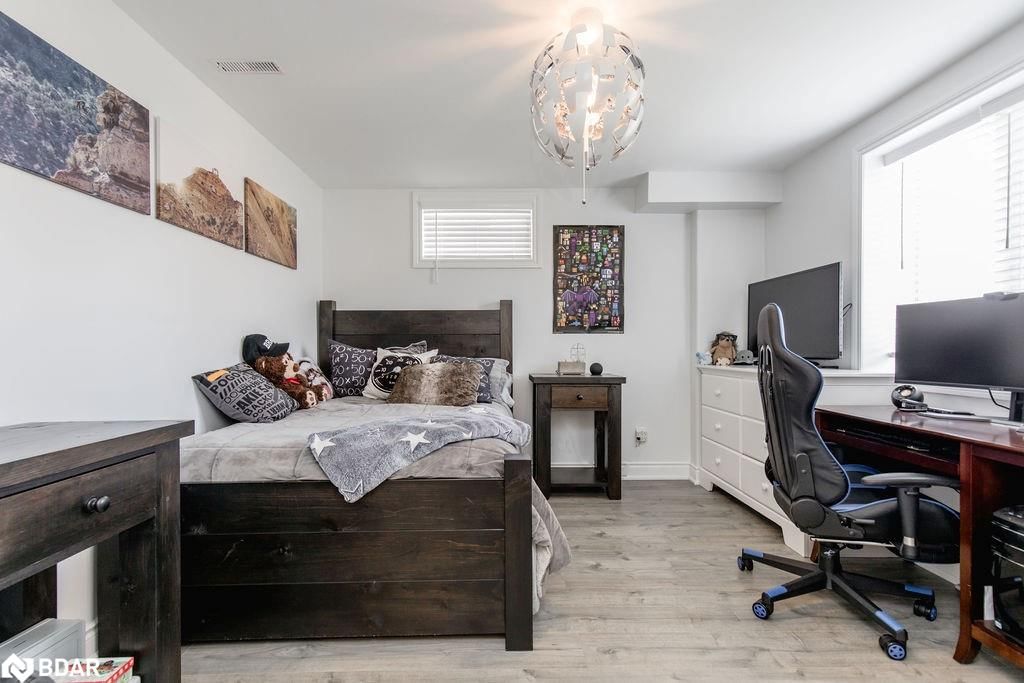
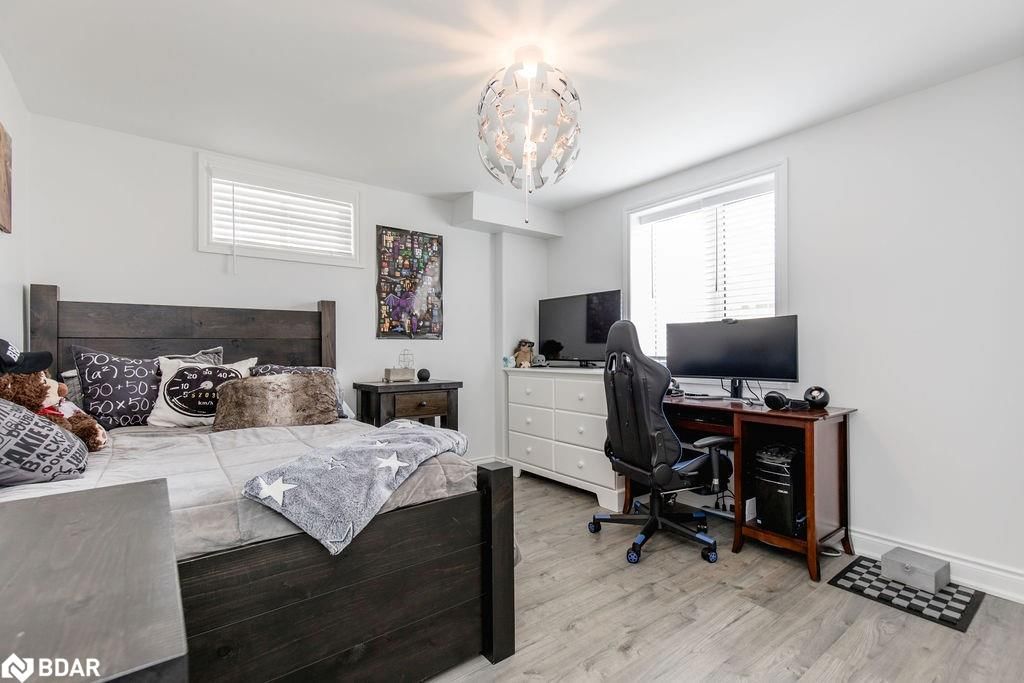
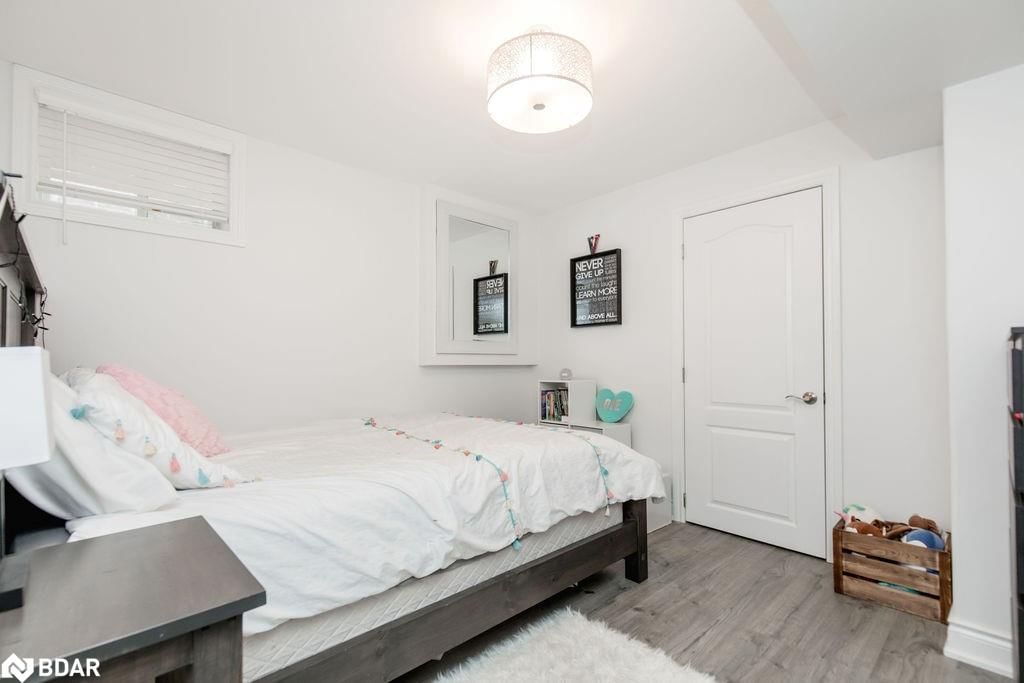
Bedroom
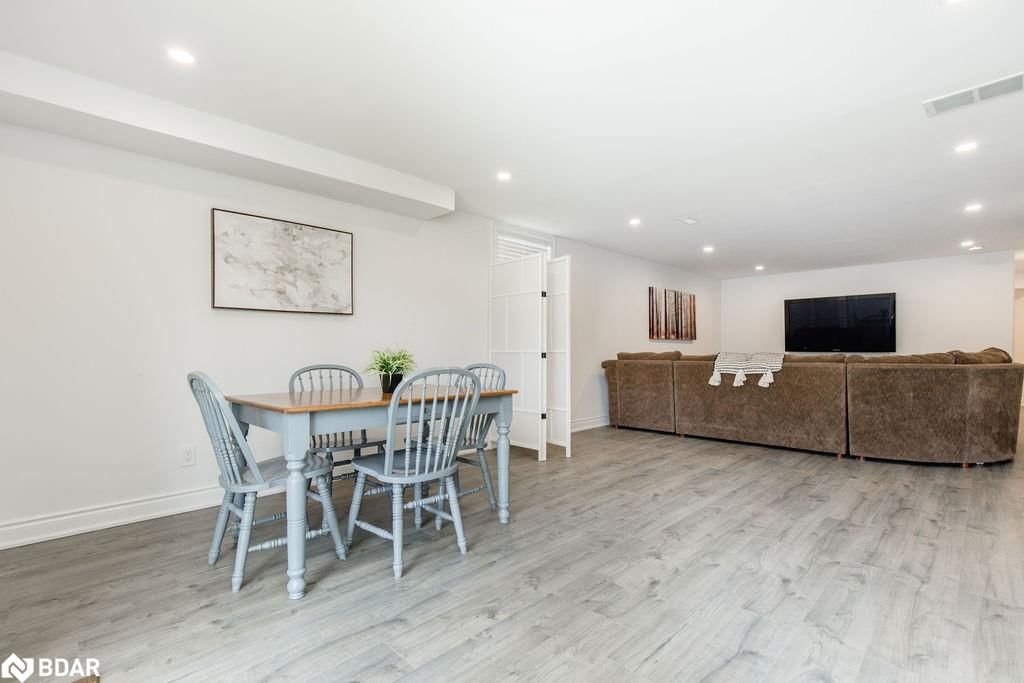
Family Room
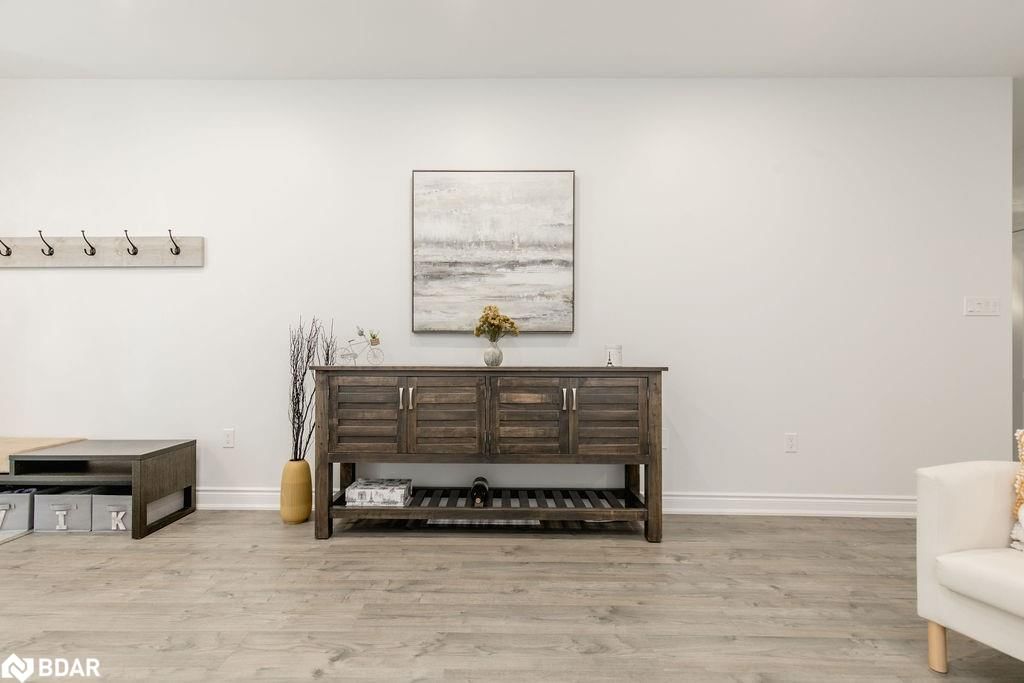
Living Room
Bedroom Primary
Bedroom
Gym
Recreation Room
Bedroom
The graph below compares the average list price and average sale price of homes in this neighborhood by month for the last 24 months. When average sale price is greater than average list price, this may suggest a buyer's market. When average sale price is lower than the average list price this may suggest a seller's market.
The graph below illustrates the average days on market for homes in this neighborhood. The yellow area may indicate a buyer's market, the green area may indicate a balanced market and the red area may indicate a seller's market.
Sales Representative, Century 21 People’s Choice Realty Inc., Brokerage
(647) 576 - 2100