

Century 21 People’s Choice Realty Inc., Brokerage
120 MATHESON BLVD E #103
MISSISSAUGA, Ontario
L4Z 1X1


Orillia, North Ward, L3V 8J6
$599,900$000000
Listed by RE/MAX Hallmark Chay Realty Brokerage.
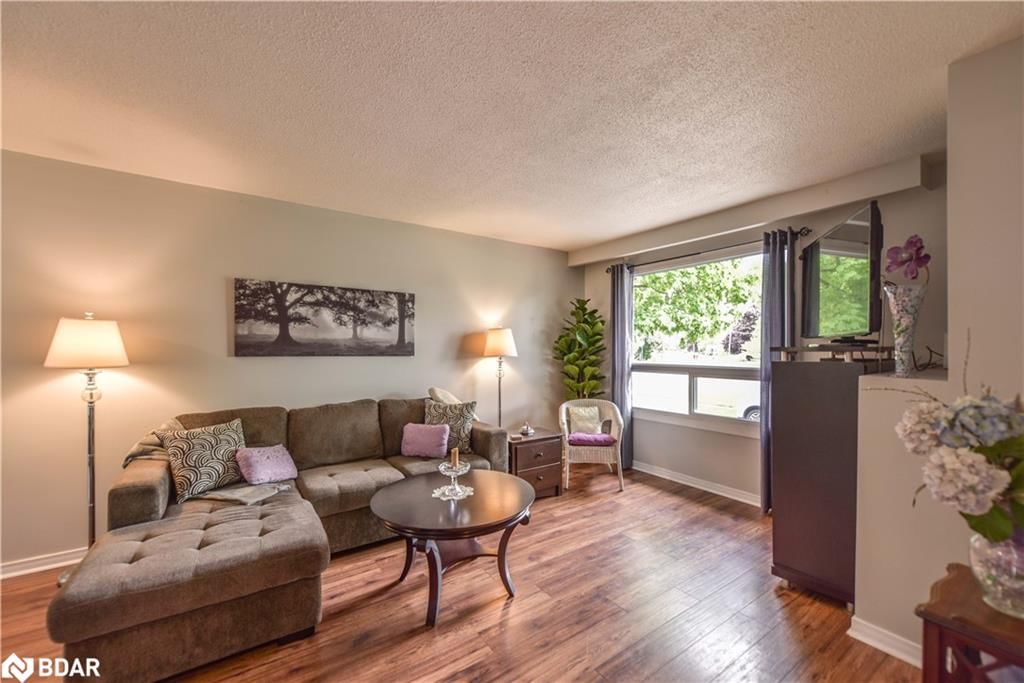
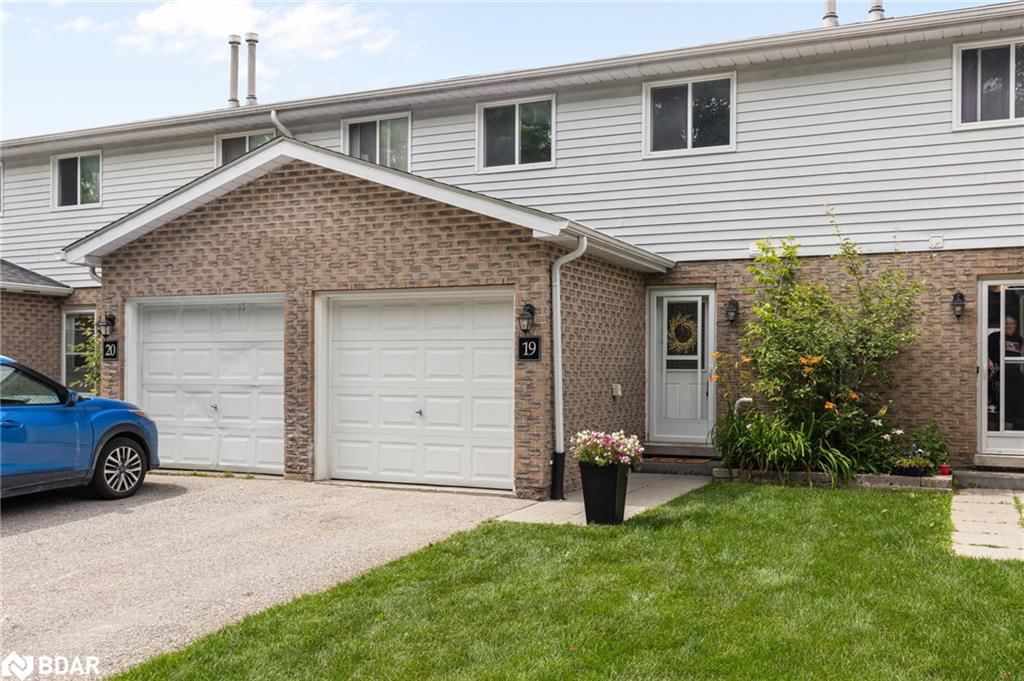
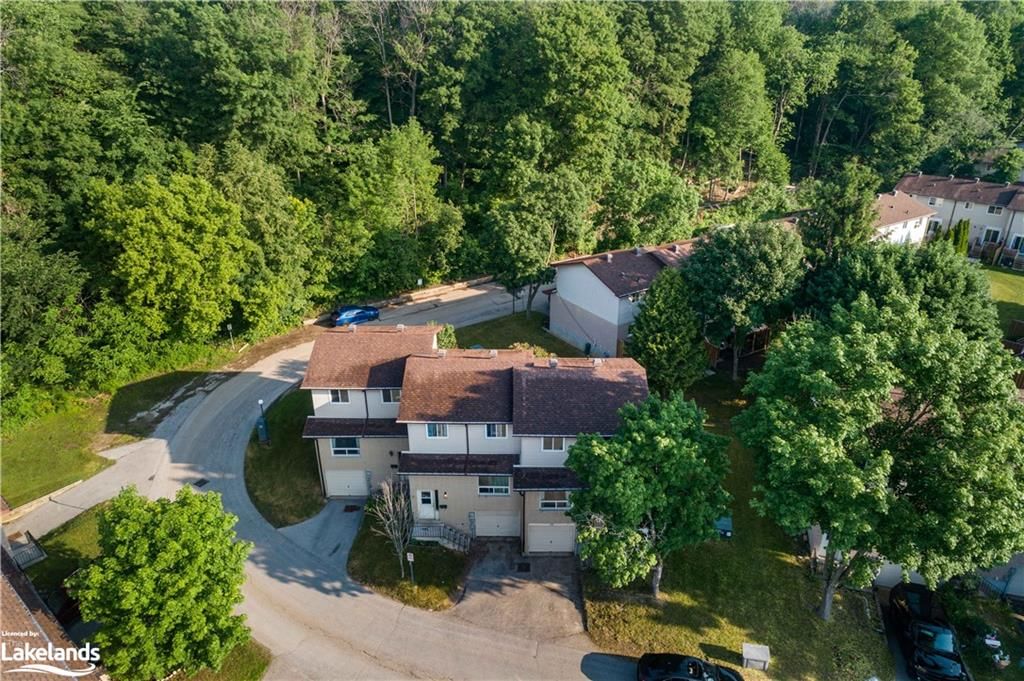
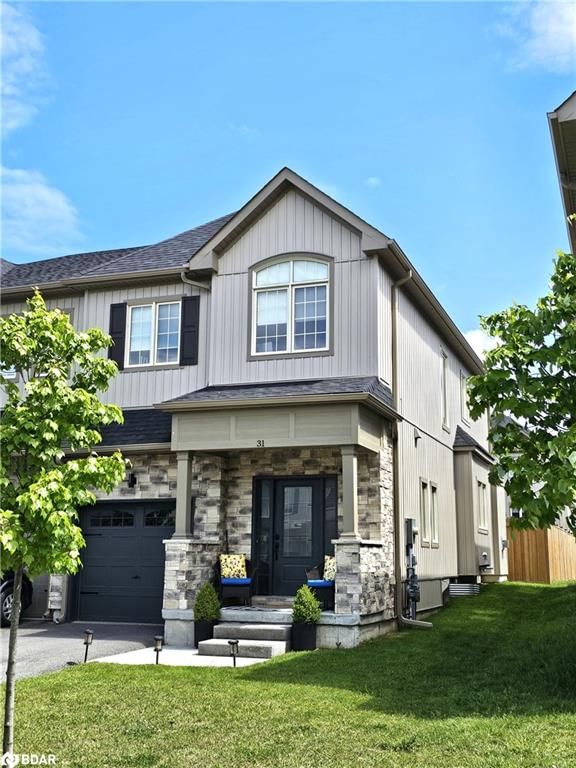
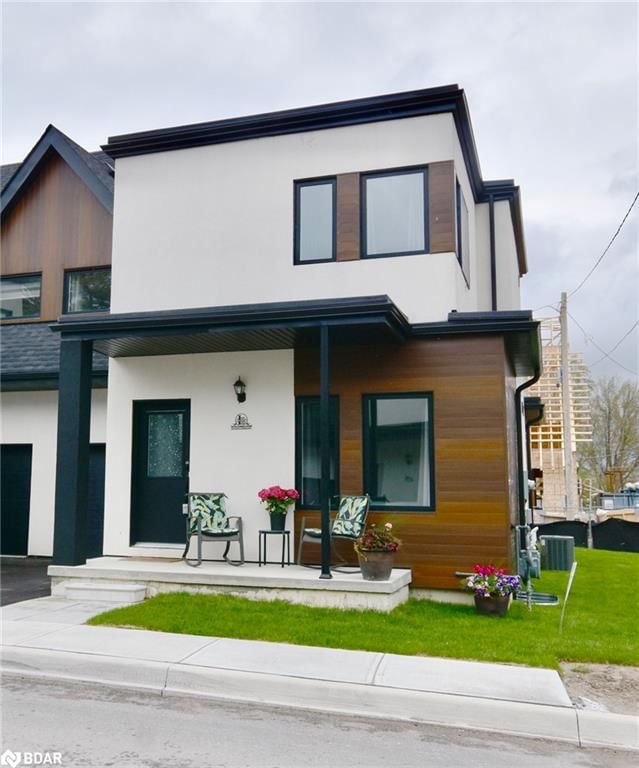
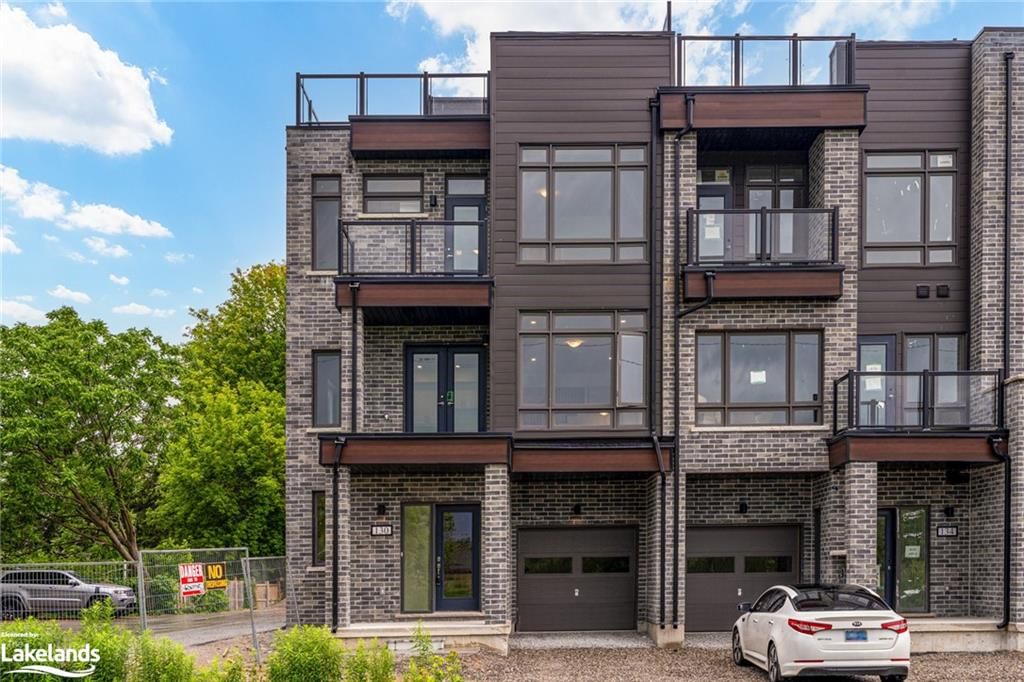
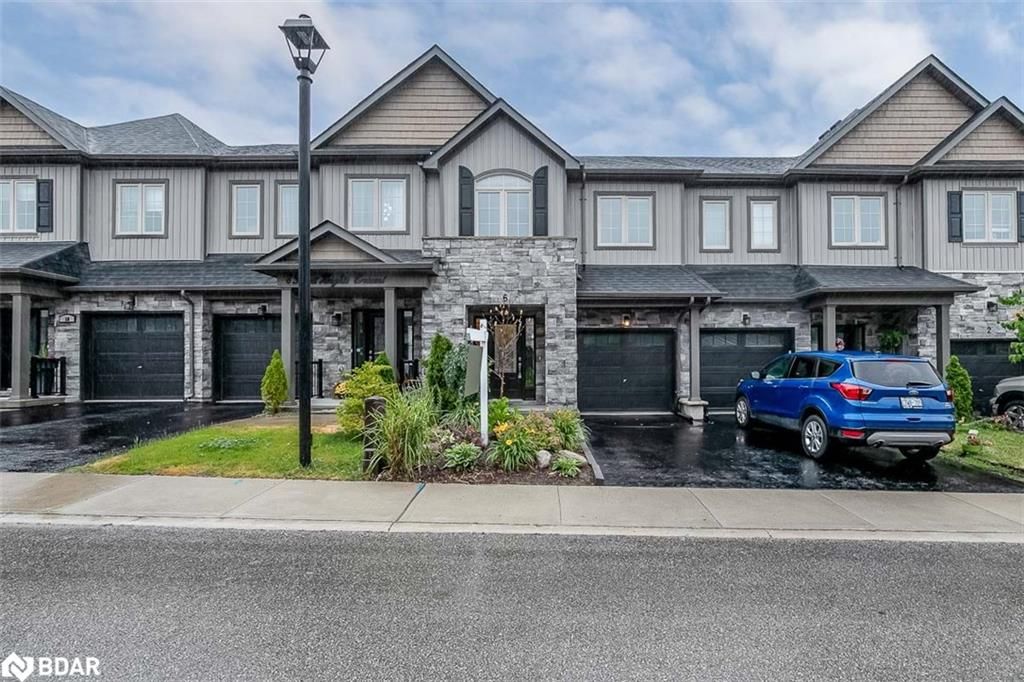
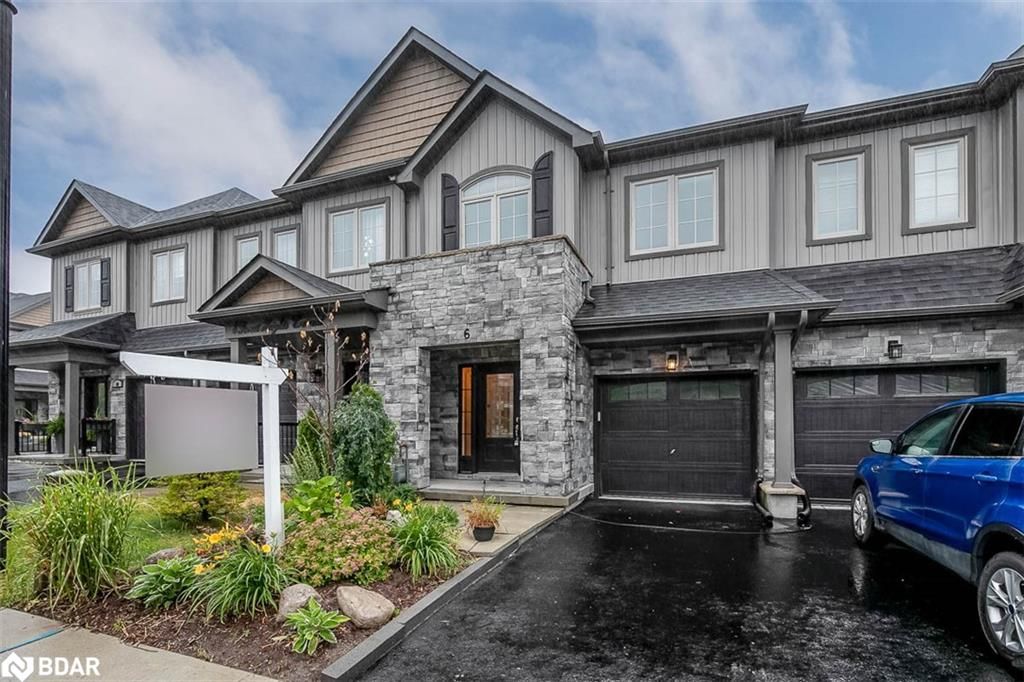
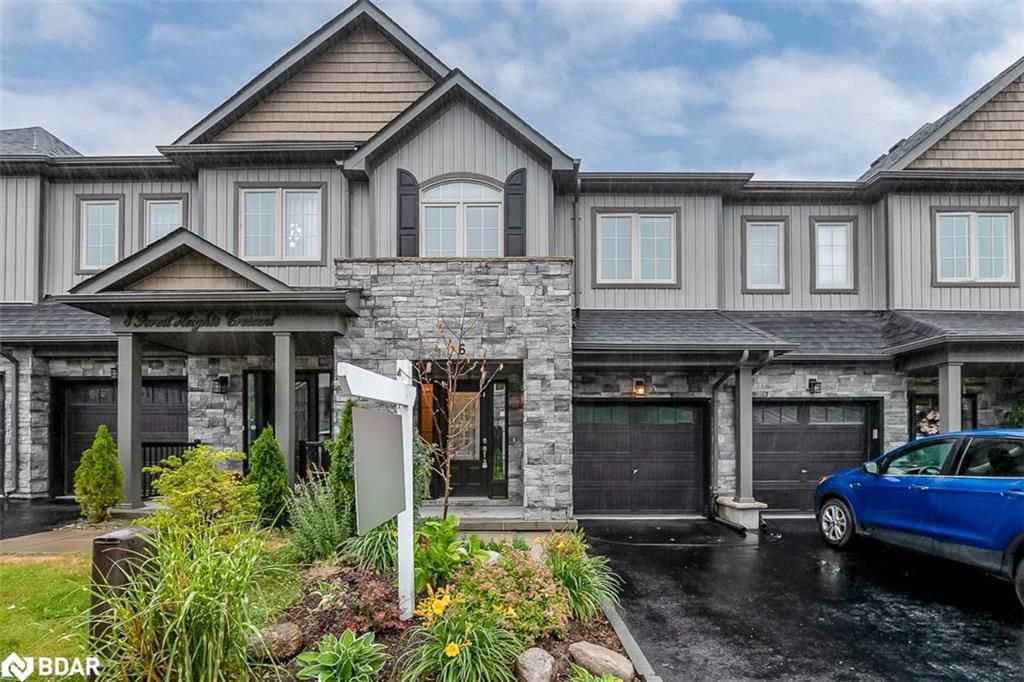
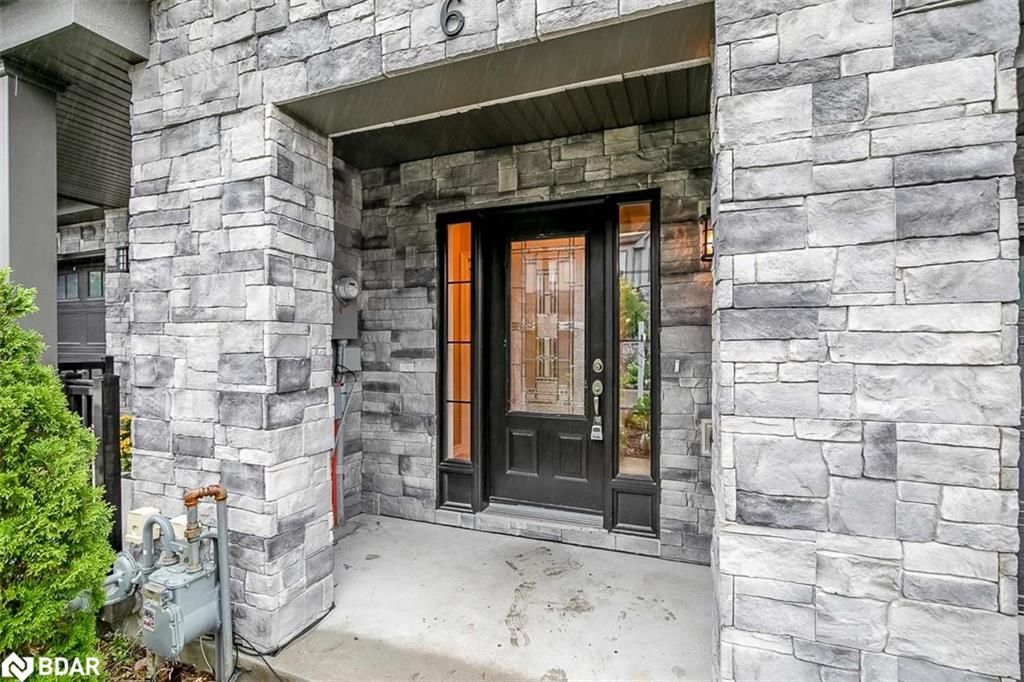
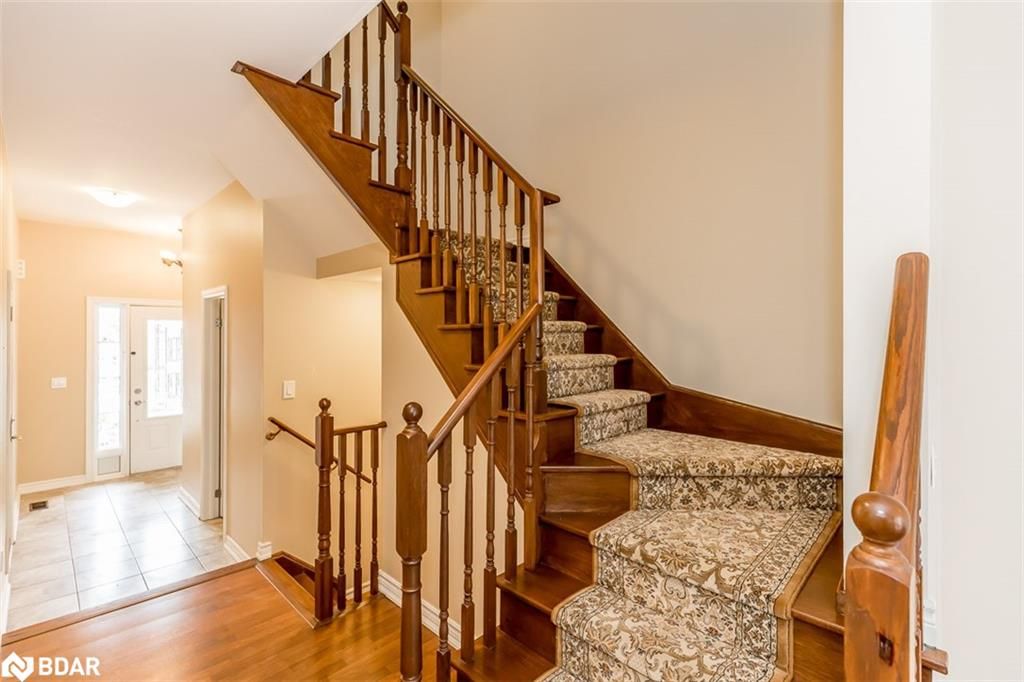
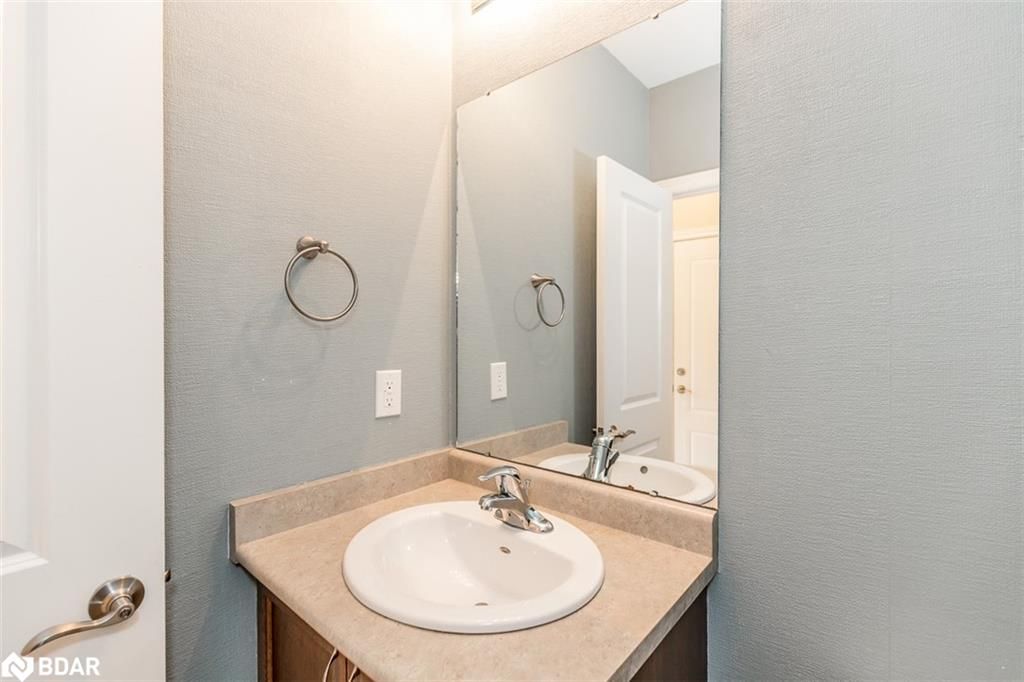
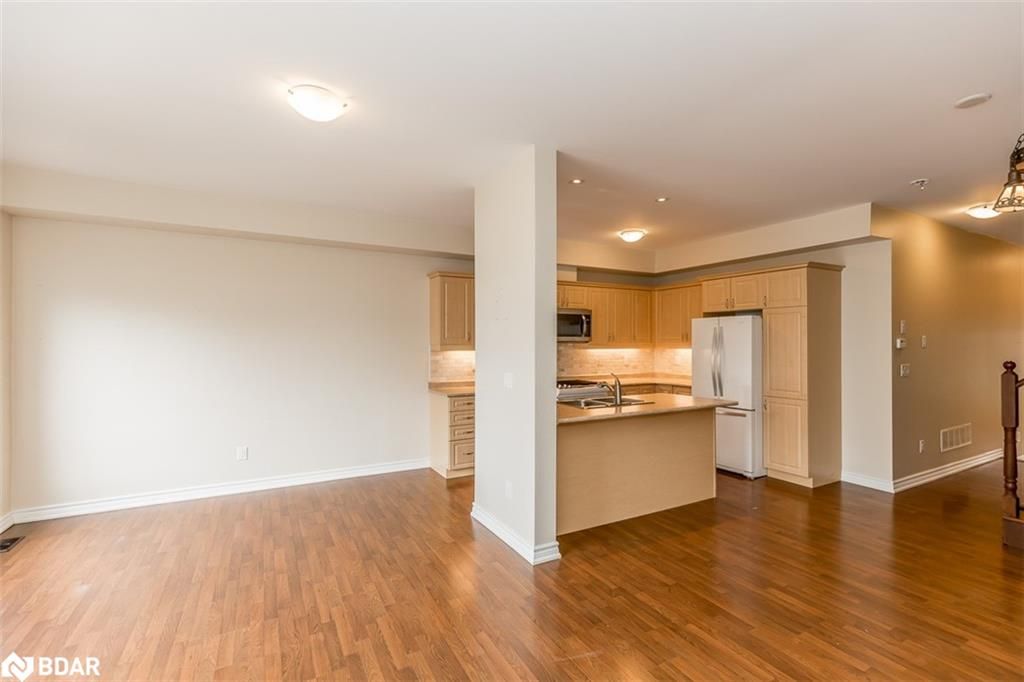
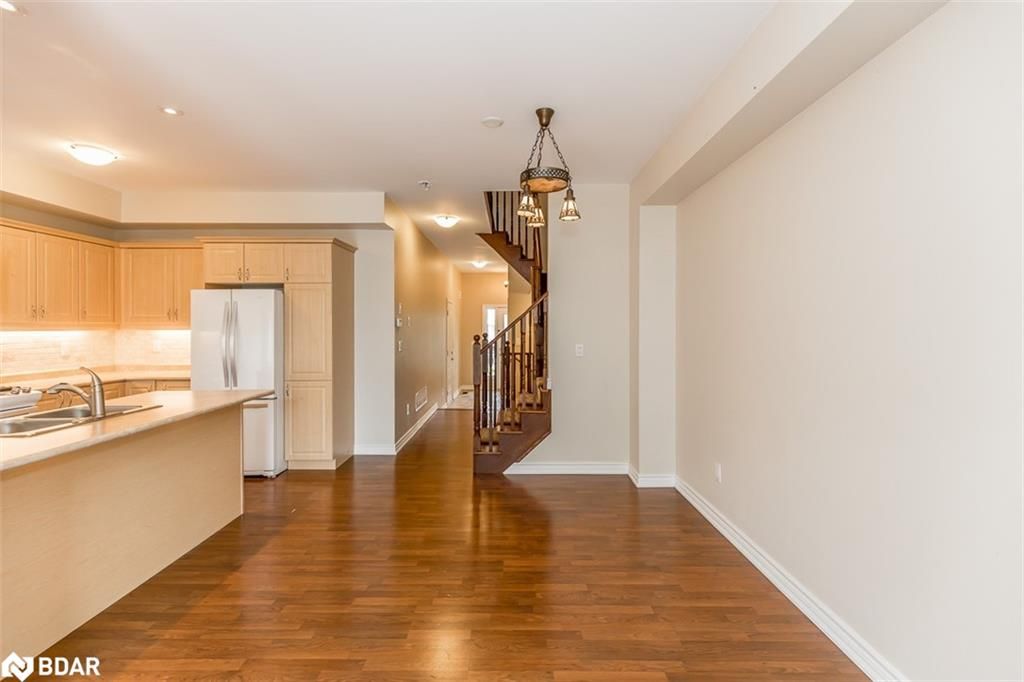
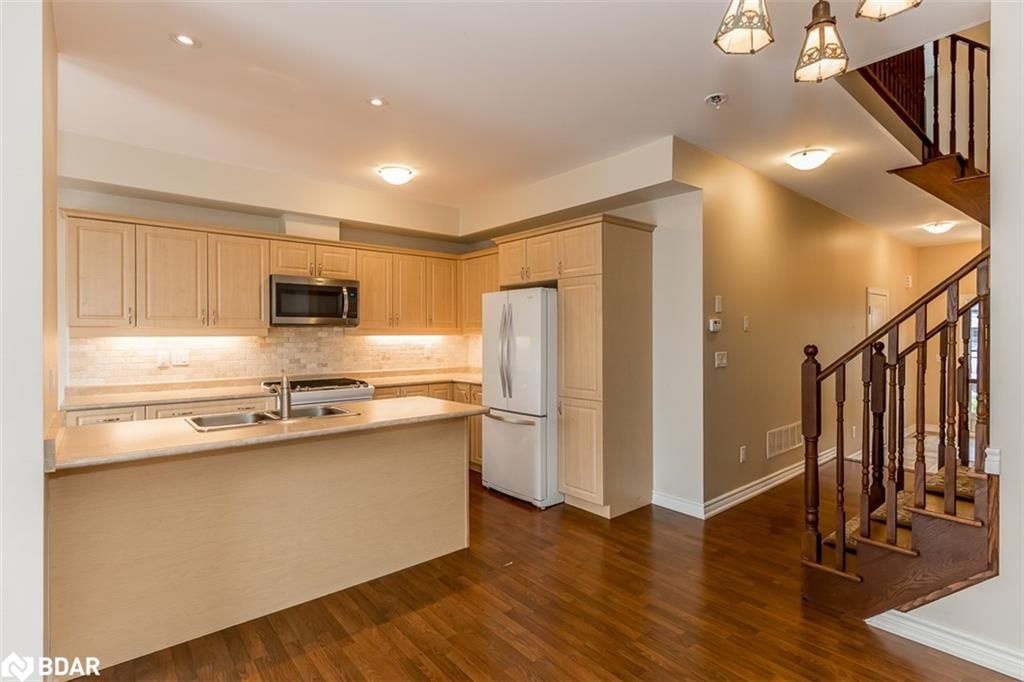
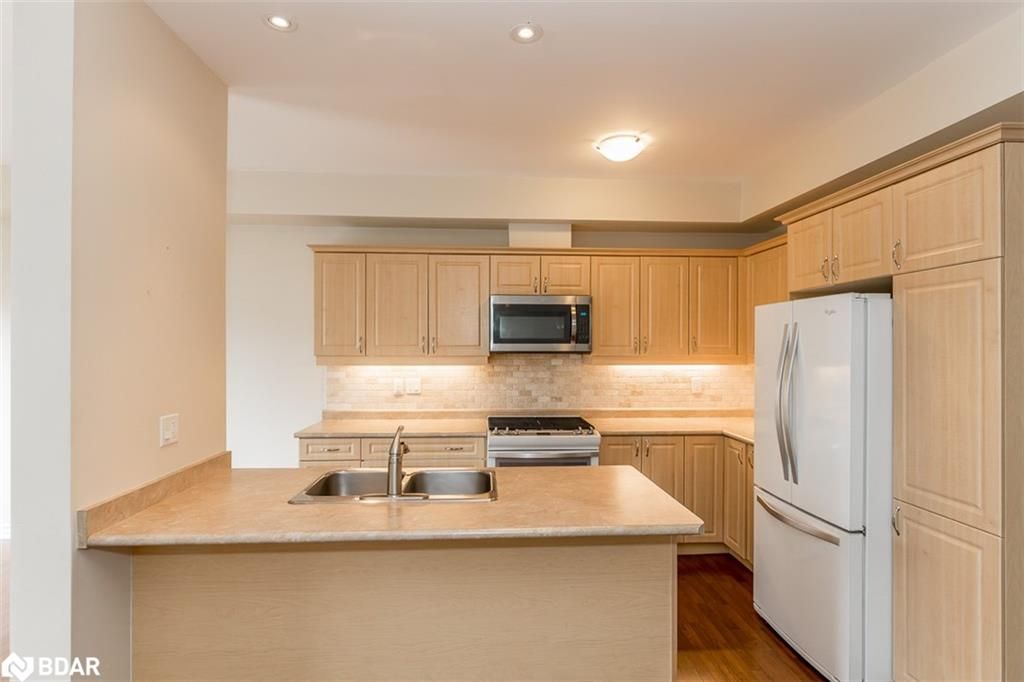
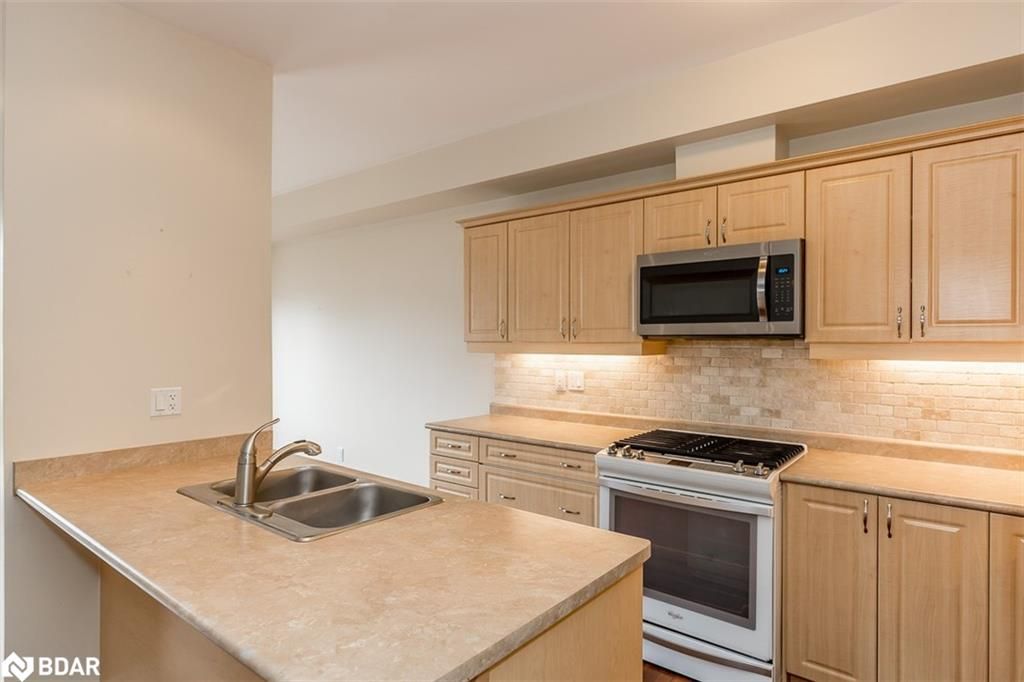
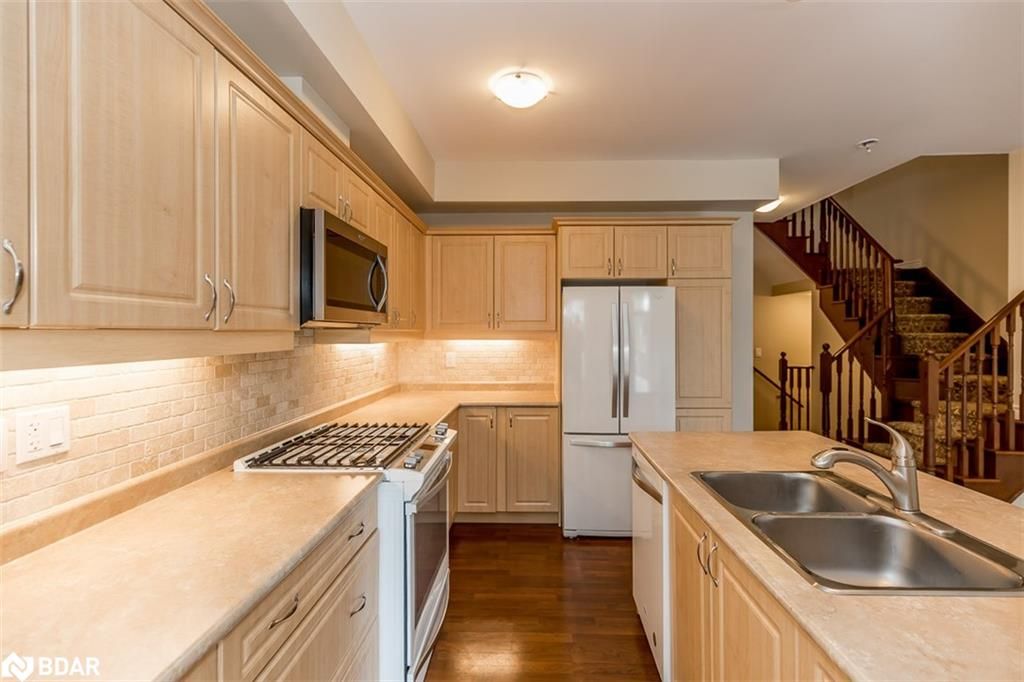
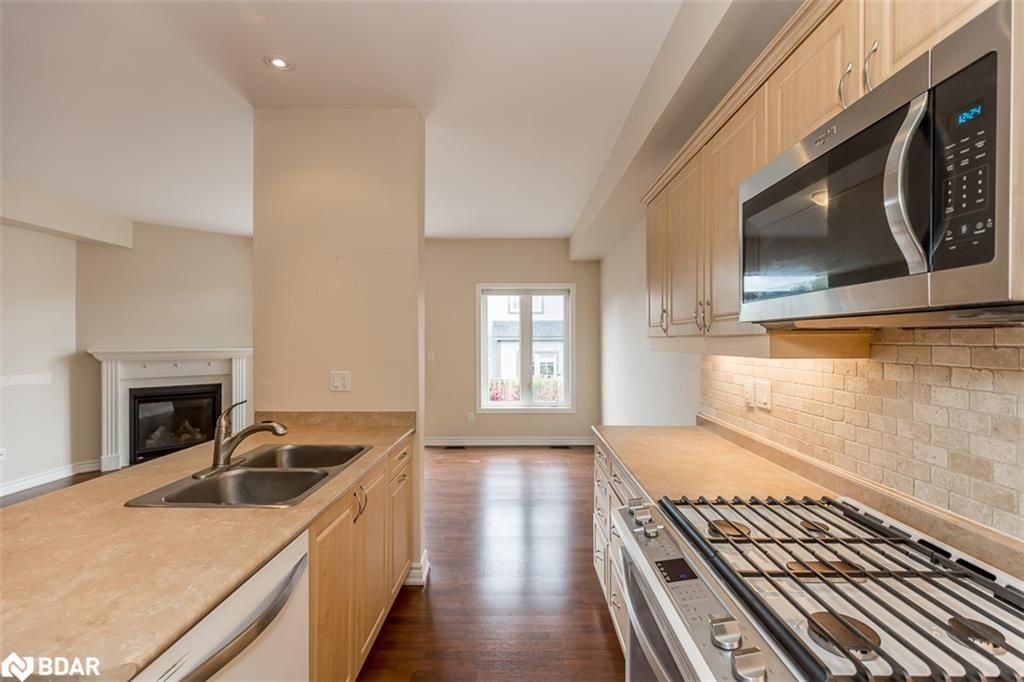
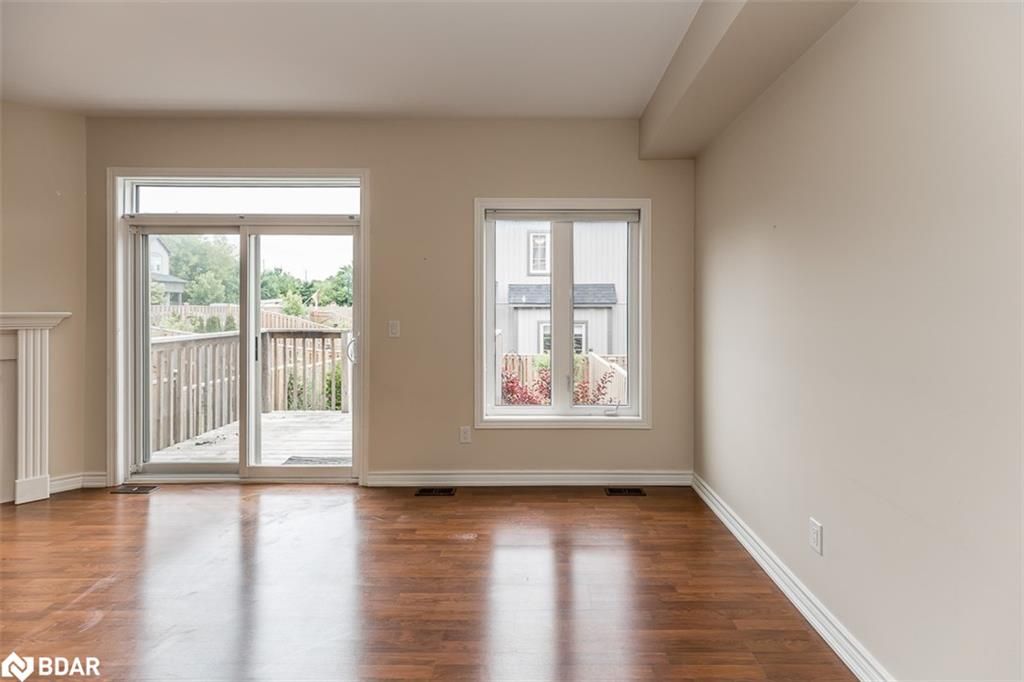
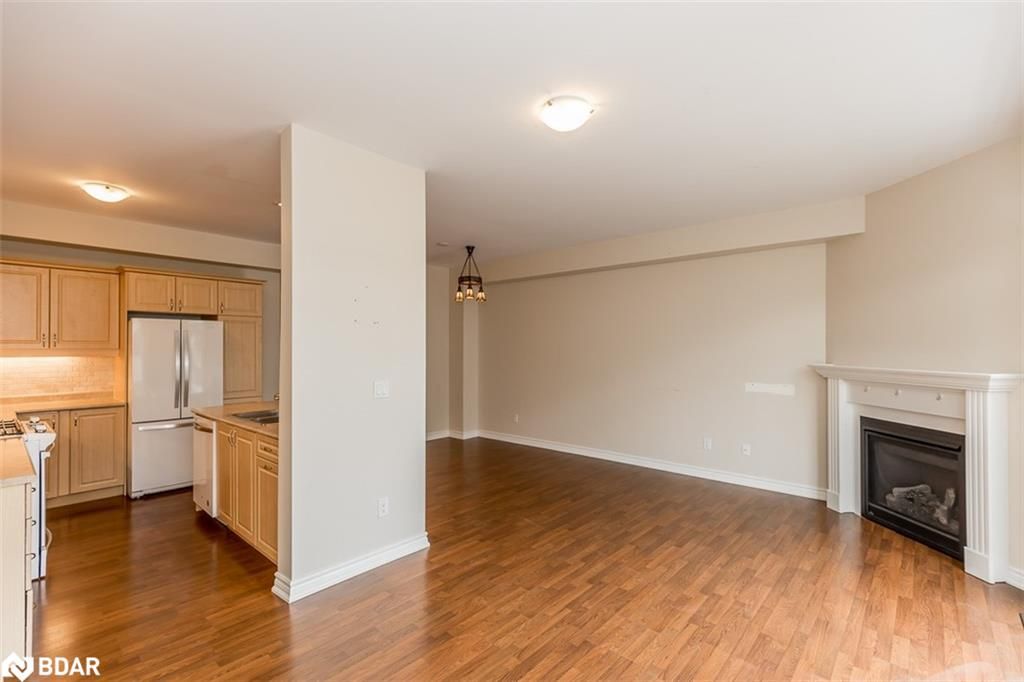
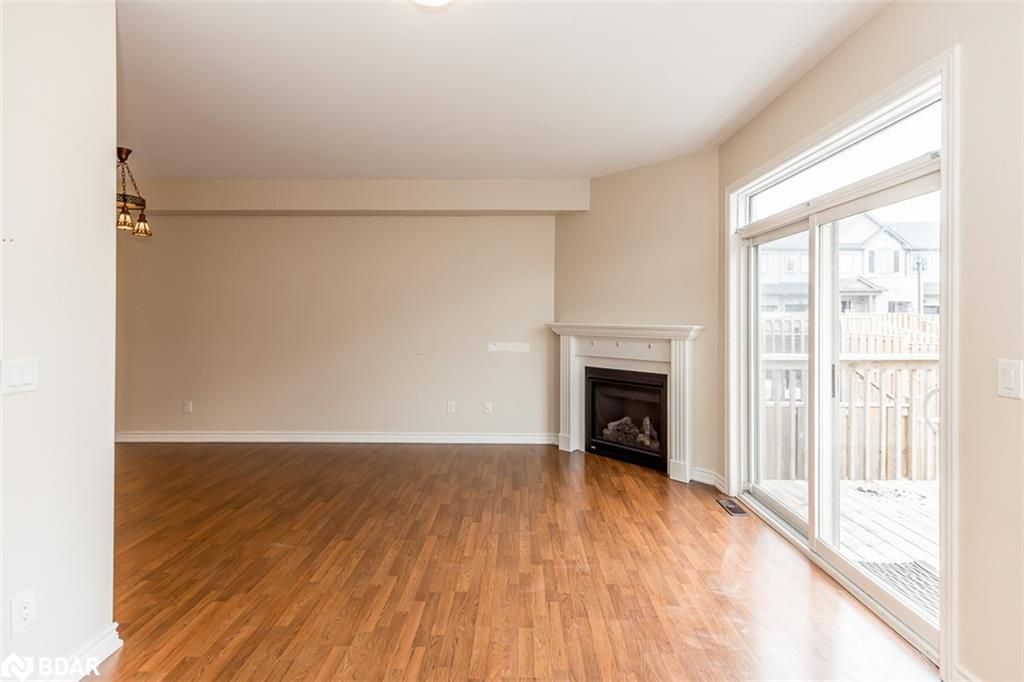
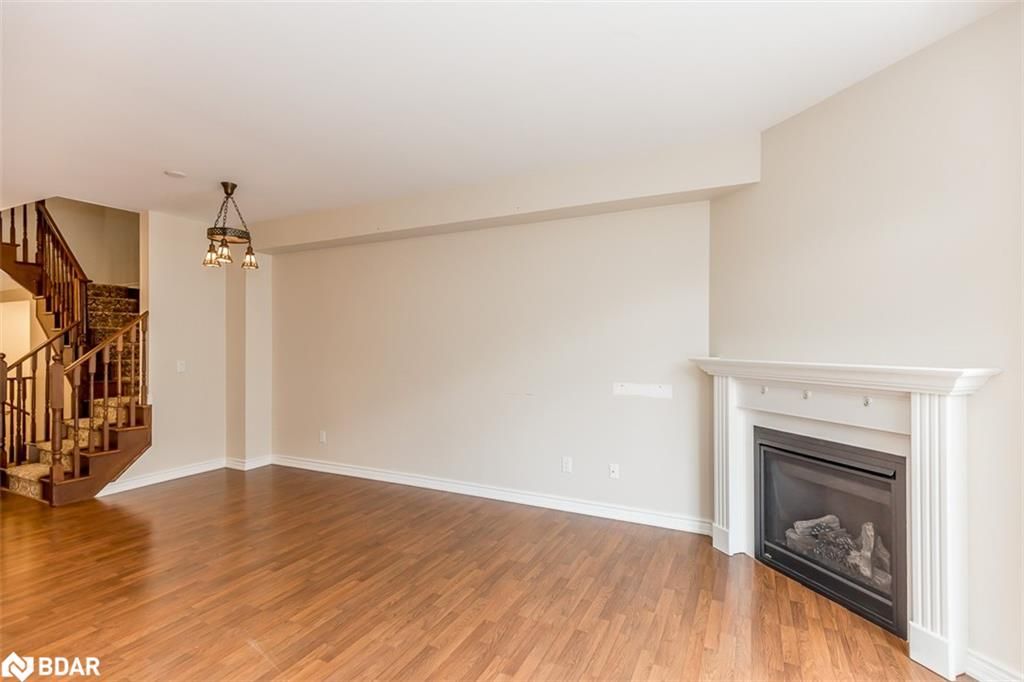
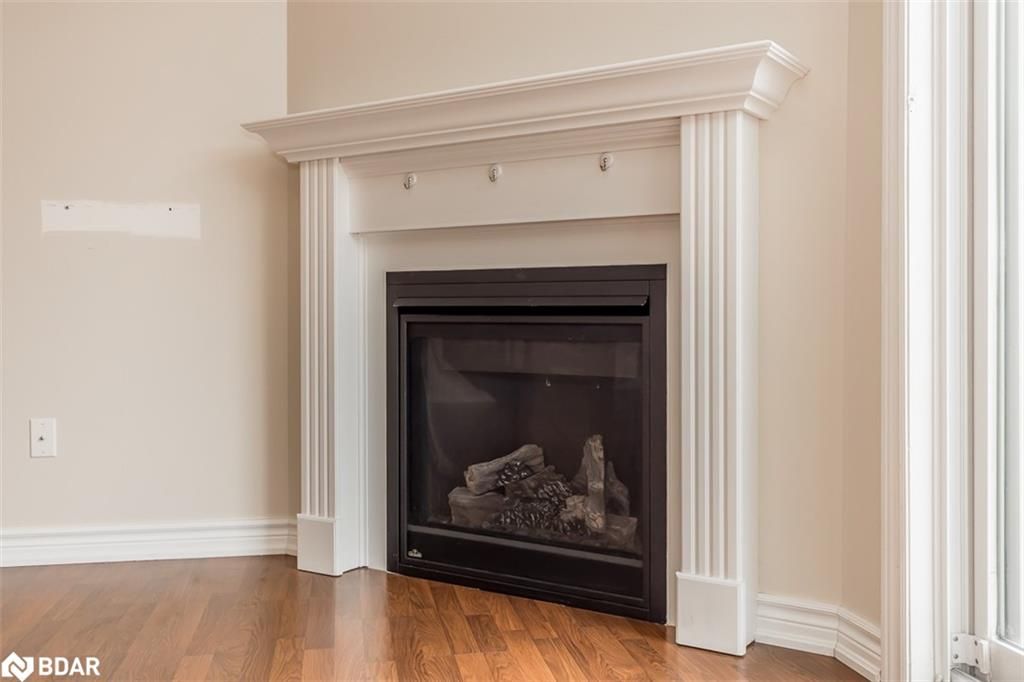
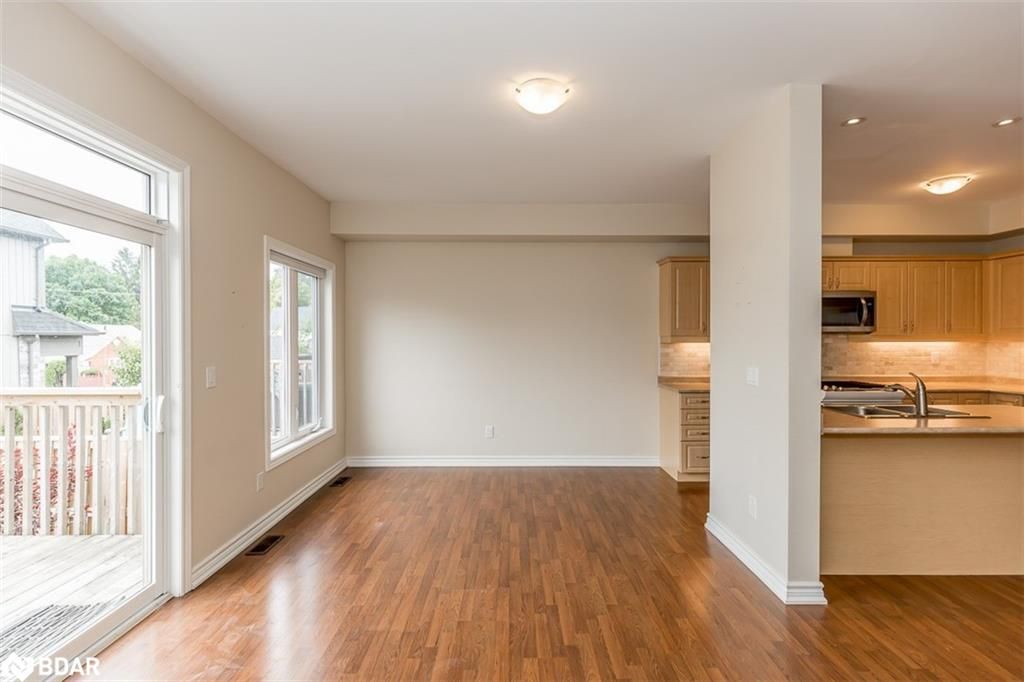
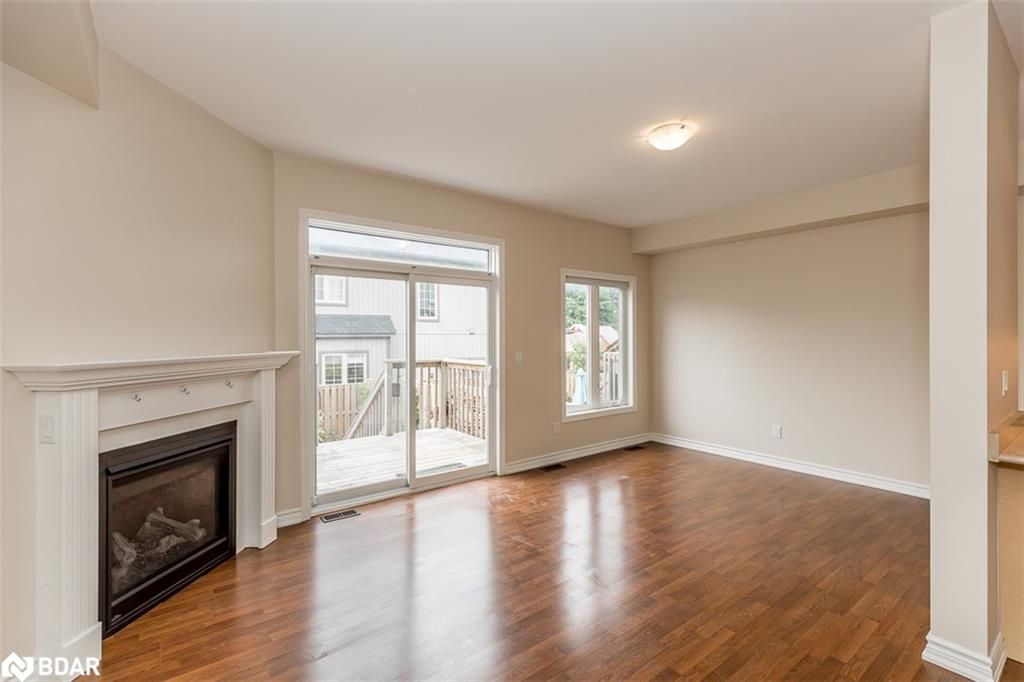
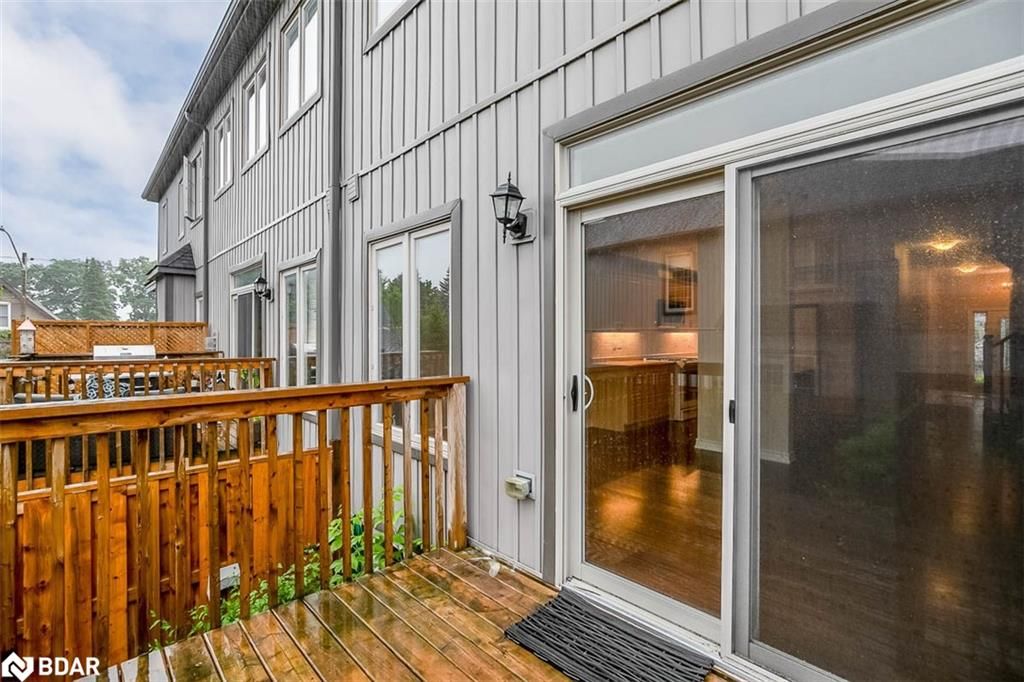
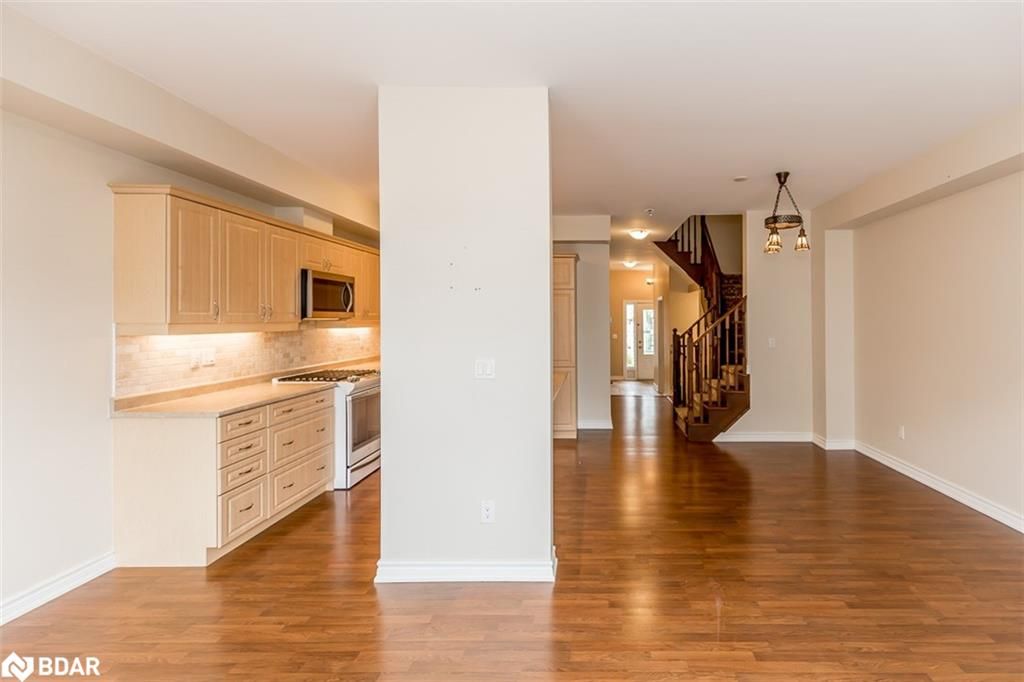
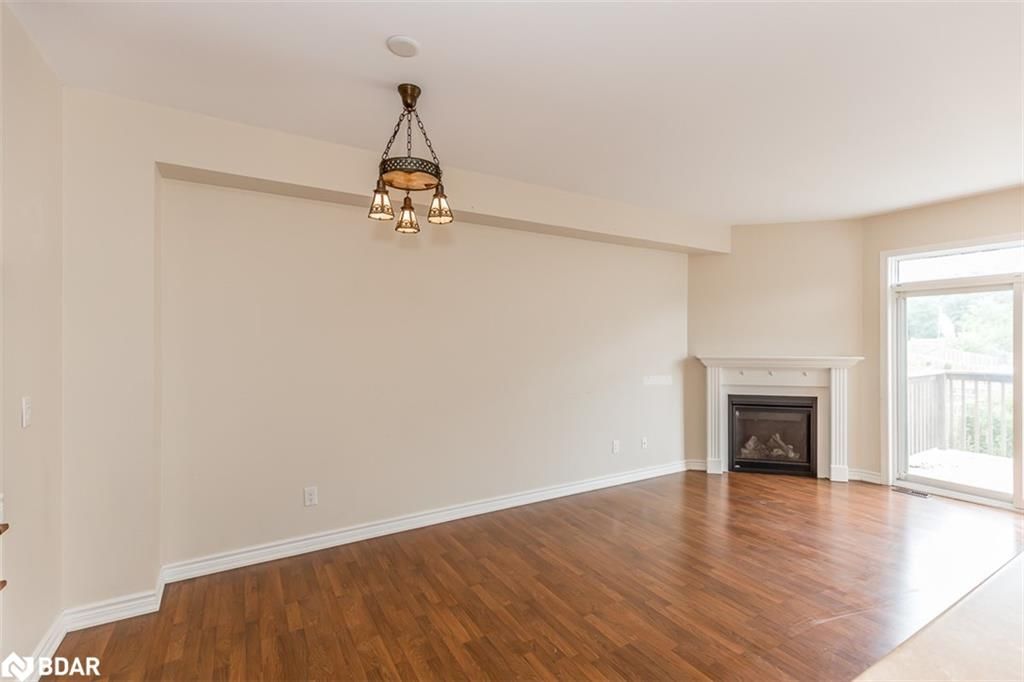
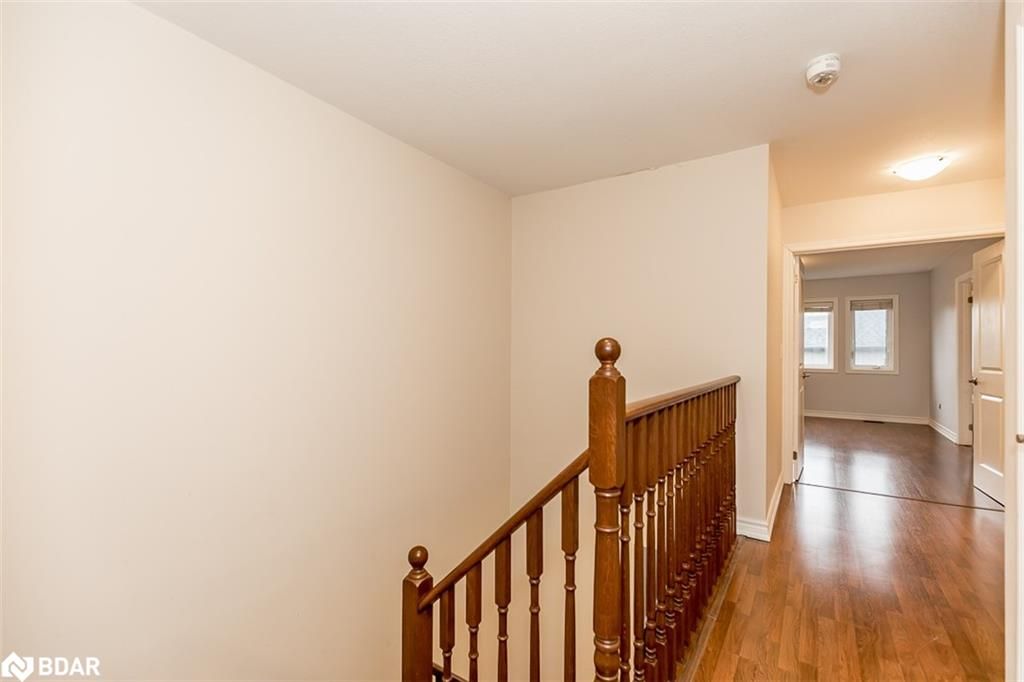
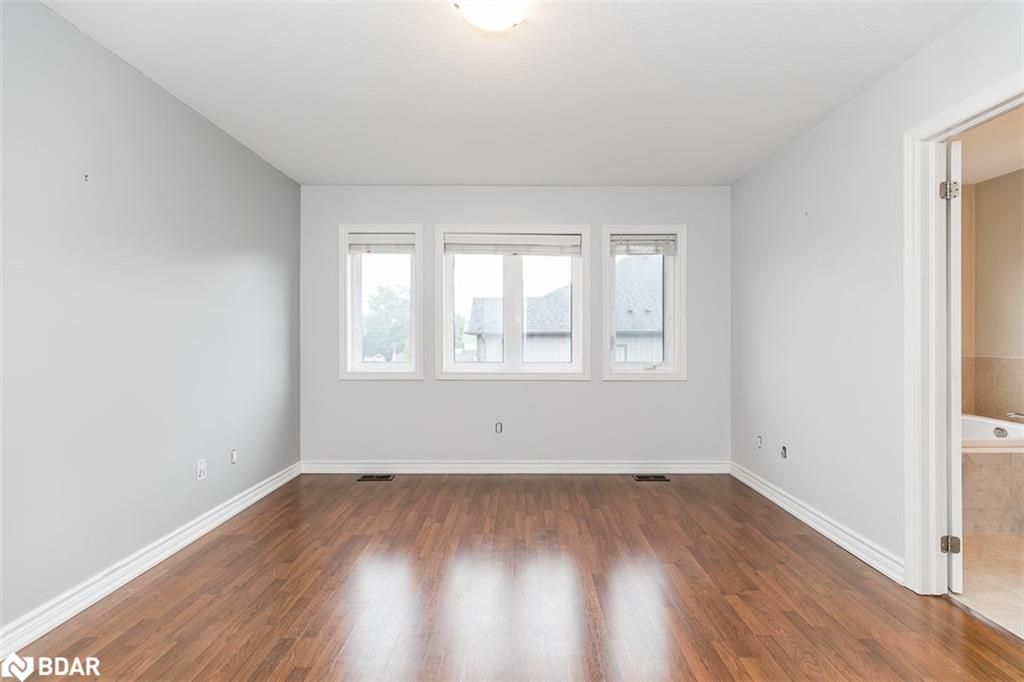
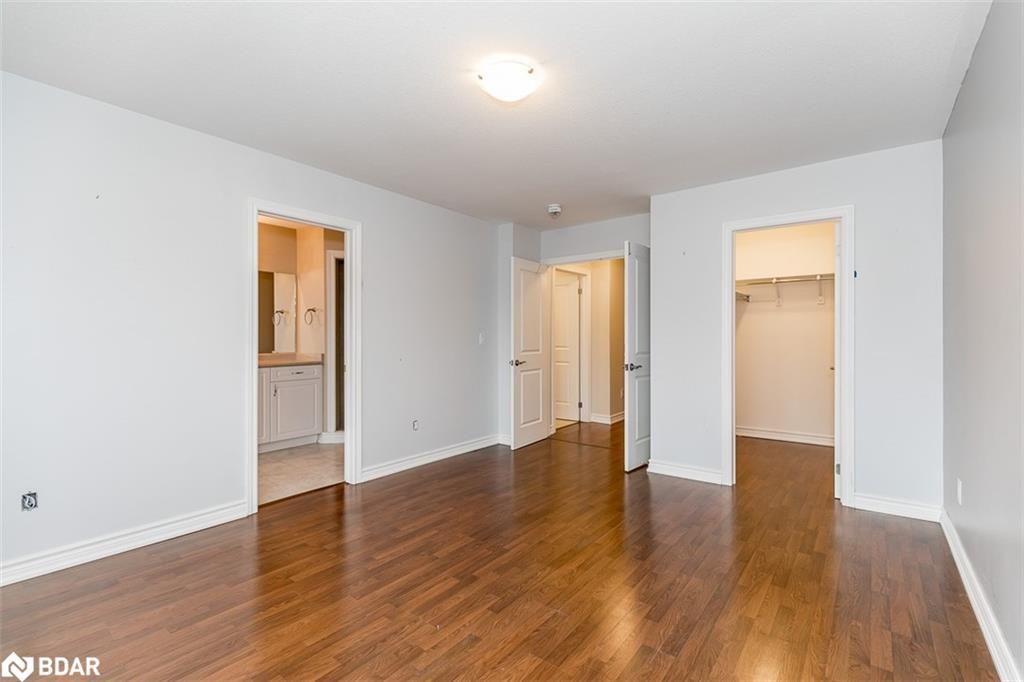
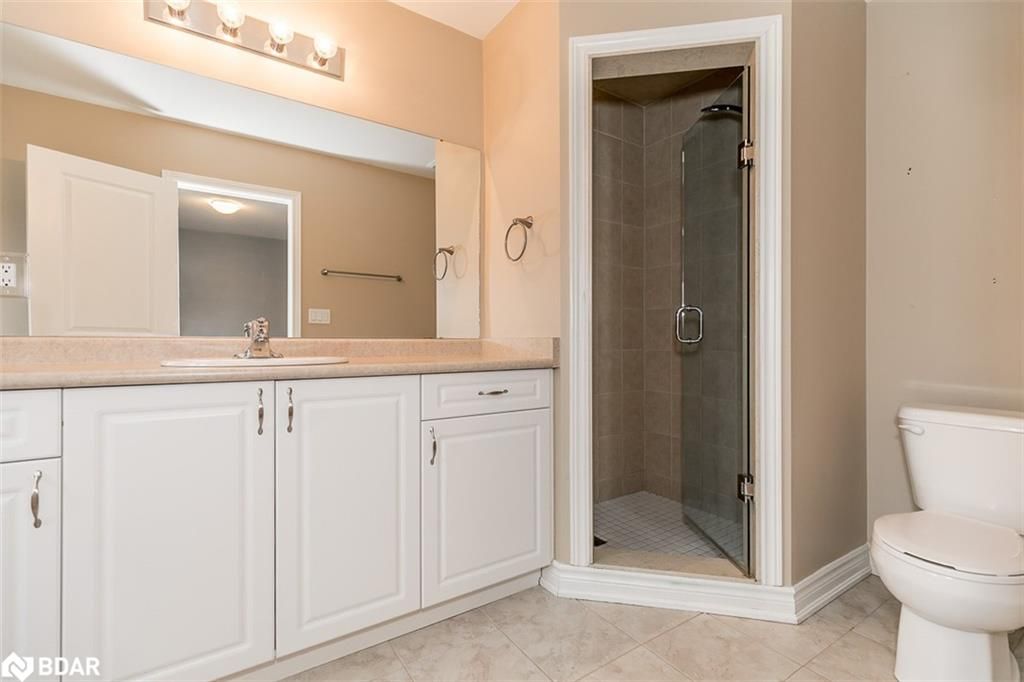
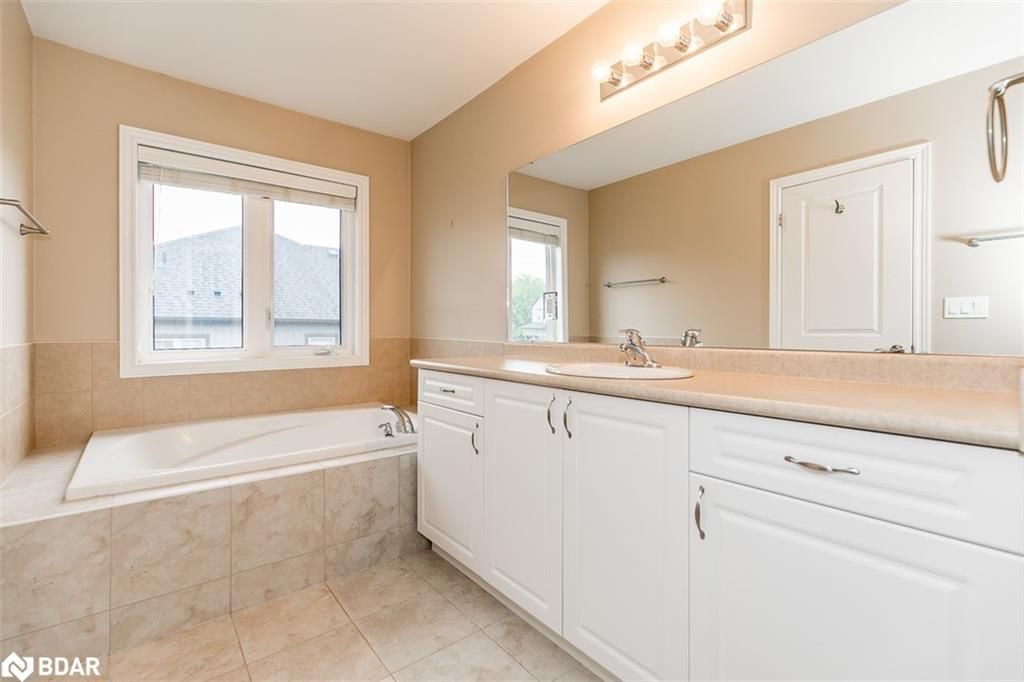
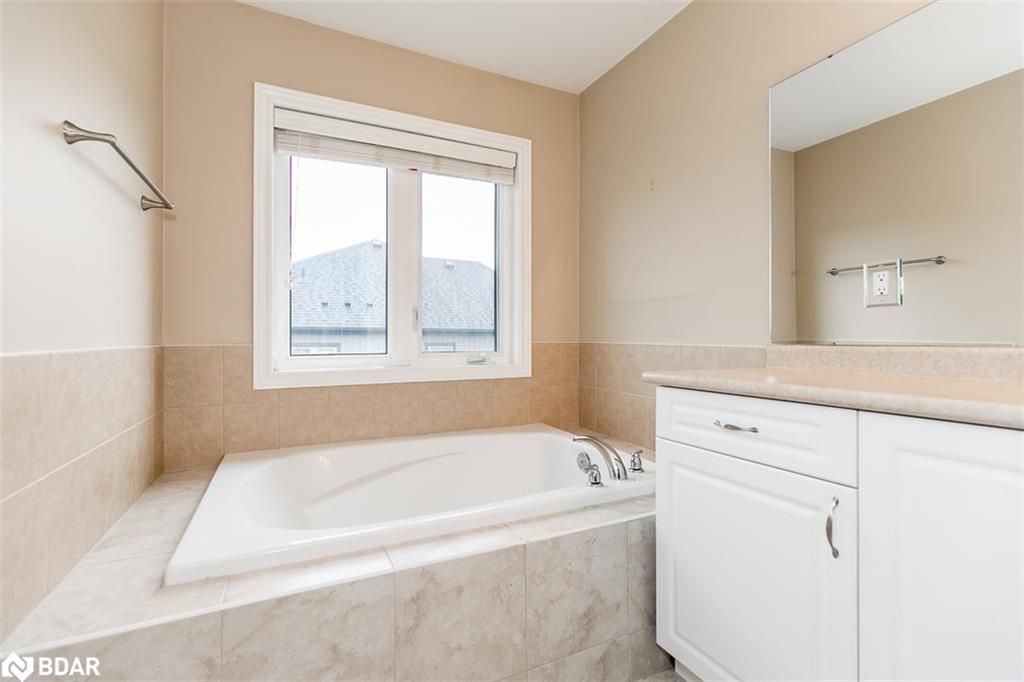
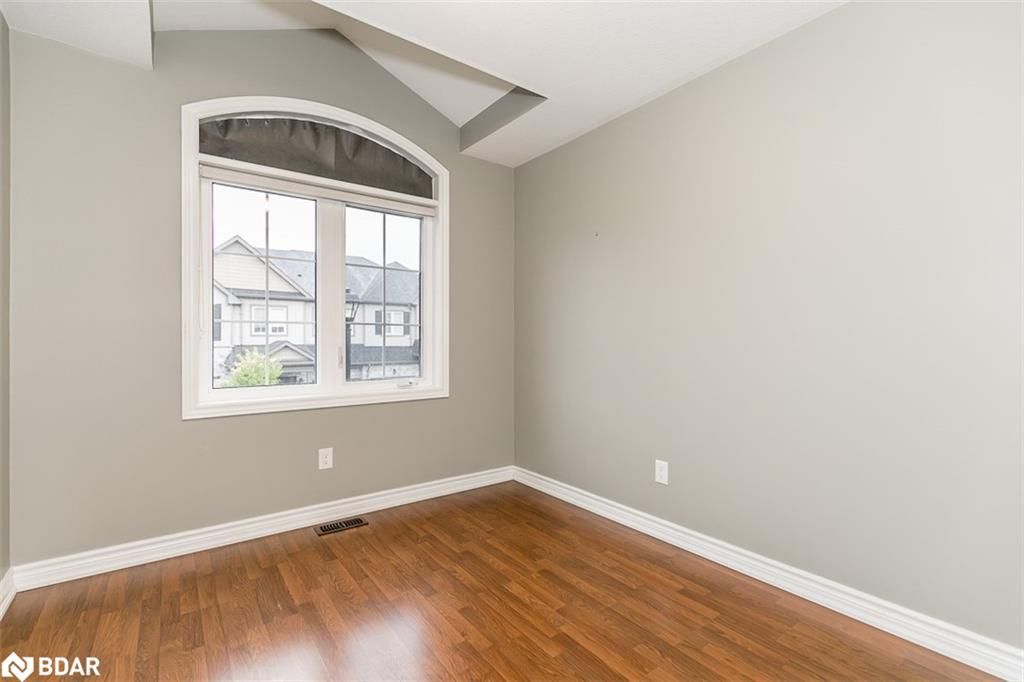
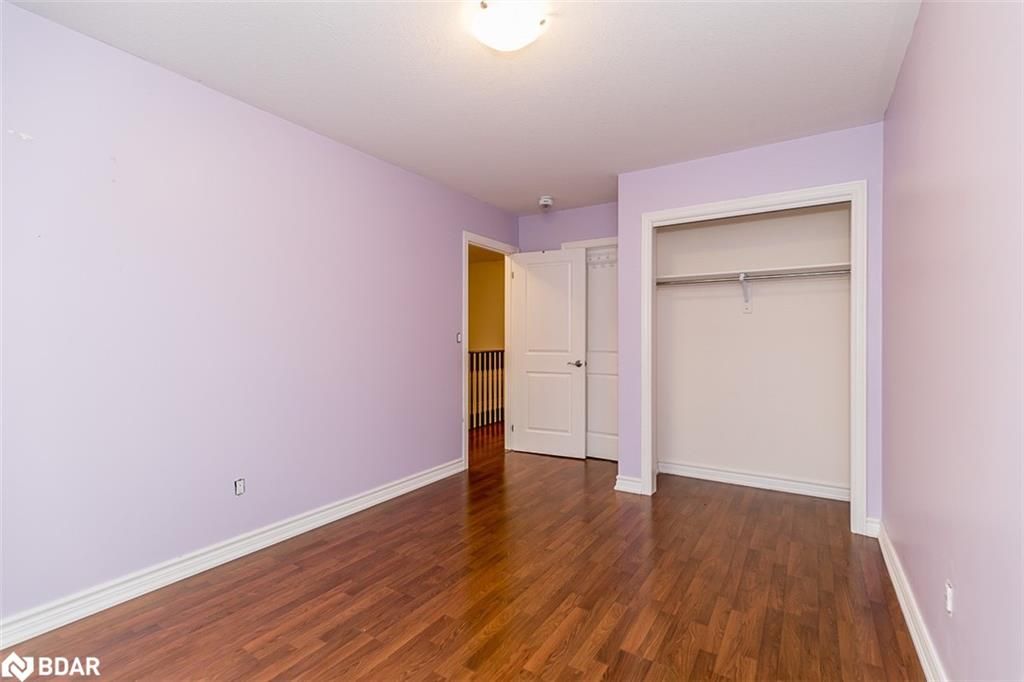
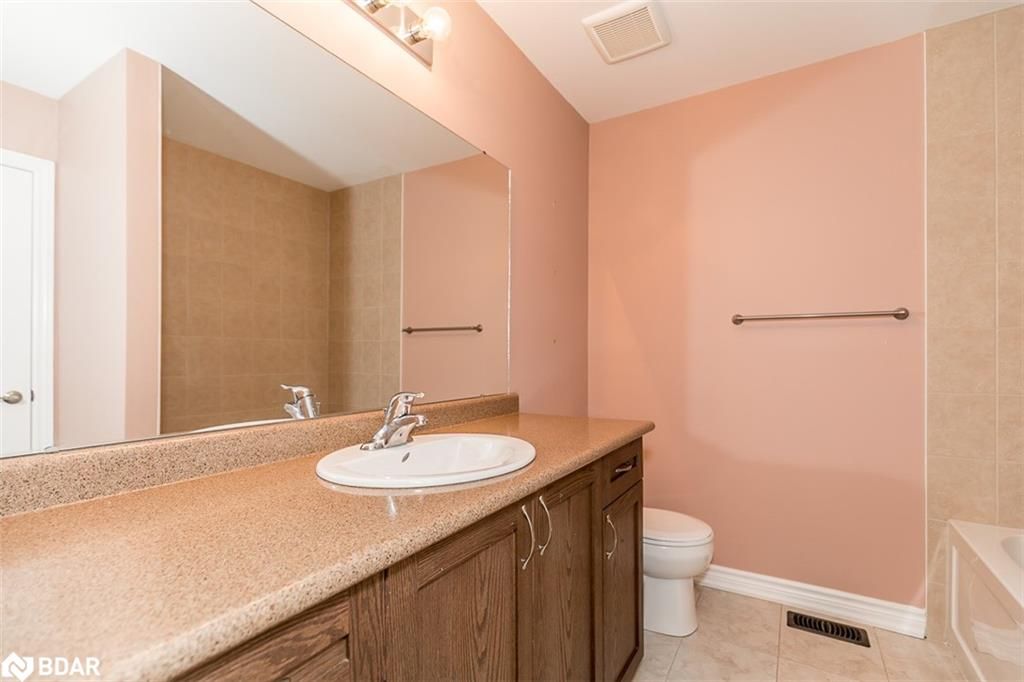
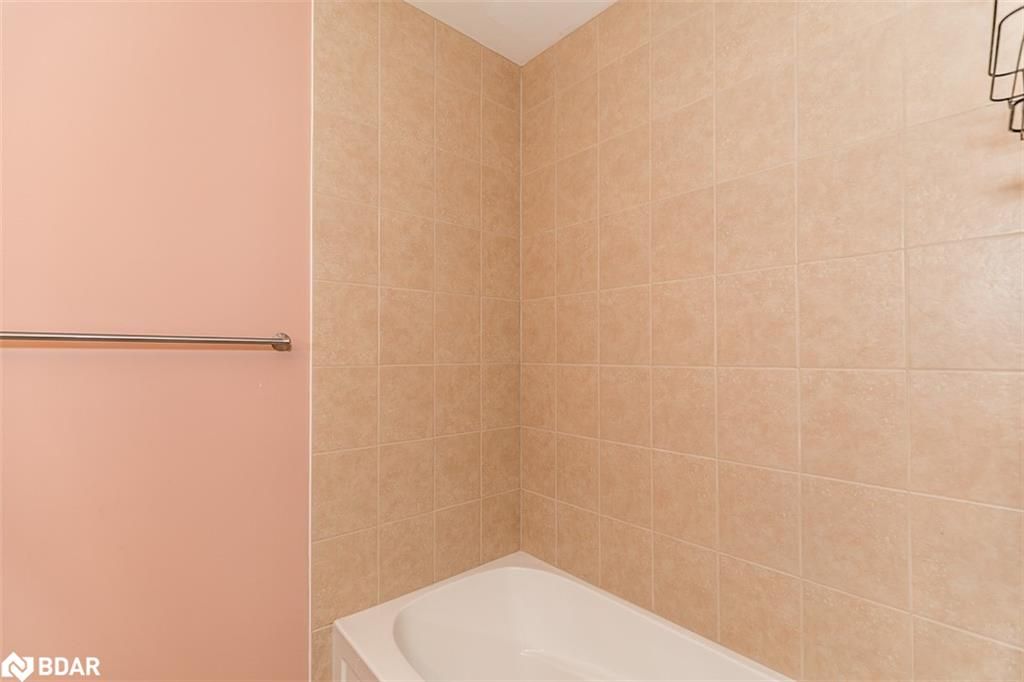
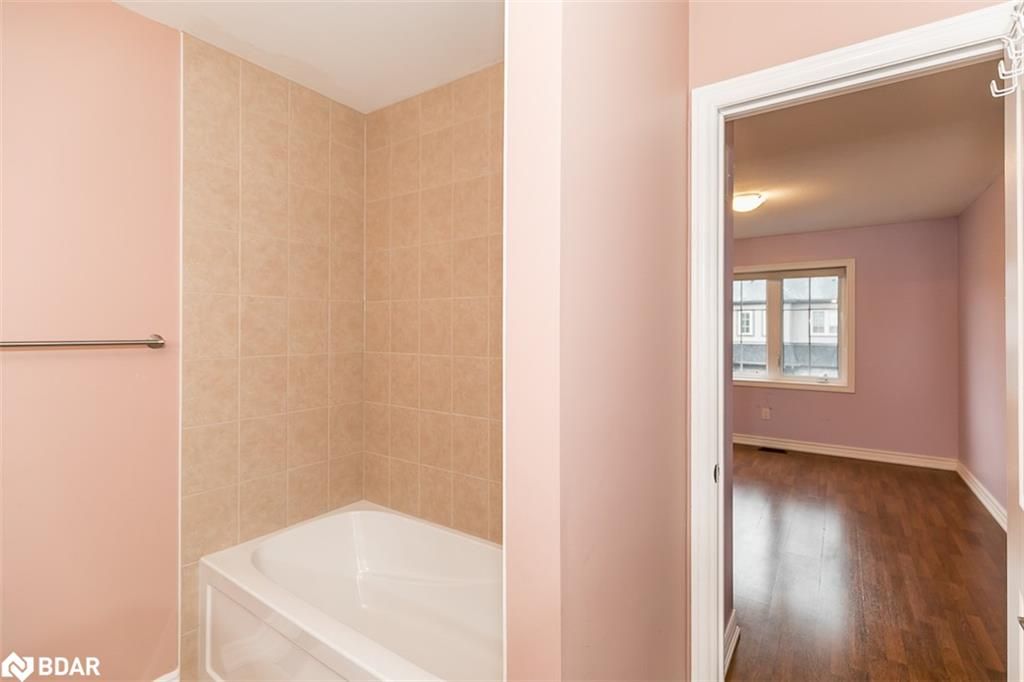
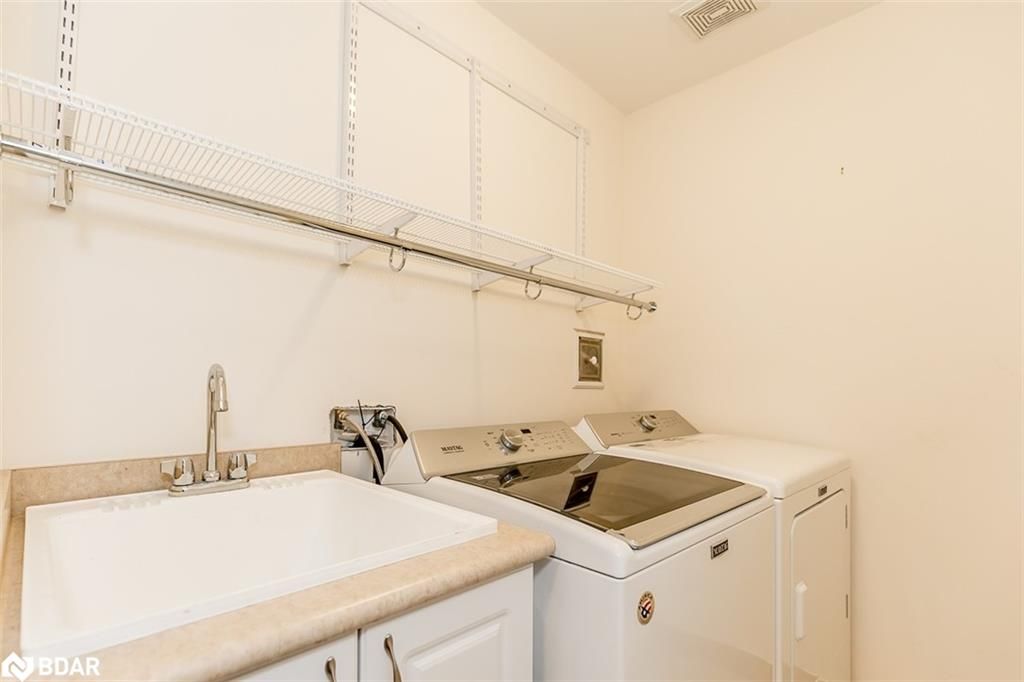
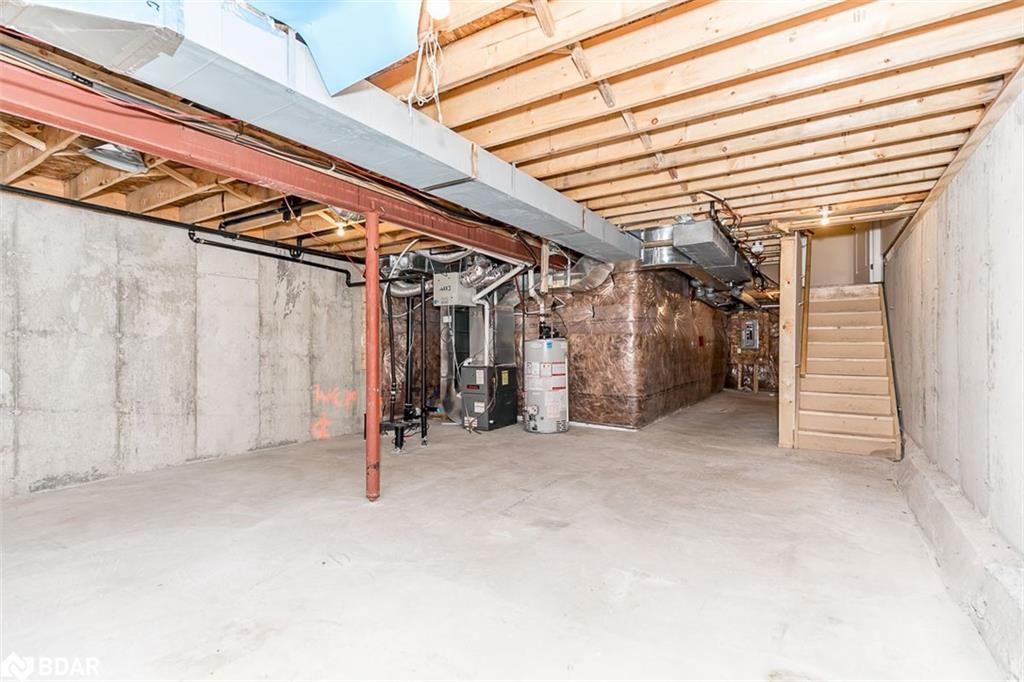
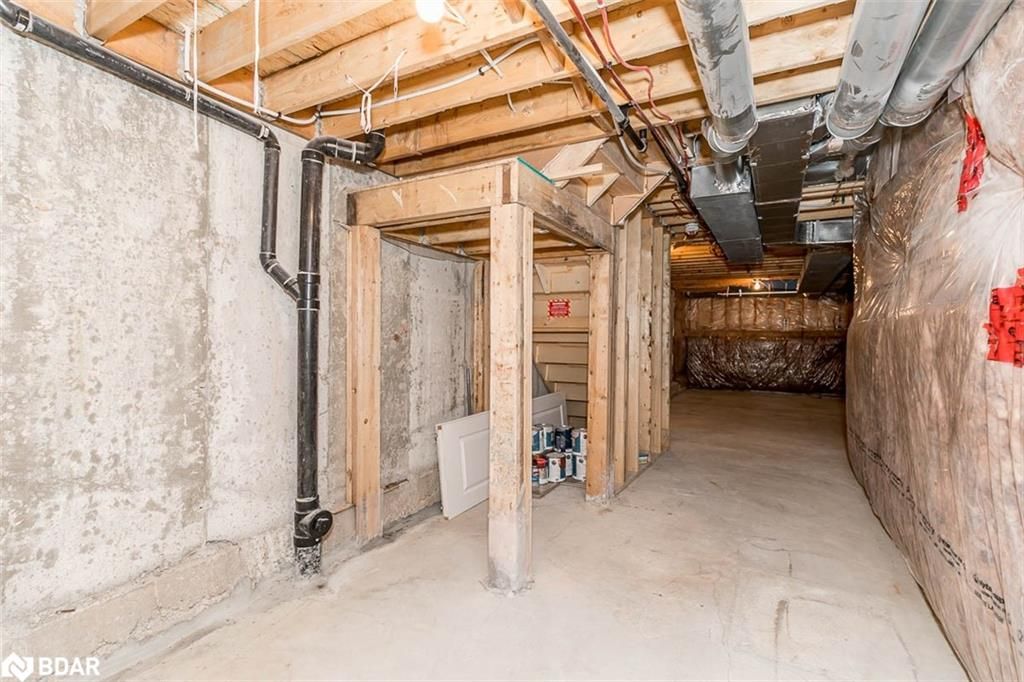
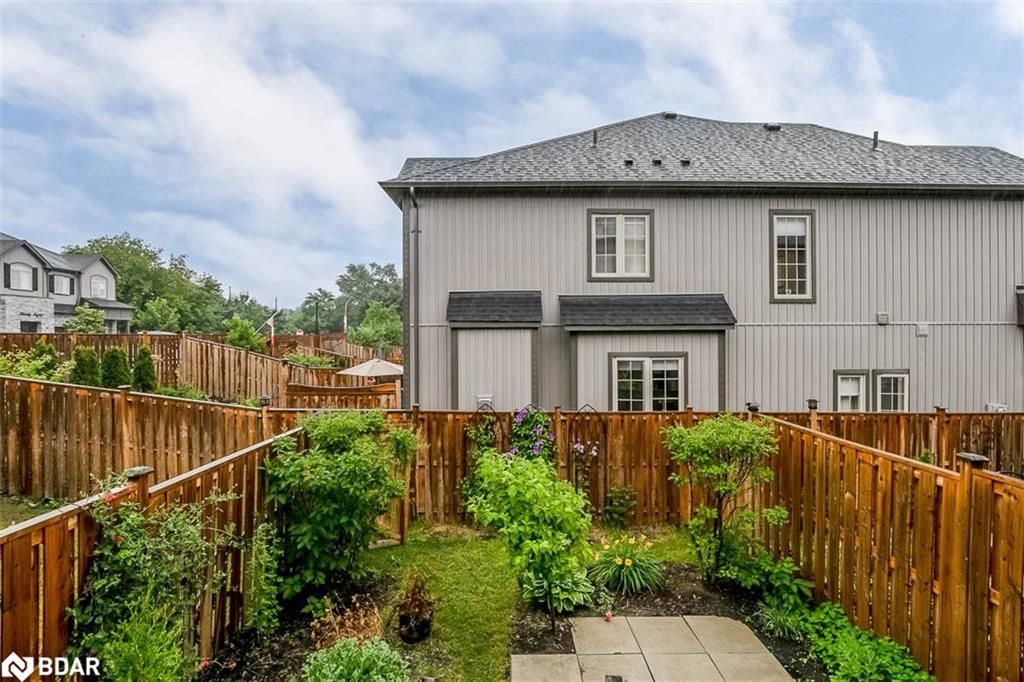
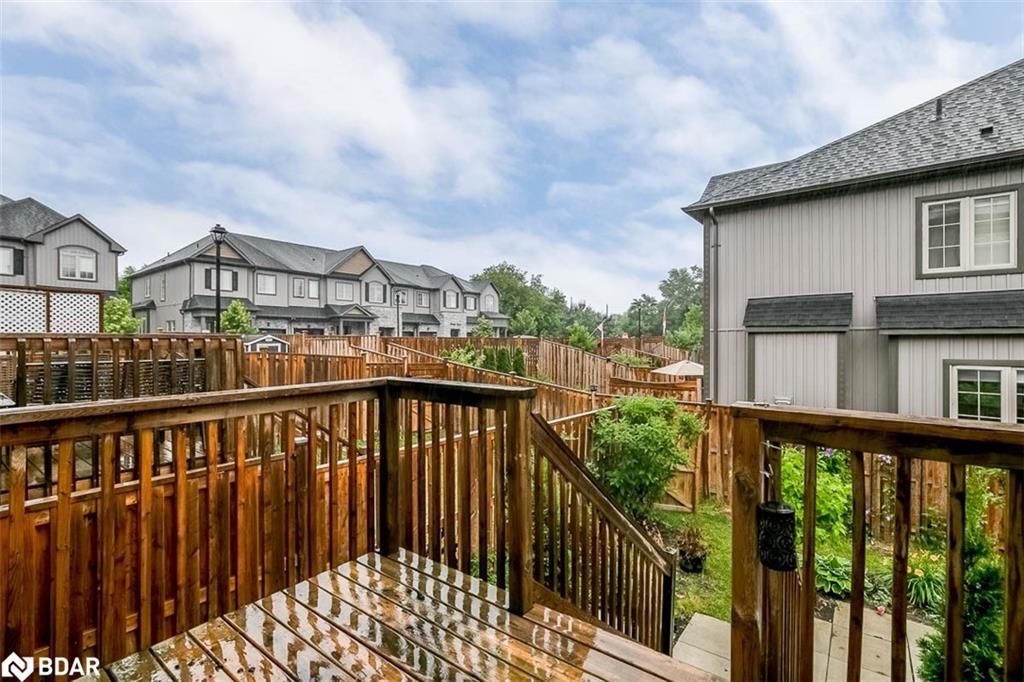
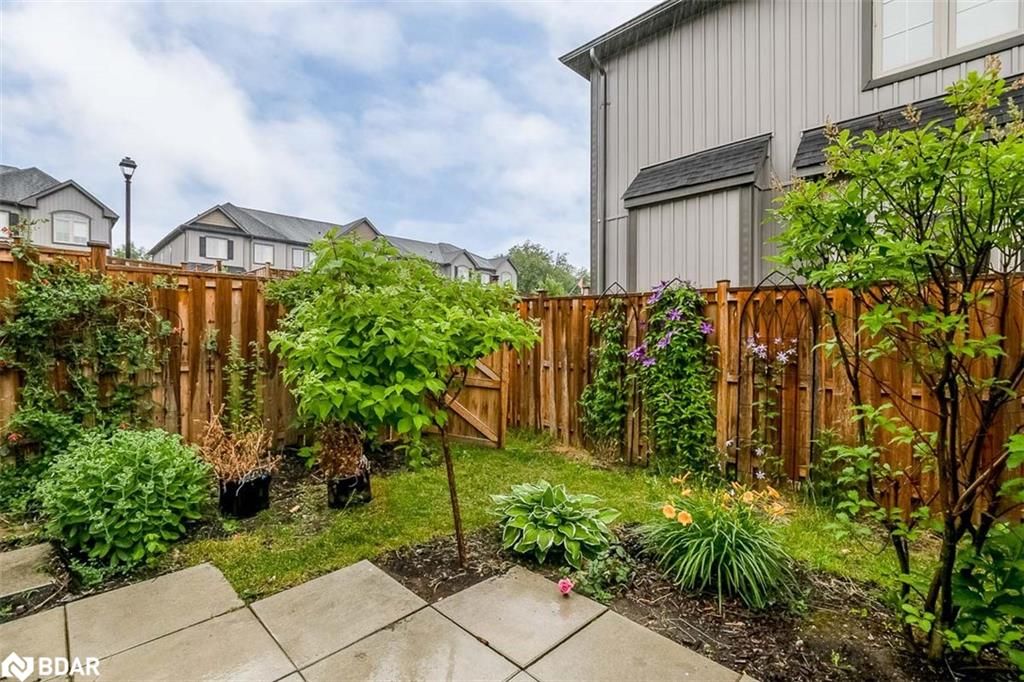
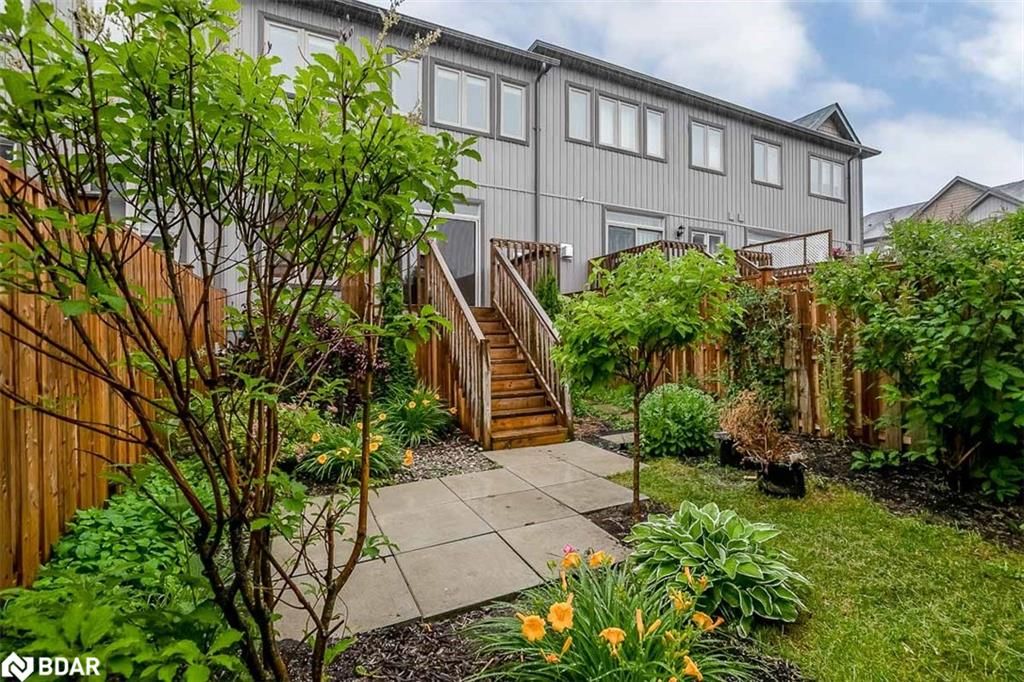
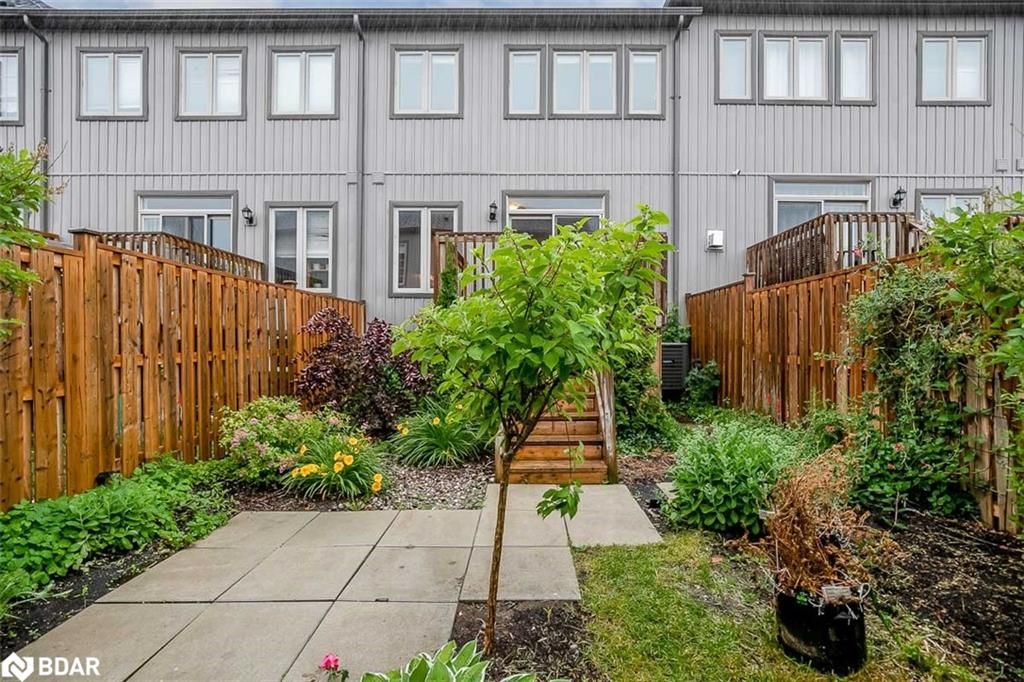
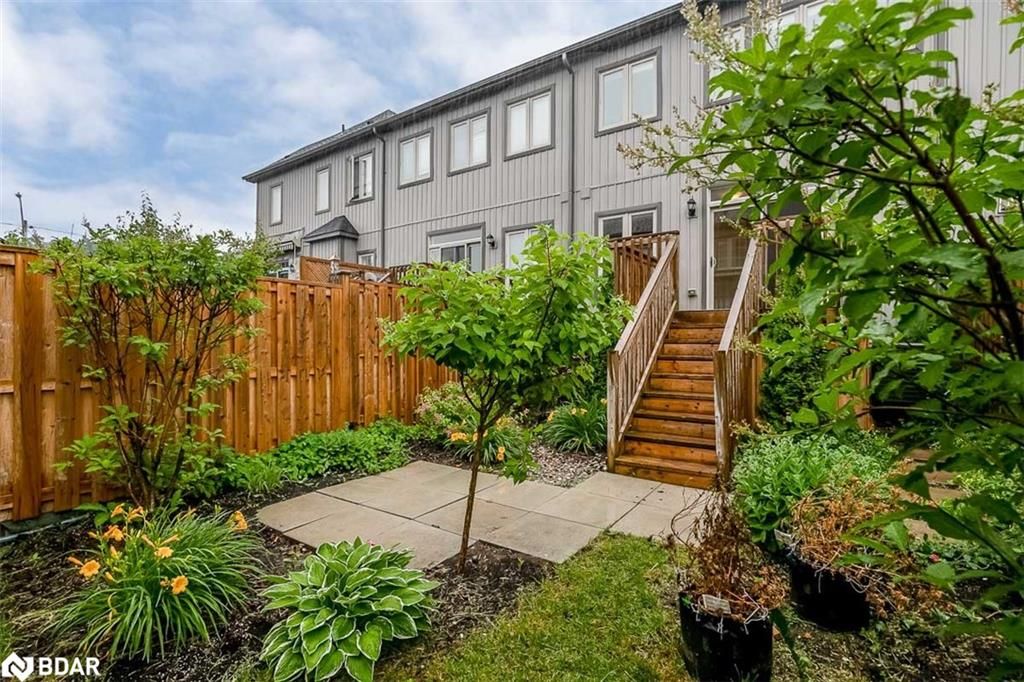
Welcome to 6 Forest Heights Crescent! This 5 year new 1575 sq.ft 3 bedroom, 2 + 1 bathroom townhome is situated in an unique enclave of townhomes in Central Orillia close to all amenities! This home has charming curb appeal with a Stone facade and a welcoming front porch! Once inside enjoy the open concept layout: Main floor boasts a large foyer w/inside entry to the large single garage,a 2pc washroom,living room w/gas fireplace and mantle, dining area, spacious kitchen and a walkout to an 11' x 8' deck overlooking the rear yards. The kitchen is complete with beautiful stone tile backsplash, a large counter area and separate island, fridge, gas stove, dishwasher and built-in microwave/range hood* Reach the upper level from the beautiful hardwood staircase w/runner; the upper level boasts 3 bedrooms including two good sized bedrooms, one with a 4pc ensuite, a laundry room w/sink, washer & dryer, and this level features a large master complete with double-door entry, large 7' x 6' walk-in closet and stunning 5pc ensuite w/tile surrounds for the tub and shower*The lower level is unfinished but does have a rough-in for a 4th bathroom*The rear yard, like the front yard, is landscaped with flower beds and has both access from the deck and a rear entry/common path to the home*This home shows 10+ and is priced to $ELL!!
Built-in Microwave,Dishwasher,Garage Door Opener,Gas Stove,Refrigerator,Washer,Window Coverings
Copyright 2025 Information Technology Systems Ontario, Inc. The information provided herein must only be used by consumers that have a bona fide interest in the purchase, sale, or lease of real estate and may not be used for any commercial purpose or any other purpose.
Laundry
Bedroom Primary
Bedroom
Bedroom
Dining Room
Eat-in Kitchen
Living Room
Foyer
The graph below compares the average list price and average sale price of condos in this neighborhood by month for the last 24 months. When average sale price is greater than average list price, this may suggest a buyer's market. When average sale price is lower than the average list price this may suggest a seller's market.
The graph below illustrates the average days on market for condos in this neighborhood. The yellow area may indicate a buyer's market, the green area may indicate a balanced market and the red area may indicate a seller's market.
Sales Representative, Century 21 People’s Choice Realty Inc., Brokerage
(647) 576 - 2100