Century 21 People’s Choice Realty Inc., Brokerage
120 MATHESON BLVD E #103
MISSISSAUGA, Ontario
L4K 0A4


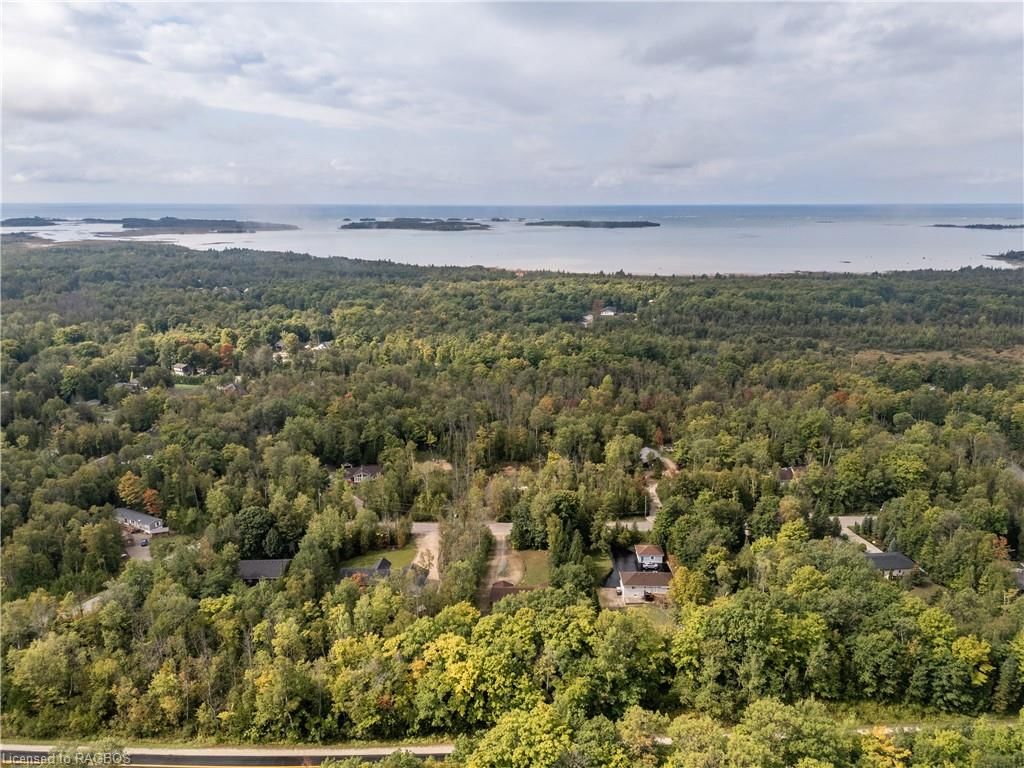
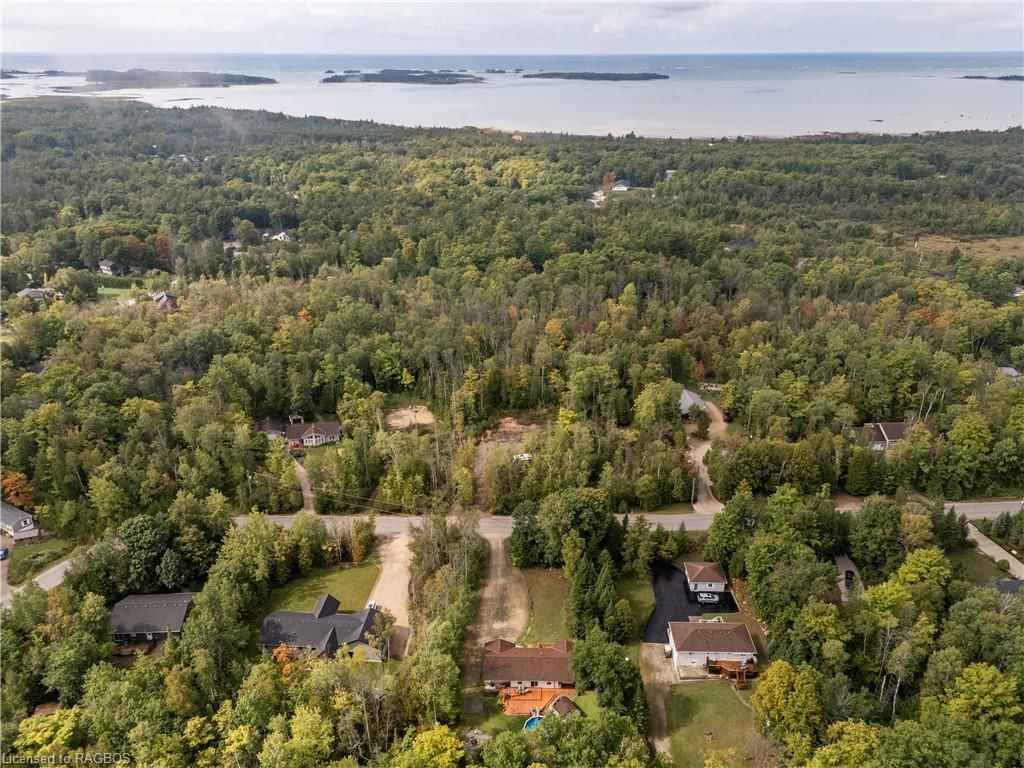
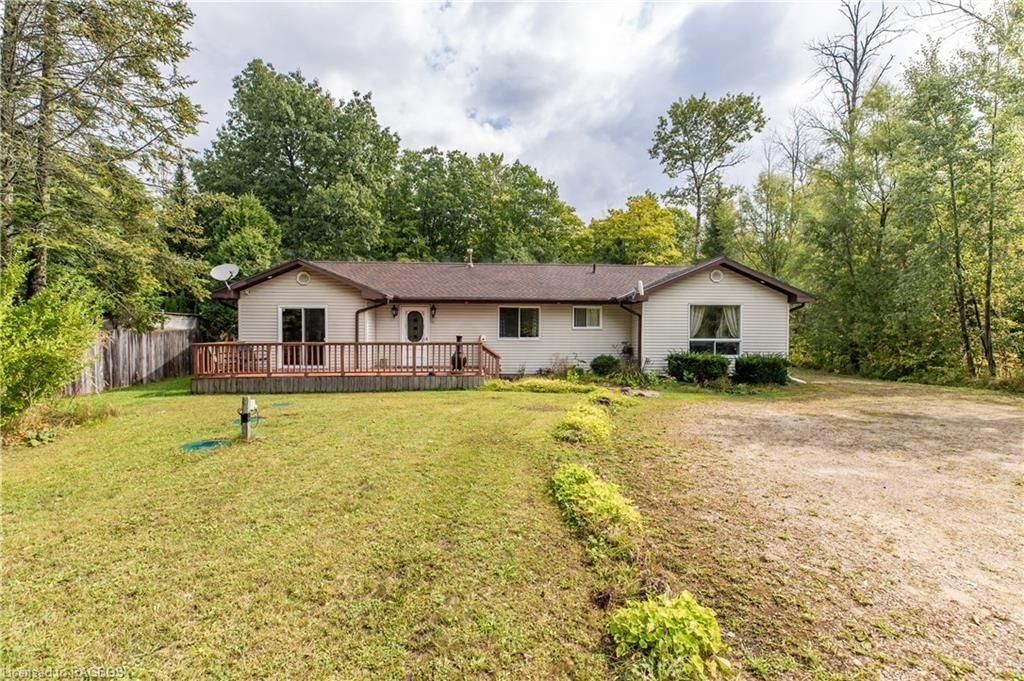
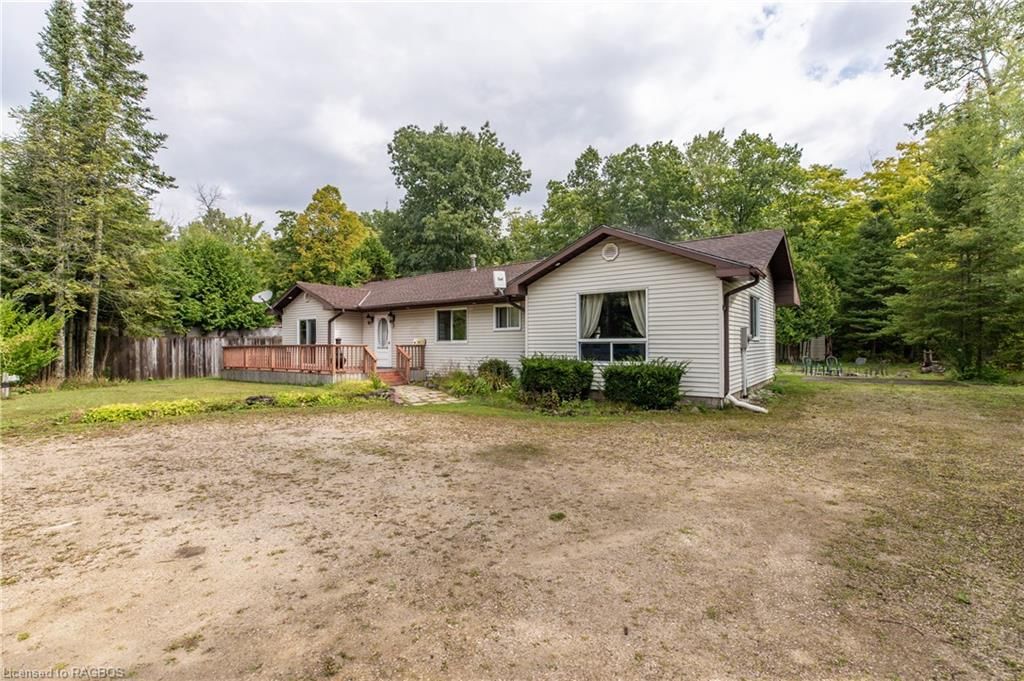


Oliphant, South Bruce Peninsula, N0H 2T0
$569,000$000000
Listed by CENTURY 21 IN-STUDIO REALTY INC. Brokerage (Sauble Beach).
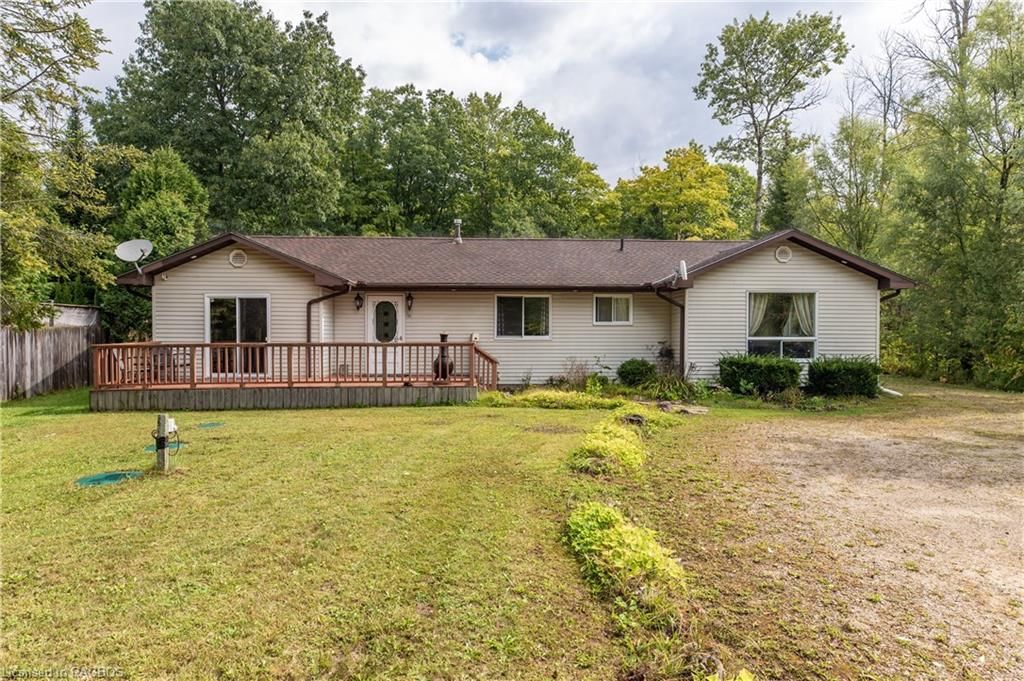
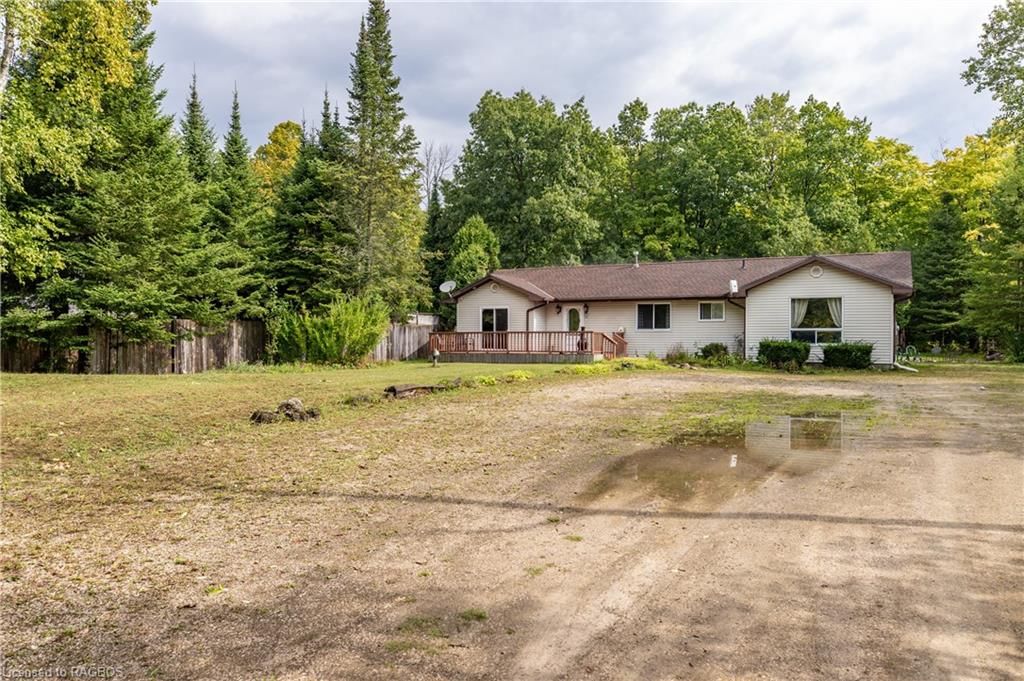
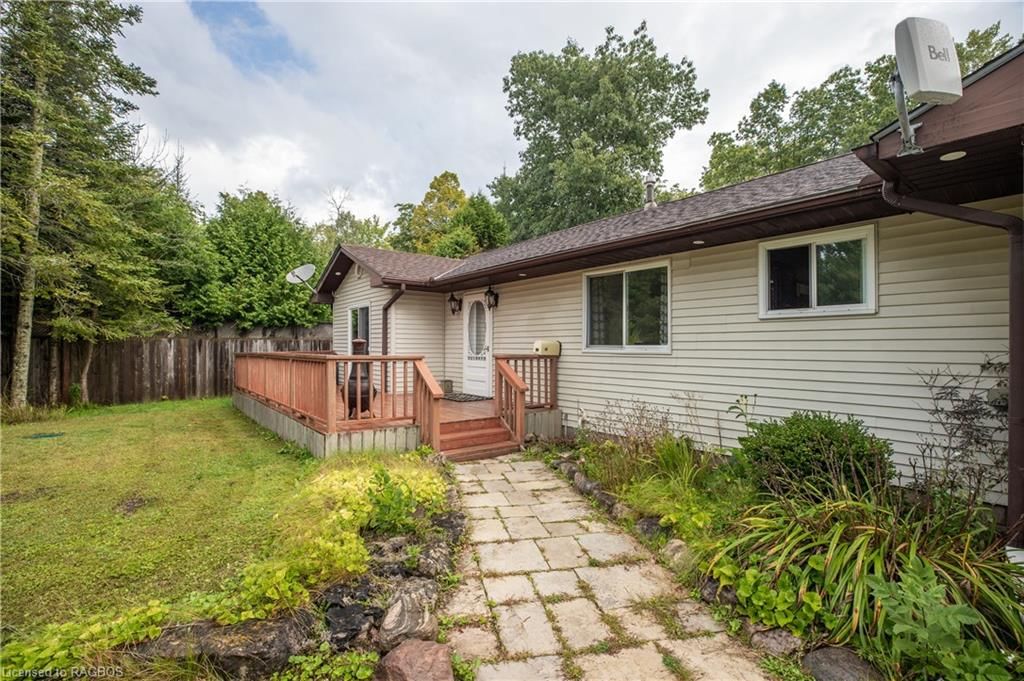
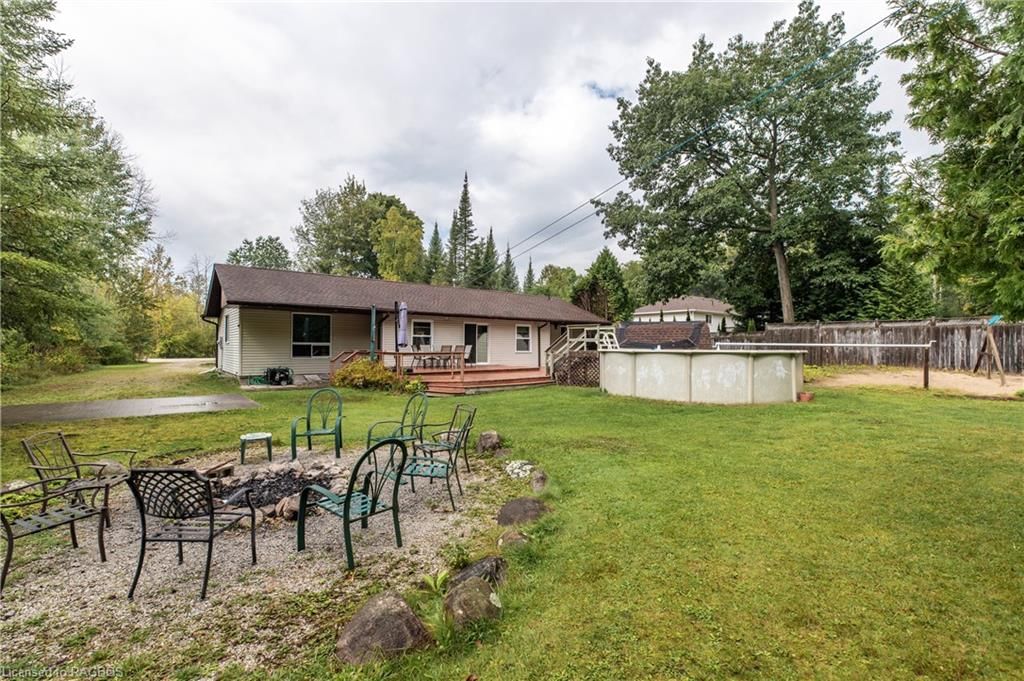
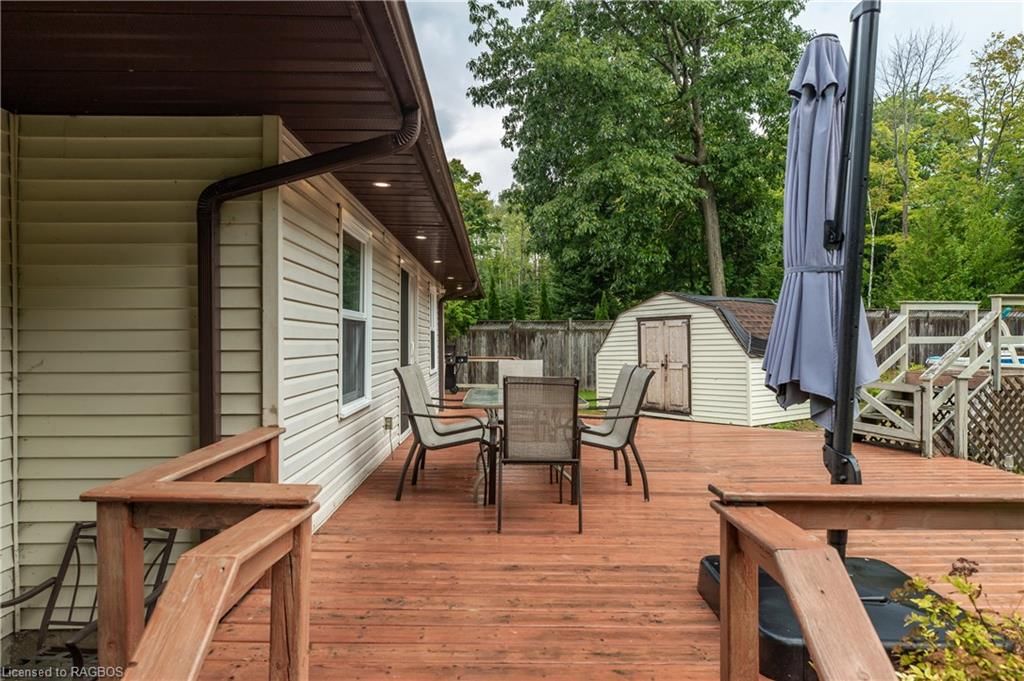
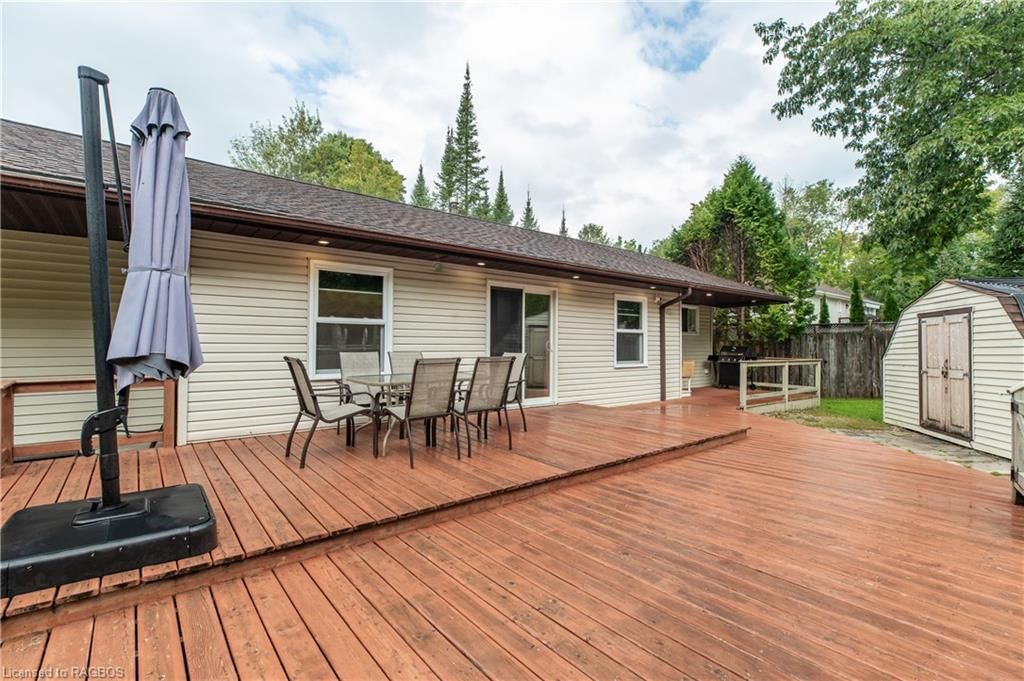
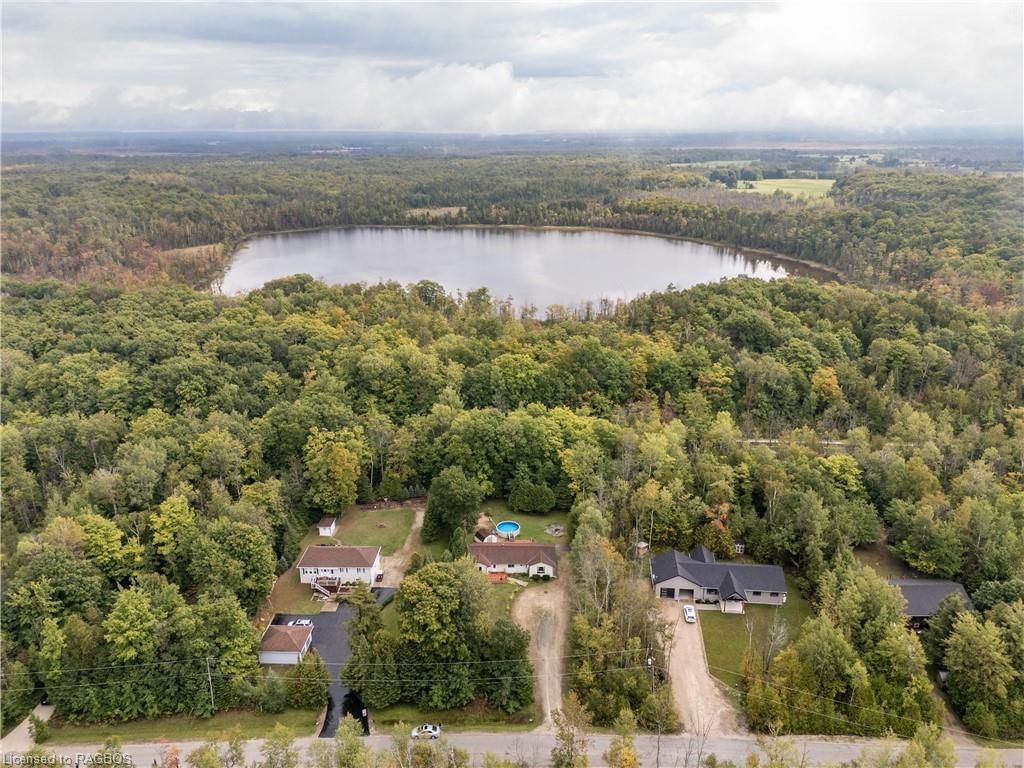
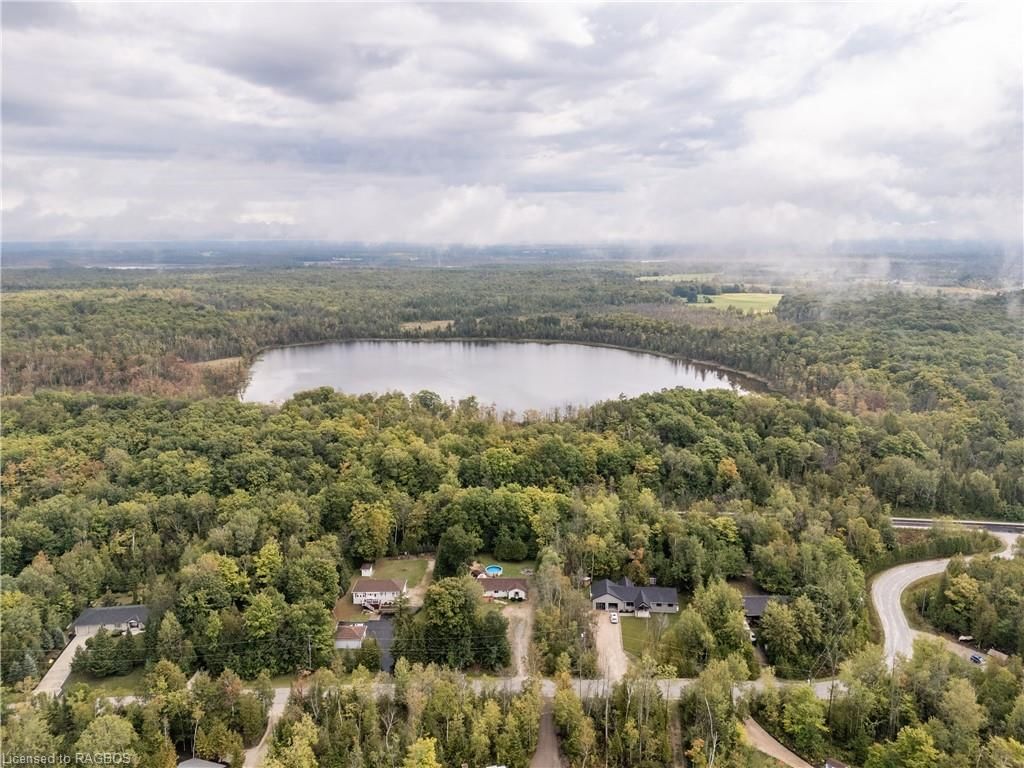
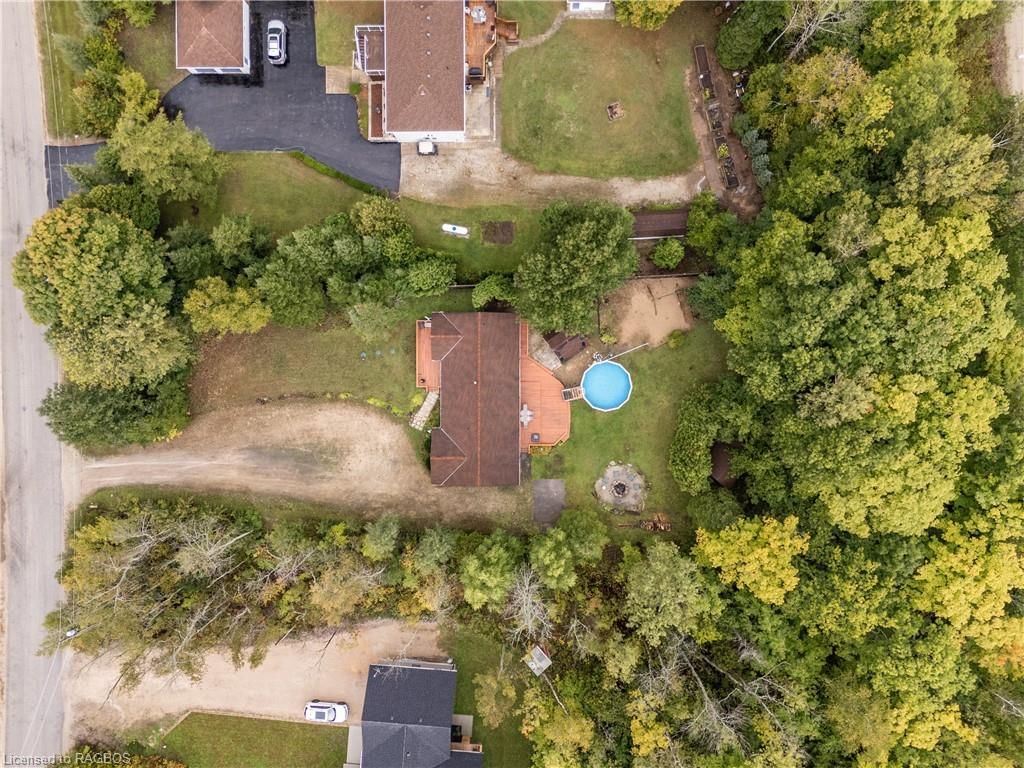
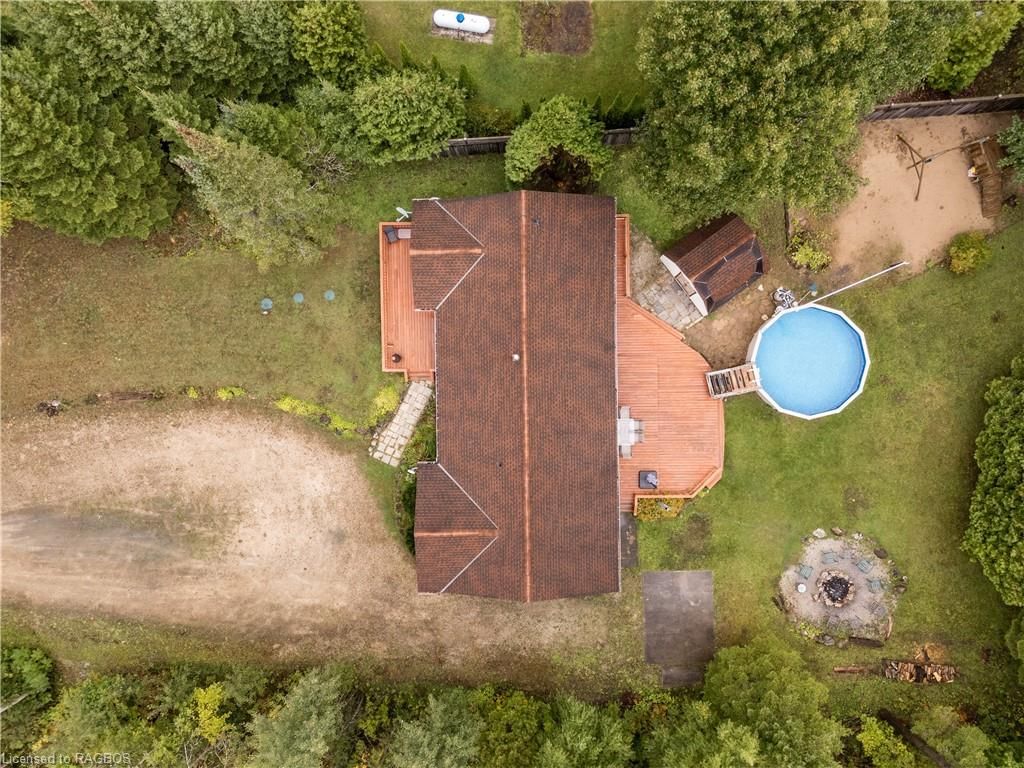
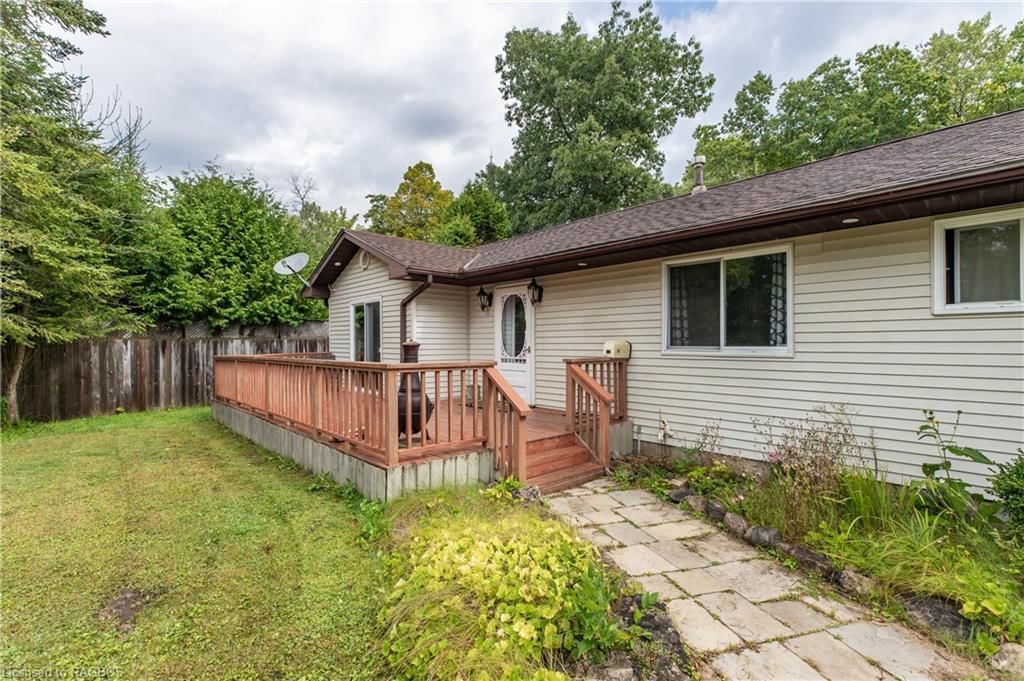
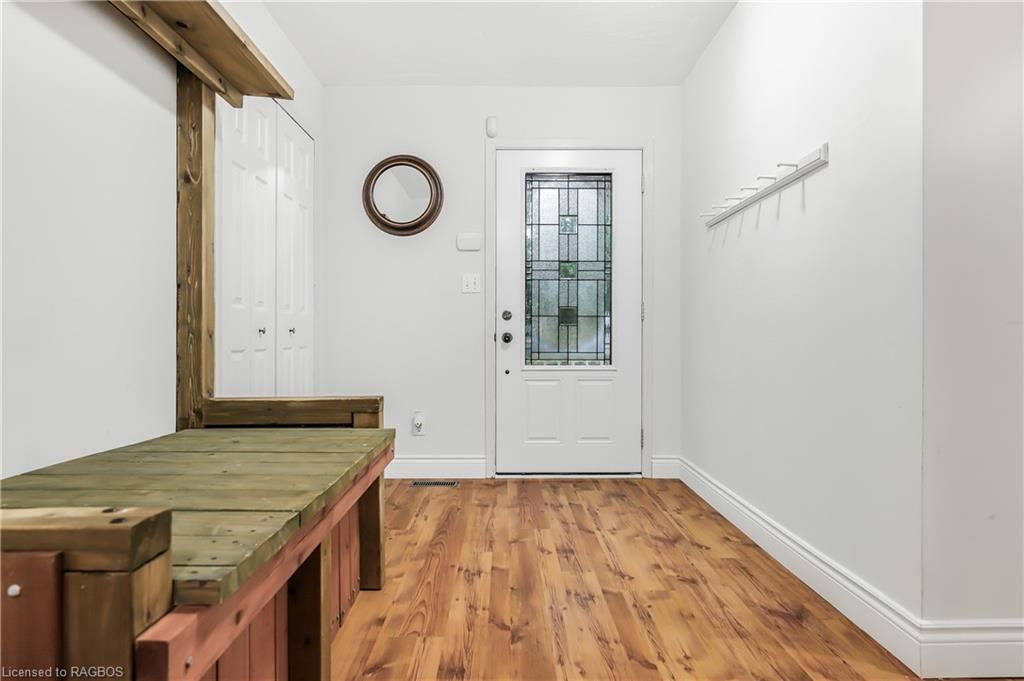
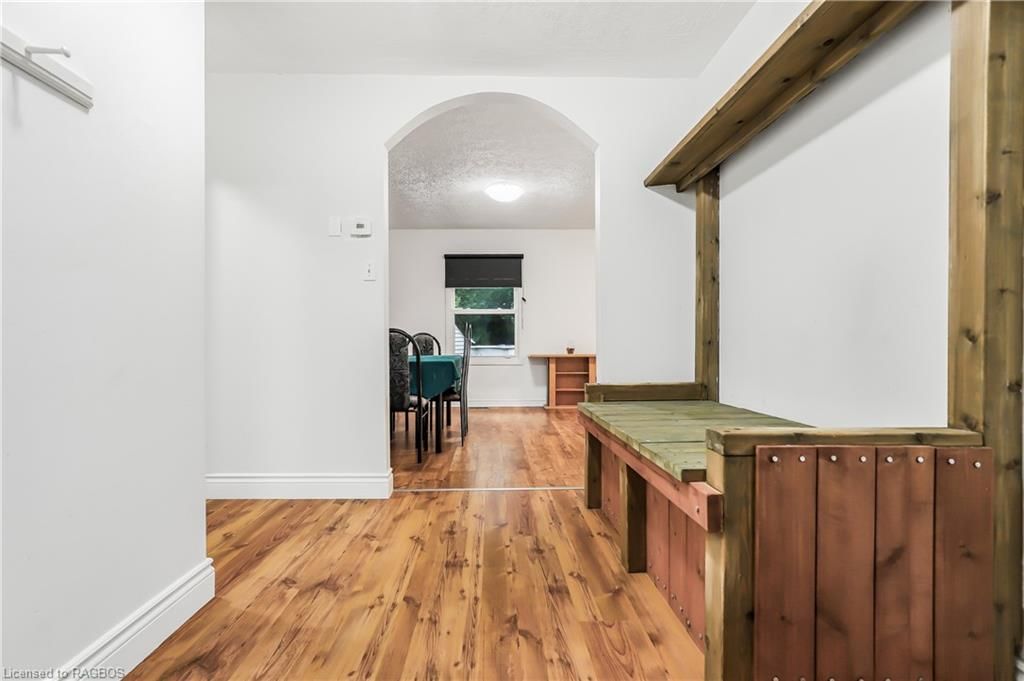
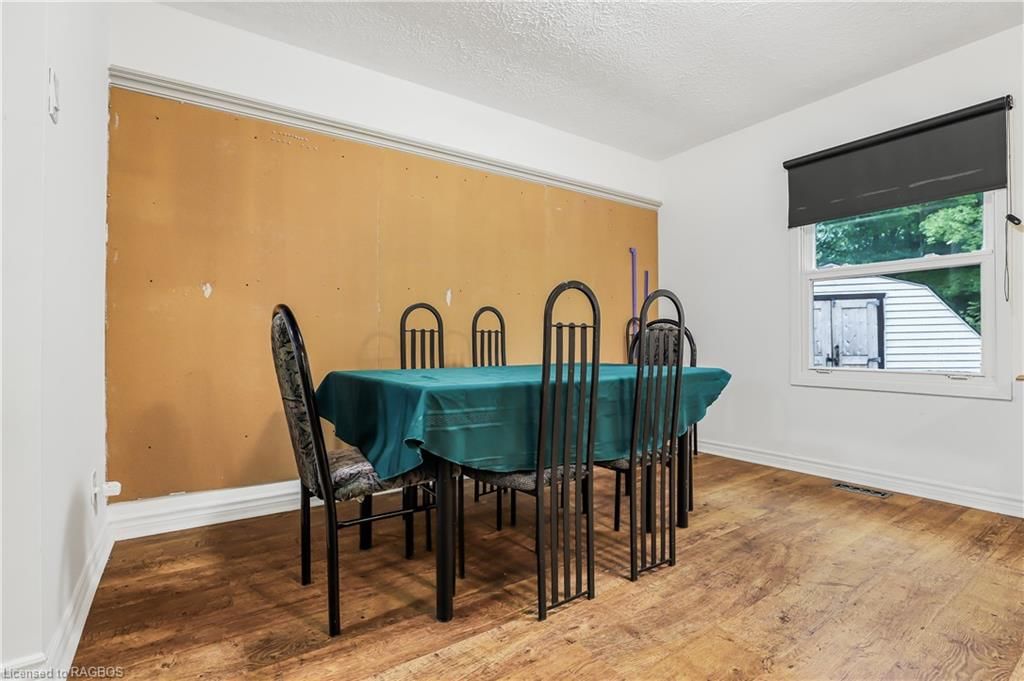
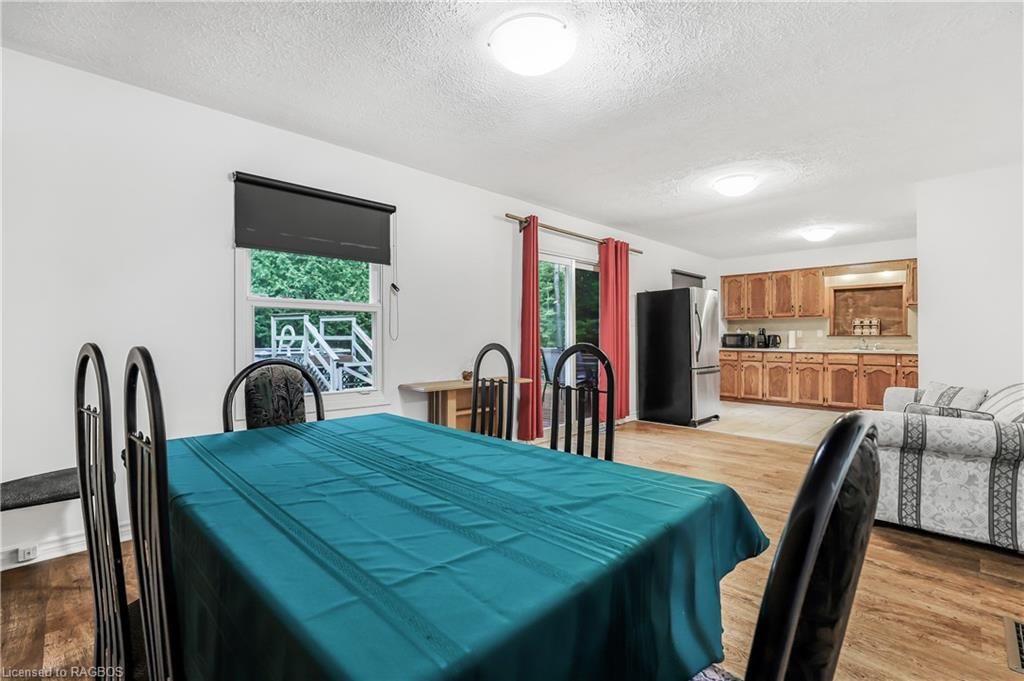
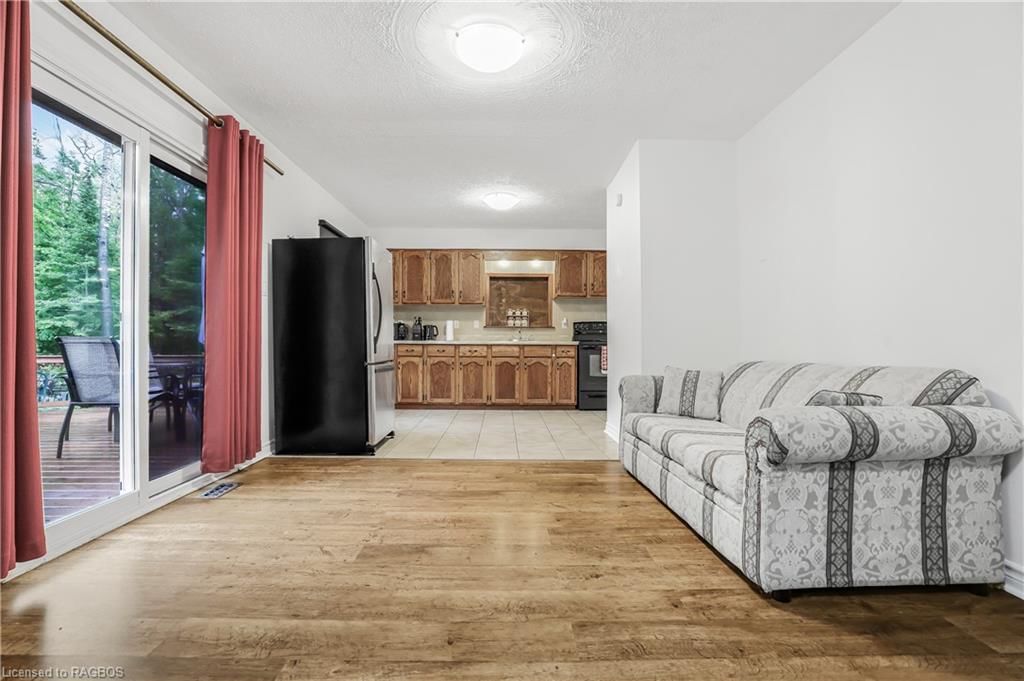
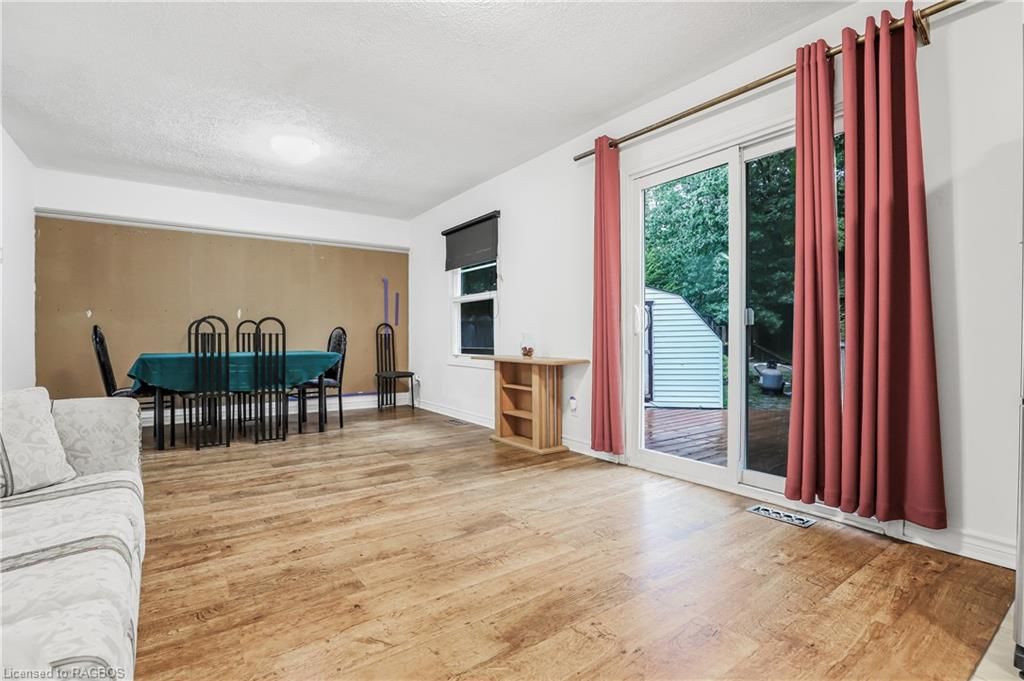
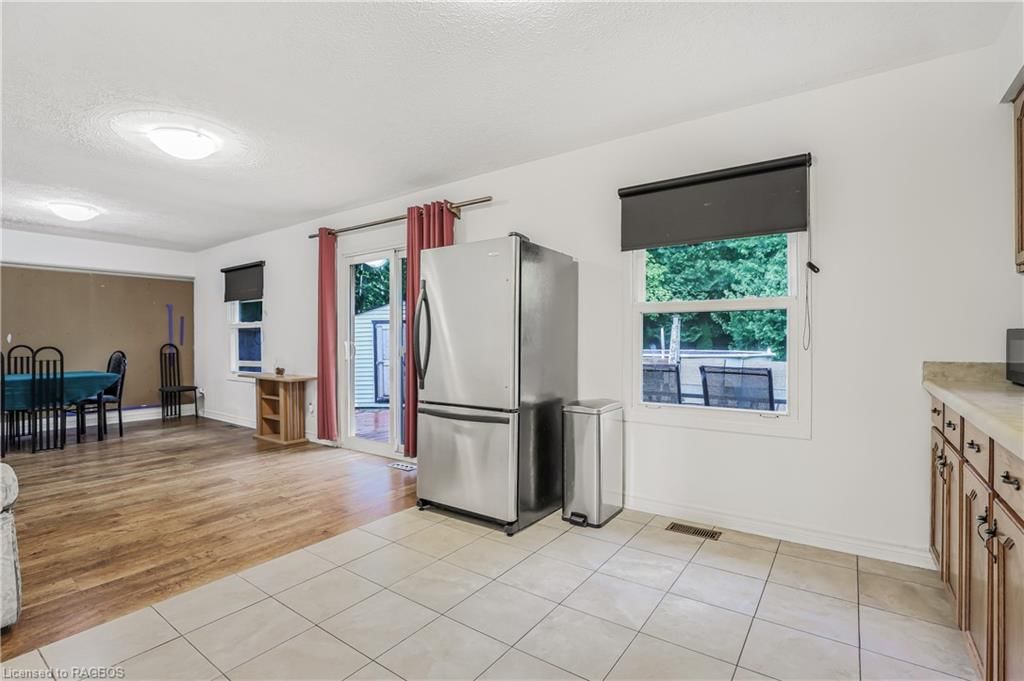
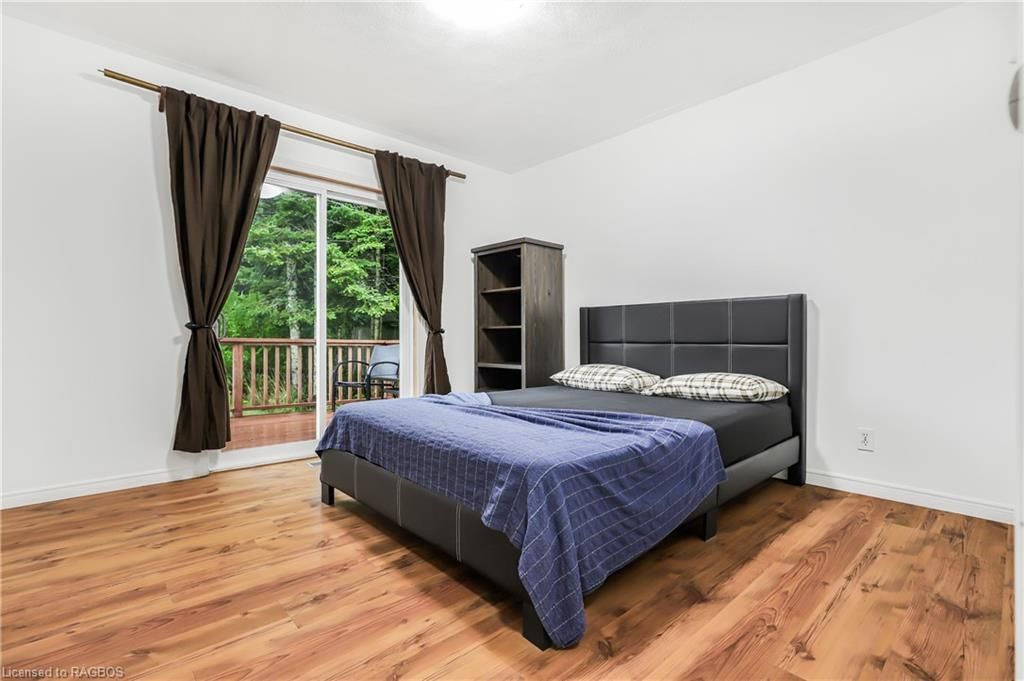
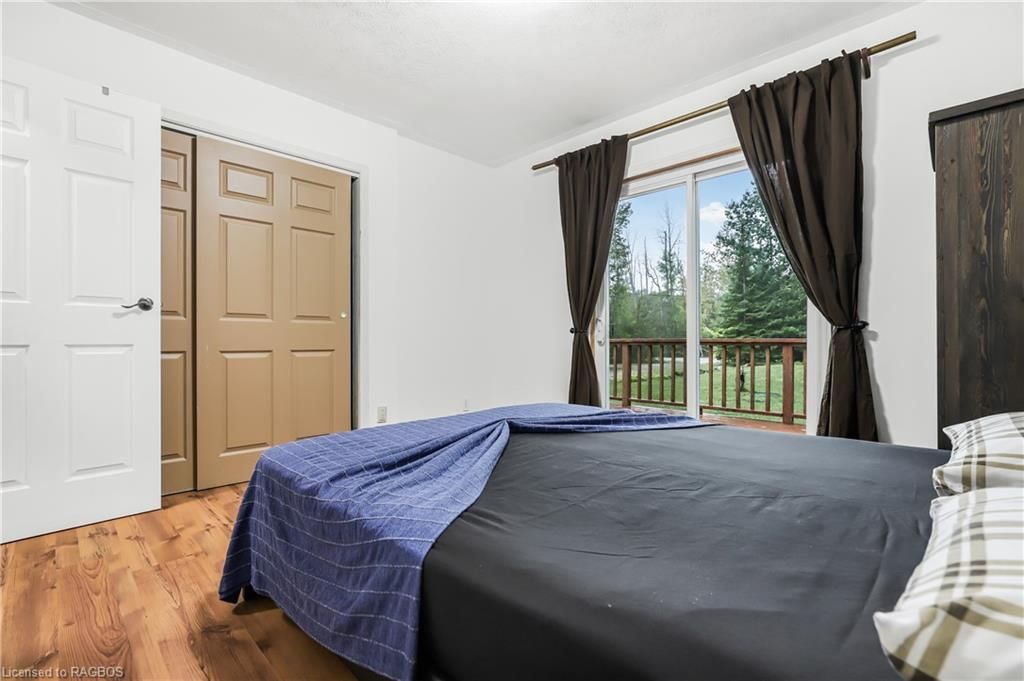
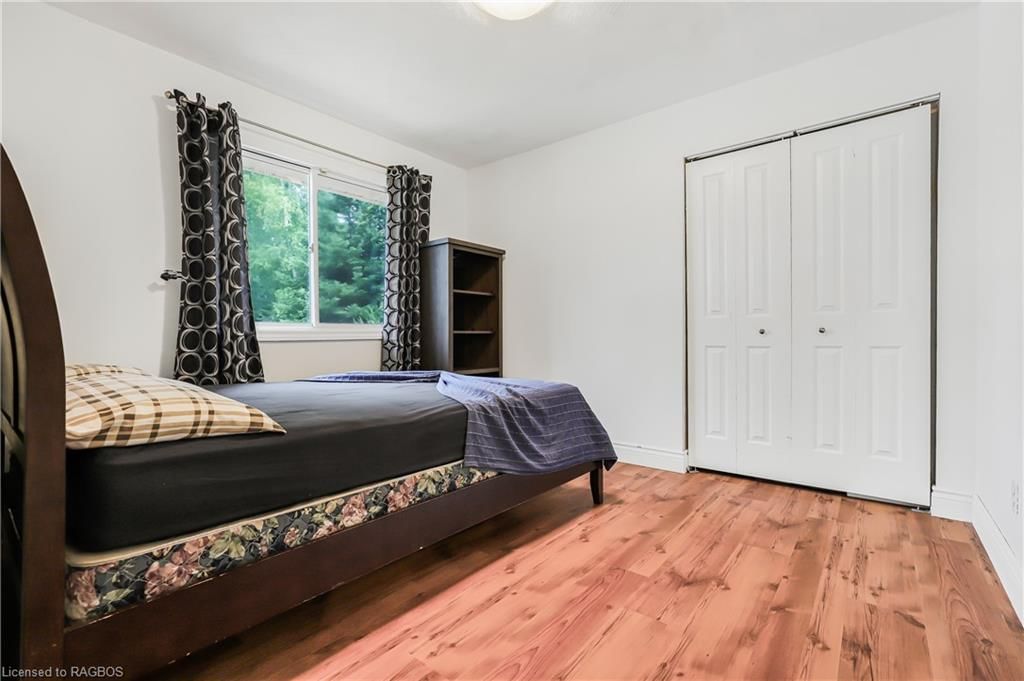
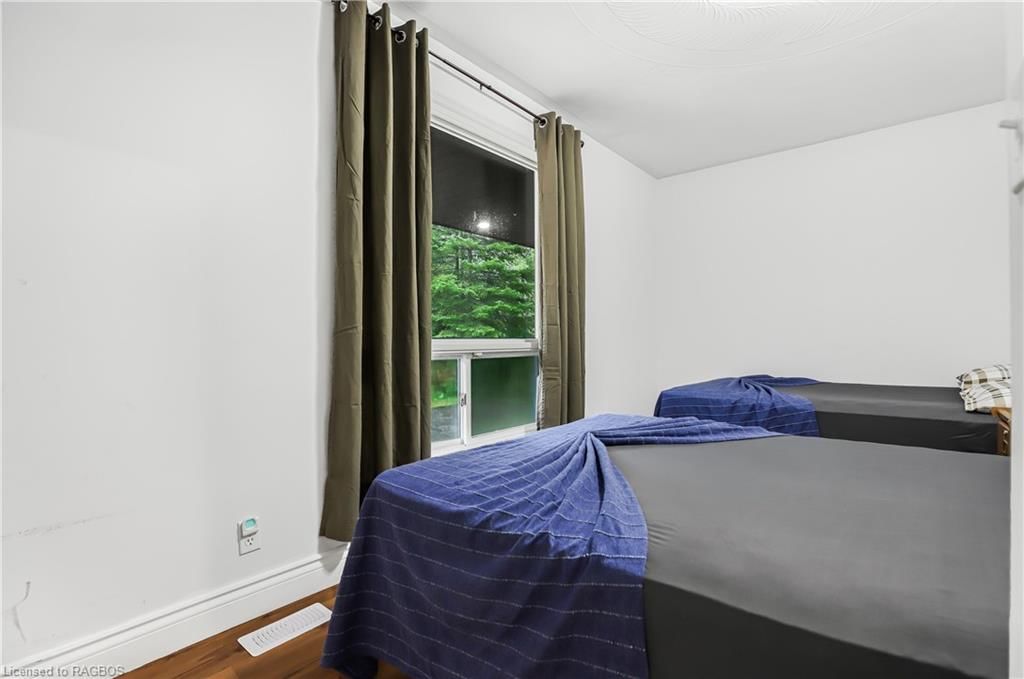
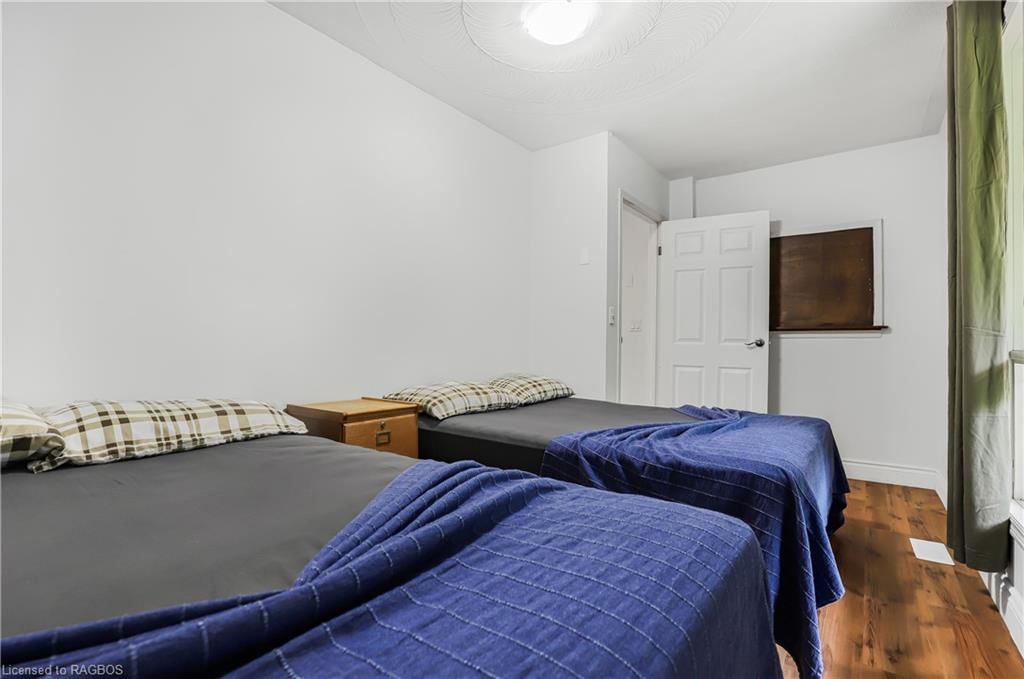
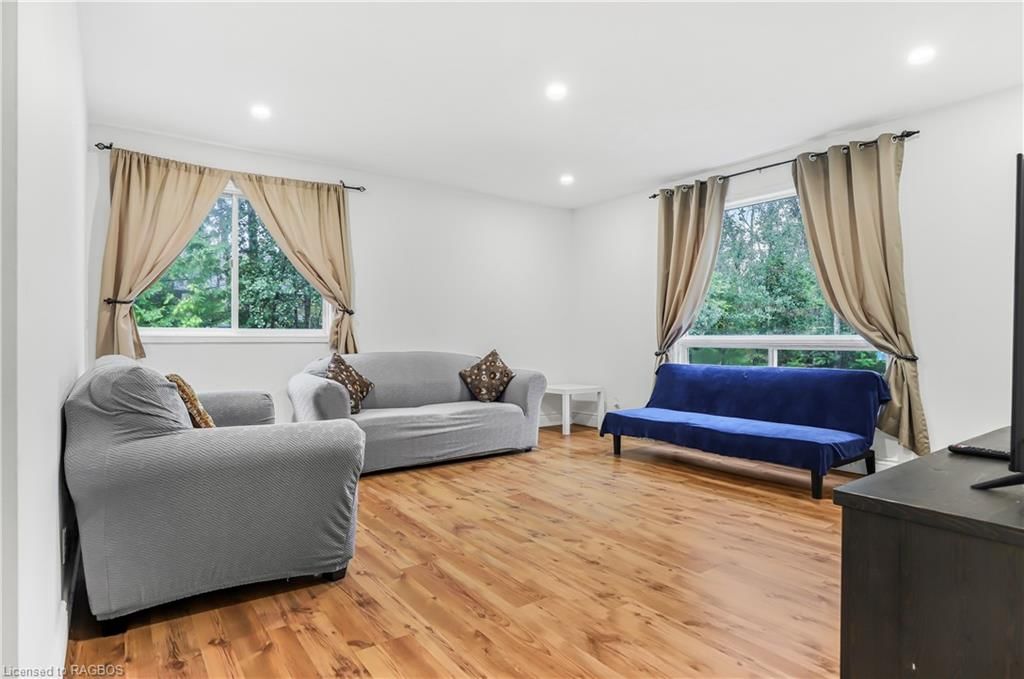
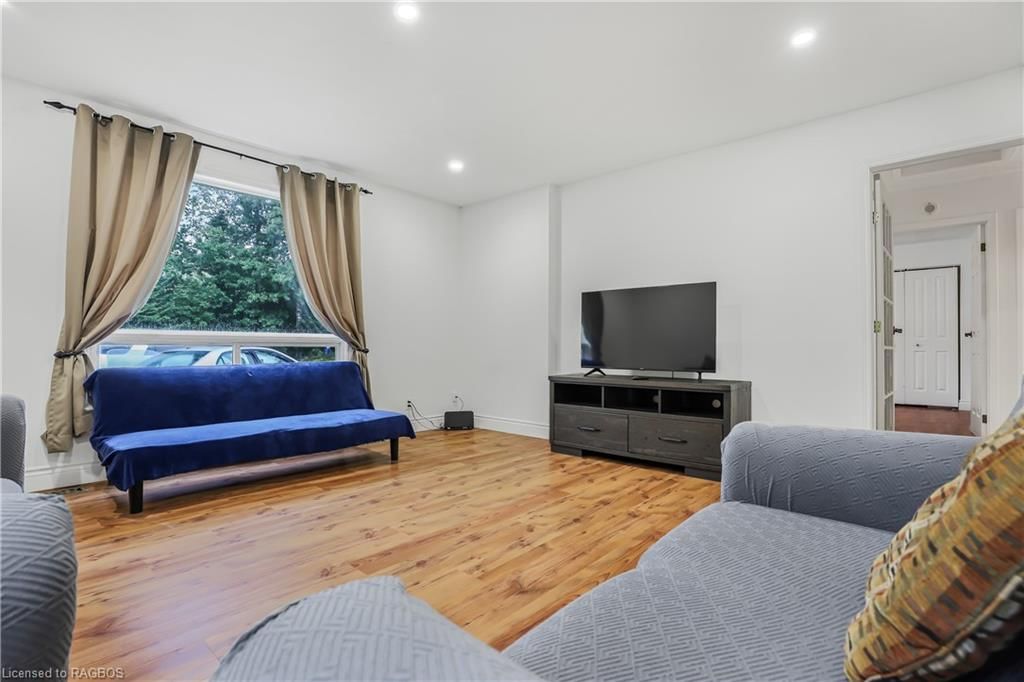
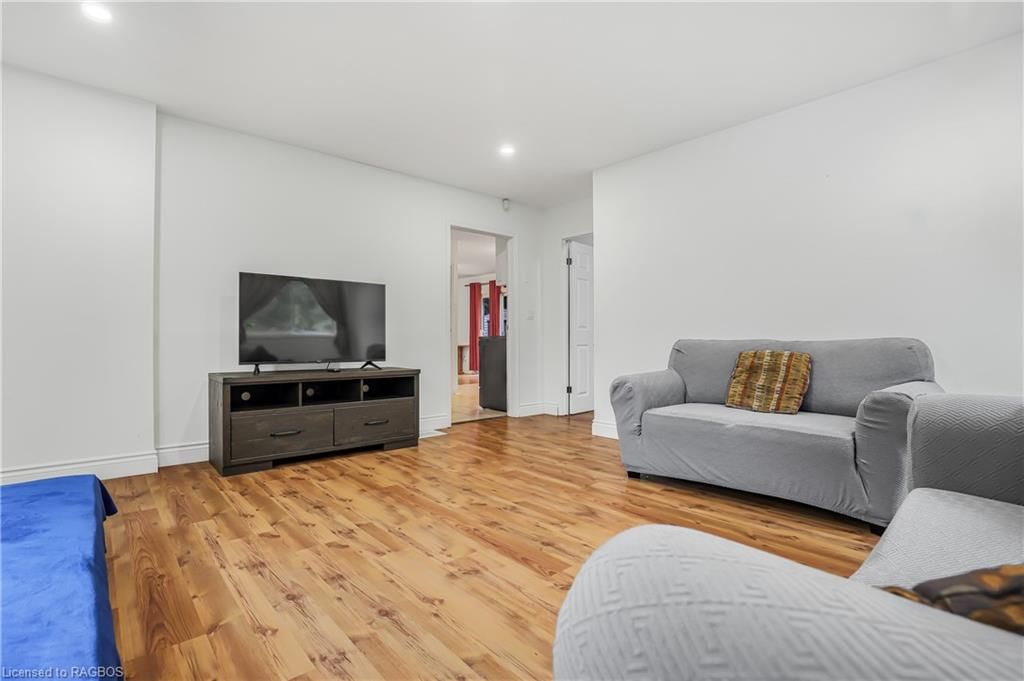
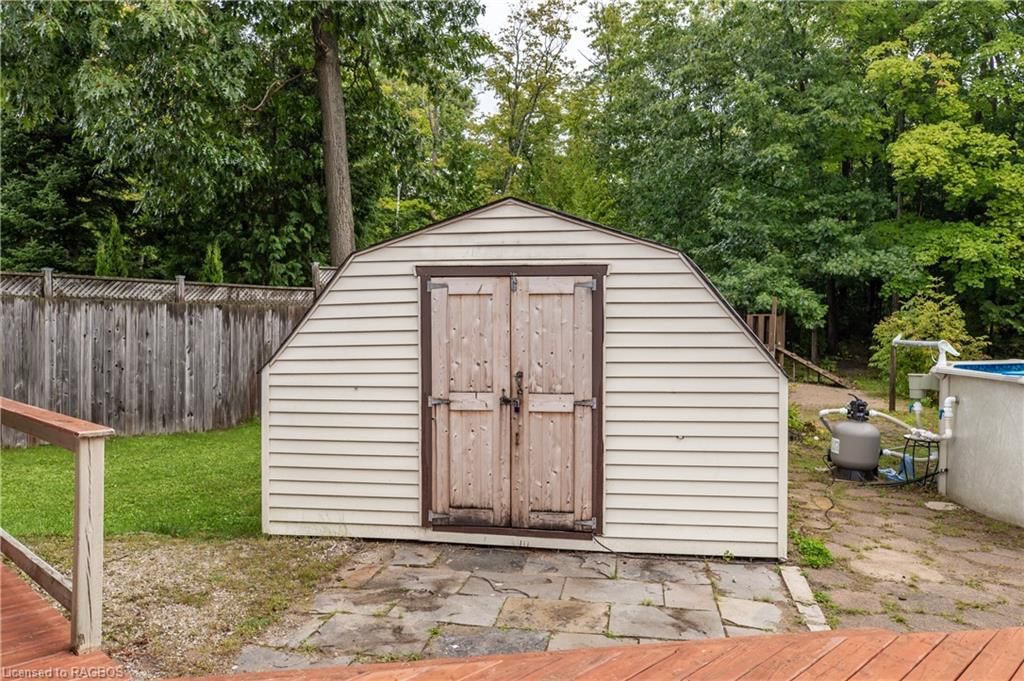
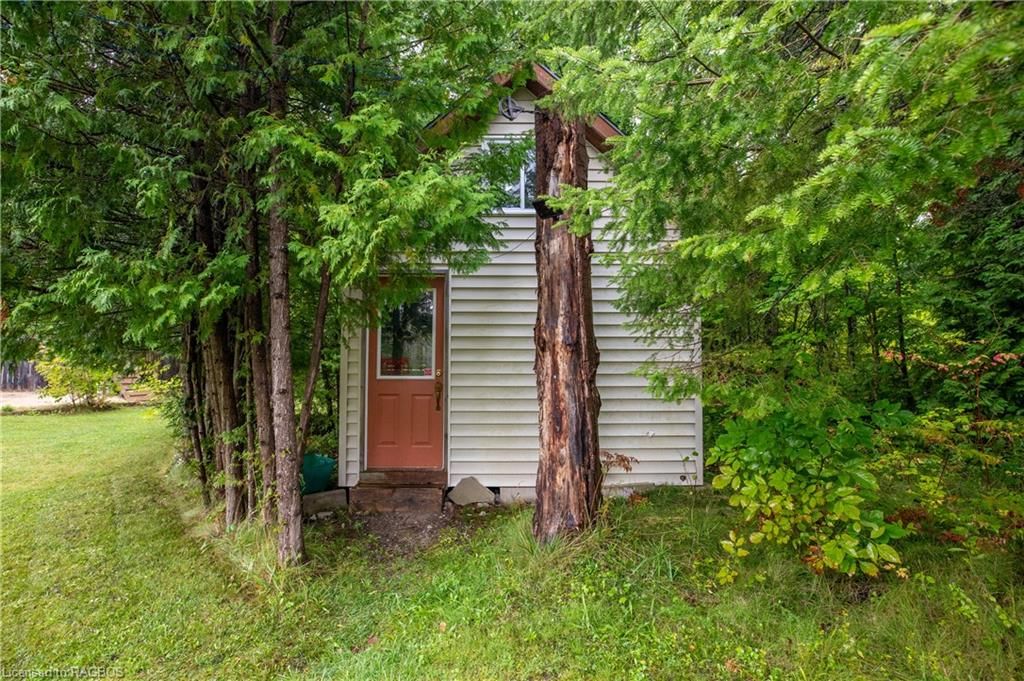
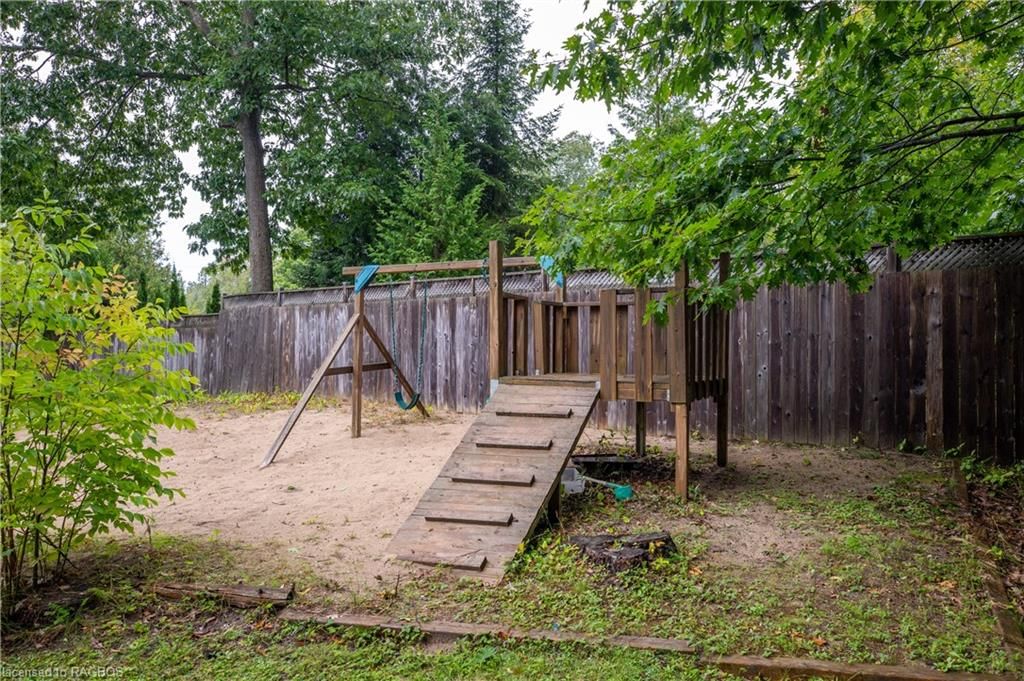
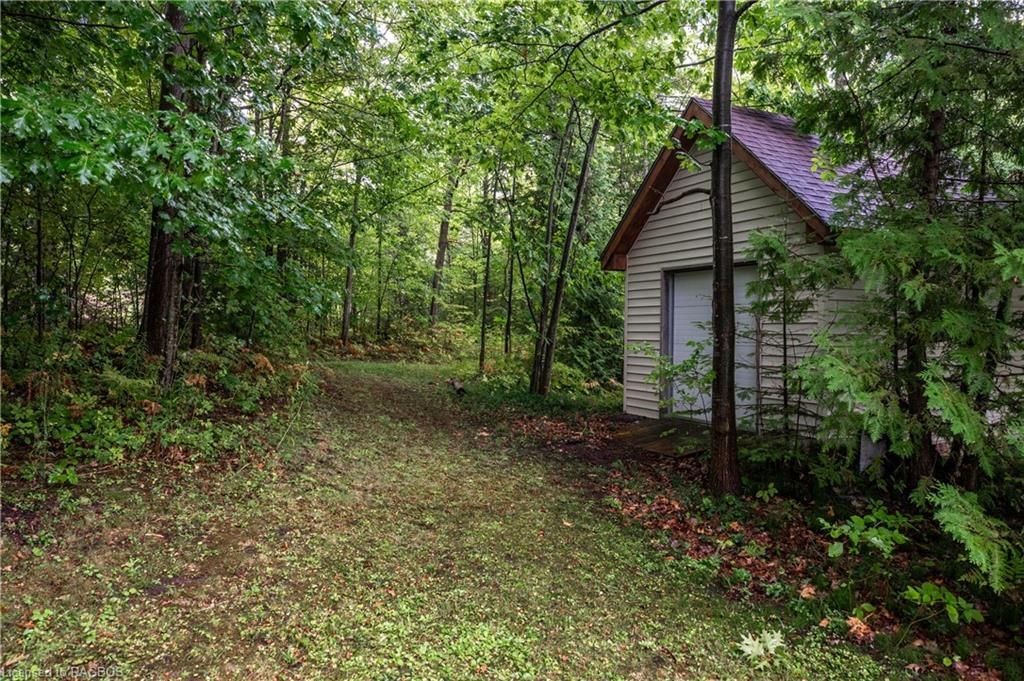
Welcome to your serene retreat in Oliphant! This charming bungalow offers the perfect blend of comfort, convenience, and relaxation, nestled in a tranquil neighborhood close to Sauble Beach and Wiarton. Step inside to discover a cozy yet spacious interior boasting 3 bedrooms, 2 baths, and a versatile bonus room, ideal for use as another bedroom, office, or recreational space. Whether you're hosting guests, working from home, or unwinding after a long day, this home provides the flexibility to suit your lifestyle. Outside, you'll find your own private oasis awaiting. Dive into the refreshing above-ground pool on warm summer days, or simply bask in the sun on the expansive deck while enjoying the peace and seclusion of the large backyard. With ample space for entertaining, gardening, or simply enjoying the great outdoors, this backyard is sure to become your favorite spot to unwind and recharge. Start your mornings right with a cup of coffee on the great deck out front, soaking in the peaceful surroundings and breathing in the crisp, fresh air. And when adventure calls, take a short bike ride to the nearby sandy beach for a day of sun, sand, and surf. Don't miss out on the opportunity to make this your own slice of paradise in Oliphant. Schedule a showing today and experience the beauty and tranquility this home has to offer!
Dishwasher,Dryer,Furniture,Hot Water Tank Owned,Microwave,Pool Equipment,Stove,Washer,Window Coverings
Copyright 2025 Information Technology Systems Ontario, Inc. The information provided herein must only be used by consumers that have a bona fide interest in the purchase, sale, or lease of real estate and may not be used for any commercial purpose or any other purpose.
Bedroom
Bedroom
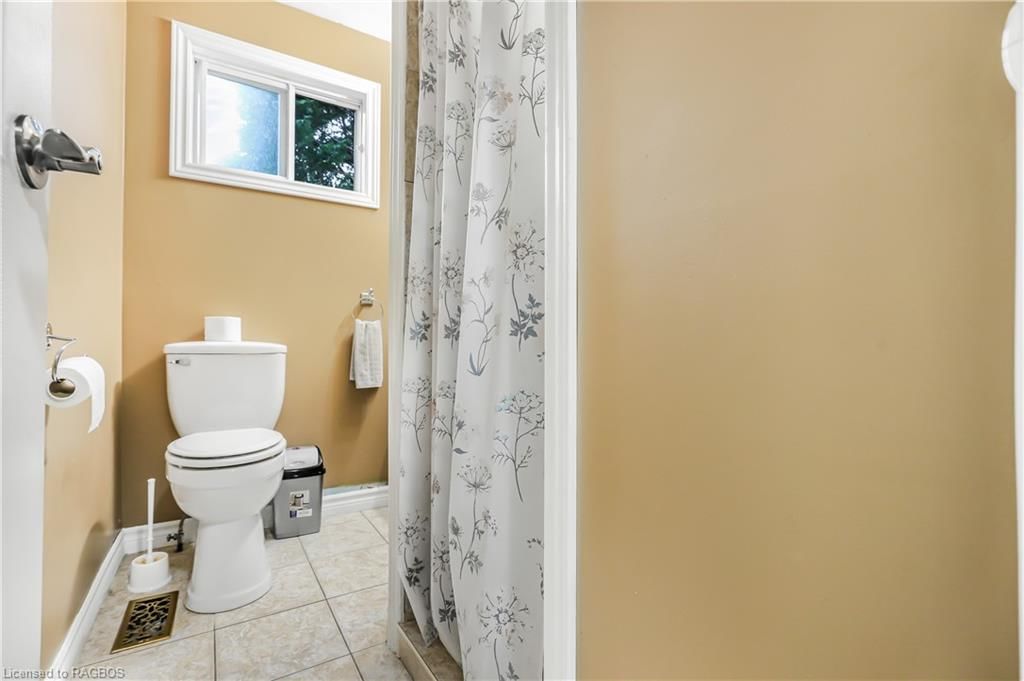
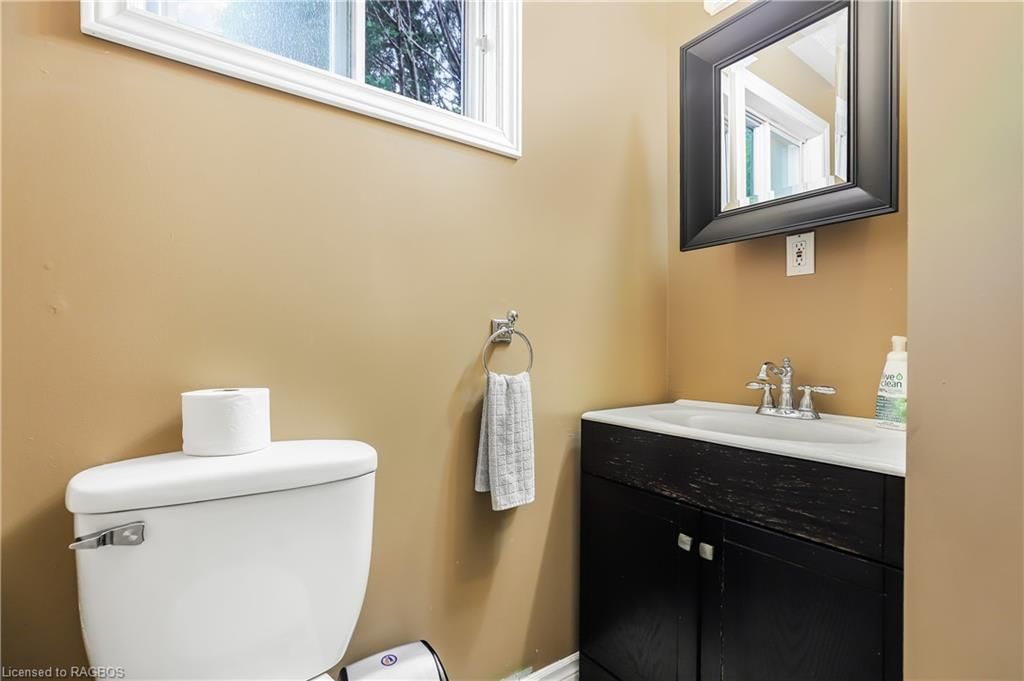
Bathroom
Bathroom
Dining Room
Foyer
Bedroom
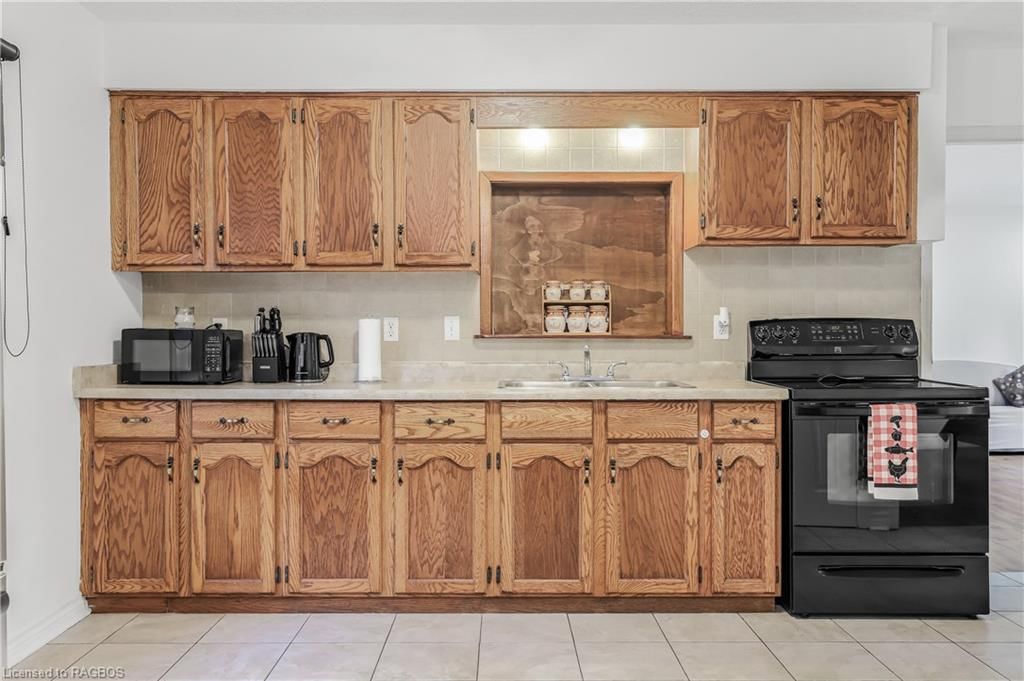
Kitchen
Bonus Room
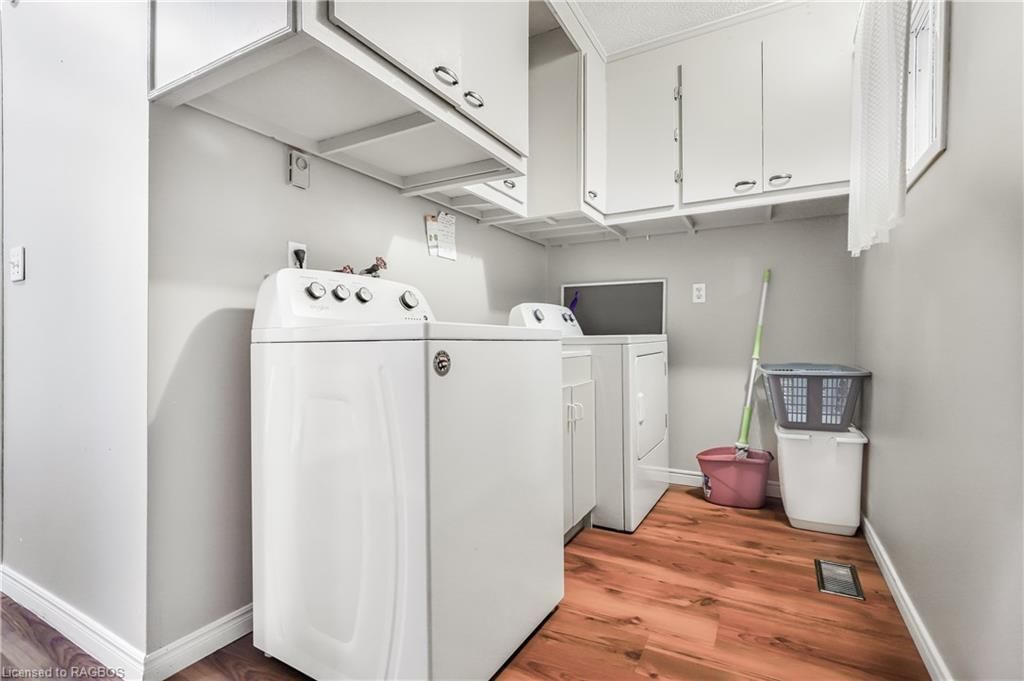
Laundry
The graph below compares the average list price and average sale price of homes in this neighborhood by month for the last 24 months. When average sale price is greater than average list price, this may suggest a buyer's market. When average sale price is lower than the average list price this may suggest a seller's market.
The graph below illustrates the average days on market for homes in this neighborhood. The yellow area may indicate a buyer's market, the green area may indicate a balanced market and the red area may indicate a seller's market.
Sales Representative, Century 21 People’s Choice Realty Inc., Brokerage
(647) 576 - 2100