

Century 21 People’s Choice Realty Inc., Brokerage
120 MATHESON BLVD E #103
MISSISSAUGA, Ontario
L4Z 1X1

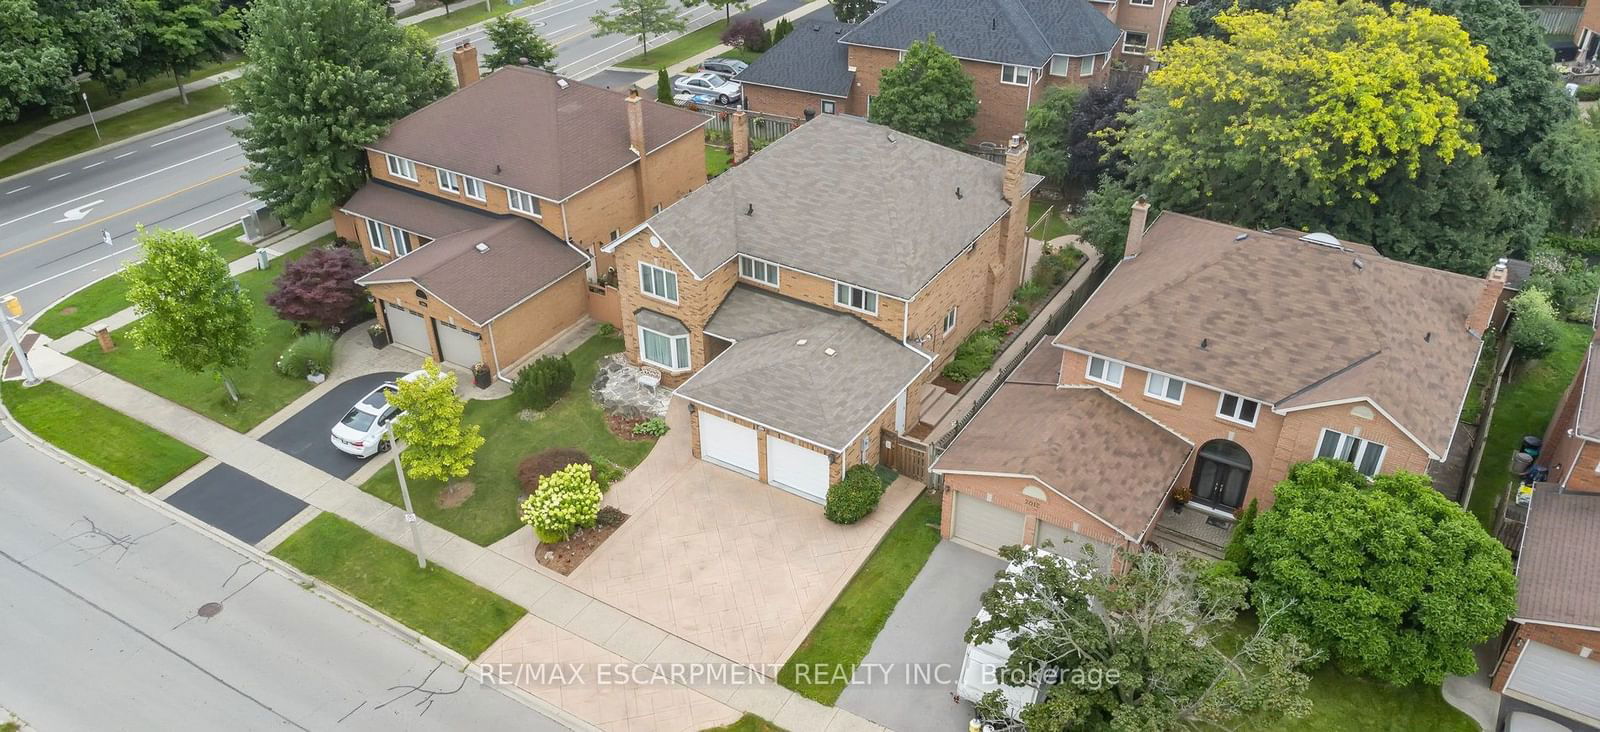
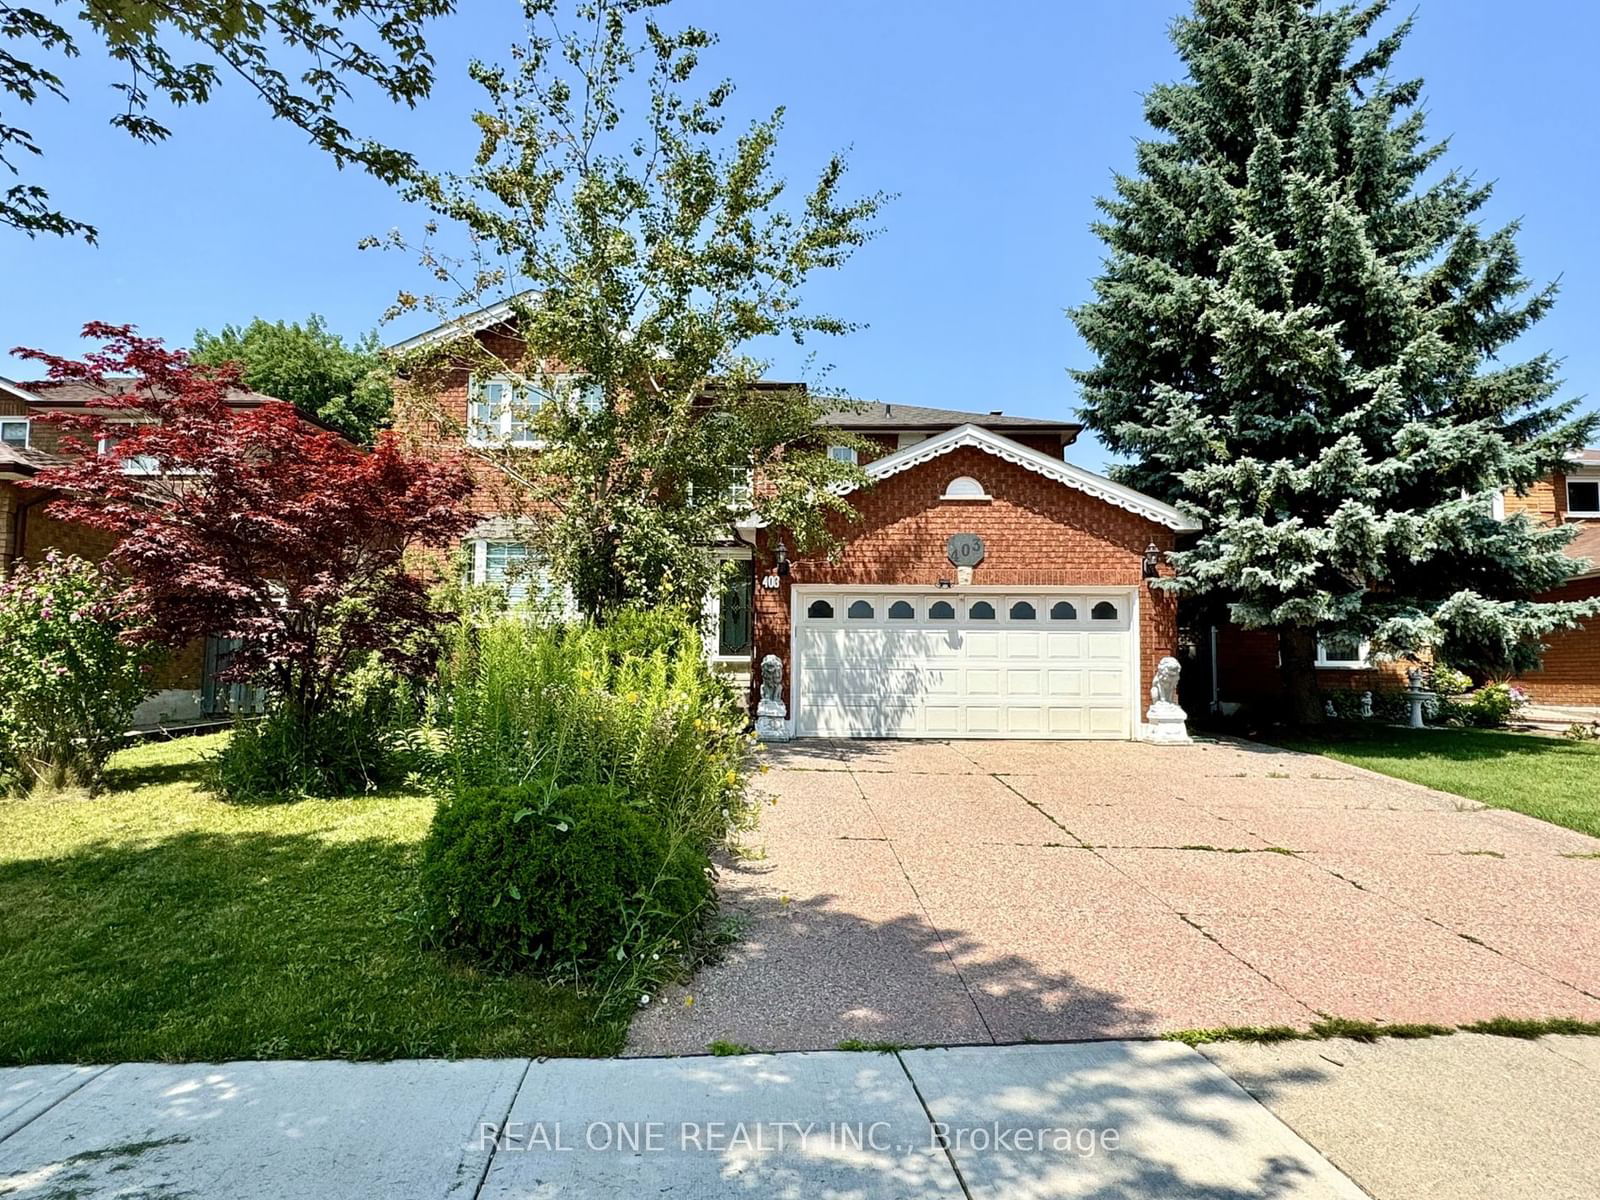
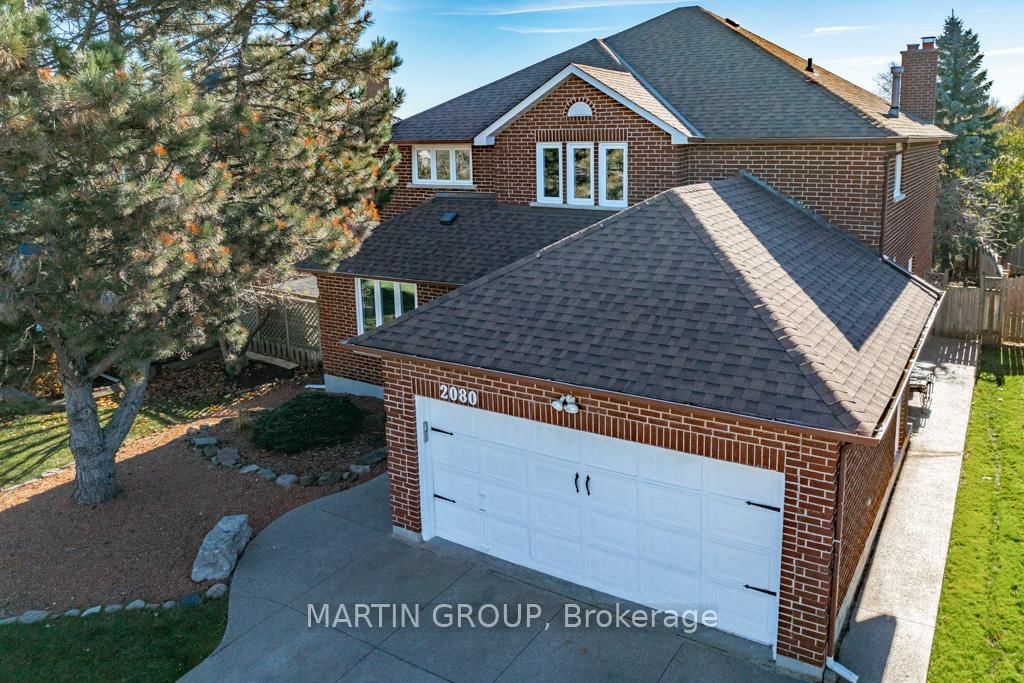
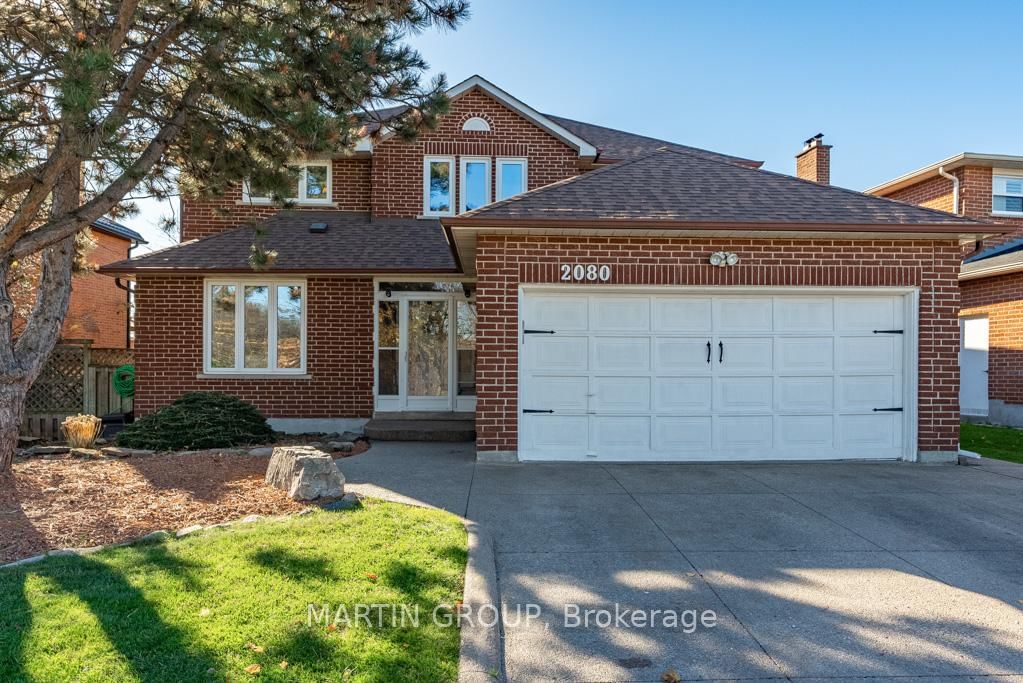
Oakville, FA Falgarwood, L6H 4R3
$1,688,800
Listed by Re/Max Hallmark Alliance Realty.
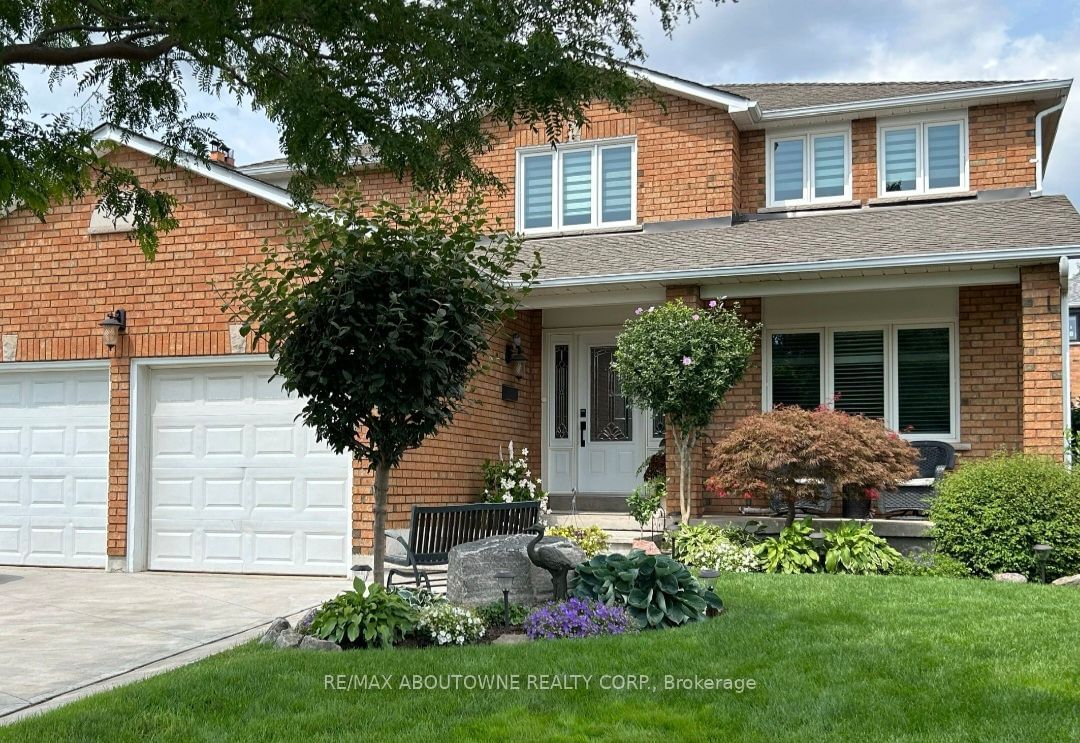
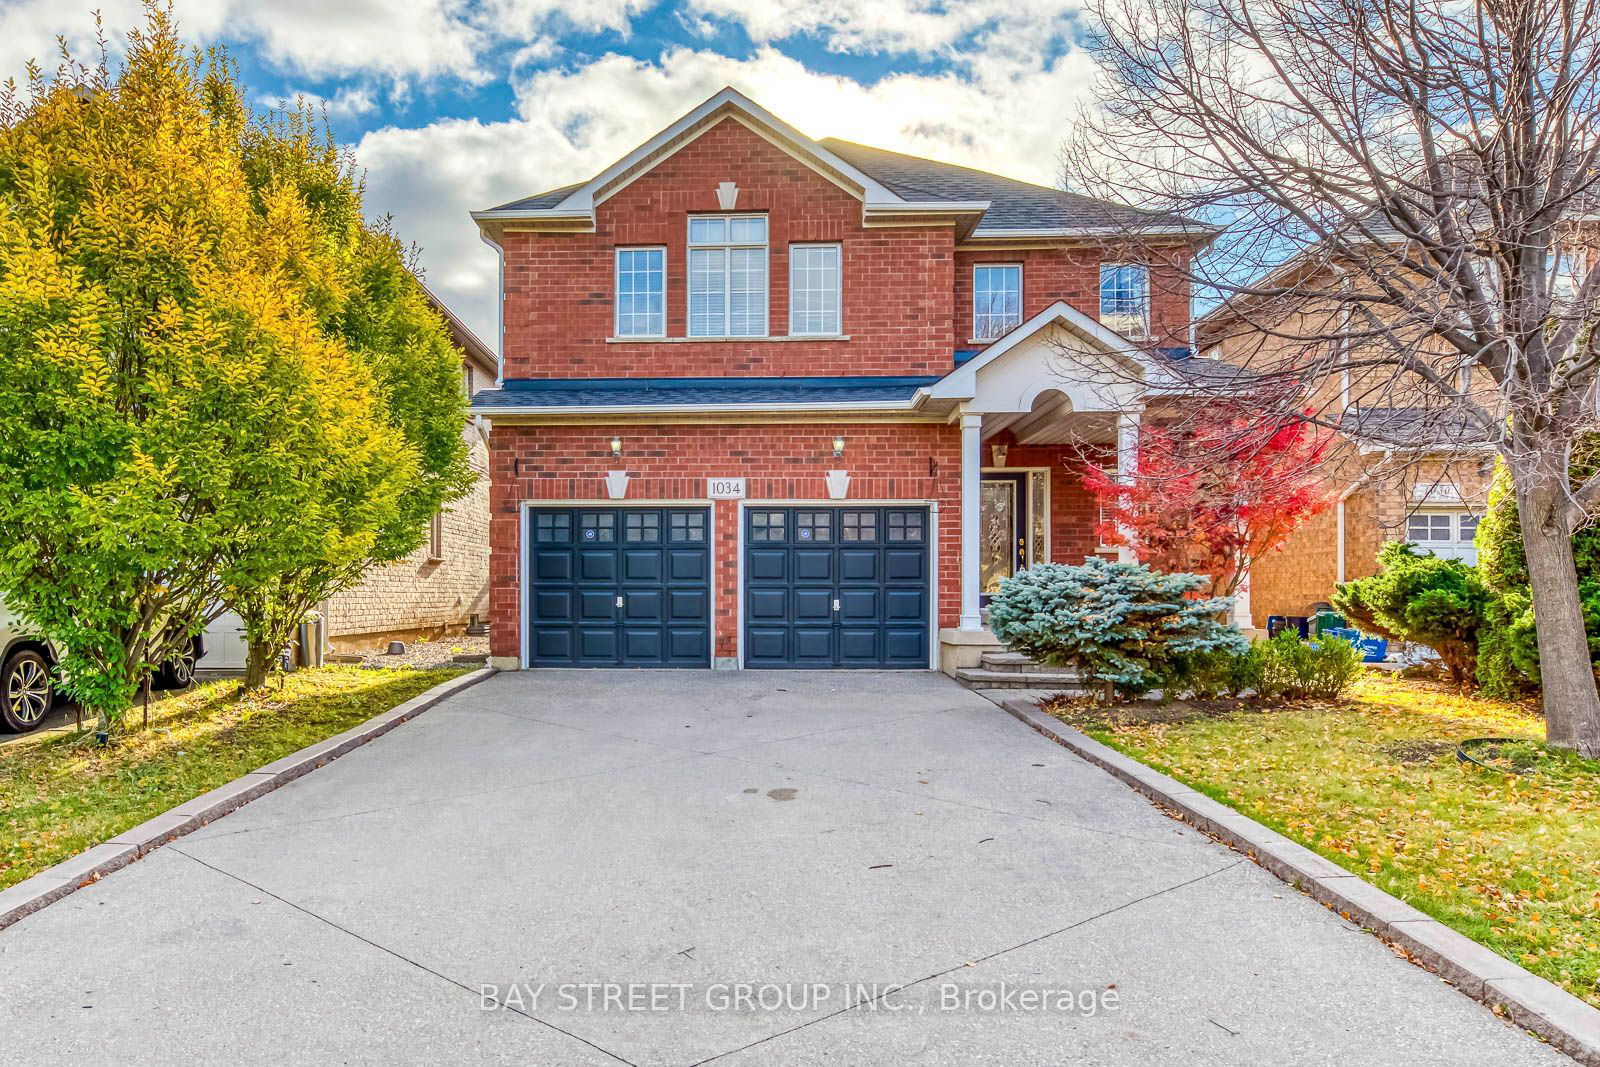
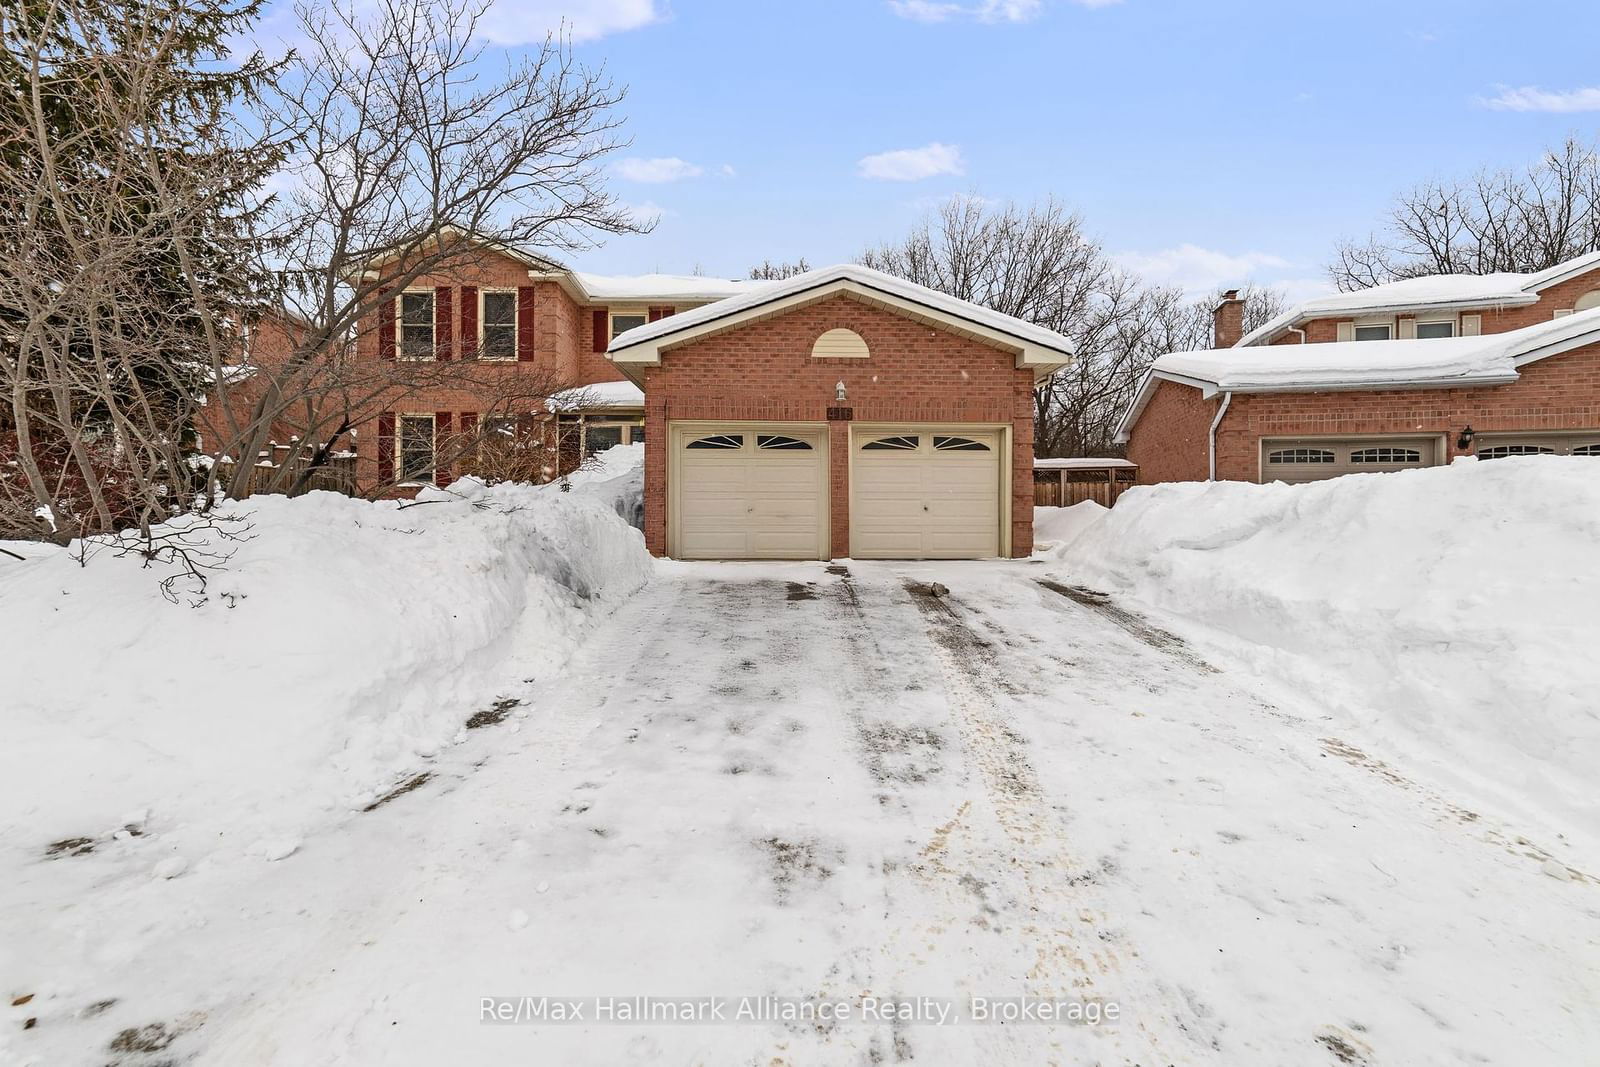
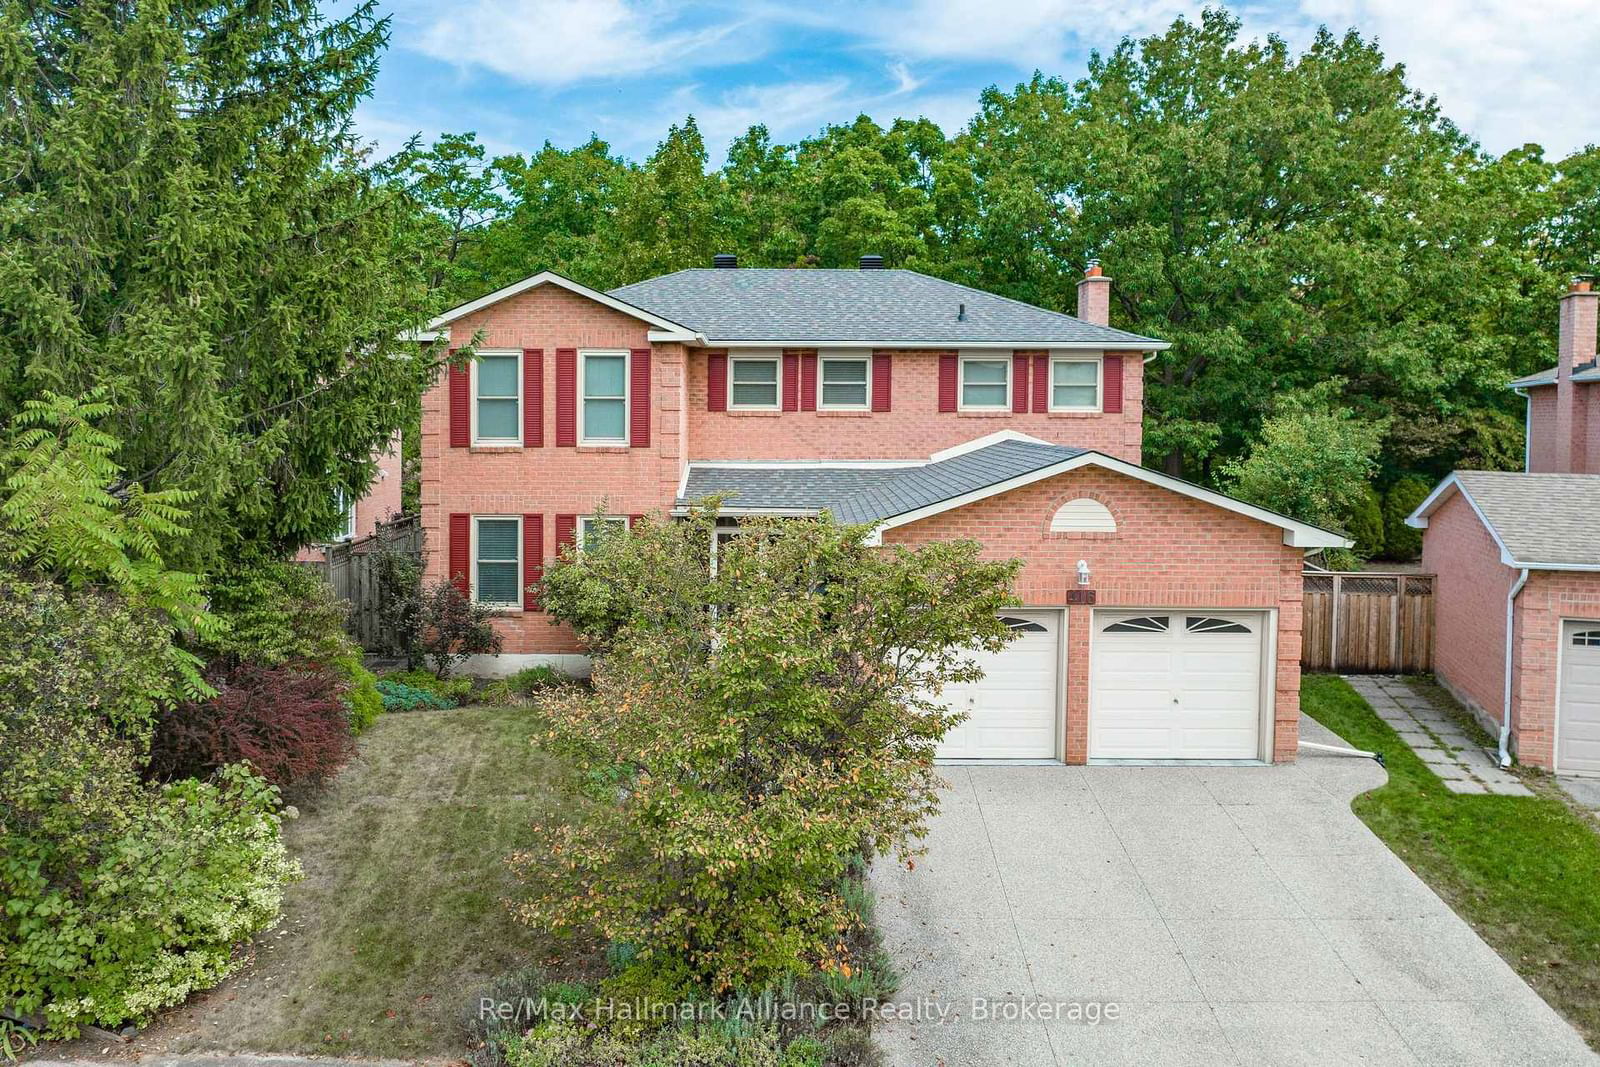
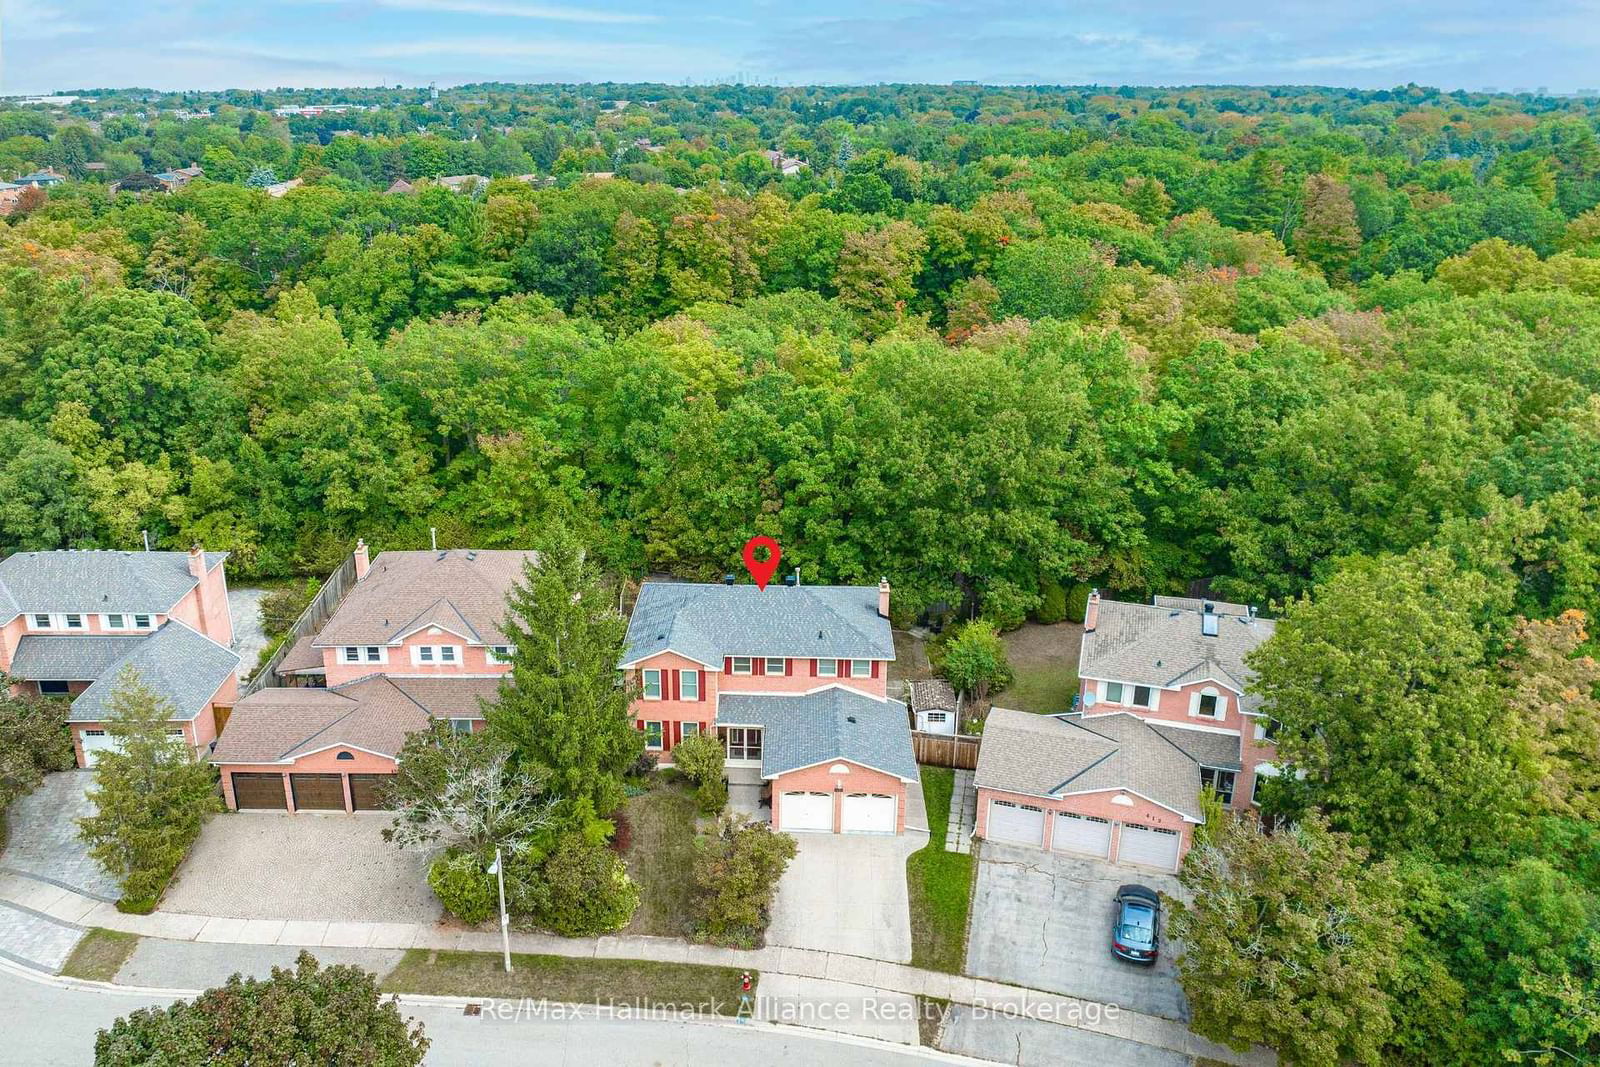
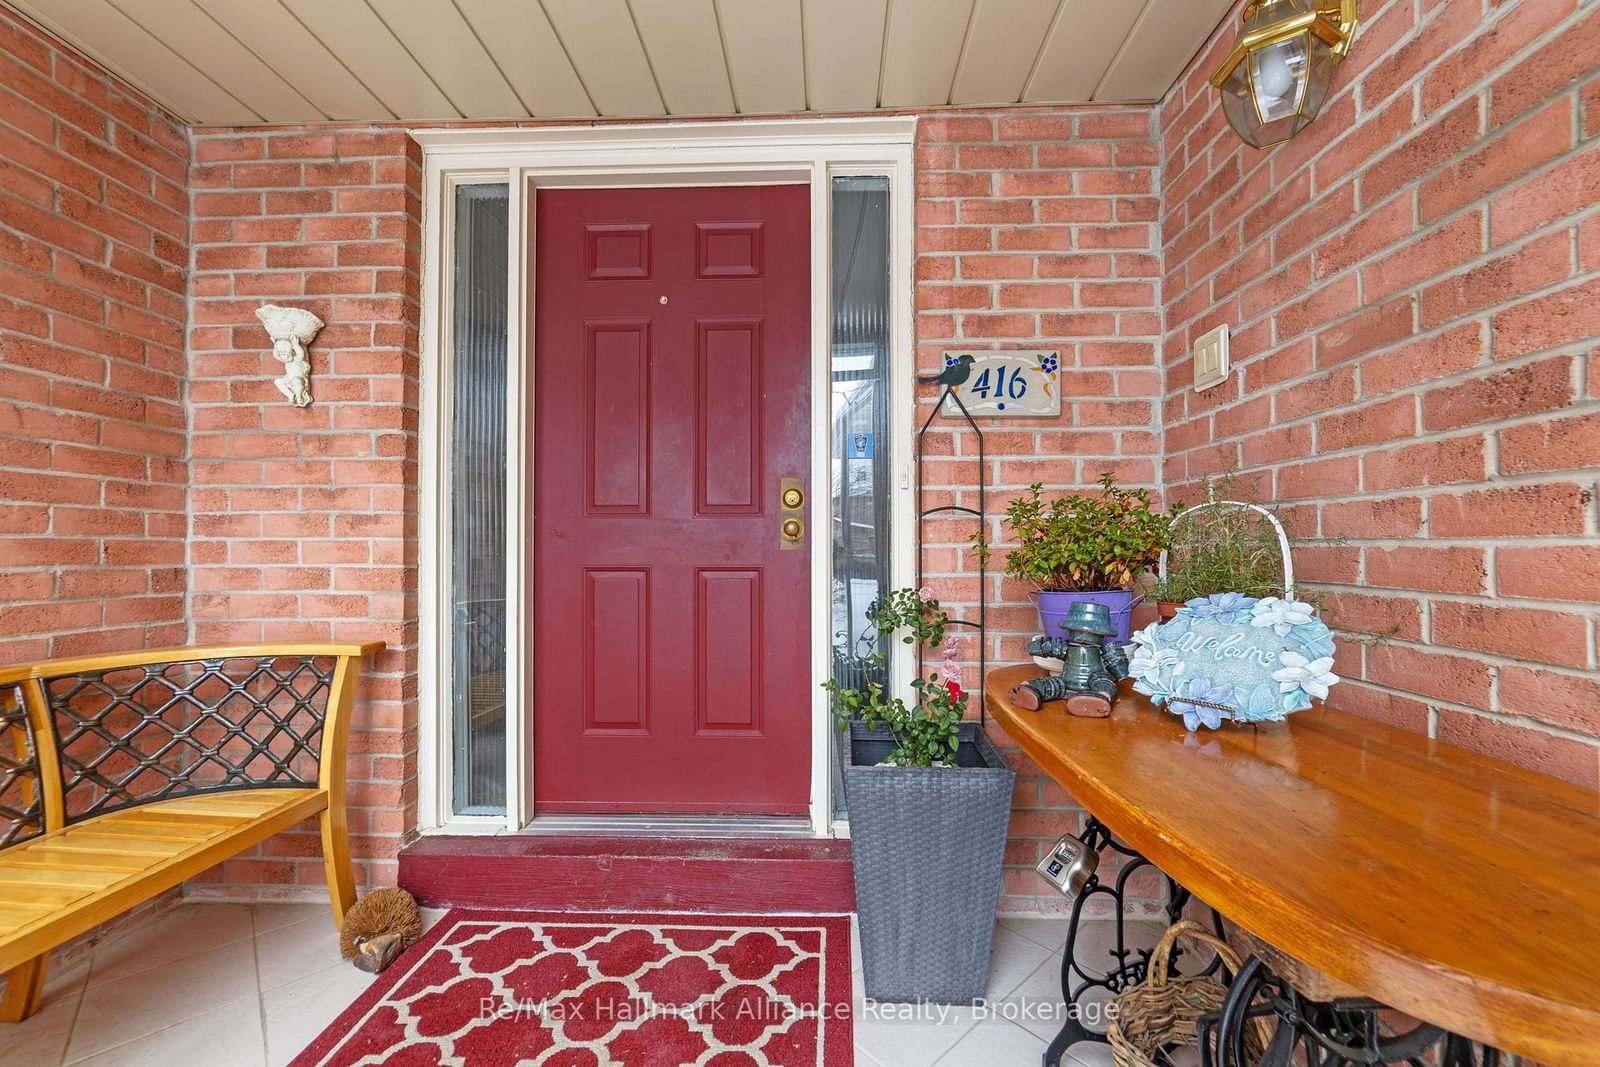
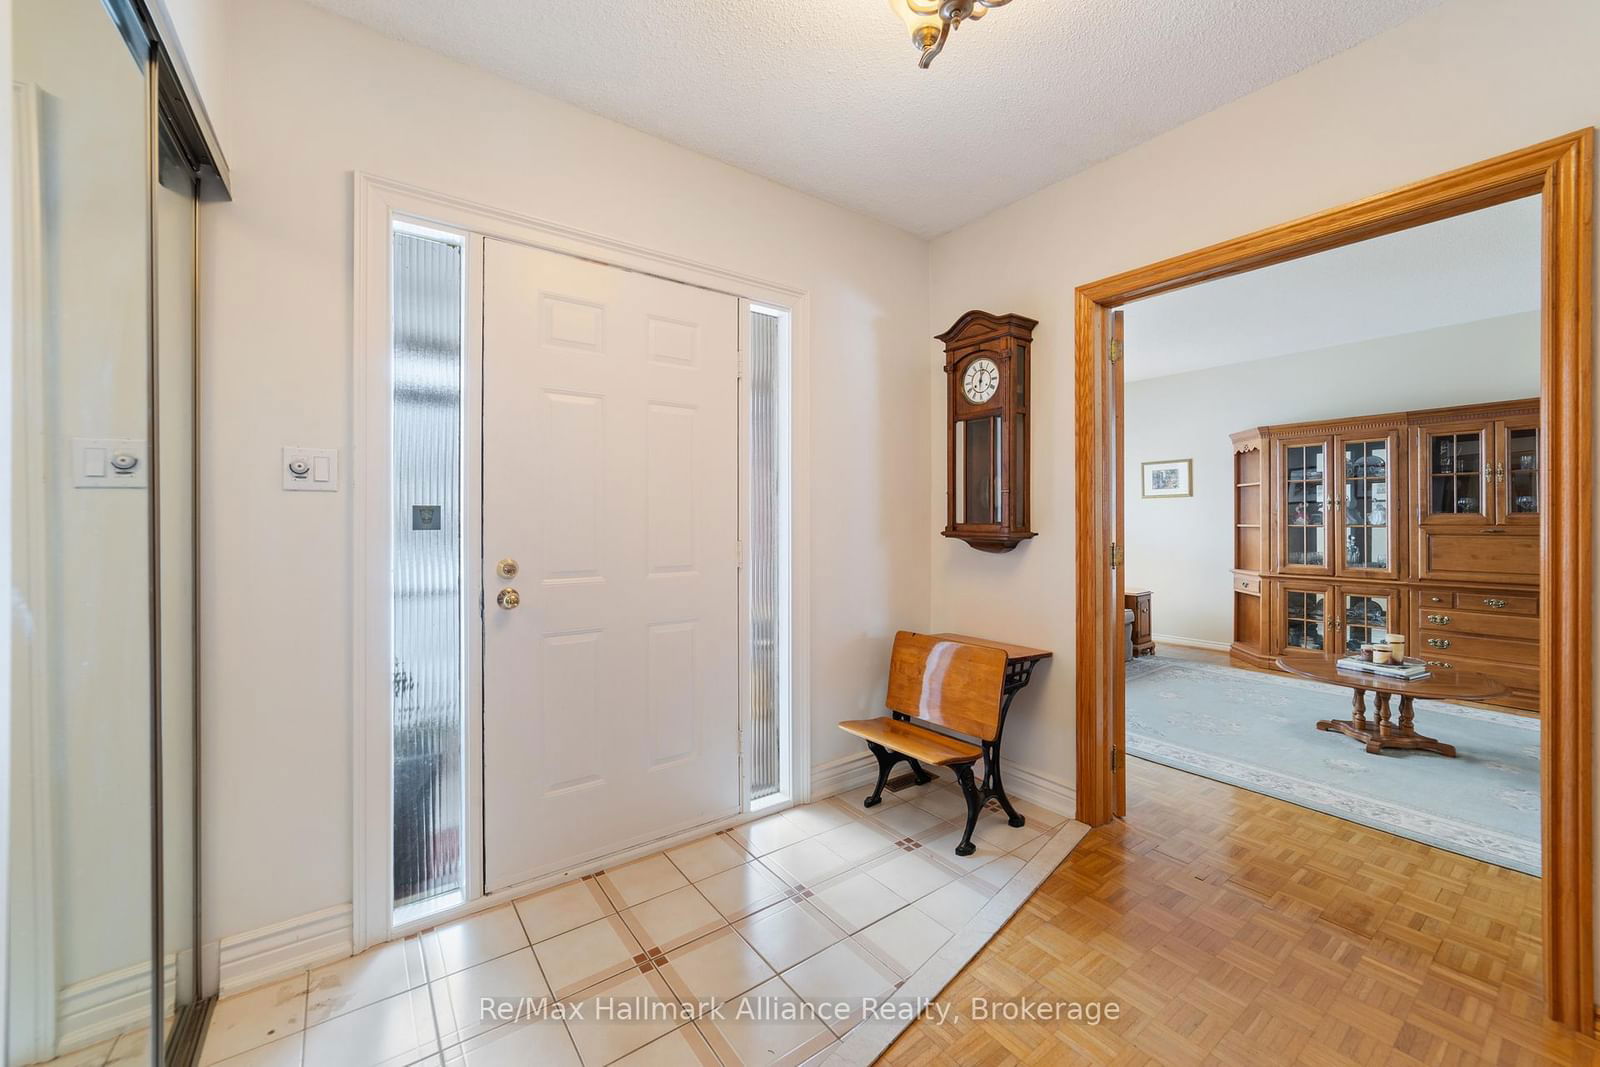
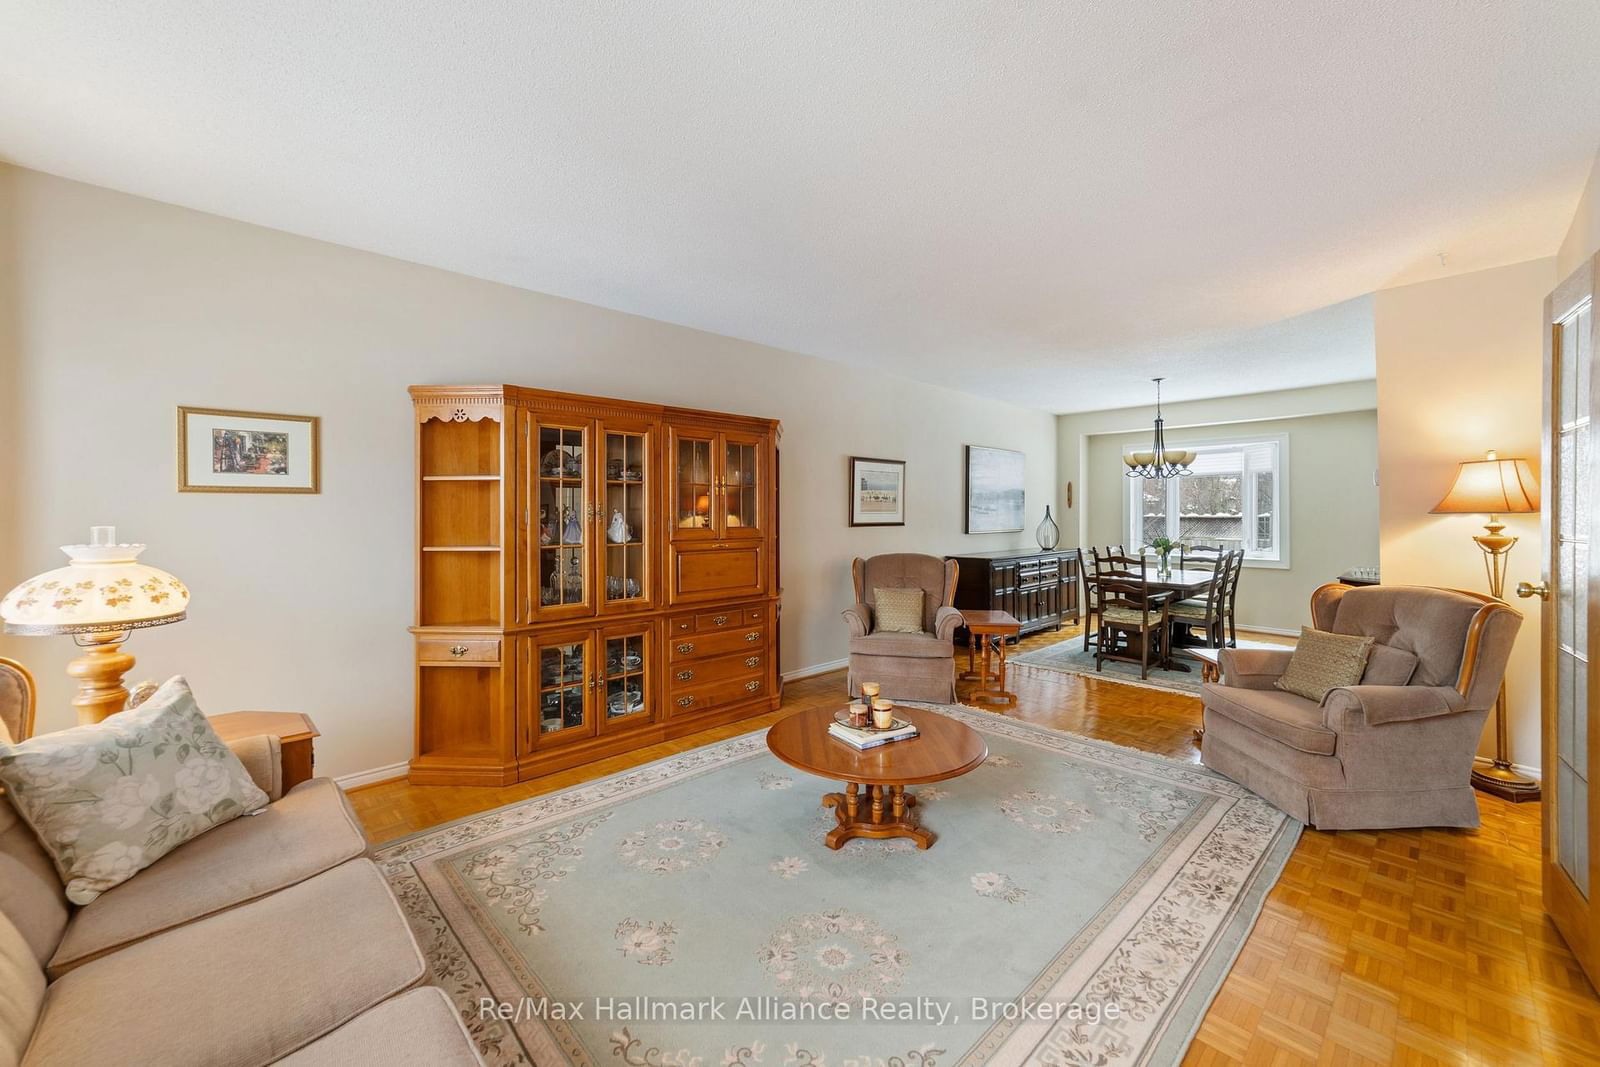
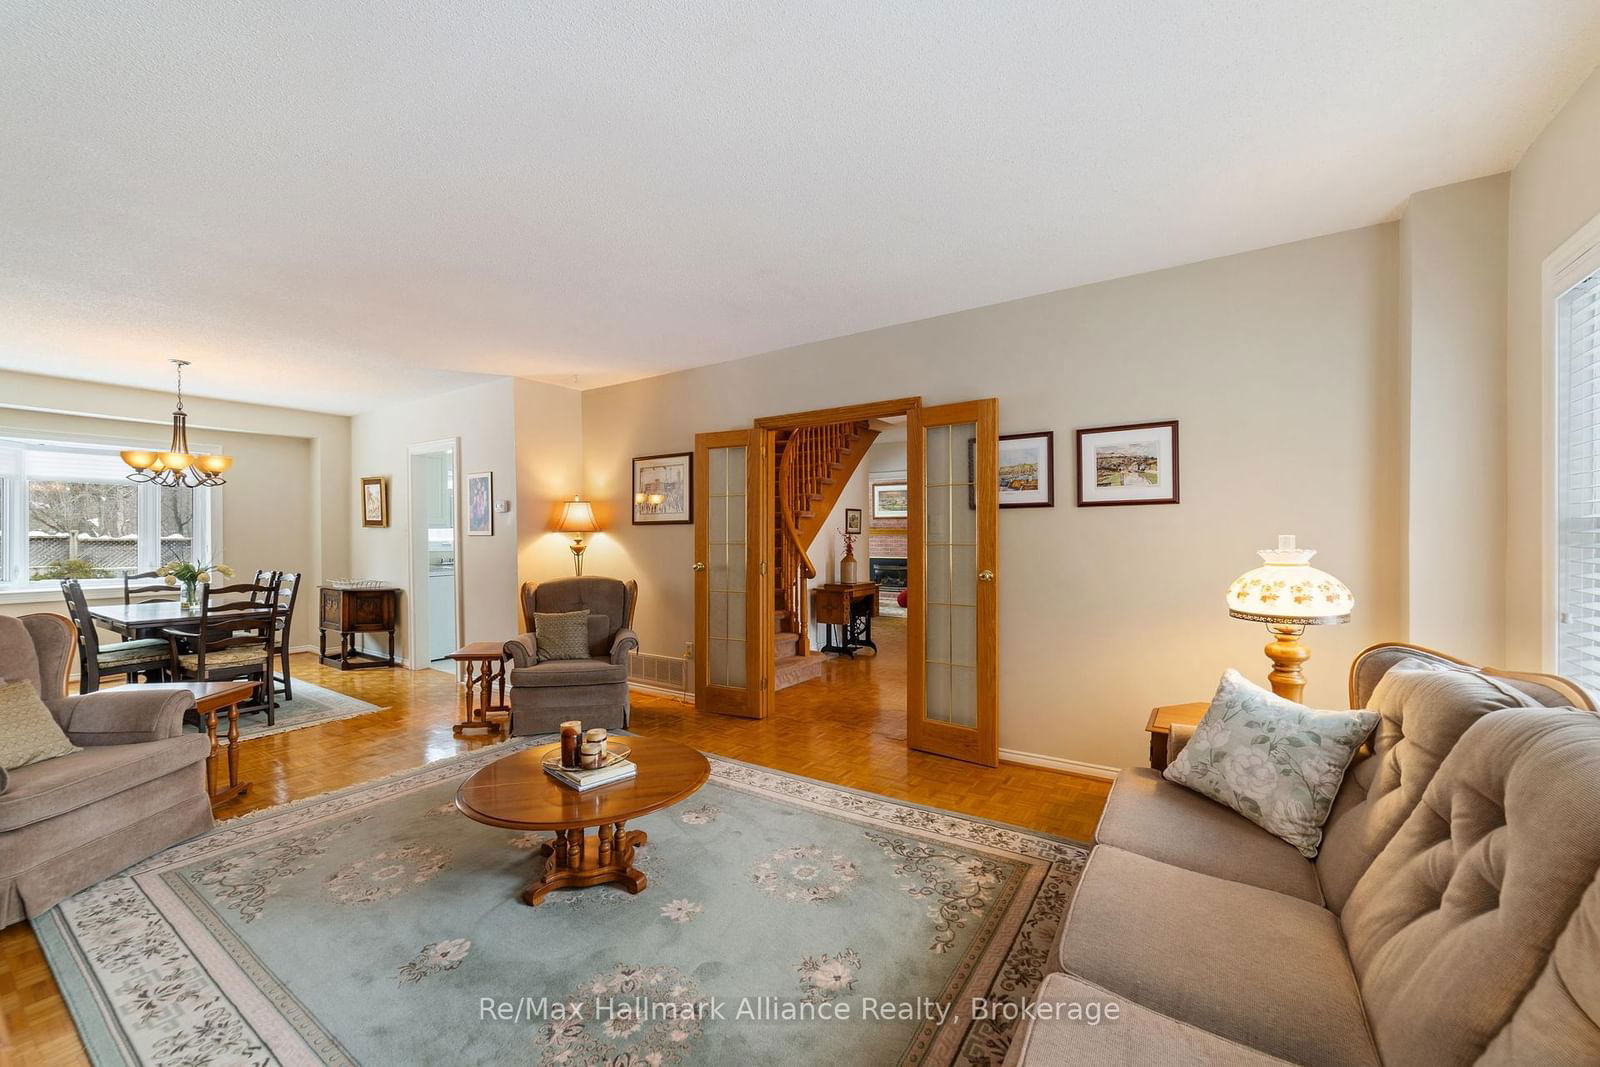
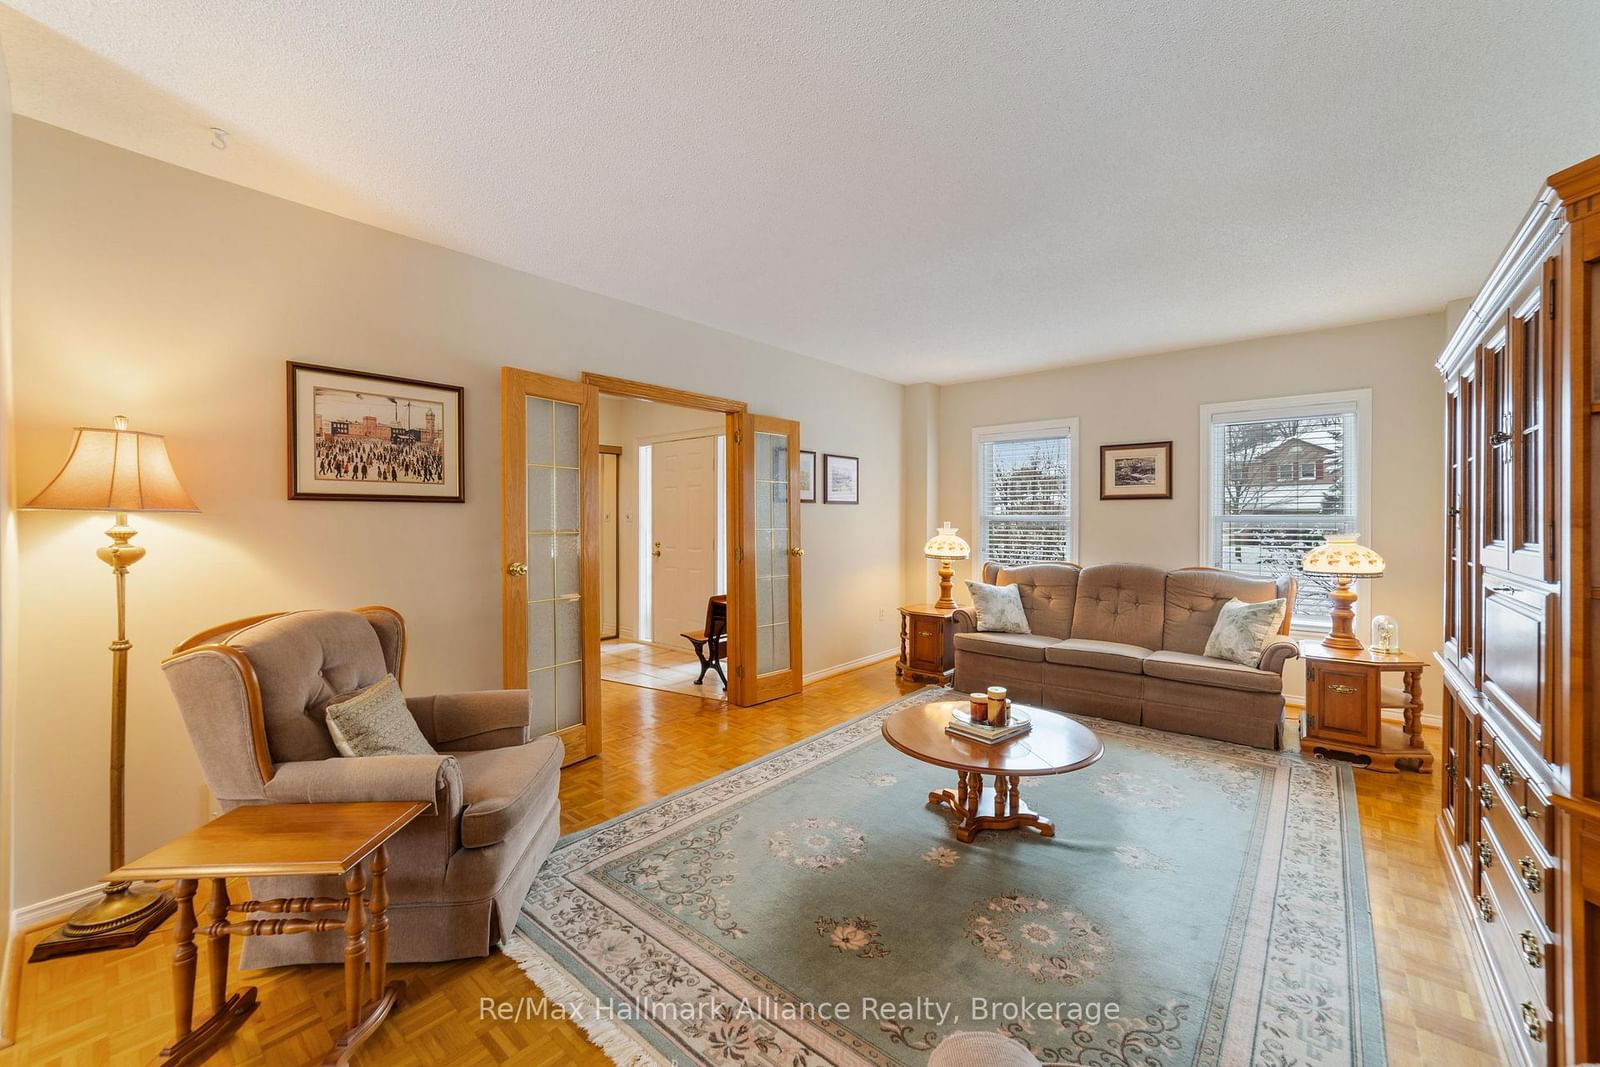
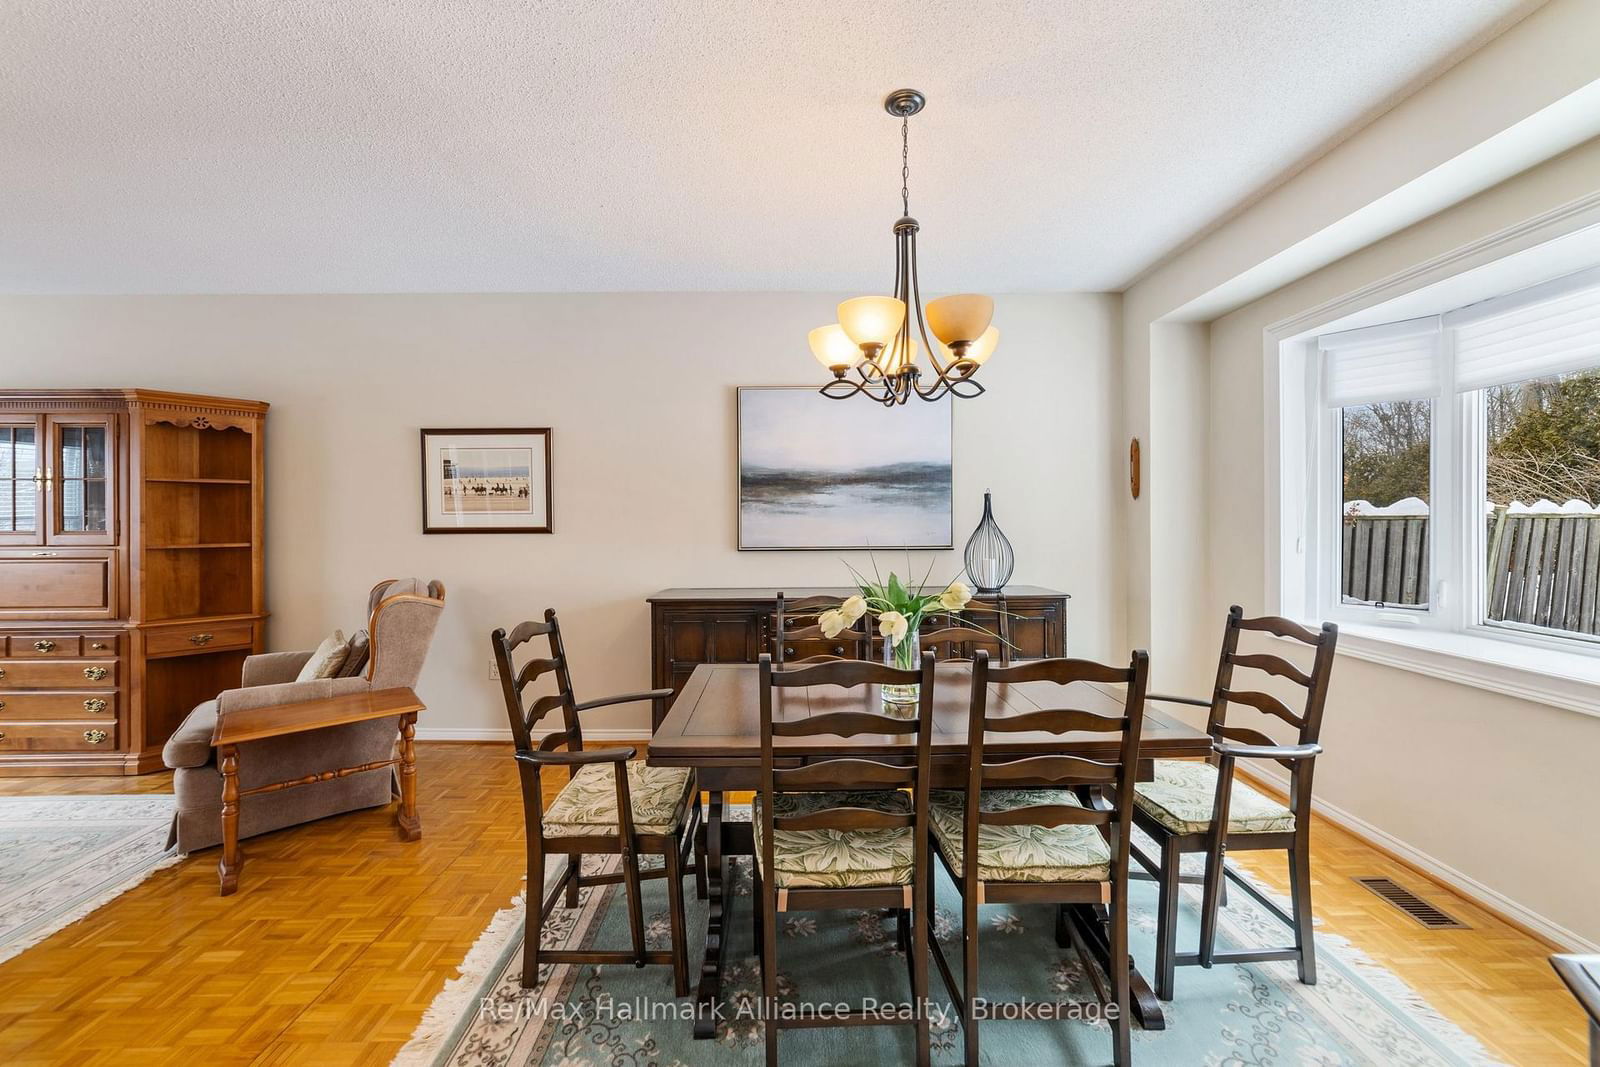
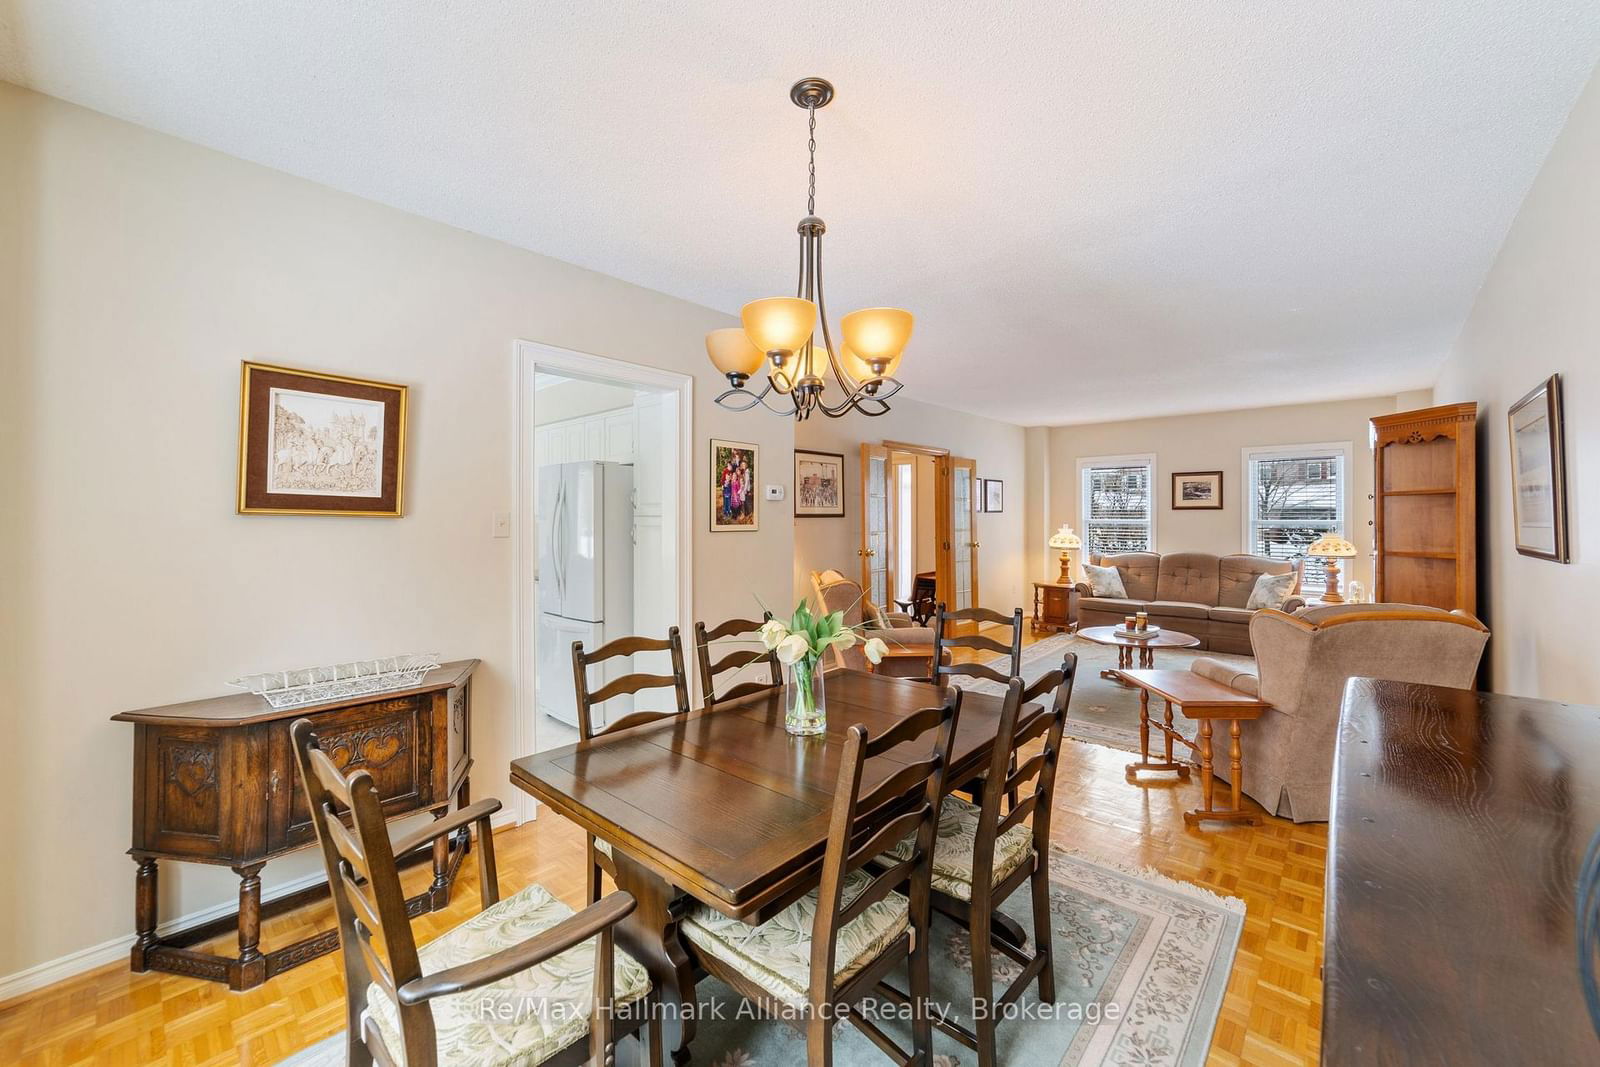
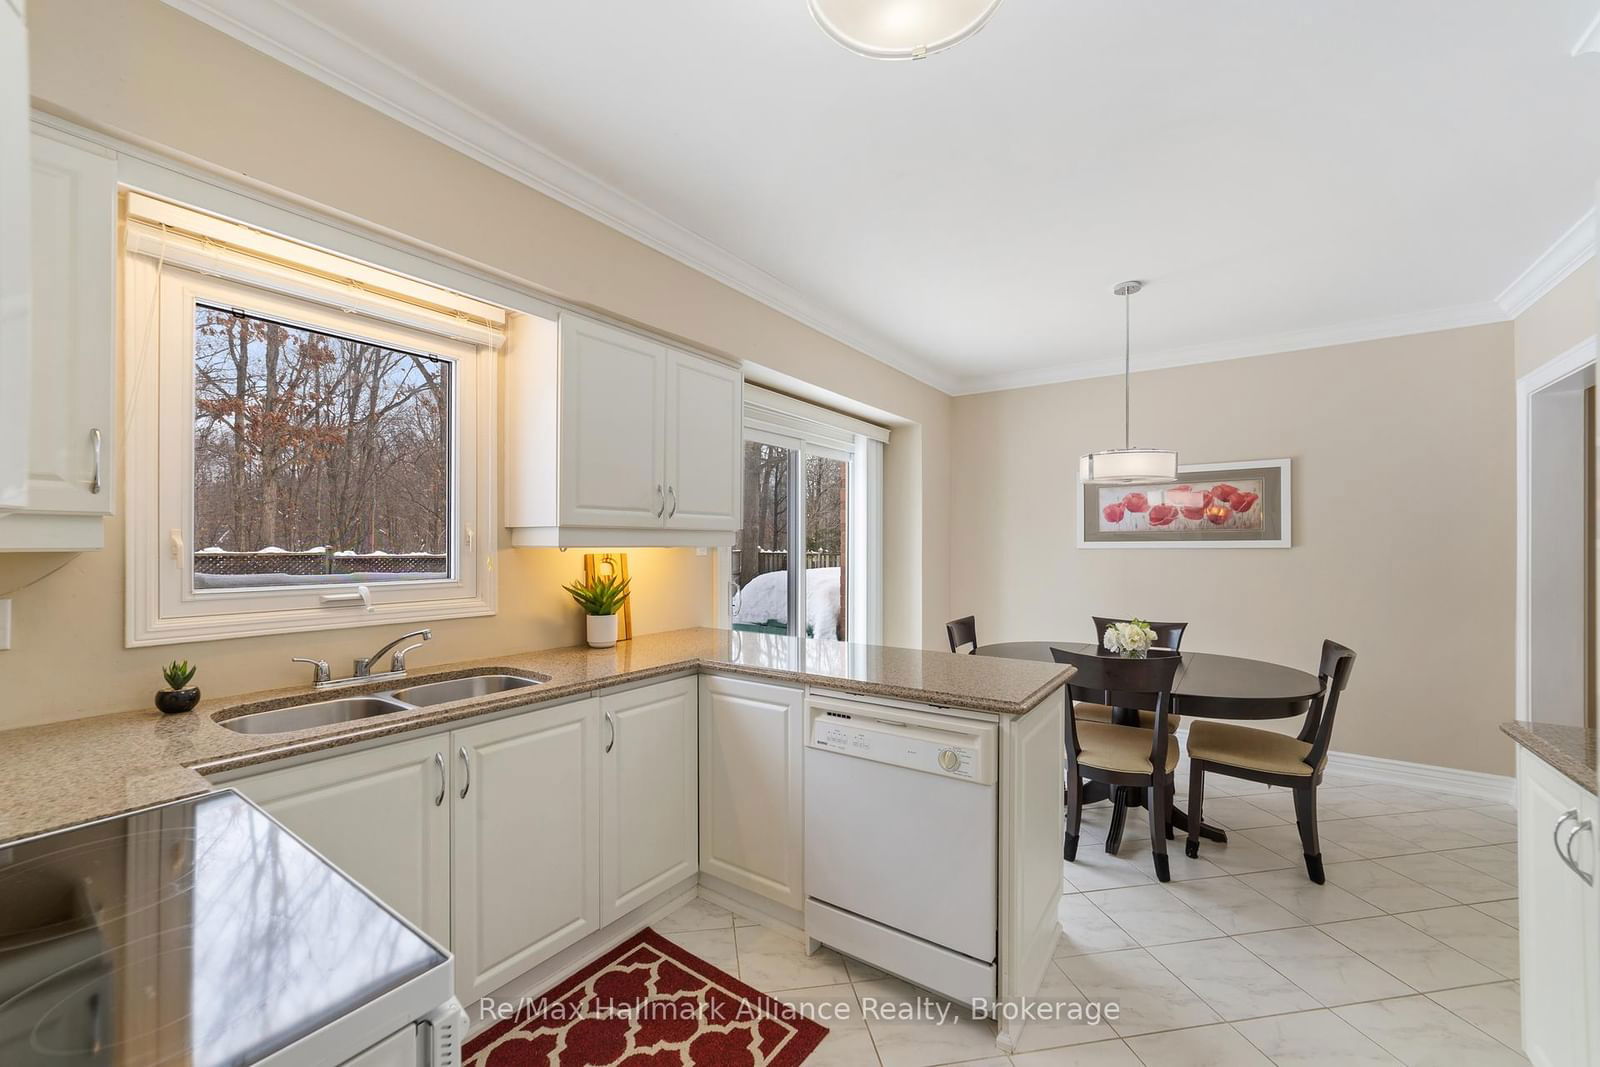
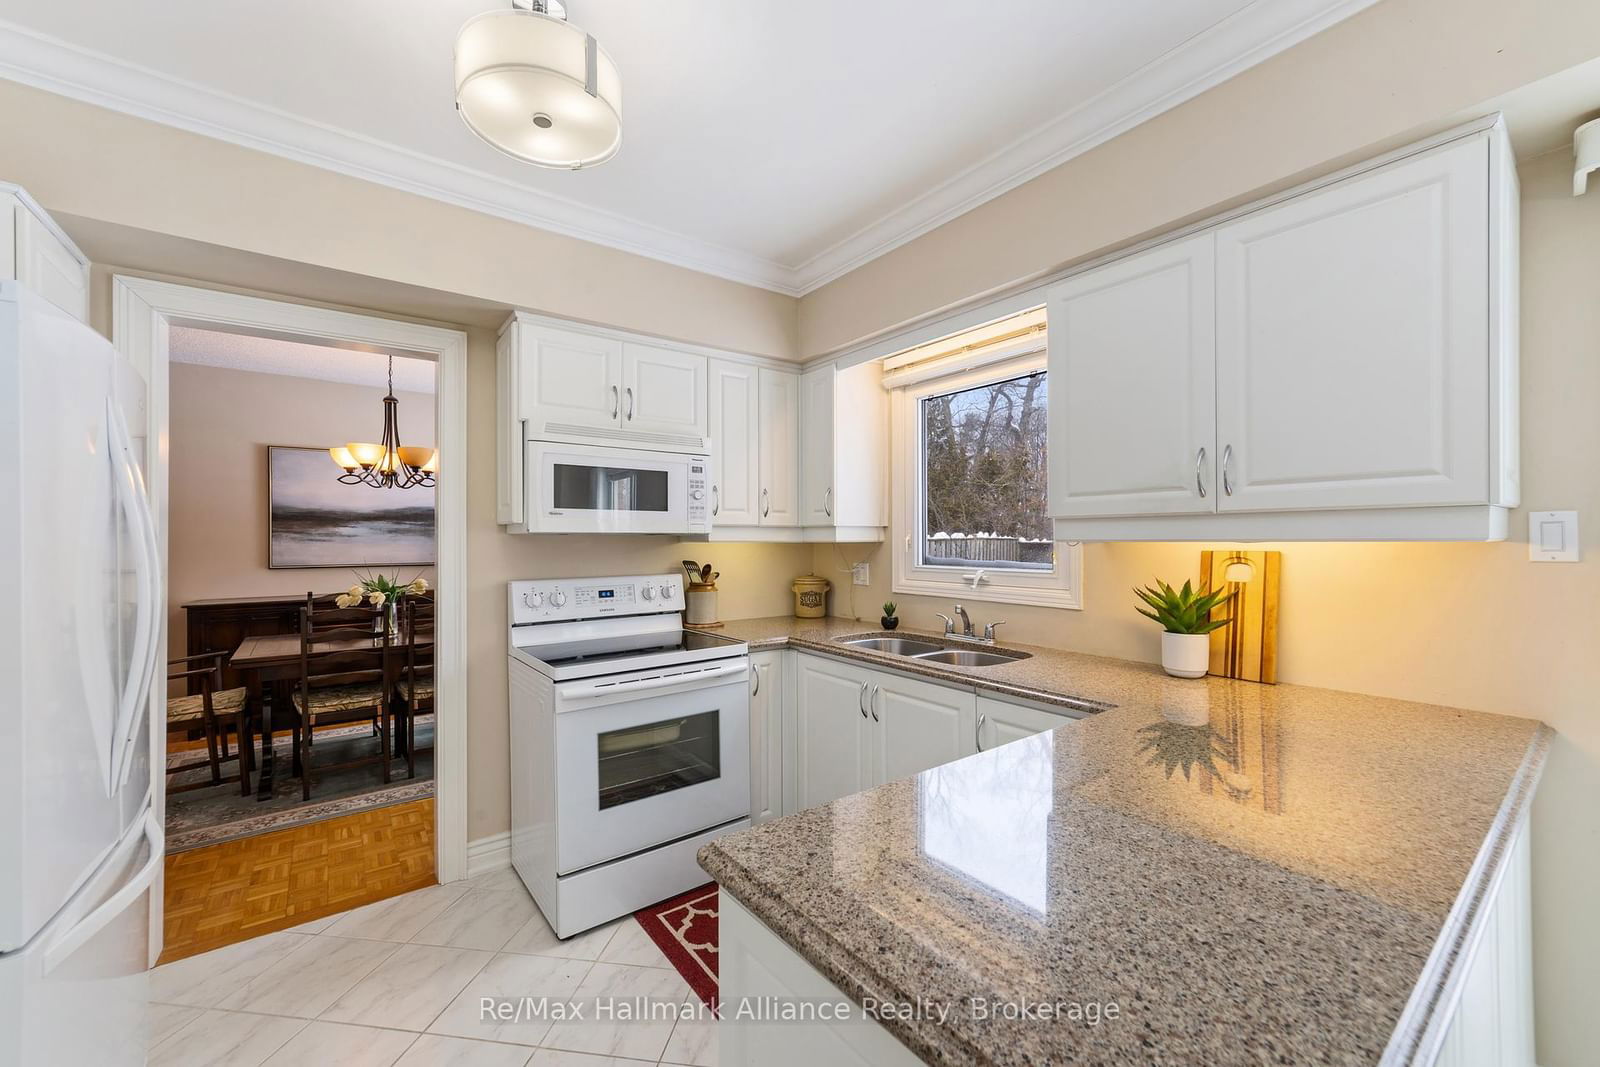
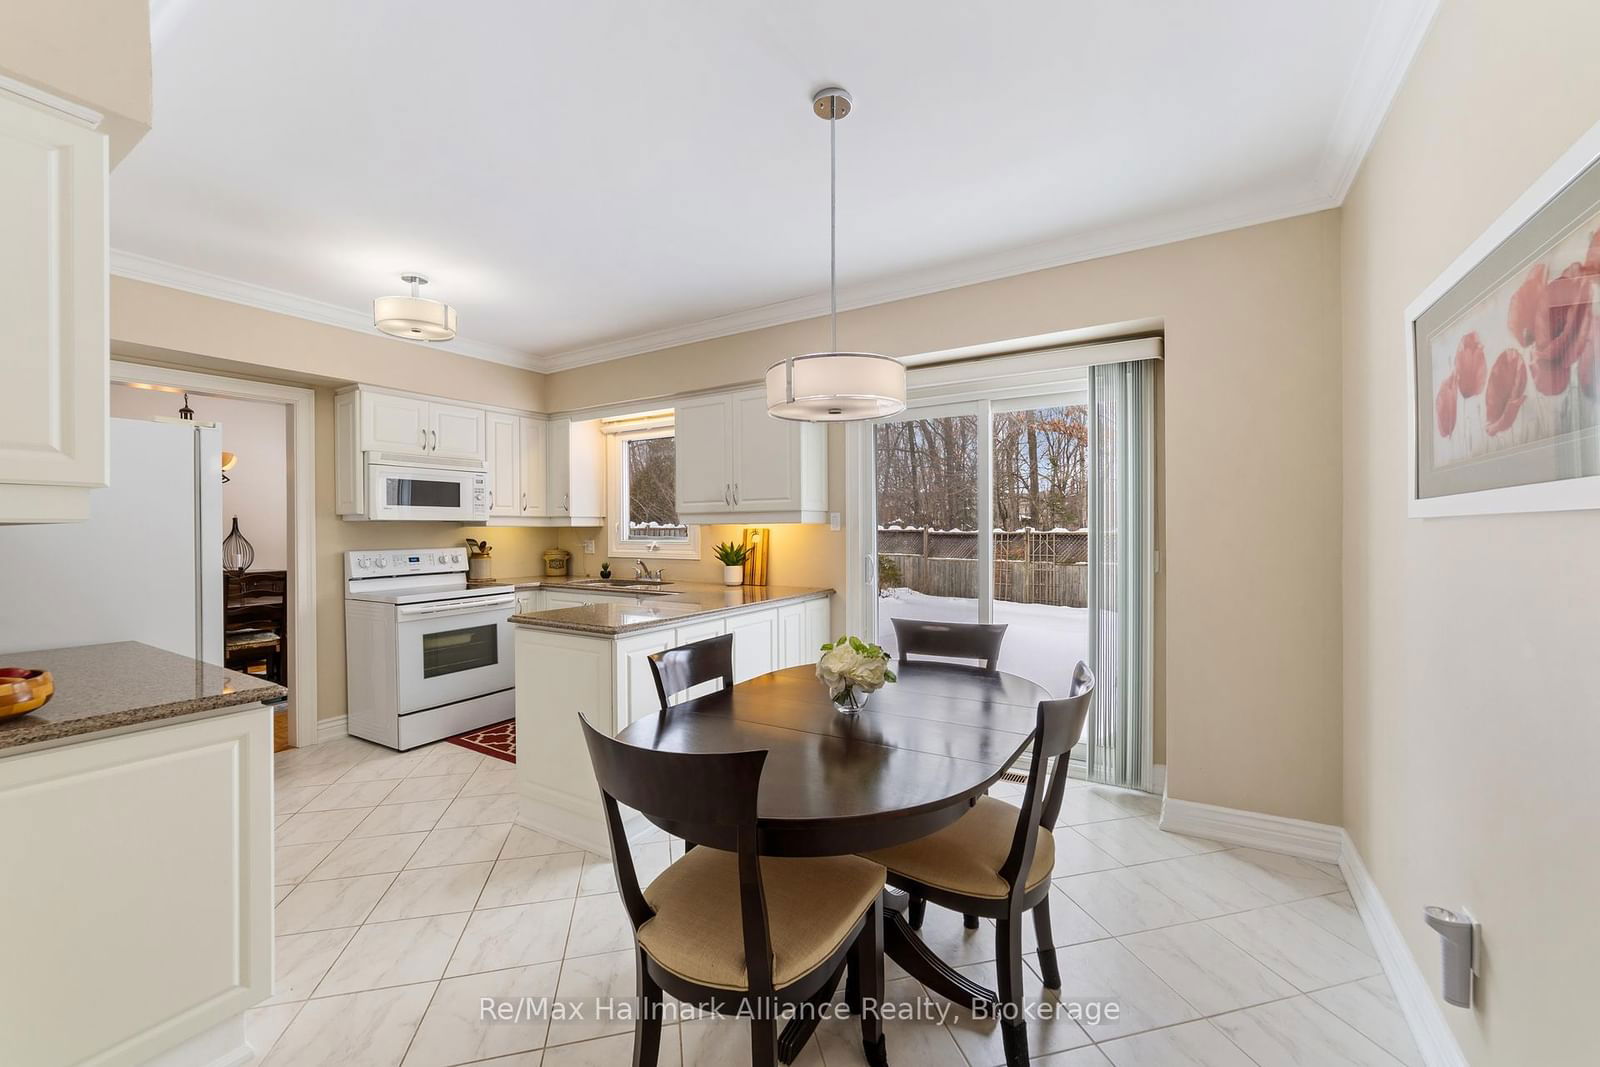
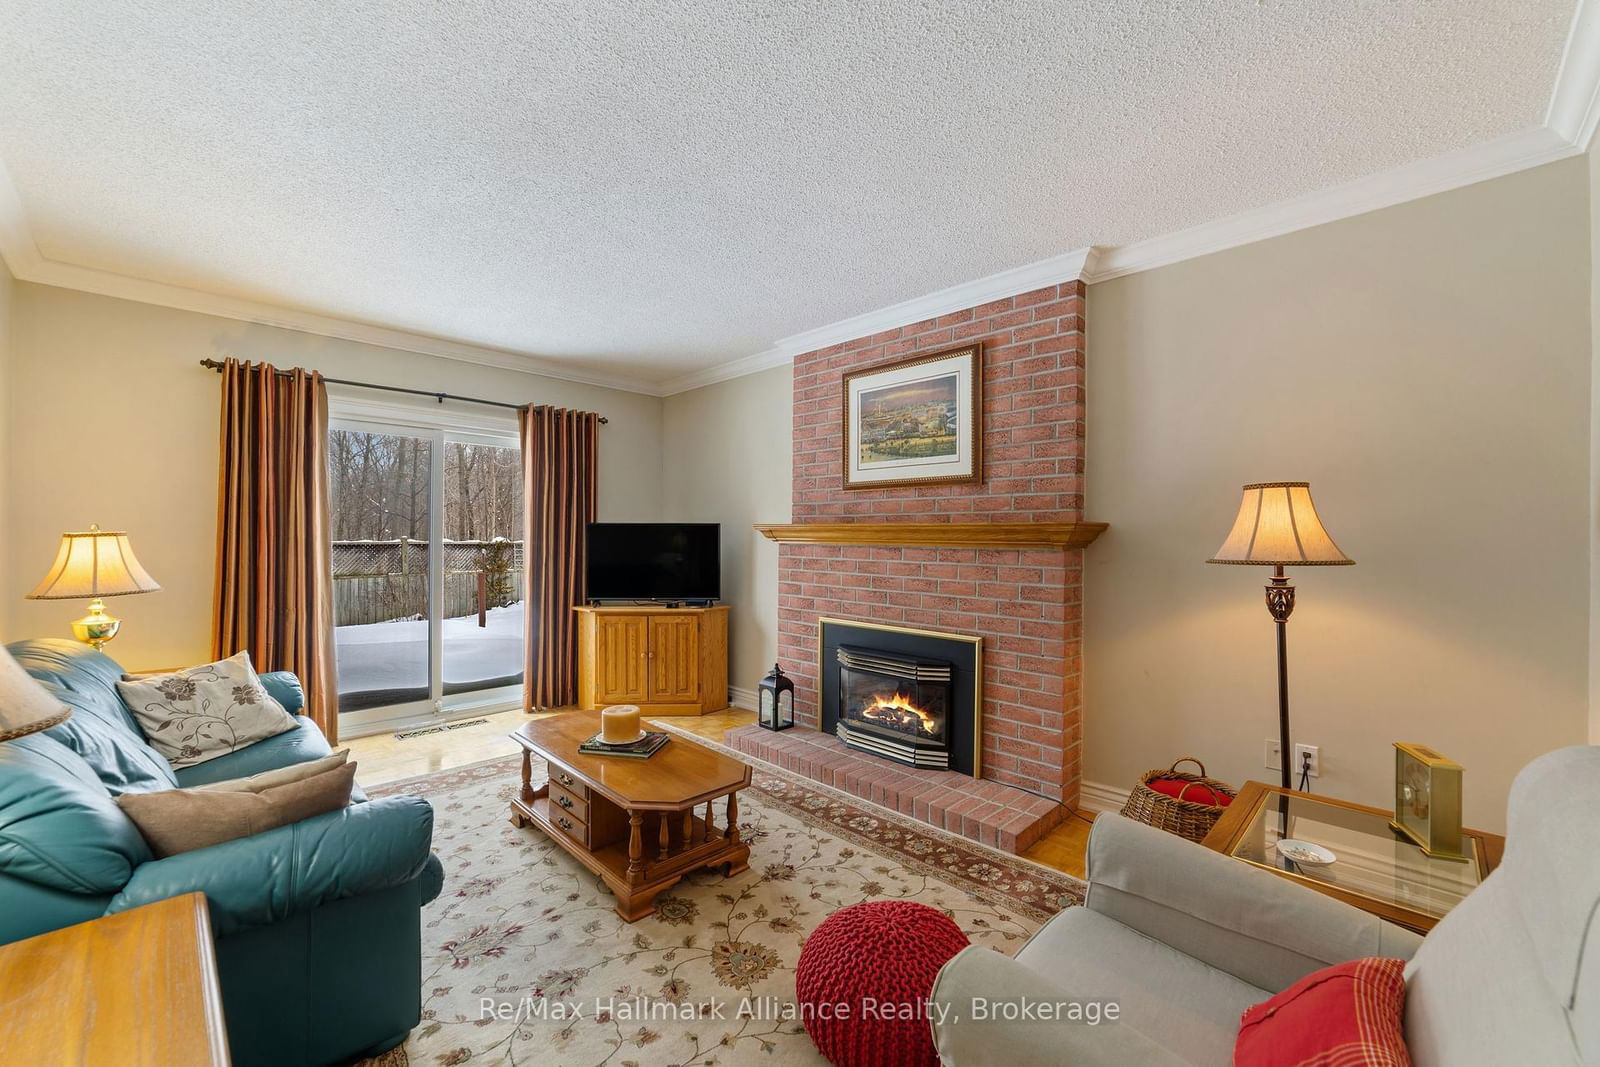
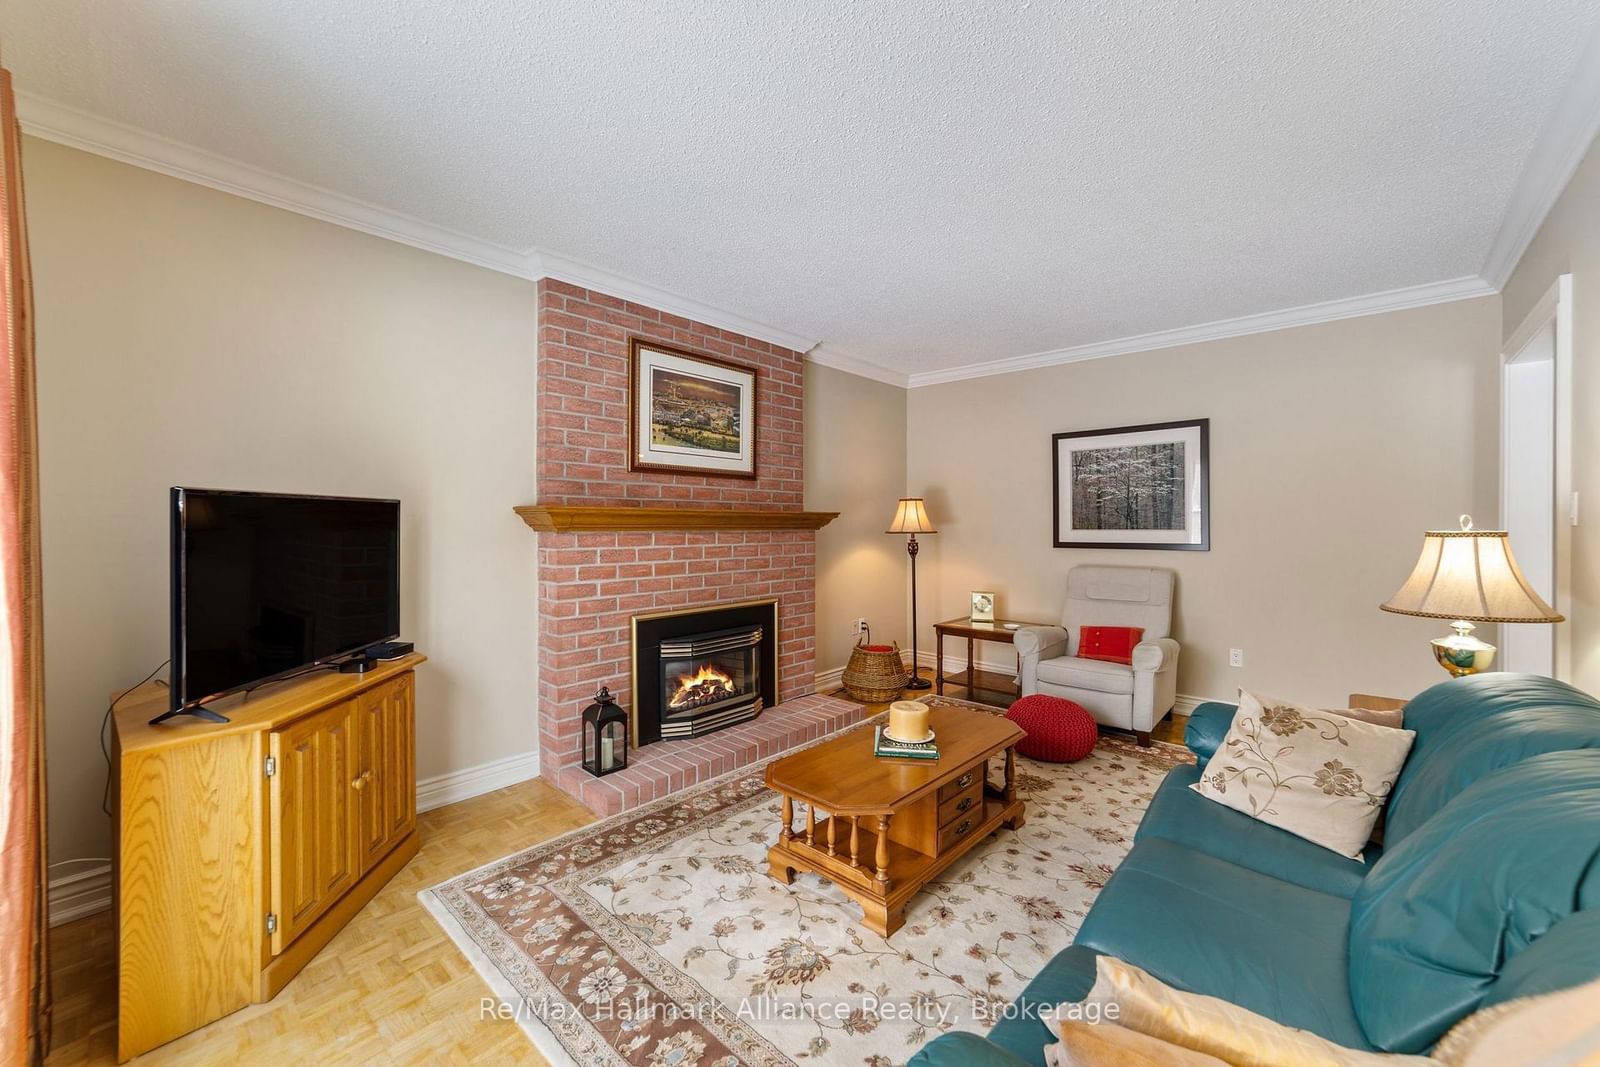
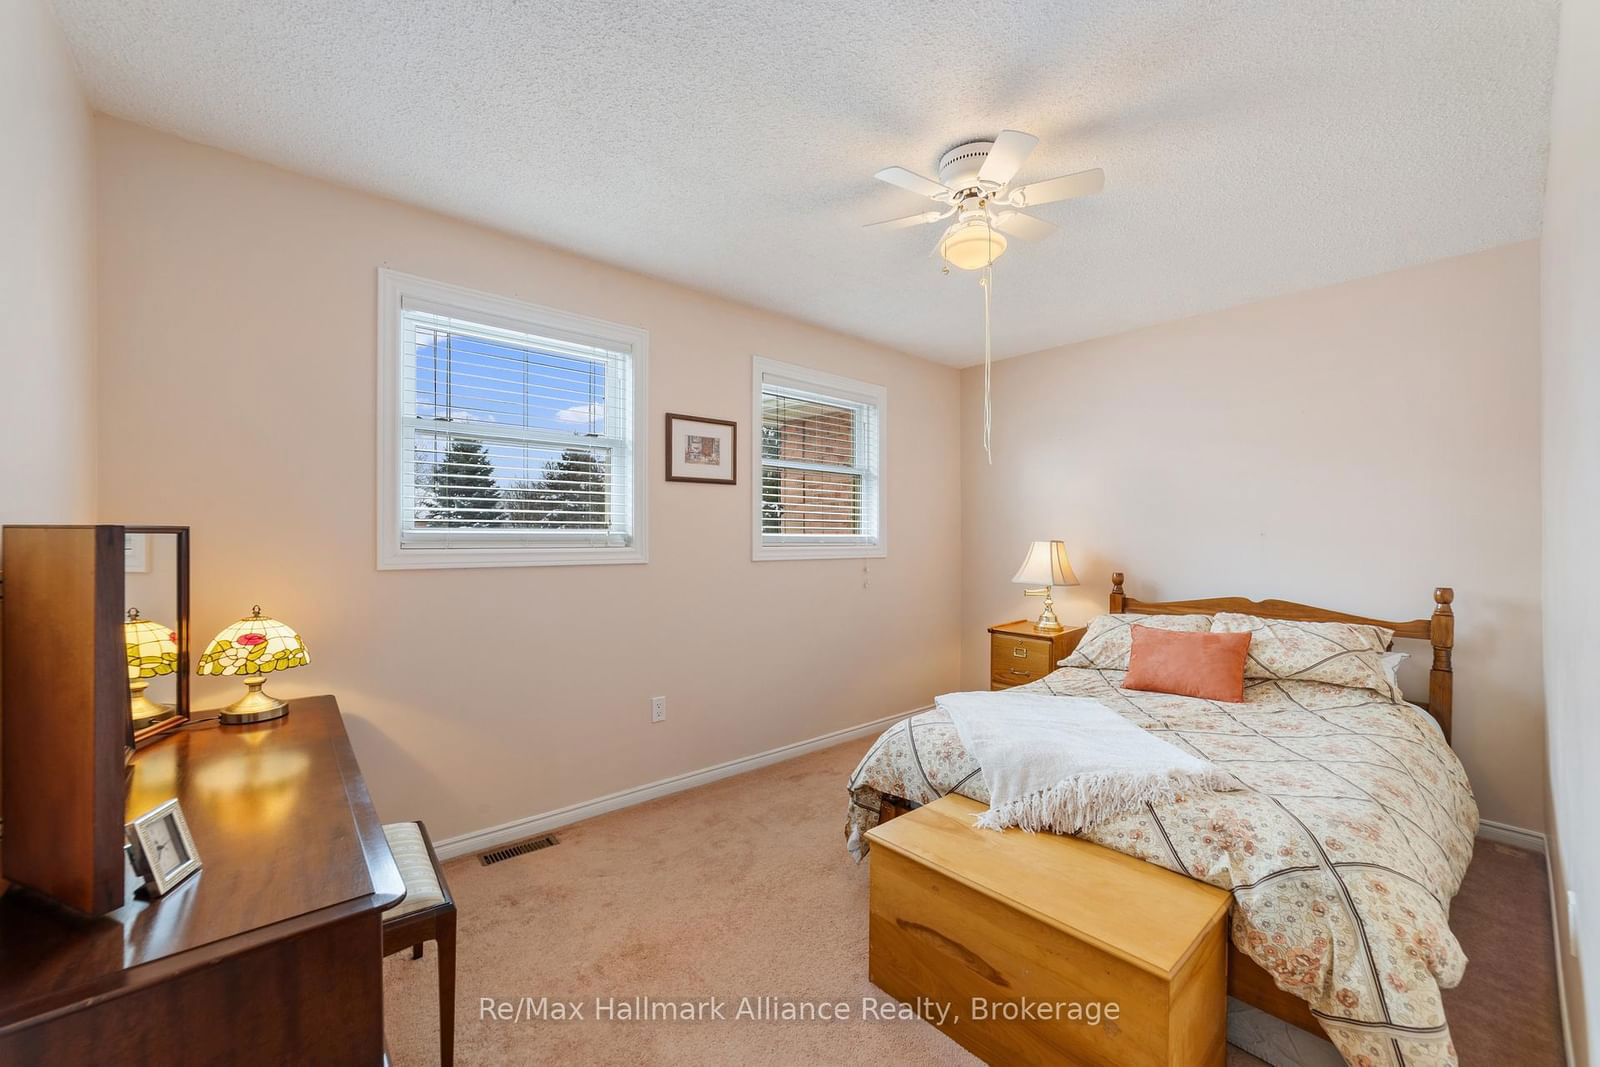
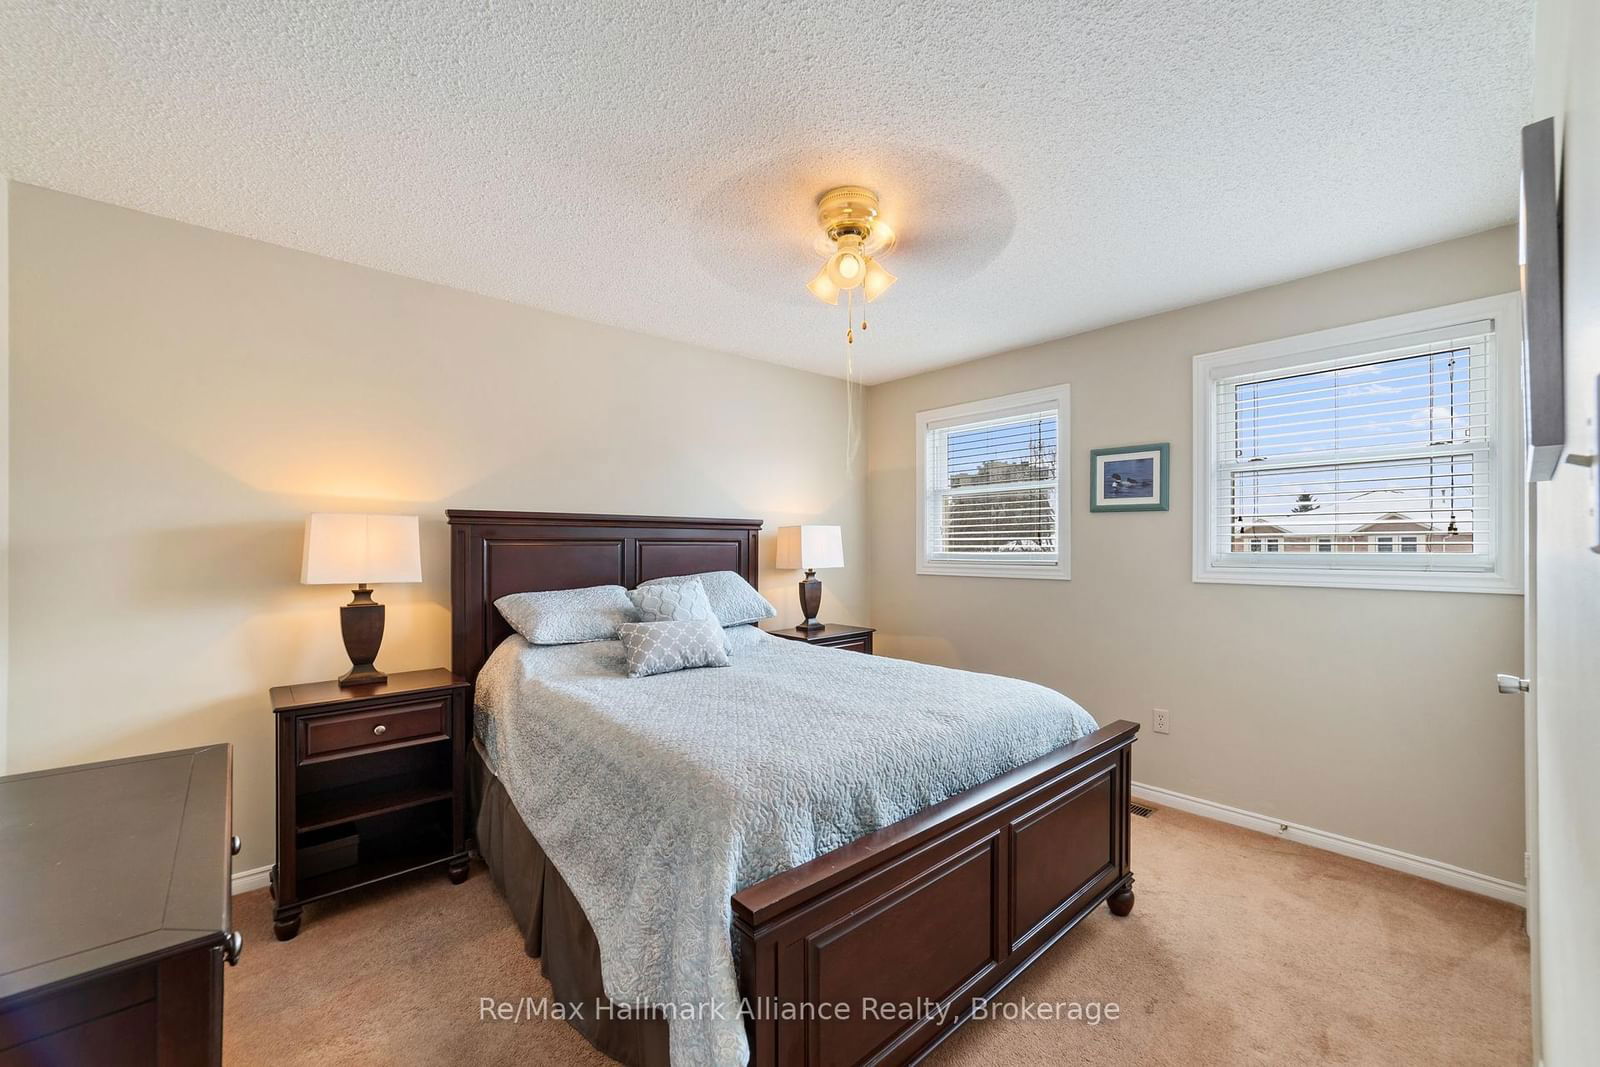
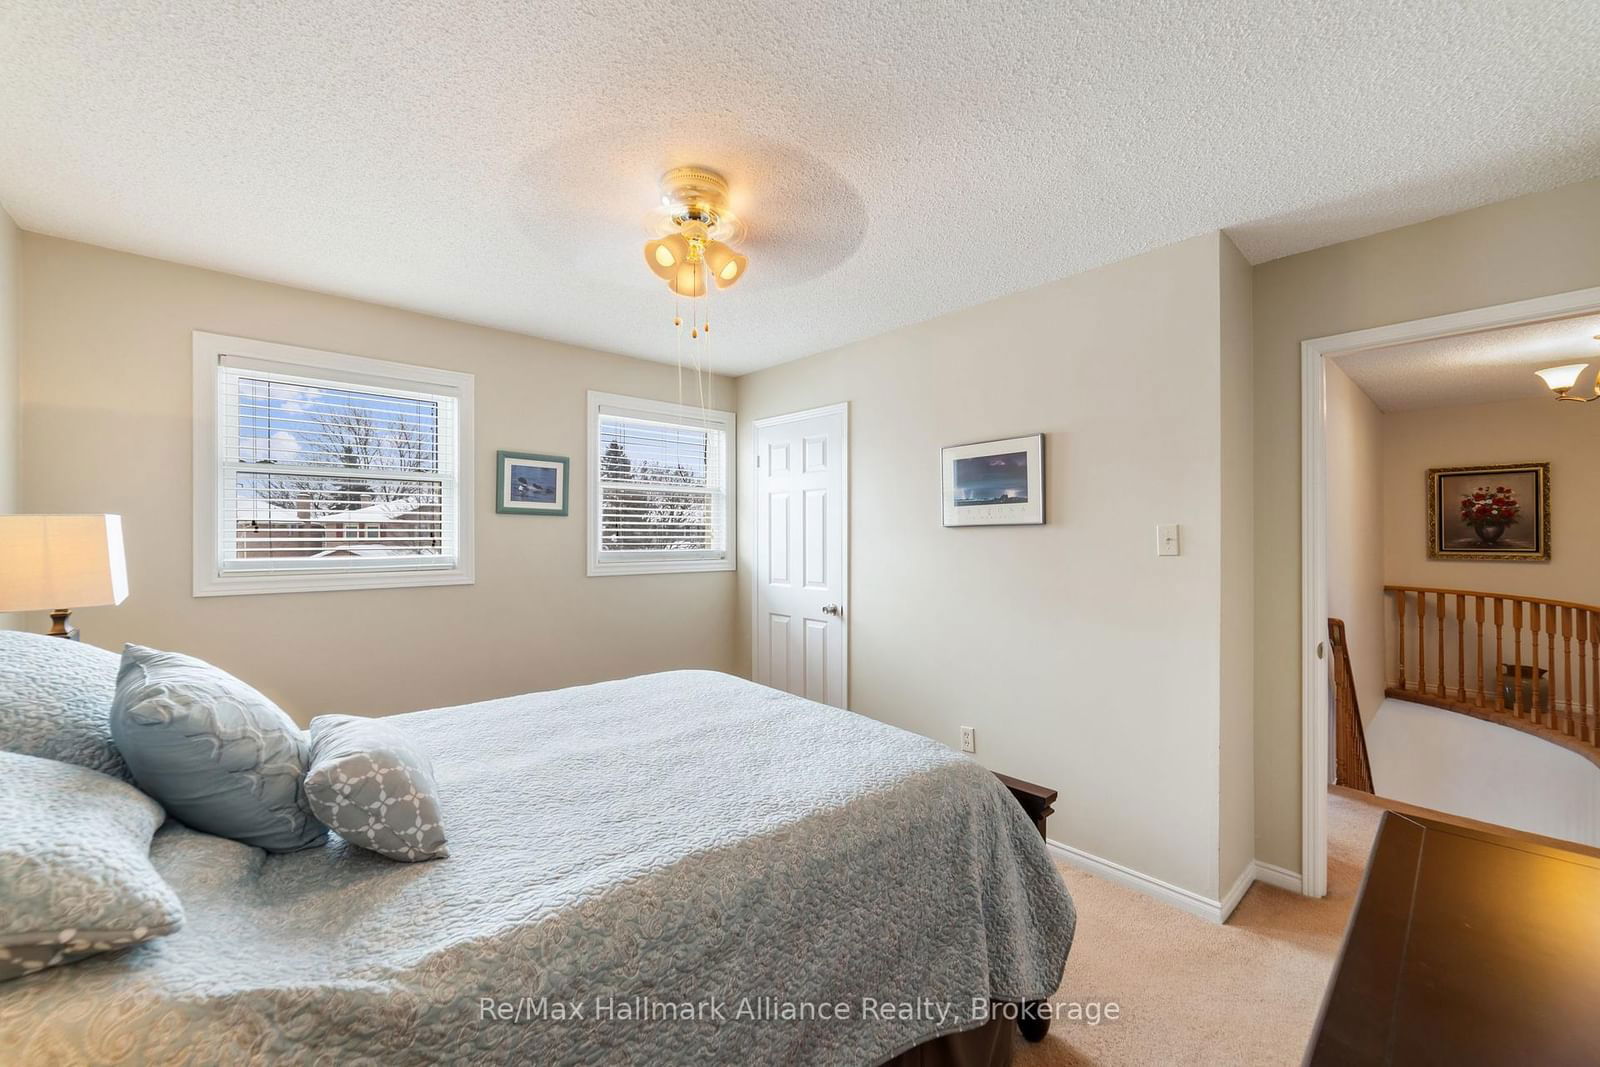
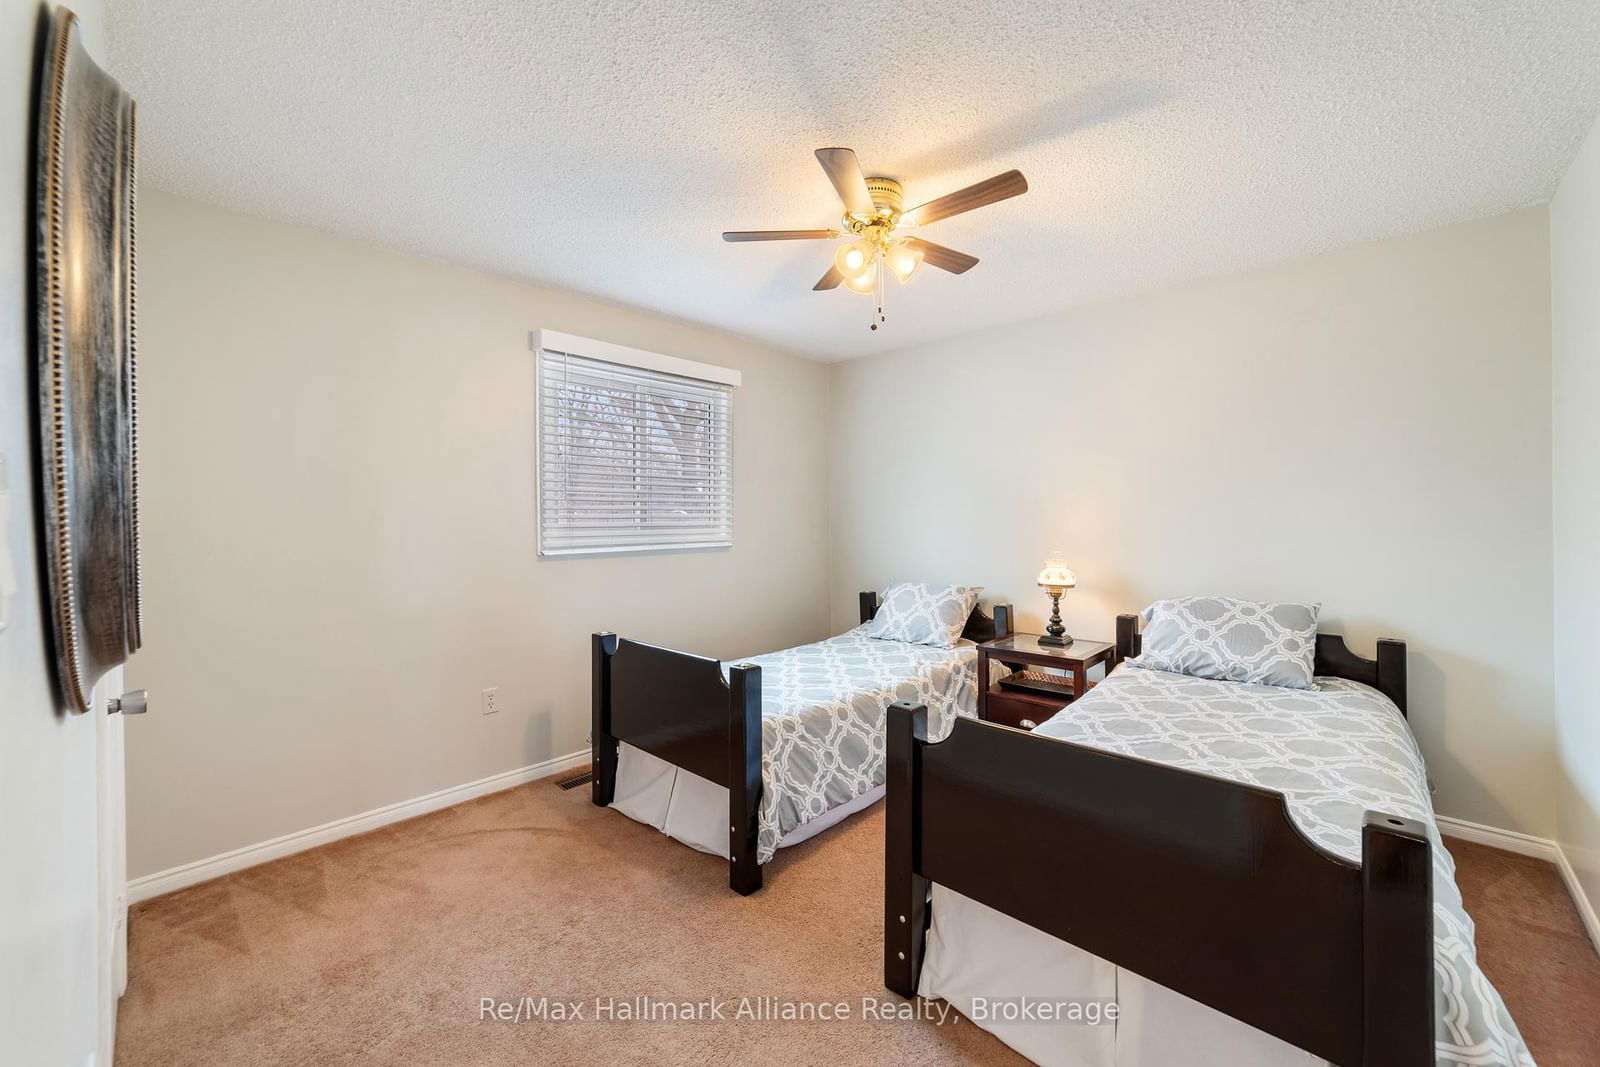
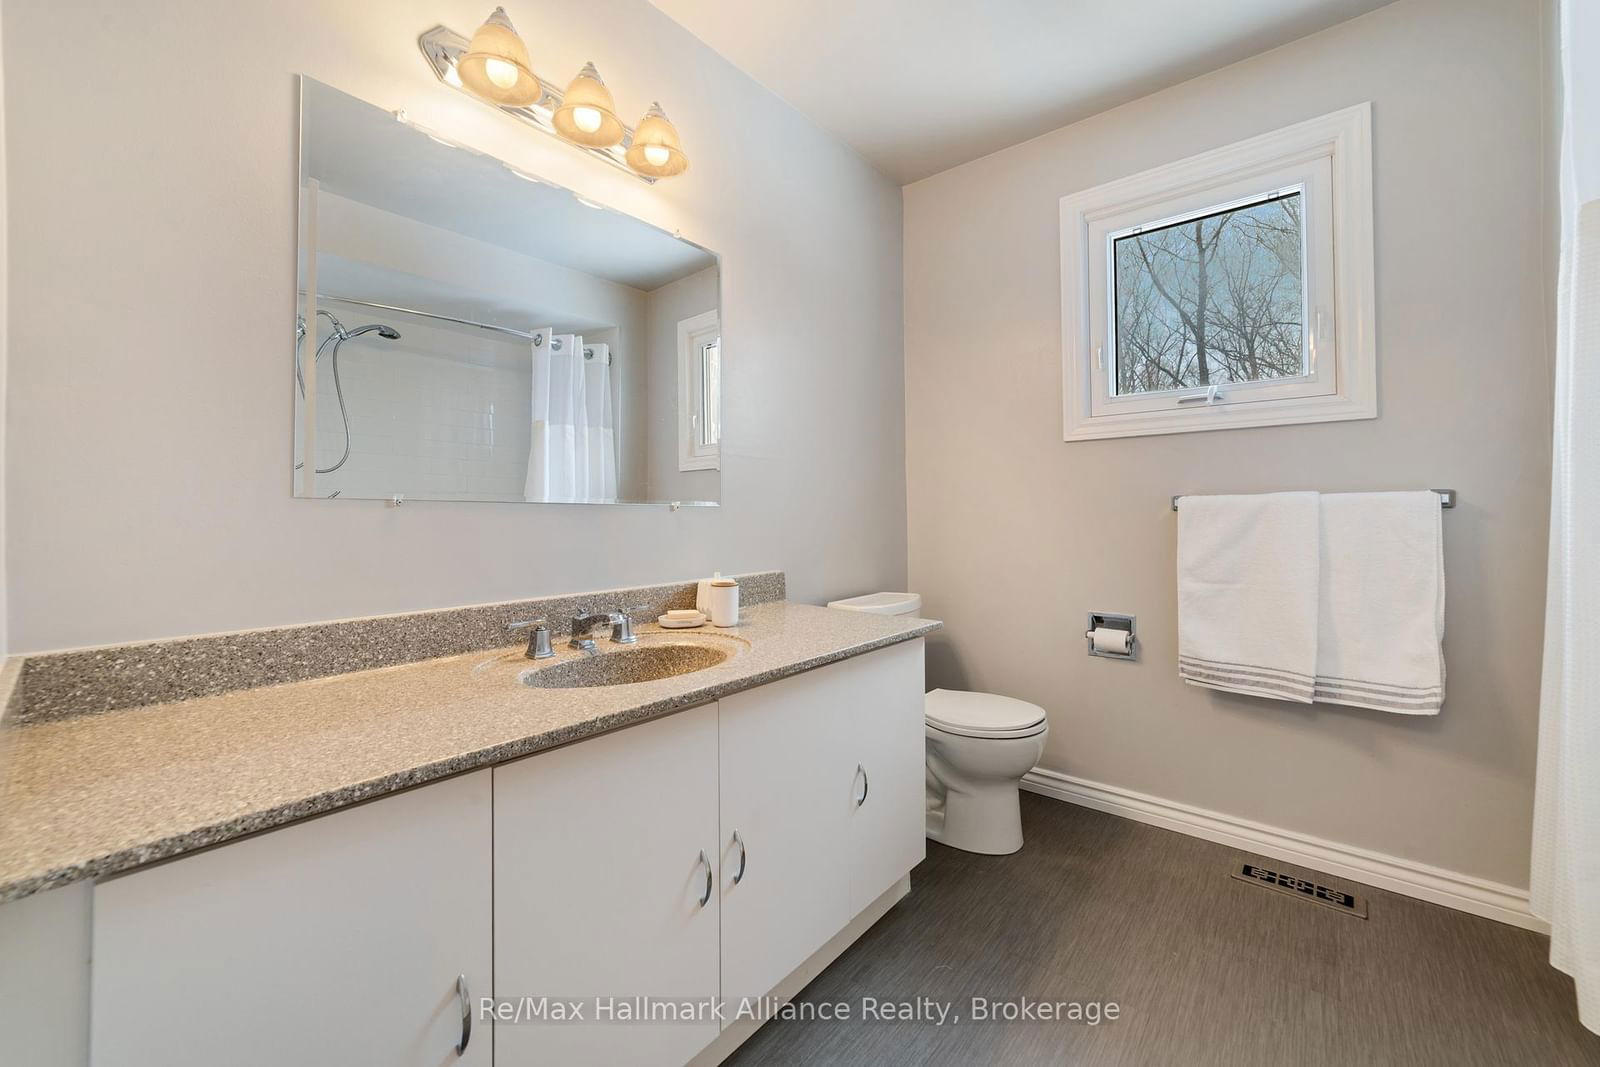
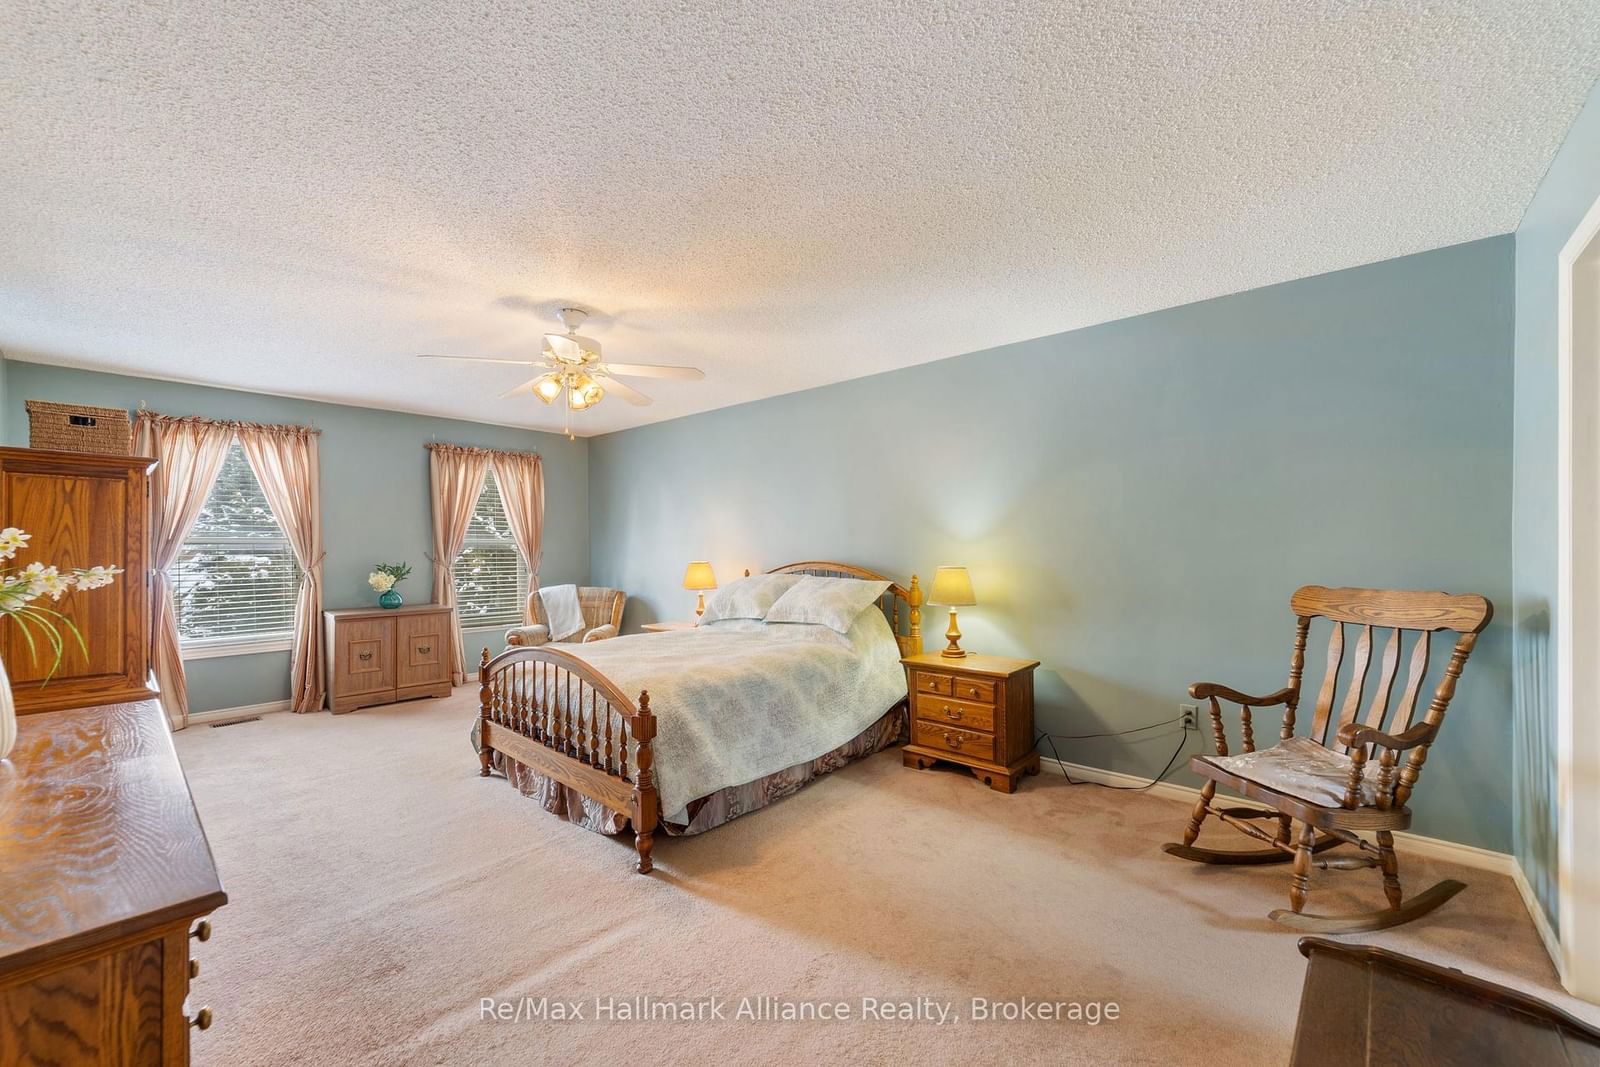
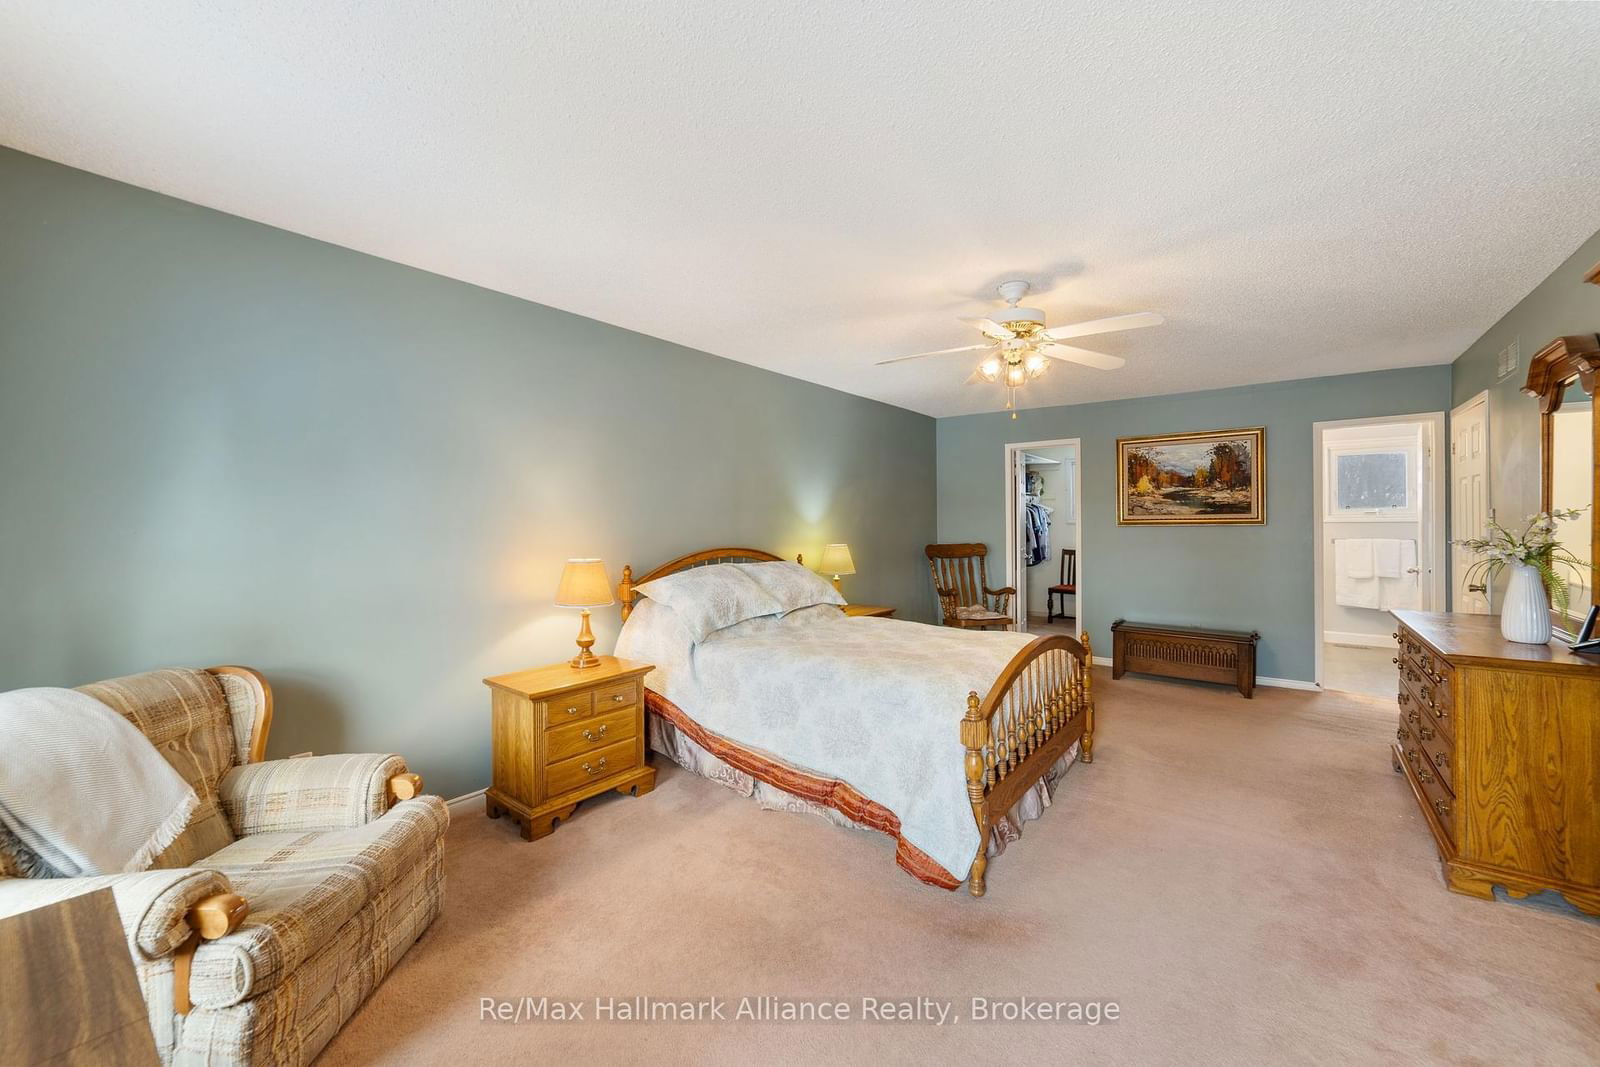
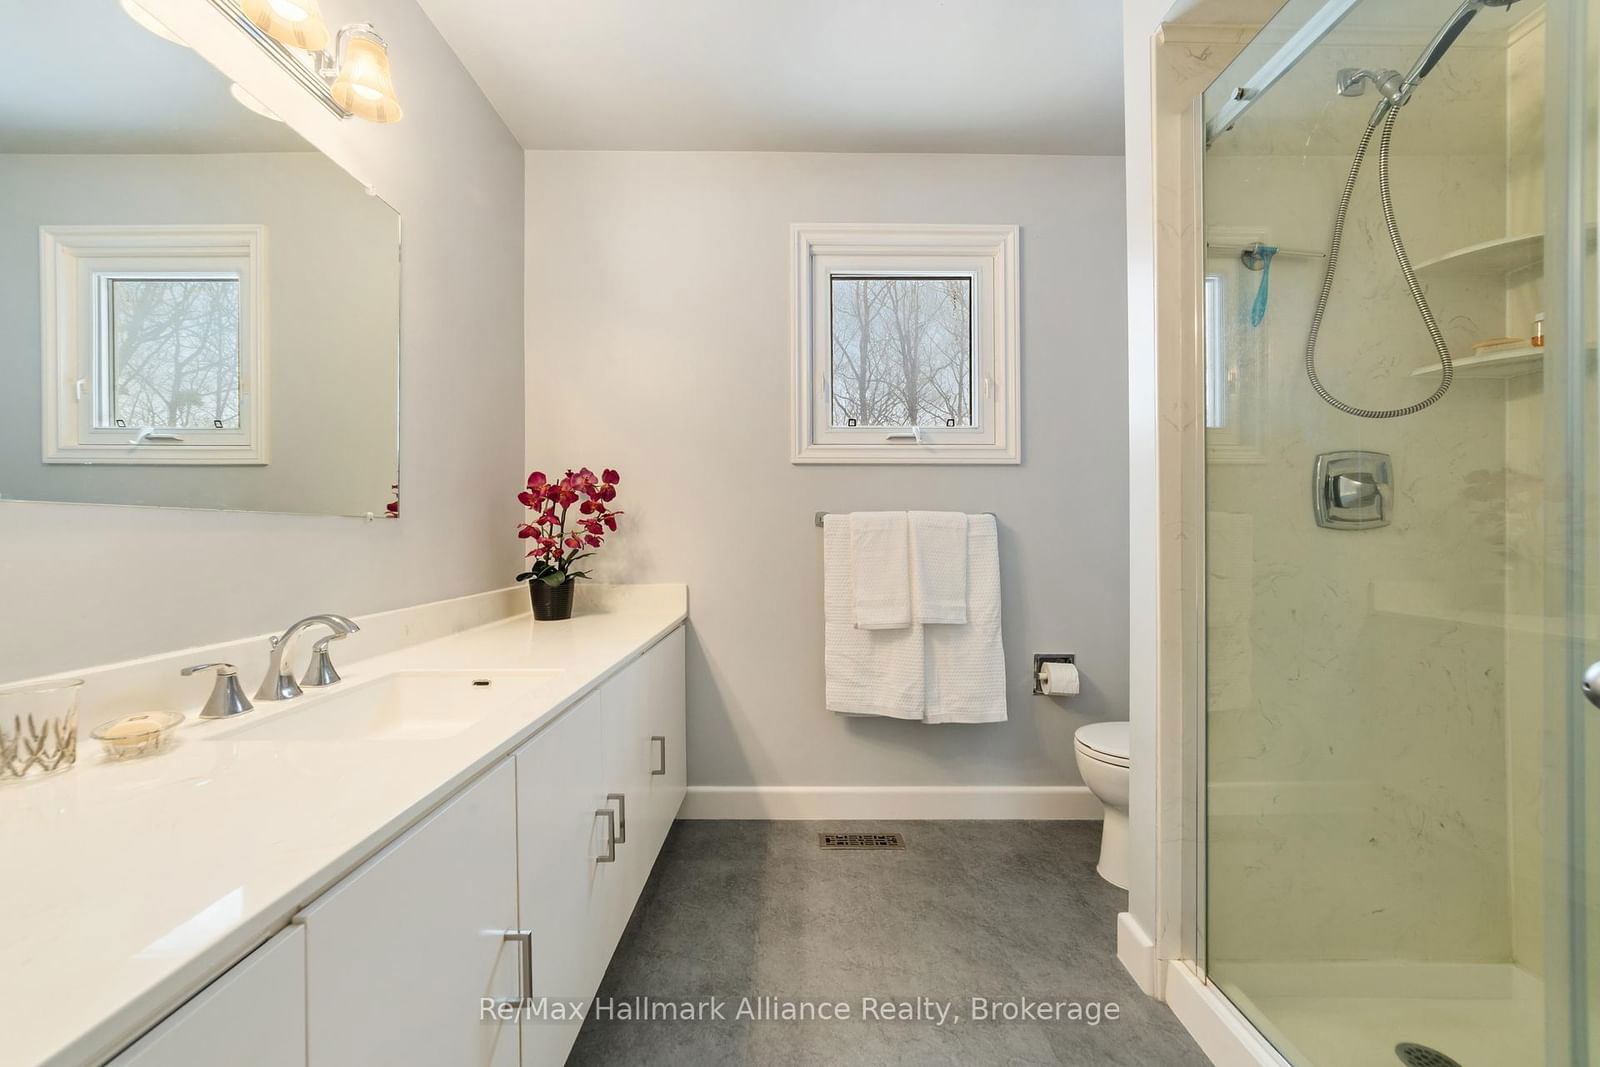
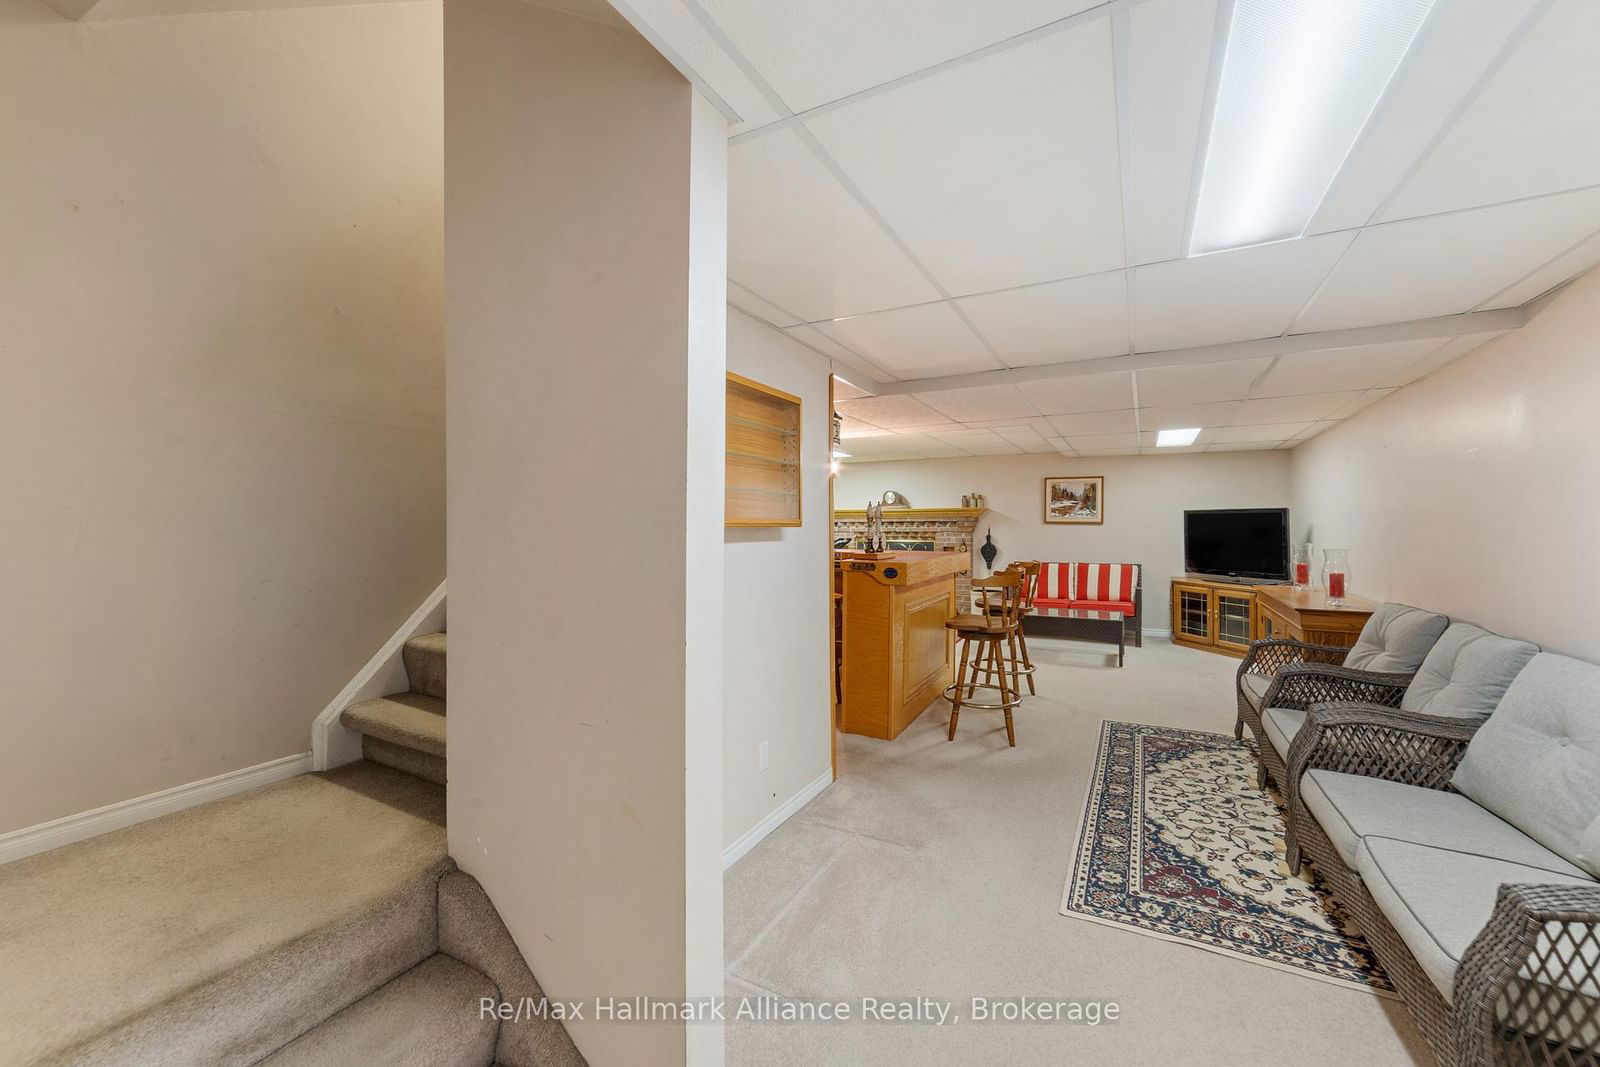
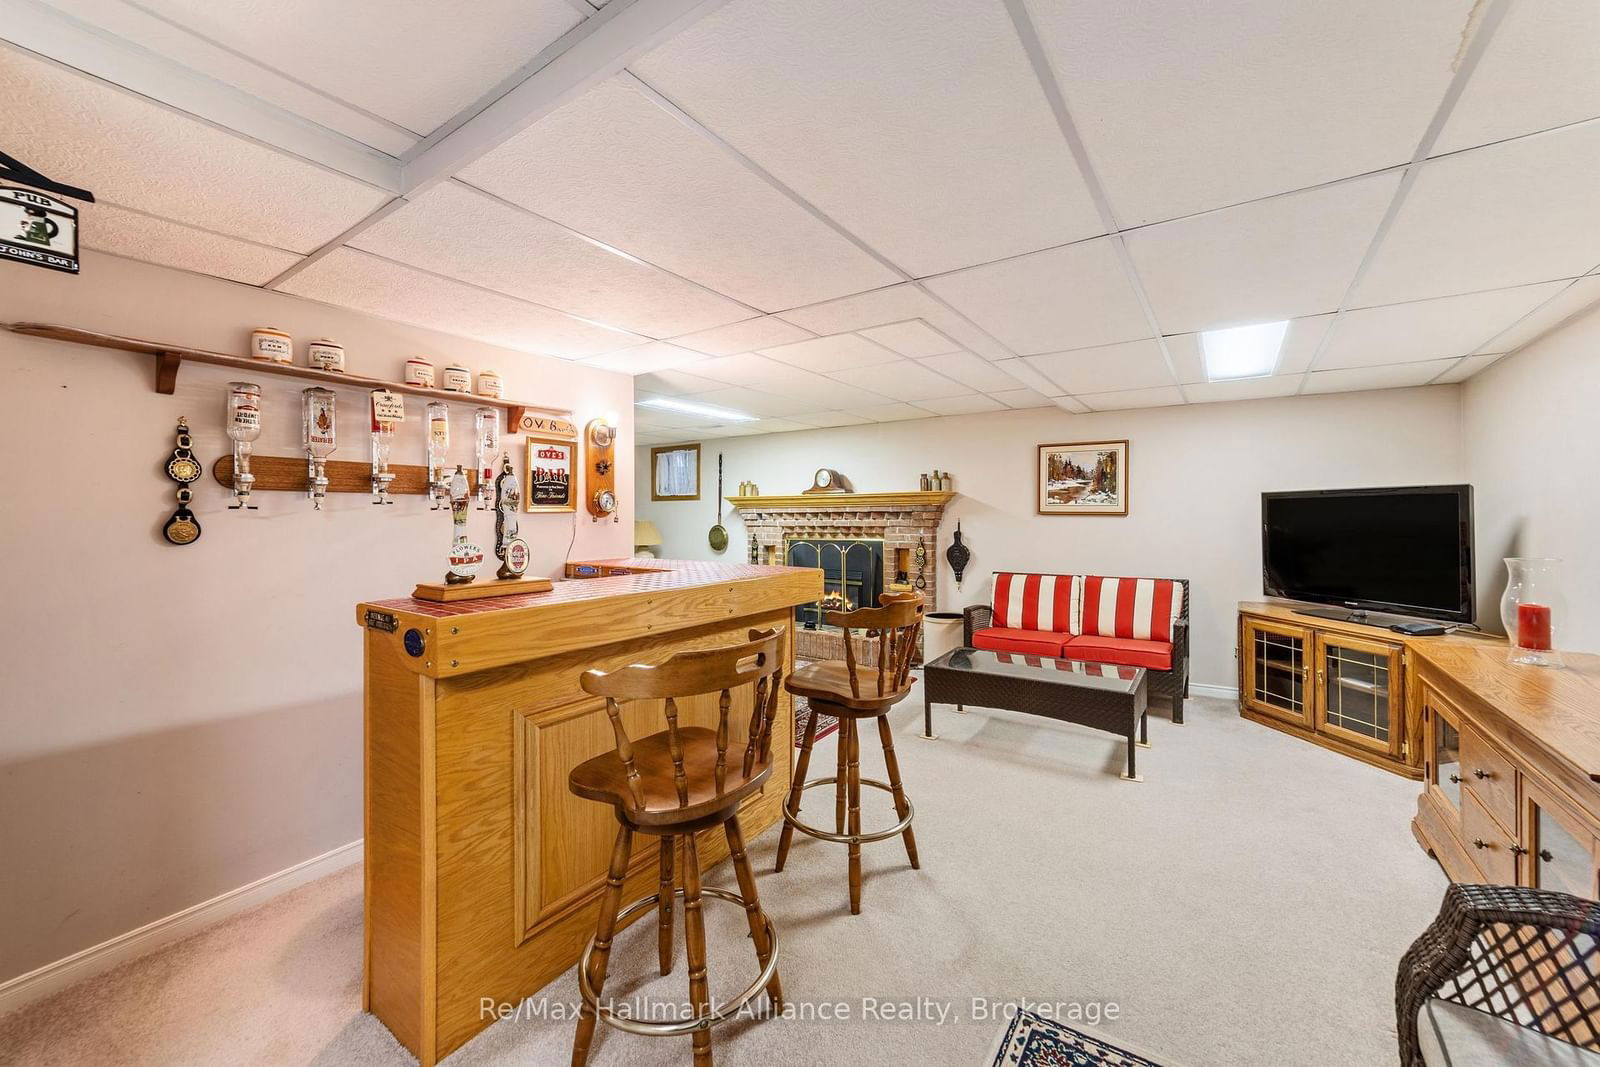
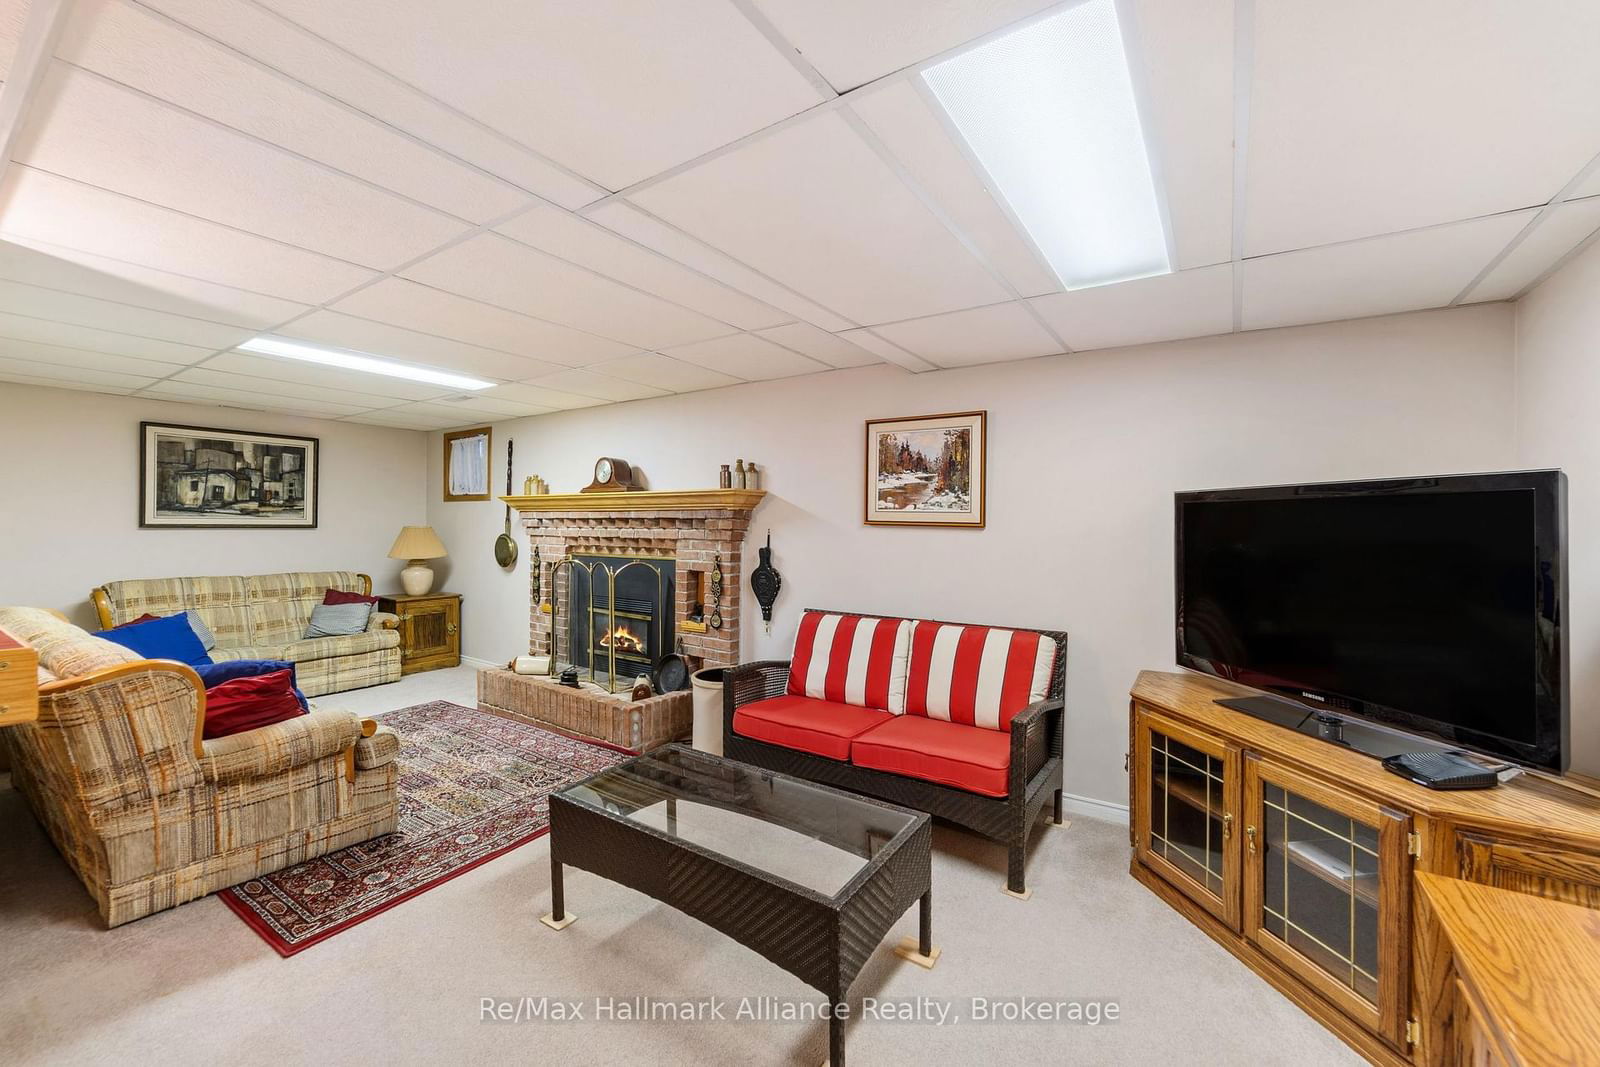
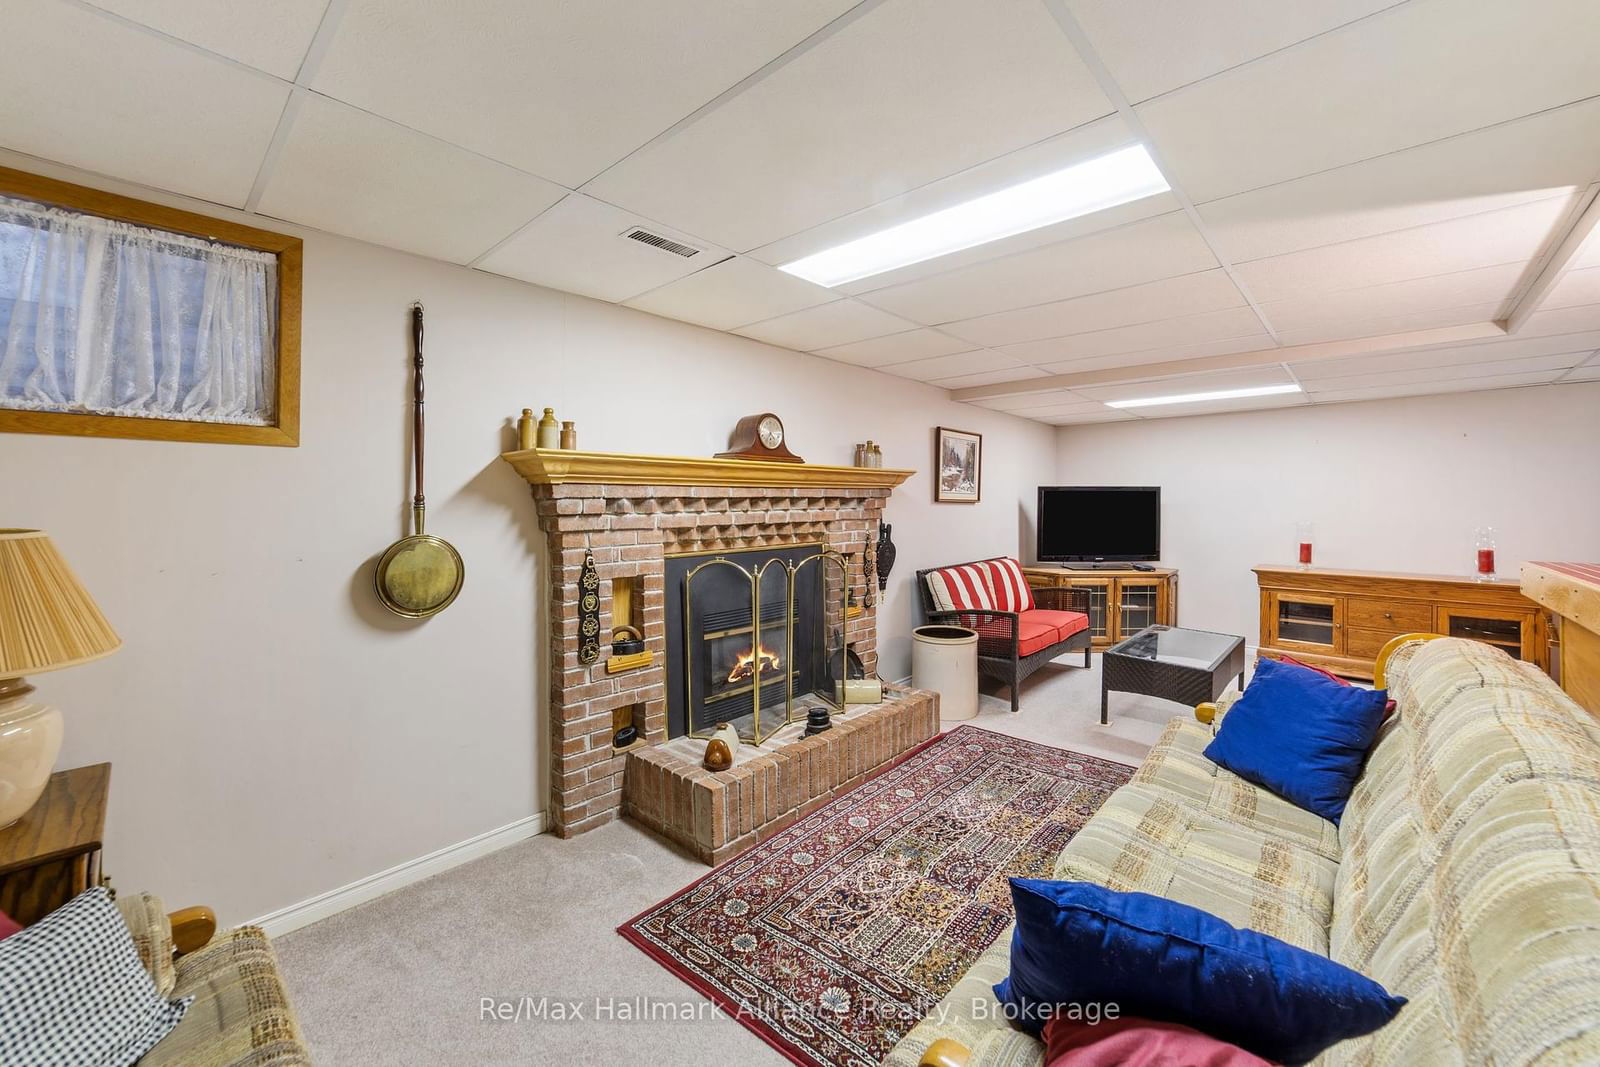
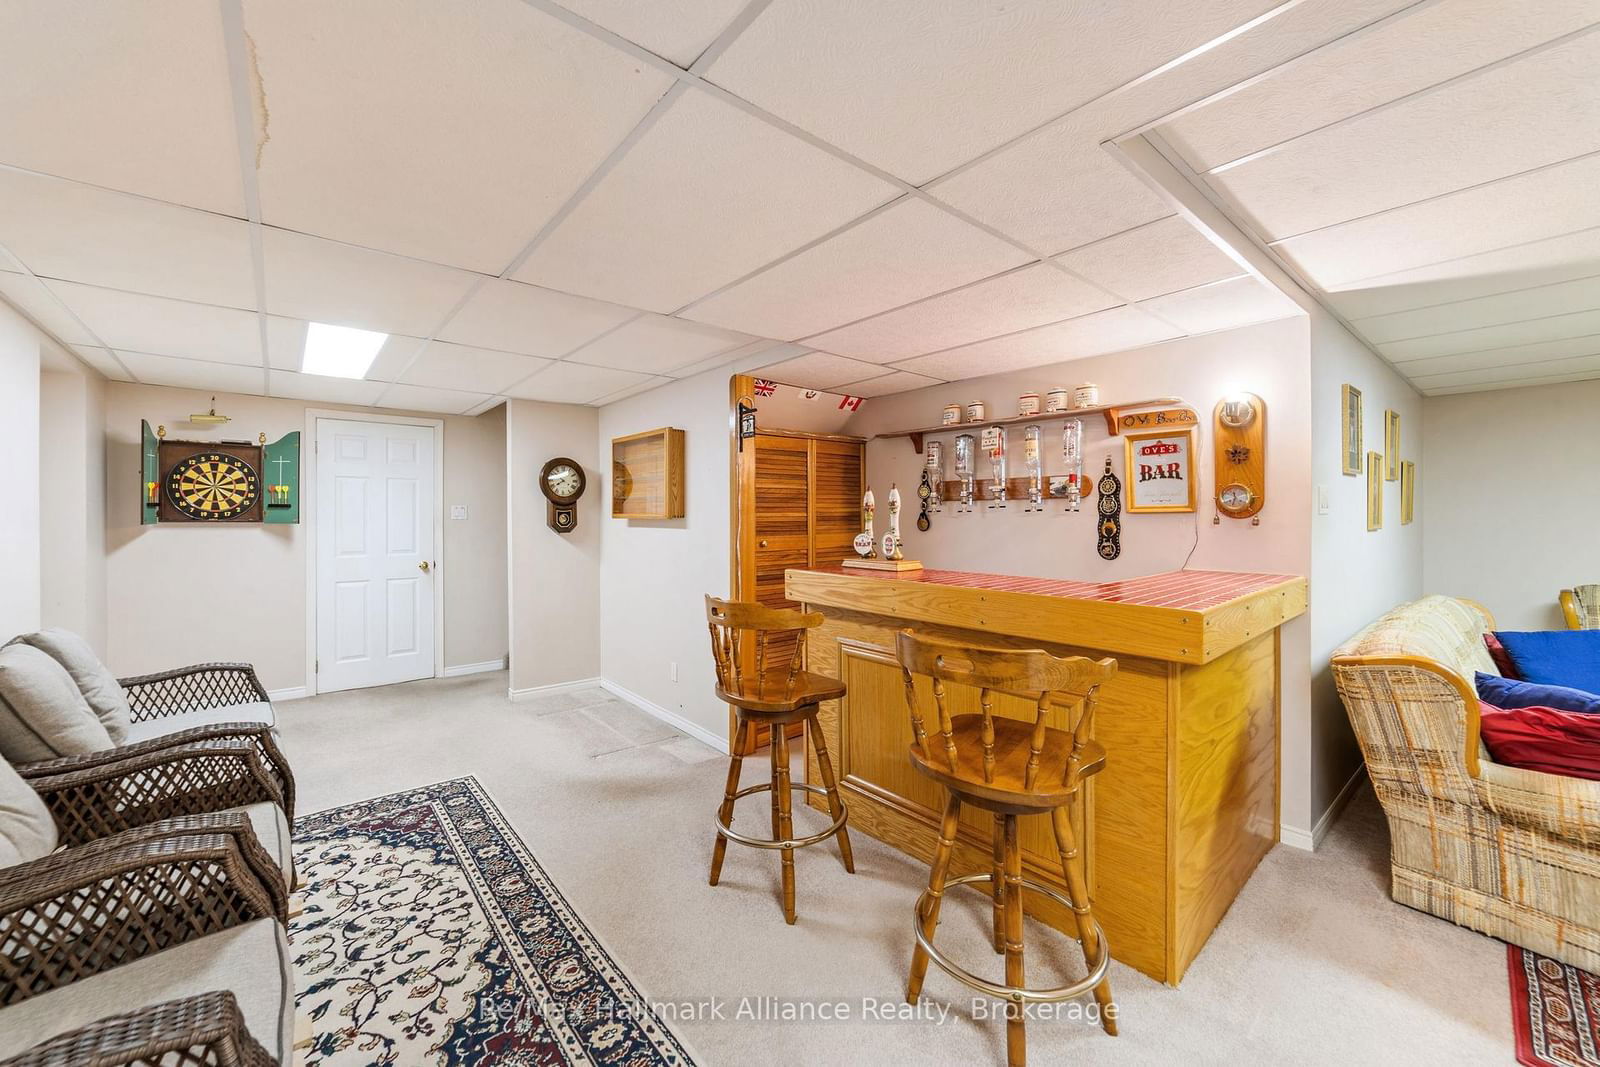
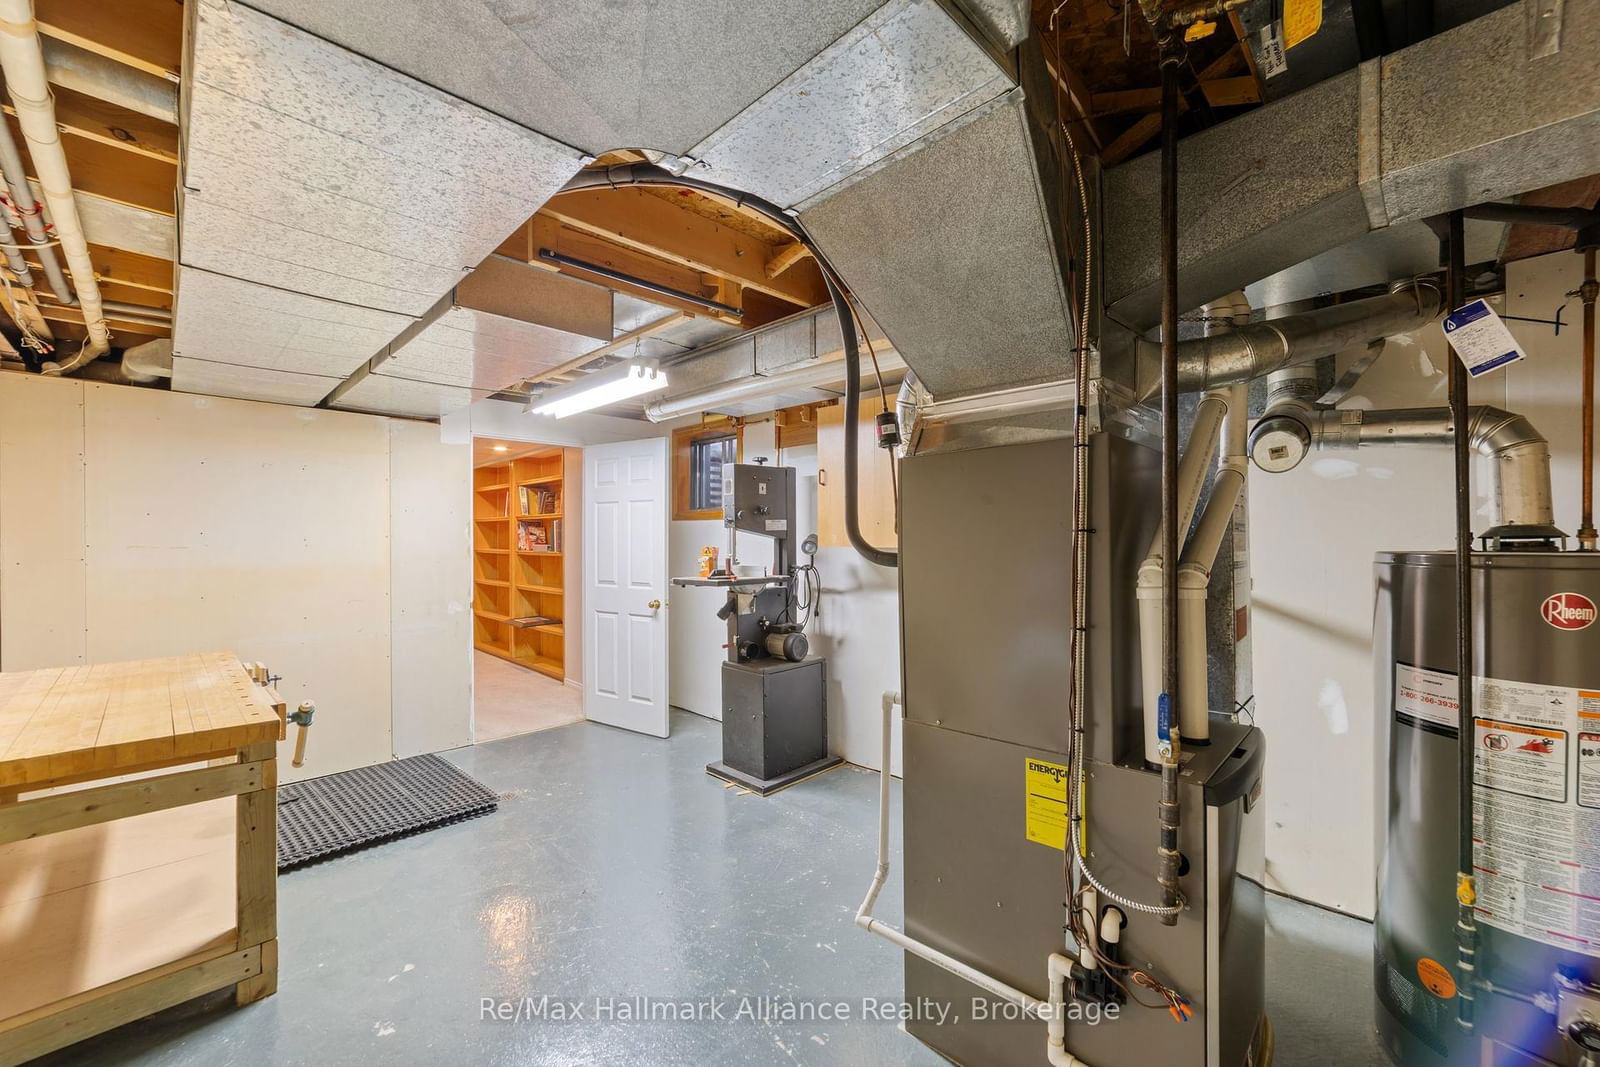
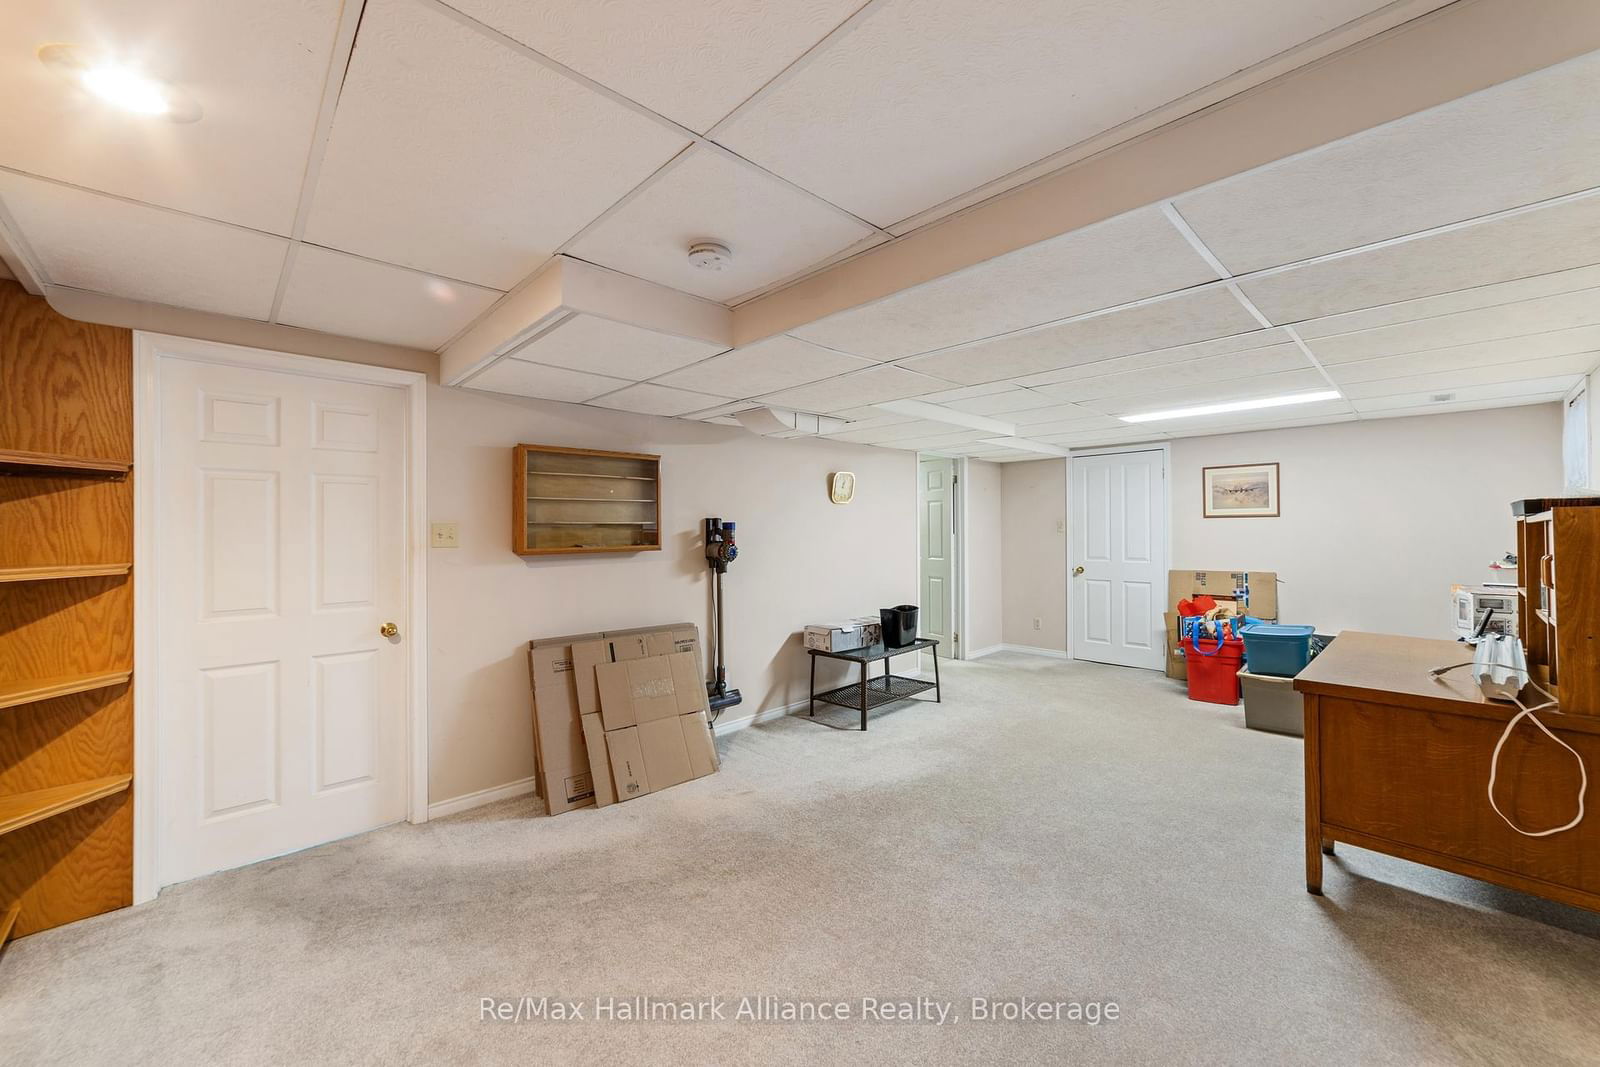
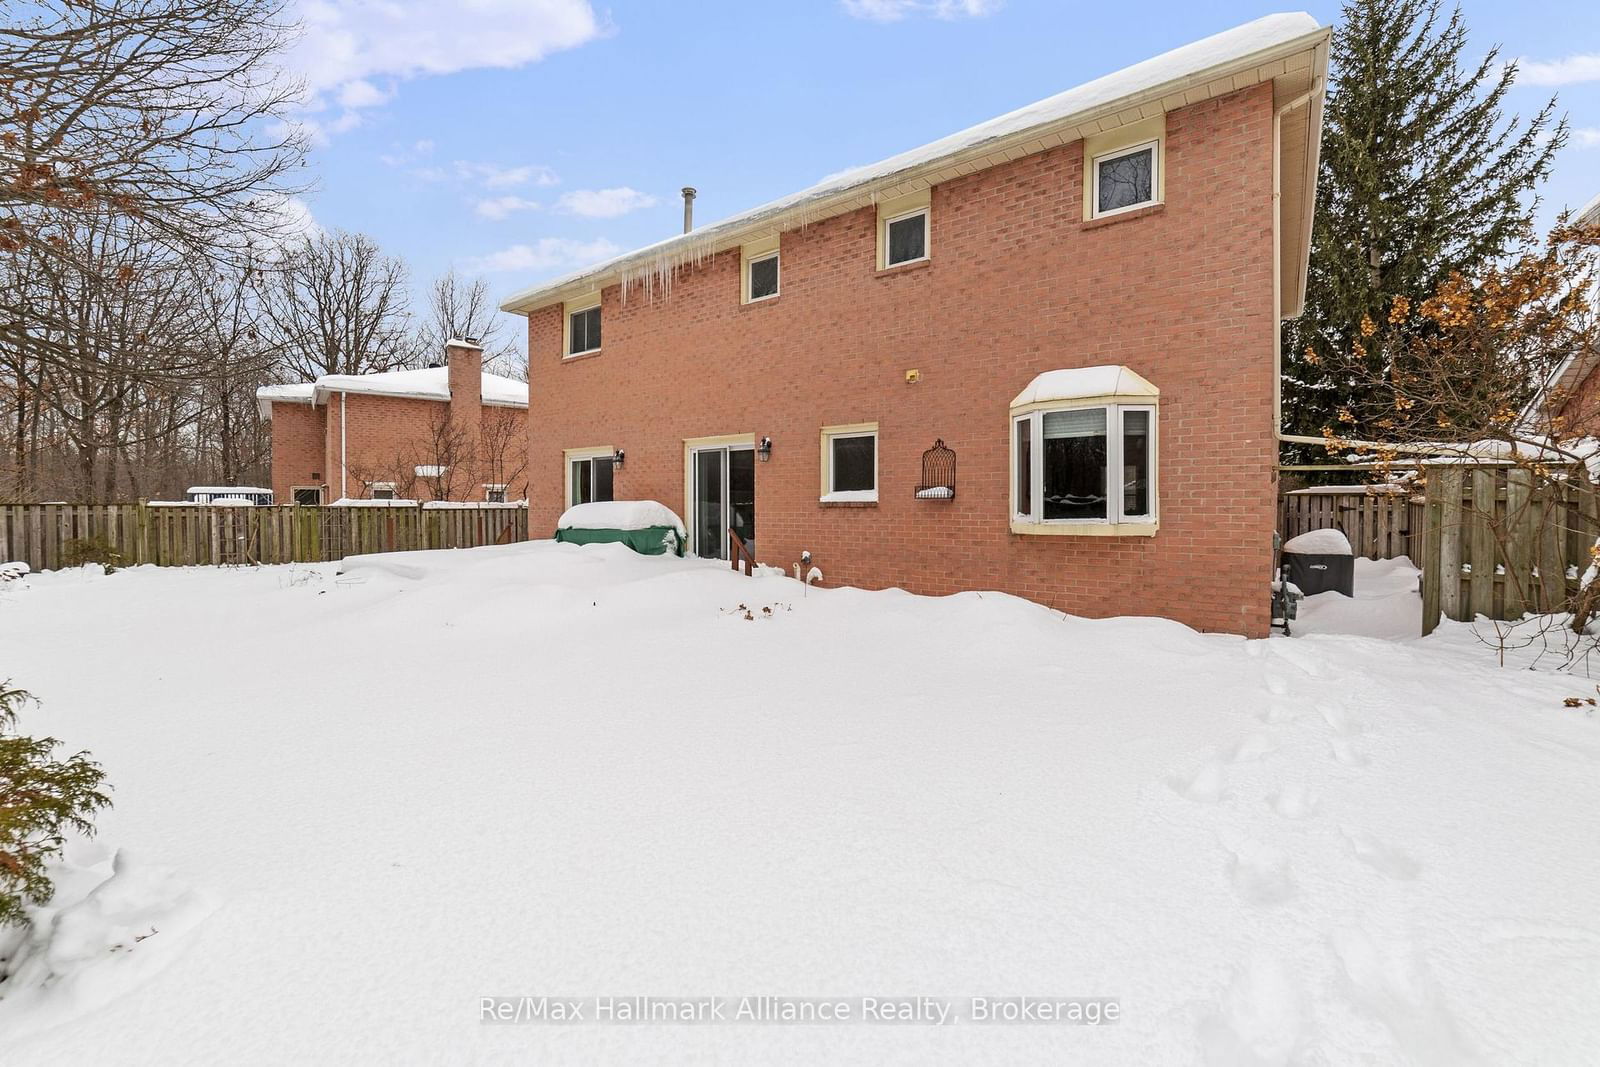
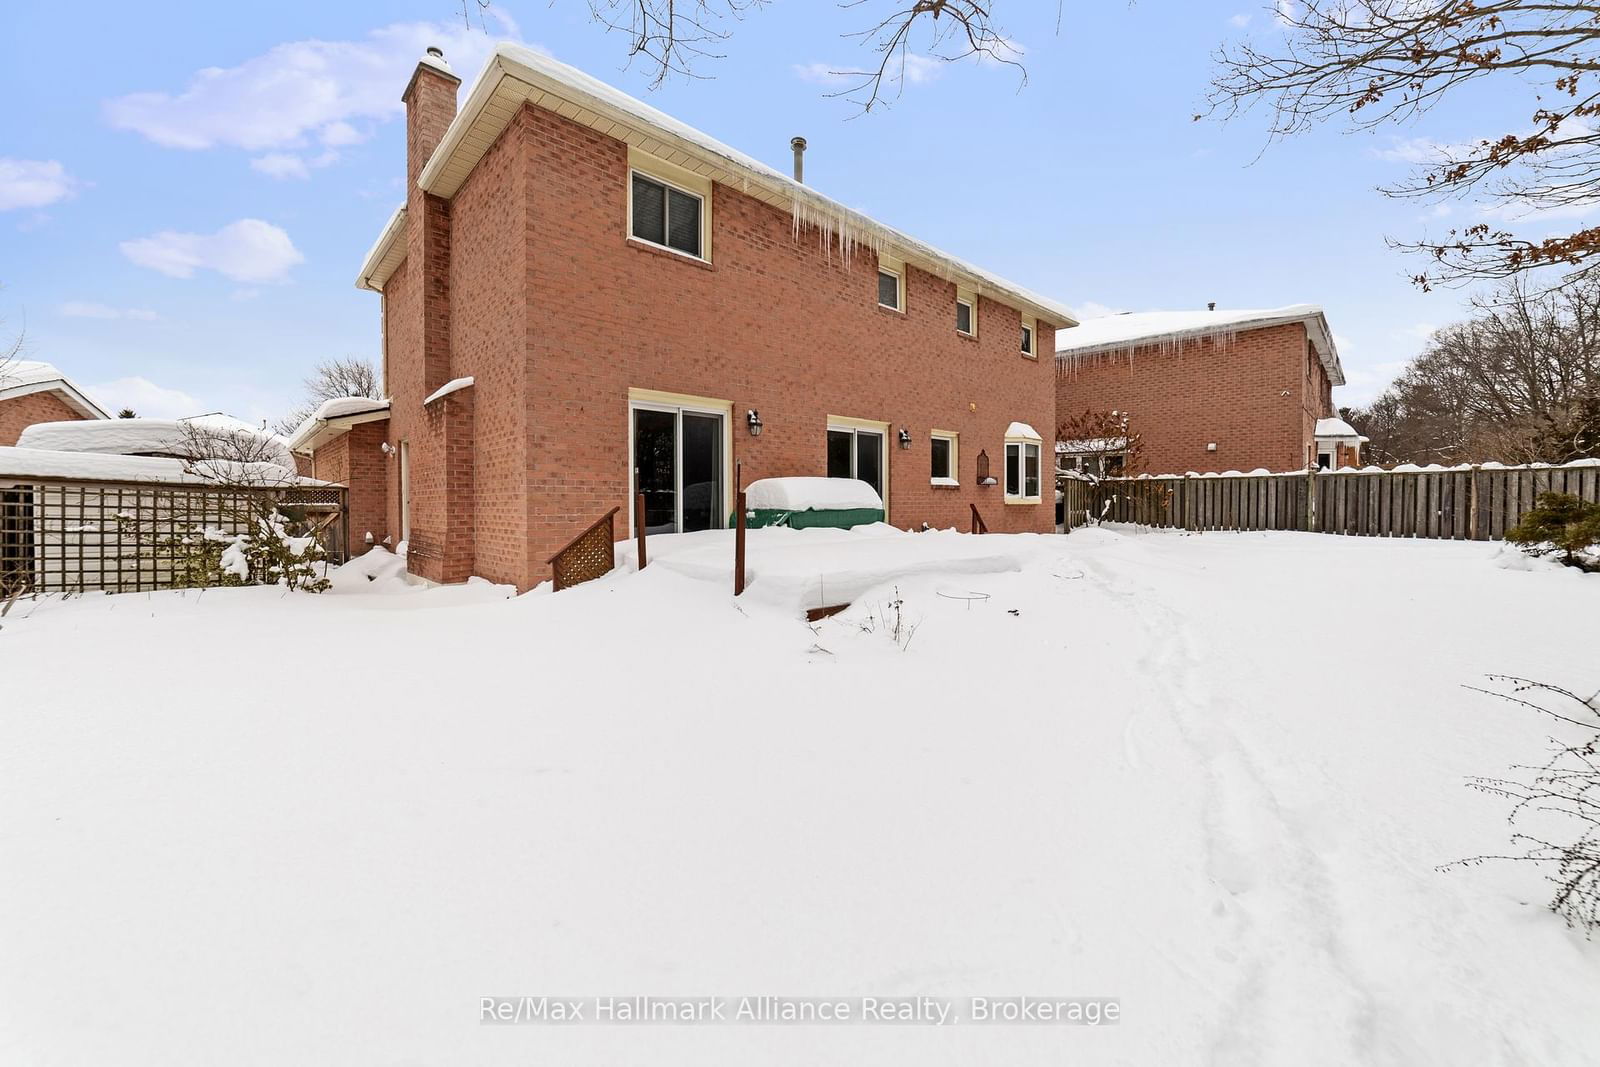
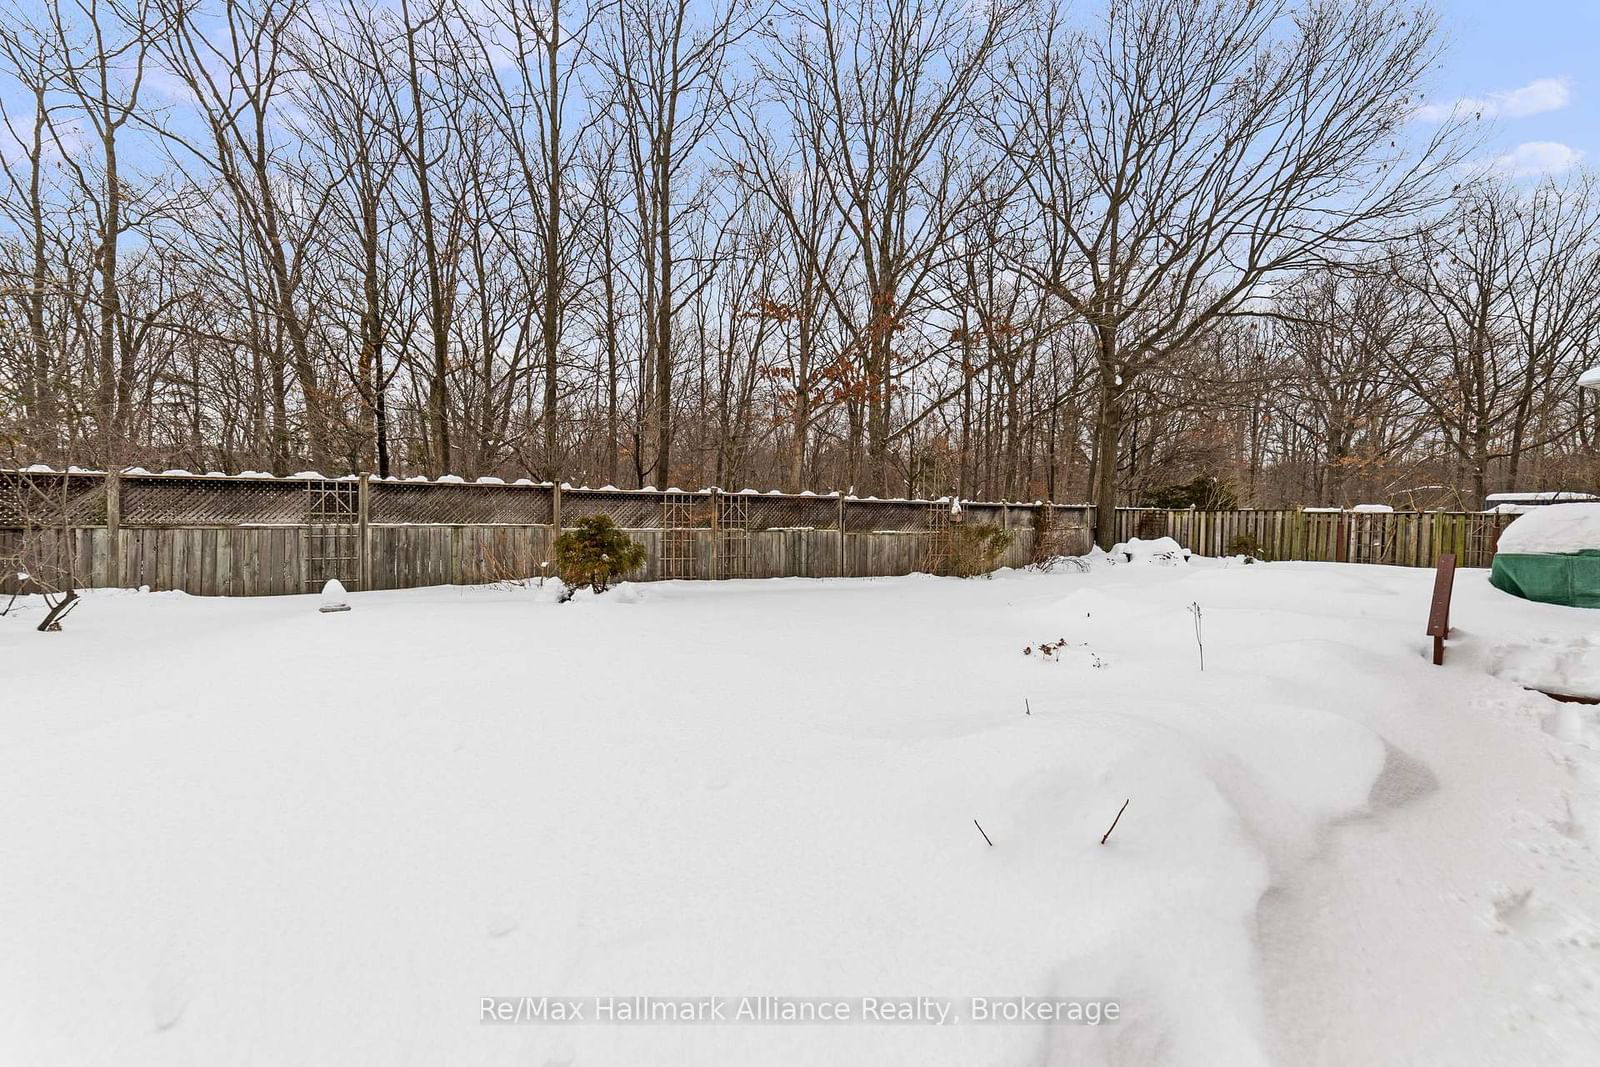
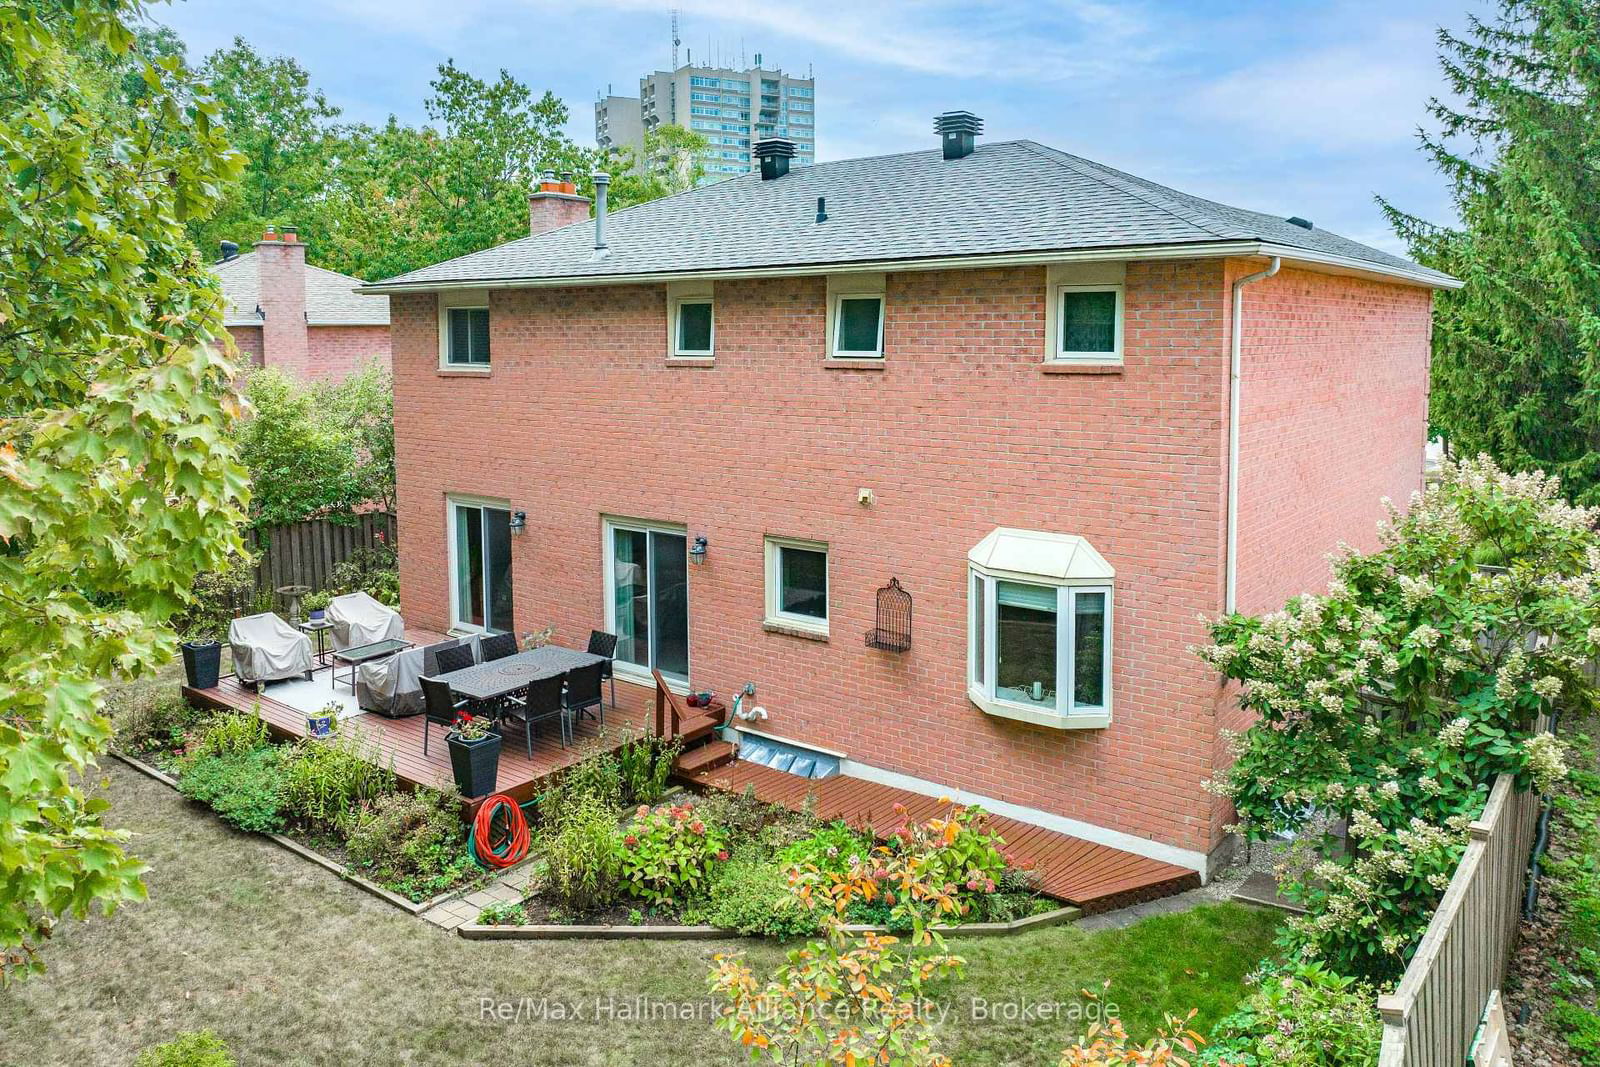
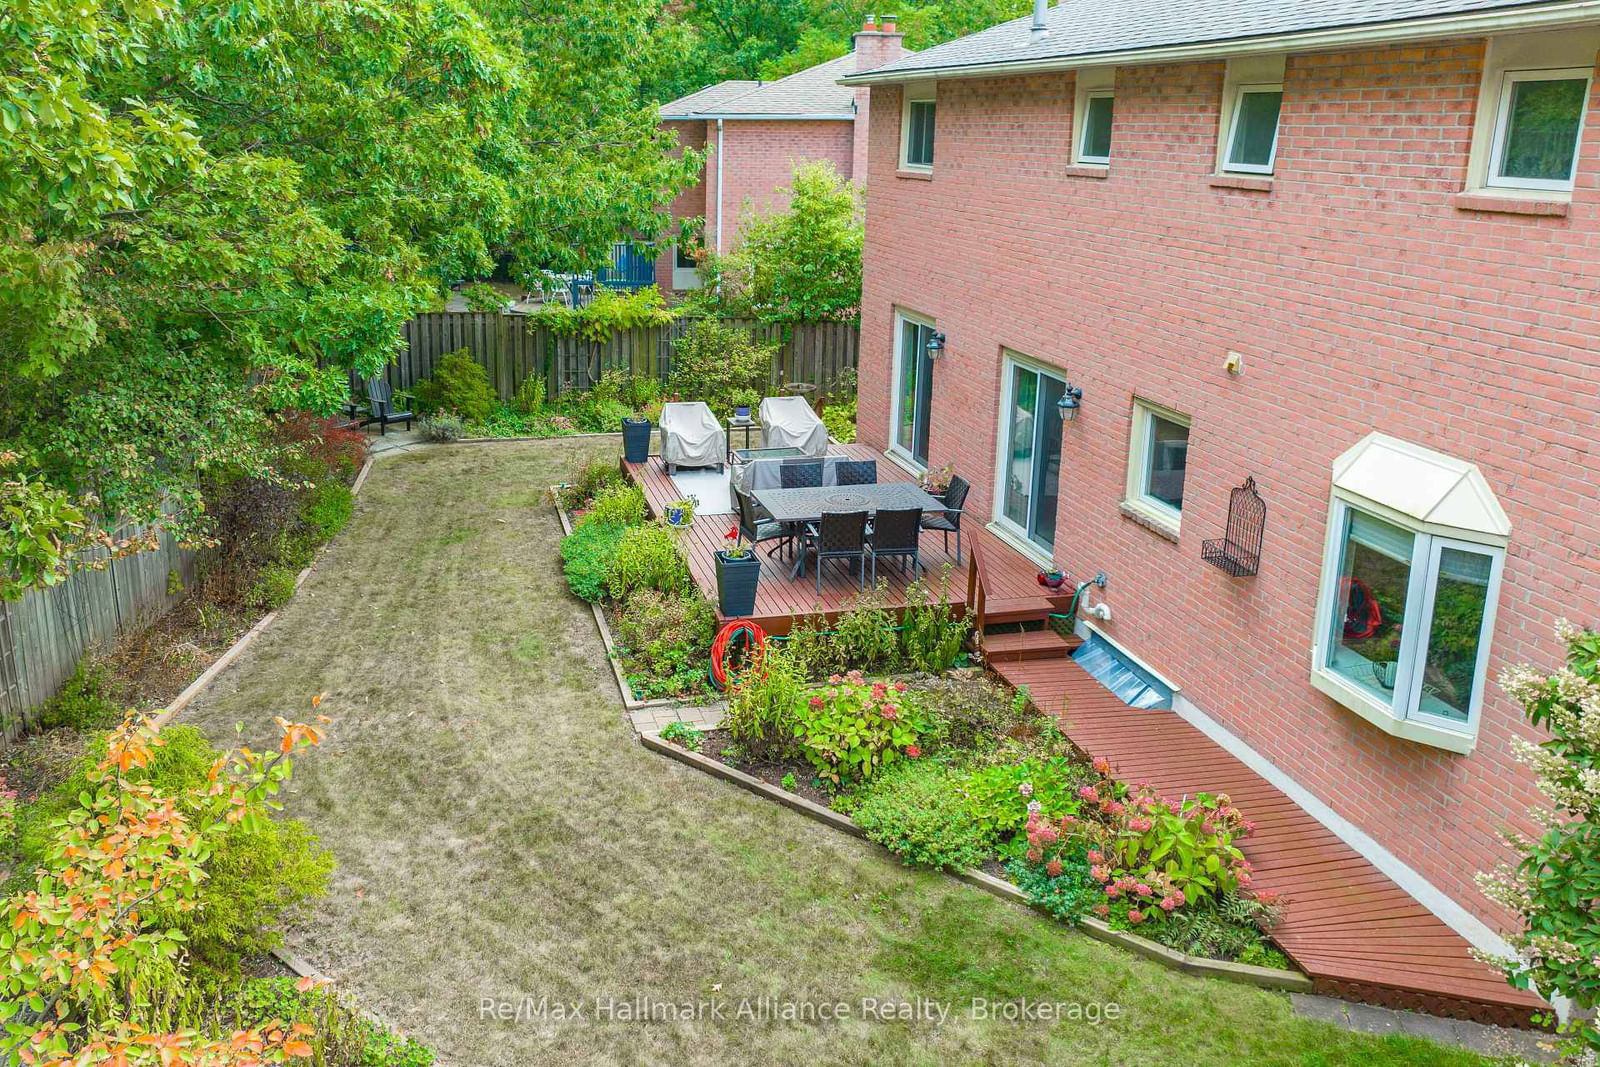
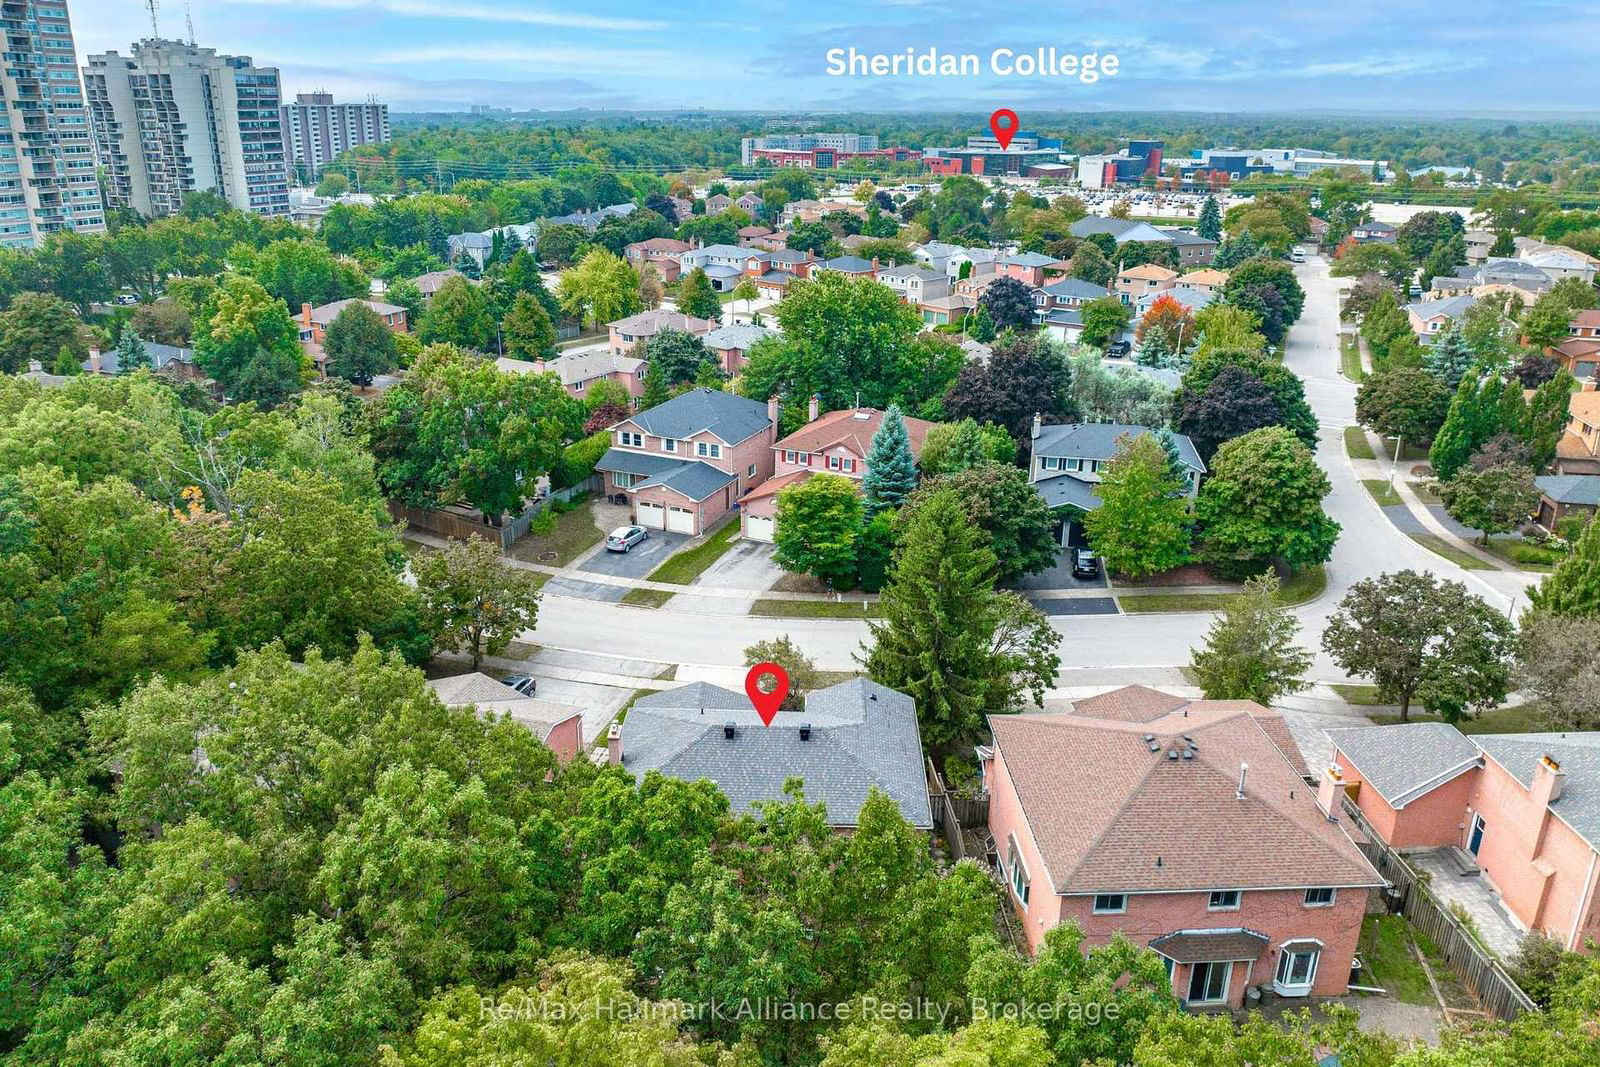
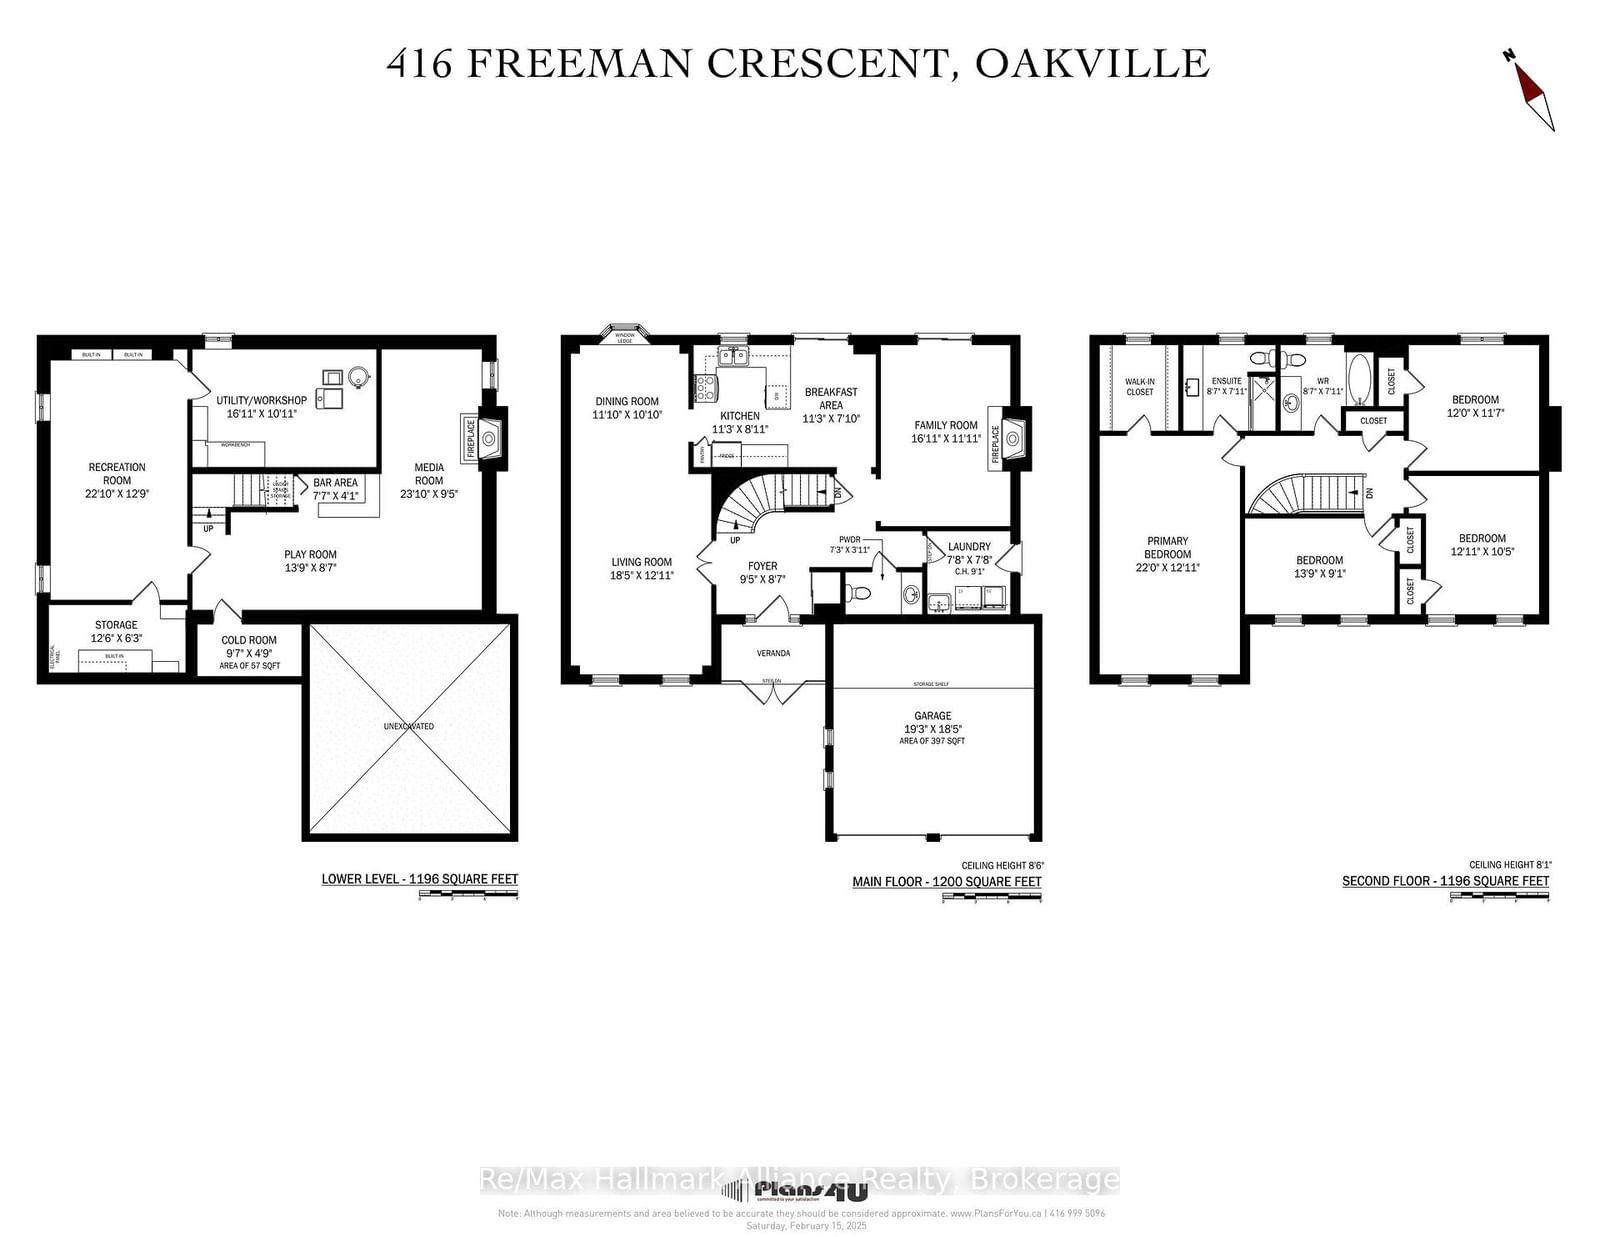
Nestled in the highly sought-after Falgarwood community, 416 Freeman Crescent offers a perfect blend of tranquility and convenience. This stunning two-storey home backs onto the picturesque Morrison Valley RAVINE, providing a serene and private setting among mature trees. Located on a quiet, family-friendly crescent, this home is just minutes from top-rated schools, parks, shopping, and excellent commuter access to the QEW, 403, 407, and the GO Train. Step inside to 3,565 sq. ft. of beautifully designed living space. The main level boasts parquet flooring throughout, an open-concept living and dining area, and a bright kitchen with a walkout to the backyard. The inviting family room features a cozy gas fireplace, and the convenience of a main-floor laundry room adds to the home's functionality. Upstairs, the spacious primary suite offers a walk-in closet and a private 3-piece ensuite, while three additional bedrooms share a well-appointed 4-piece bath. The lower level expands the living space with an expansive recreation room, a playroom, and a media room with a second fireplace, along with ample storage, a utility room, and a cold room. The backyard is a true retreat offering privacy, lush landscaping, and a spacious deck perfect for entertaining or relaxing while enjoying the peaceful ravine views. Whether hosting gatherings or unwinding in nature, this outdoor space is a rare find. Enjoy the best of both worlds with nature at your doorstep and easy access to urban amenities. Walking distance to Sheridan College and within the catchment for top-rated Iroquois Ridge High School, this home is ideal for families seeking space, comfort, and a prime location.
Appliances: Refrigerator, Stove, Dishwasher, Microwave, Washer/Dryer, Blinds, Curtains, Light fixtures, Shelving units in basement.
Foyer
Laundry
Breakfast
Kitchen
Family
Living
Dining
Primary
2nd Br
3rd Br
4th Br
Rec
Media/Ent
Play
Workshop
Cold/Cant
The graph below compares the average list price and average sale price of homes in this neighborhood by month for the last 24 months. When average sale price is greater than average list price, this may suggest a buyer's market. When average sale price is lower than the average list price this may suggest a seller's market.
The graph below illustrates the average days on market for homes in this neighborhood. The yellow area may indicate a buyer's market, the green area may indicate a balanced market and the red area may indicate a seller's market.
Sales Representative, Century 21 People’s Choice Realty Inc., Brokerage
(647) 576 - 2100
Oakville, FA Falgarwood, L6H 3J5
Oakville, WC Wedgewood Creek, L6H 3X6
Oakville, Iroquois Ridge North, L6H 3Y2
Oakville, Iroquois Ridge North, L6H 3Z3
Oakville, WC Wedgewood Creek, L6H 4V3
Oakville, Iroquois Ridge North, L6H 4V7
Oakville, 1015 - RO River Oaks, L6H 6B4
Oakville, JC Joshua Creek, L6H 5L7
Oakville, JC Joshua Creek, L6H 7N6
Oakville, Iroquois Ridge North, L6H 7L6
Oakville, 1015 - RO River Oaks, L6H 6C4