Century 21 People’s Choice Realty Inc., Brokerage
120 MATHESON BLVD E #103
MISSISSAUGA, Ontario
L4K 0A4


Mississauga, Lorne Park, L5H 4L5
$3,198,850
Listed by RE/MAX REALTY ENTERPRISES INC..
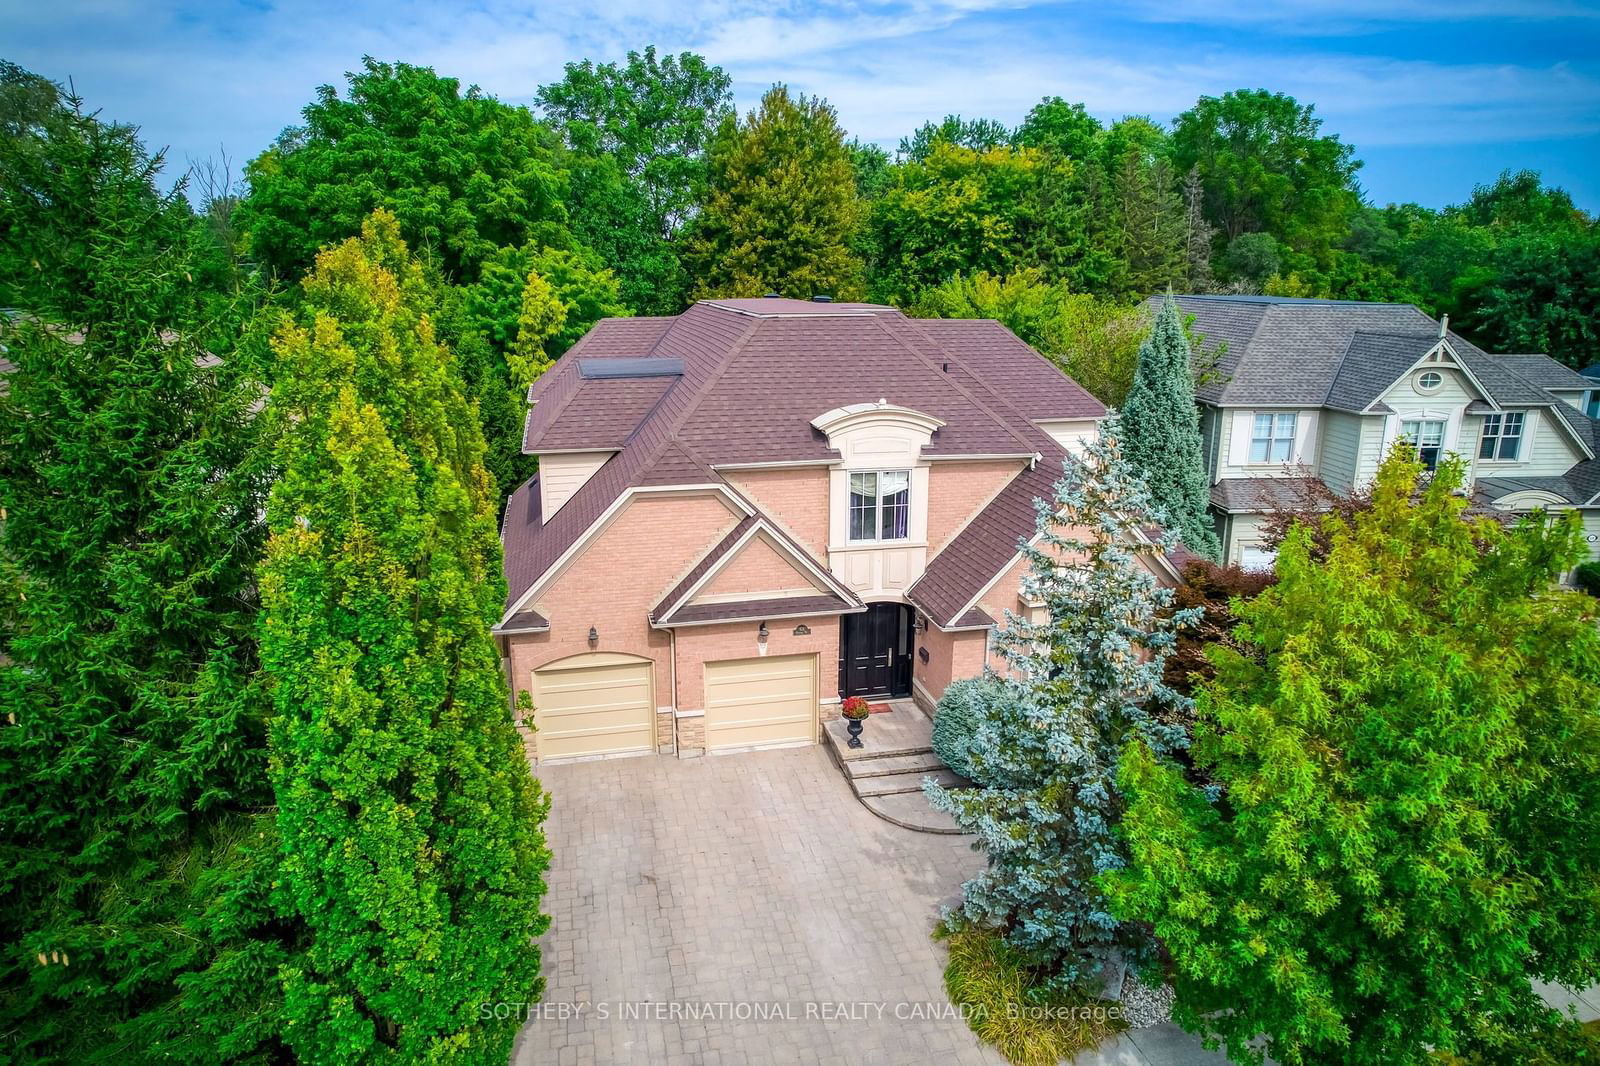
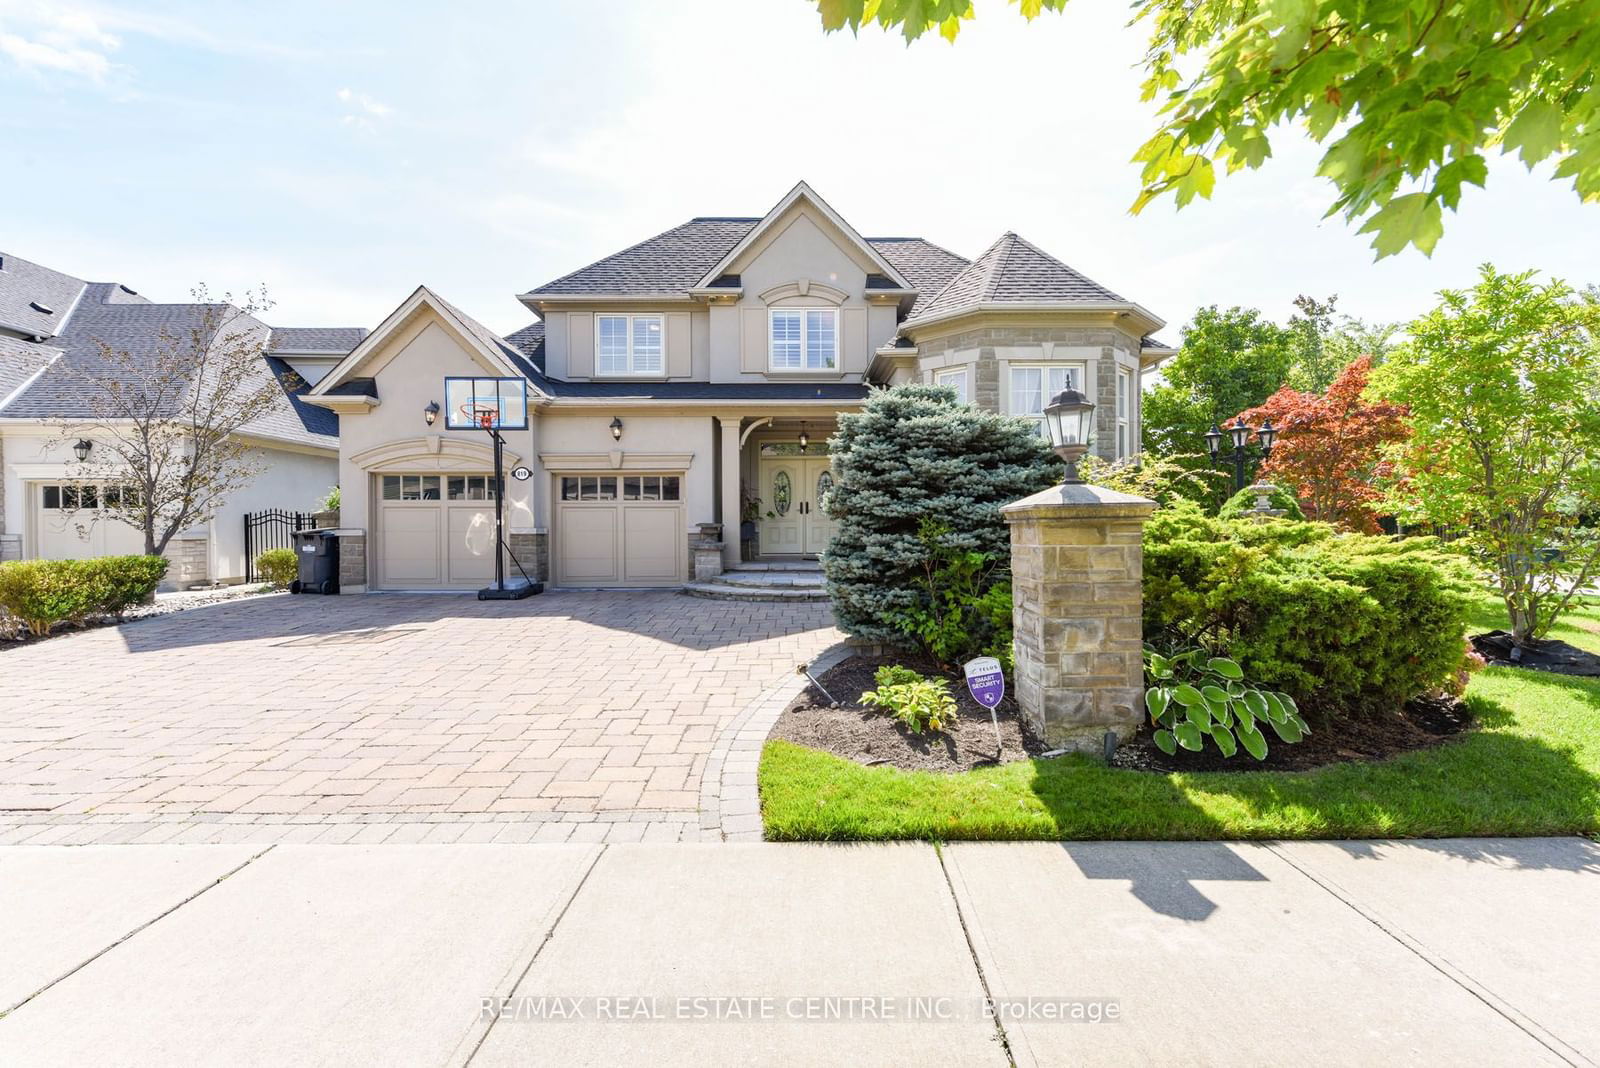
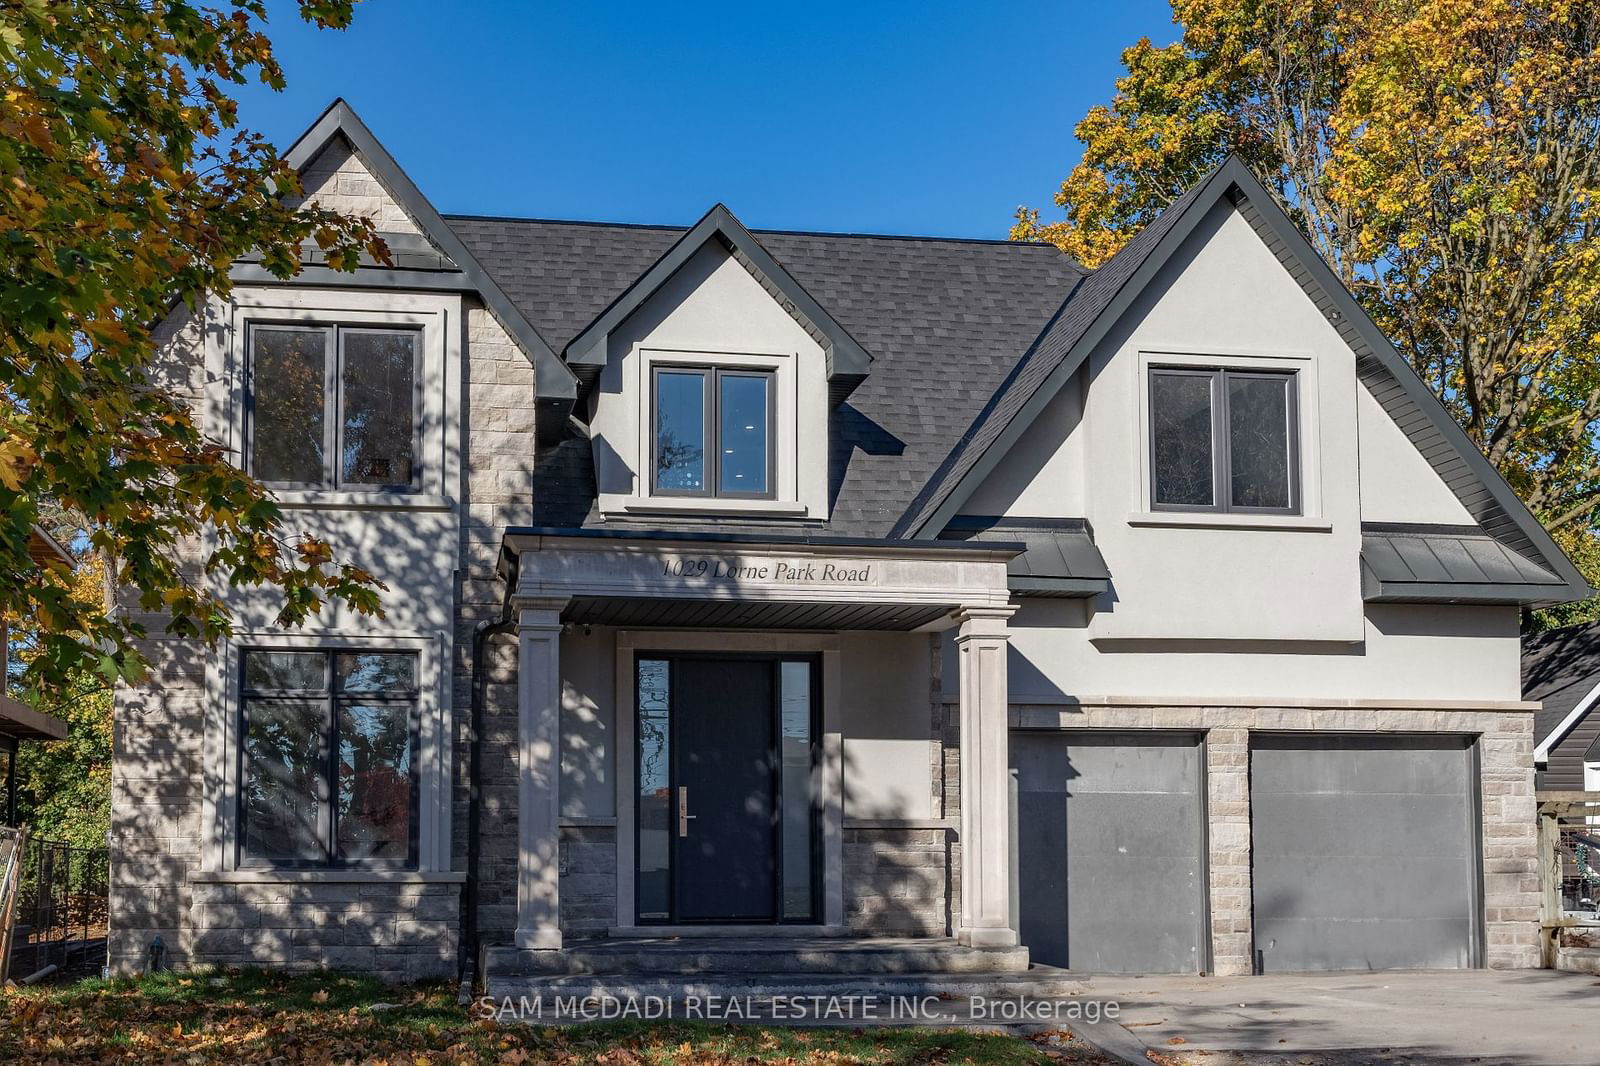
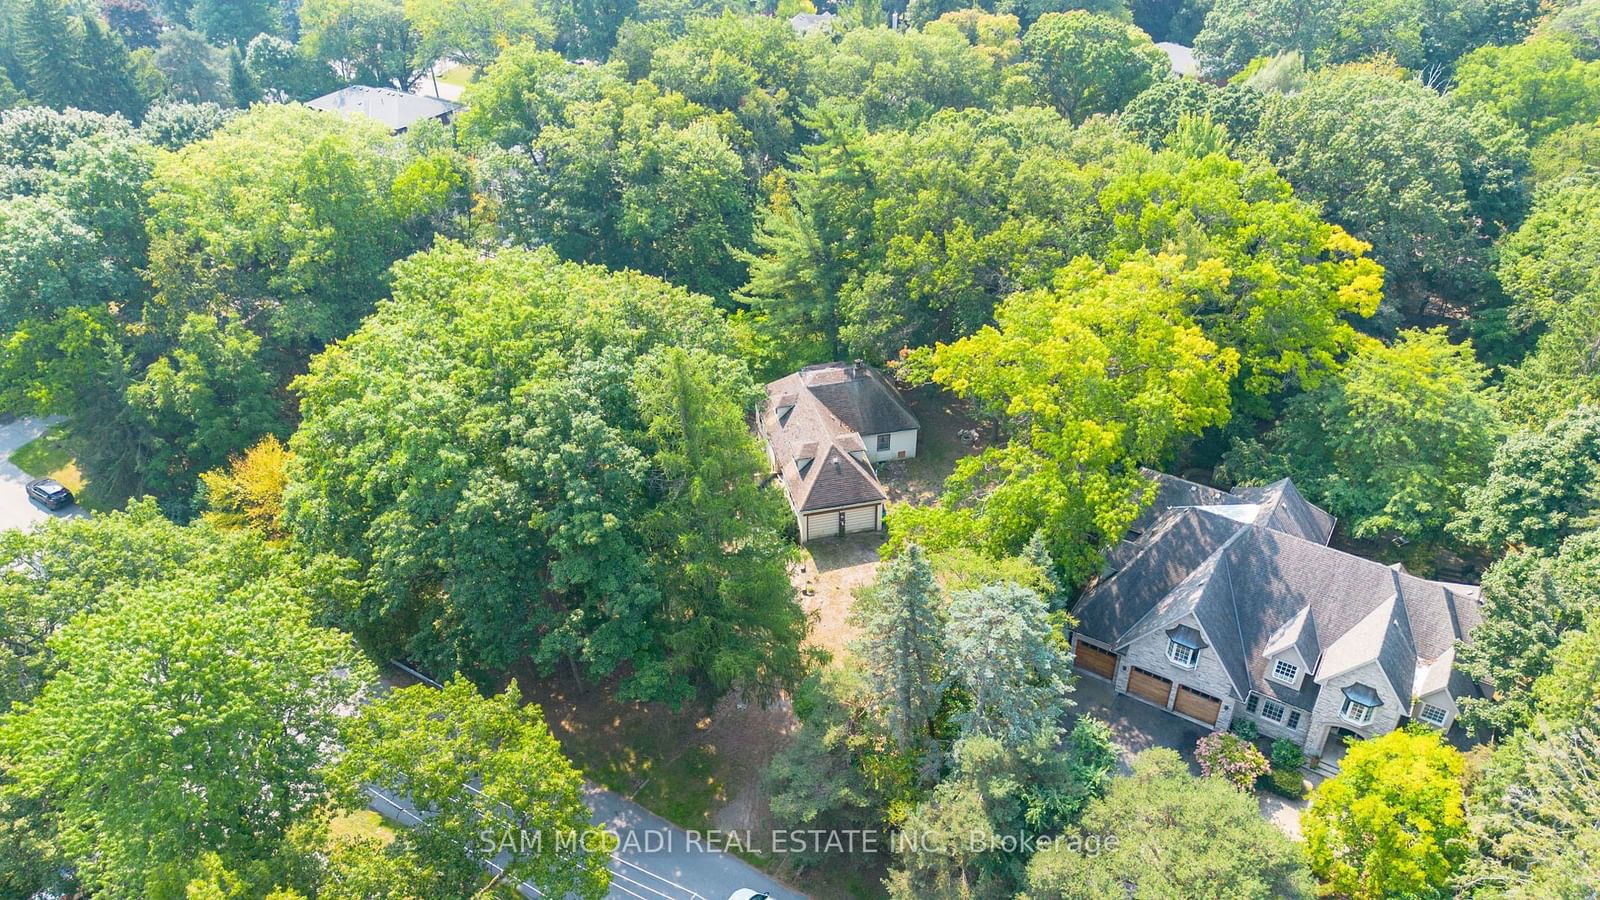
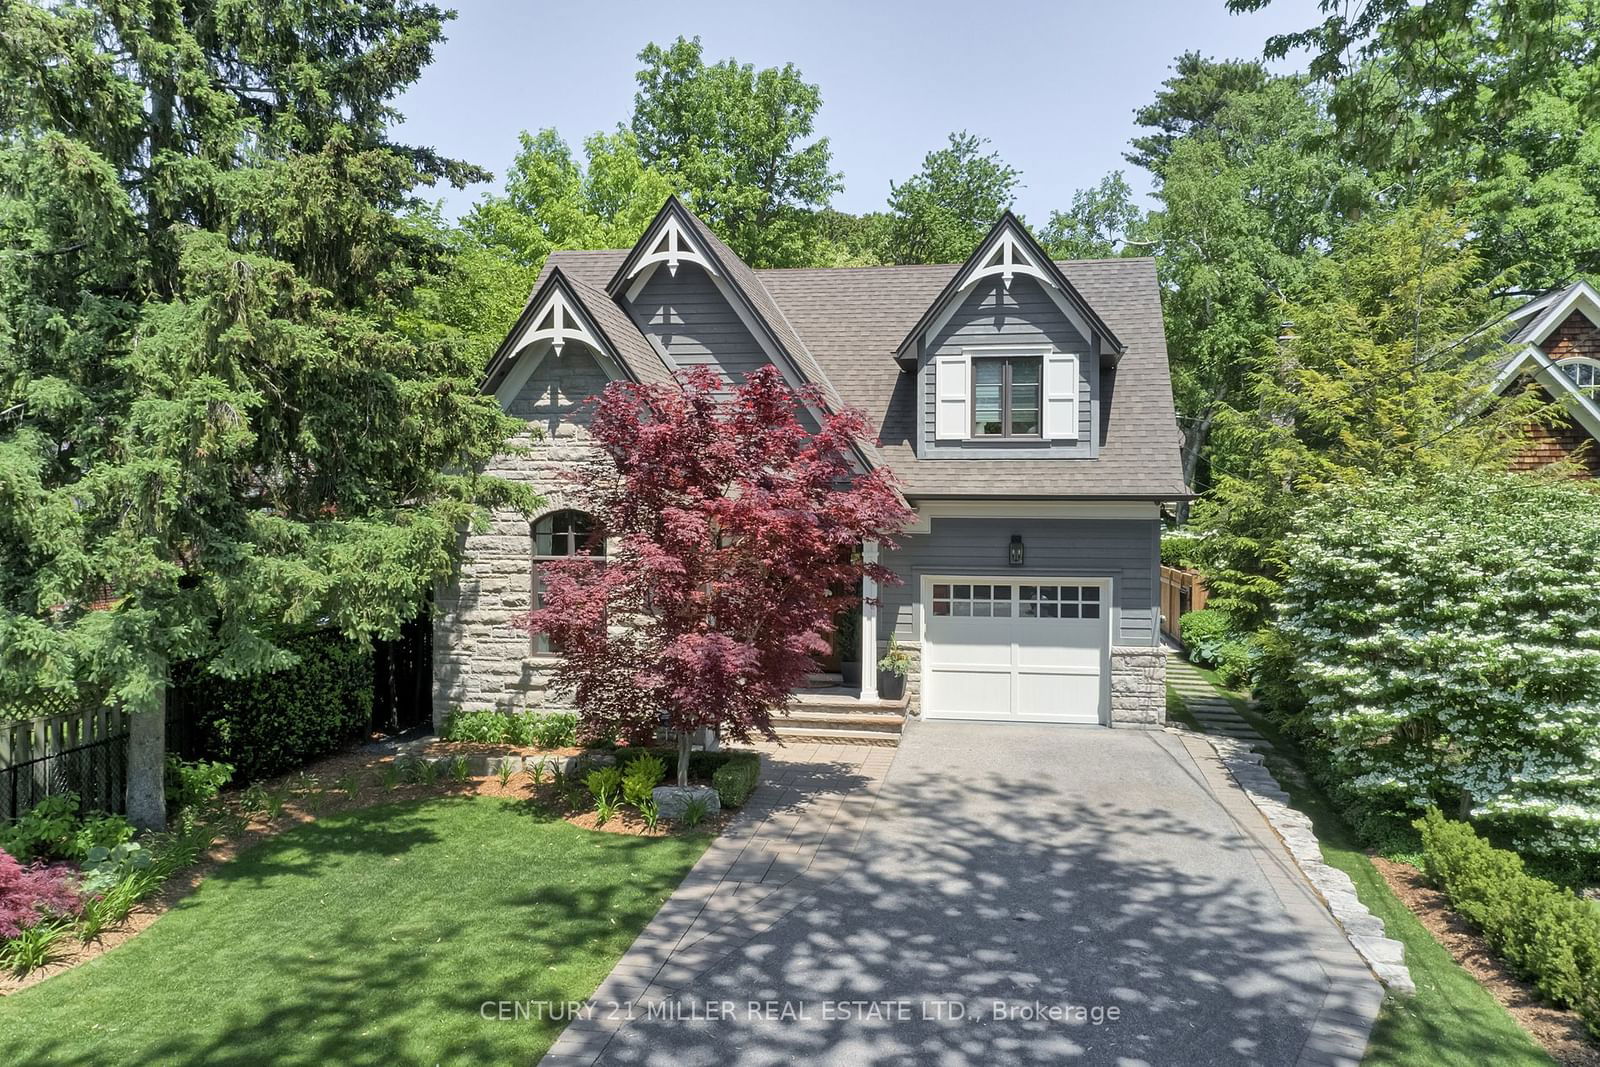
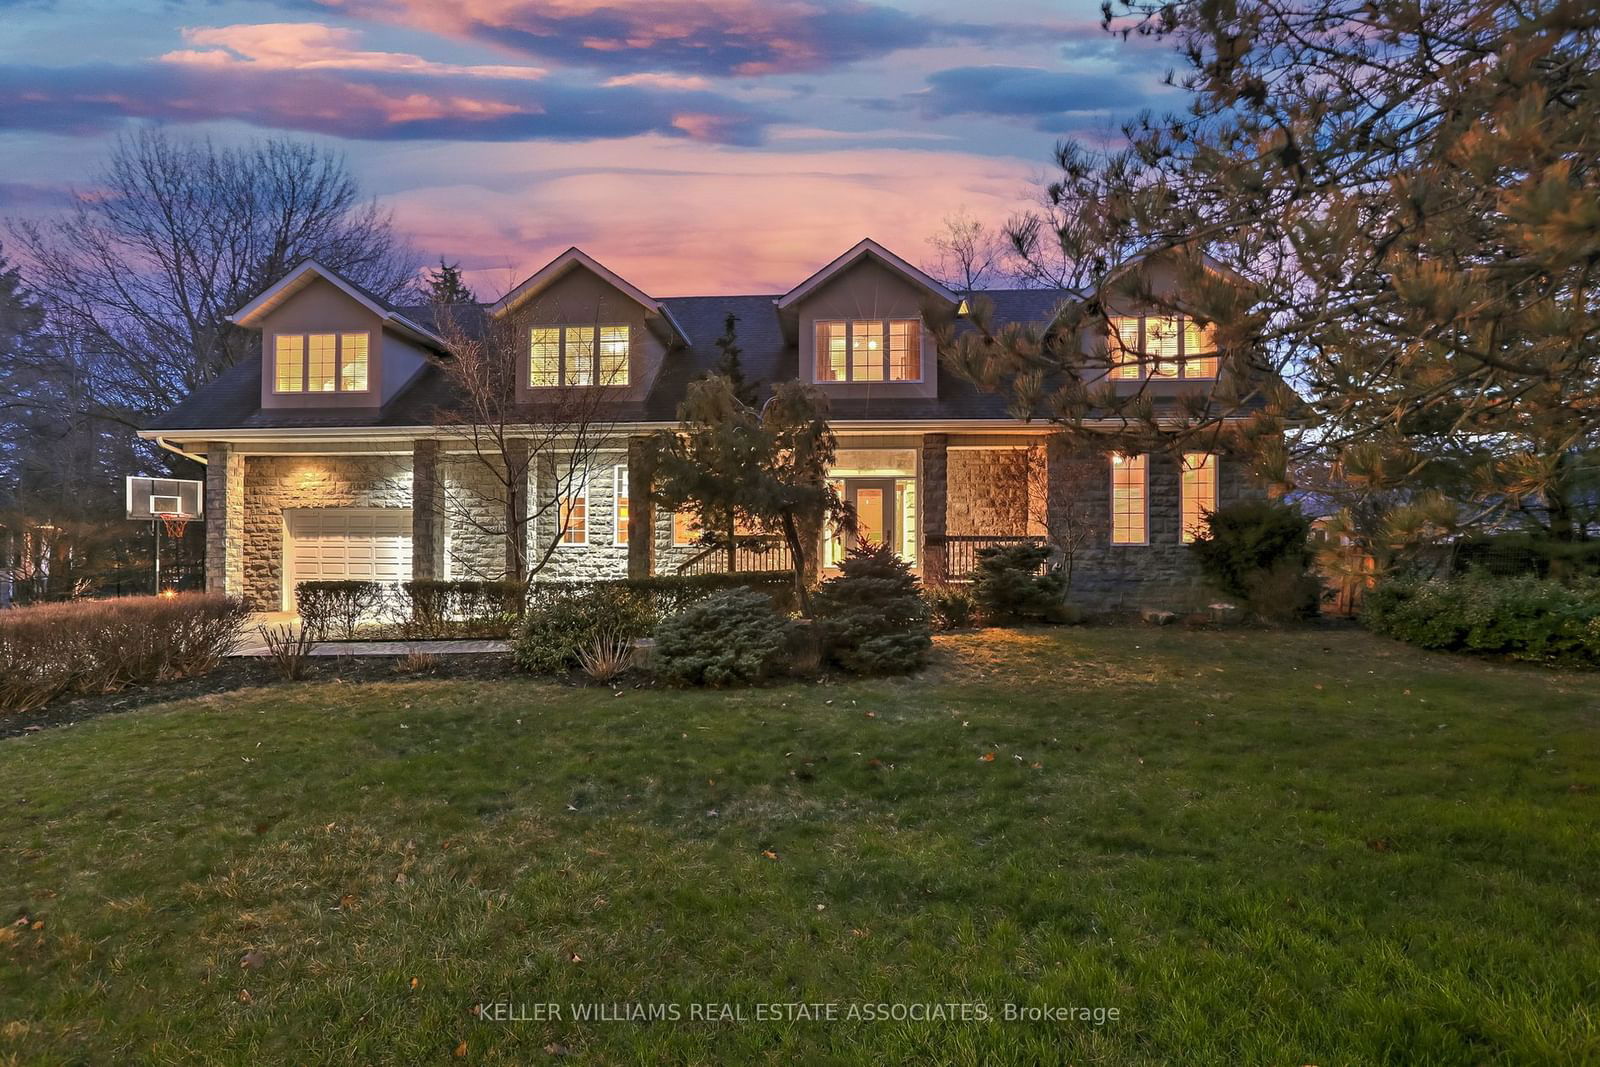
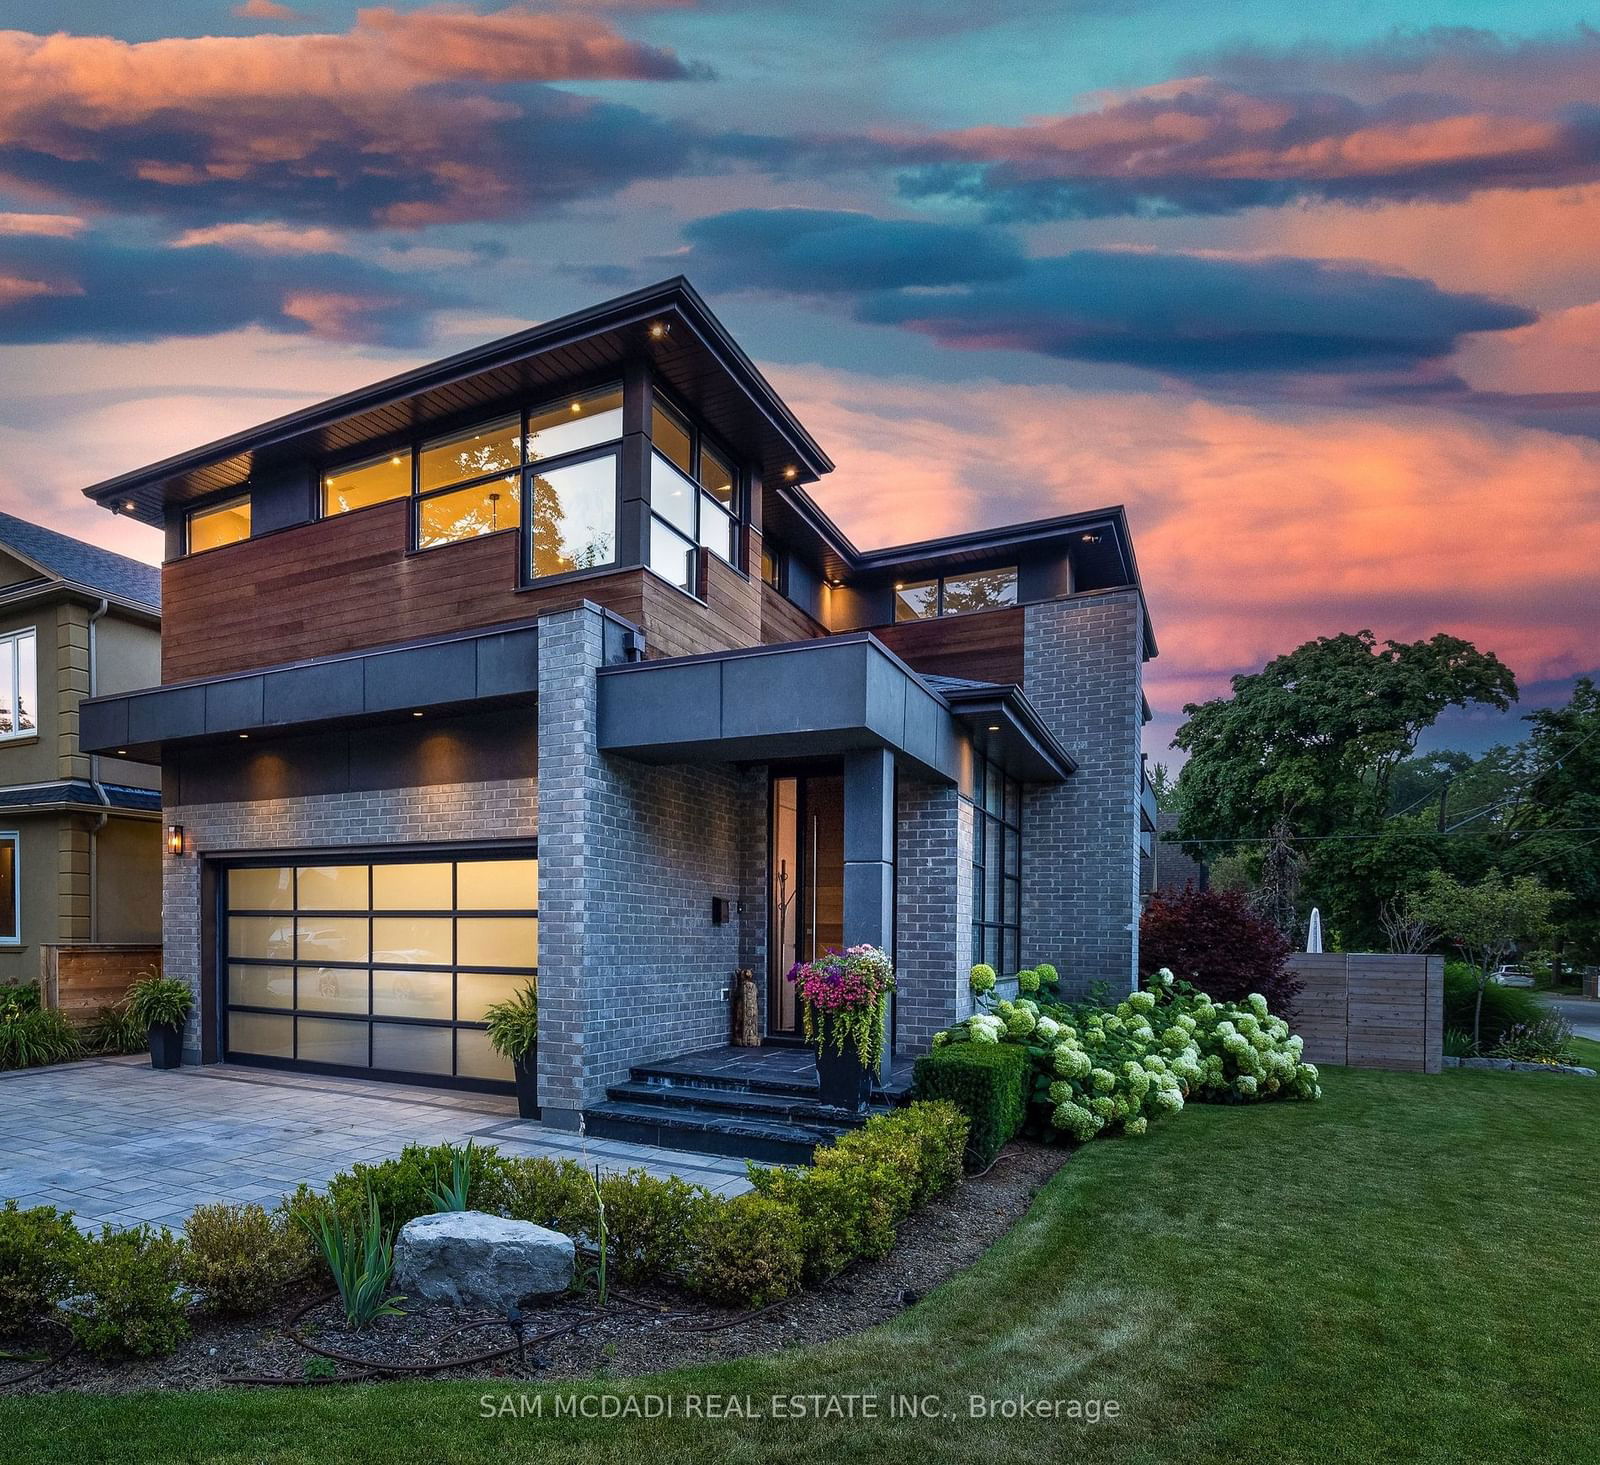
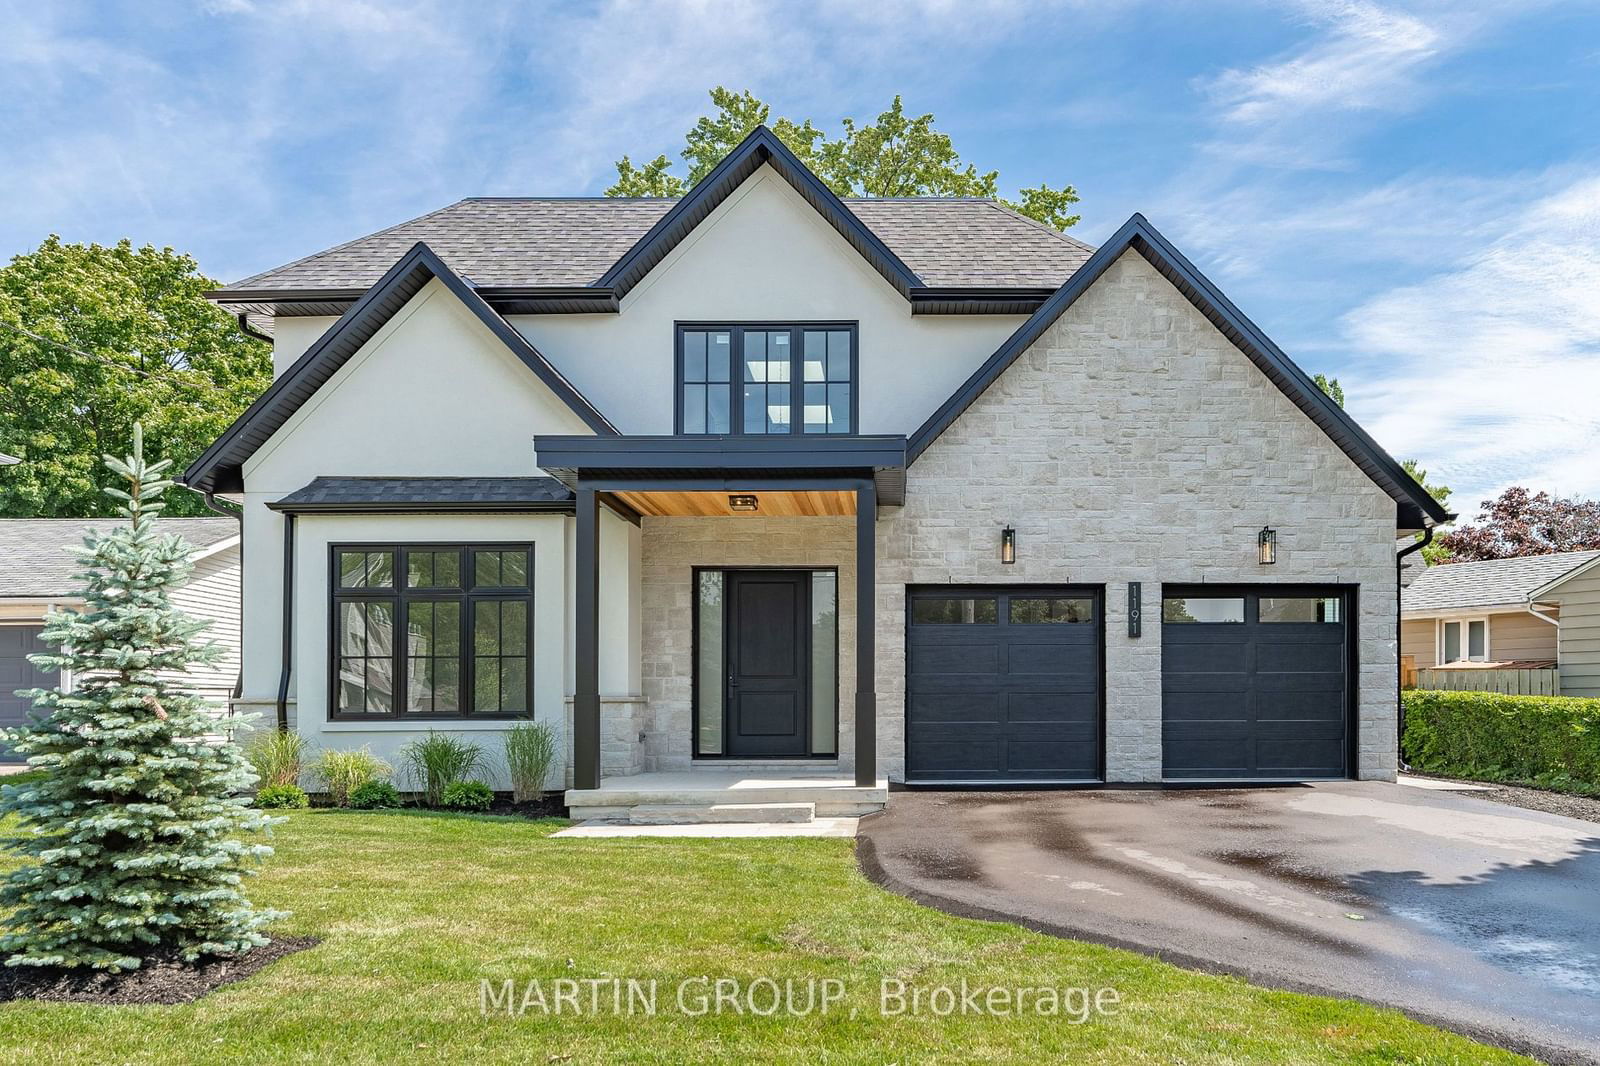
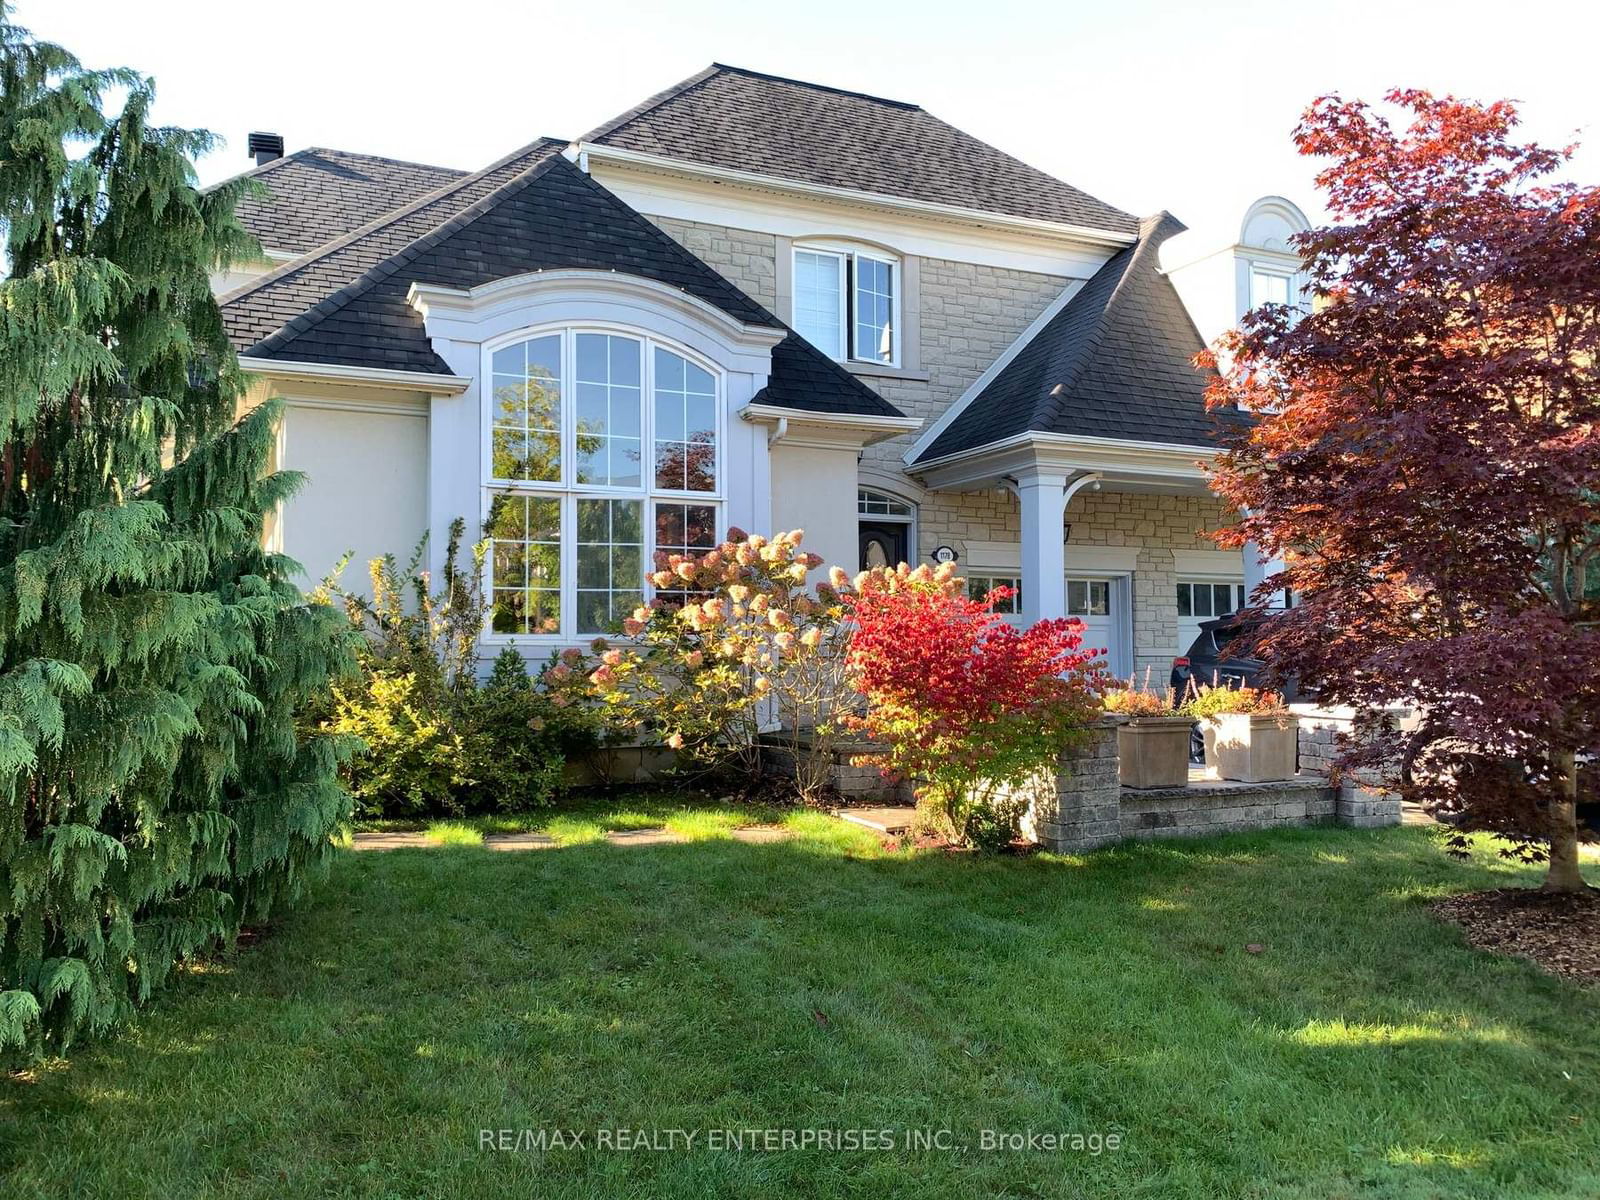
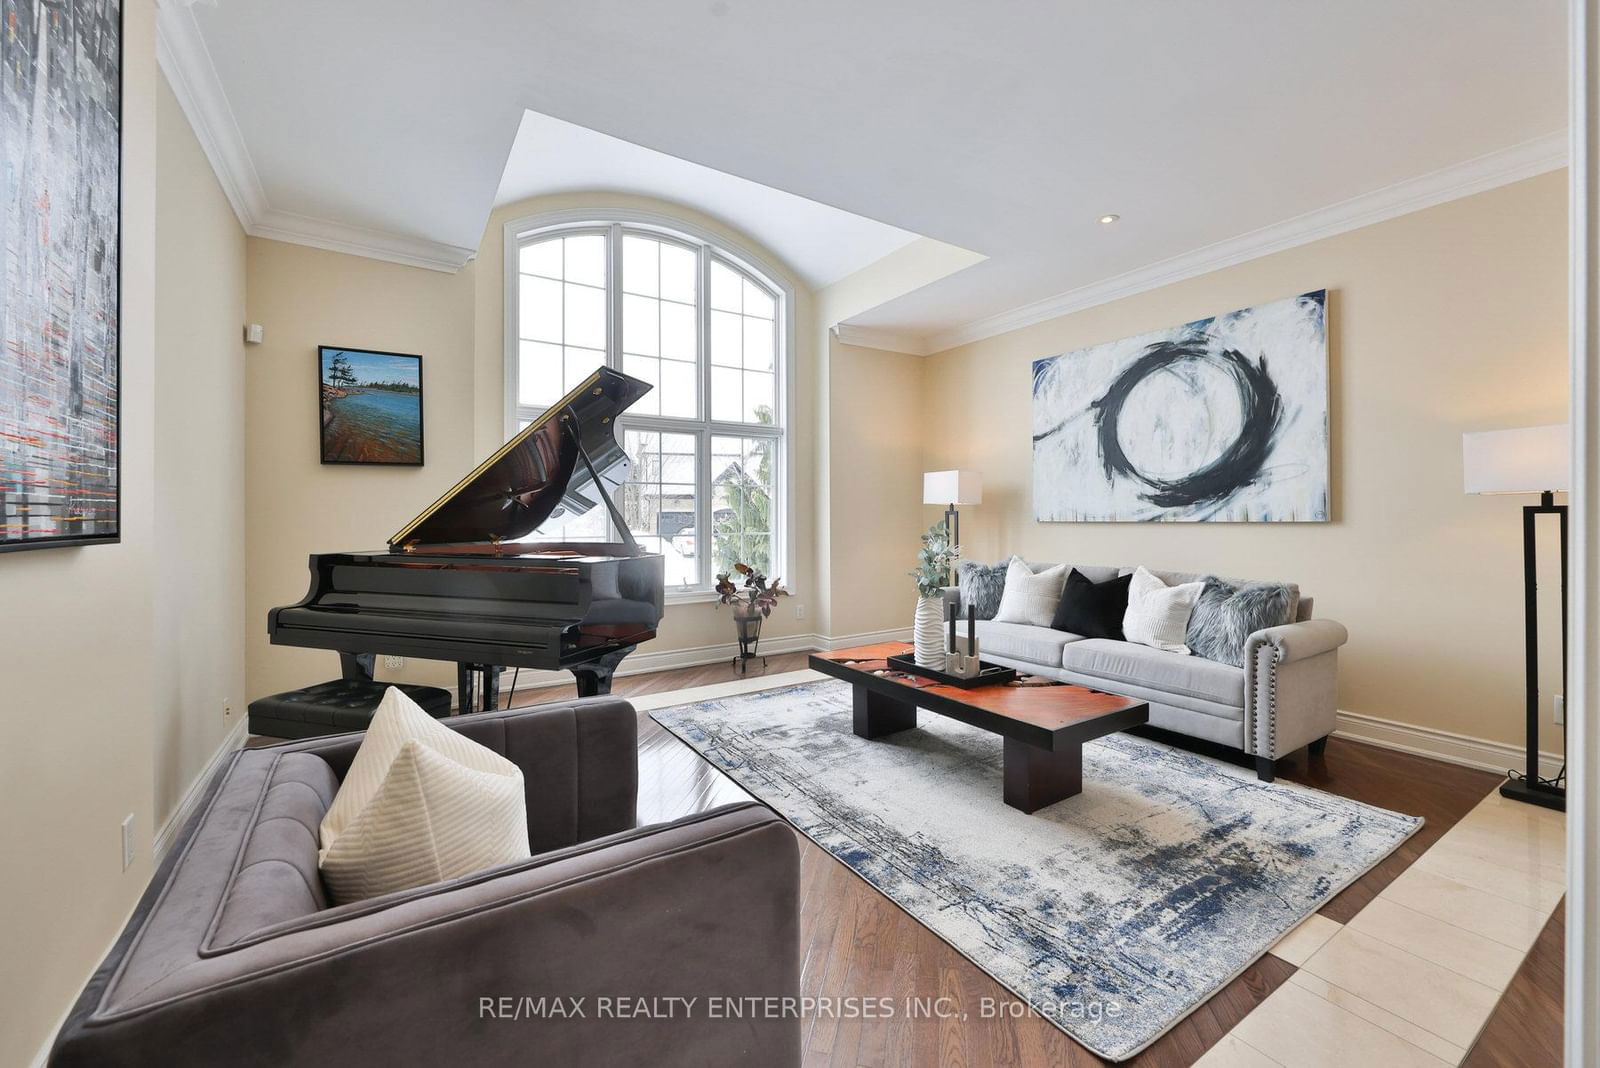
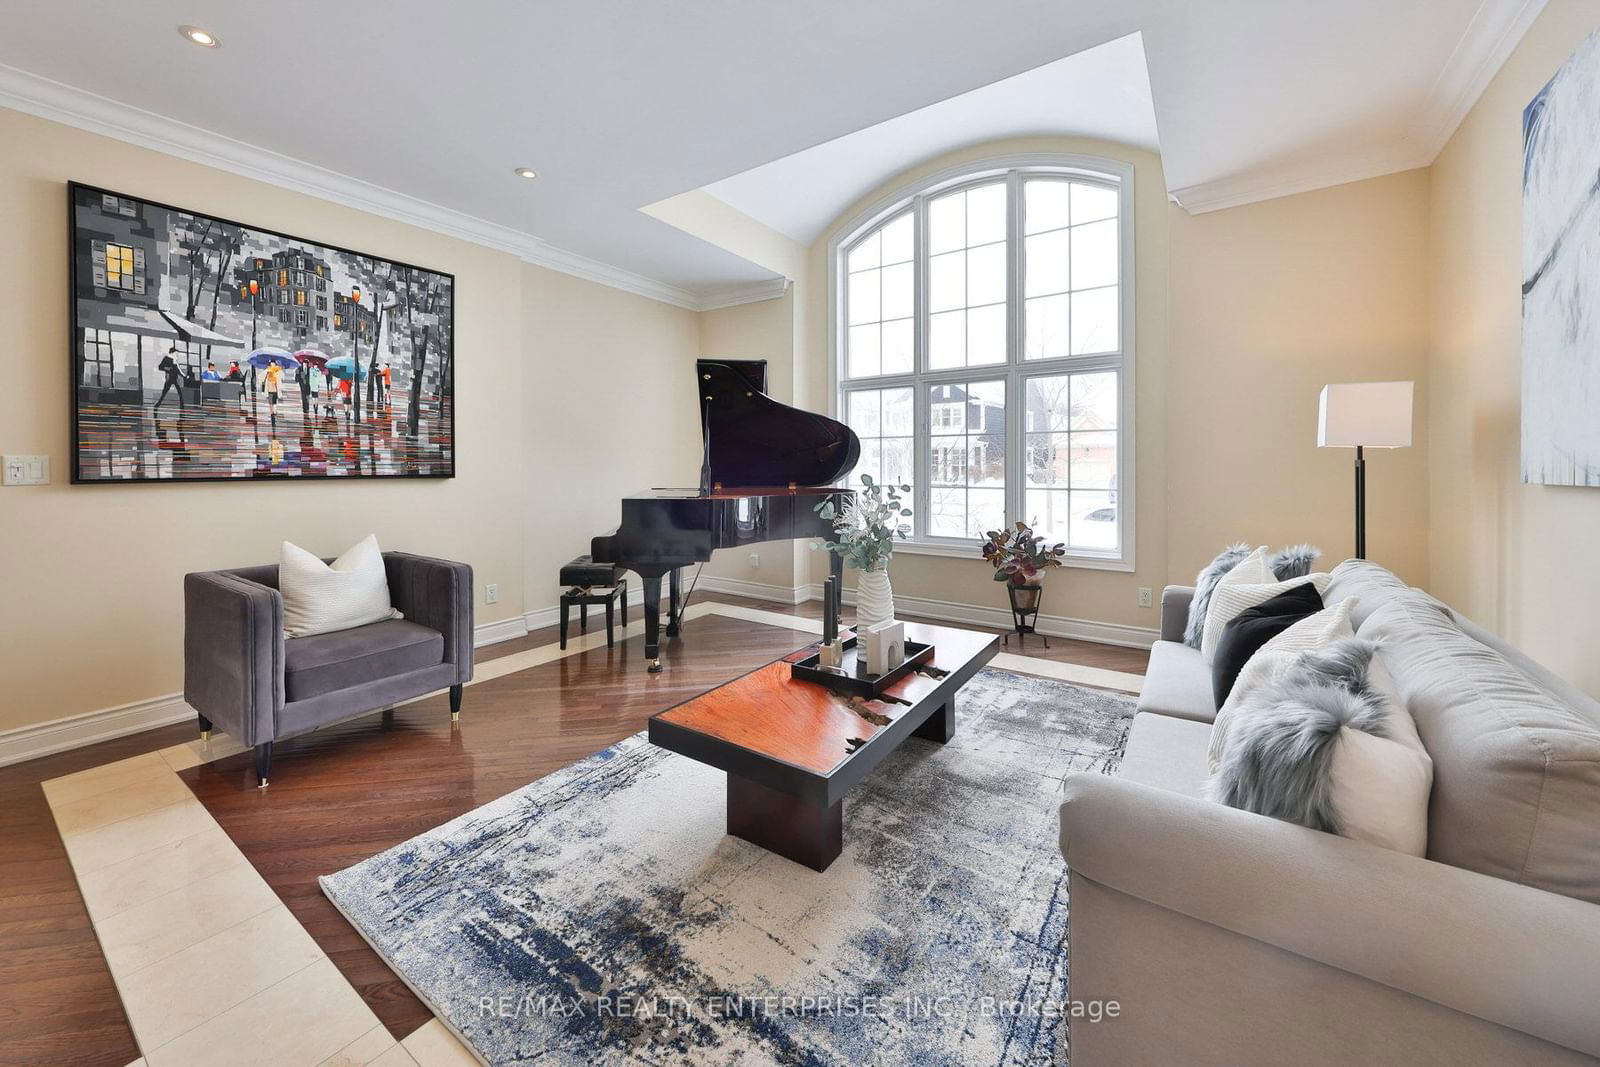
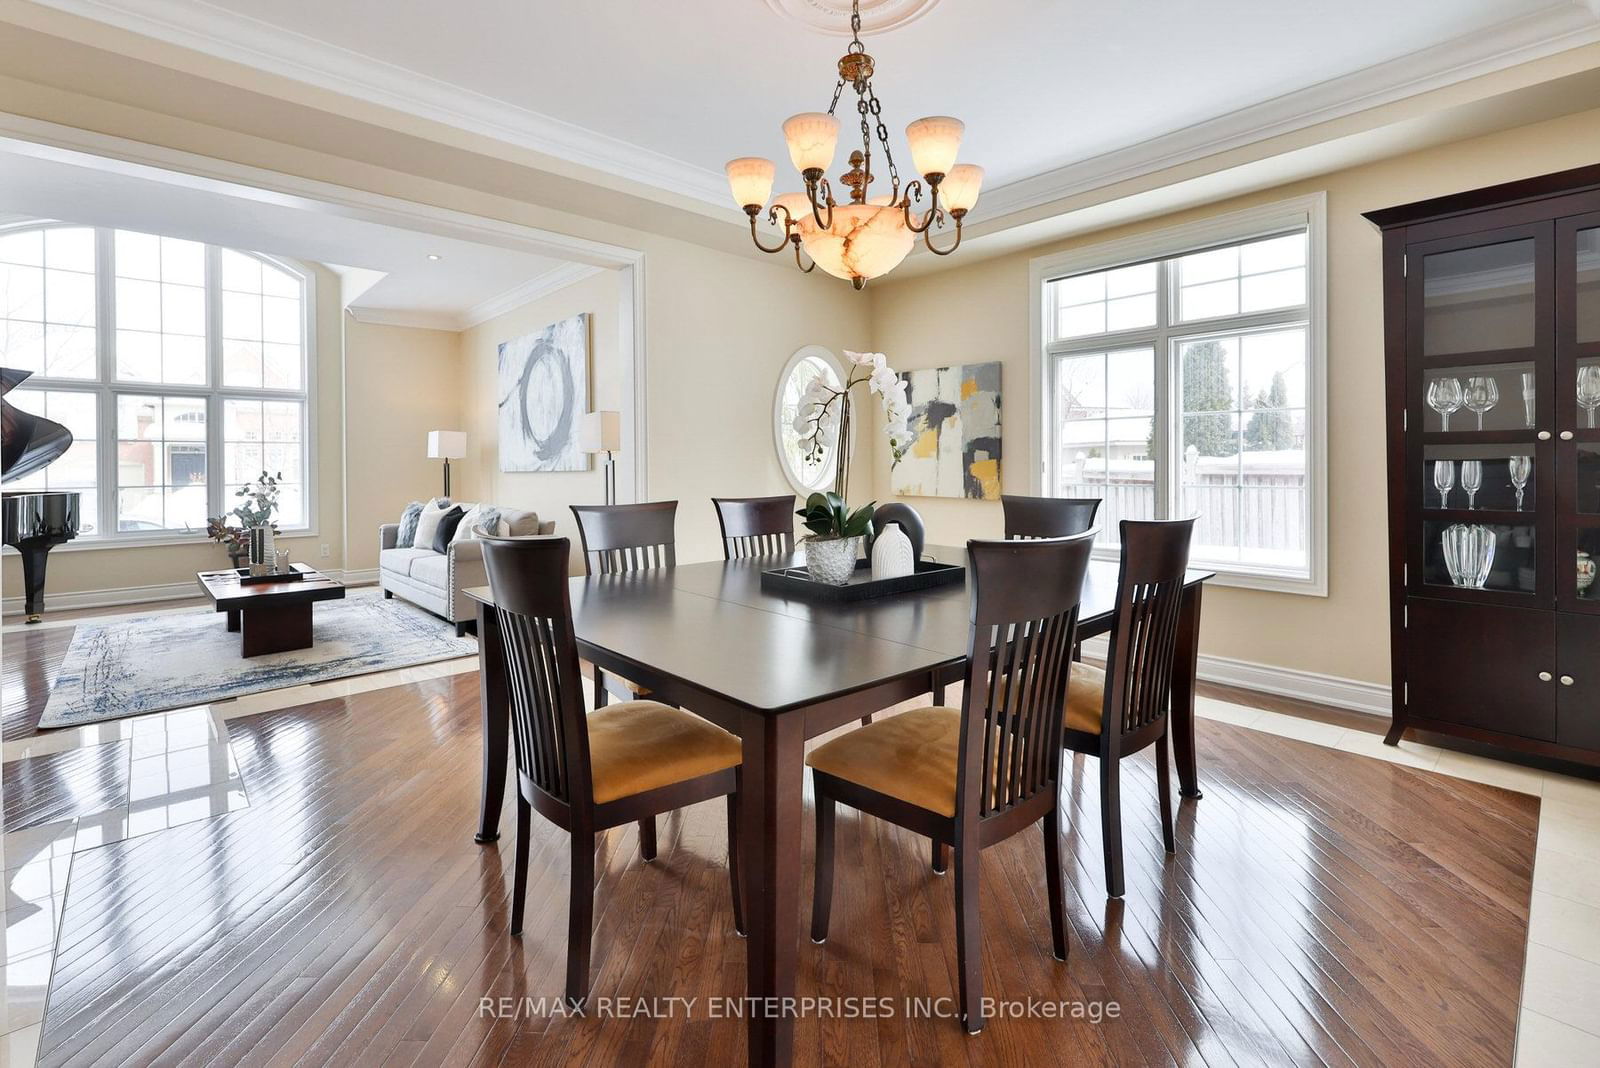
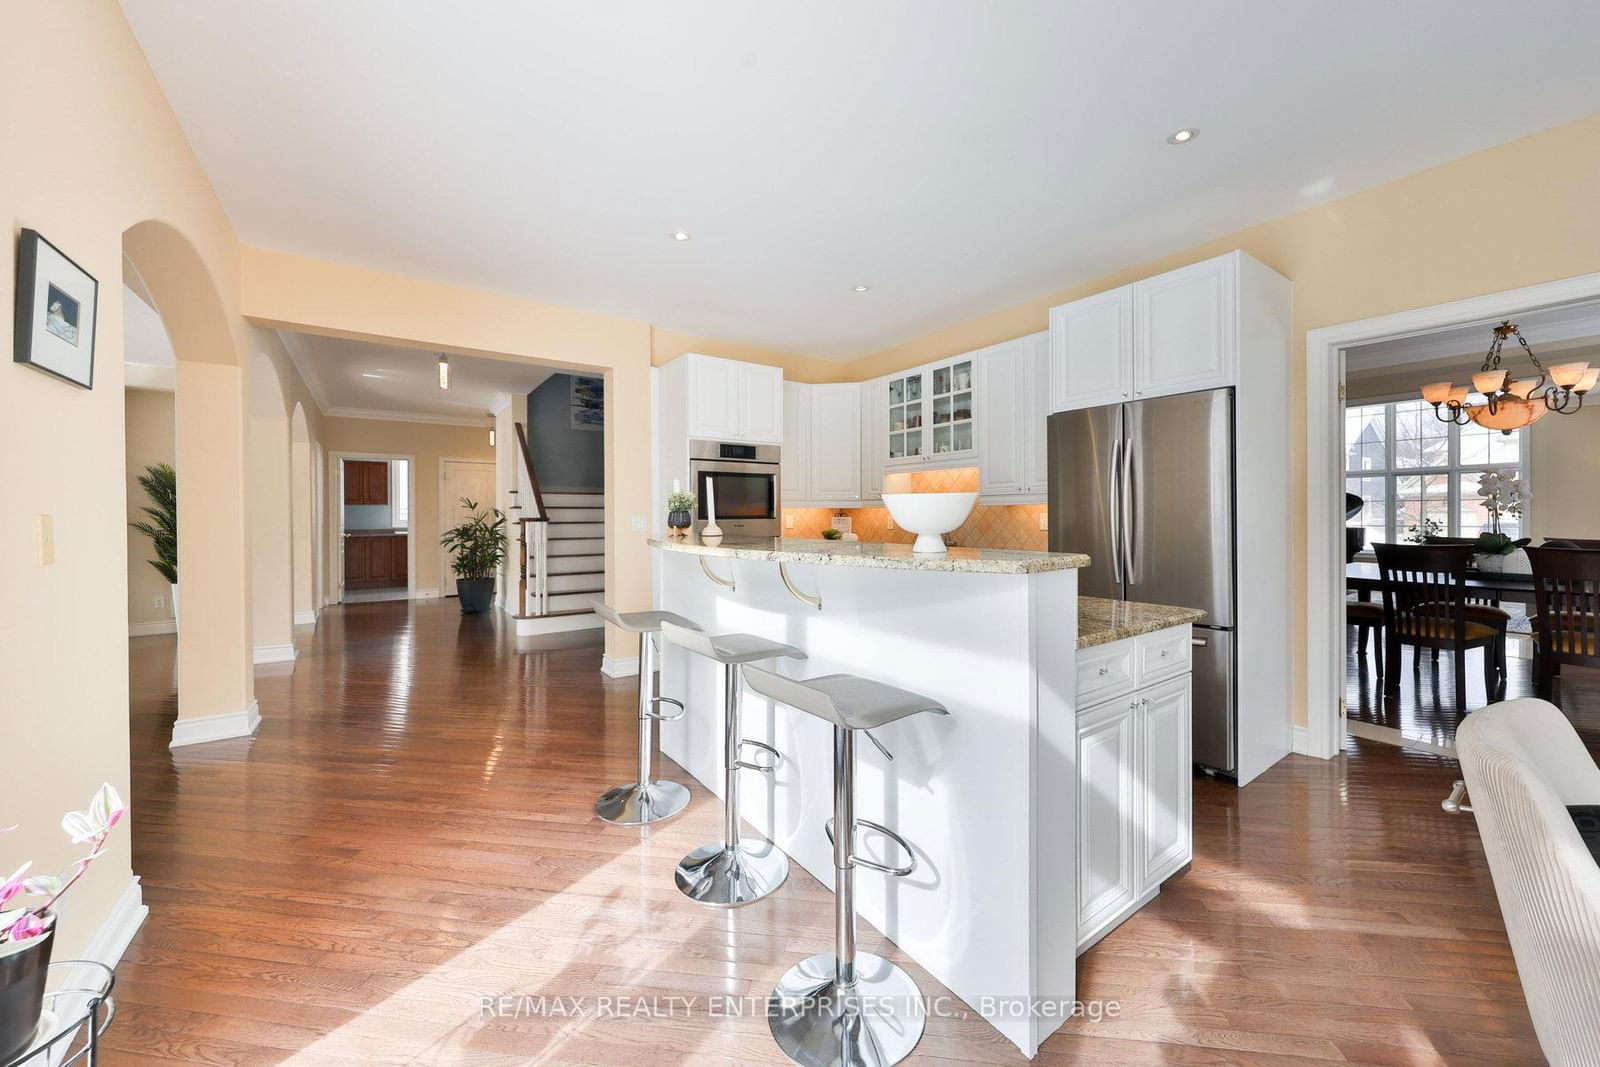
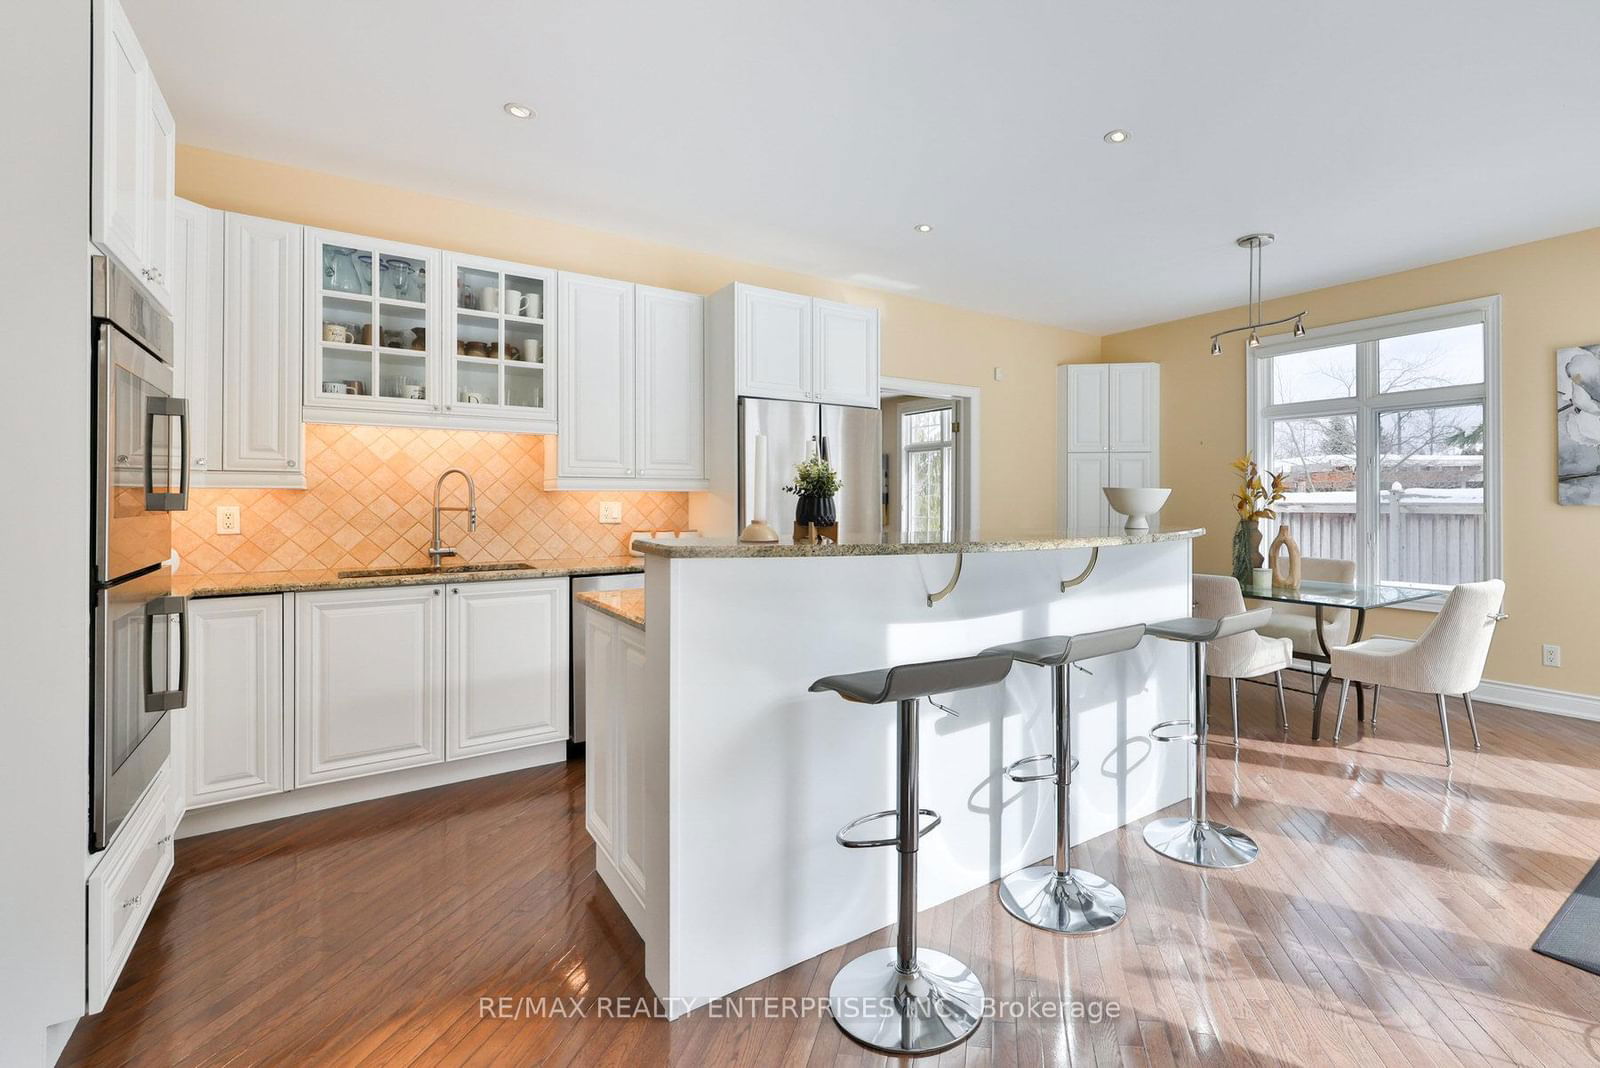
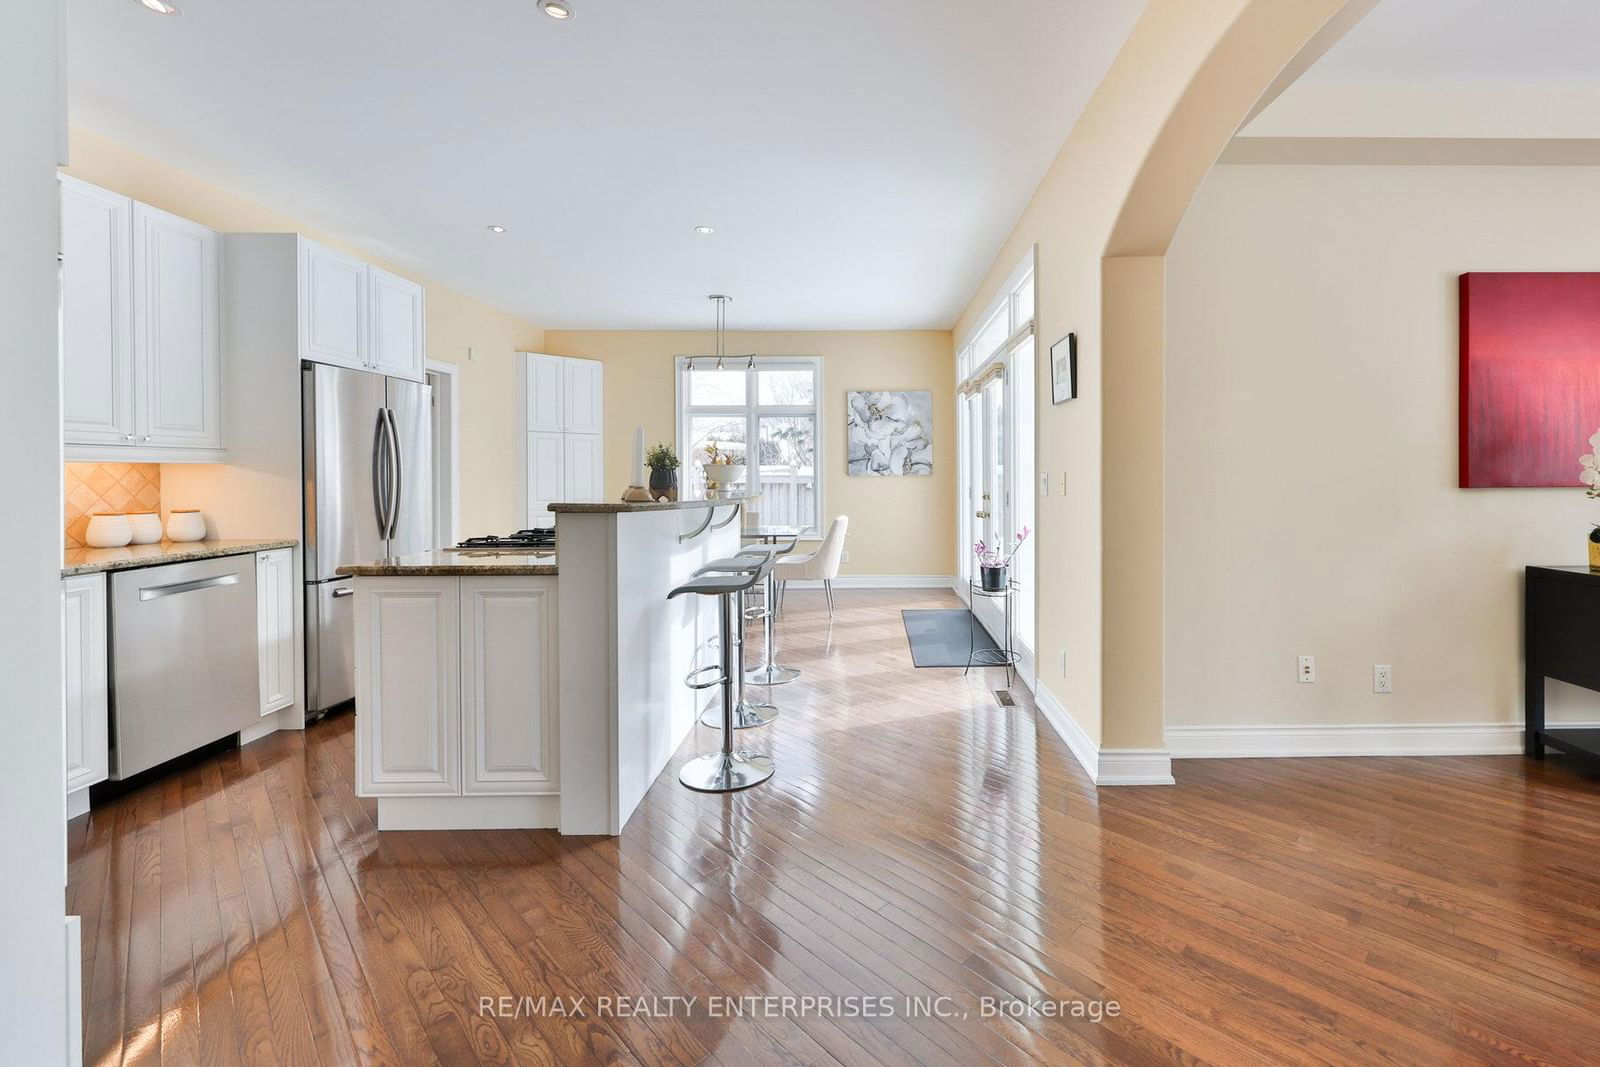
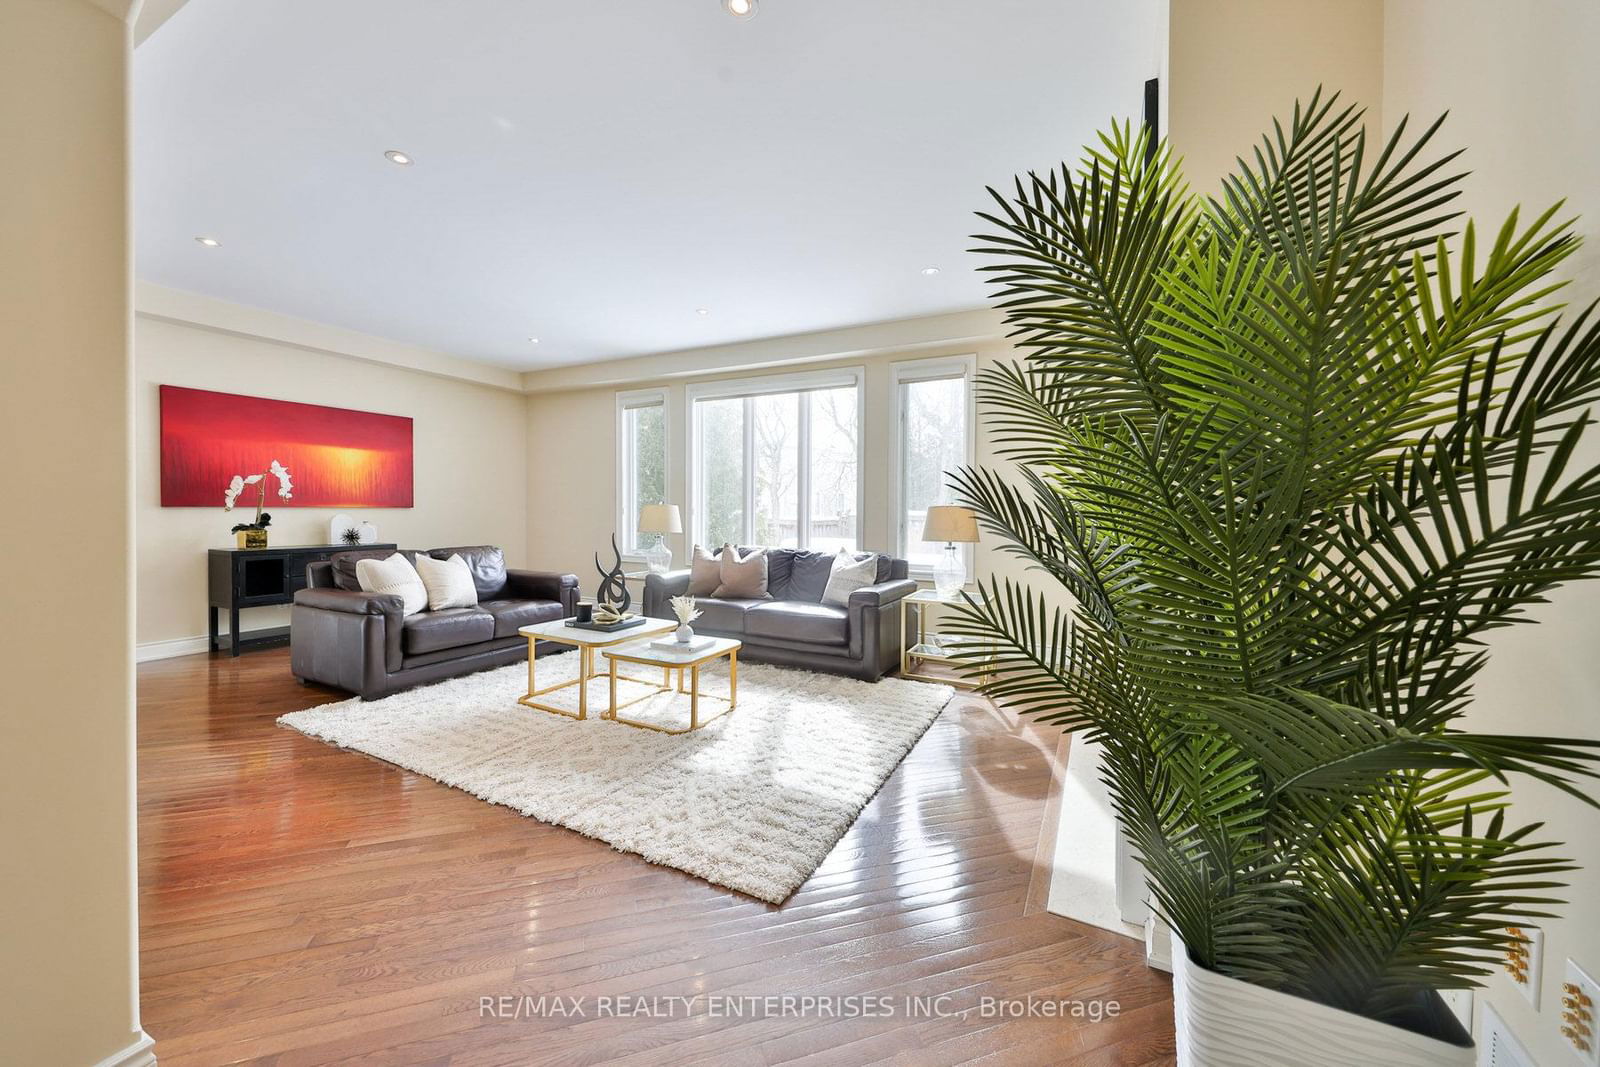
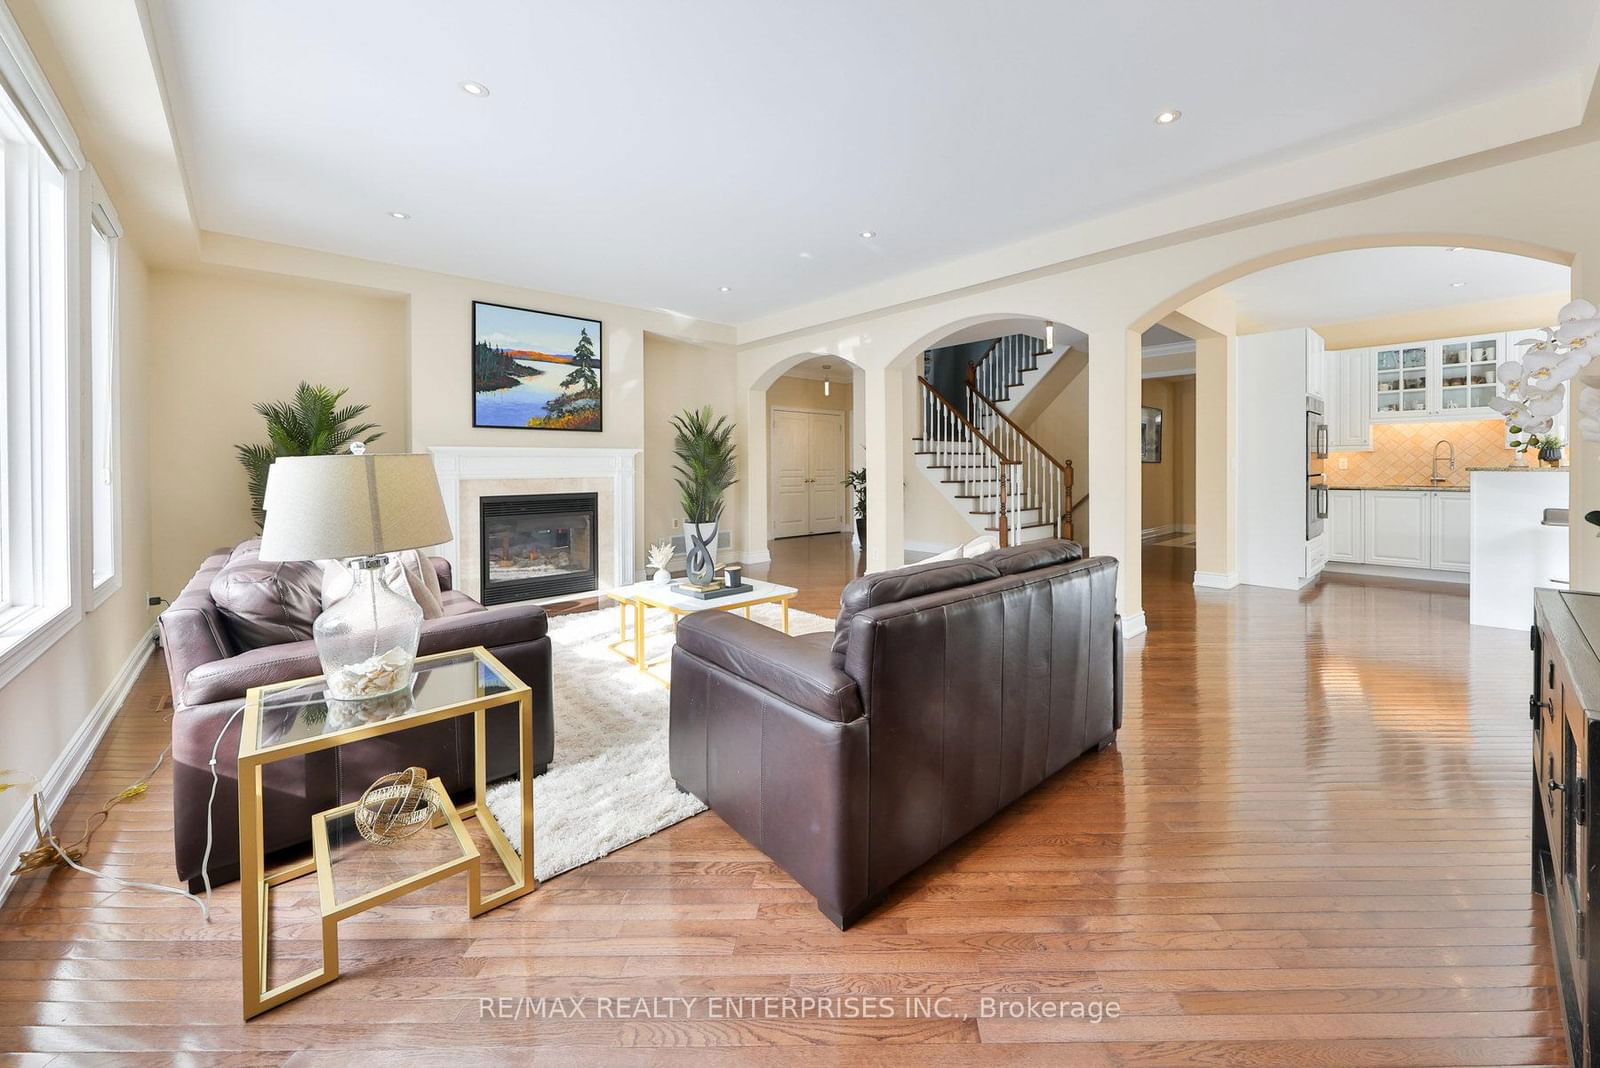
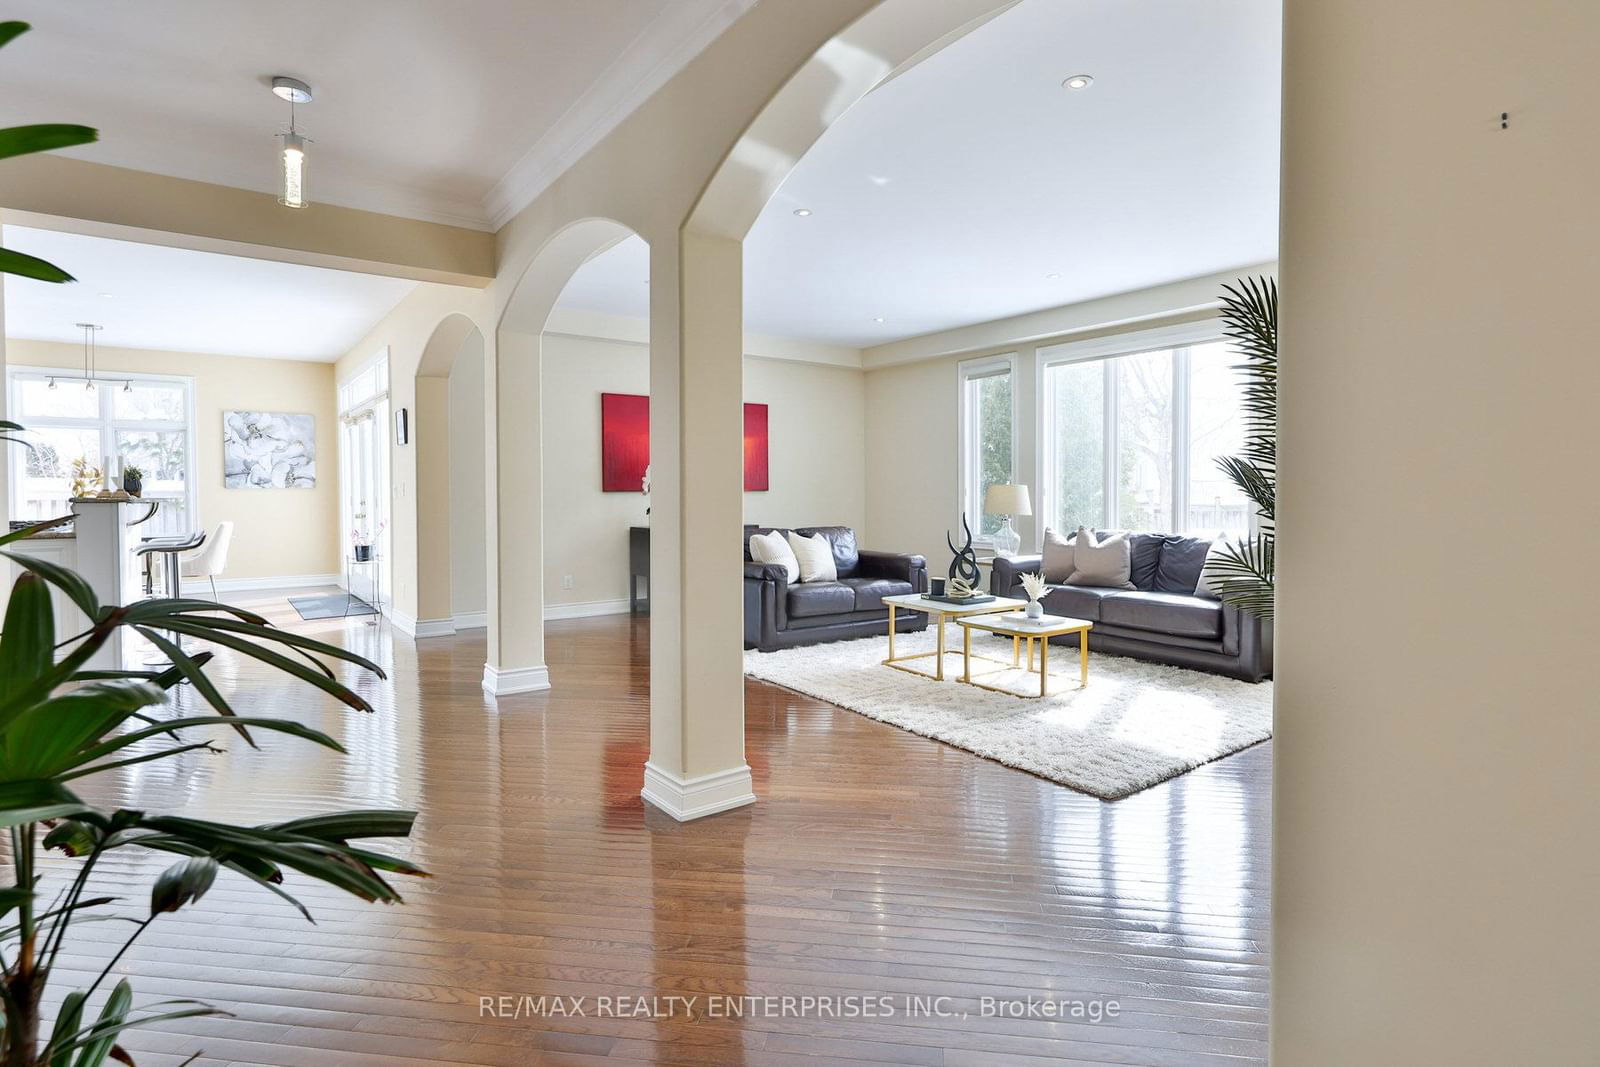
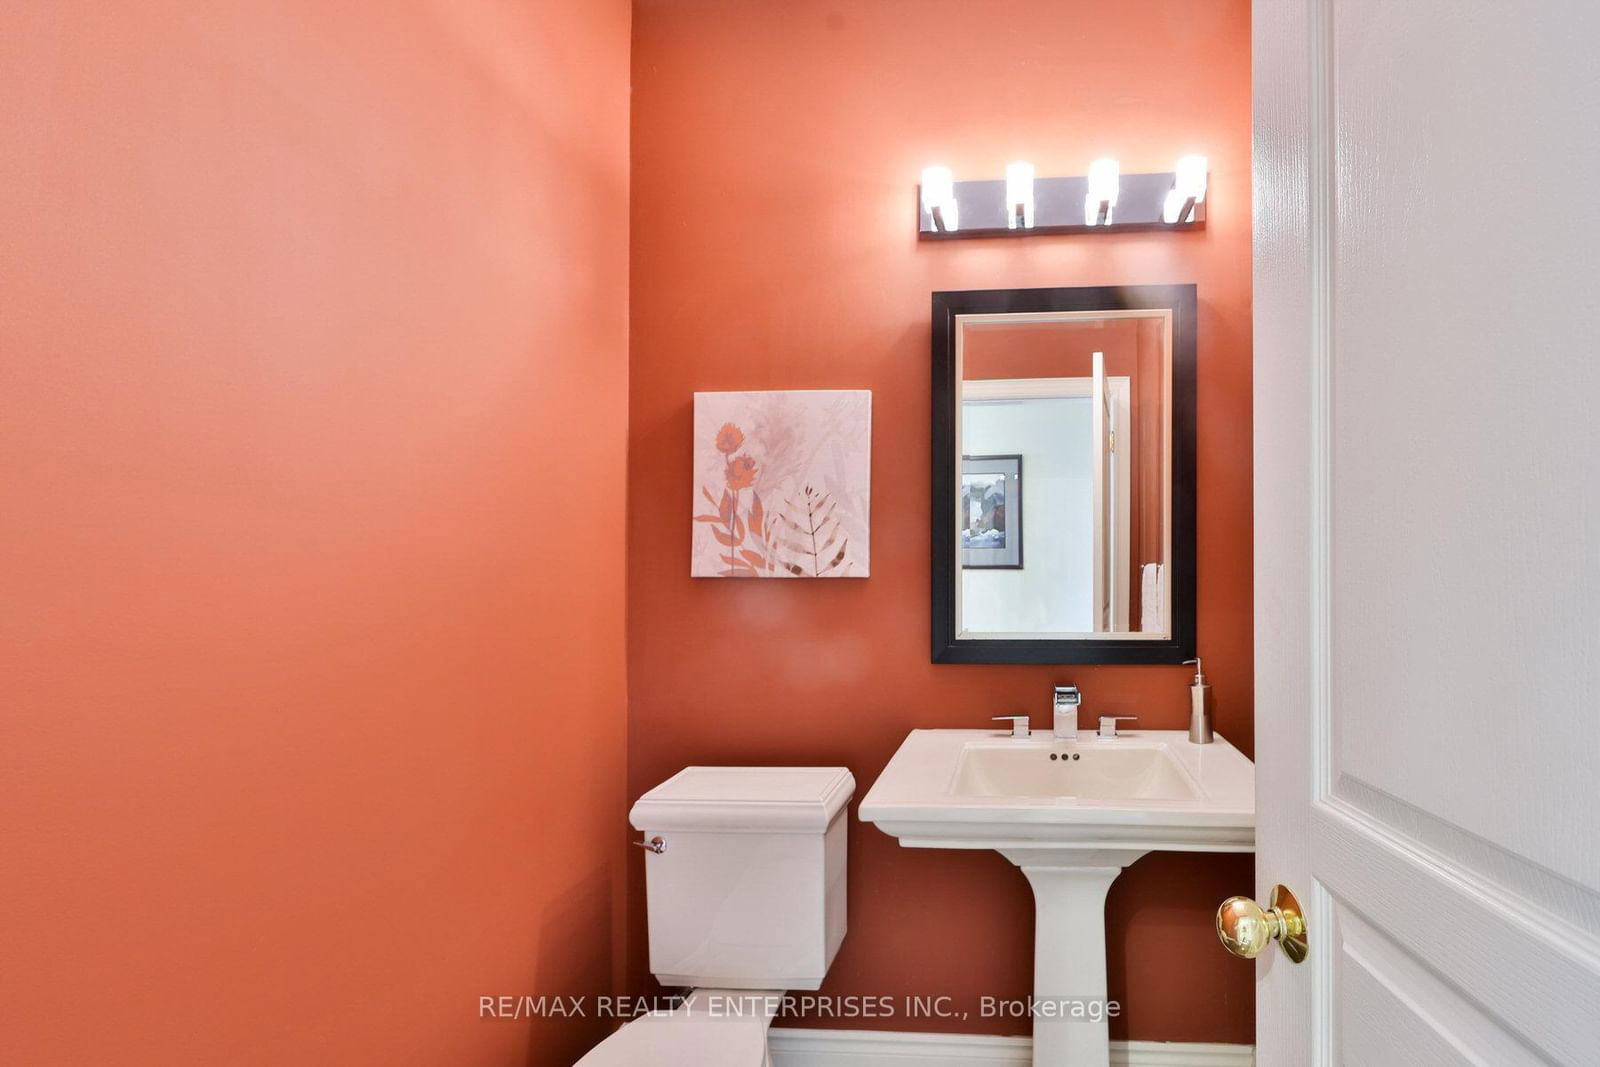
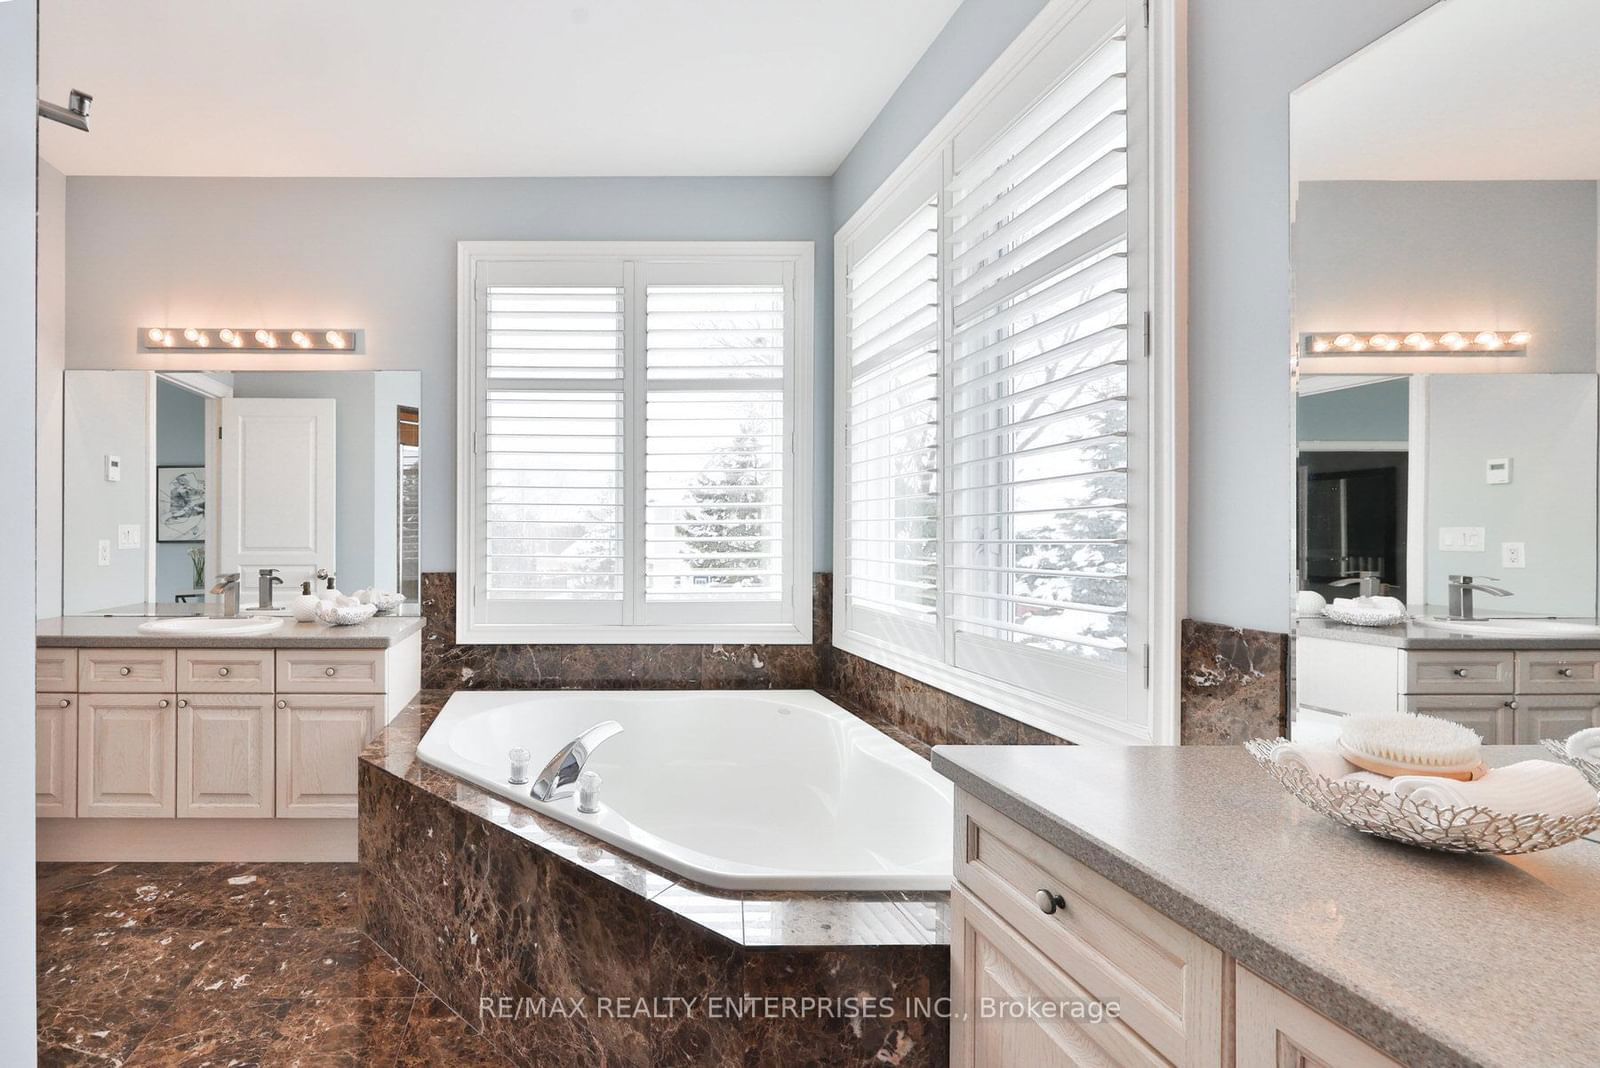
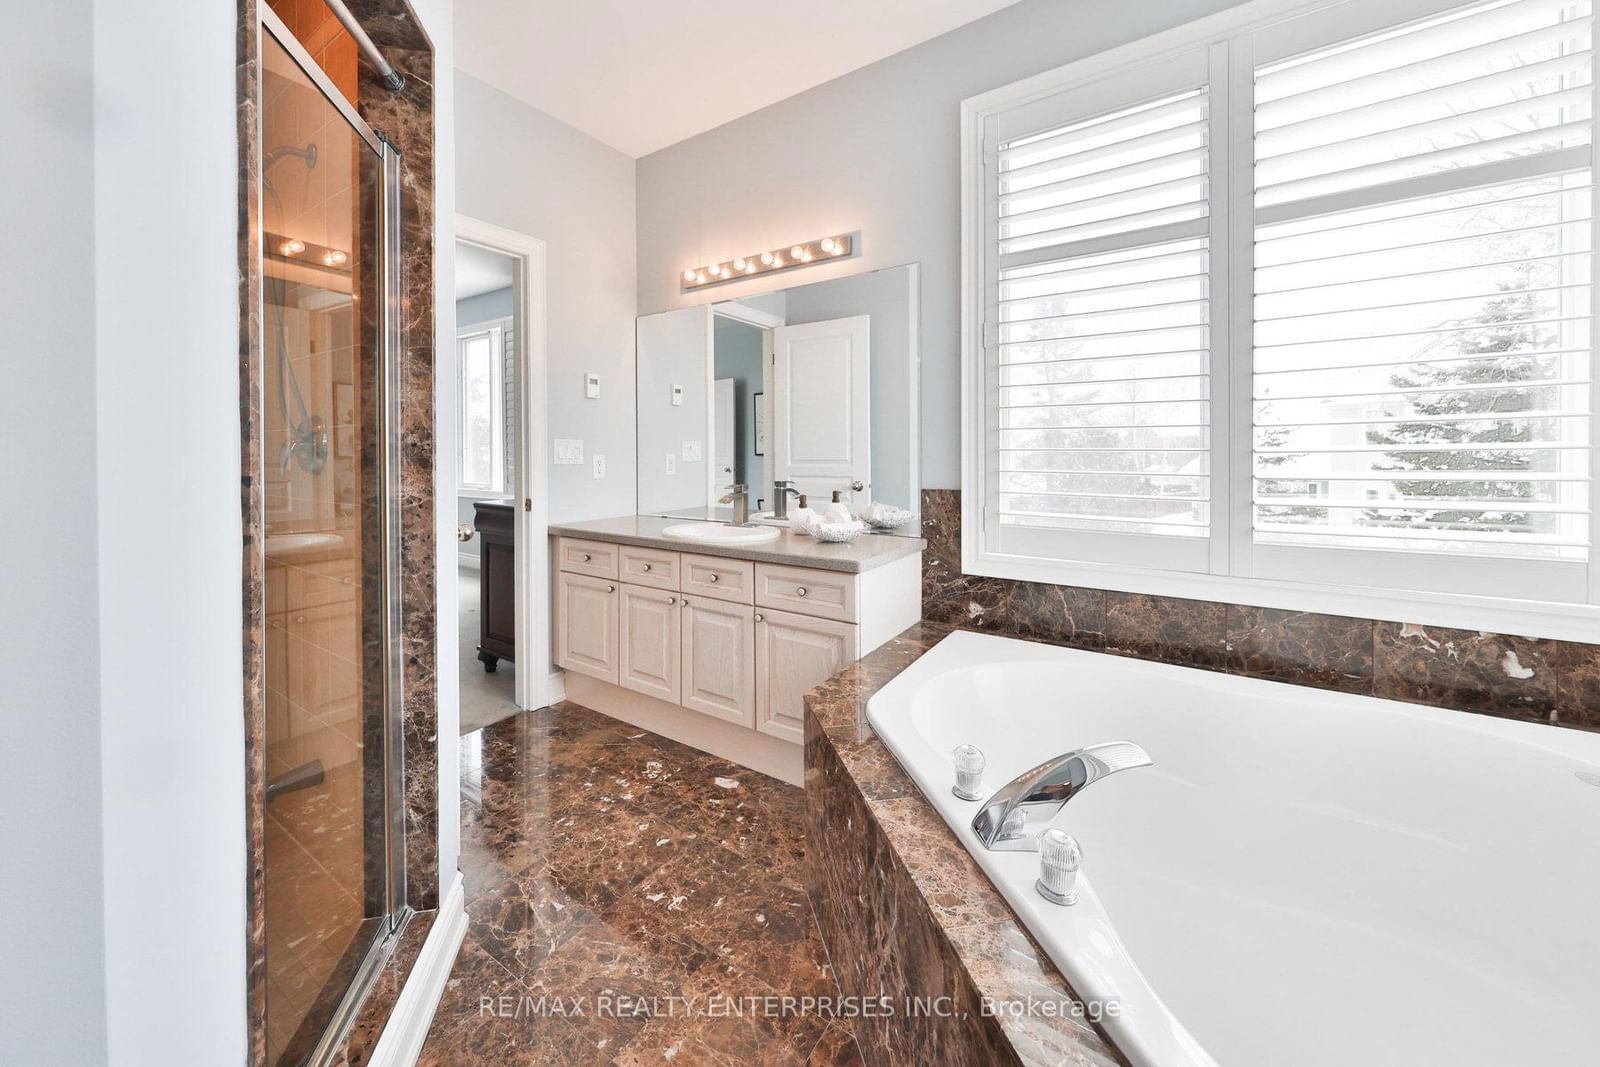
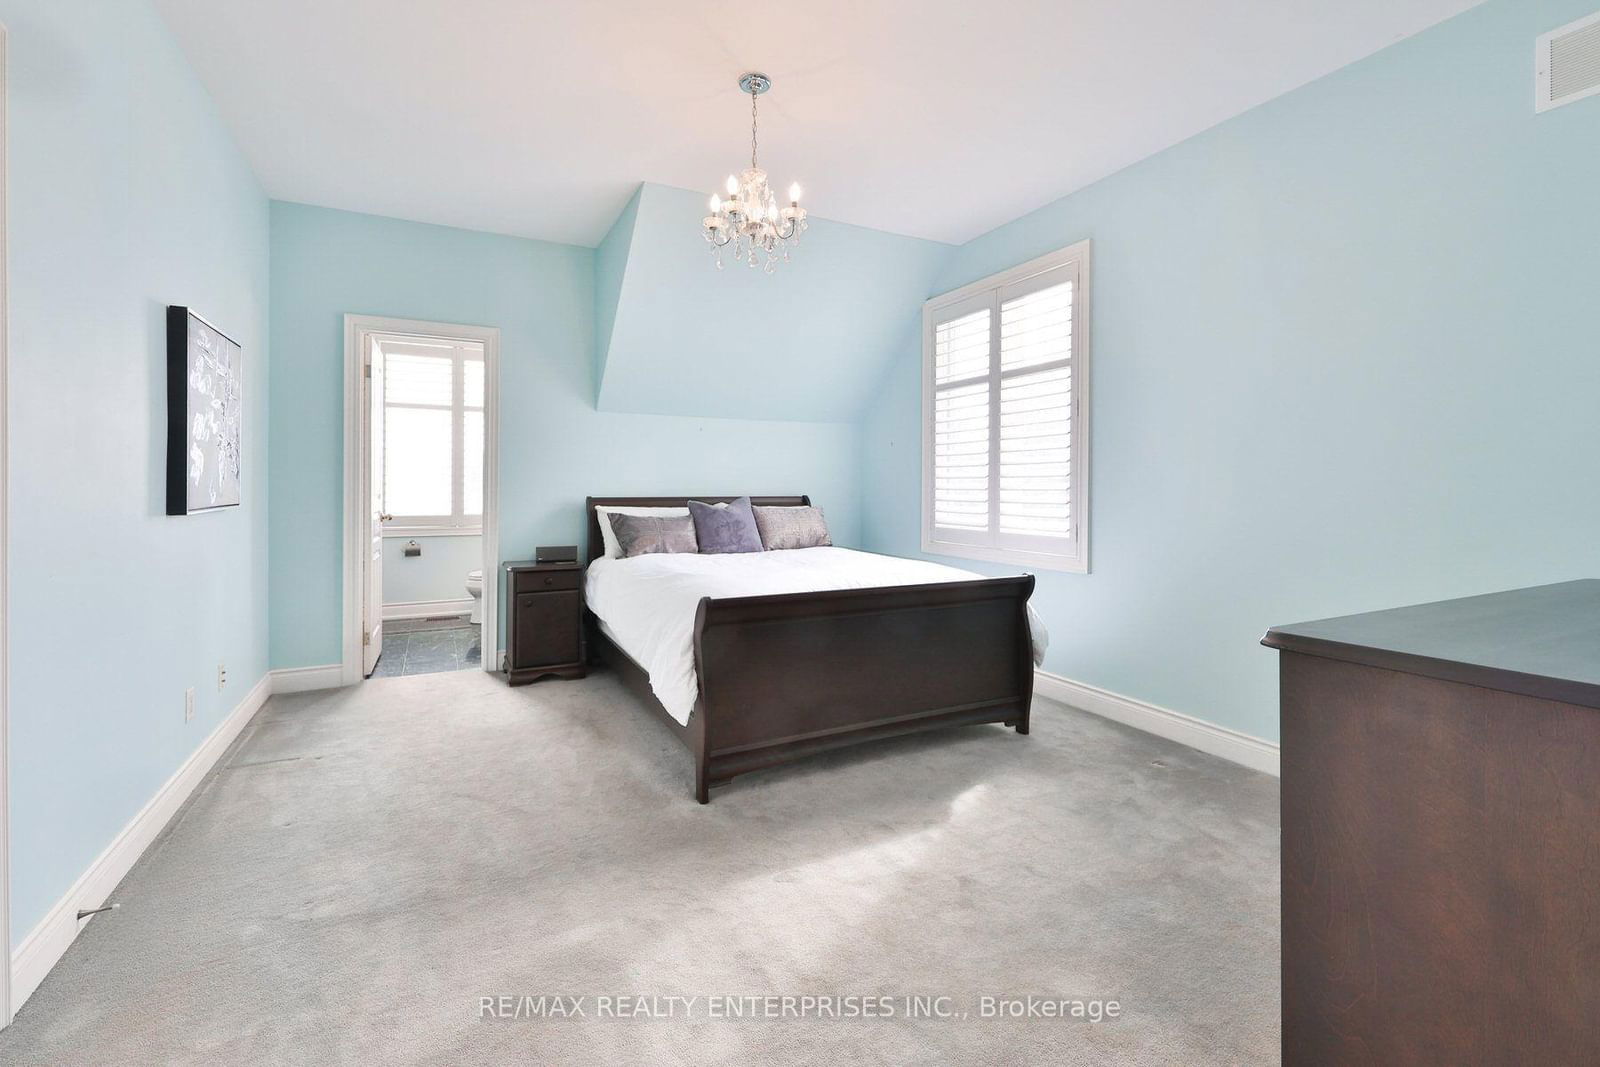
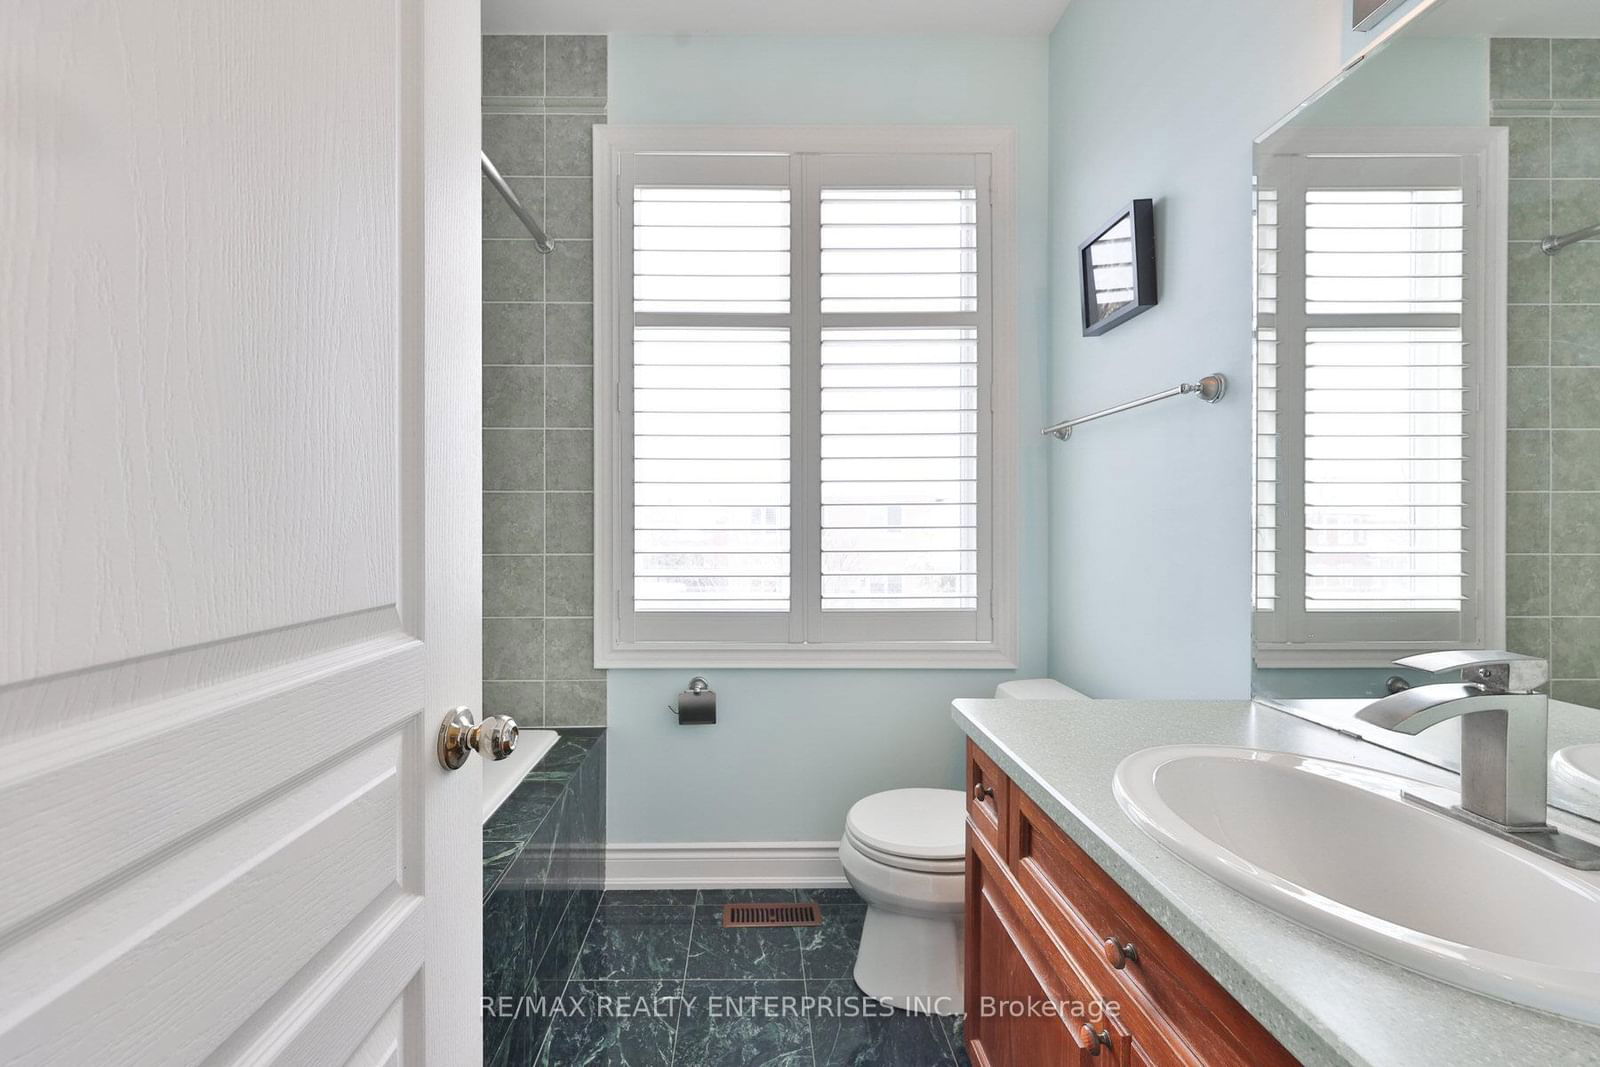
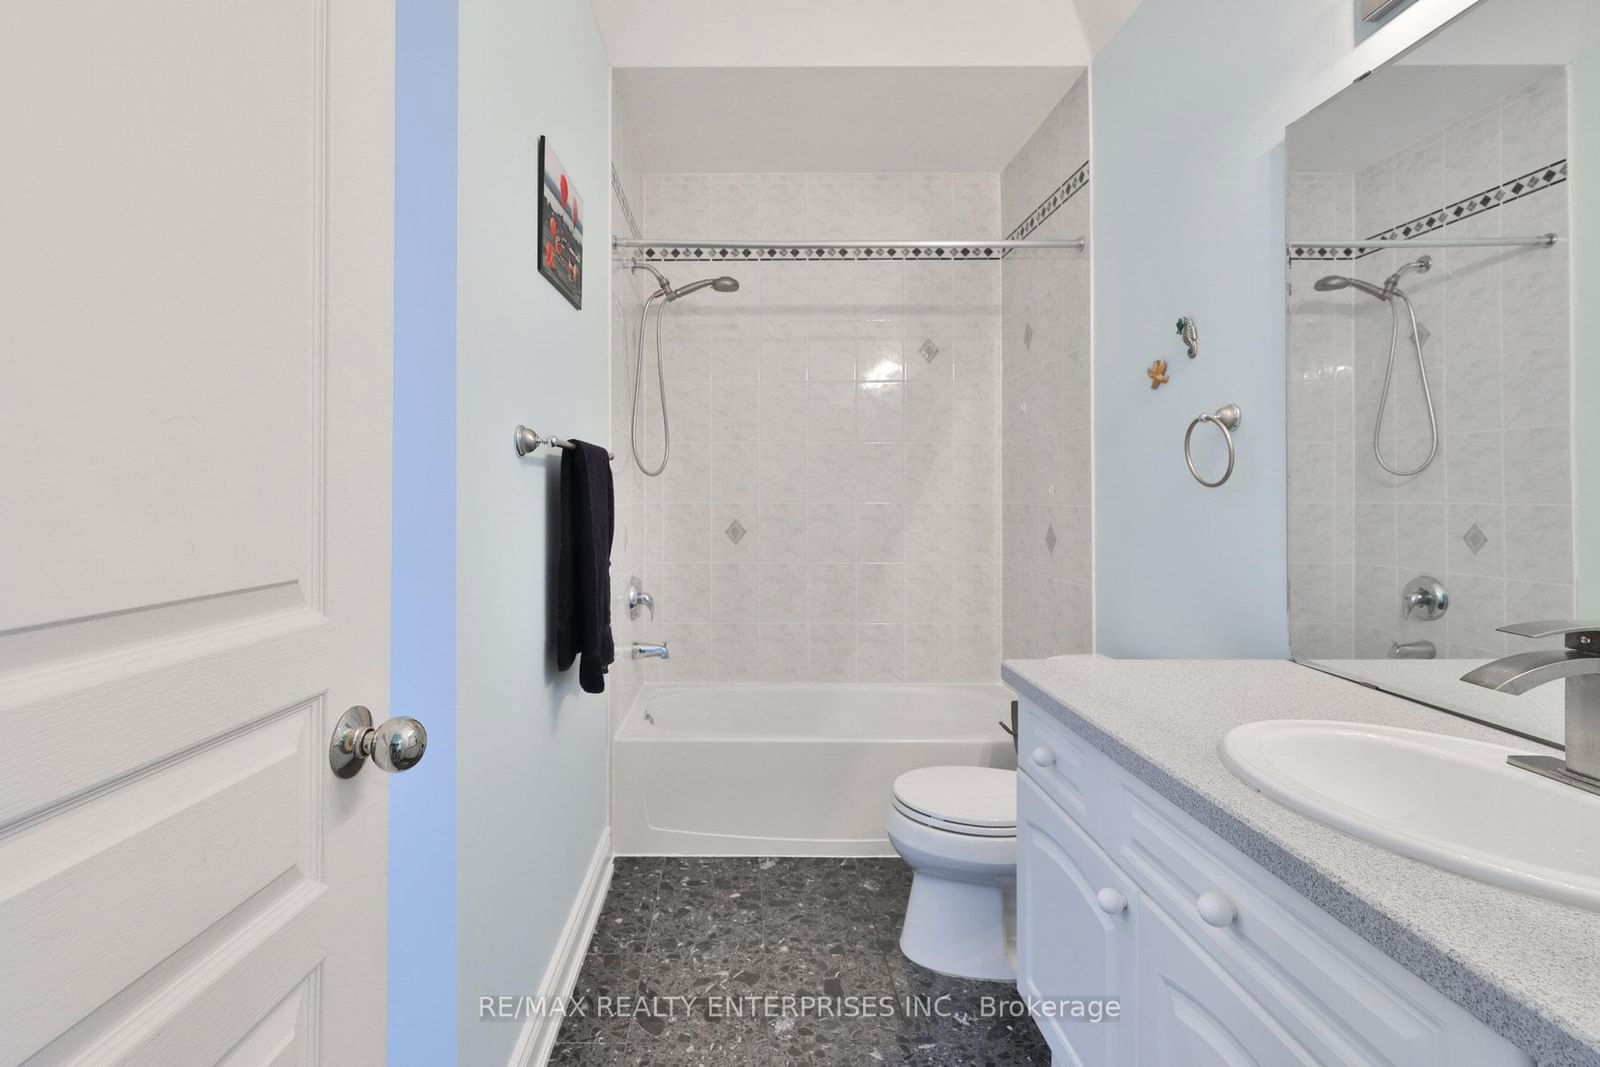
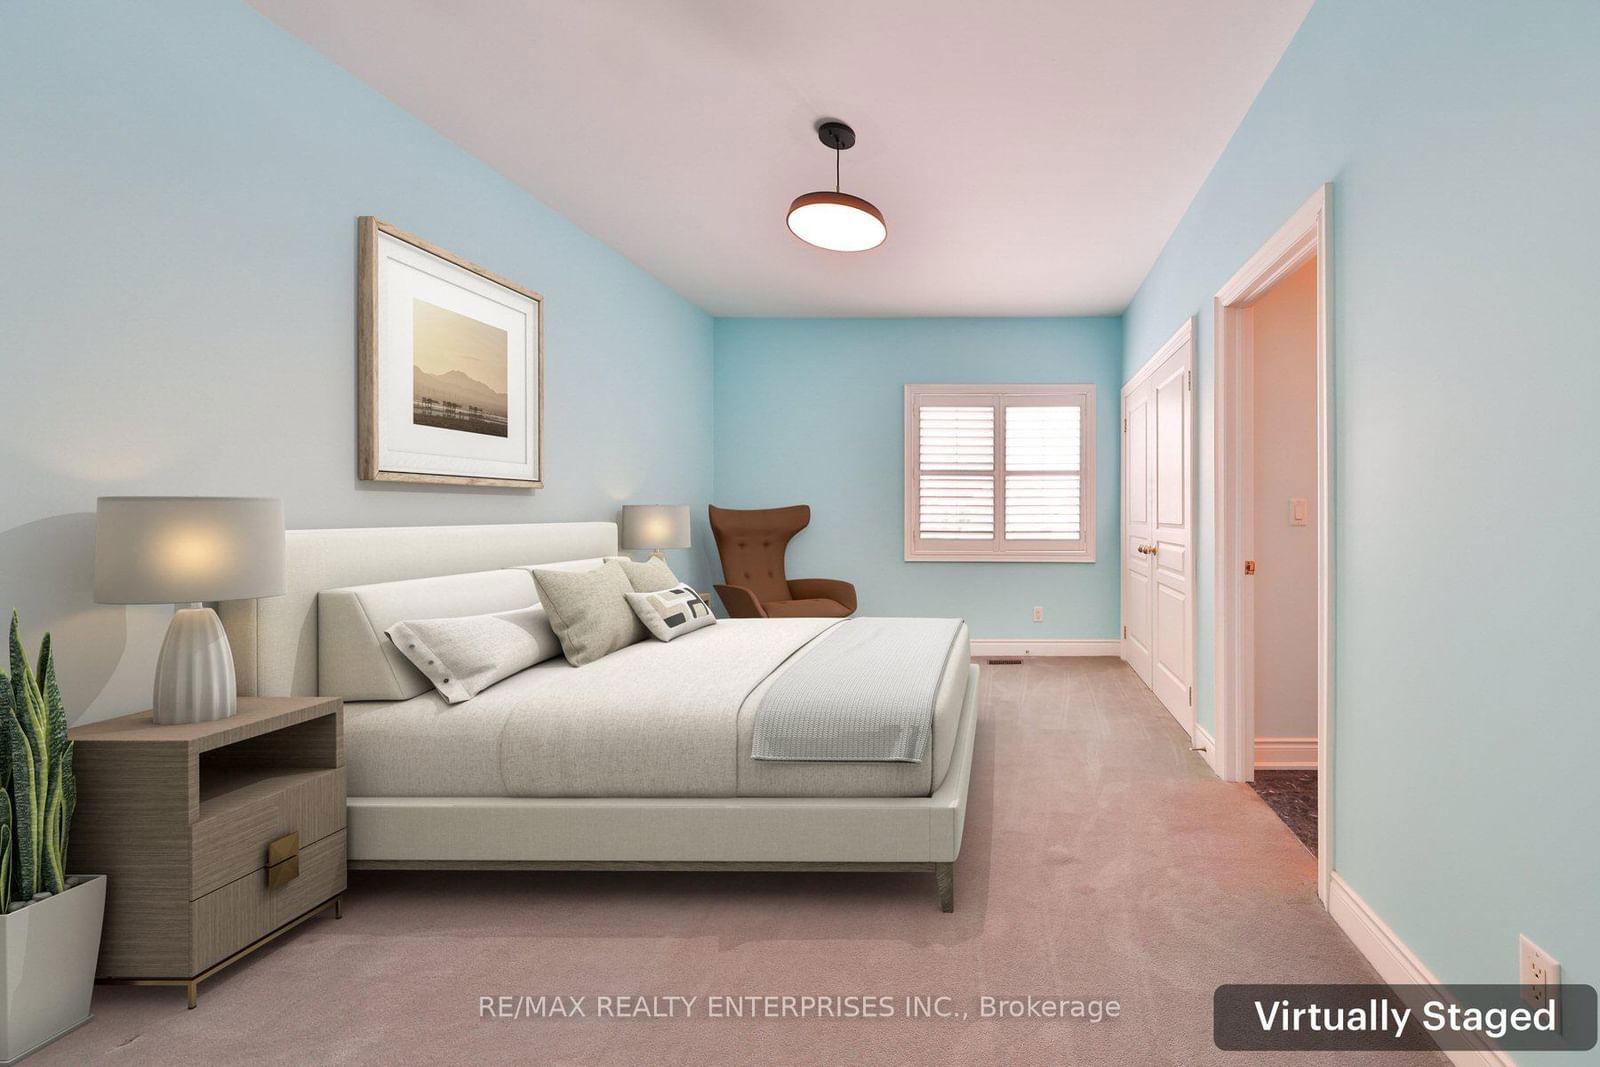
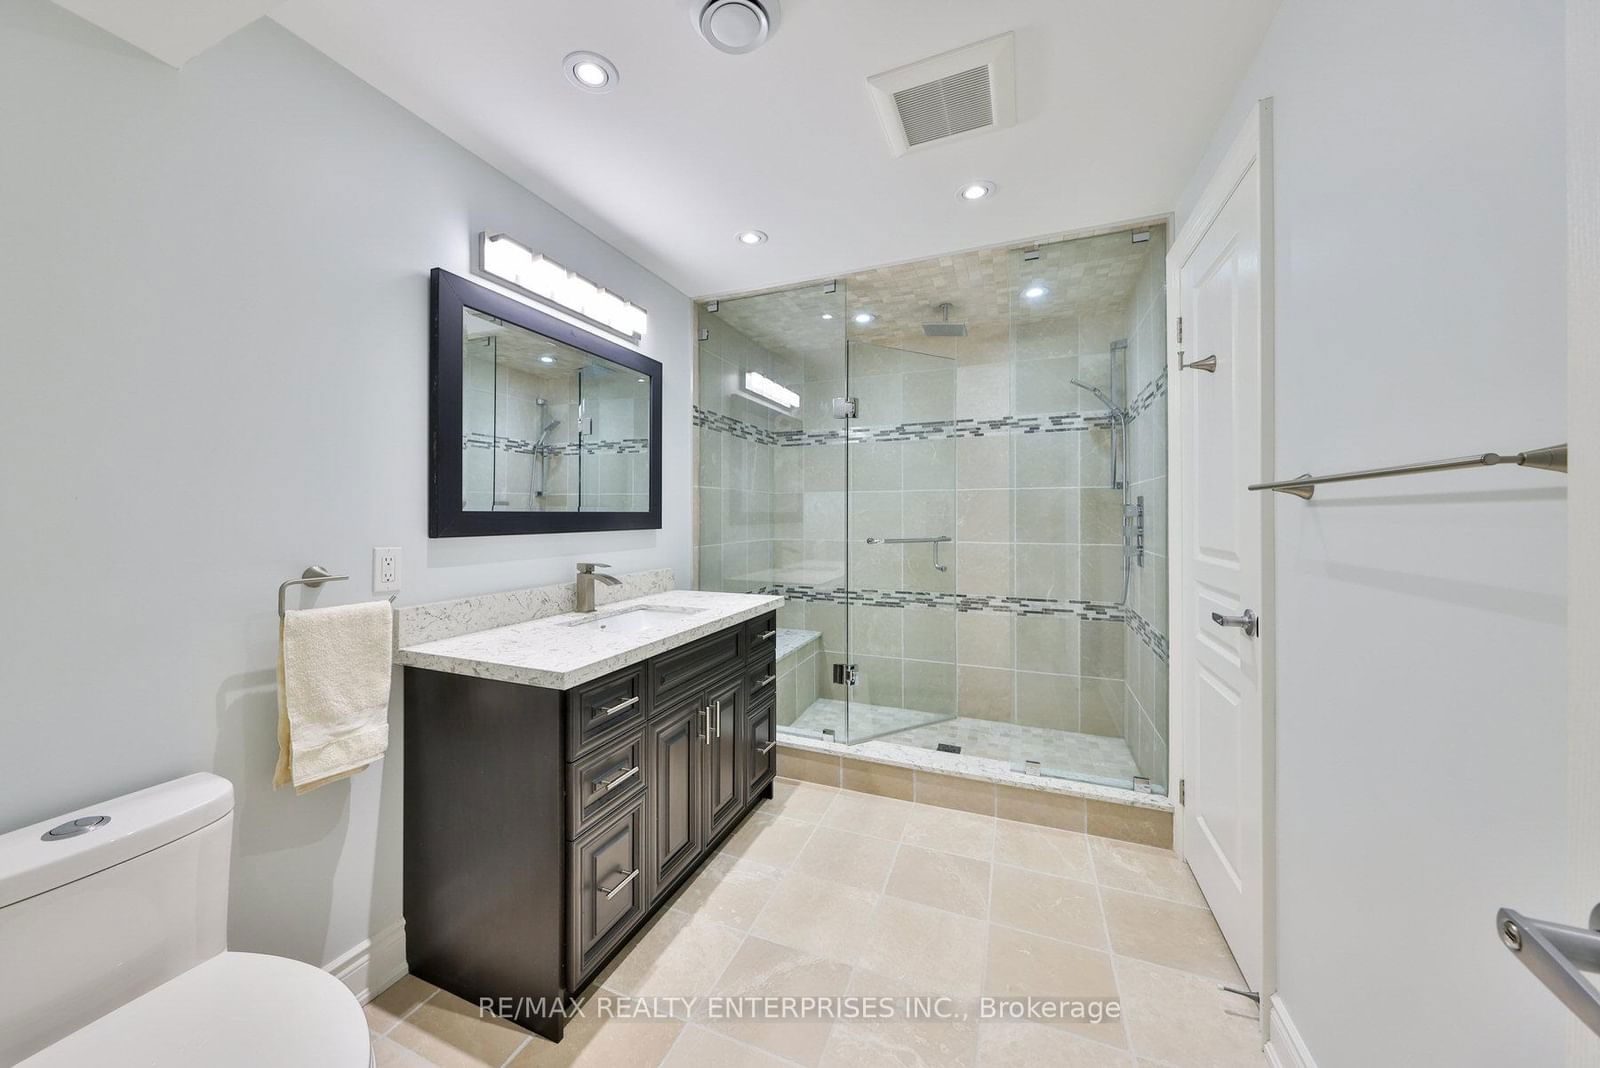
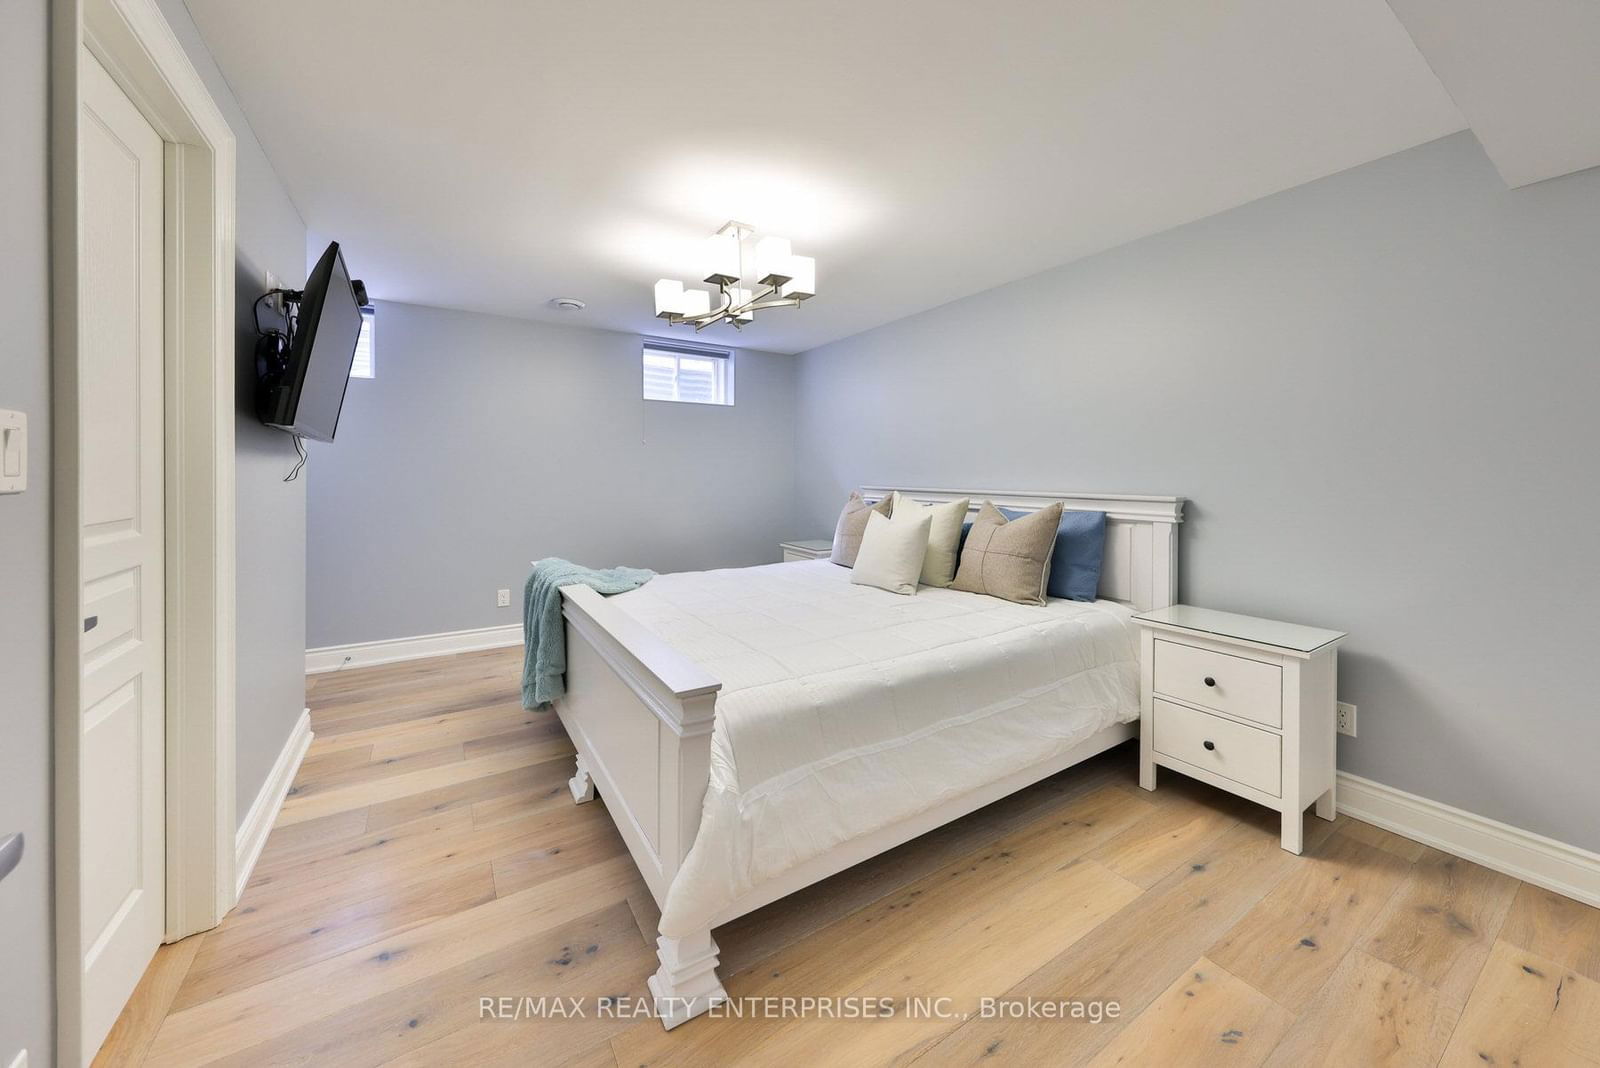
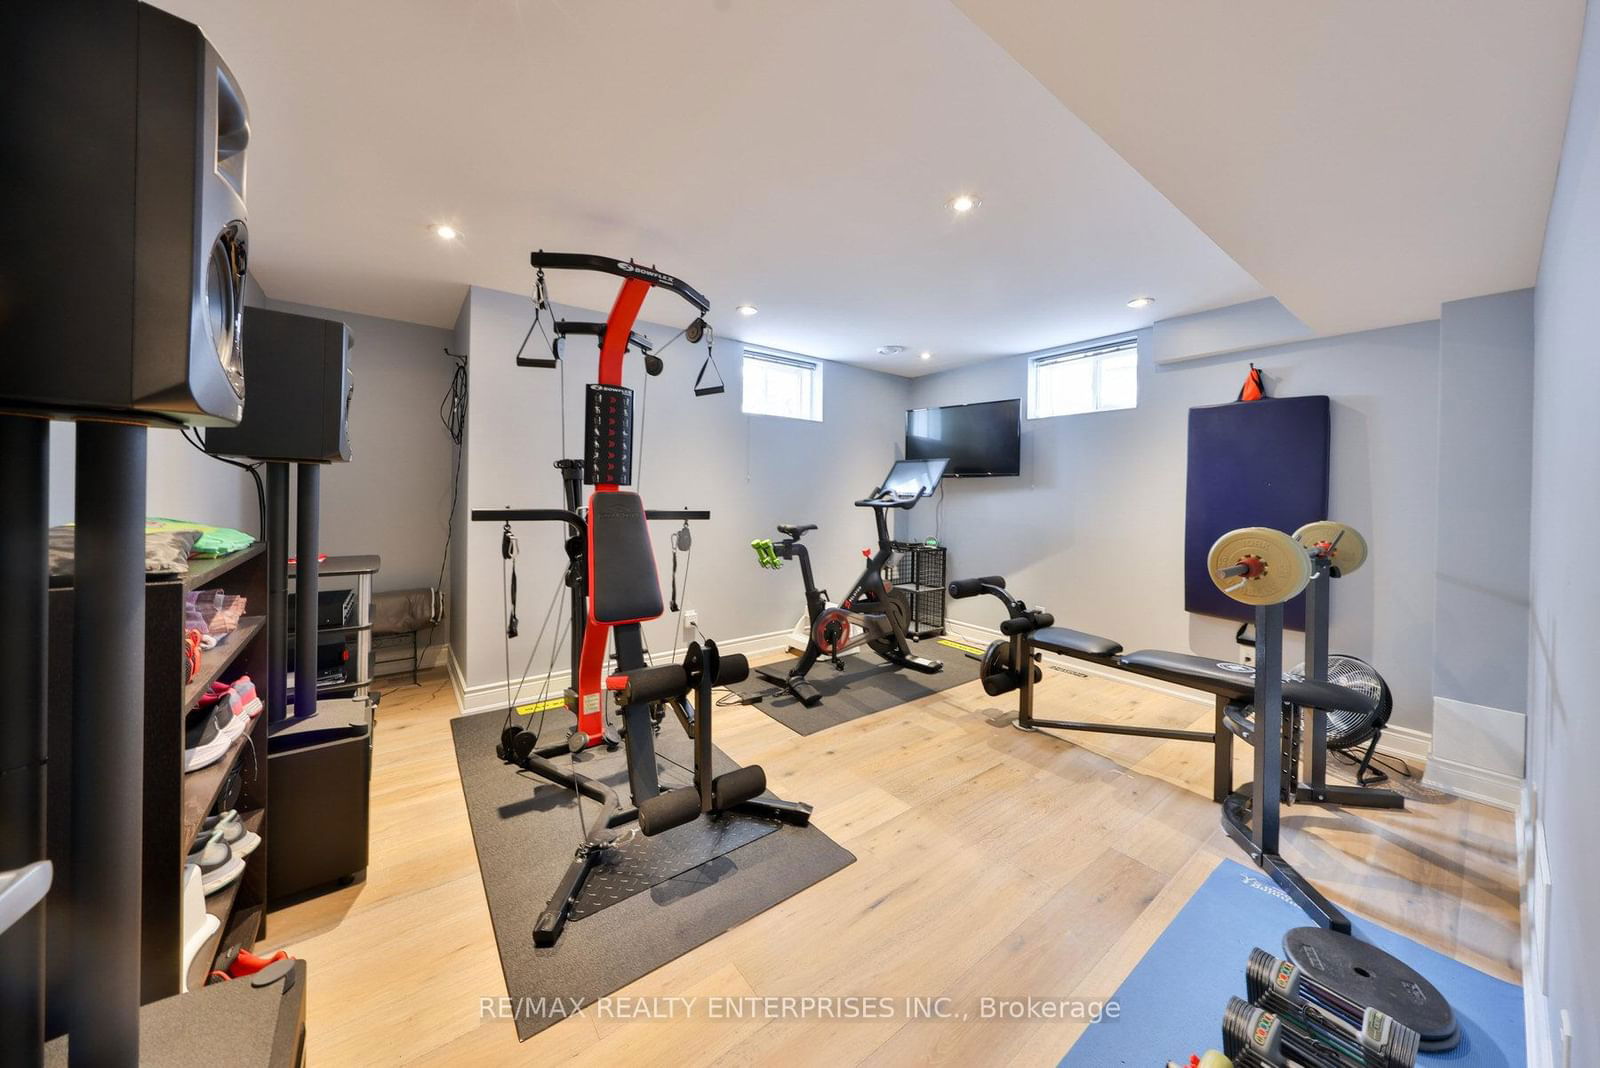
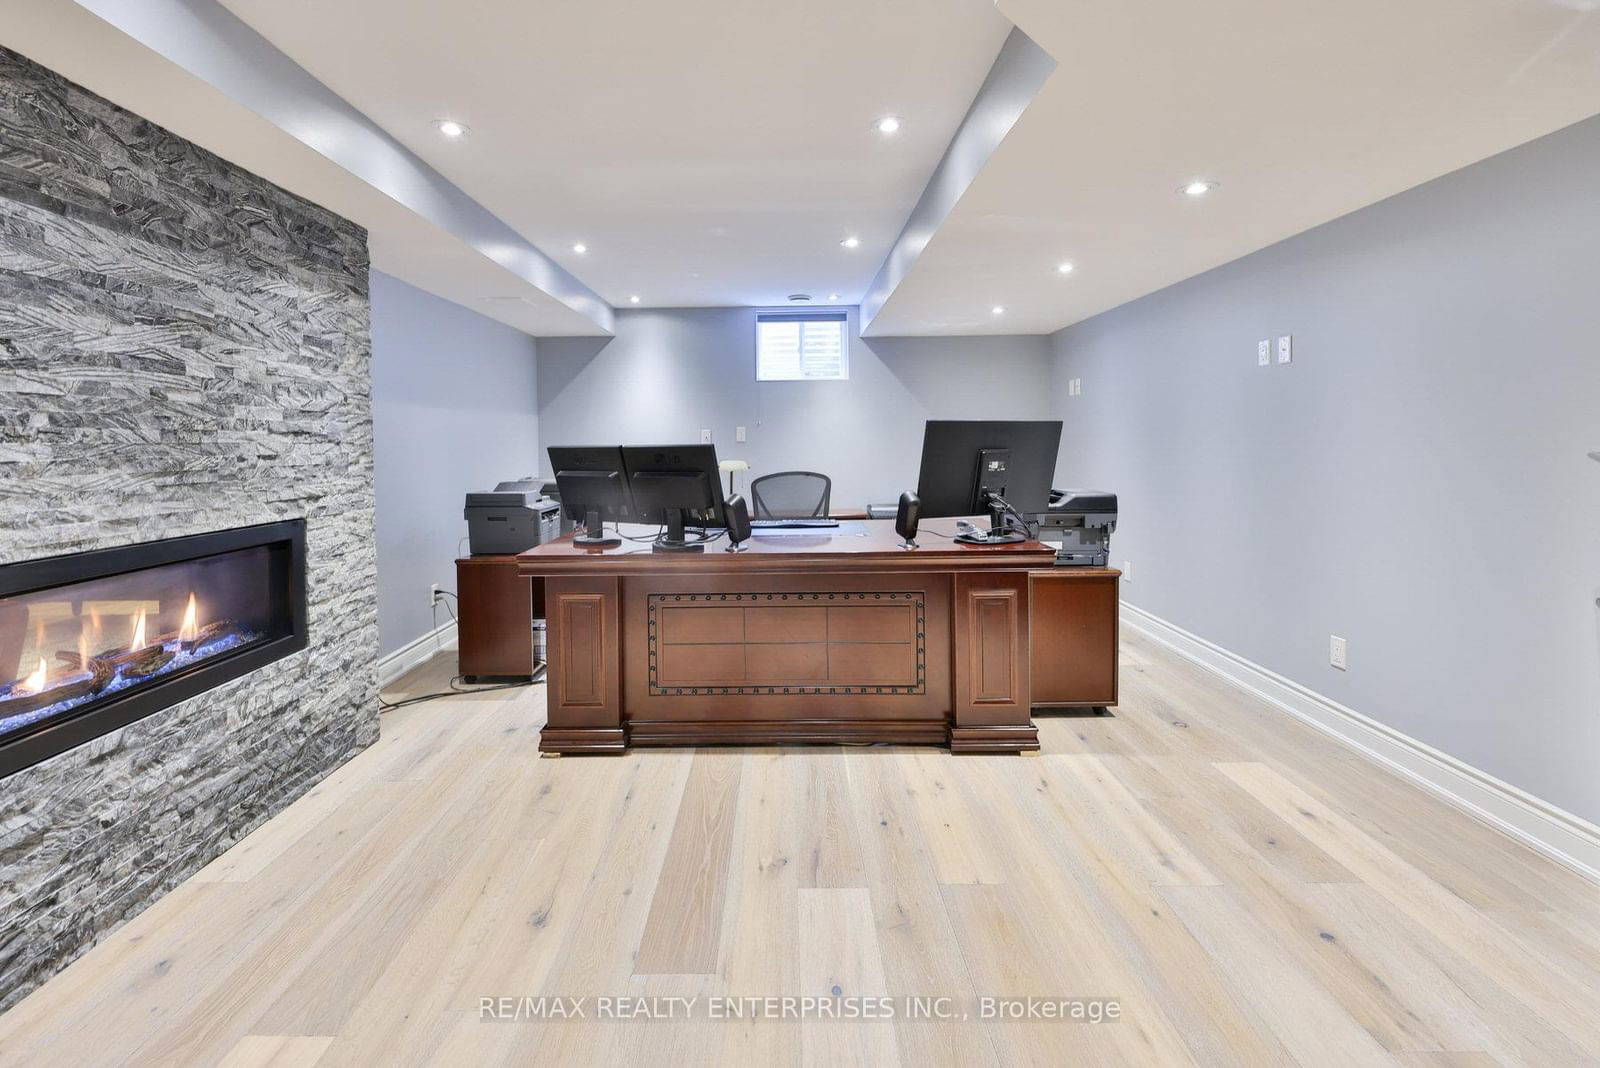
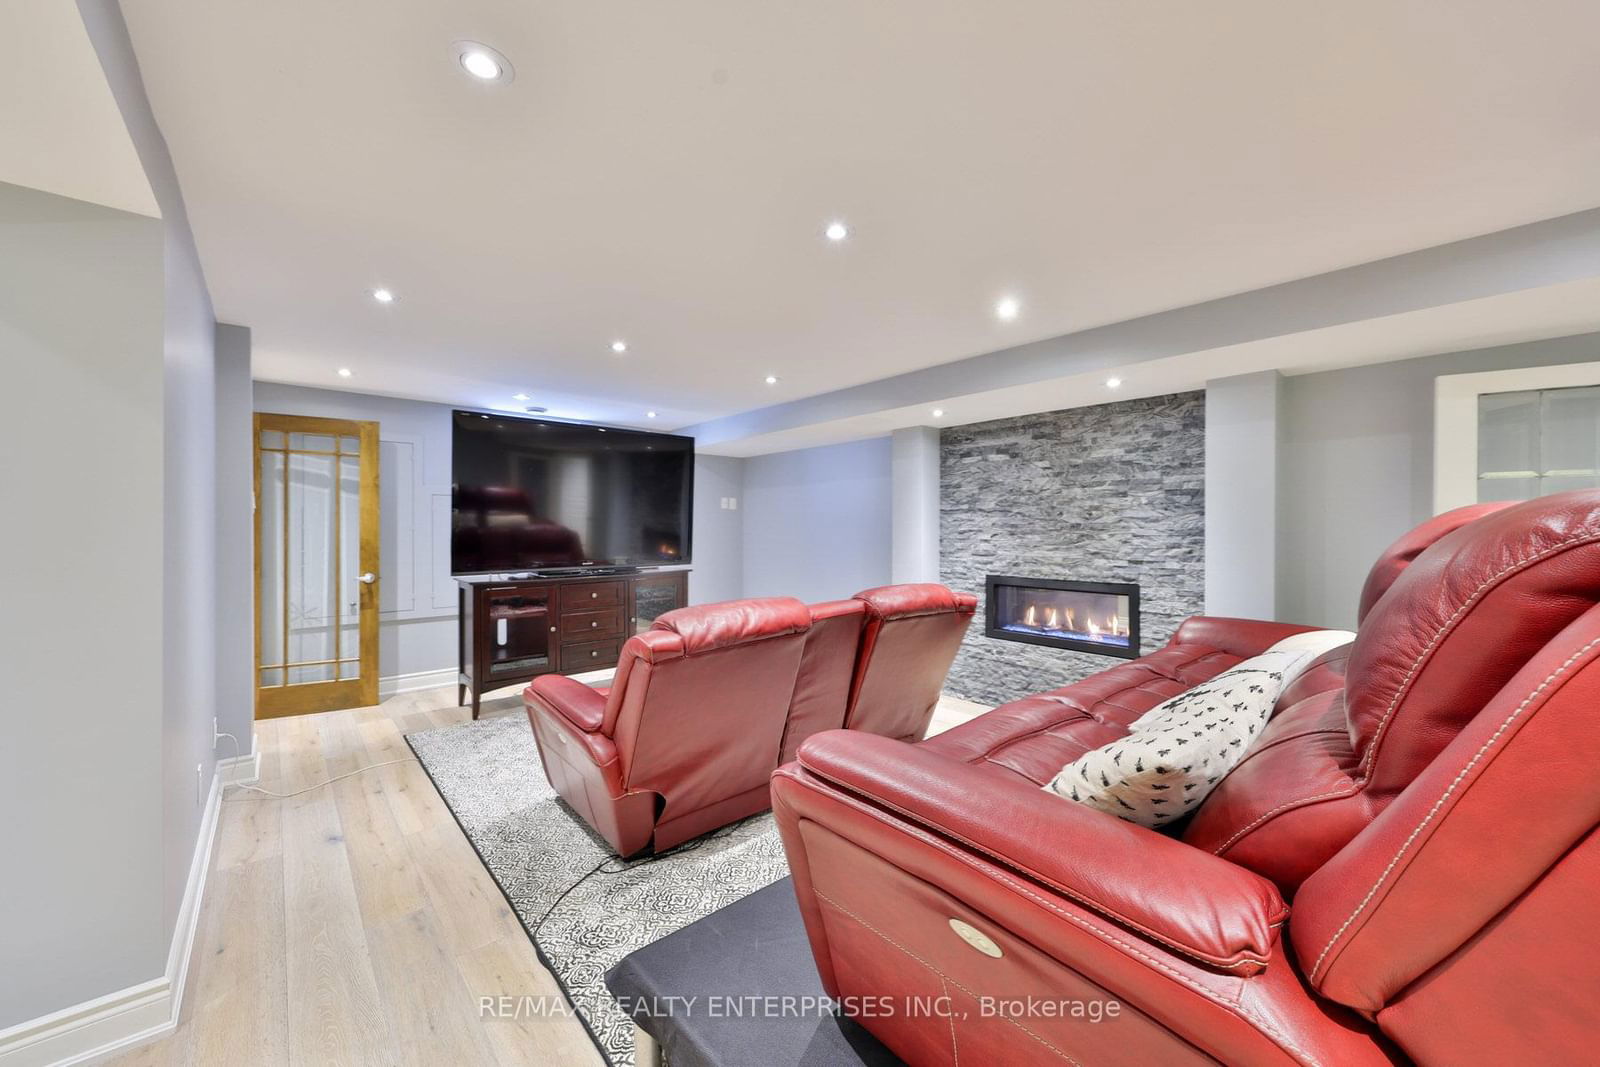
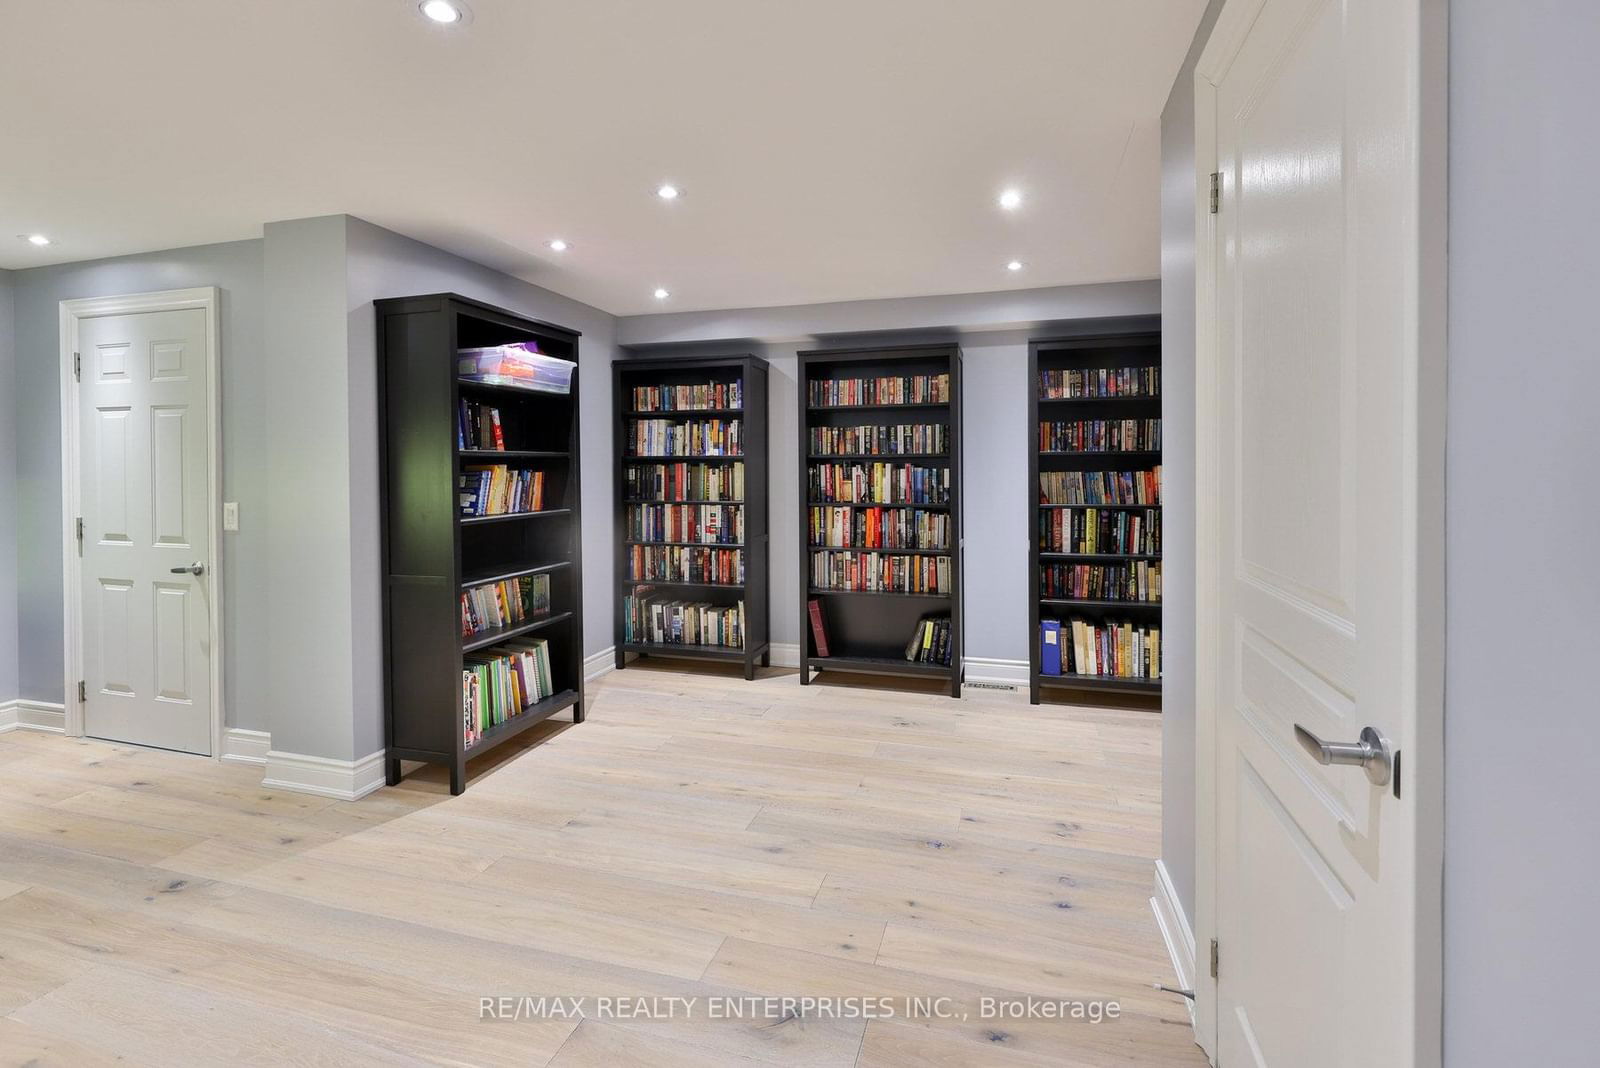
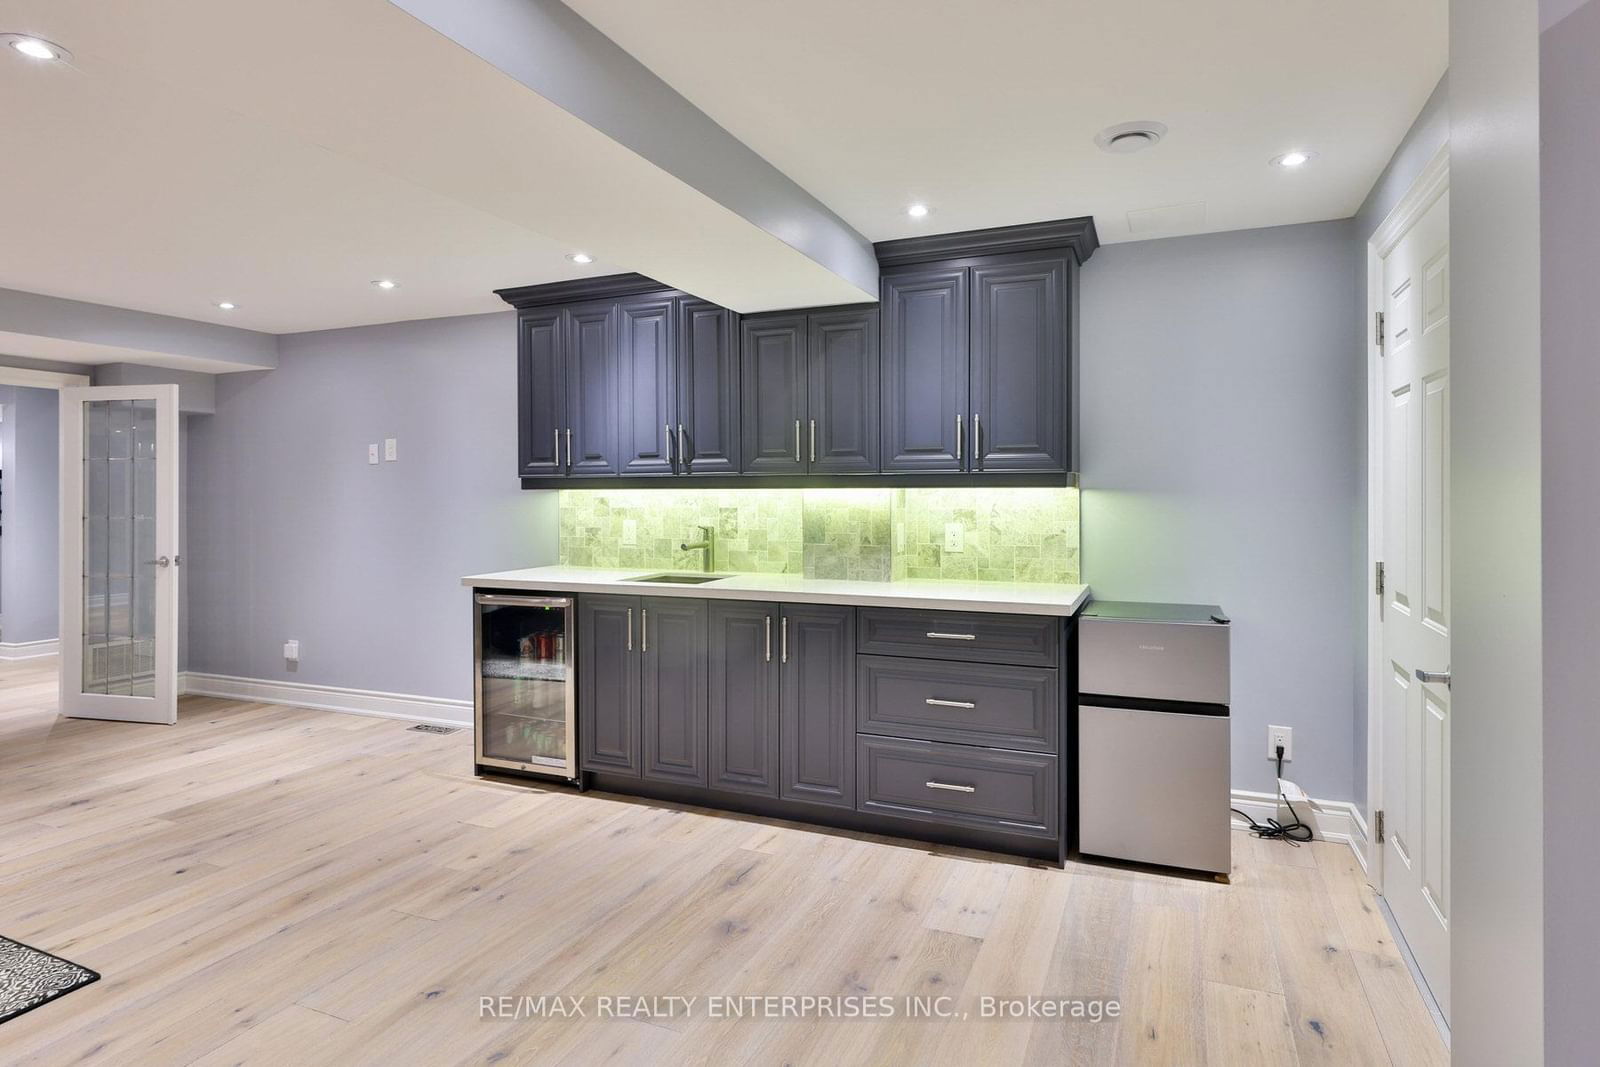
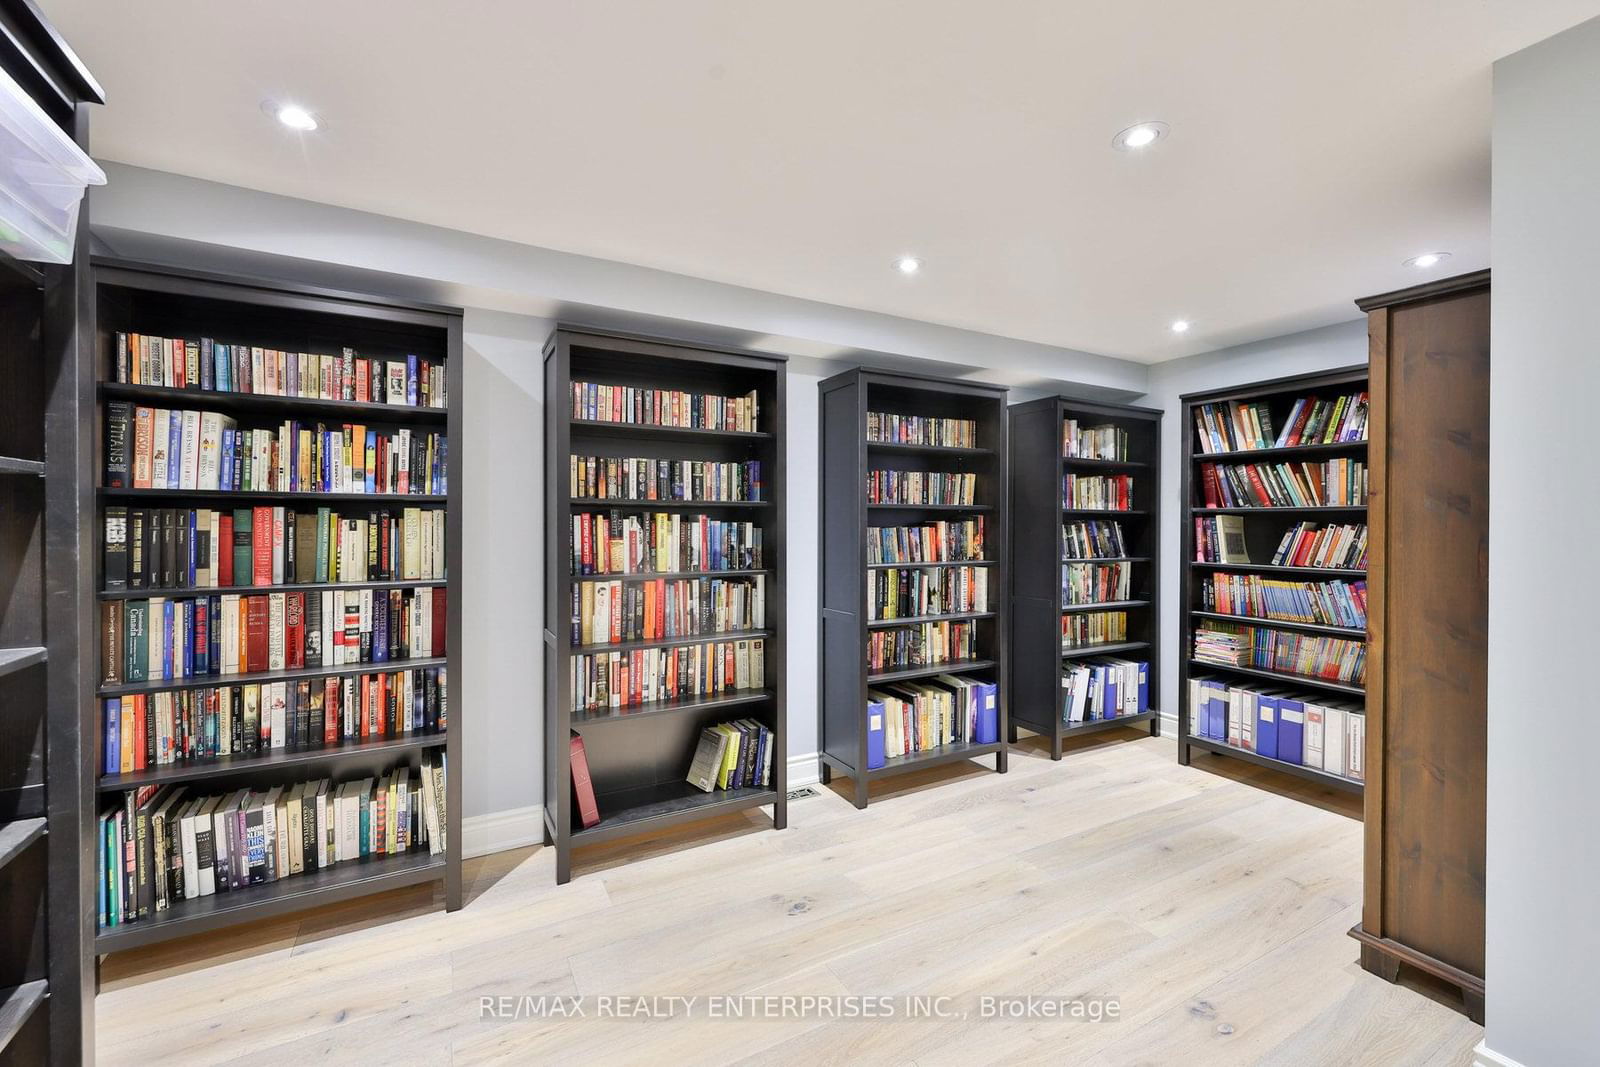
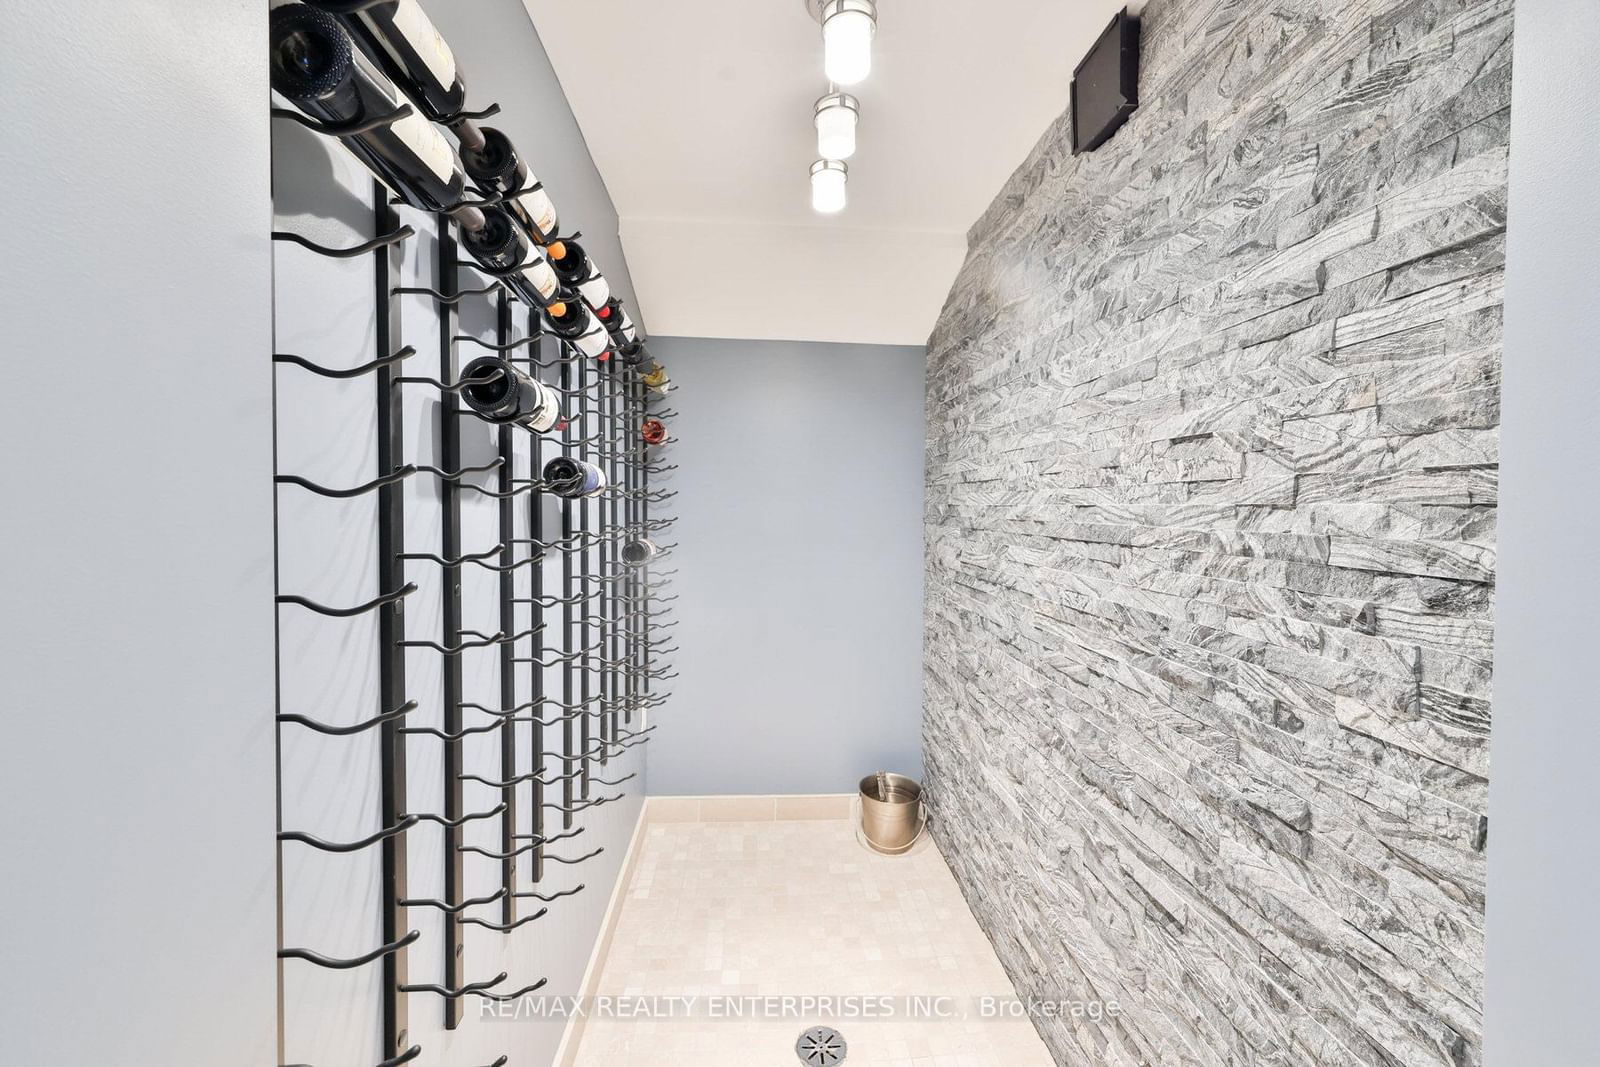
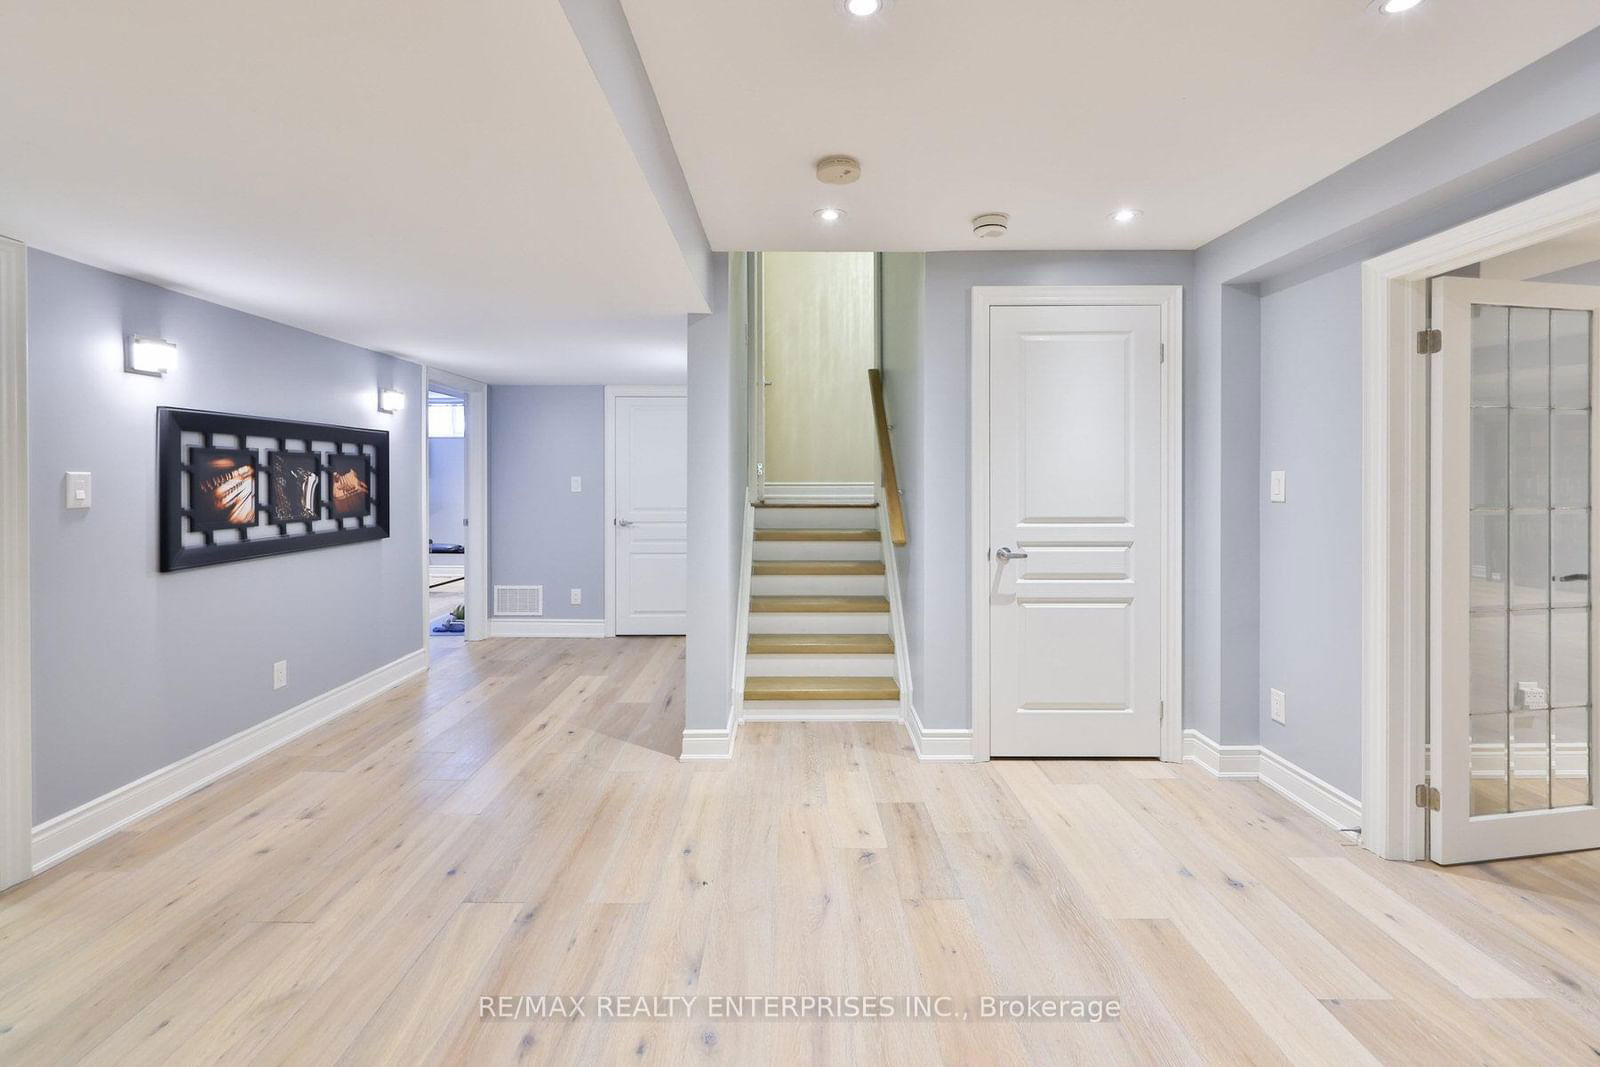
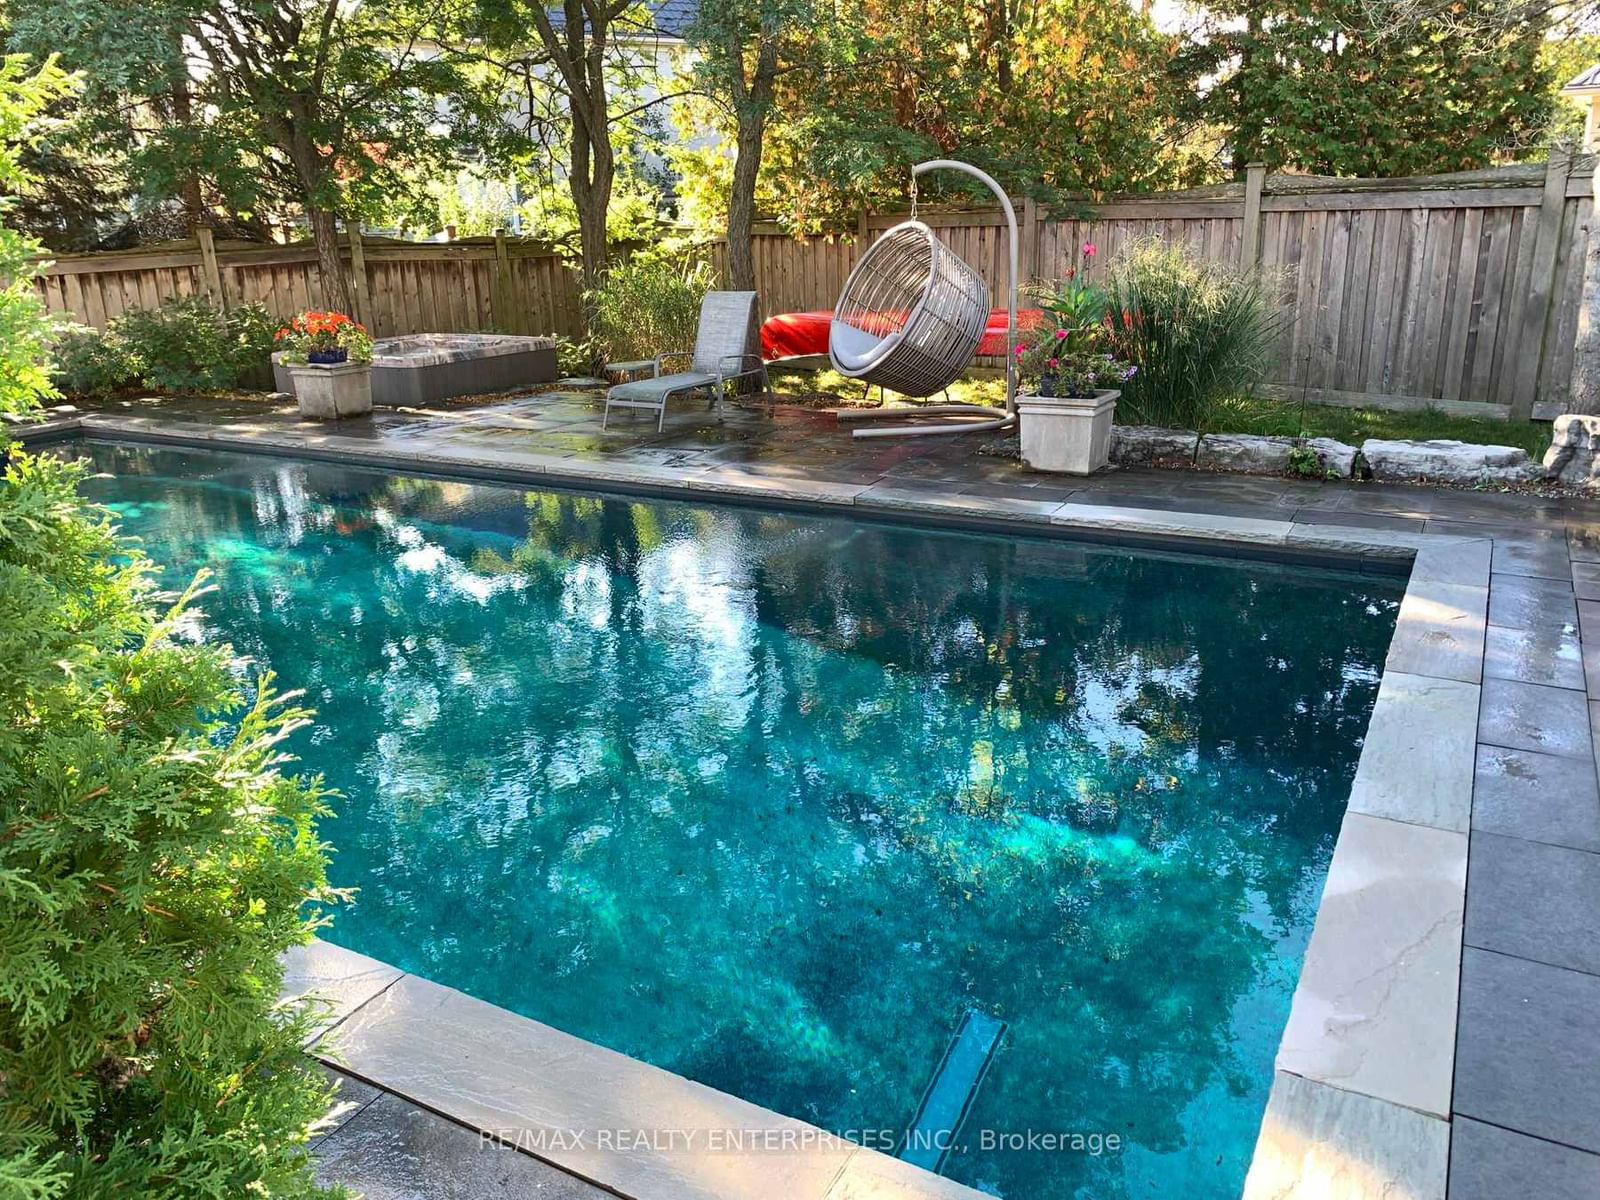
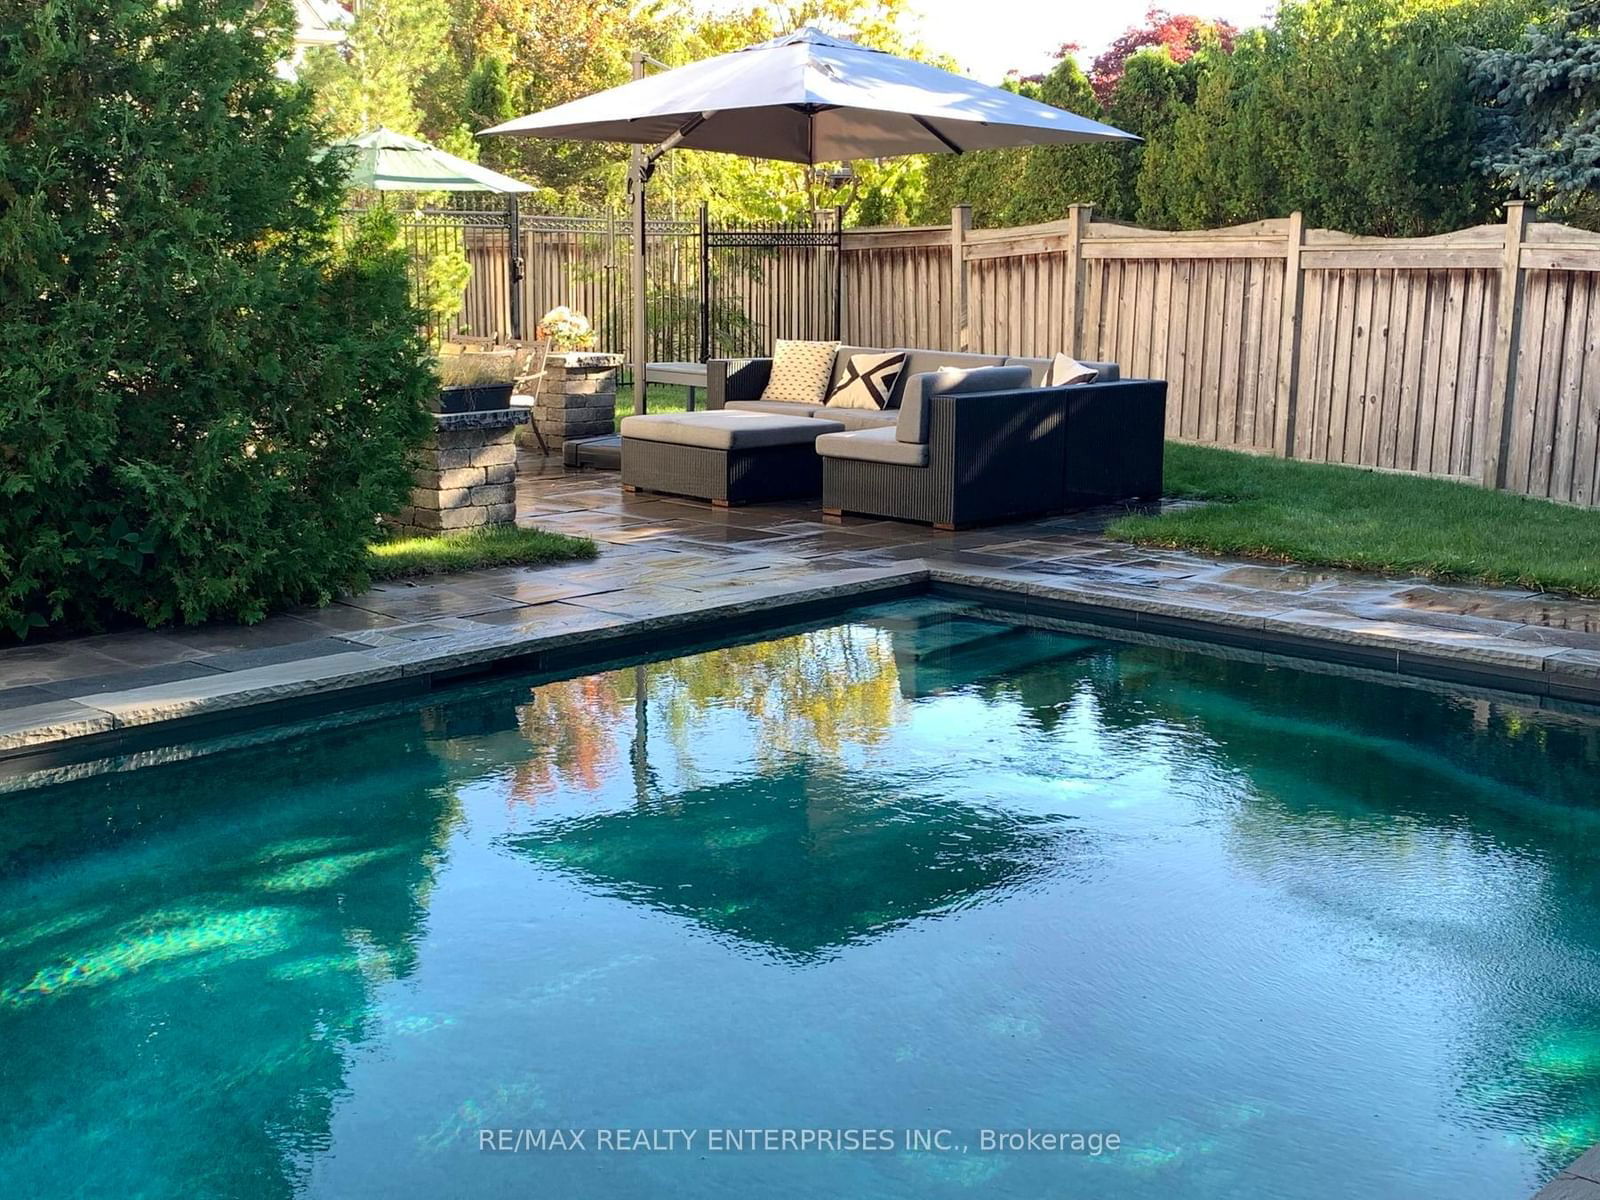
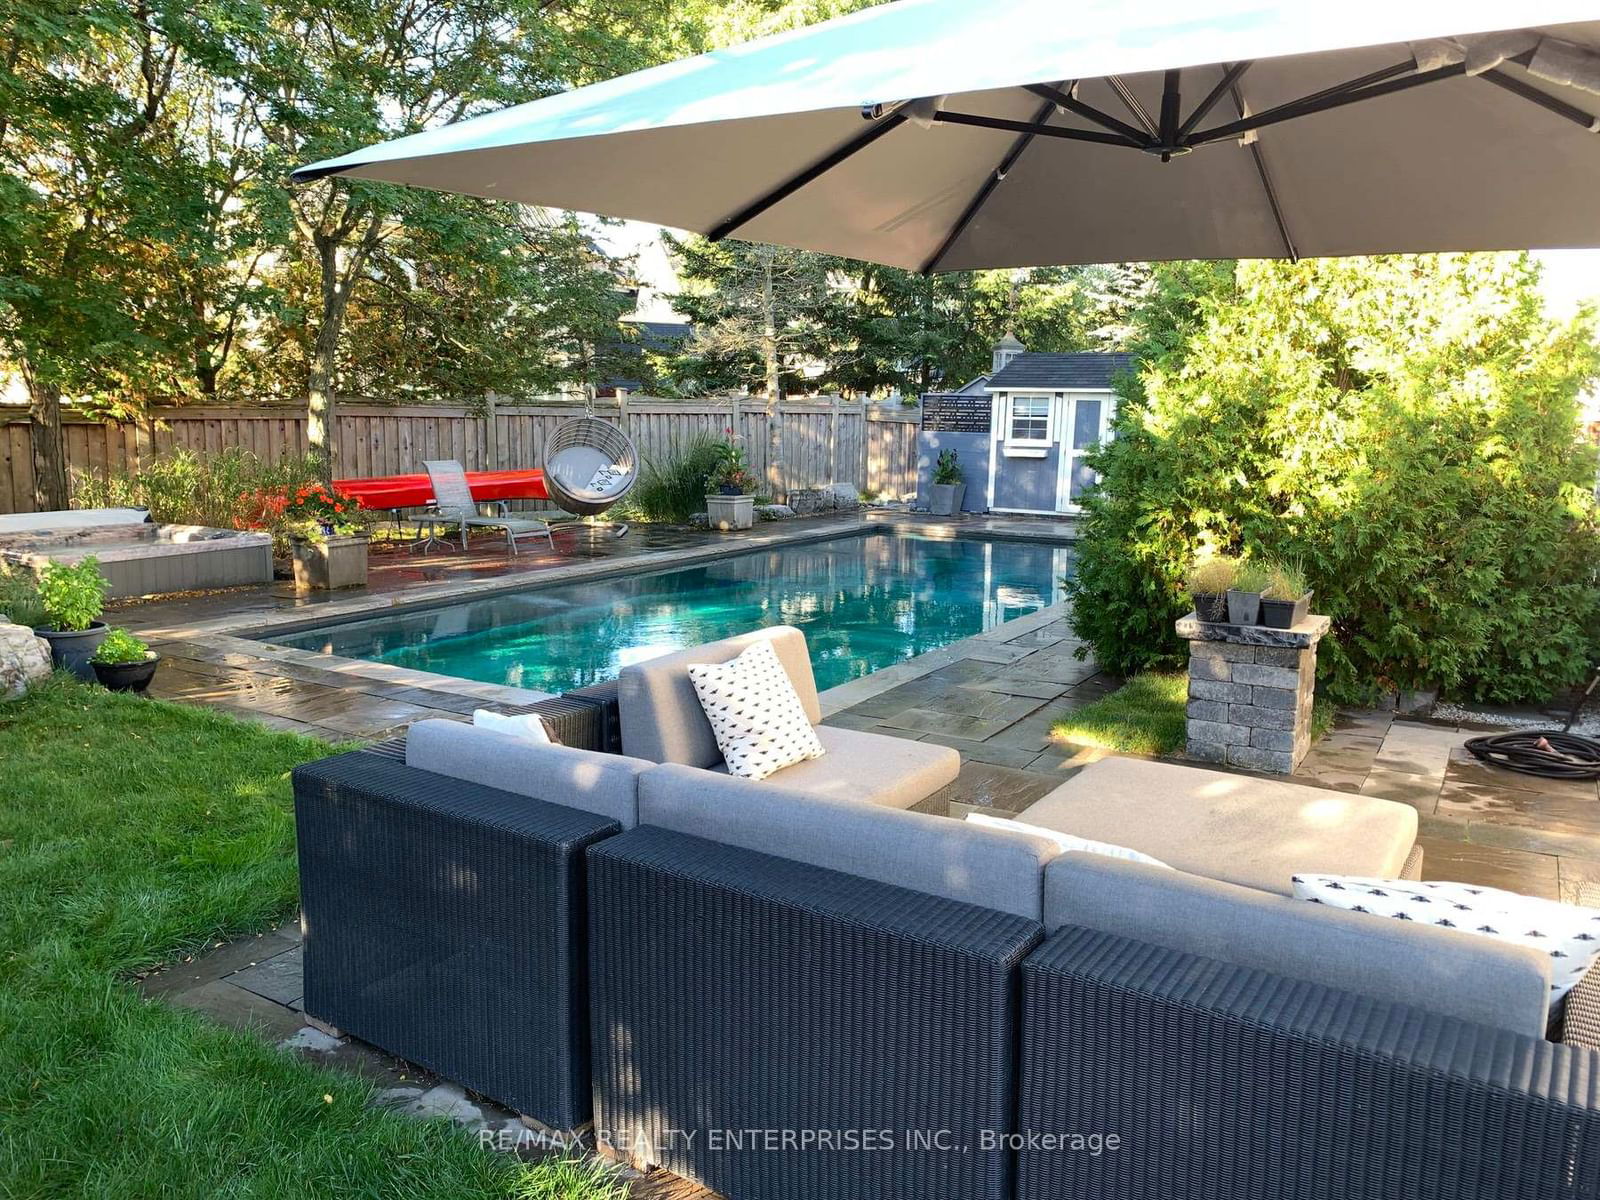
Nestled In The Heart Of The Coveted Watercolours Community, This Distinguished 4+1 Bedroom, 5-Bath Residence Offers An Unparalleled Blend Of Sophistication, Comfort And Functionality. Boasting Approx 5,955 Sqft Of Total Living Space, This Meticulously Crafted Home Sits On An Expansive 101.5 Ft X 139.4 Ft Lot, Enveloped By Lush Landscaping And Mature Trees, Creating A Serene Muskoka-Like Retreat In The City. Step Through The Grand Double-Door Entryway Into An Impressive Rotunda Foyer Adorned With A Sparkling Chandelier, Marble Tile Inlay, And Soaring Ceilings. The Formal Living And Dining Rooms Exude Timeless Charm, While The Spacious Family Room, Anchored By A Two-Sided Gas Fireplace, Offers Warmth And Comfort. The Chef's Kitchen Is A Culinary Dream, Featuring Built-In Stainless-Steel Appliances, A Two-Tier Island, And A Walkout To The Backyard. A Private Office, Powder Room And Garage Access Complete This Impeccably Designed Level. The Upper Level Hosts An Opulent Primary Suite Featuring A 6-Piece Spa-Like Ensuite, Walk-In Closet, And Garden Views, While 3 Additional Bedrooms Offer Ensuite Or Jack-And-Jill Access. The Fully Finished Lower Level Is An Entertainers Paradise With A Custom Wet Bar, Recreation Room, Two-Sided Fireplace, Home Office, Gym, Wine Cellar, And A Private Nanny/In-Law Suite. Outdoor Living Is Redefined With A Heated Gibsan Concrete Pool, Hot Tub, Cabana, Stone Patio, And Multiple Seating Areas, All Set Against A Tranquil, Tree-Lined Backdrop. Located Near Top-Rated Schools, Mississauga Golf Club, Parks, Hospitals, And The QEW, This Exceptional Home Presents An Opportunity To Live In One Of Mississaugas Most Exclusive Neighbourhoods.
Foyer
Living
Dining
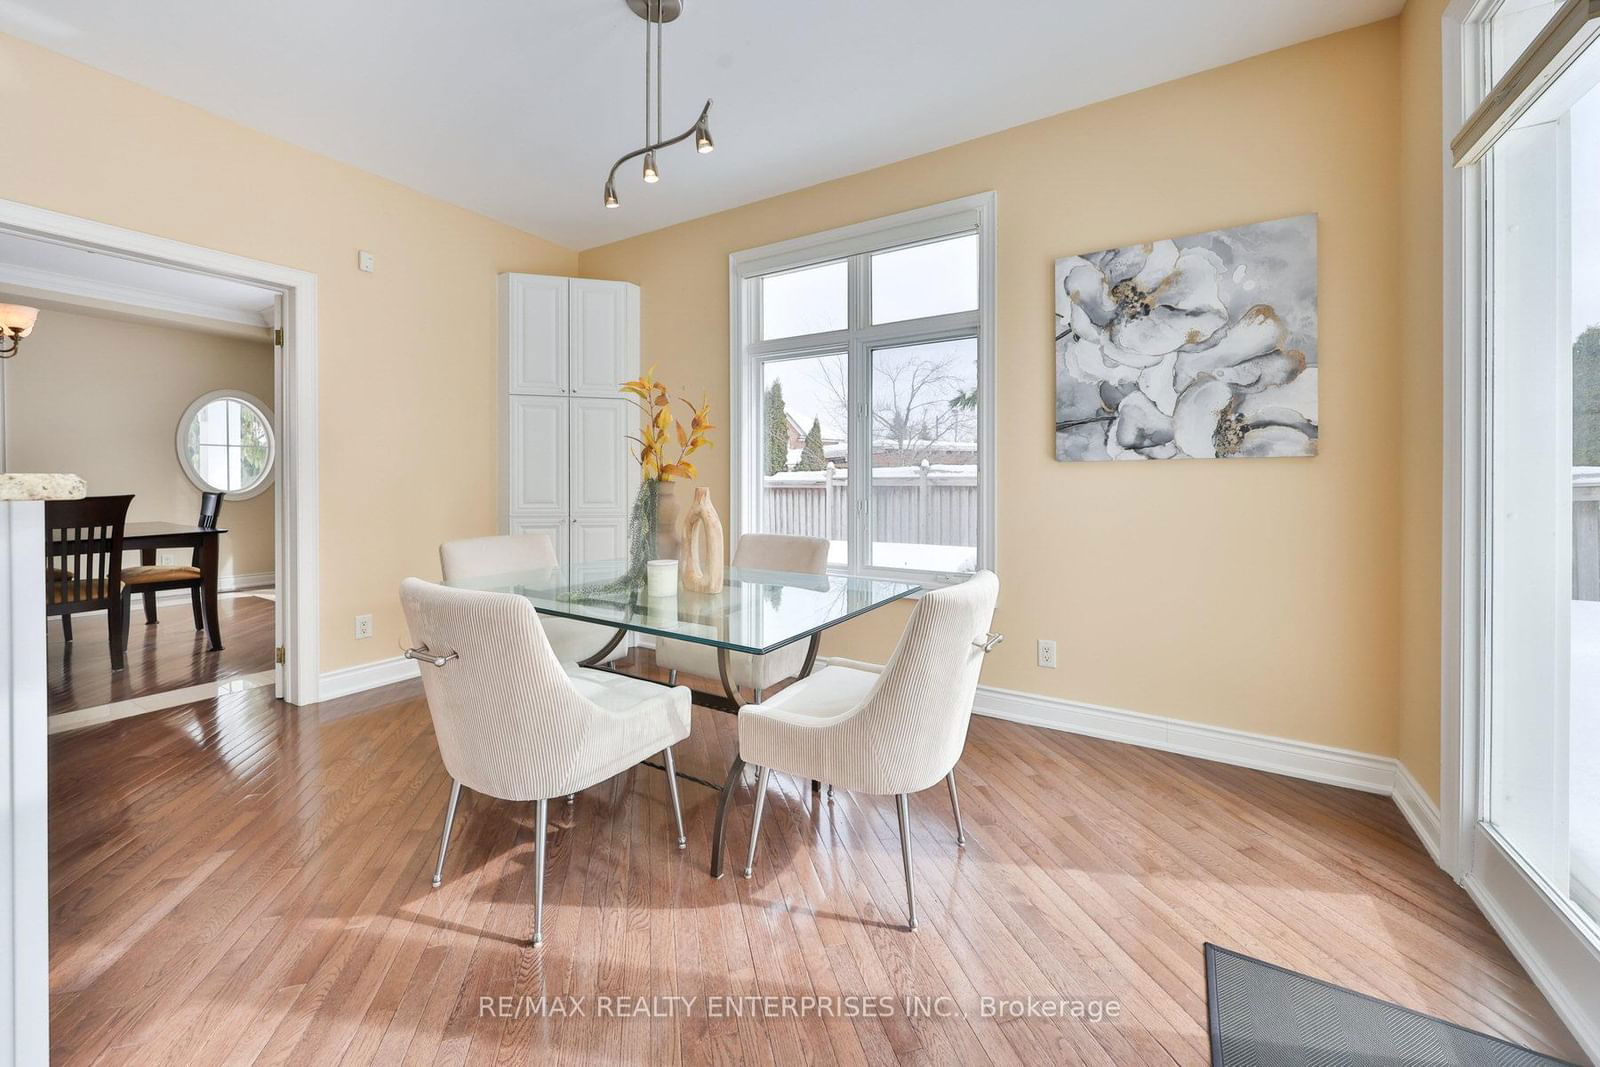
Breakfast
Kitchen
Family
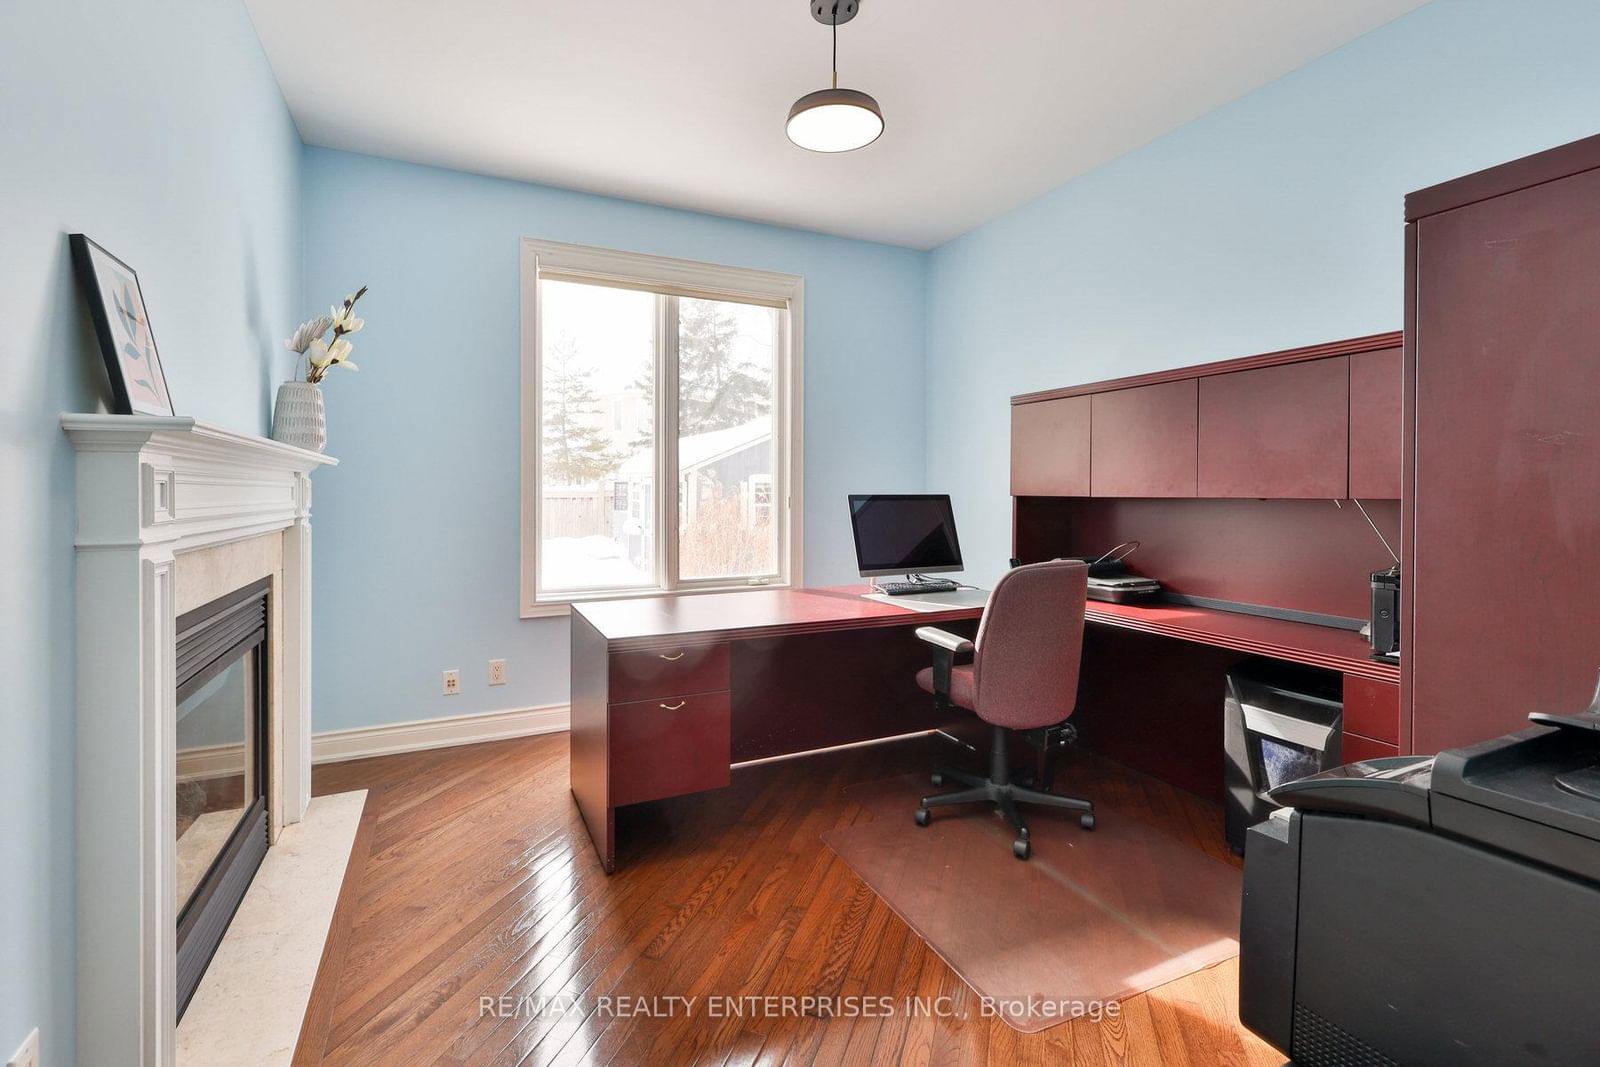
Office
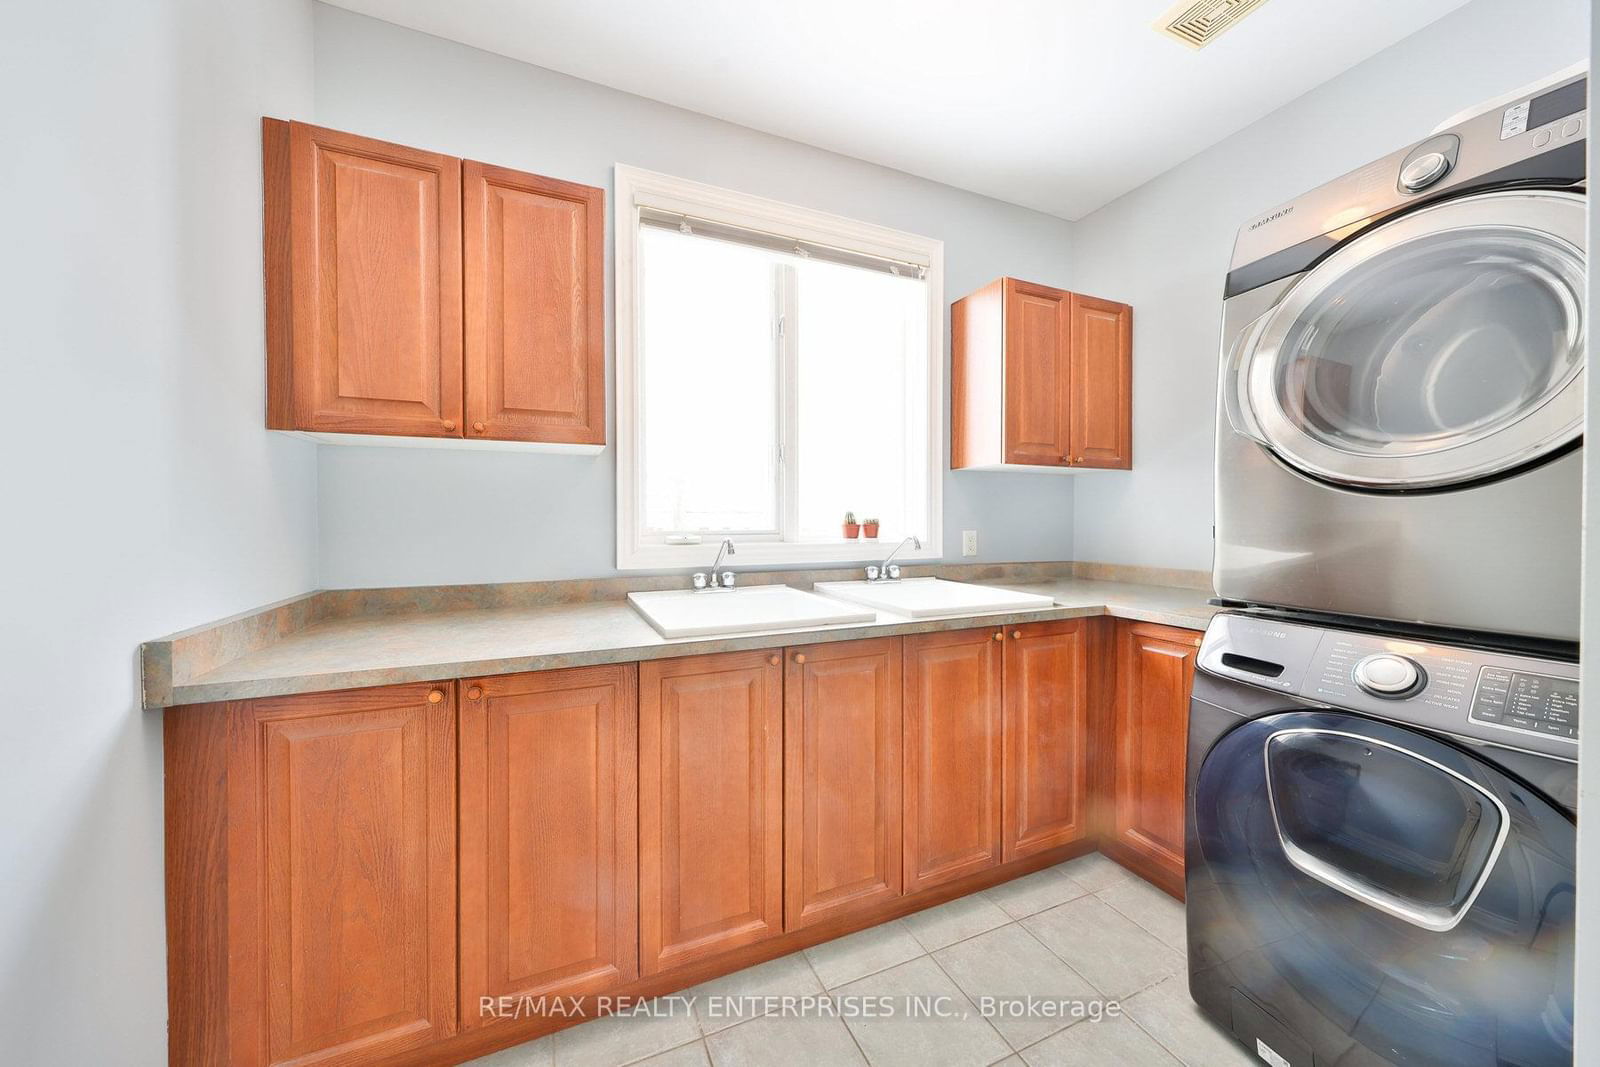
Laundry
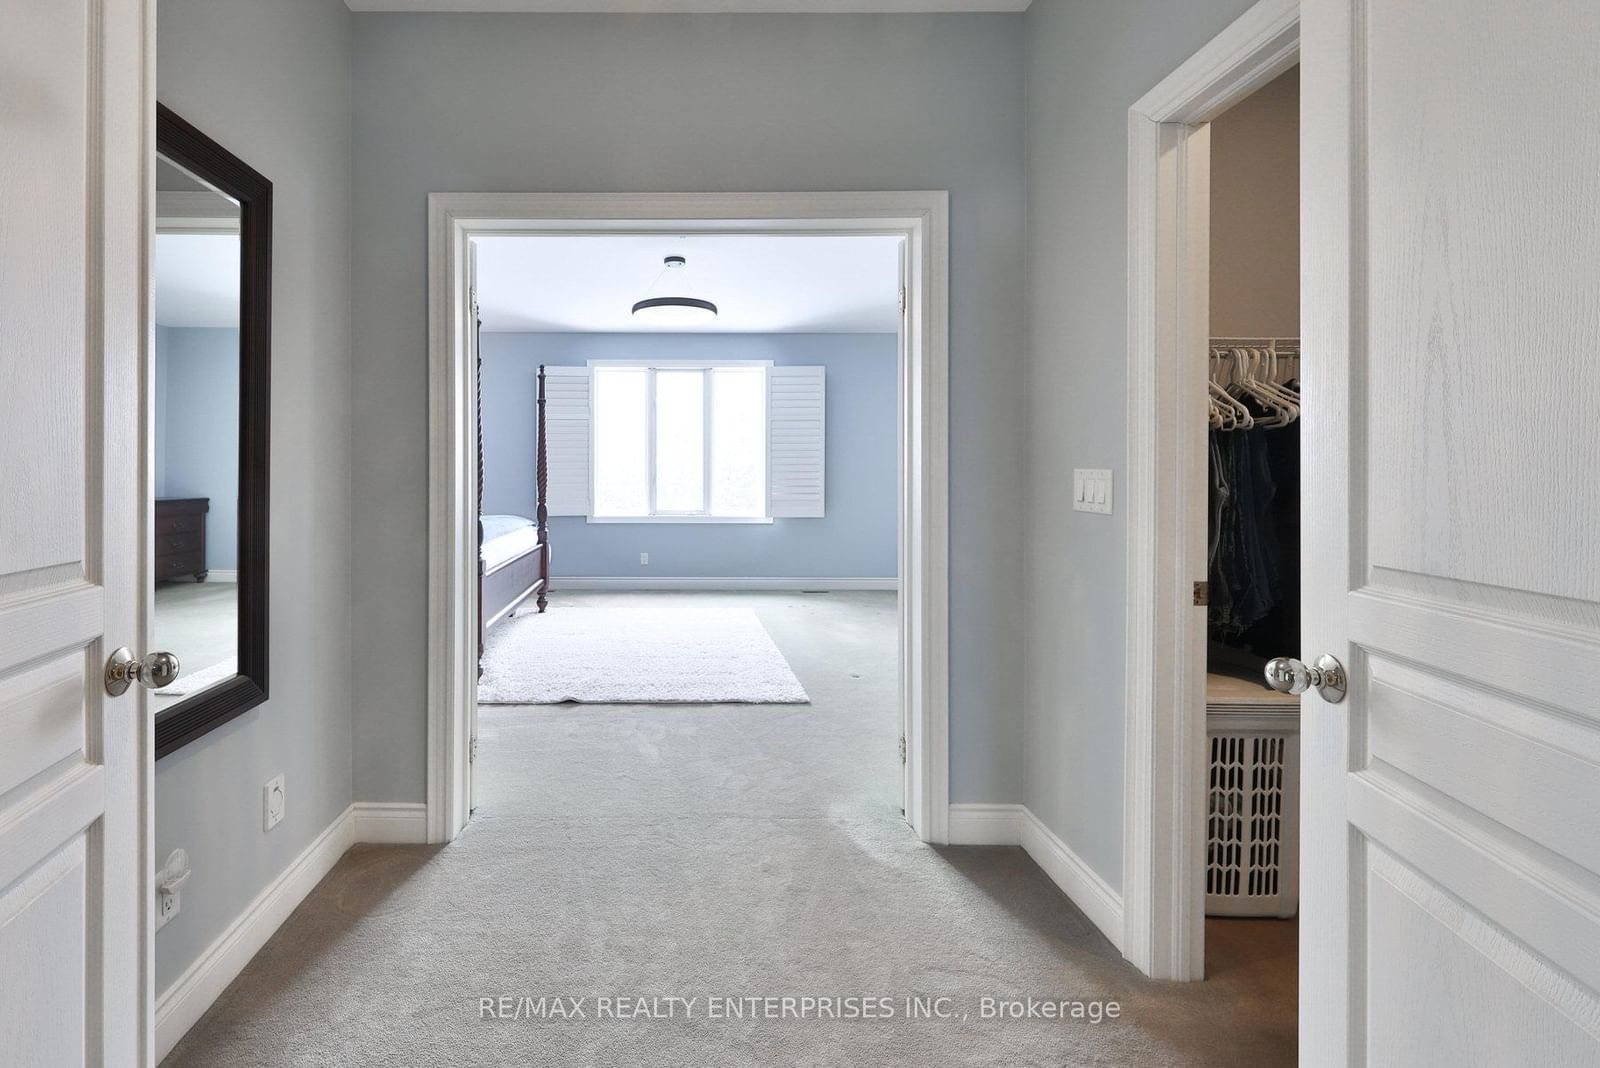
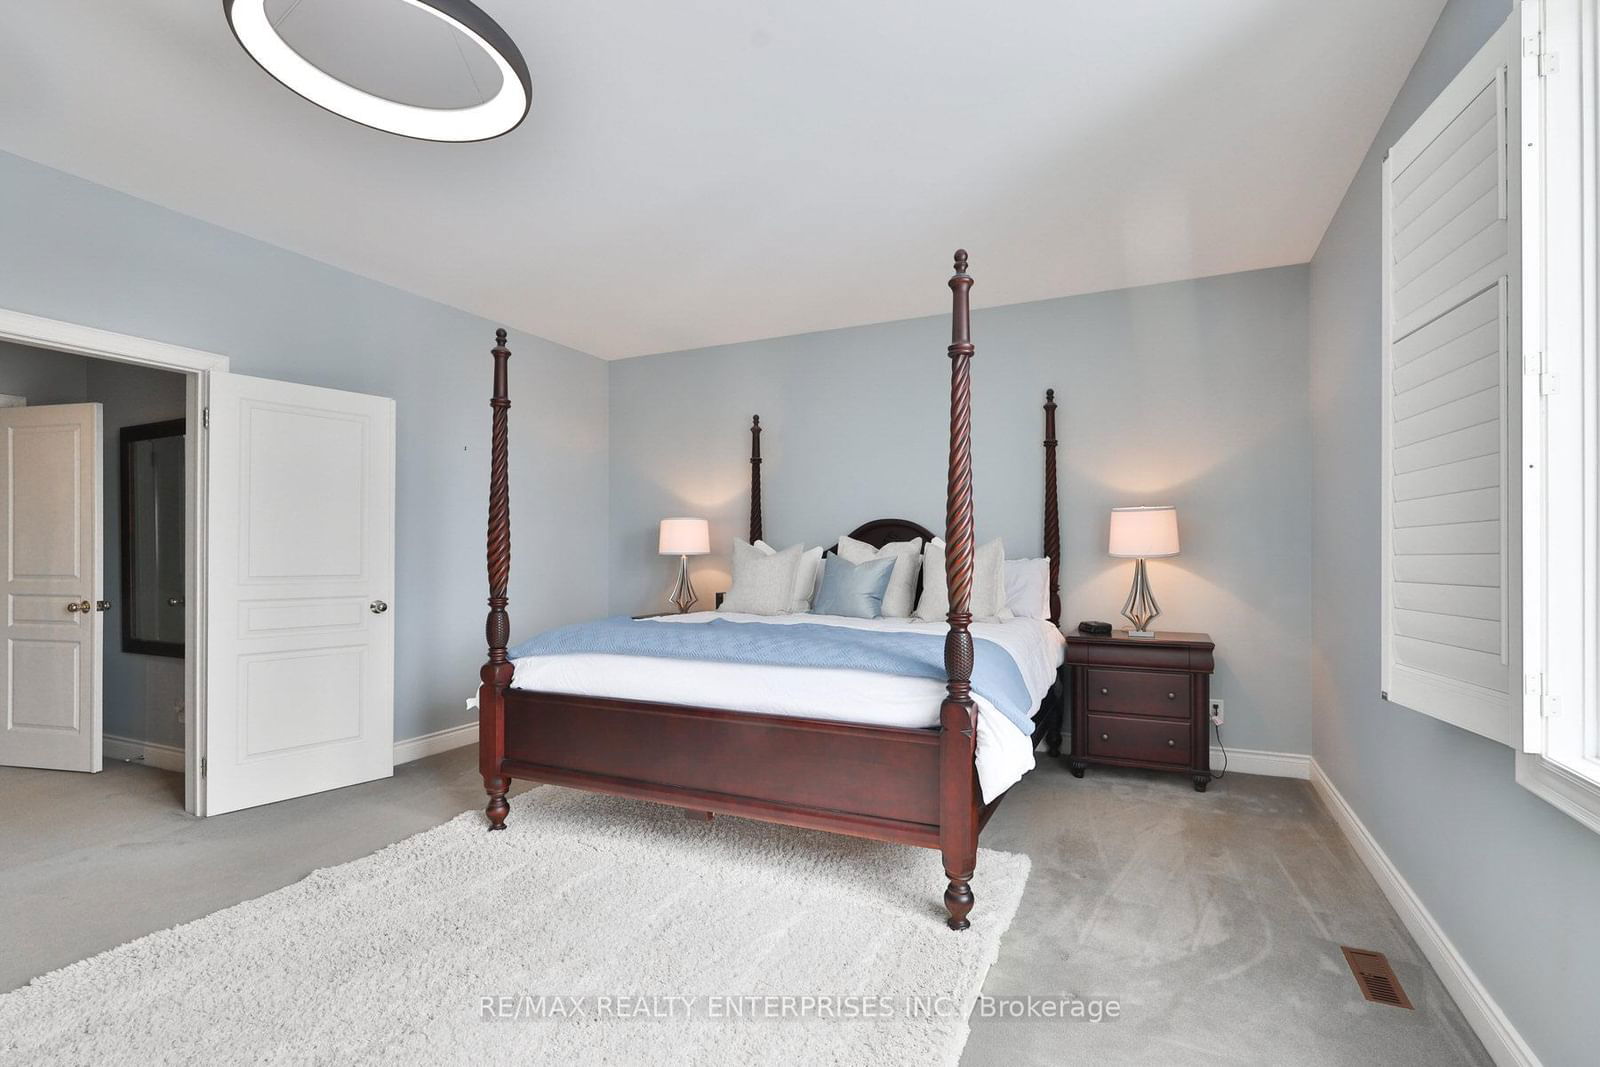
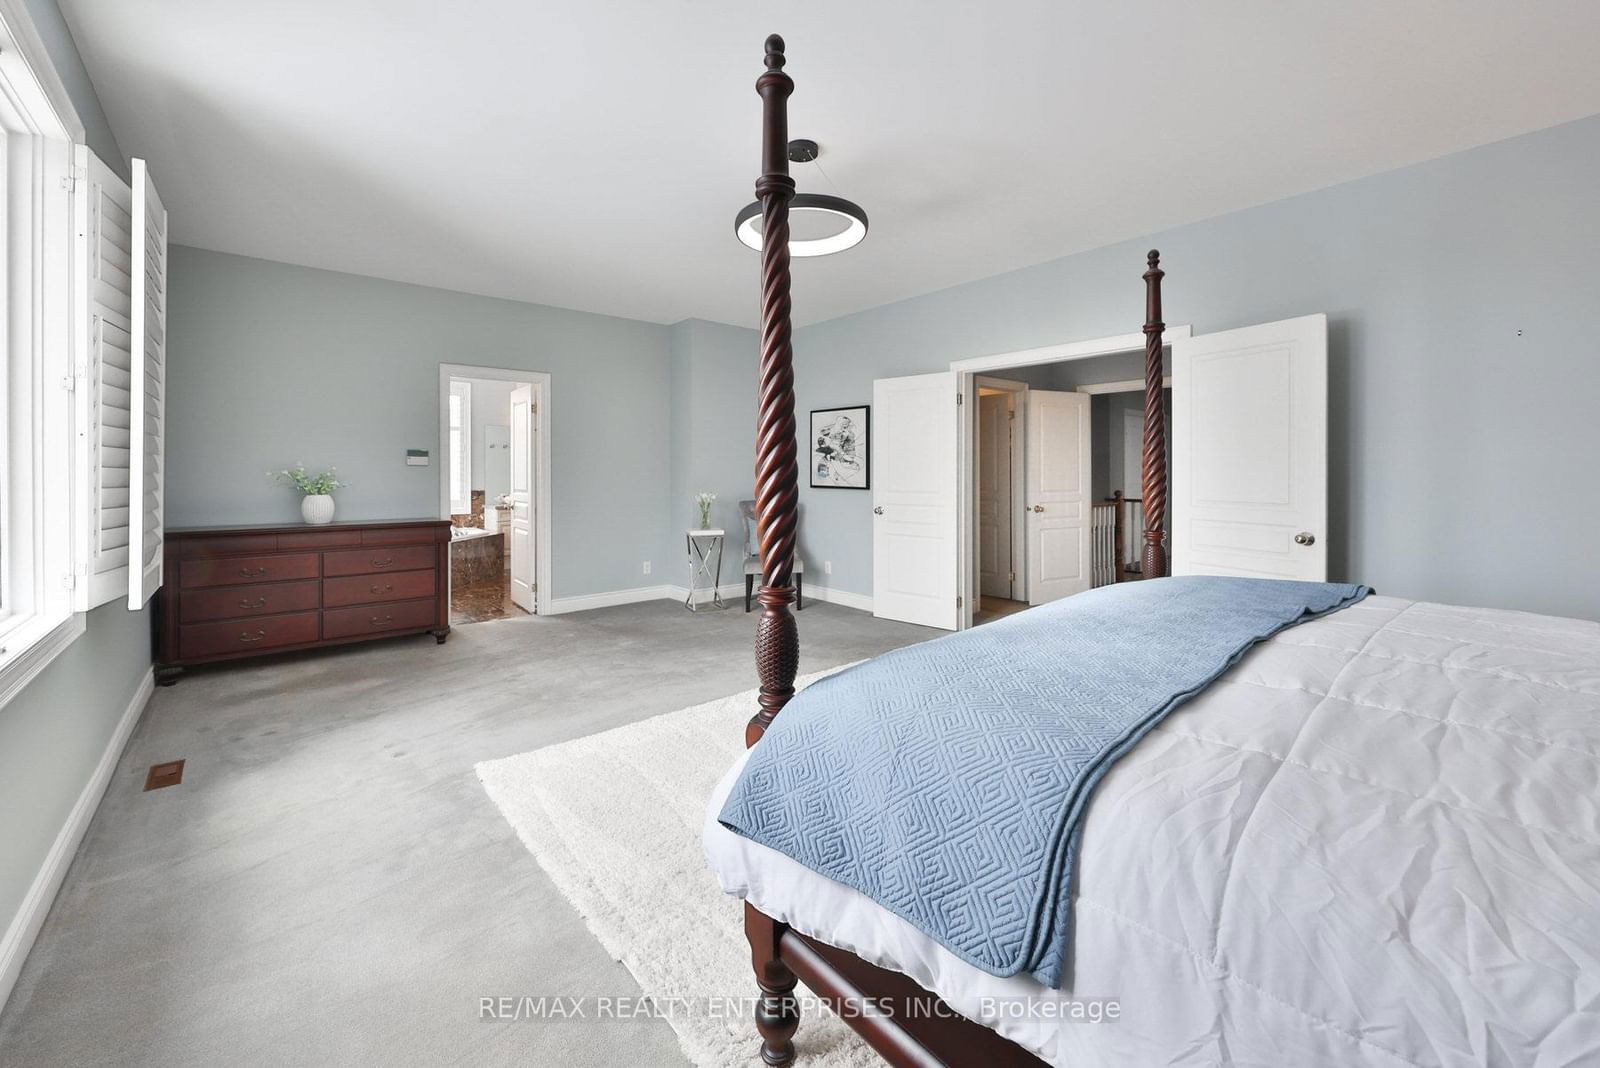
Prim Bdrm
2nd Br
3rd Br
4th Br
The graph below compares the average list price and average sale price of homes in this neighborhood by month for the last 24 months. When average sale price is greater than average list price, this may suggest a buyer's market. When average sale price is lower than the average list price this may suggest a seller's market.
The graph below illustrates the average days on market for homes in this neighborhood. The yellow area may indicate a buyer's market, the green area may indicate a balanced market and the red area may indicate a seller's market.
Sales Representative, Century 21 People’s Choice Realty Inc., Brokerage
(647) 576 - 2100