
Century 21 People’s Choice Realty Inc., Brokerage
120 MATHESON BLVD E #103
MISSISSAUGA, Ontario
L4Z 1X1
Mississauga, East Credit, L5V 2K3
$1,299,000
Listed by HOME VISION REAL ESTATE INC..
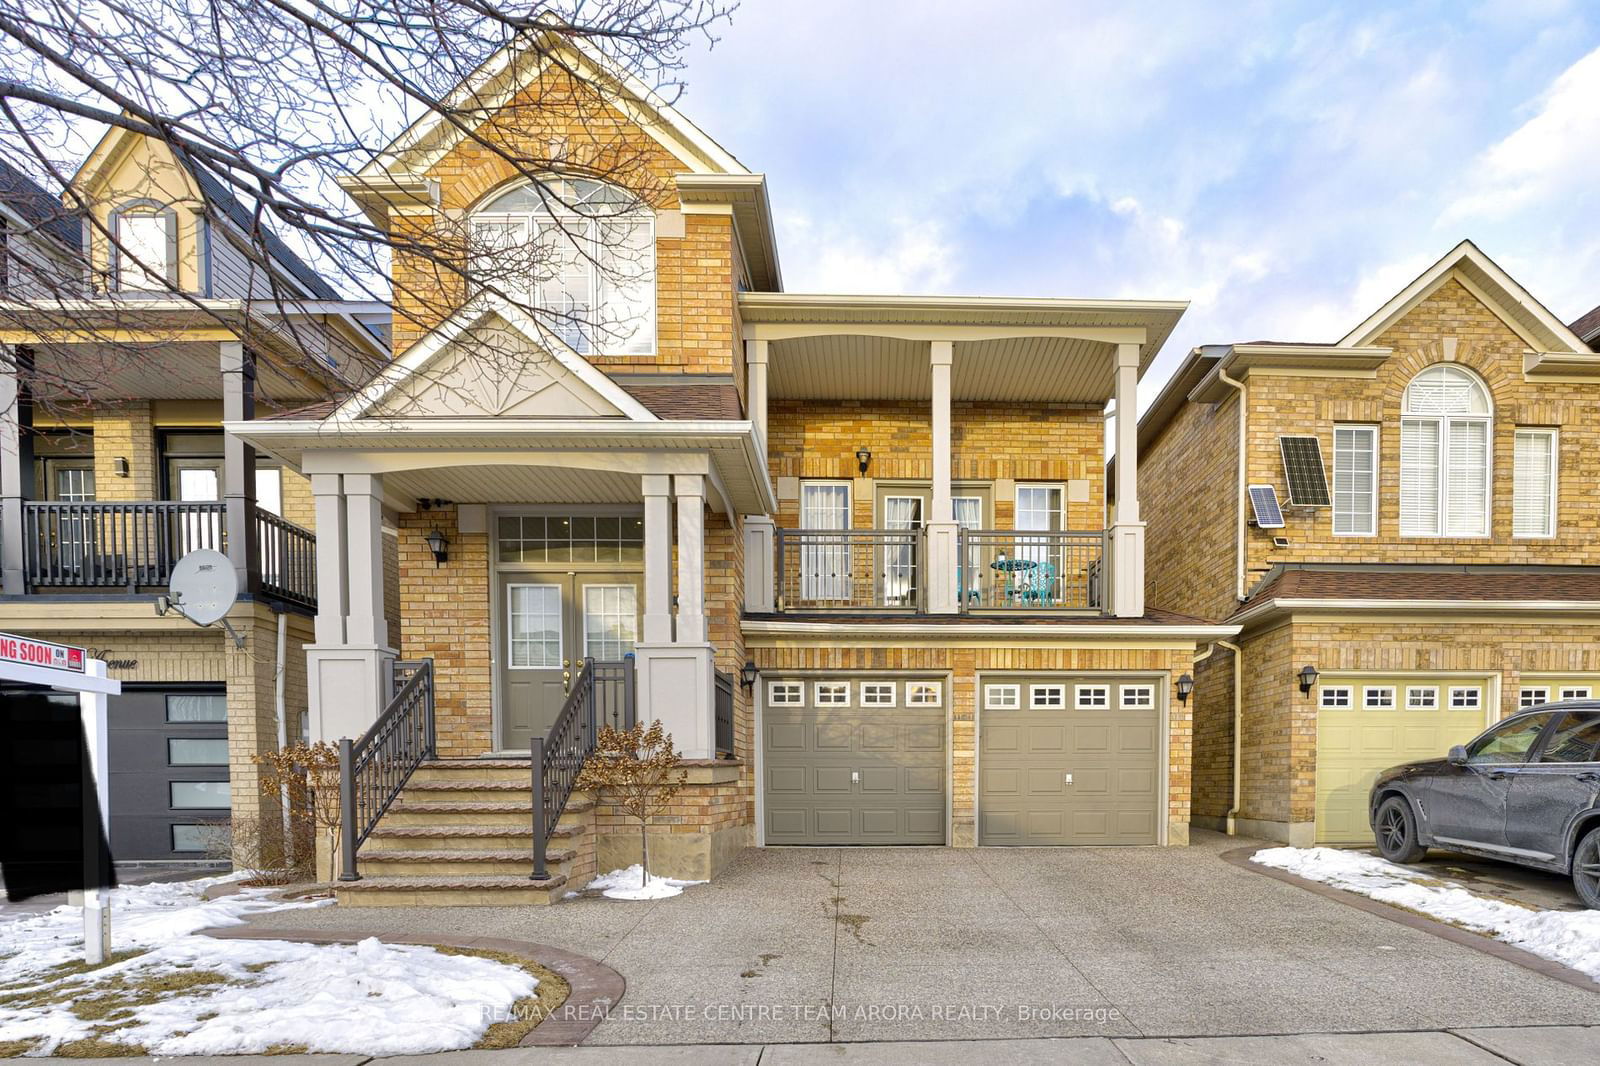
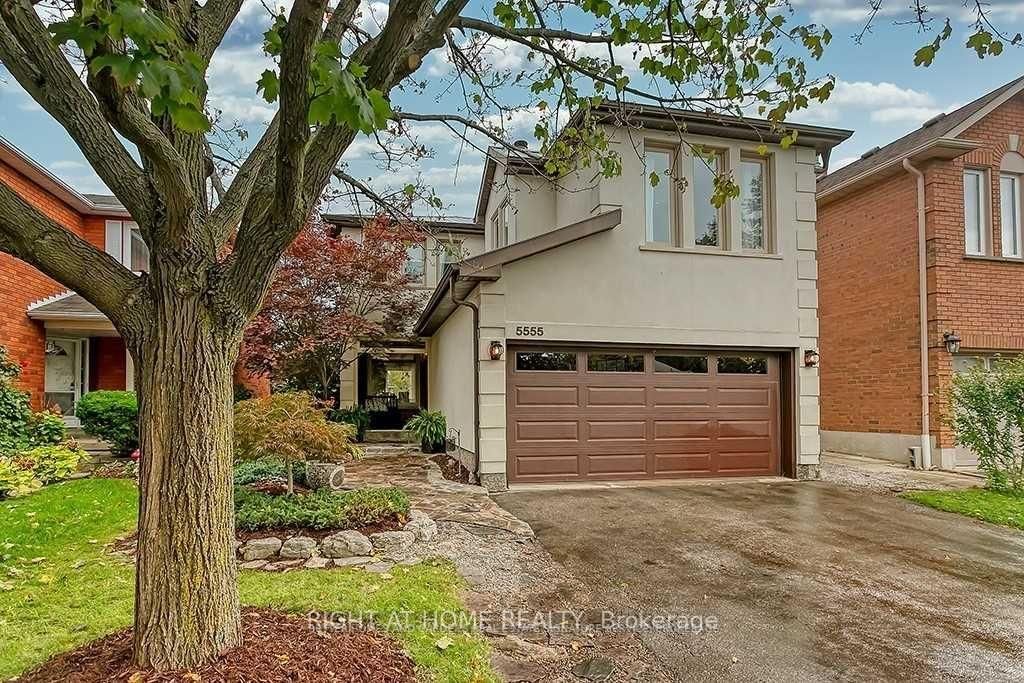
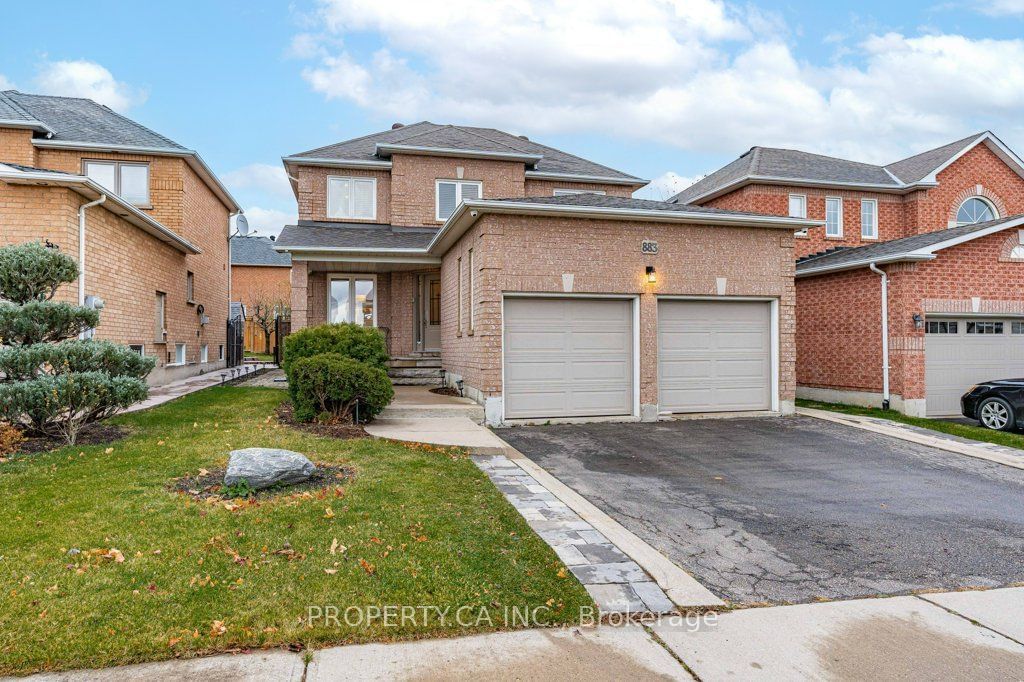
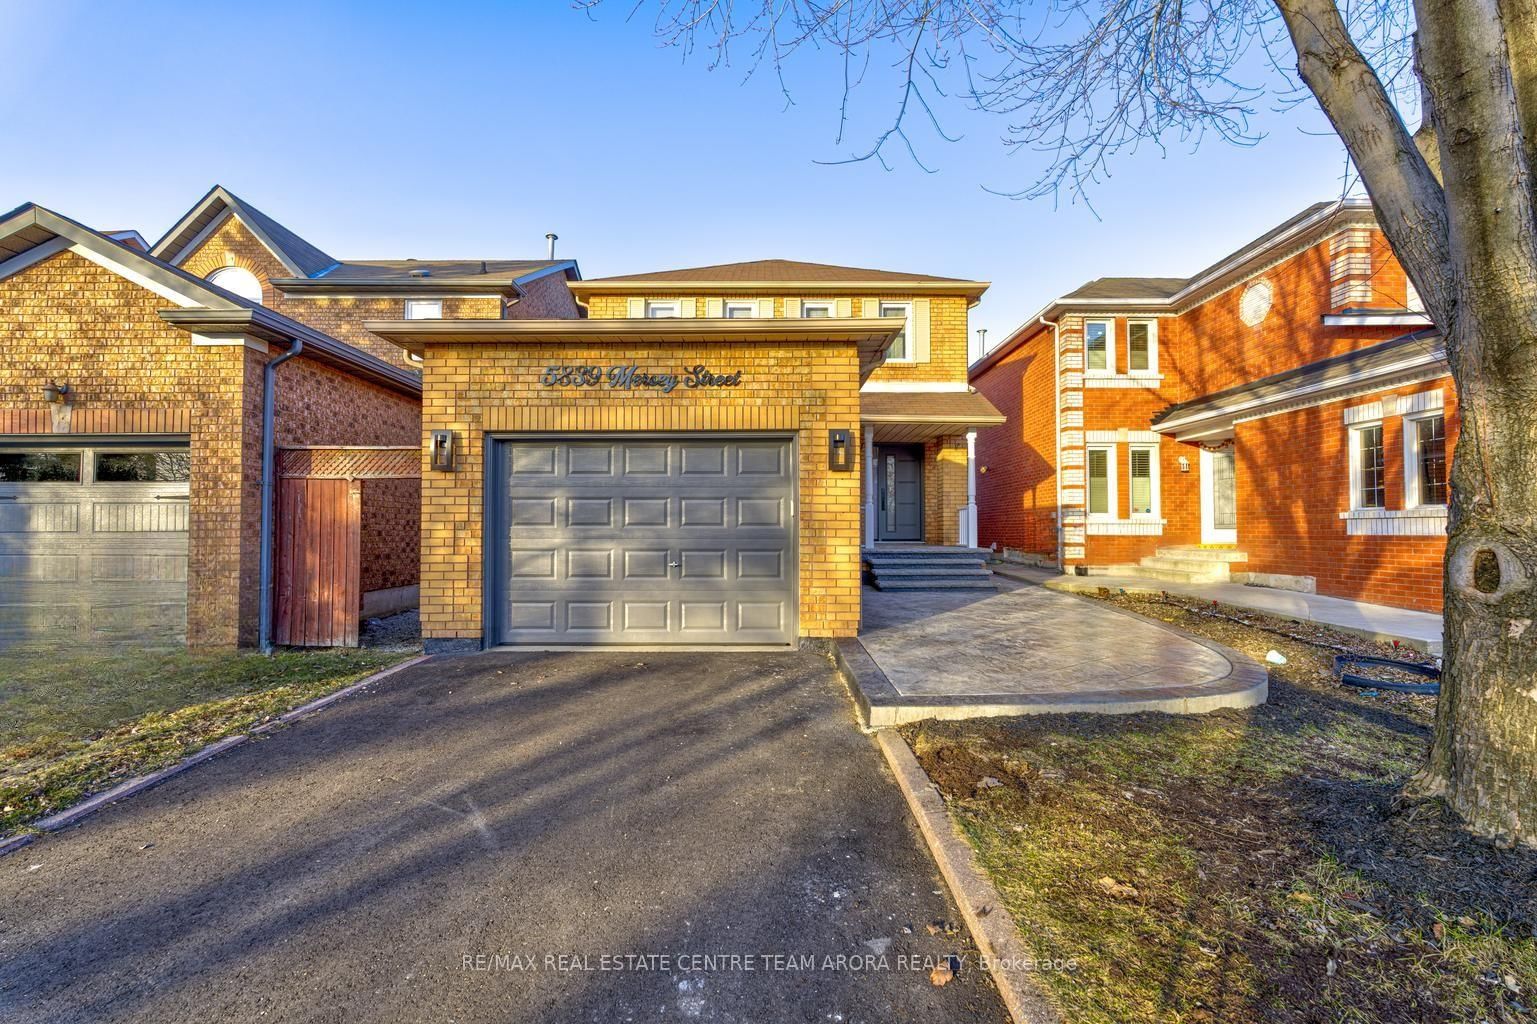
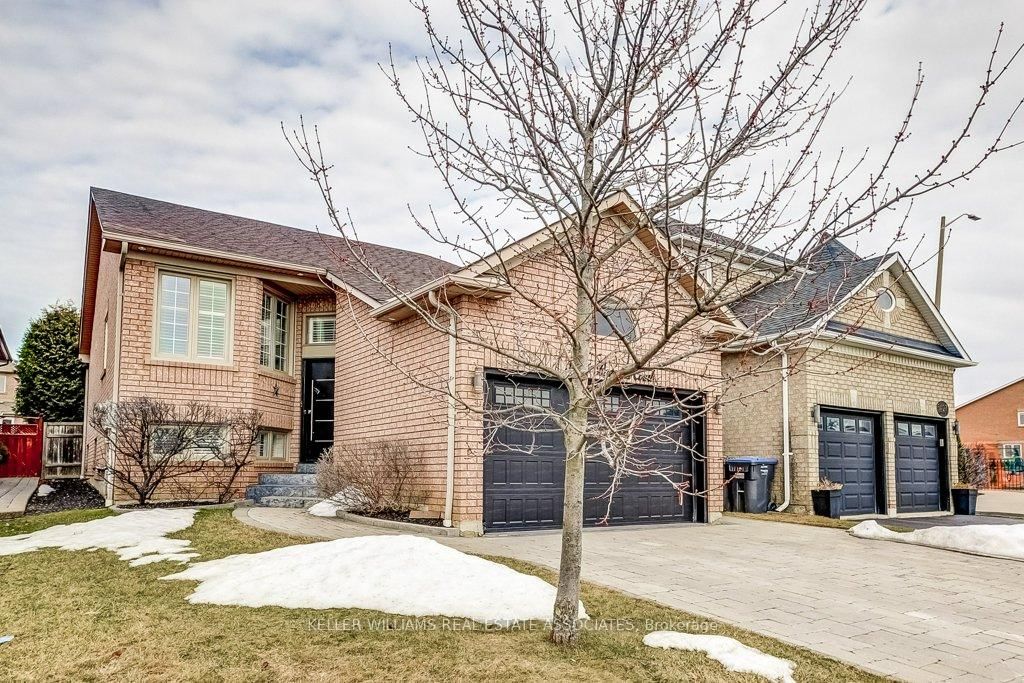
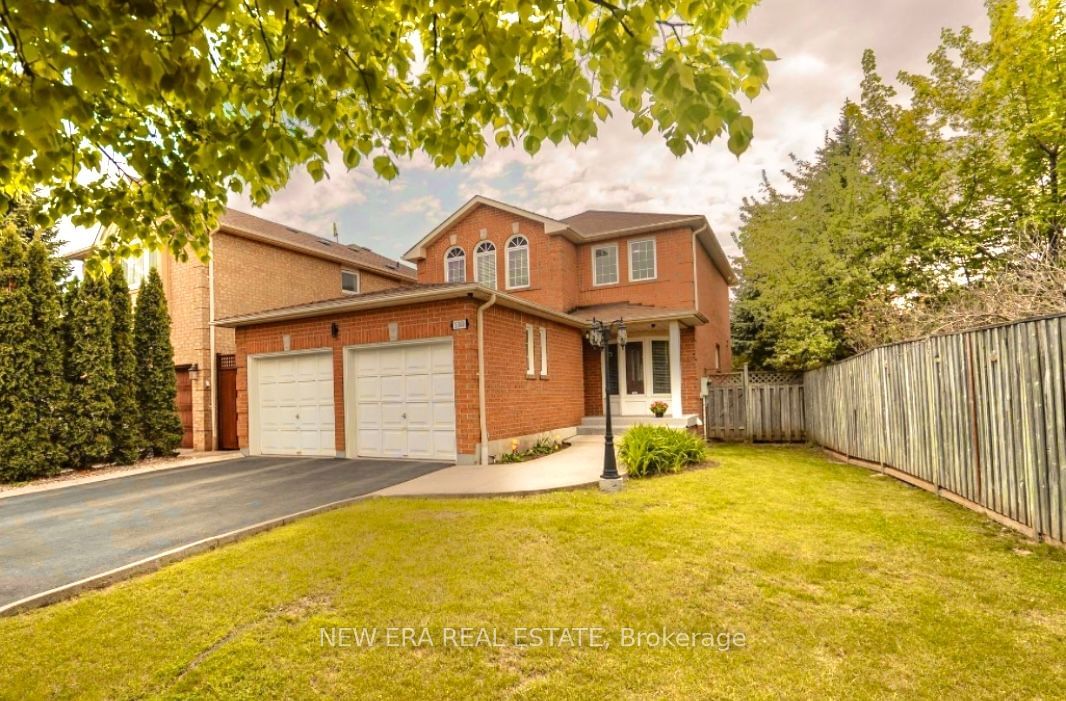
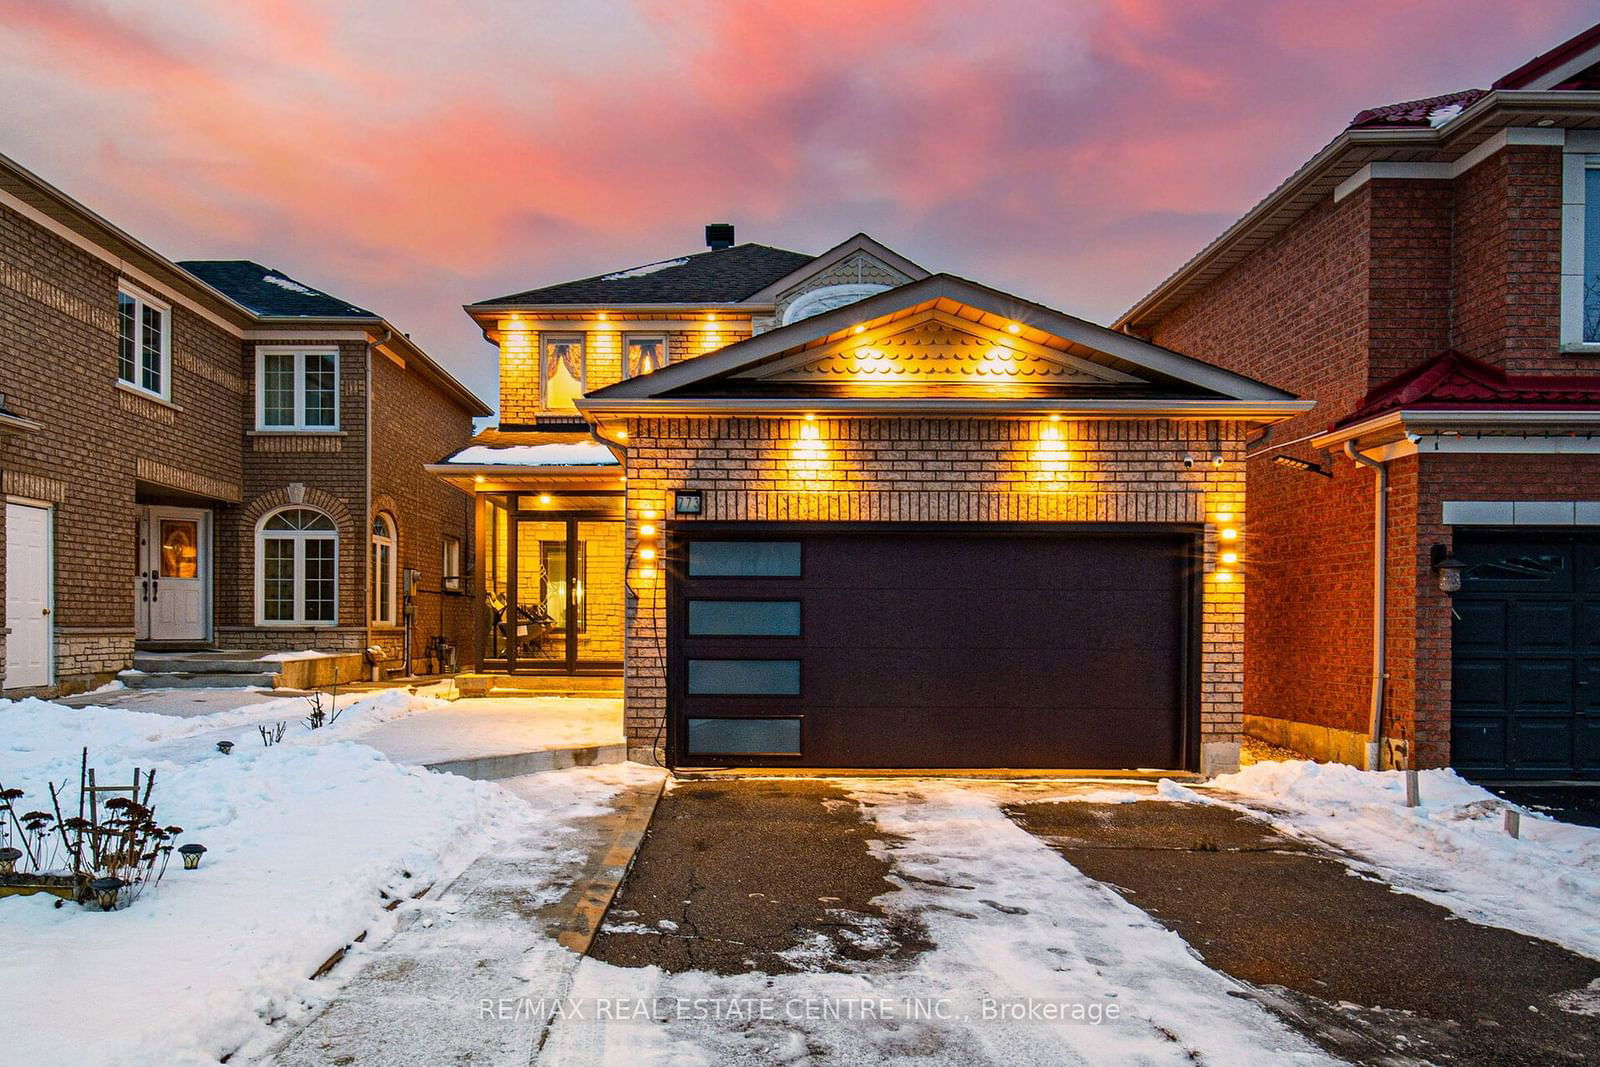
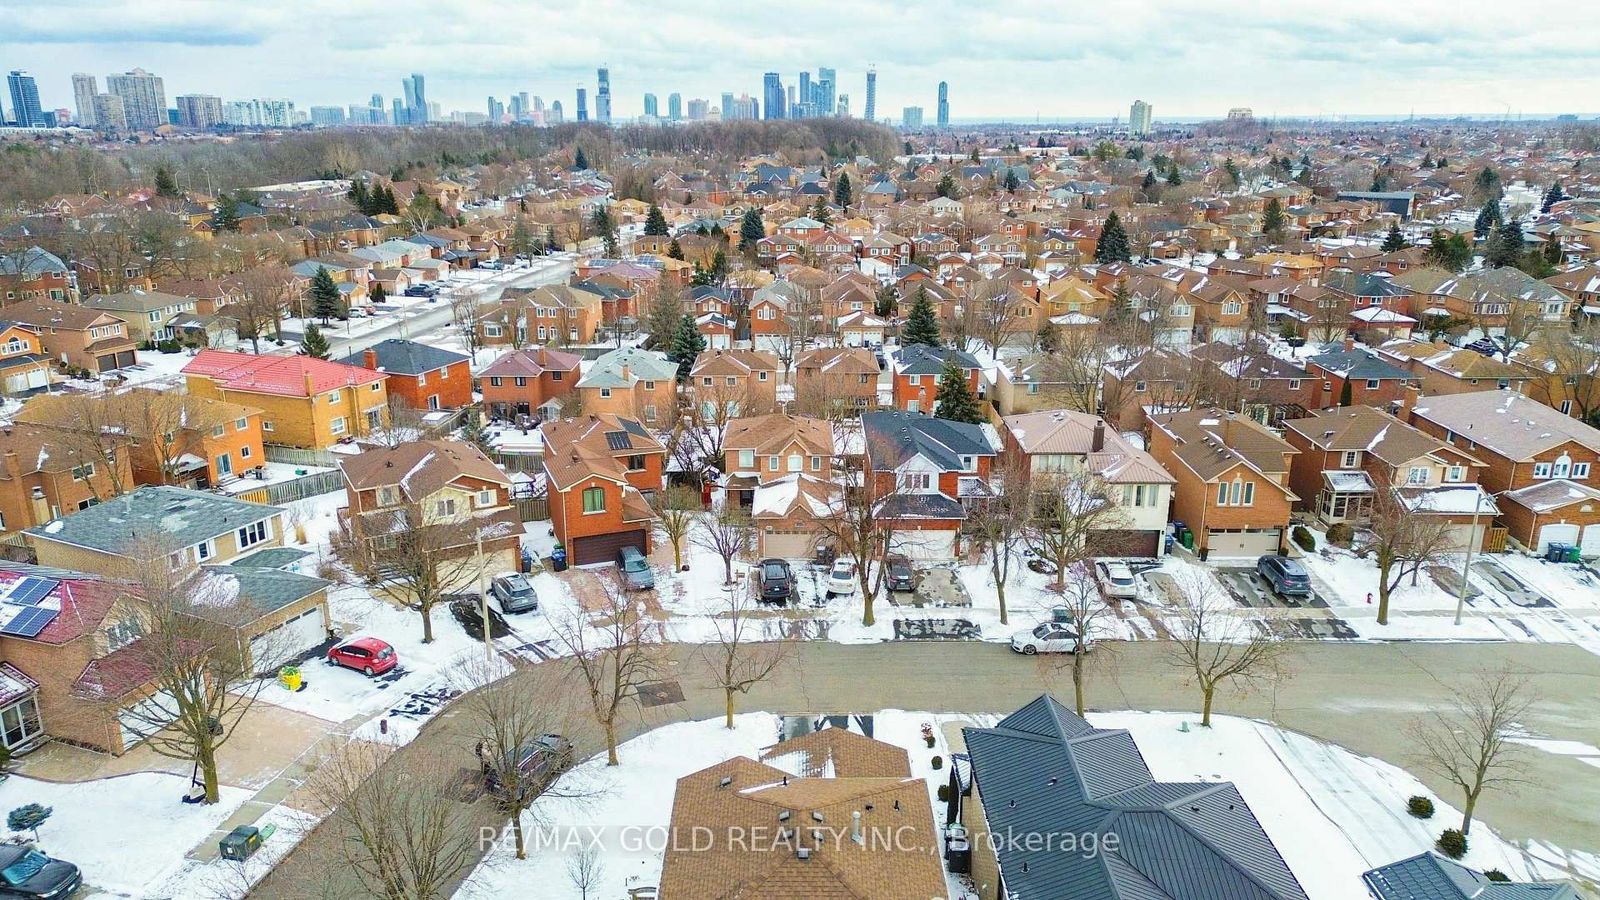
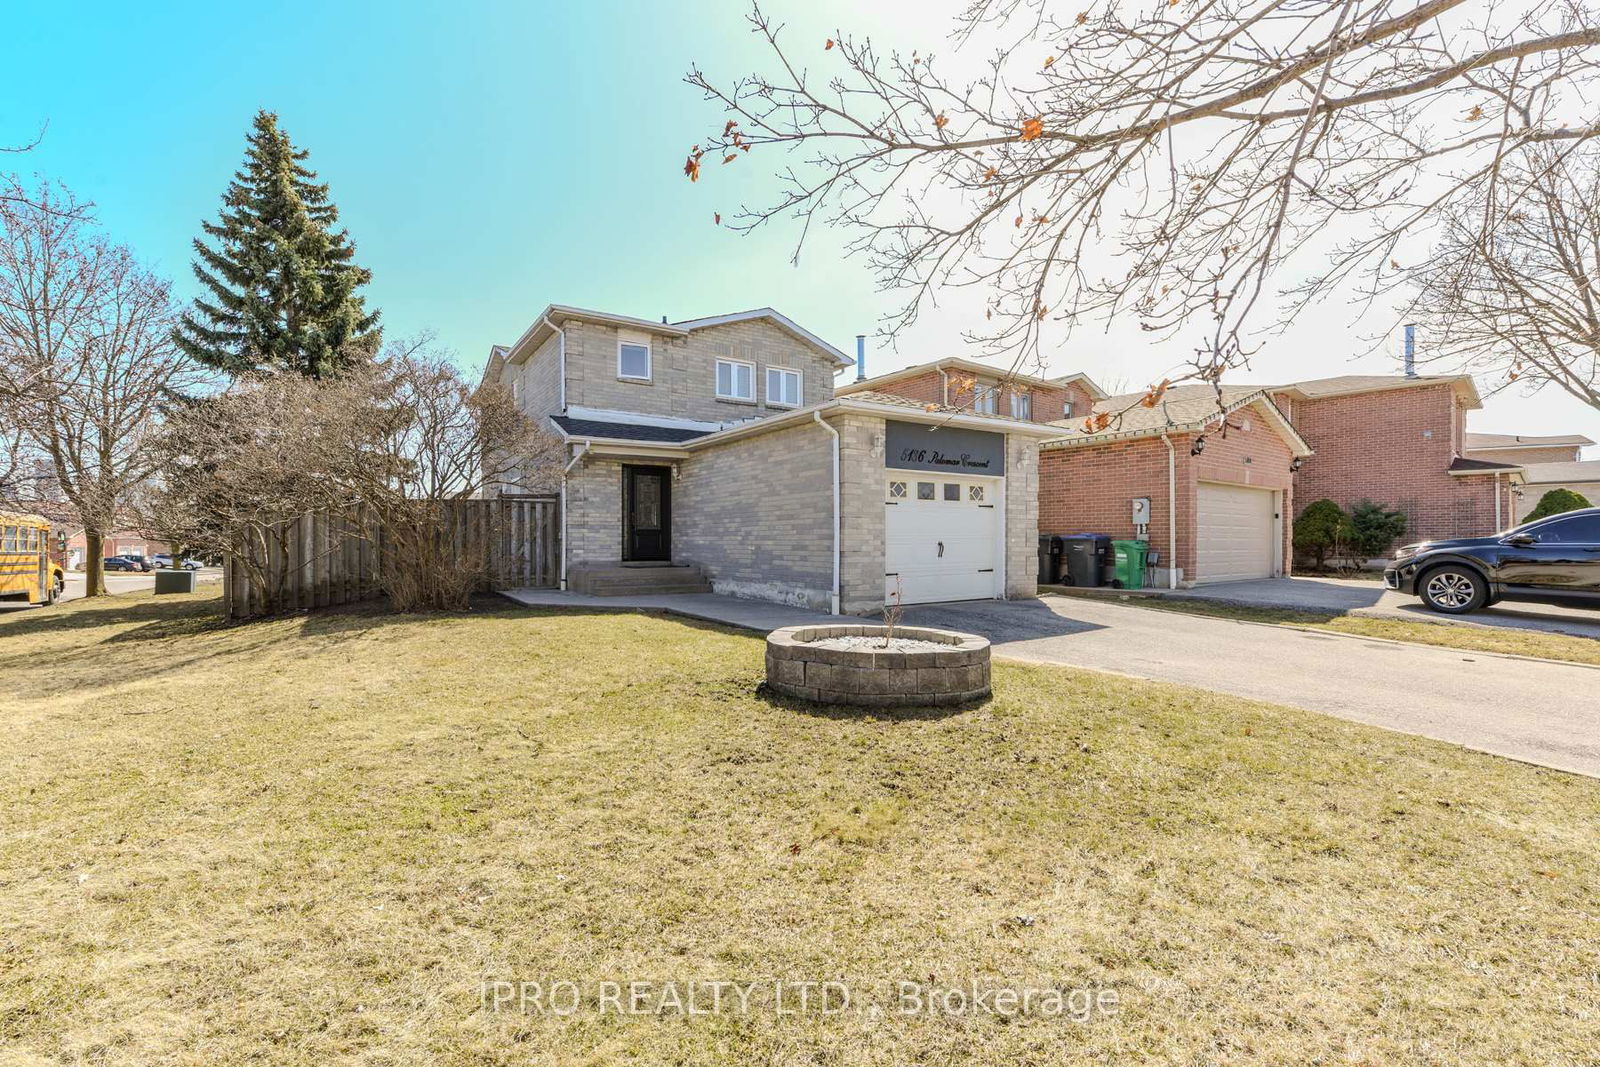
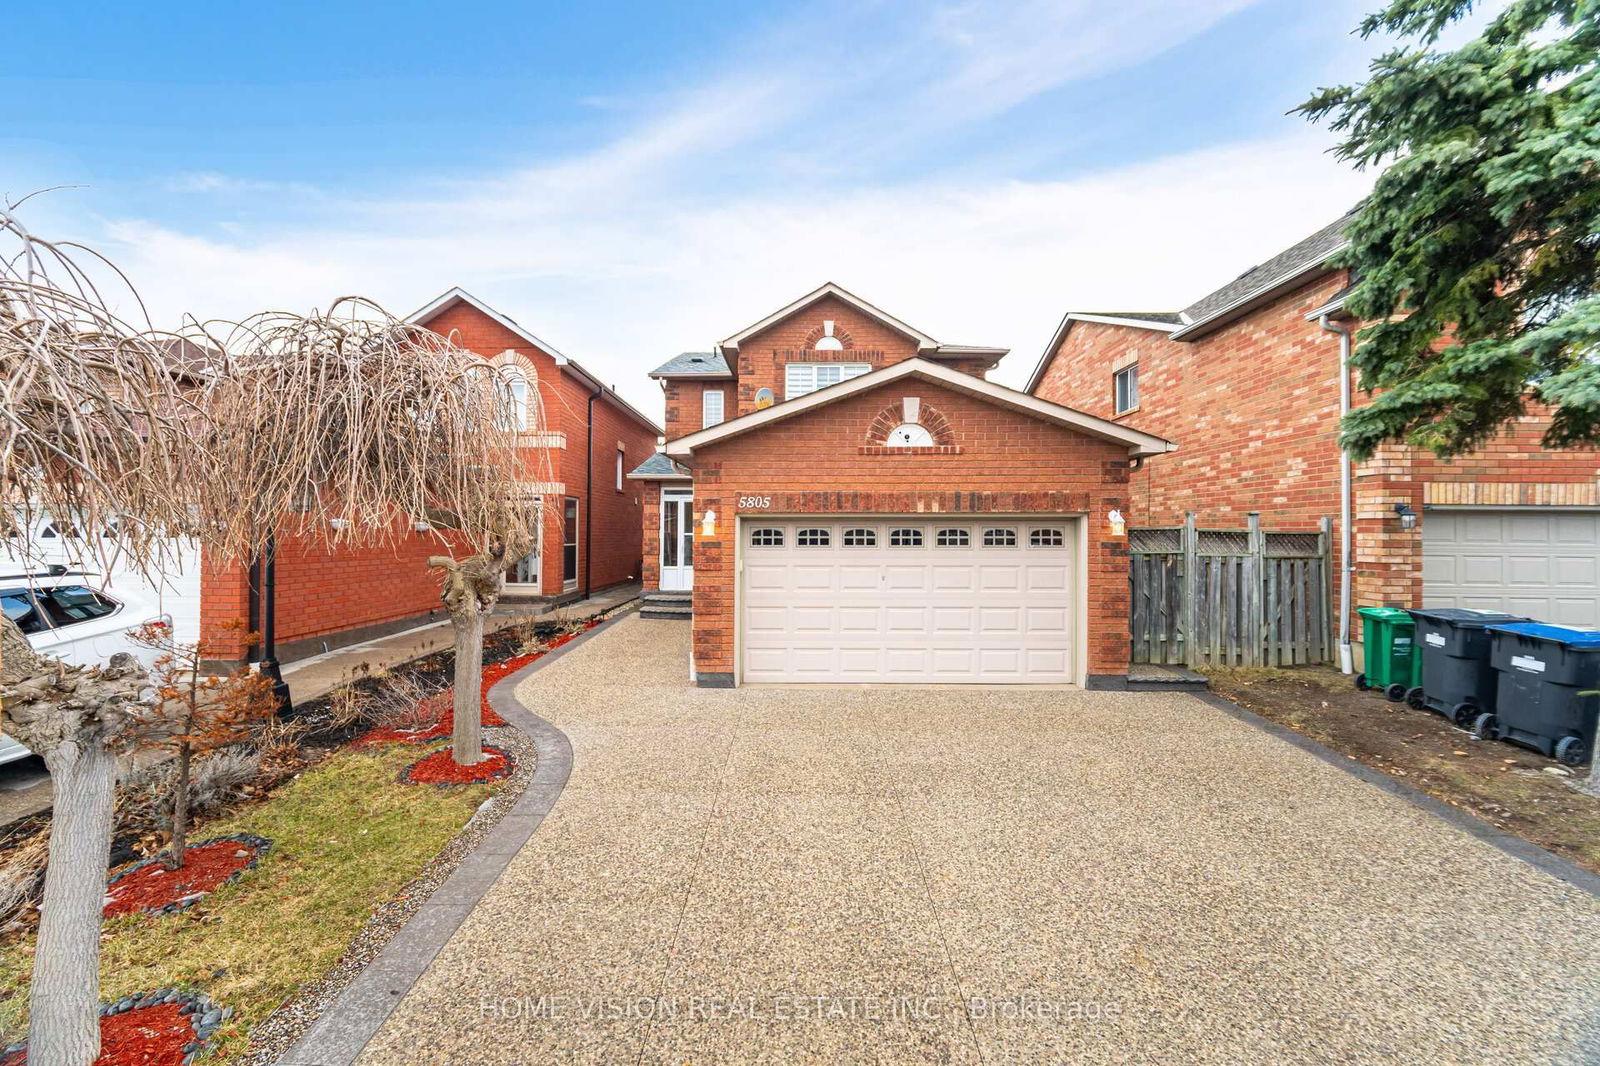
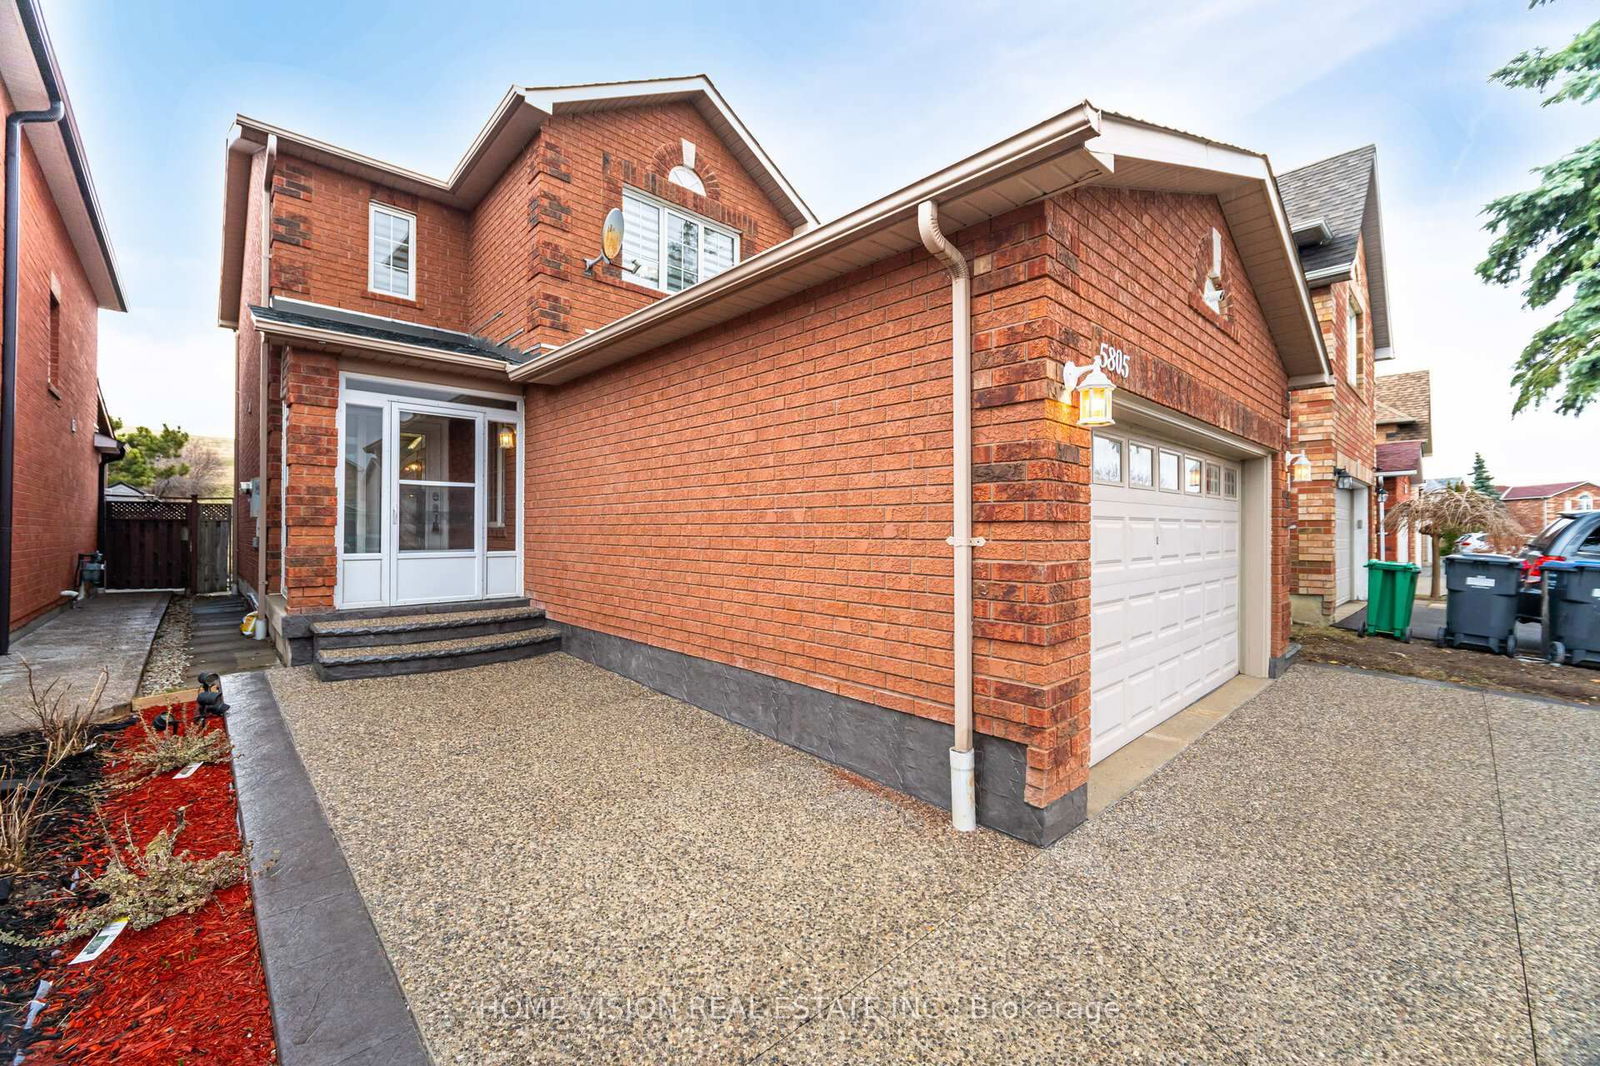
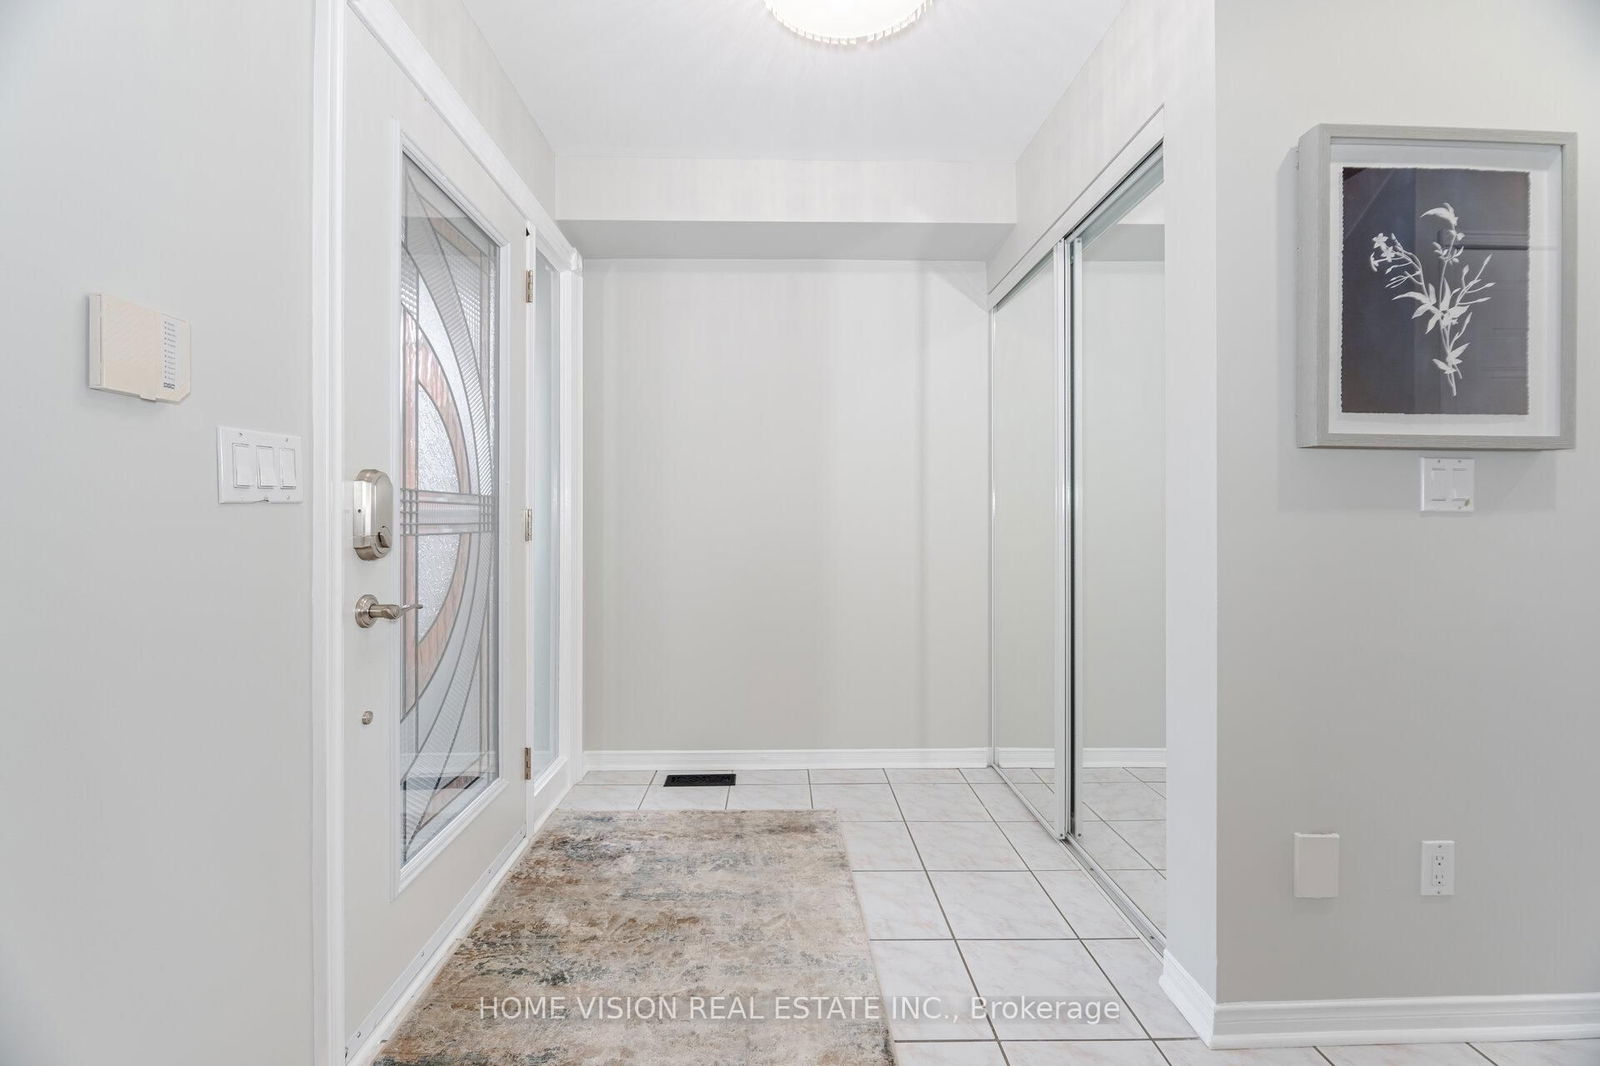
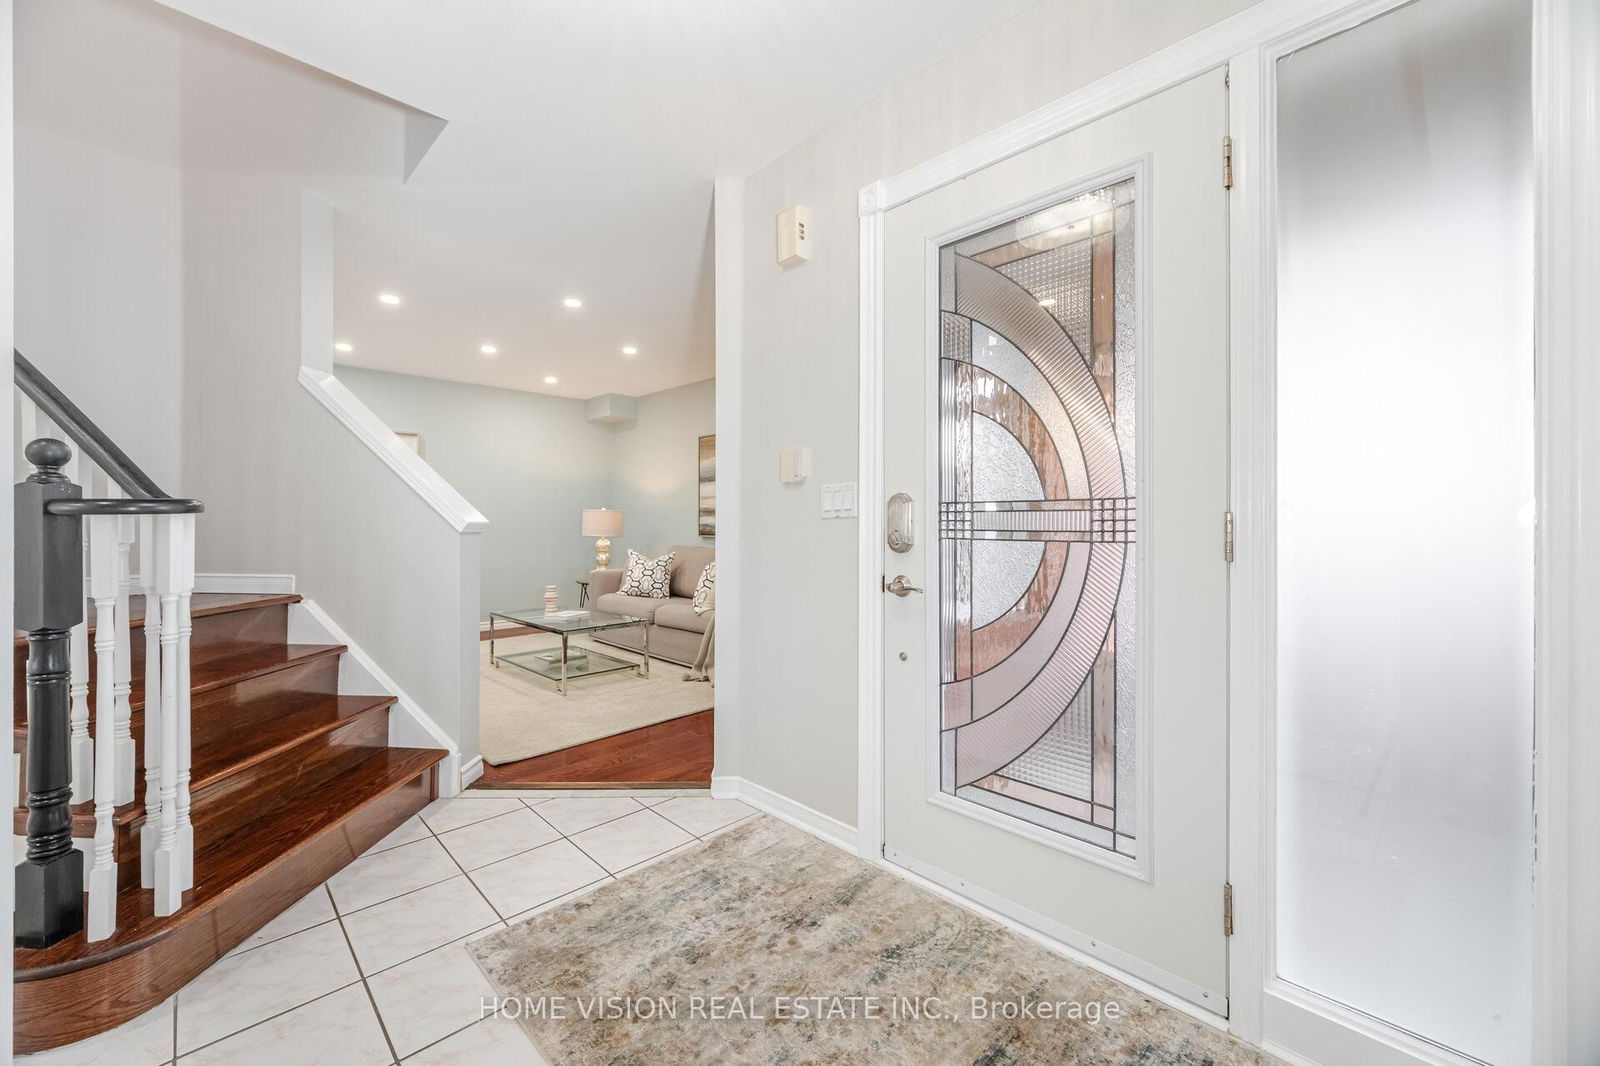
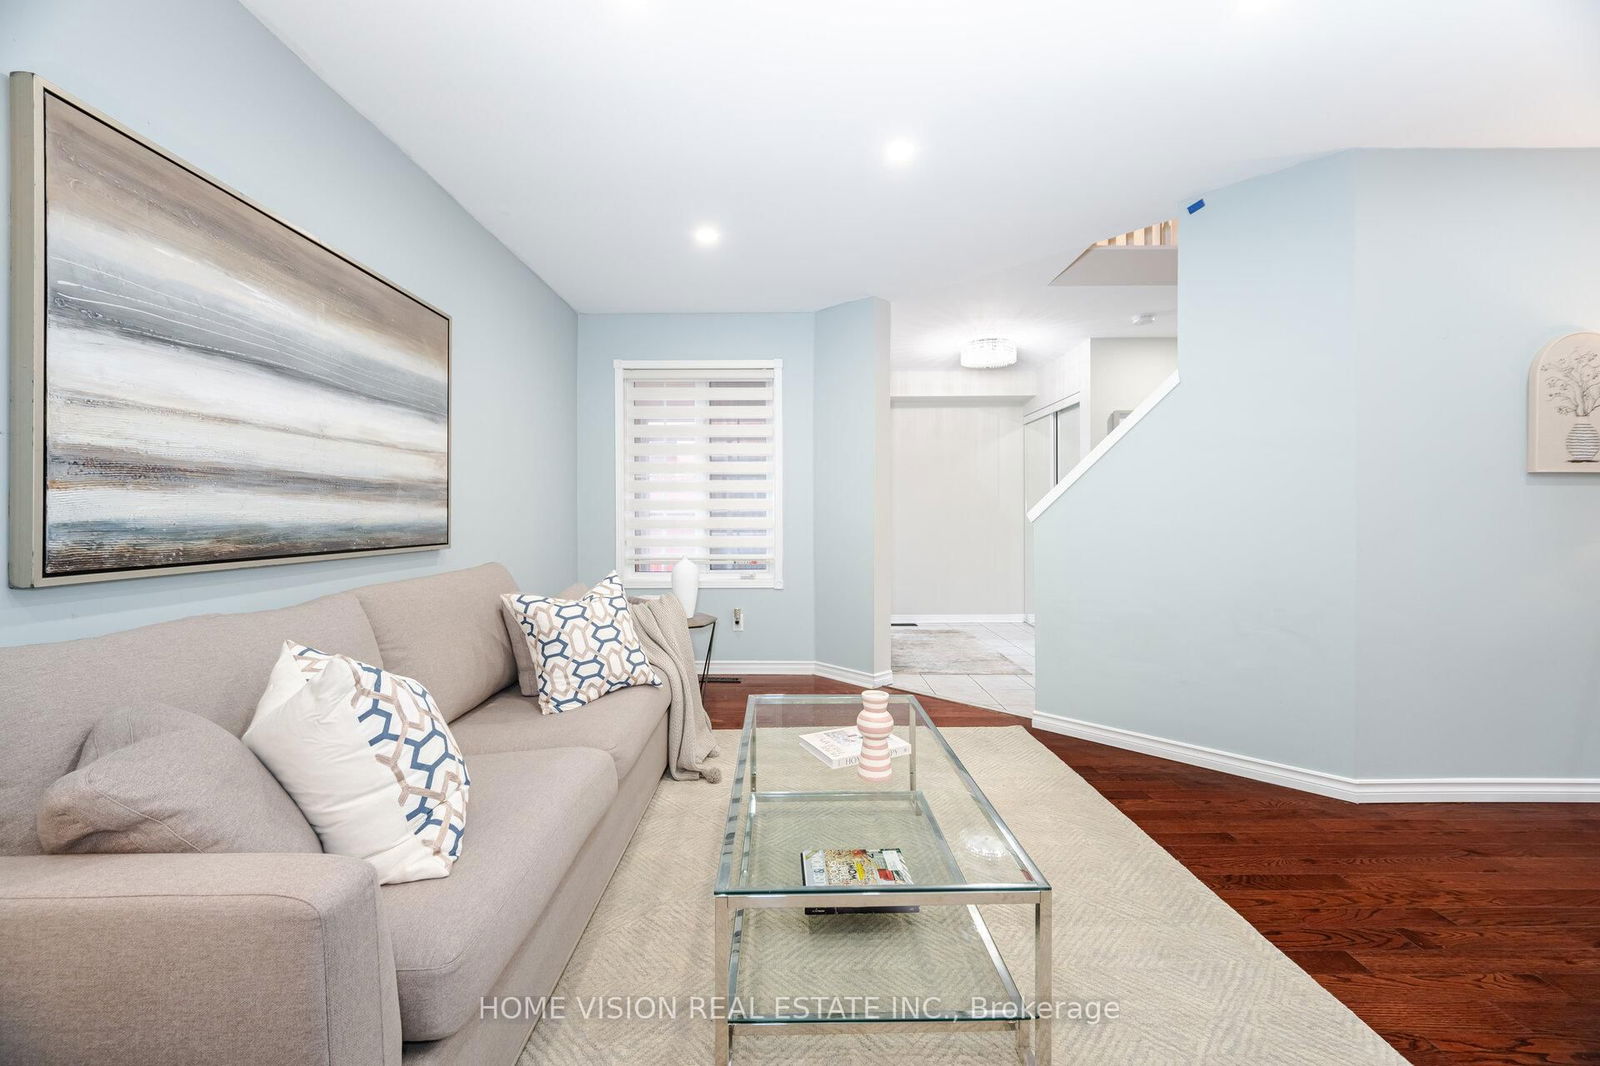
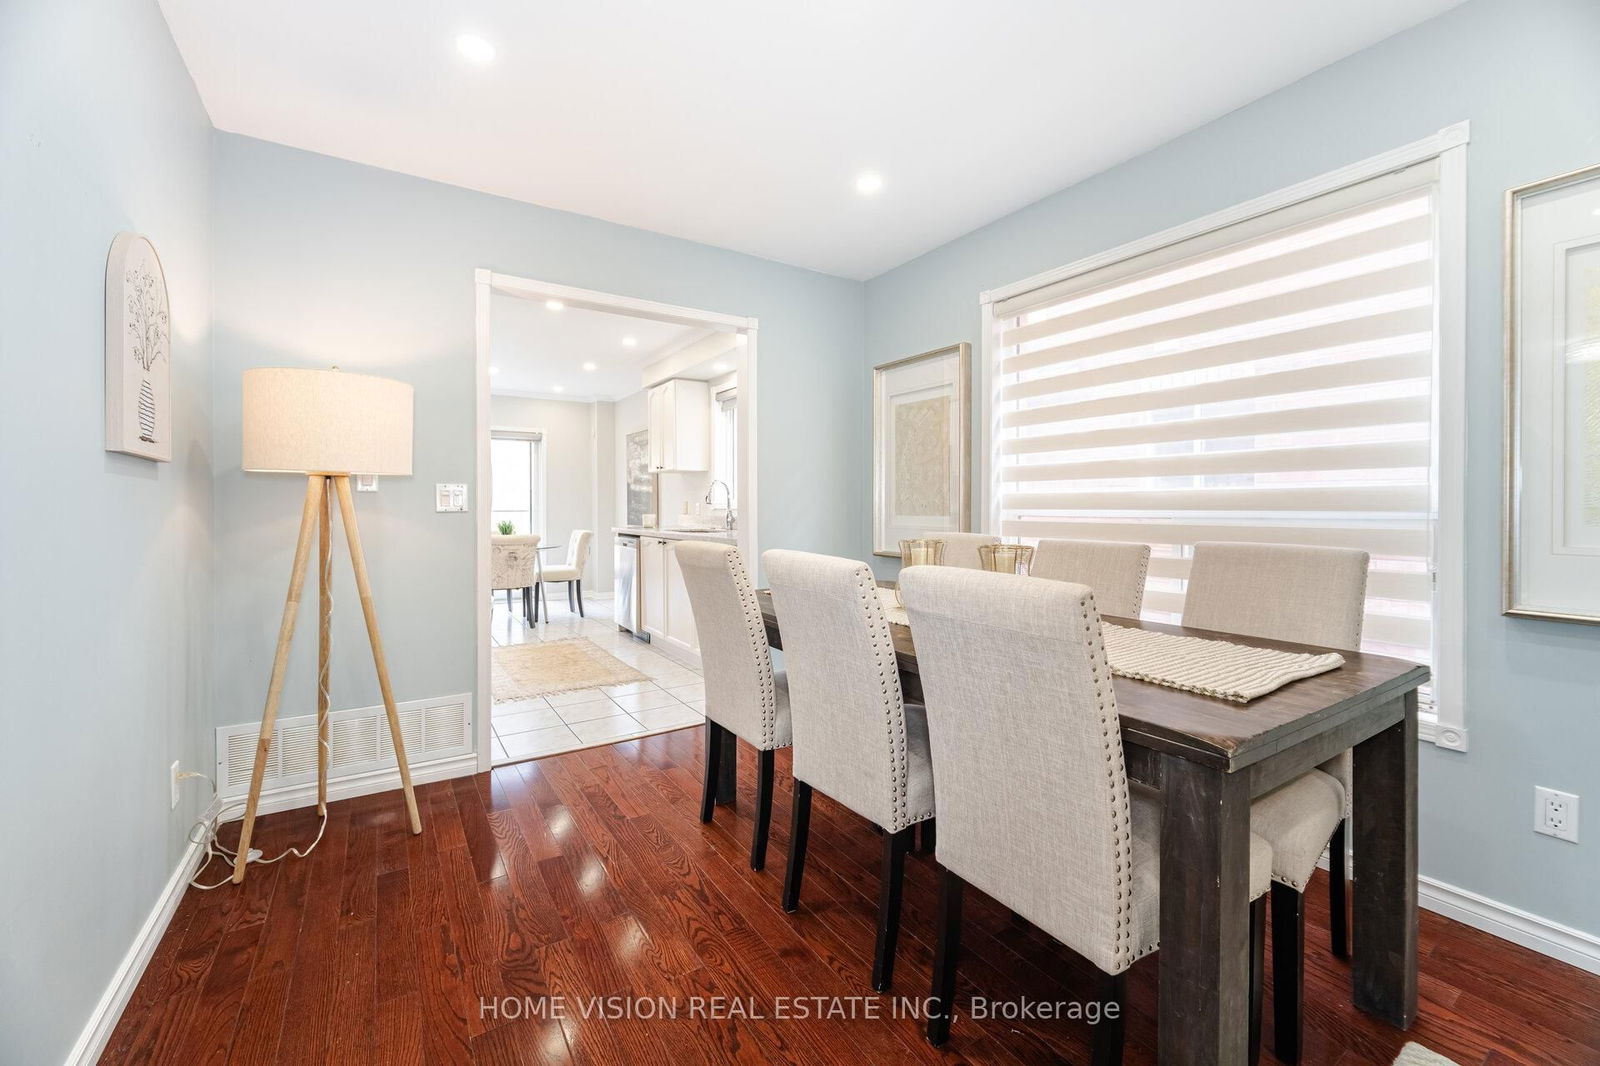
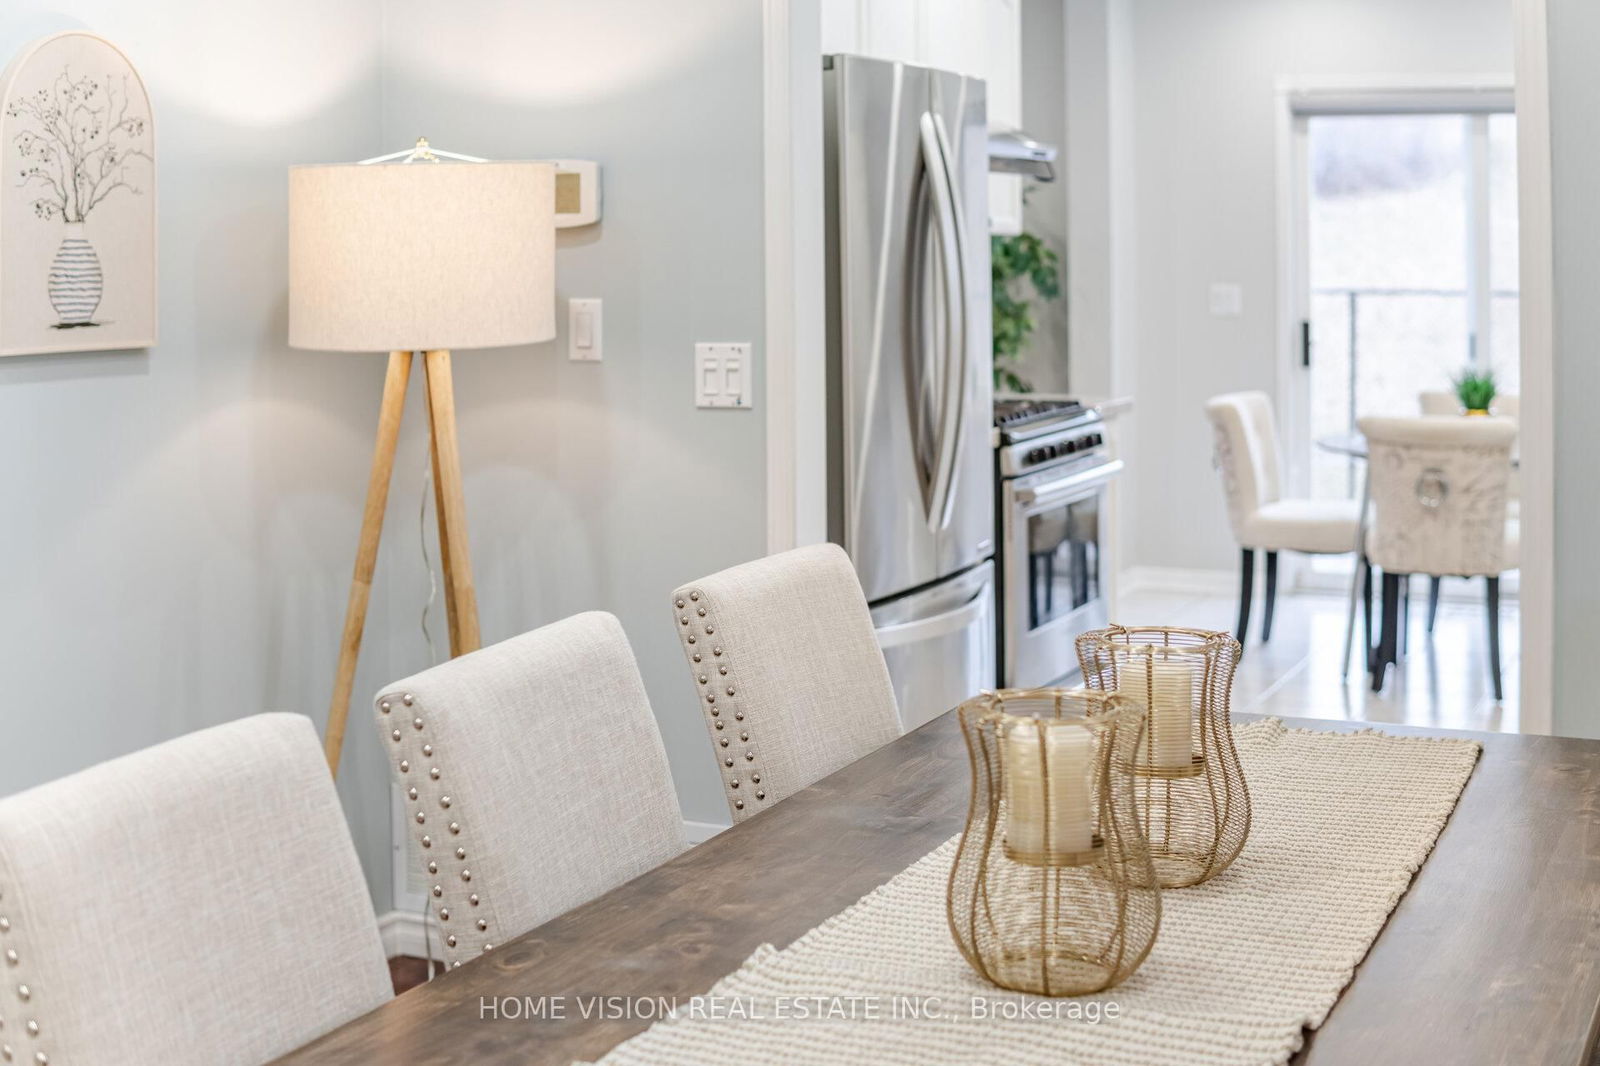
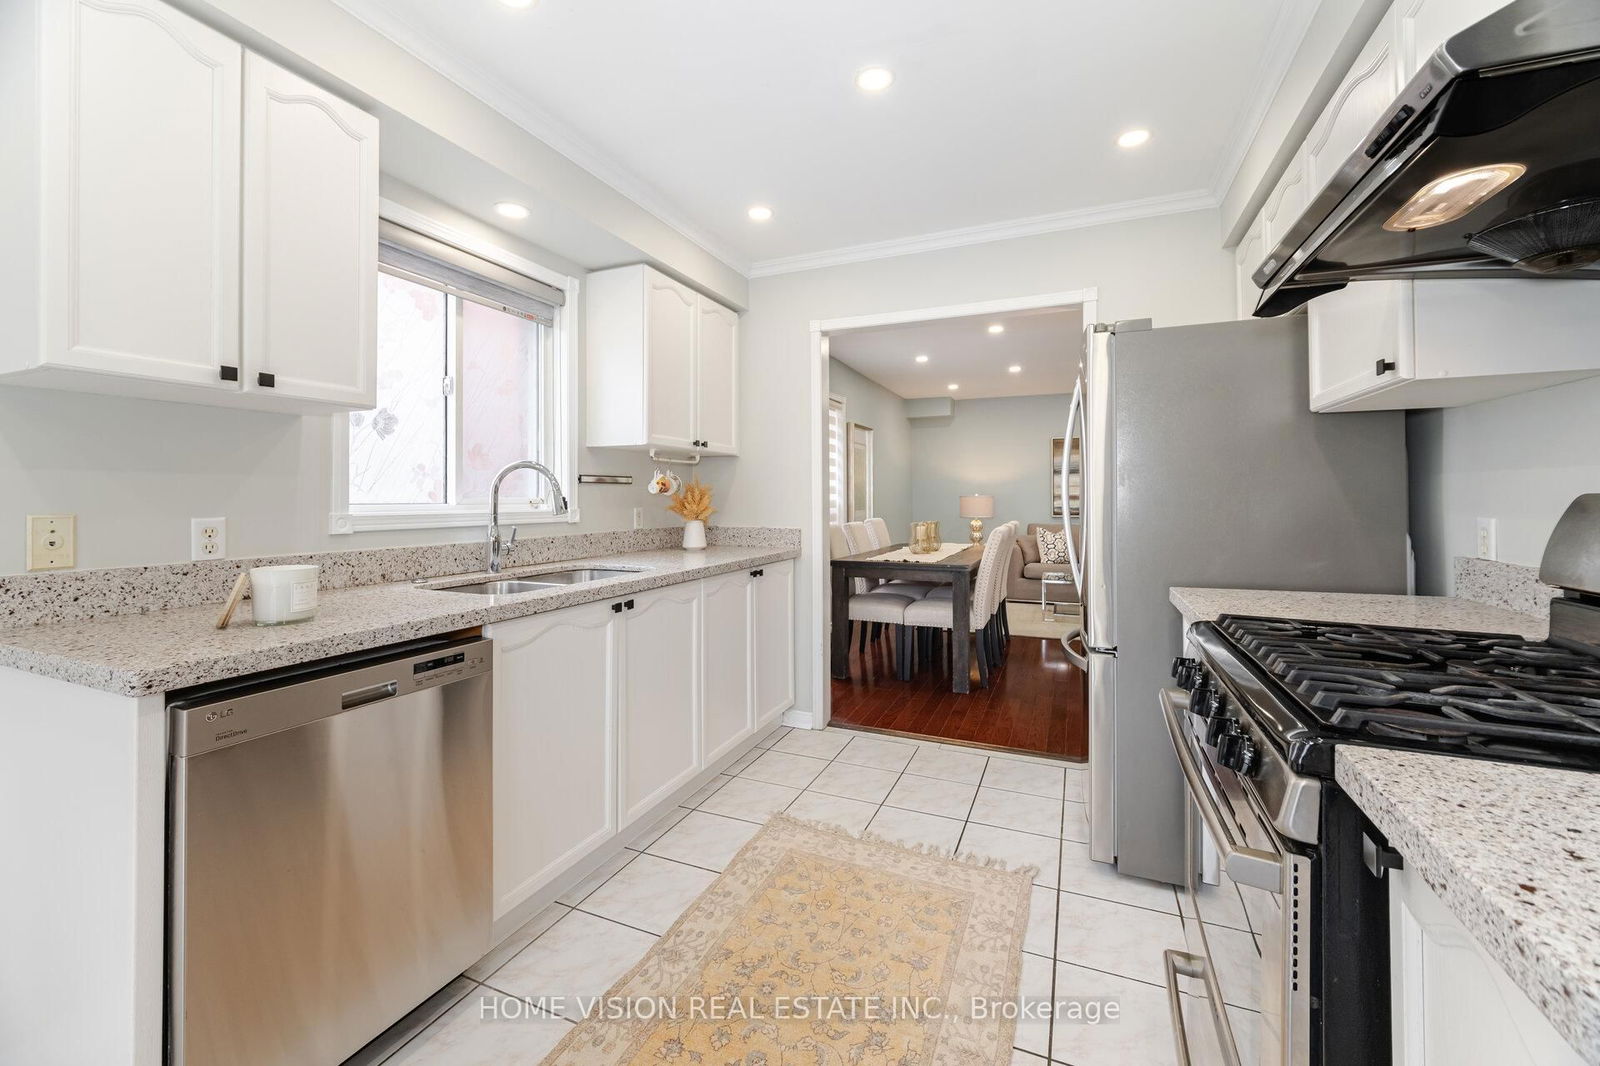
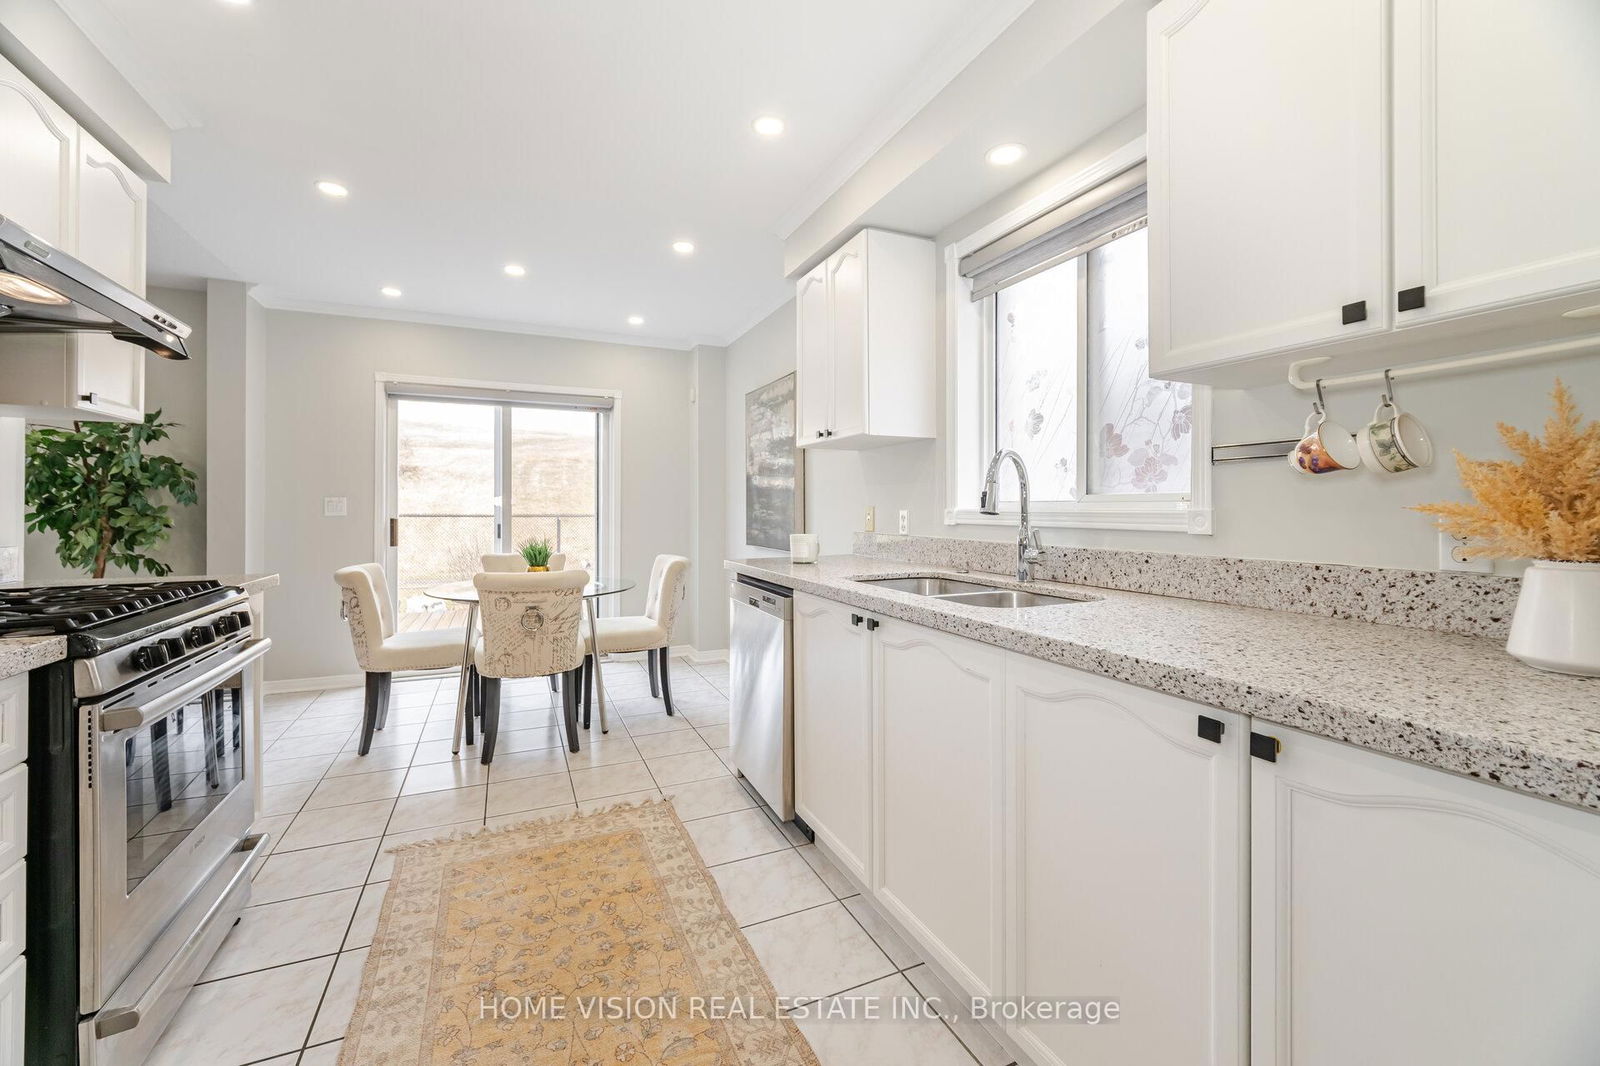
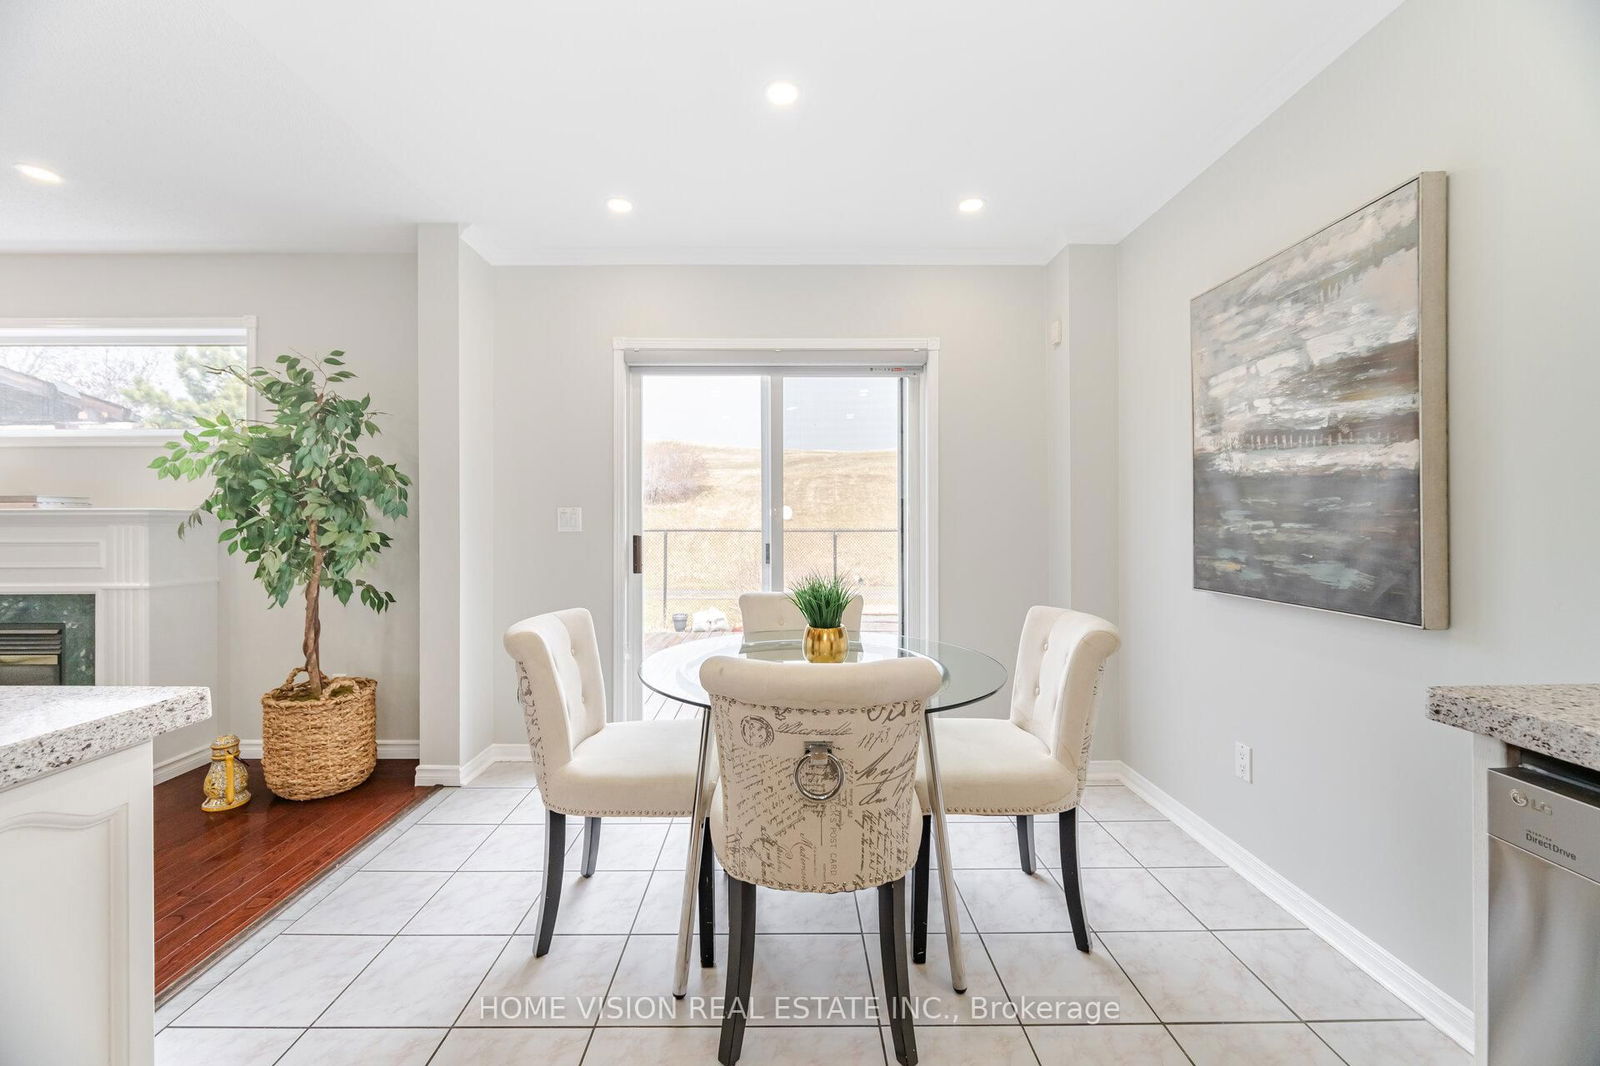
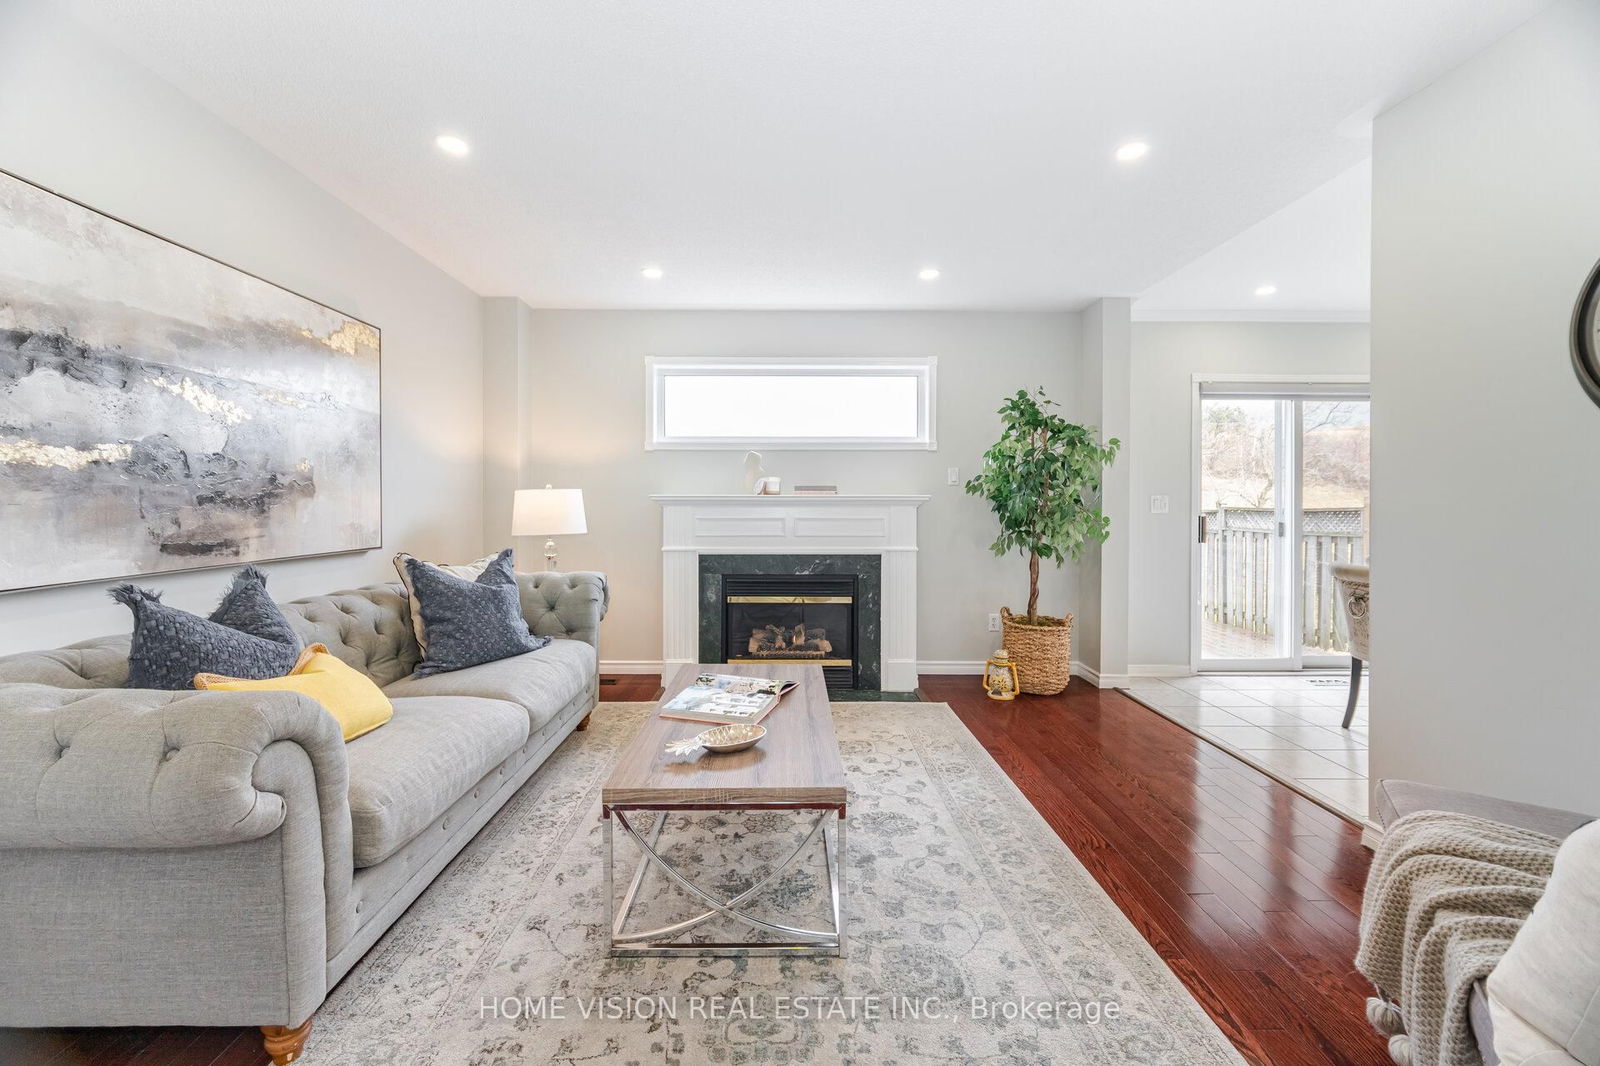
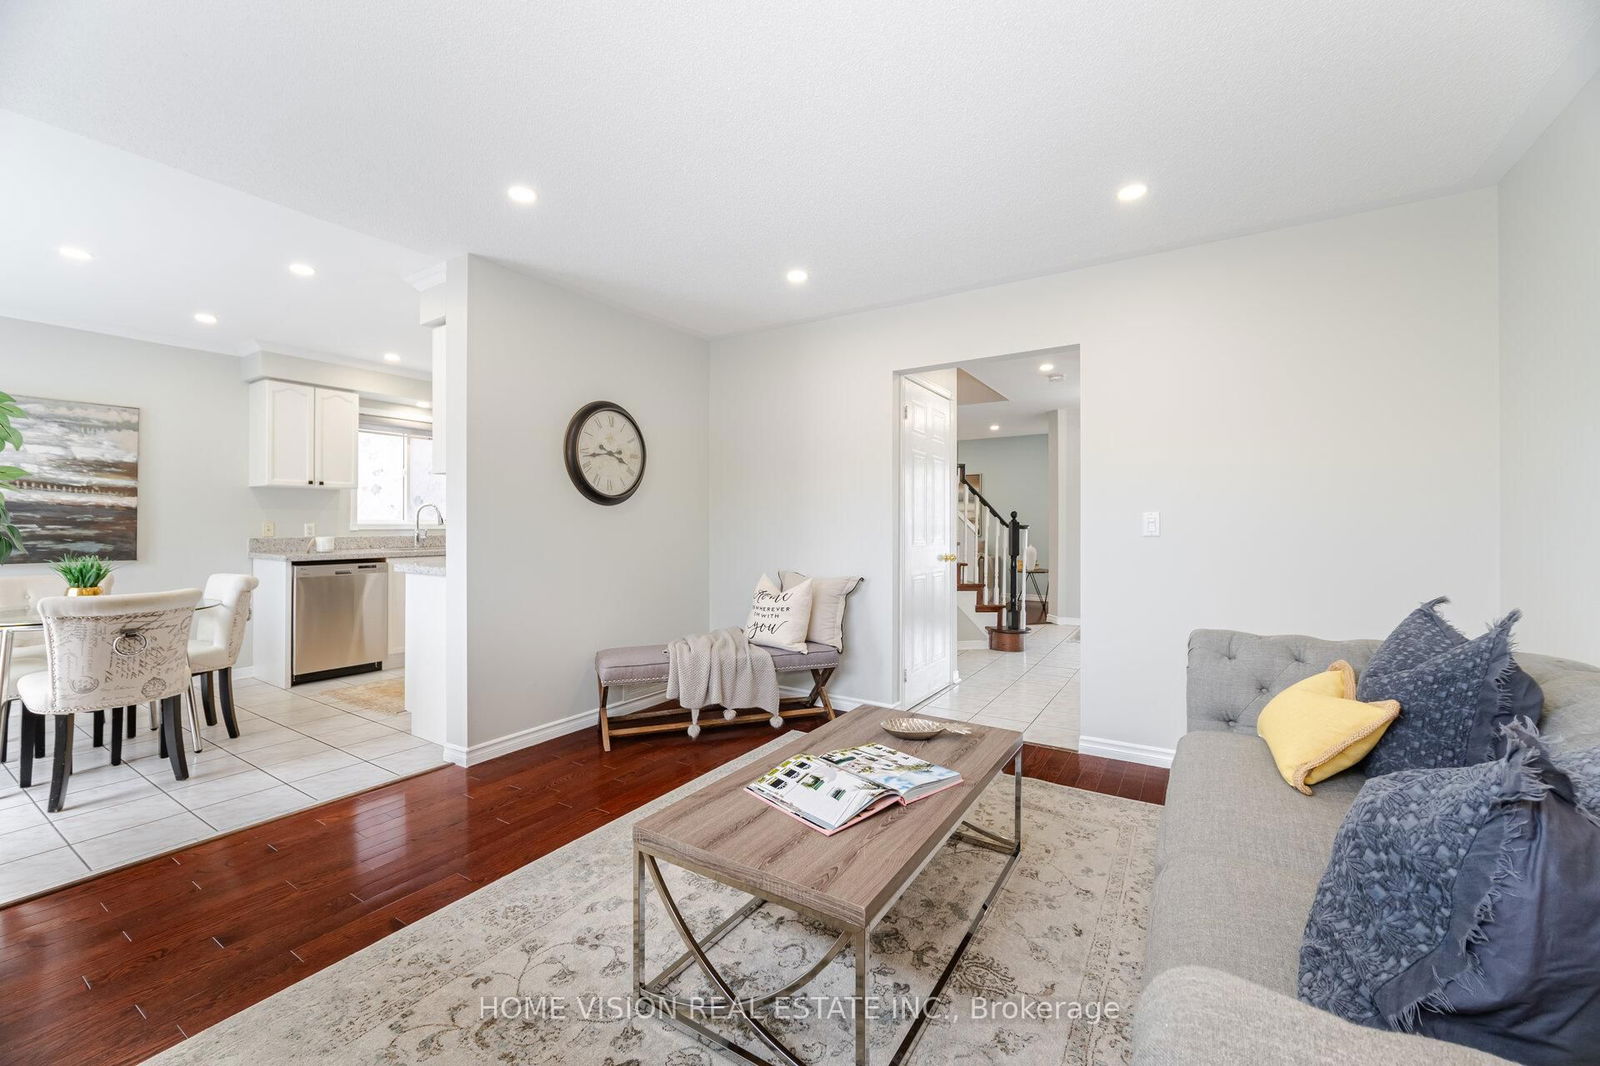
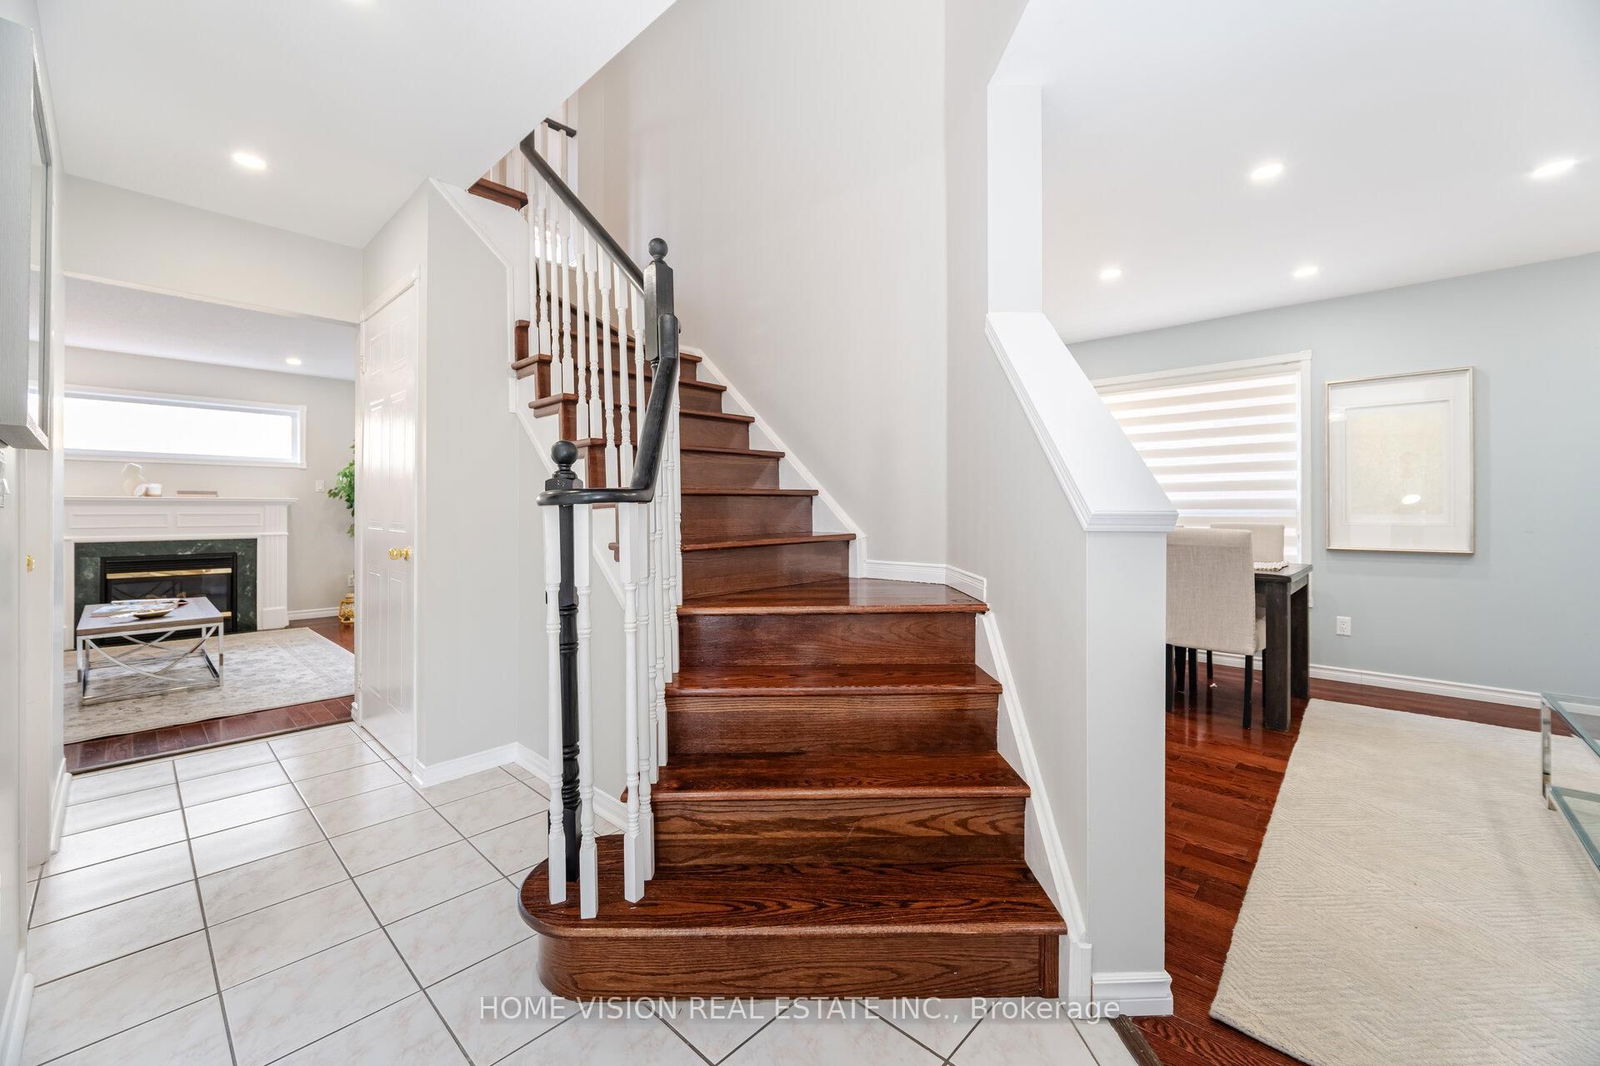
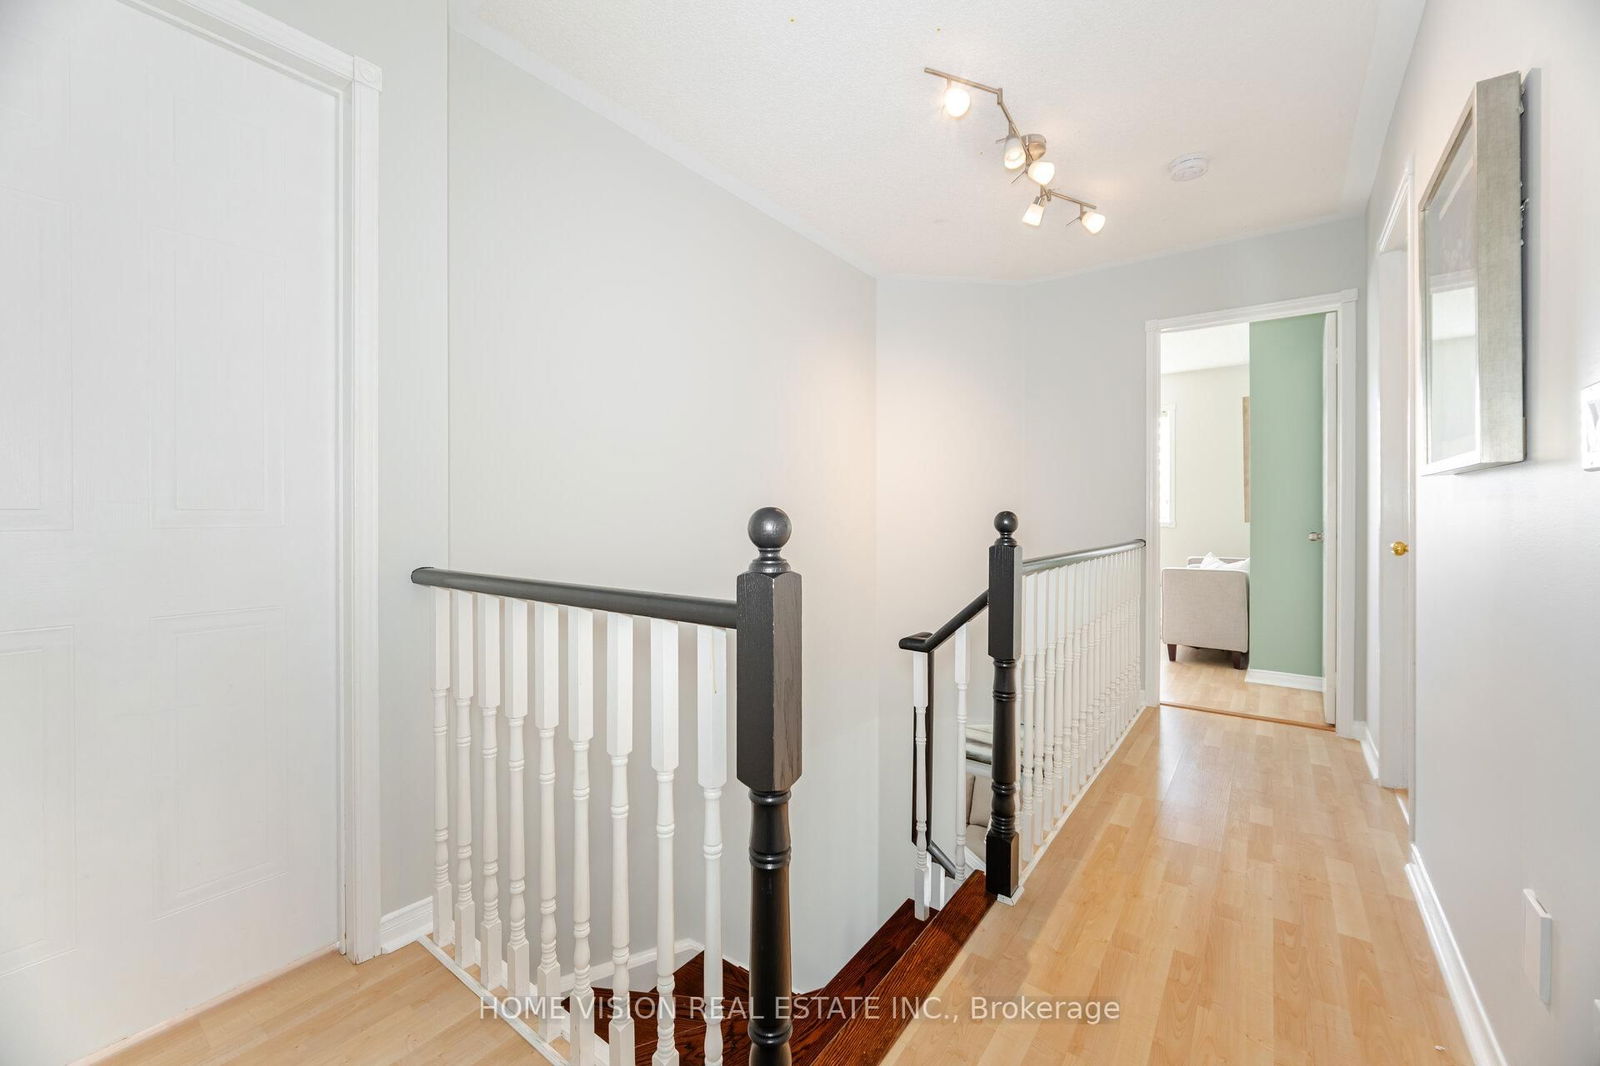
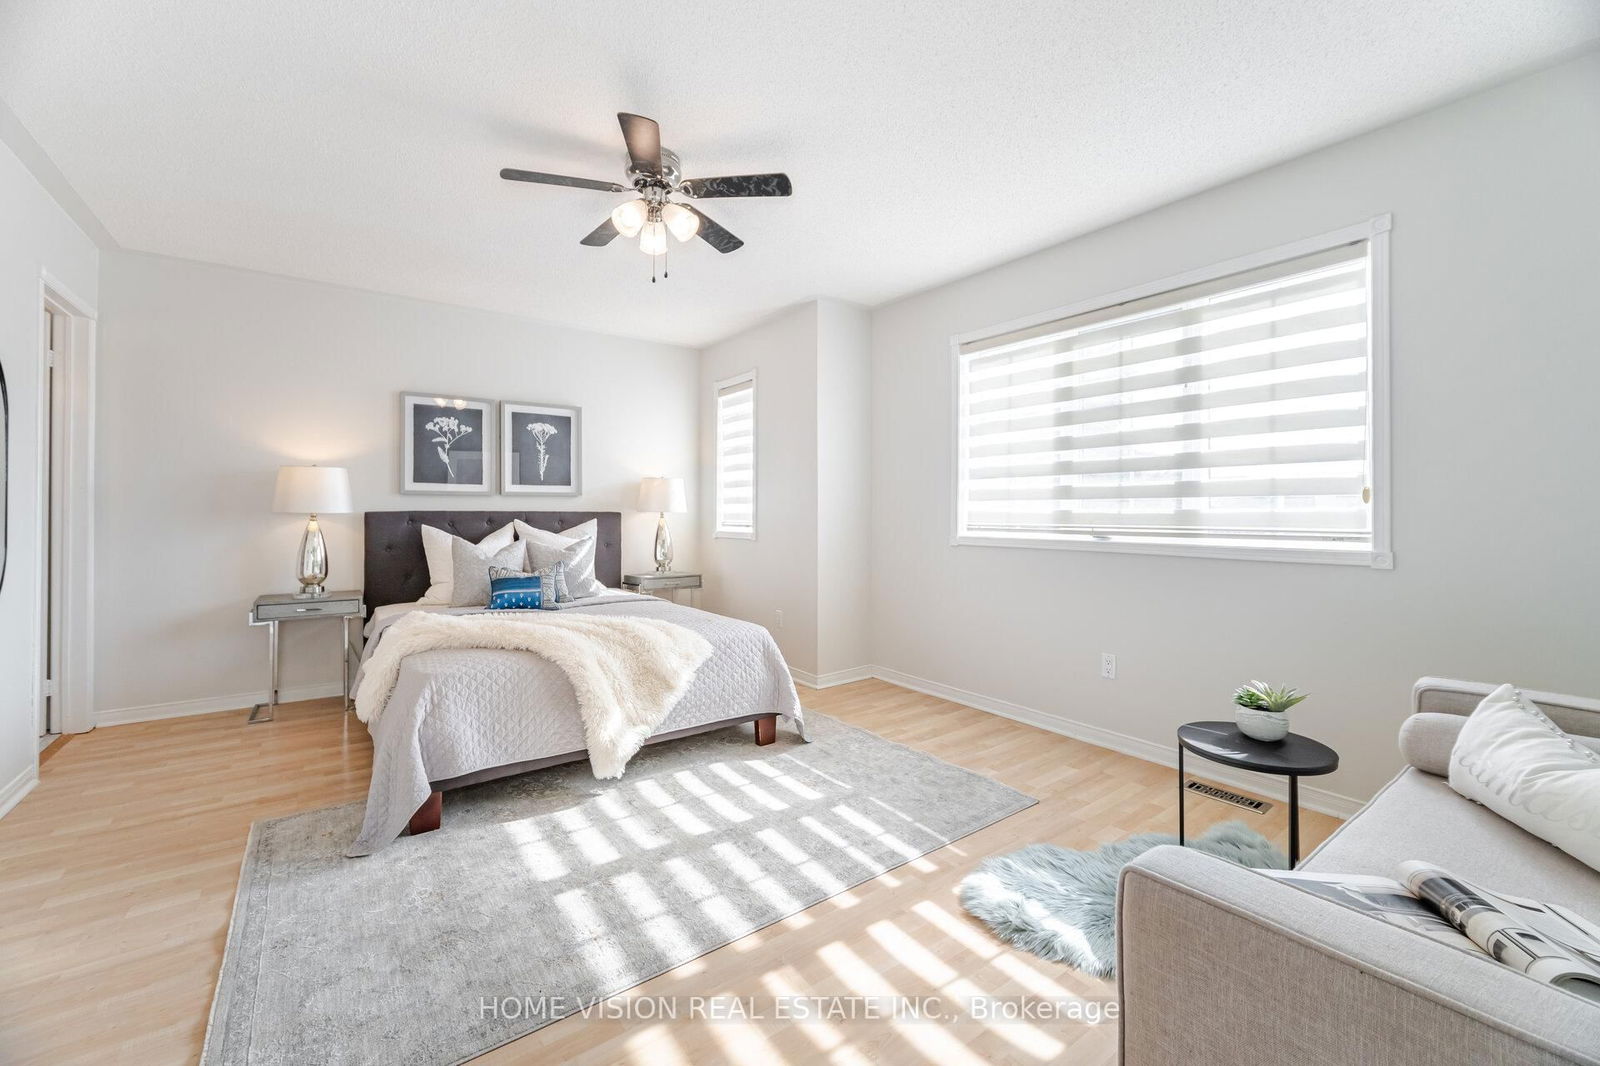
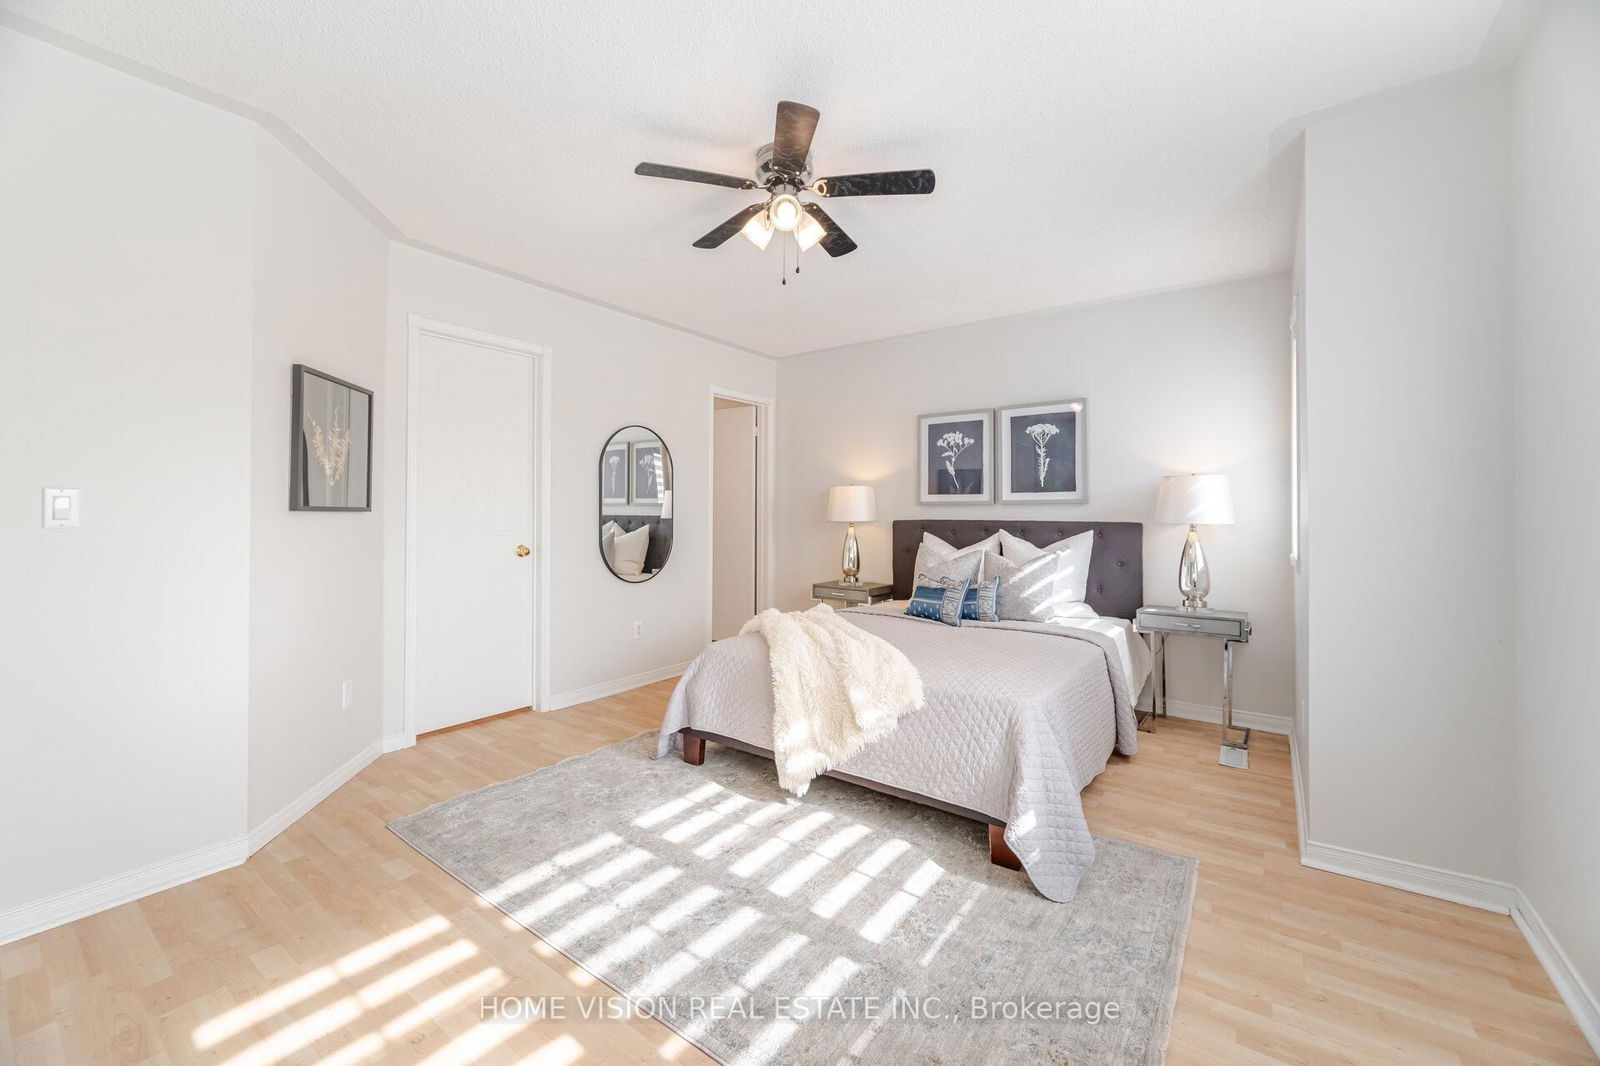
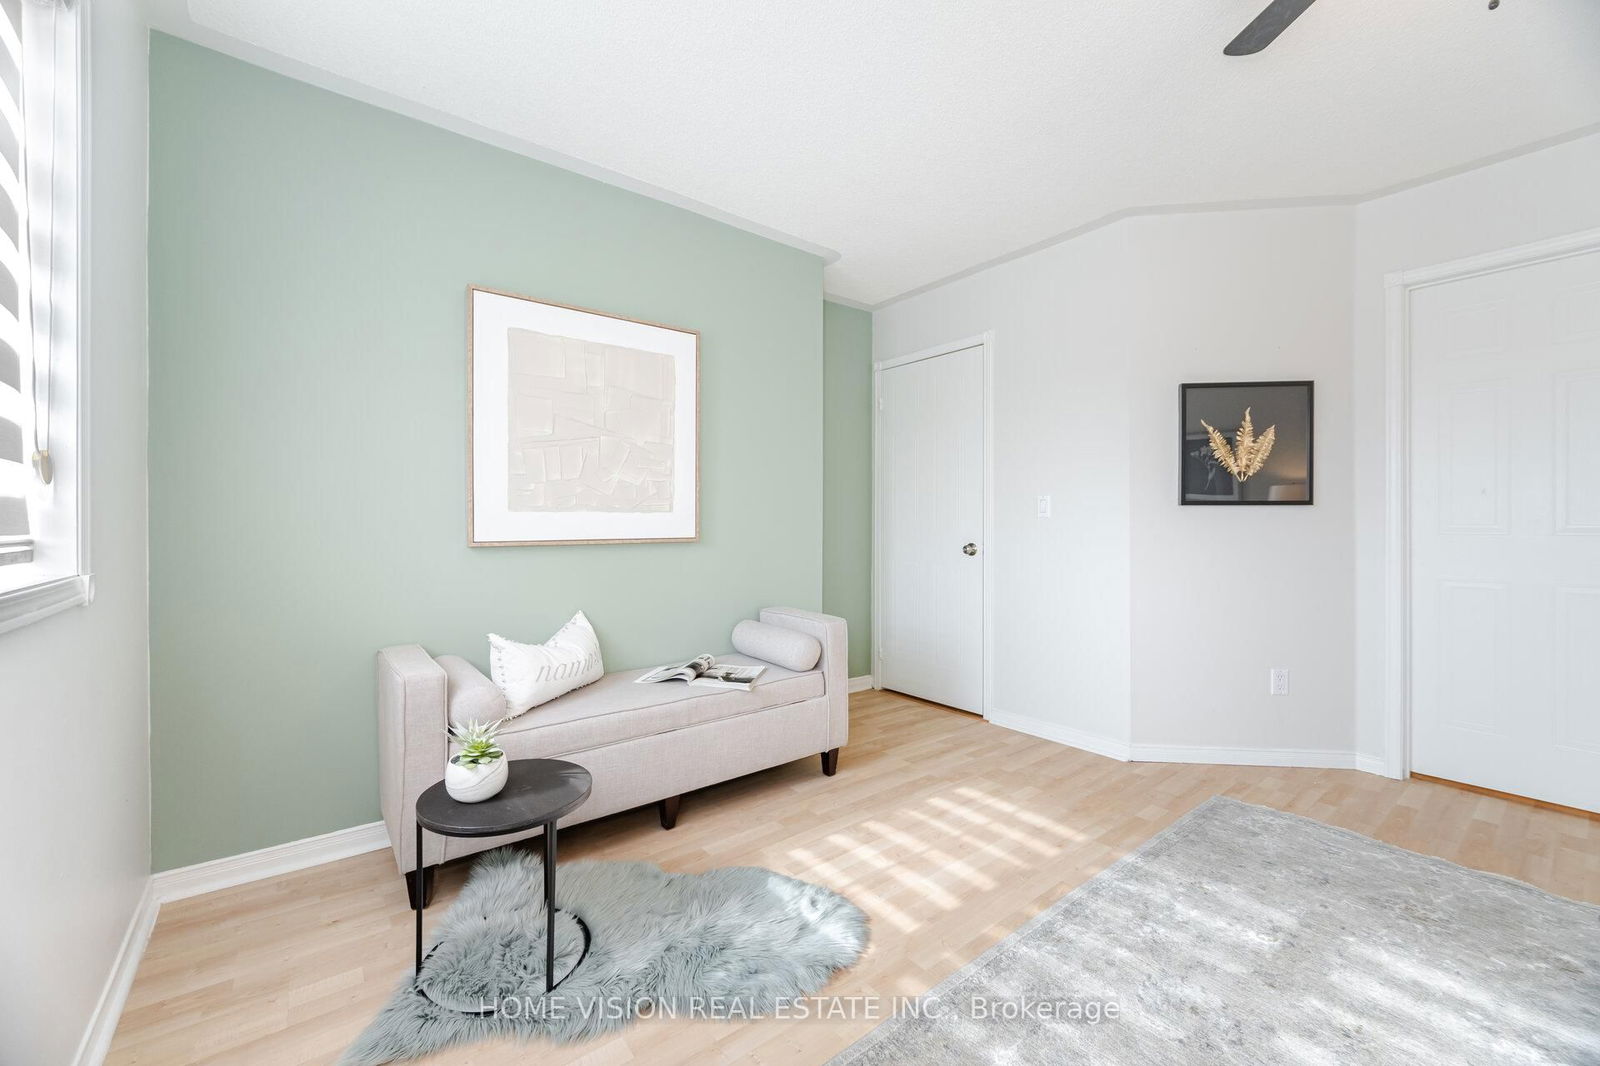
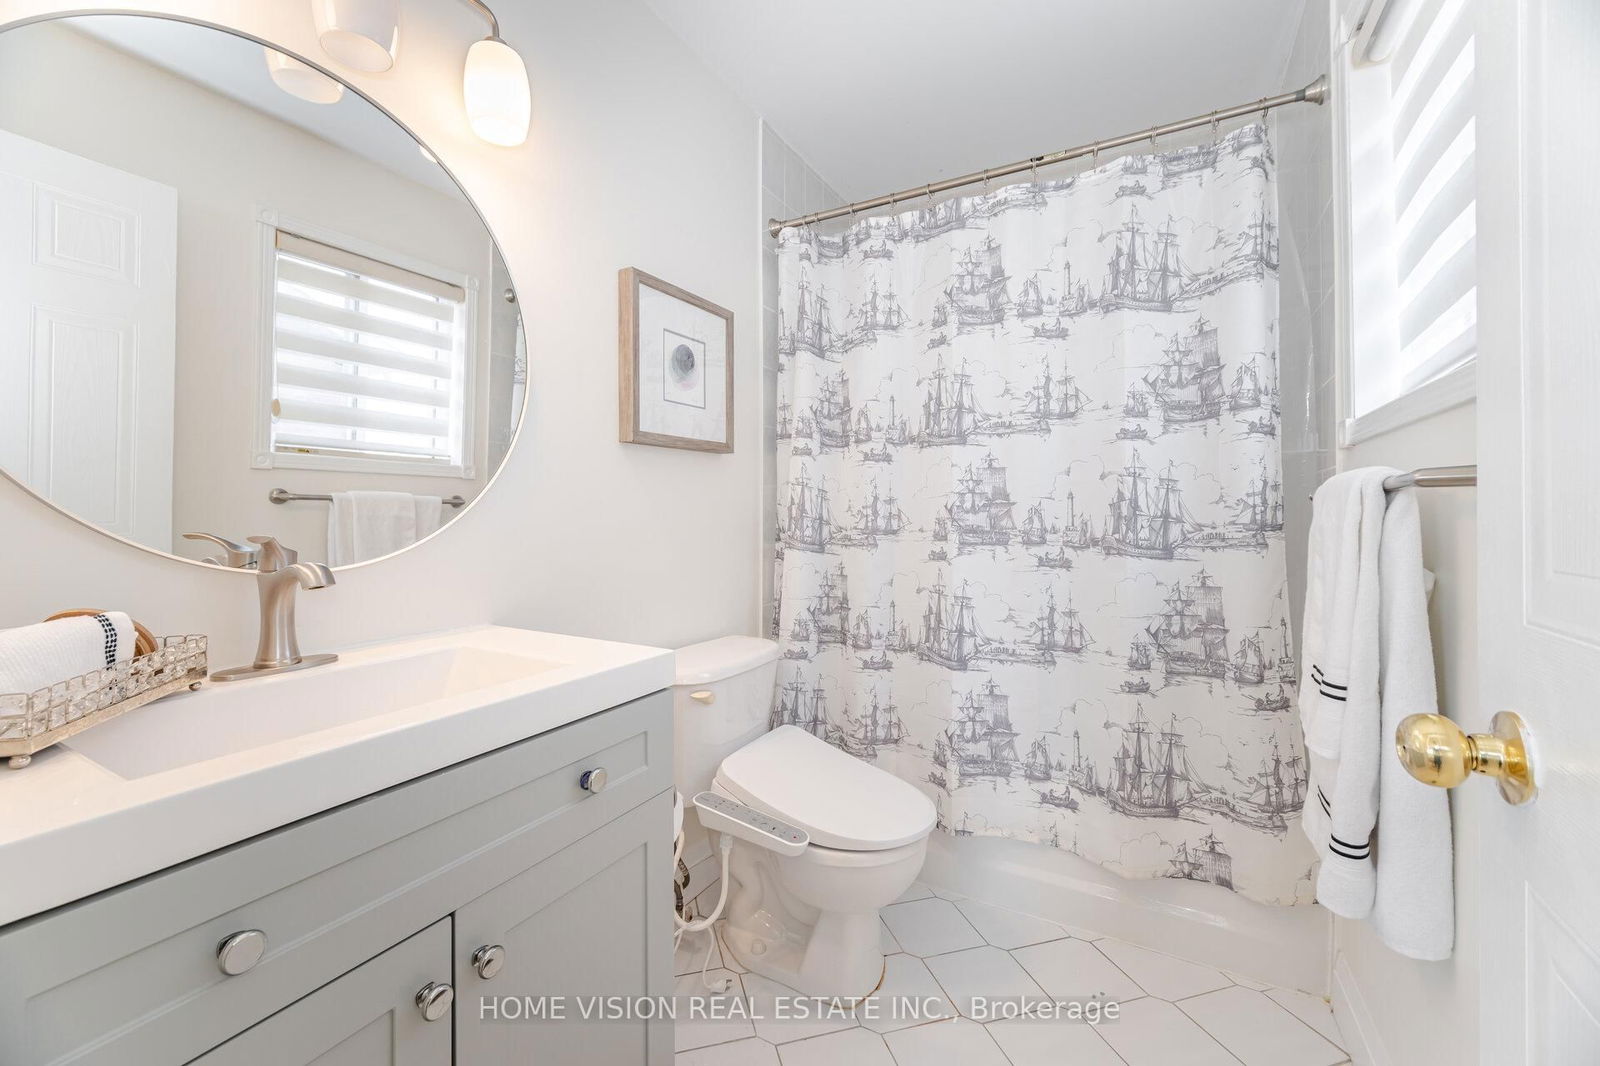
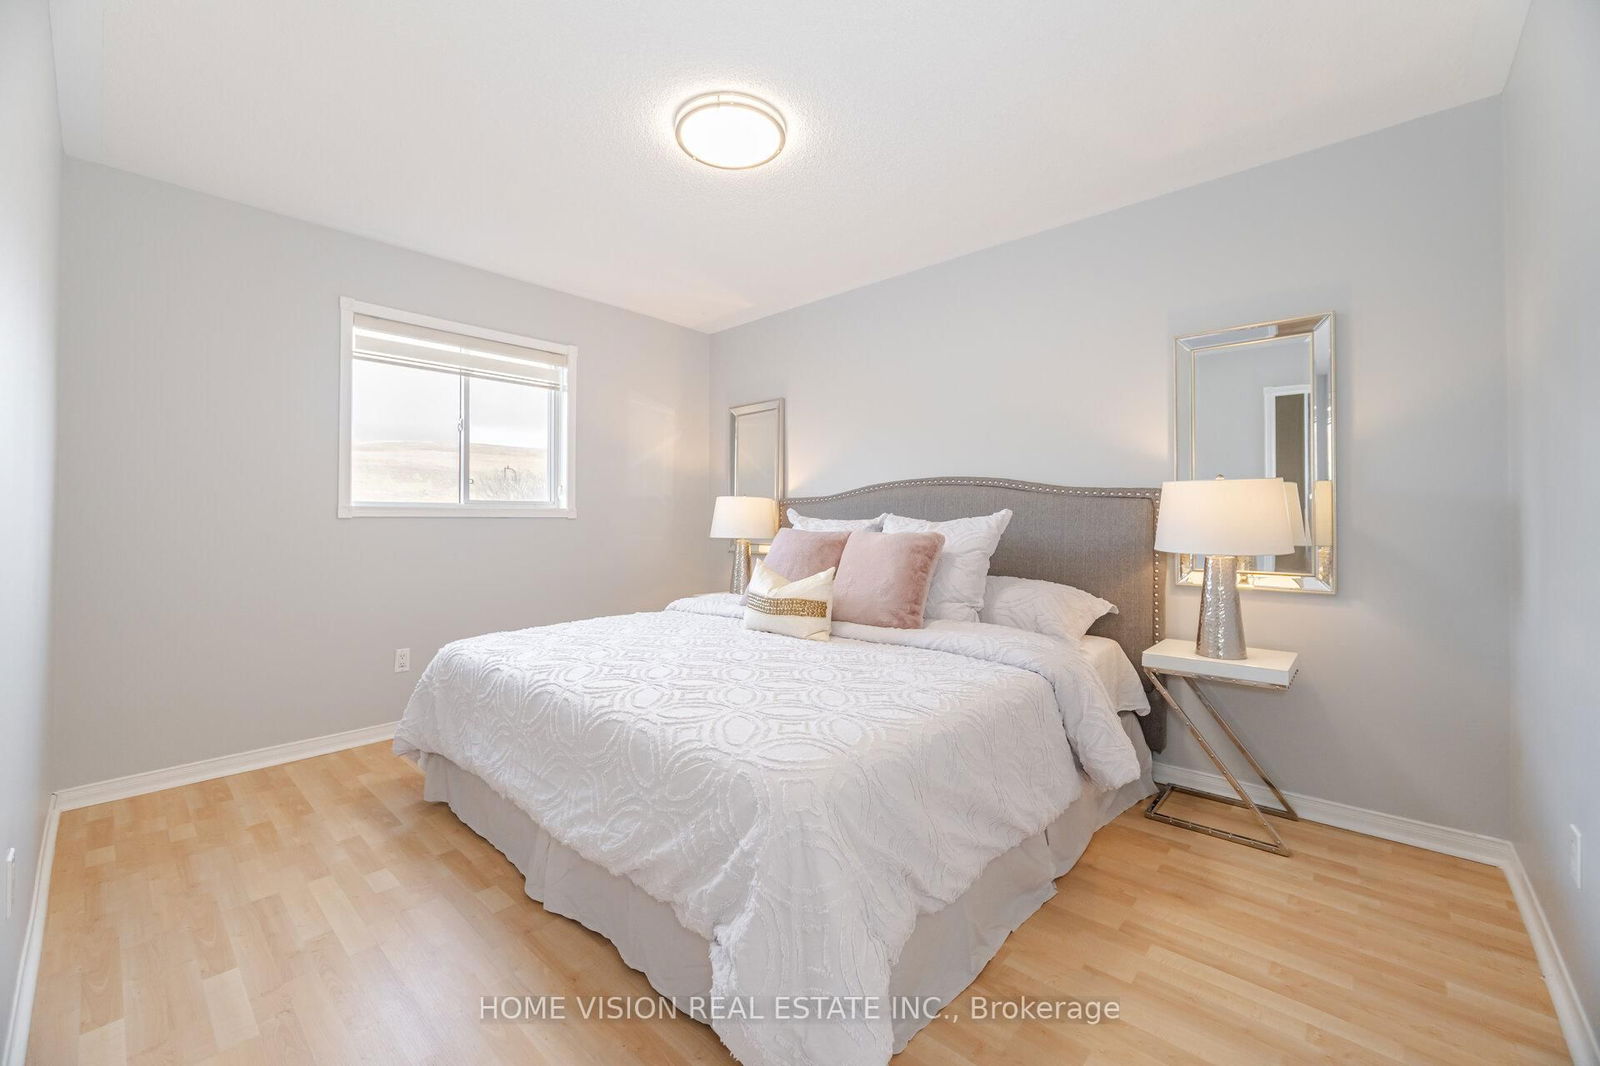
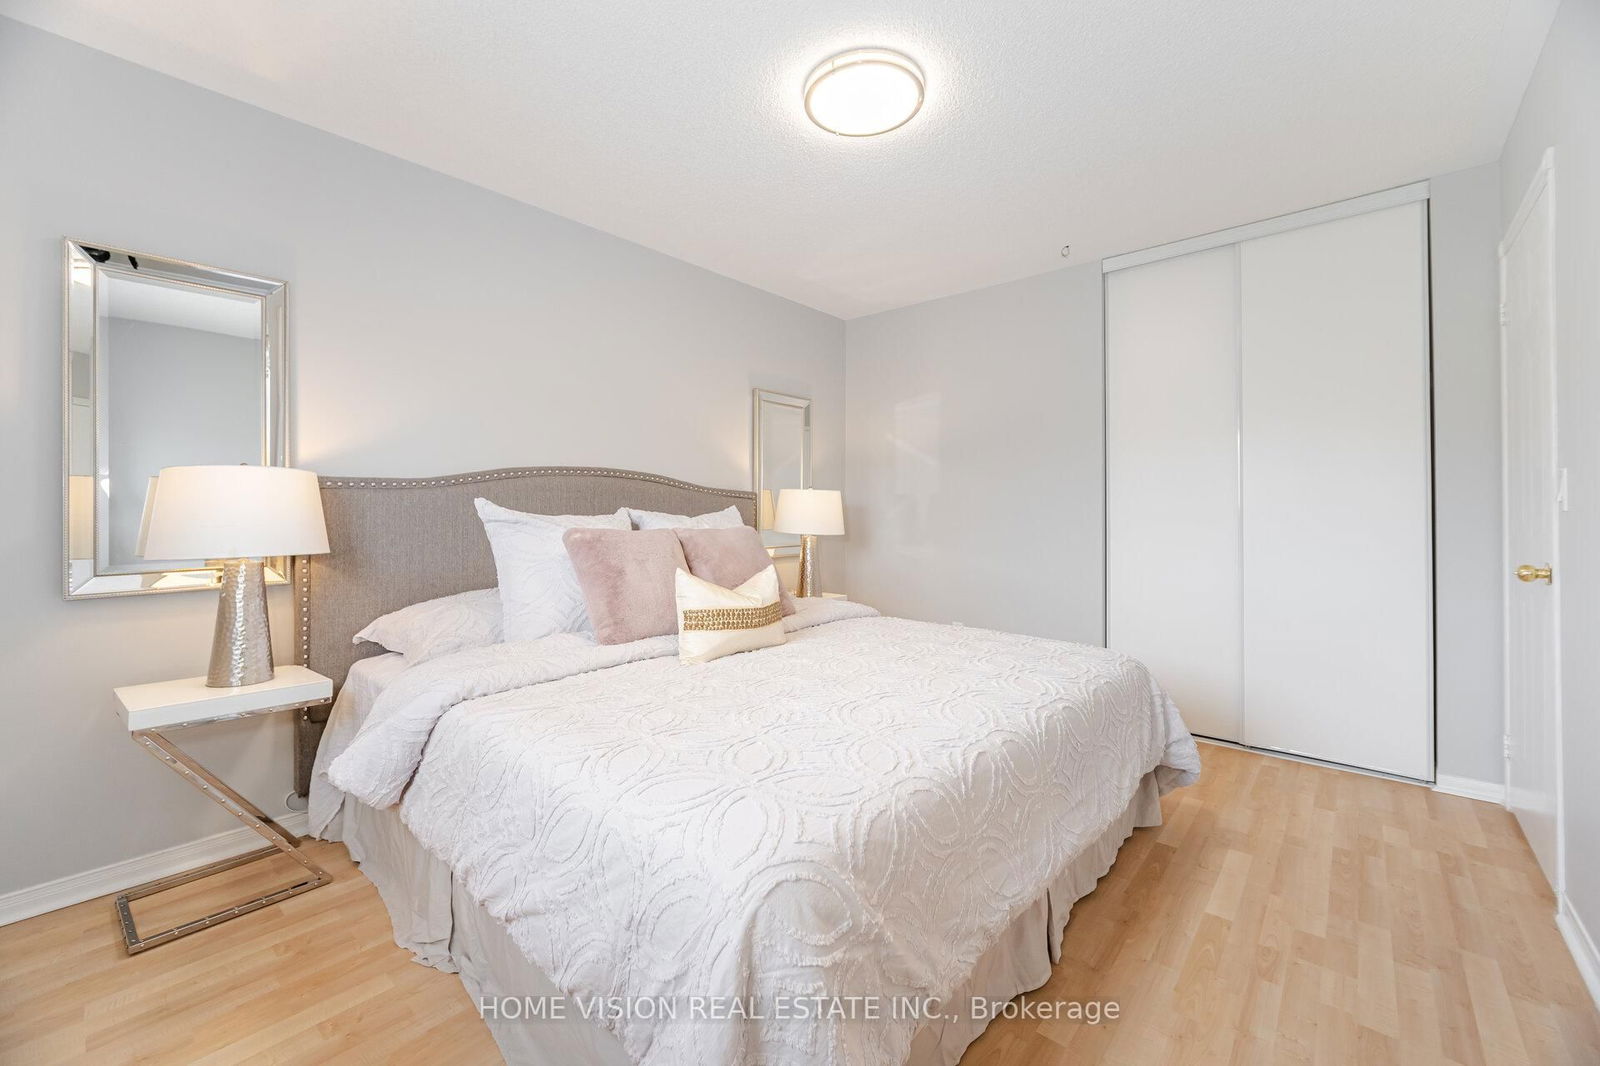
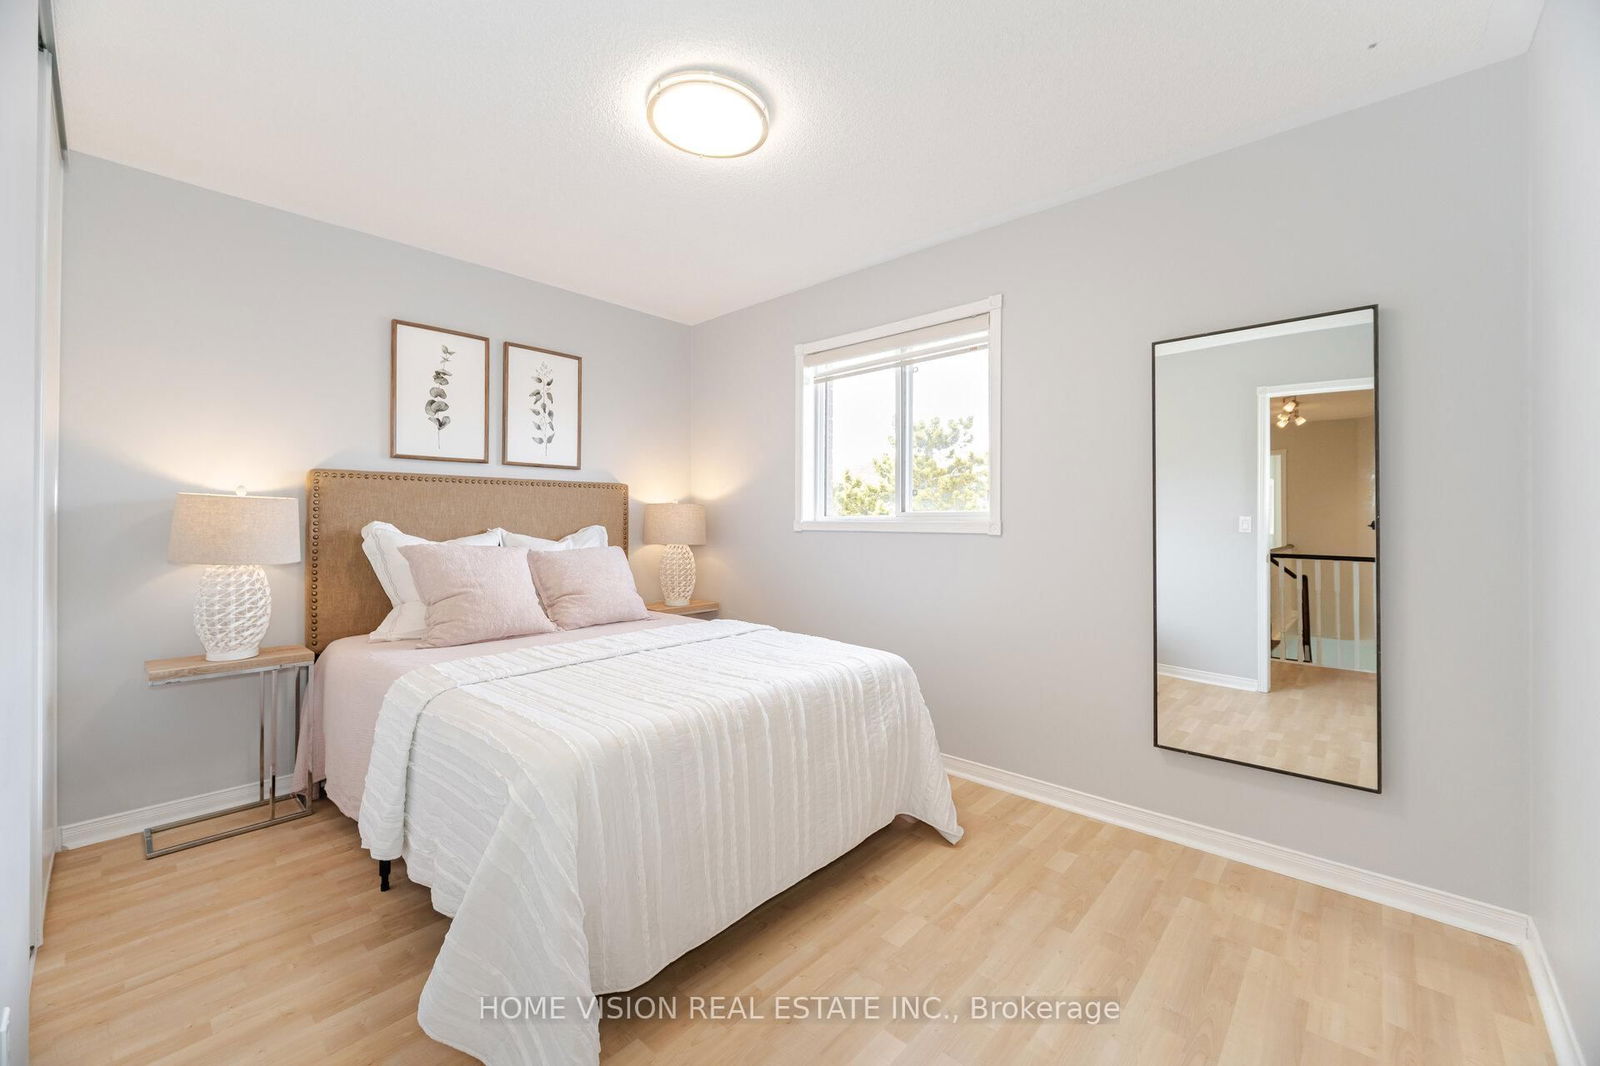
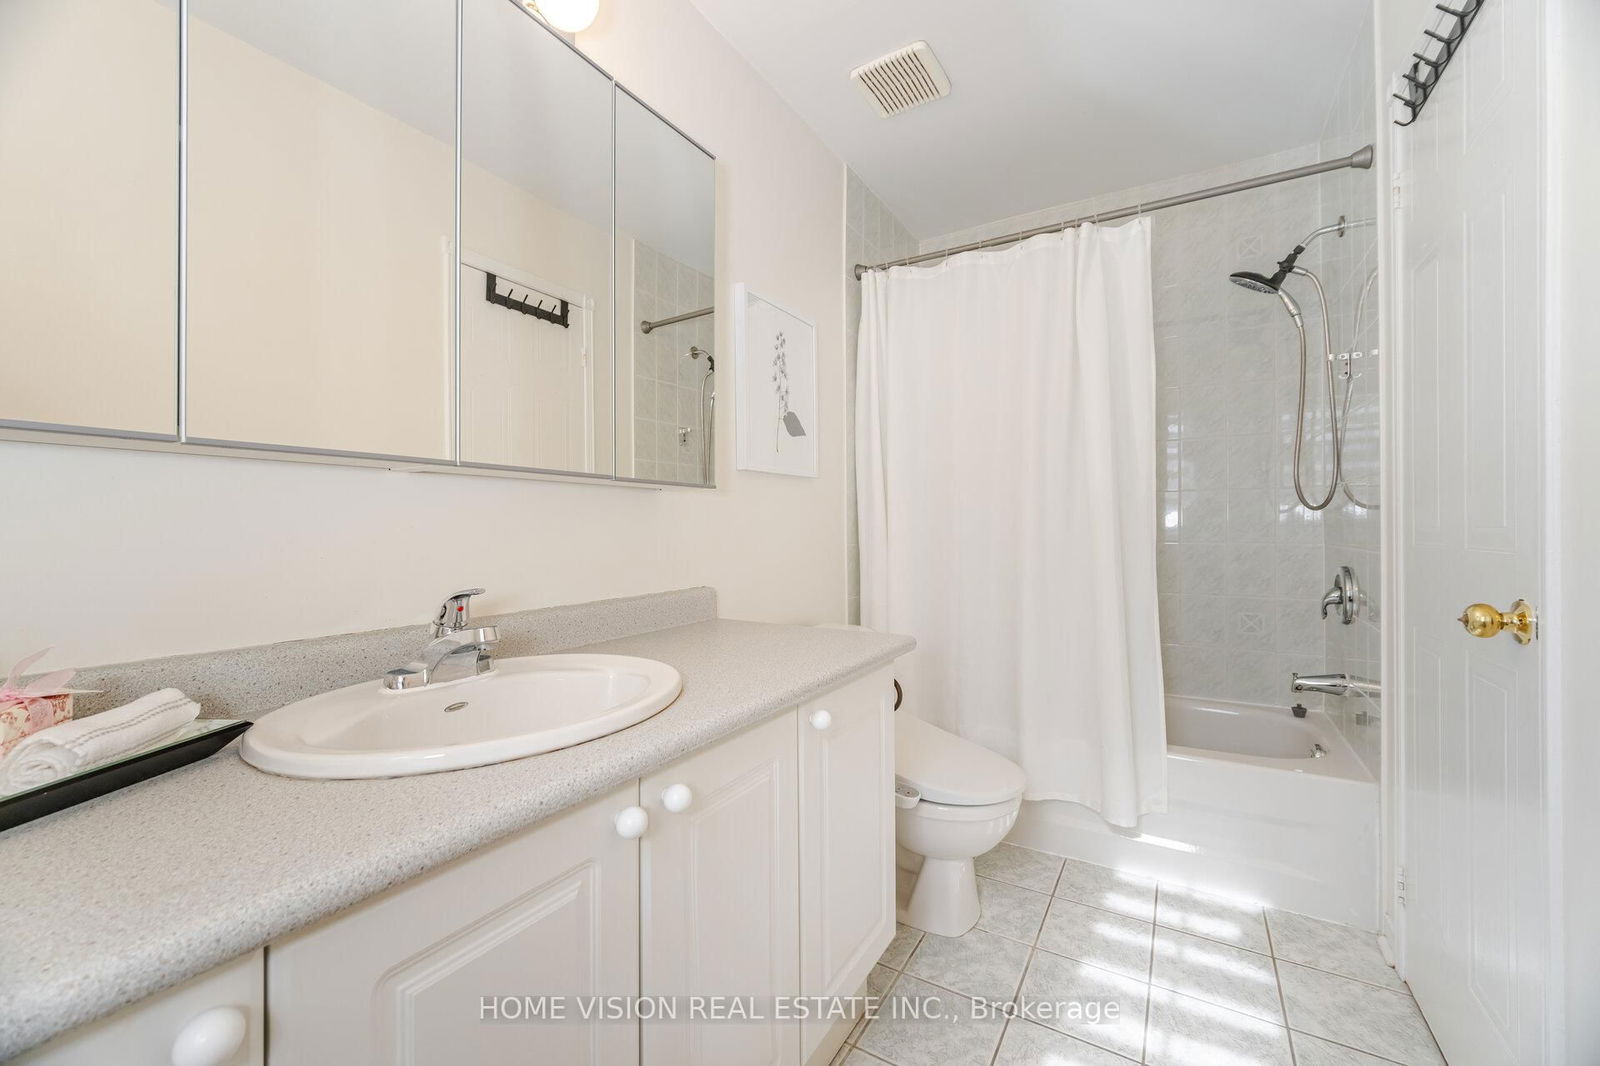
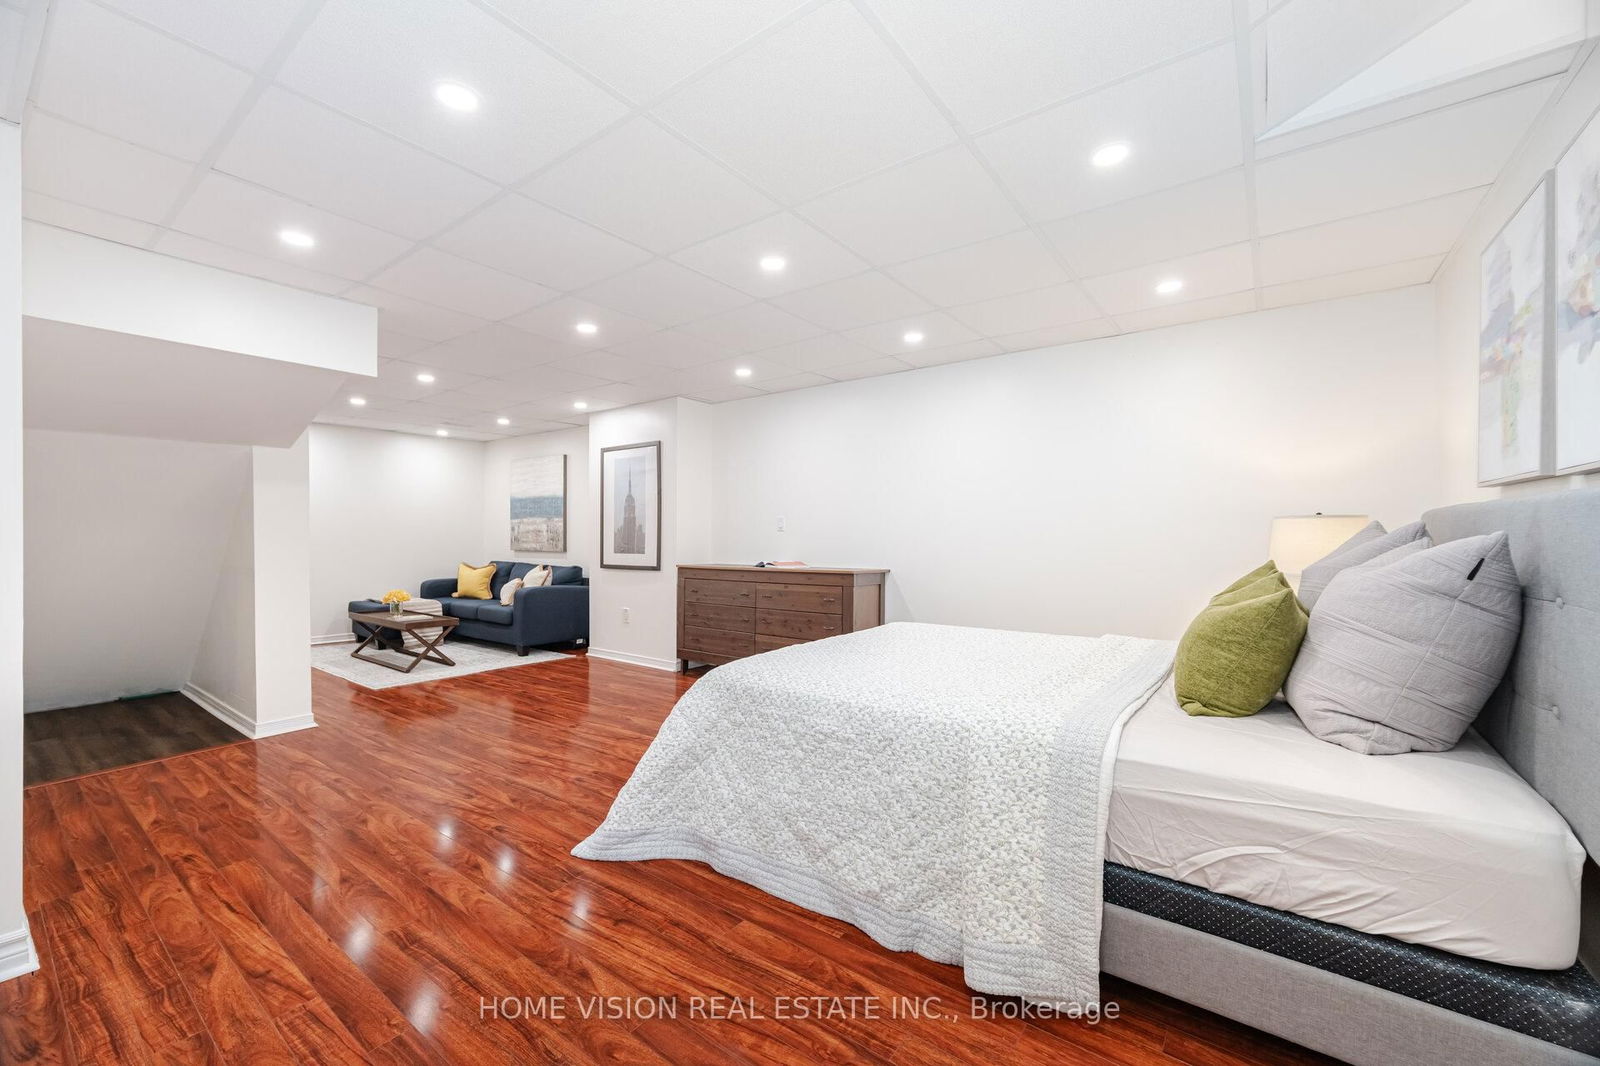
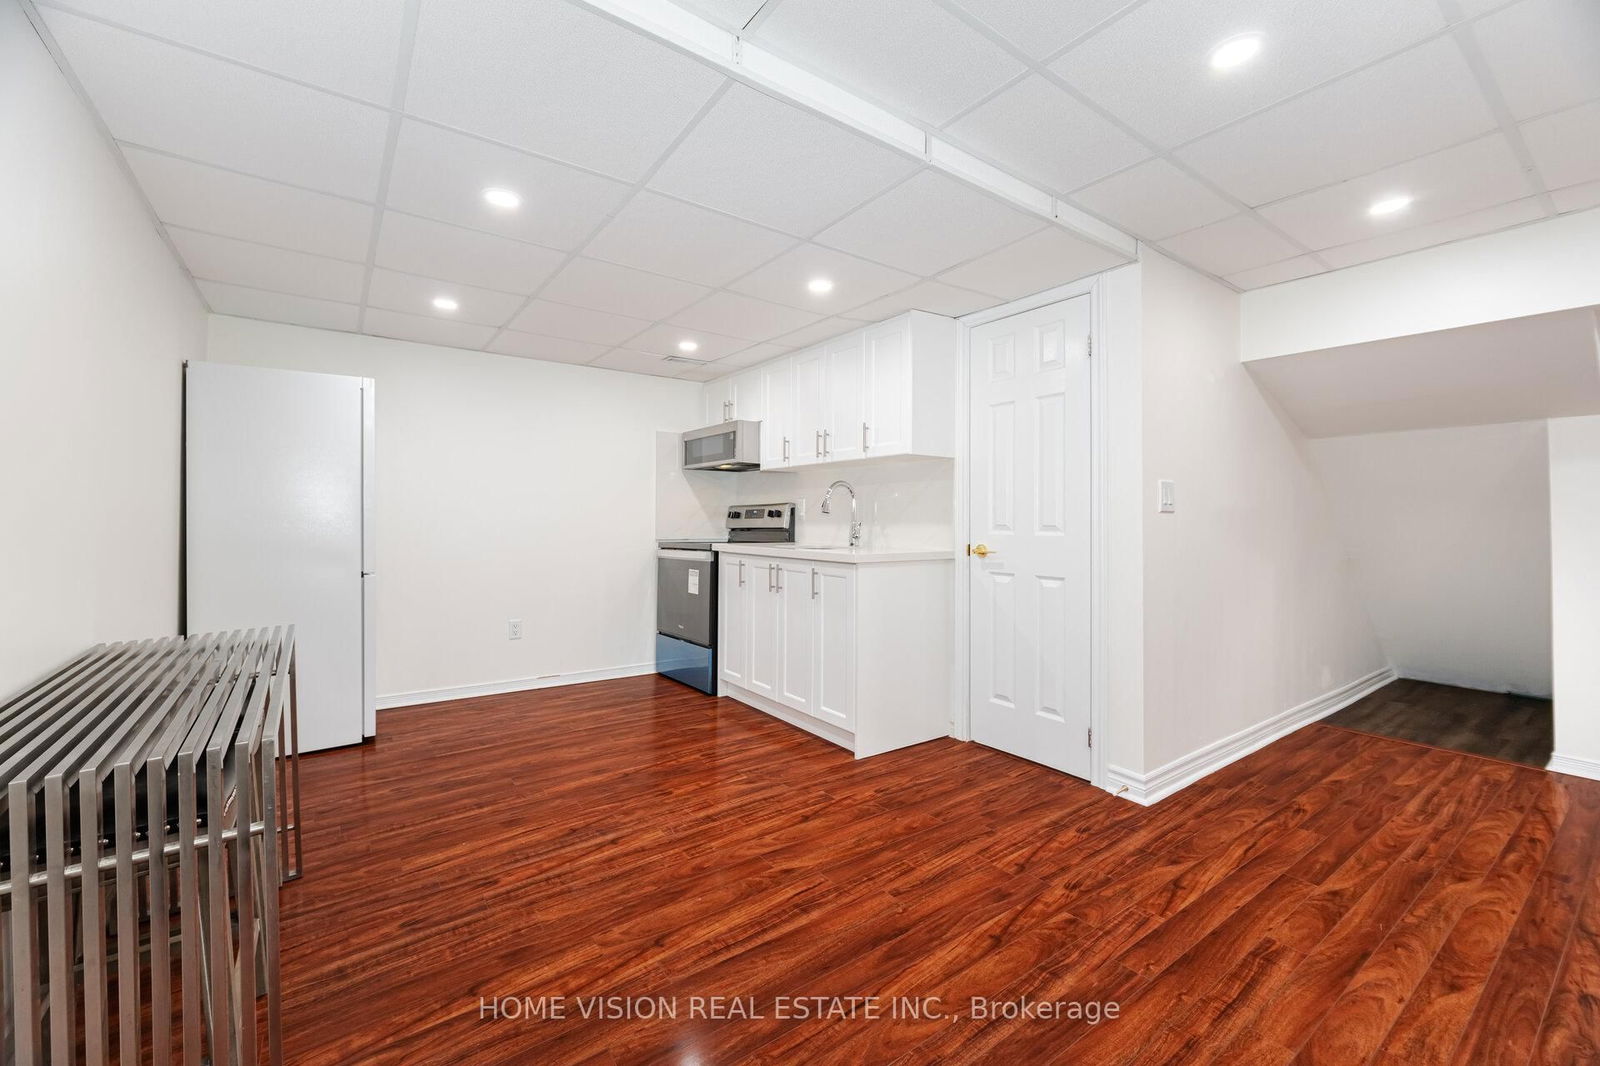
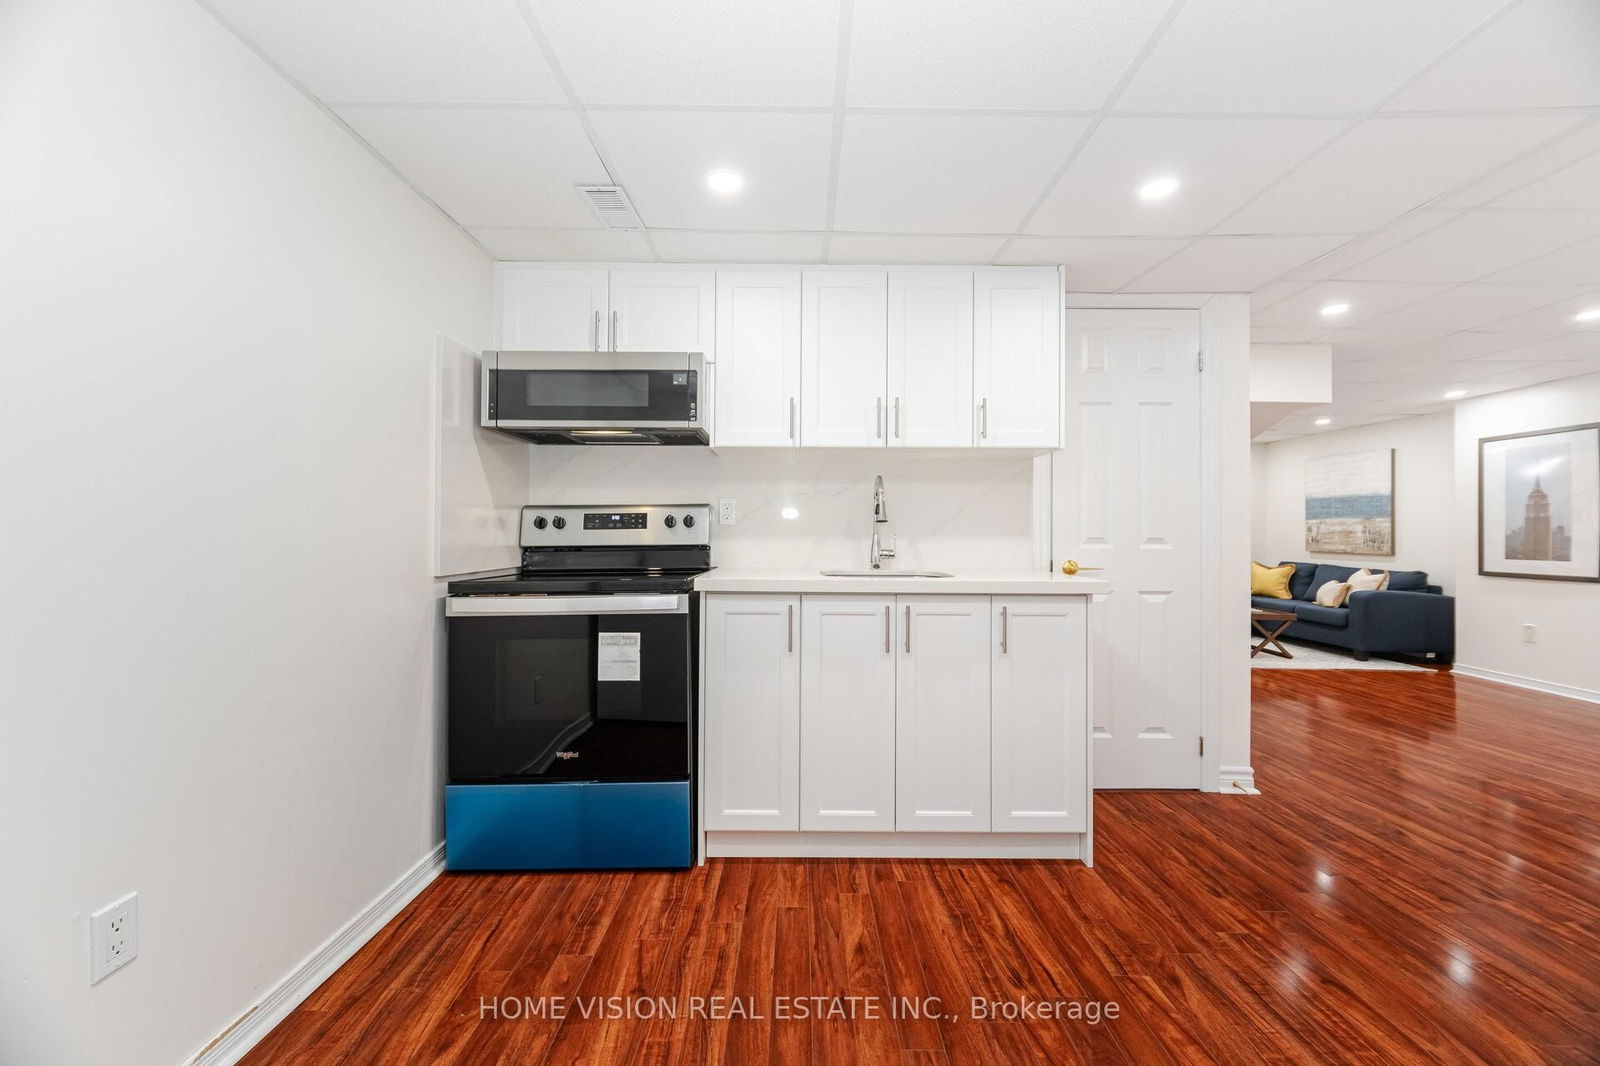
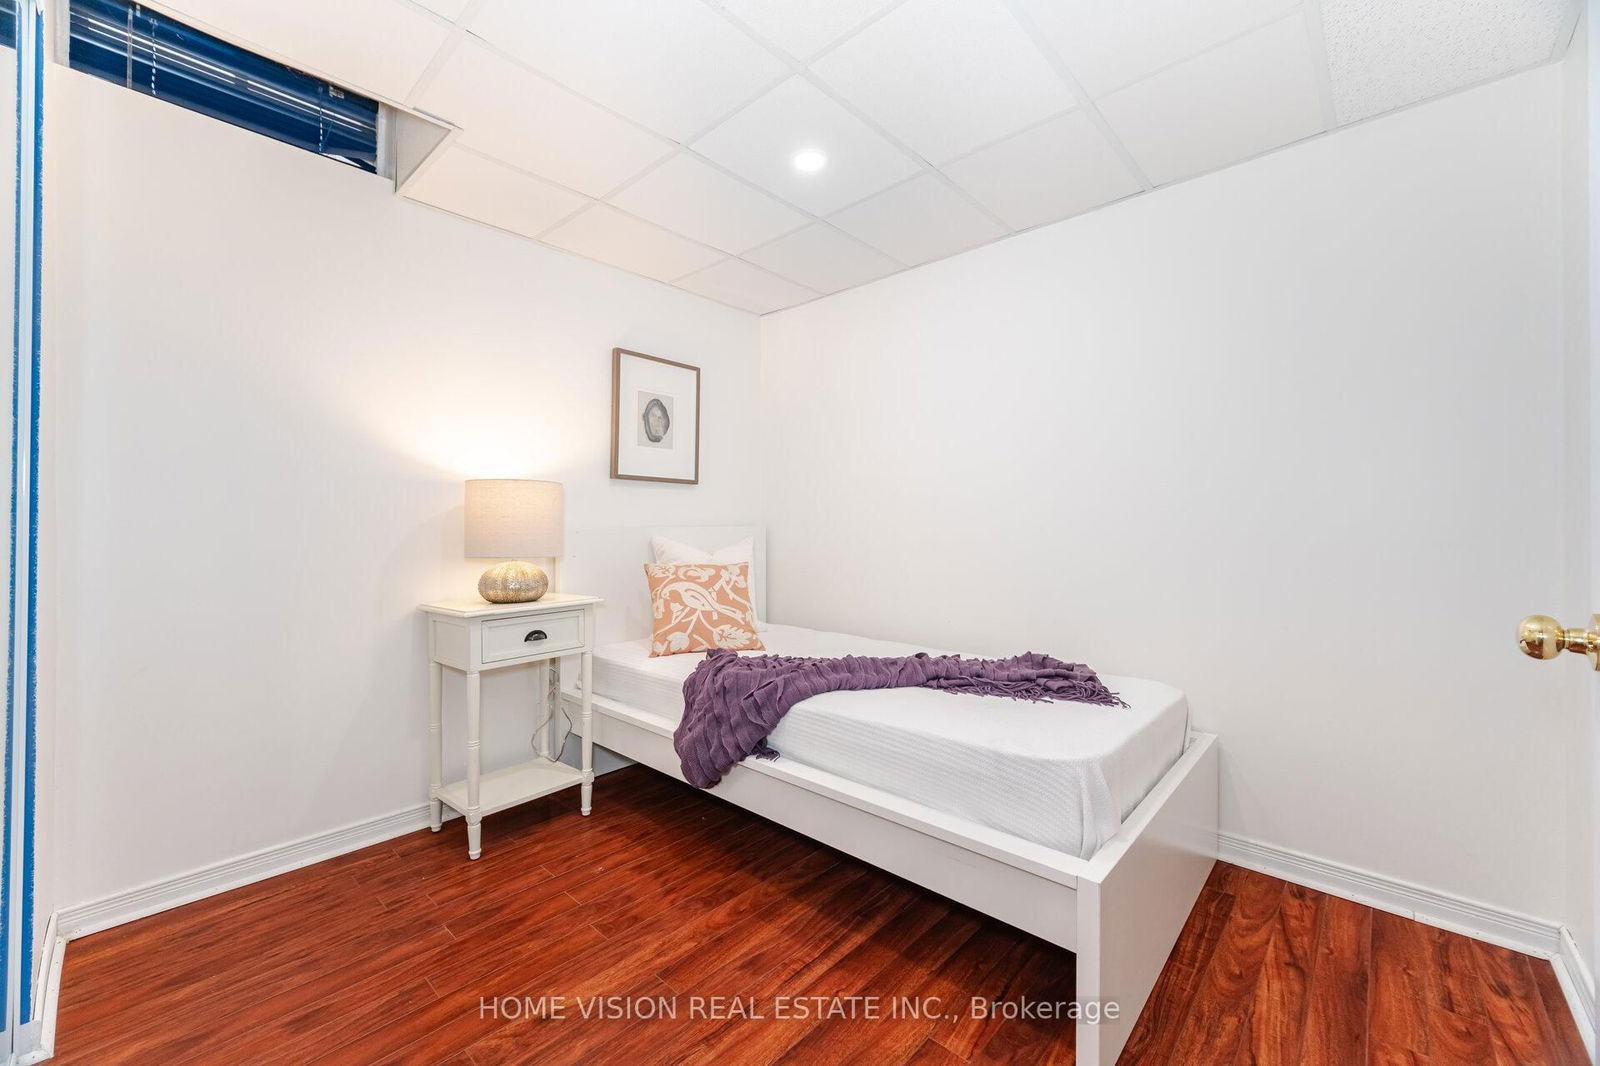
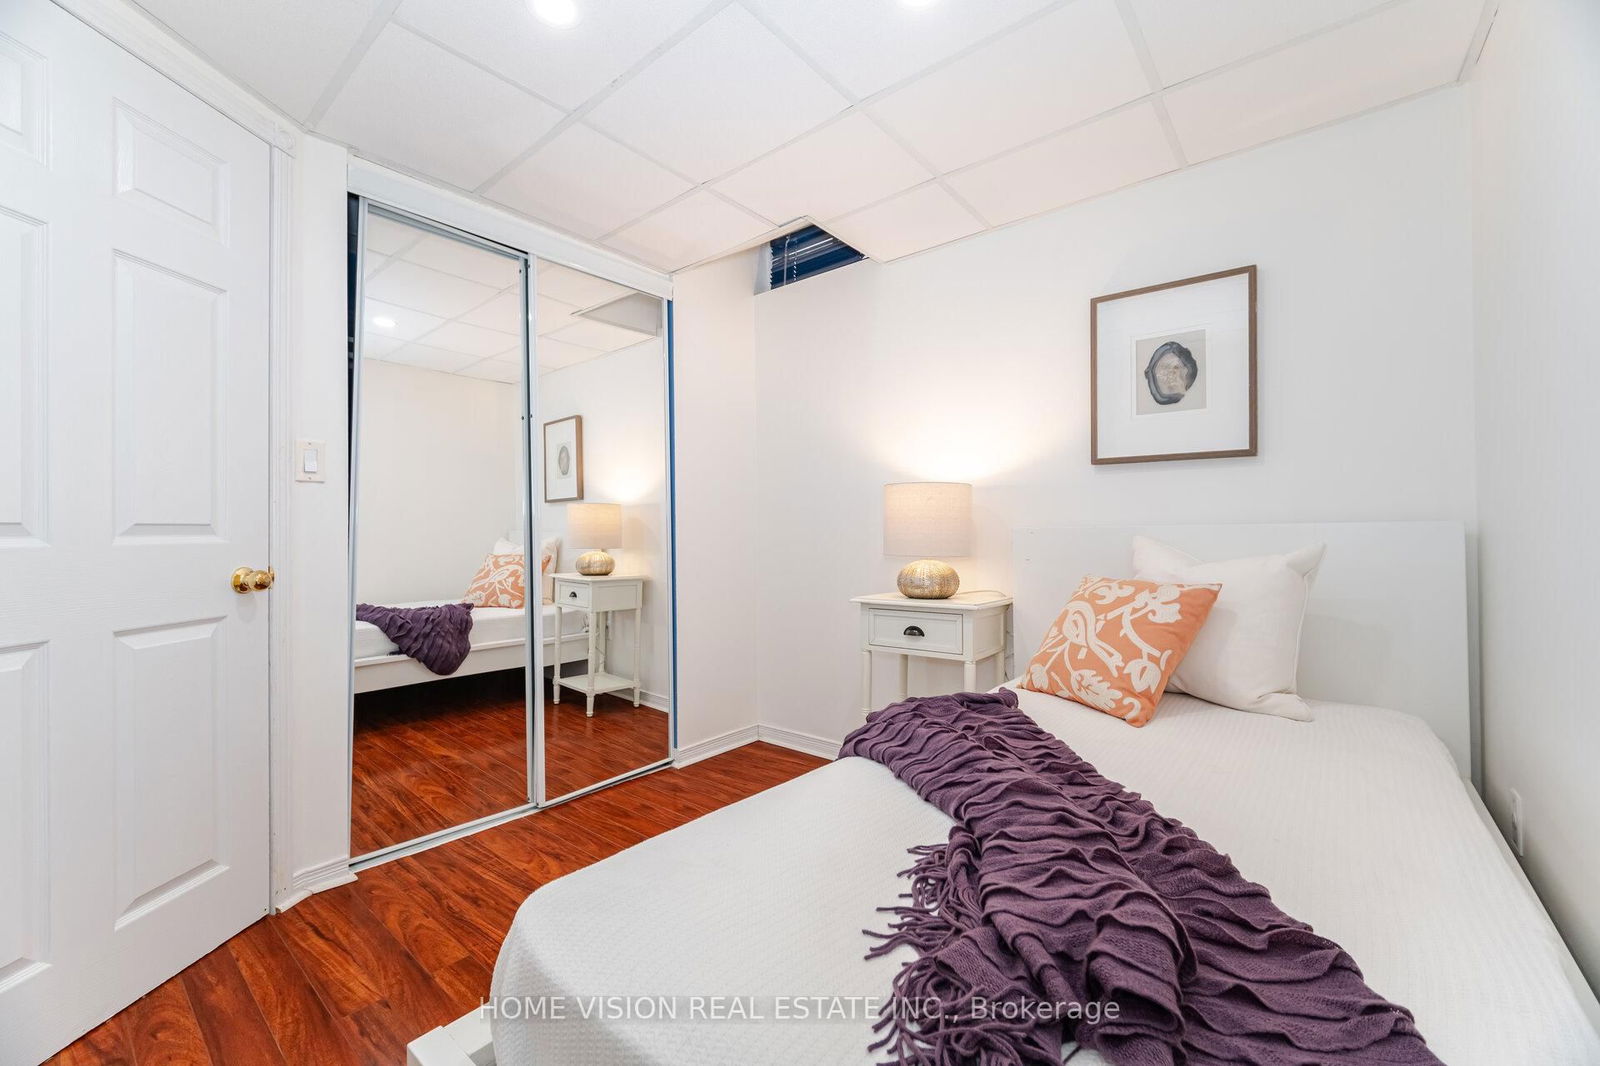
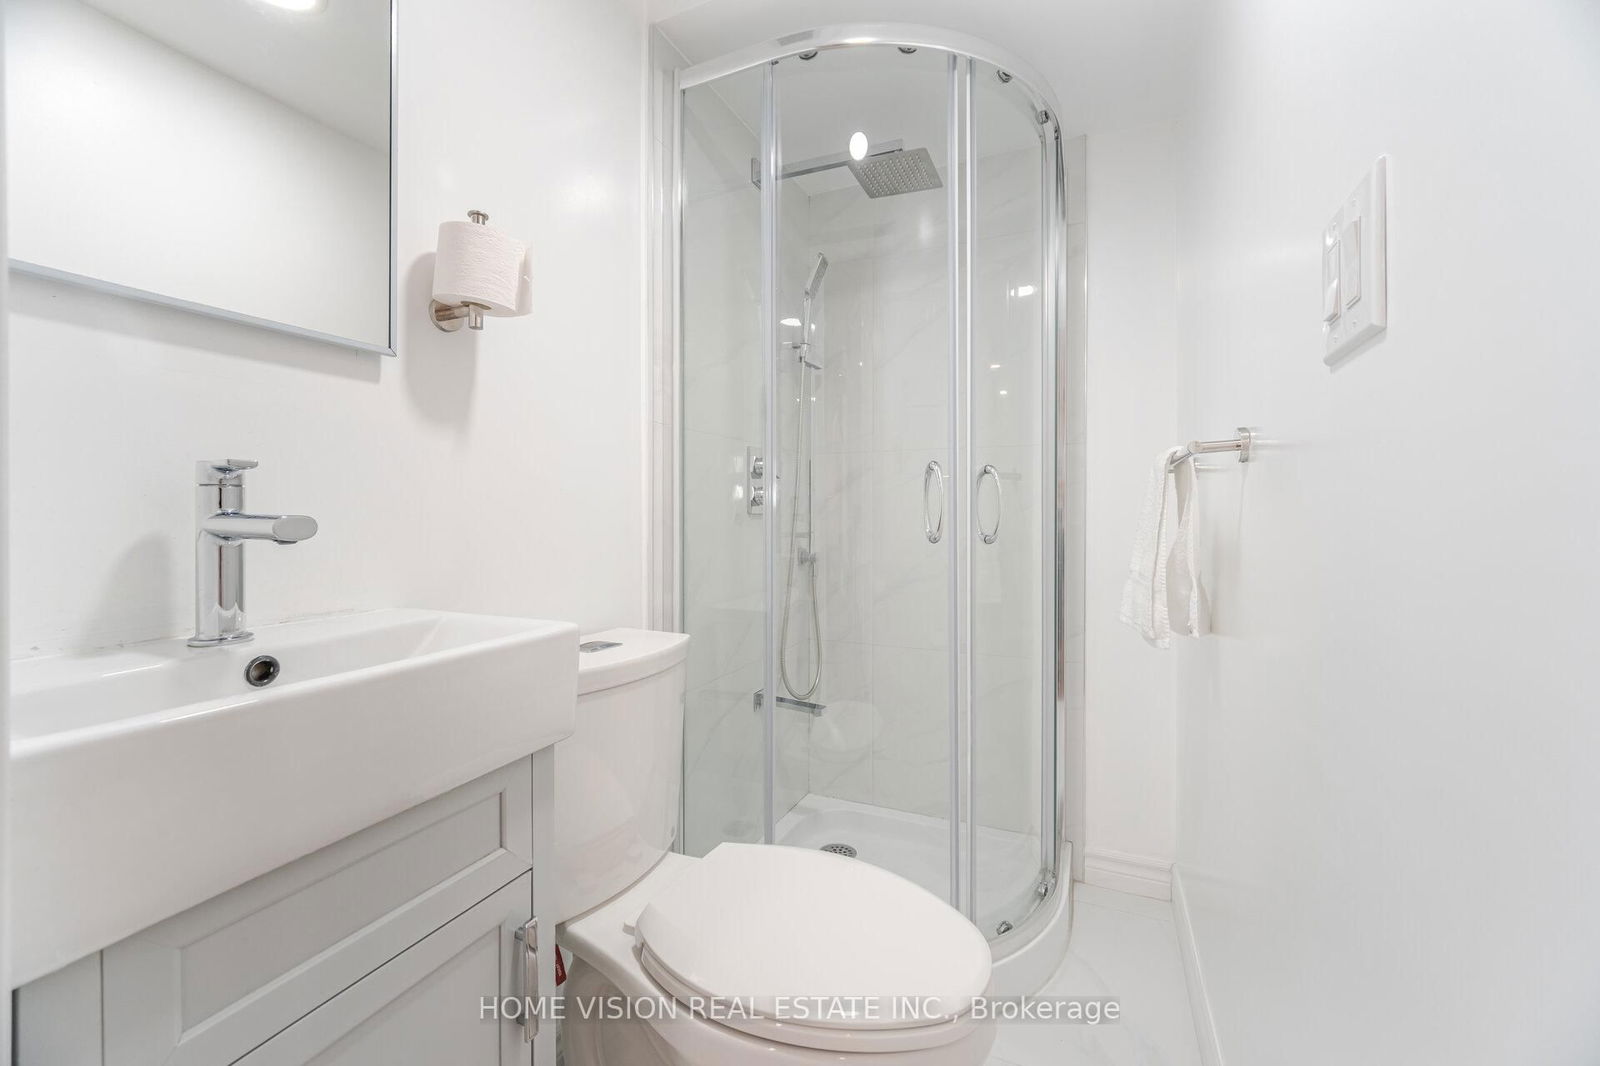
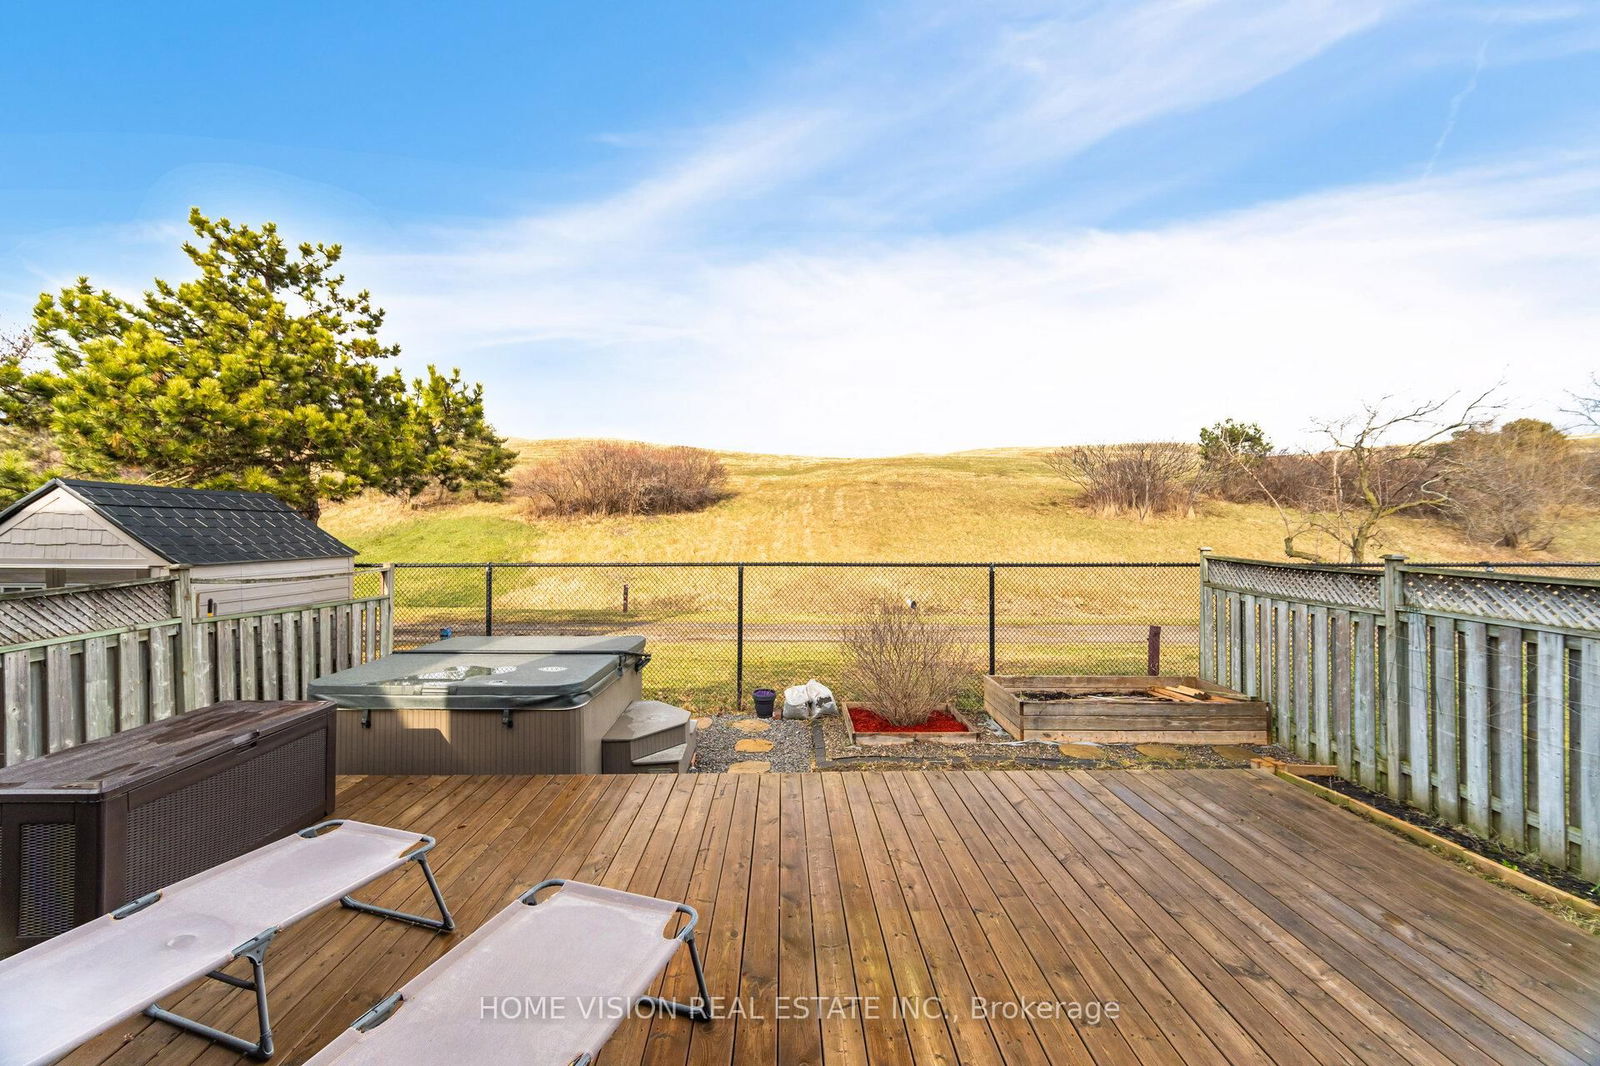
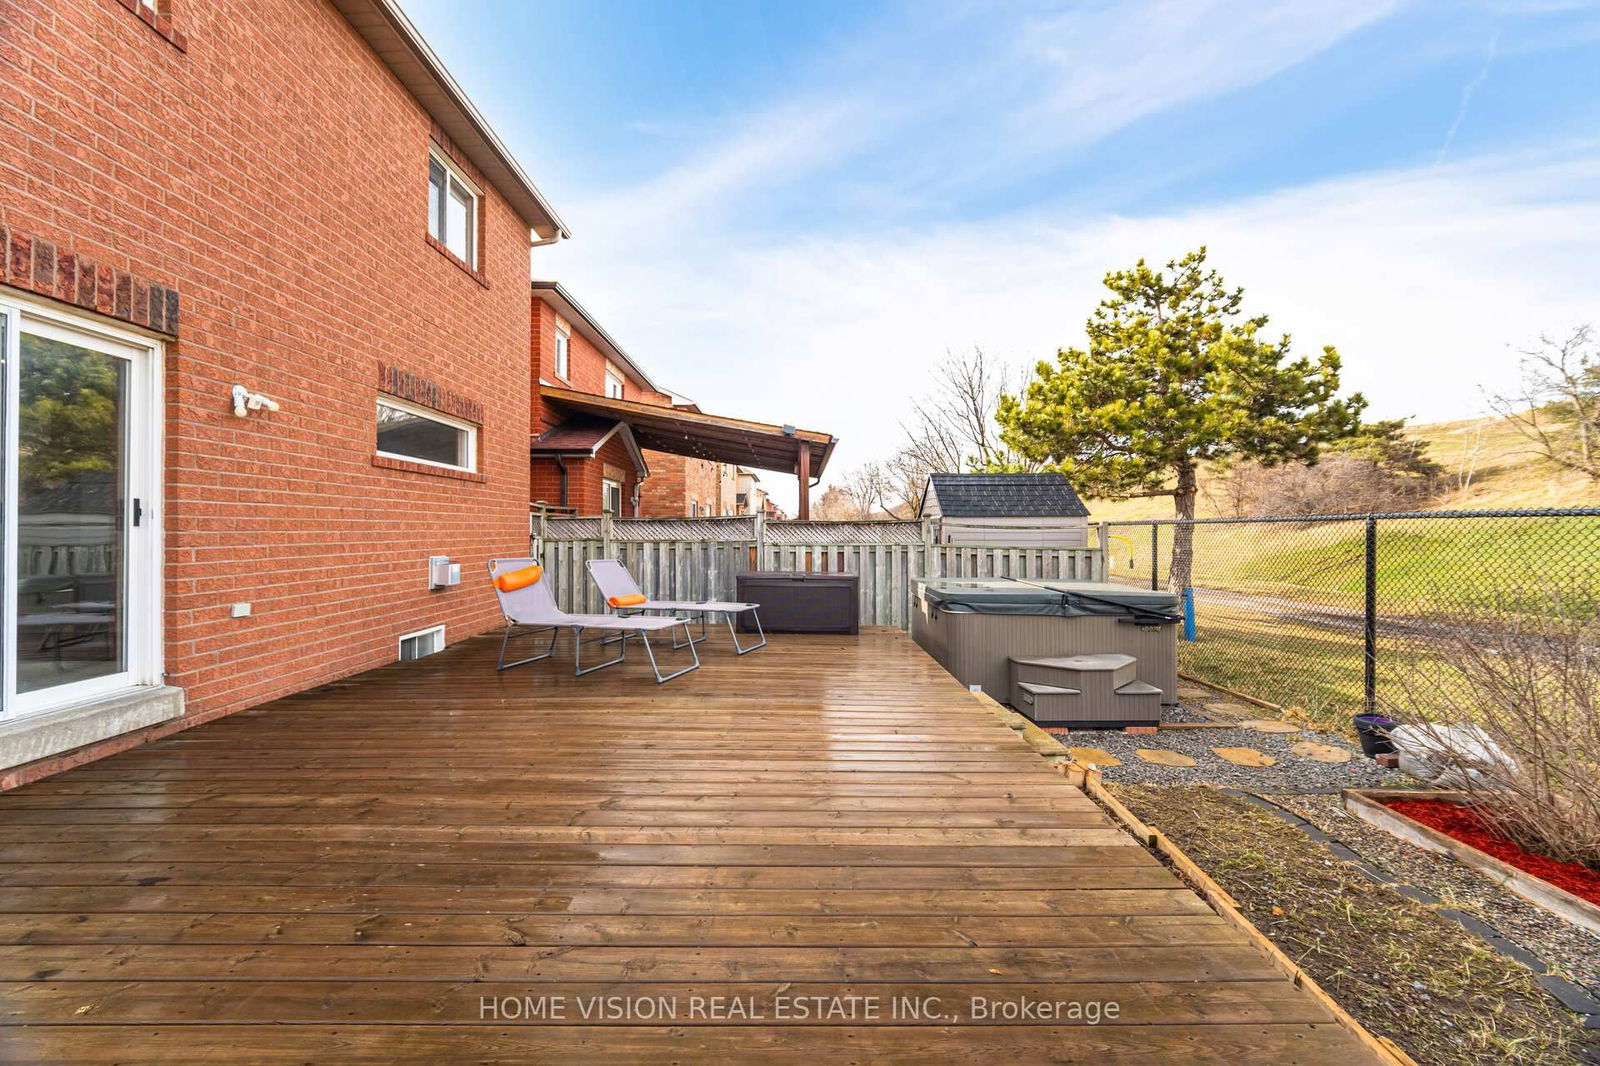
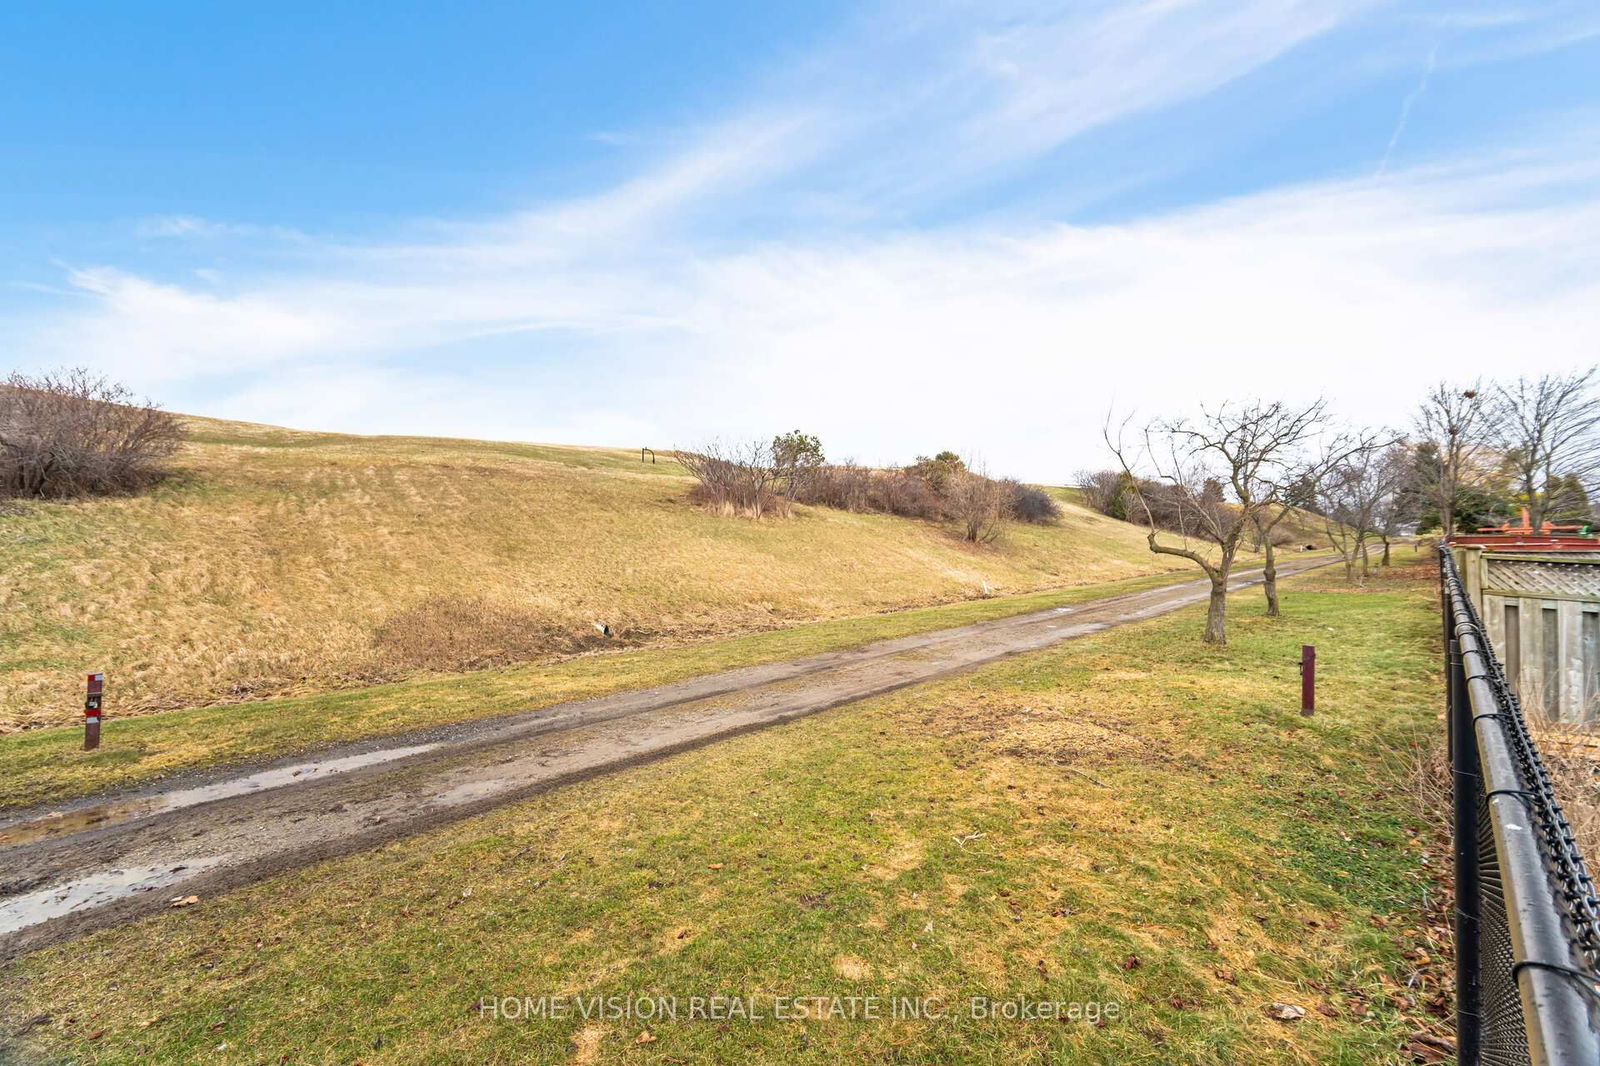
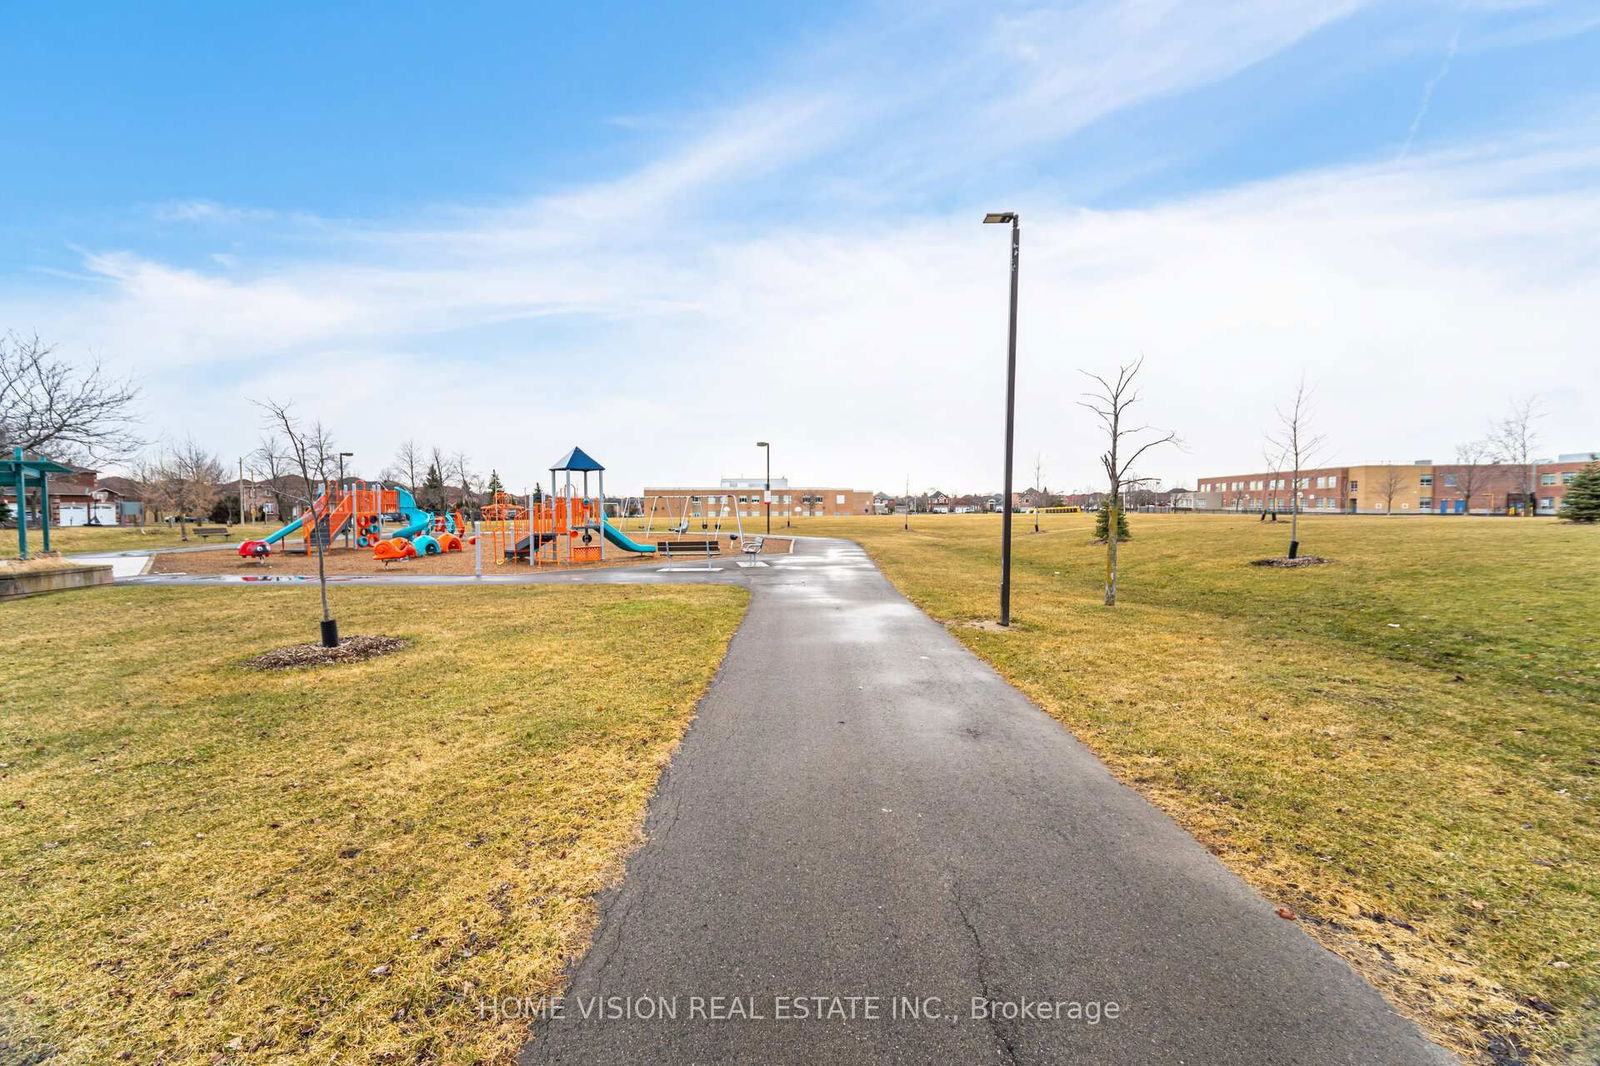
Stunning Detached Home in East Credit Backing Onto Golf Course! 3+1 bedroom detached home inthe highly sought-after East Credit Heartland area! Featuring a finished basement with an in-law suite and a private backyard overlooking a scenic recreational area, this home is a true show stopper! Oak hardwood floors on the main level & staircase. Open-concept living & dining room. Bright kitchen with white cabinetry, granite countertops &stainless steel appliances. Breakfast area with a walkout to a spacious and beautiful deck to enjoy your private backyard oasis. Welcoming family room with a gas fireplace & large lookout windows to the backyard. 3 spacious bedrooms upstairs with large windows & double closets. Primary suite with a walk-in closet & private ensuite. Huge Linen closet and can be converted in laundry room. In-Law Suite or Rental unit in the Basement! Second kitchen fully equipped for added convenience. Bedroom with a window & closet. Massive living room with dining room. 2nd bedroom can be added. Extra Storage/Coat room in basement. Huge & newly installed gravel driveway. Premium lot backing onto a golf course enjoy stunning views & privacy. Close to Heartland Town Centre, top-rated schools, parks, highways, and all major amenities.Schools within Boundary- Whitehorn PS, hazel McCallion MS, Rick Hansen SS
SS Gas Stove, SS Fridge, SS B/I Dishwasher, SS Range hood, Gas fireplace, All elf's, All window coverings, Washer, Dryer, B/I Microwave(2023), Fridge & Stove in basement (2023), Furnace, Cac, Garage door (2017), Main door(2021)
Living
Dining
Family
Kitchen
Breakfast
Primary
2nd Br
3rd Br
4th Br
Living
Kitchen
The graph below compares the average list price and average sale price of homes in this neighborhood by month for the last 24 months. When average sale price is greater than average list price, this may suggest a buyer's market. When average sale price is lower than the average list price this may suggest a seller's market.
The graph below illustrates the average days on market for homes in this neighborhood. The yellow area may indicate a buyer's market, the green area may indicate a balanced market and the red area may indicate a seller's market.
Sales Representative, Century 21 People’s Choice Realty Inc., Brokerage
(647) 576 - 2100
Mississauga, Hurontario, L5R 2B2