Century 21 People’s Choice Realty Inc., Brokerage
120 MATHESON BLVD E #103
MISSISSAUGA, Ontario
L4Z 1X1


London, South B, N6K 4J5
$1,899,900$000000
Listed by ROYAL LEPAGE TRILAND ROBERT DILORETO REALTY.
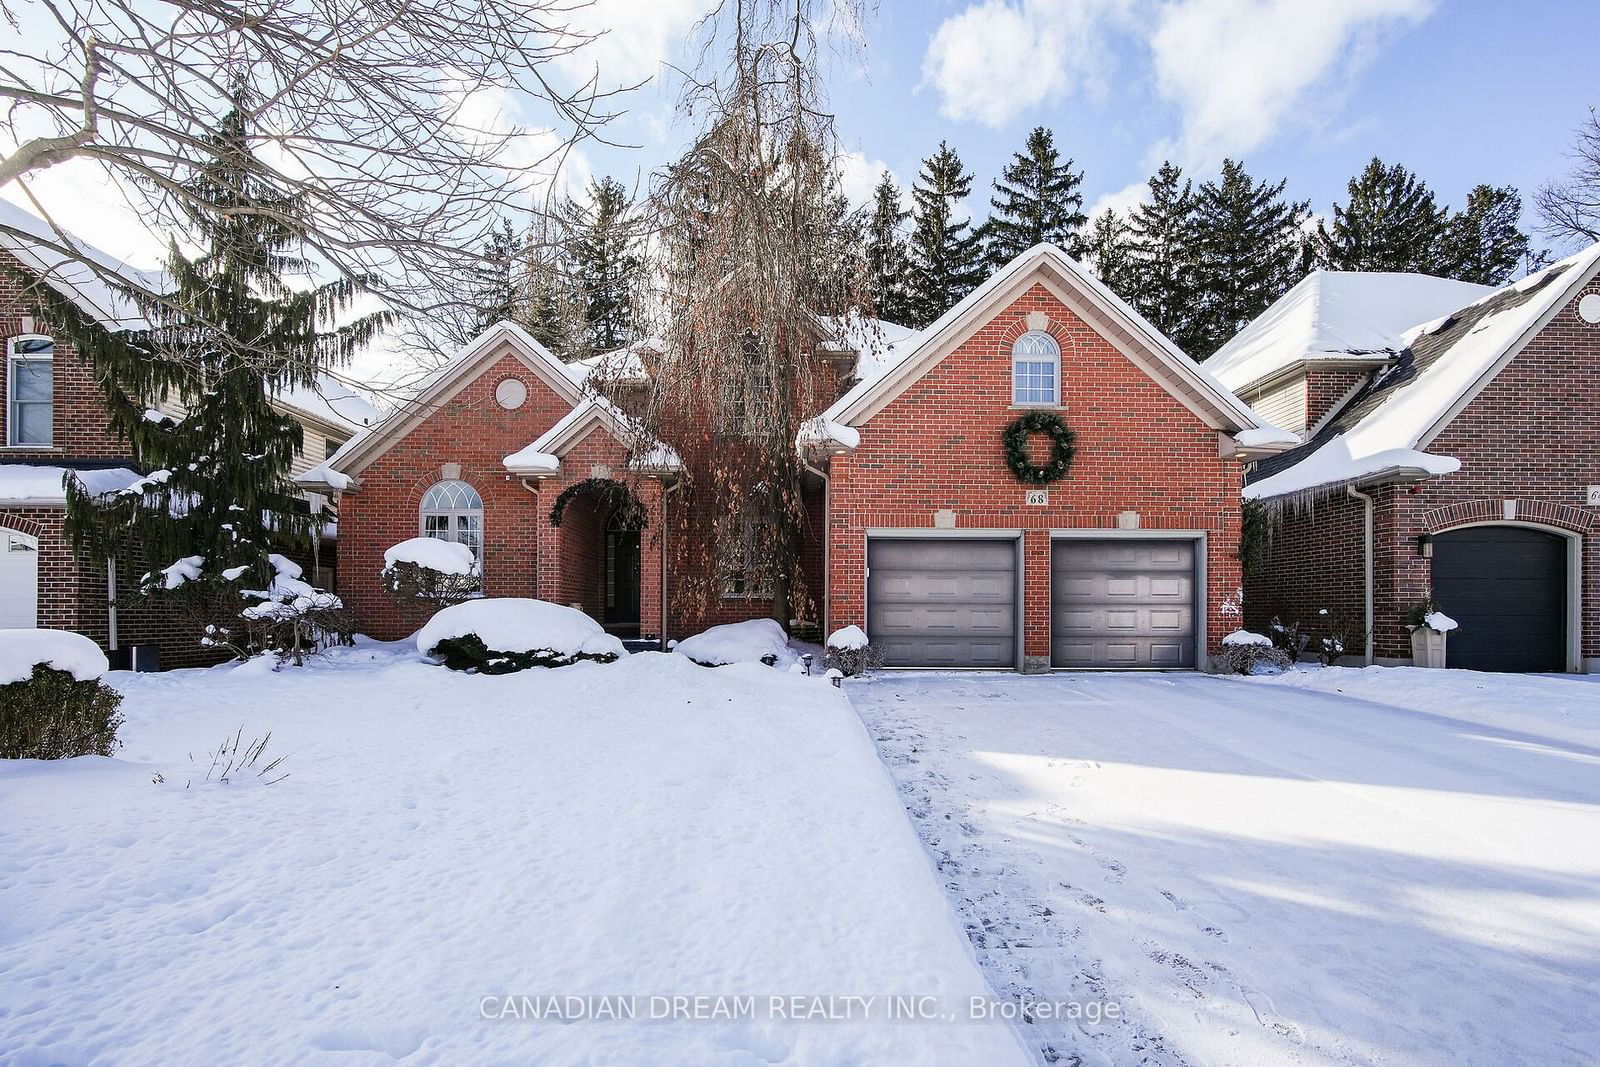
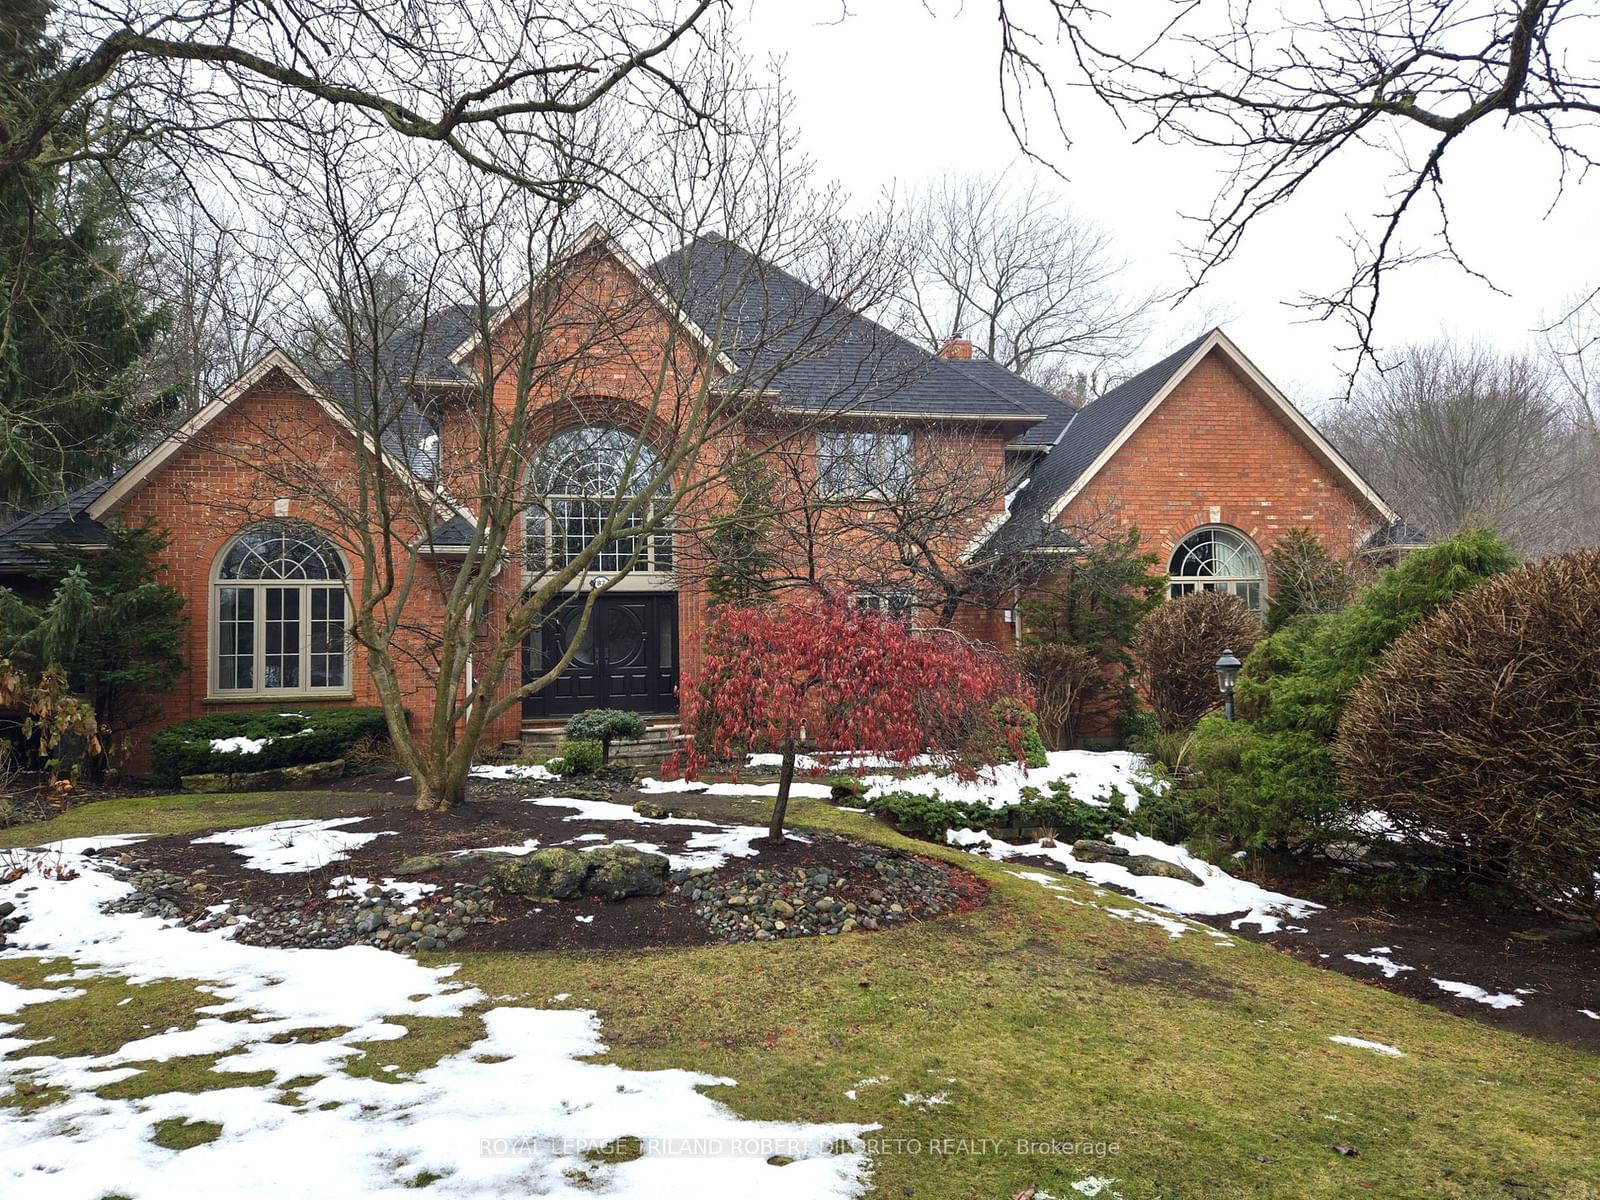
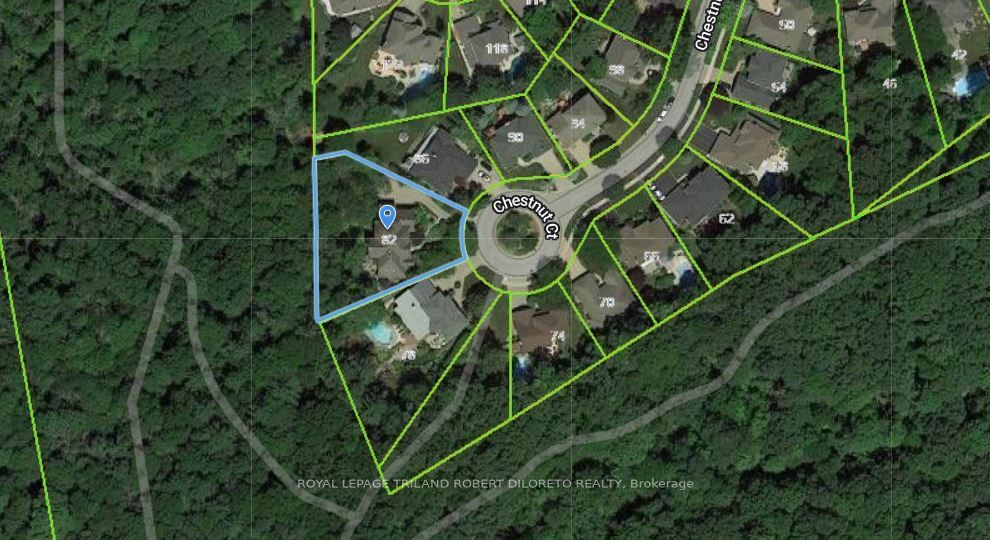
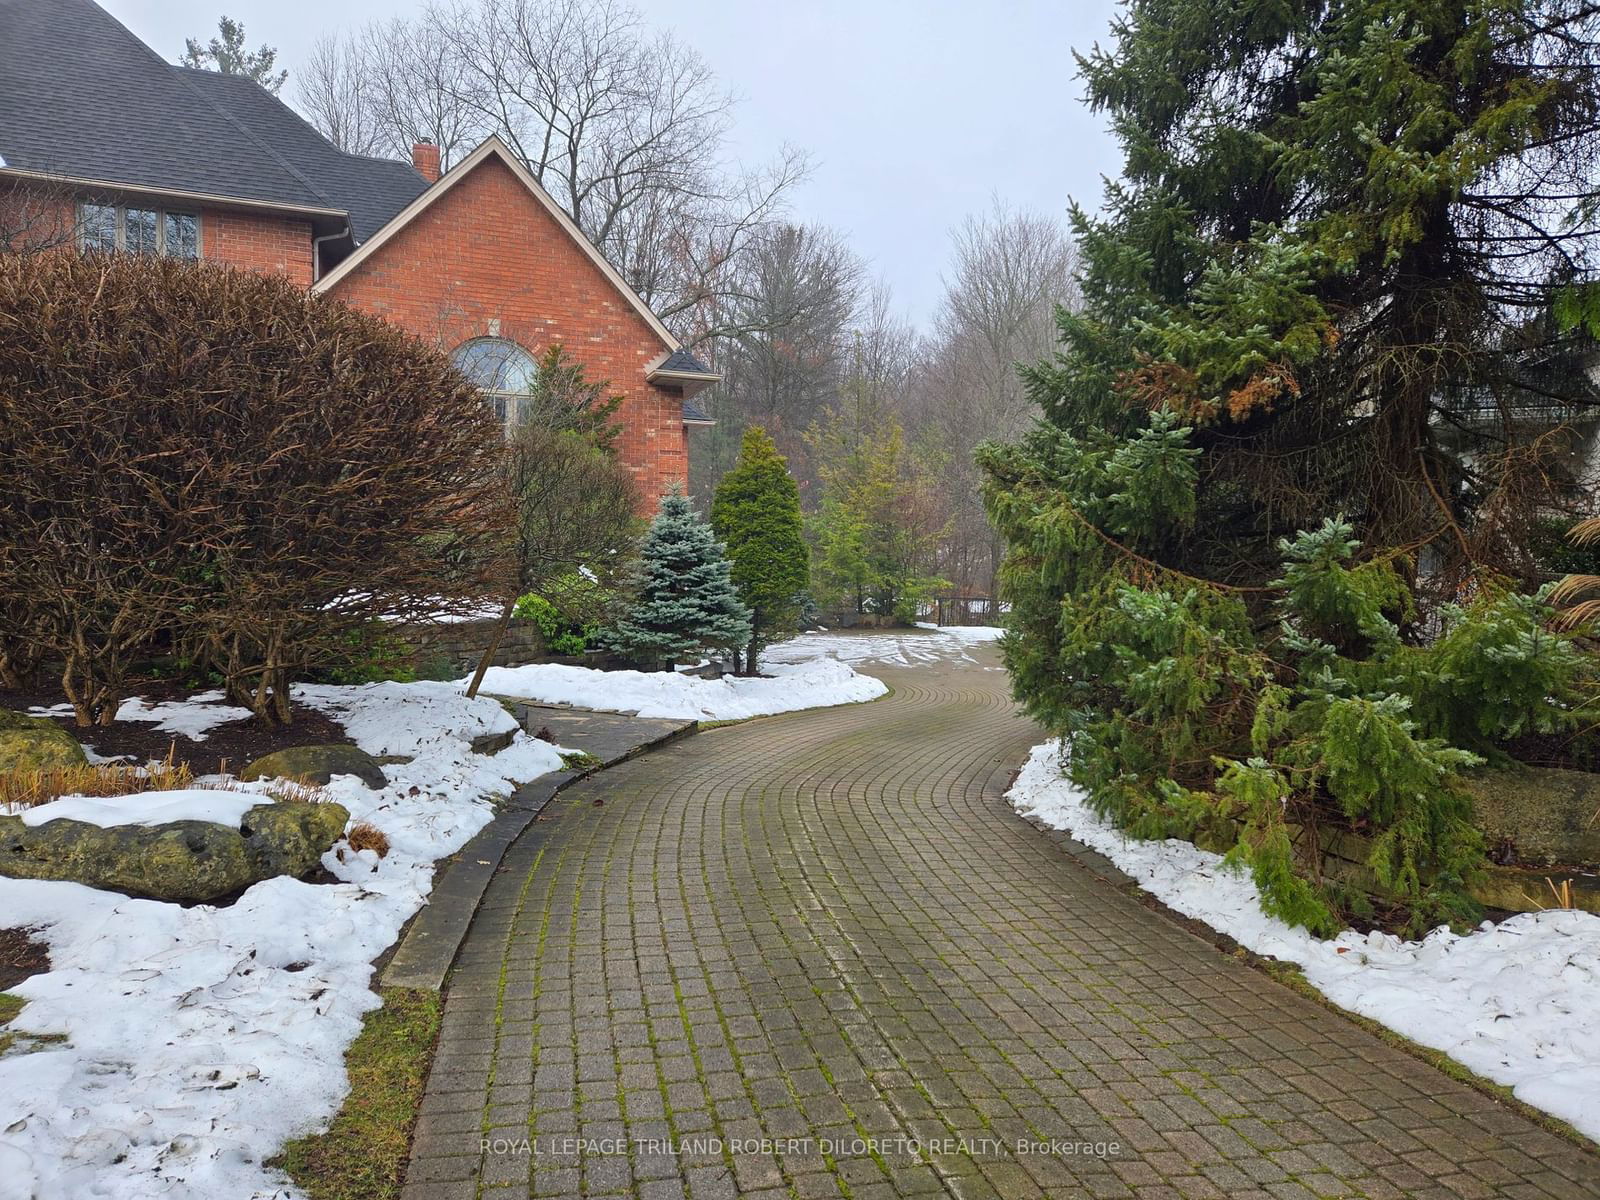
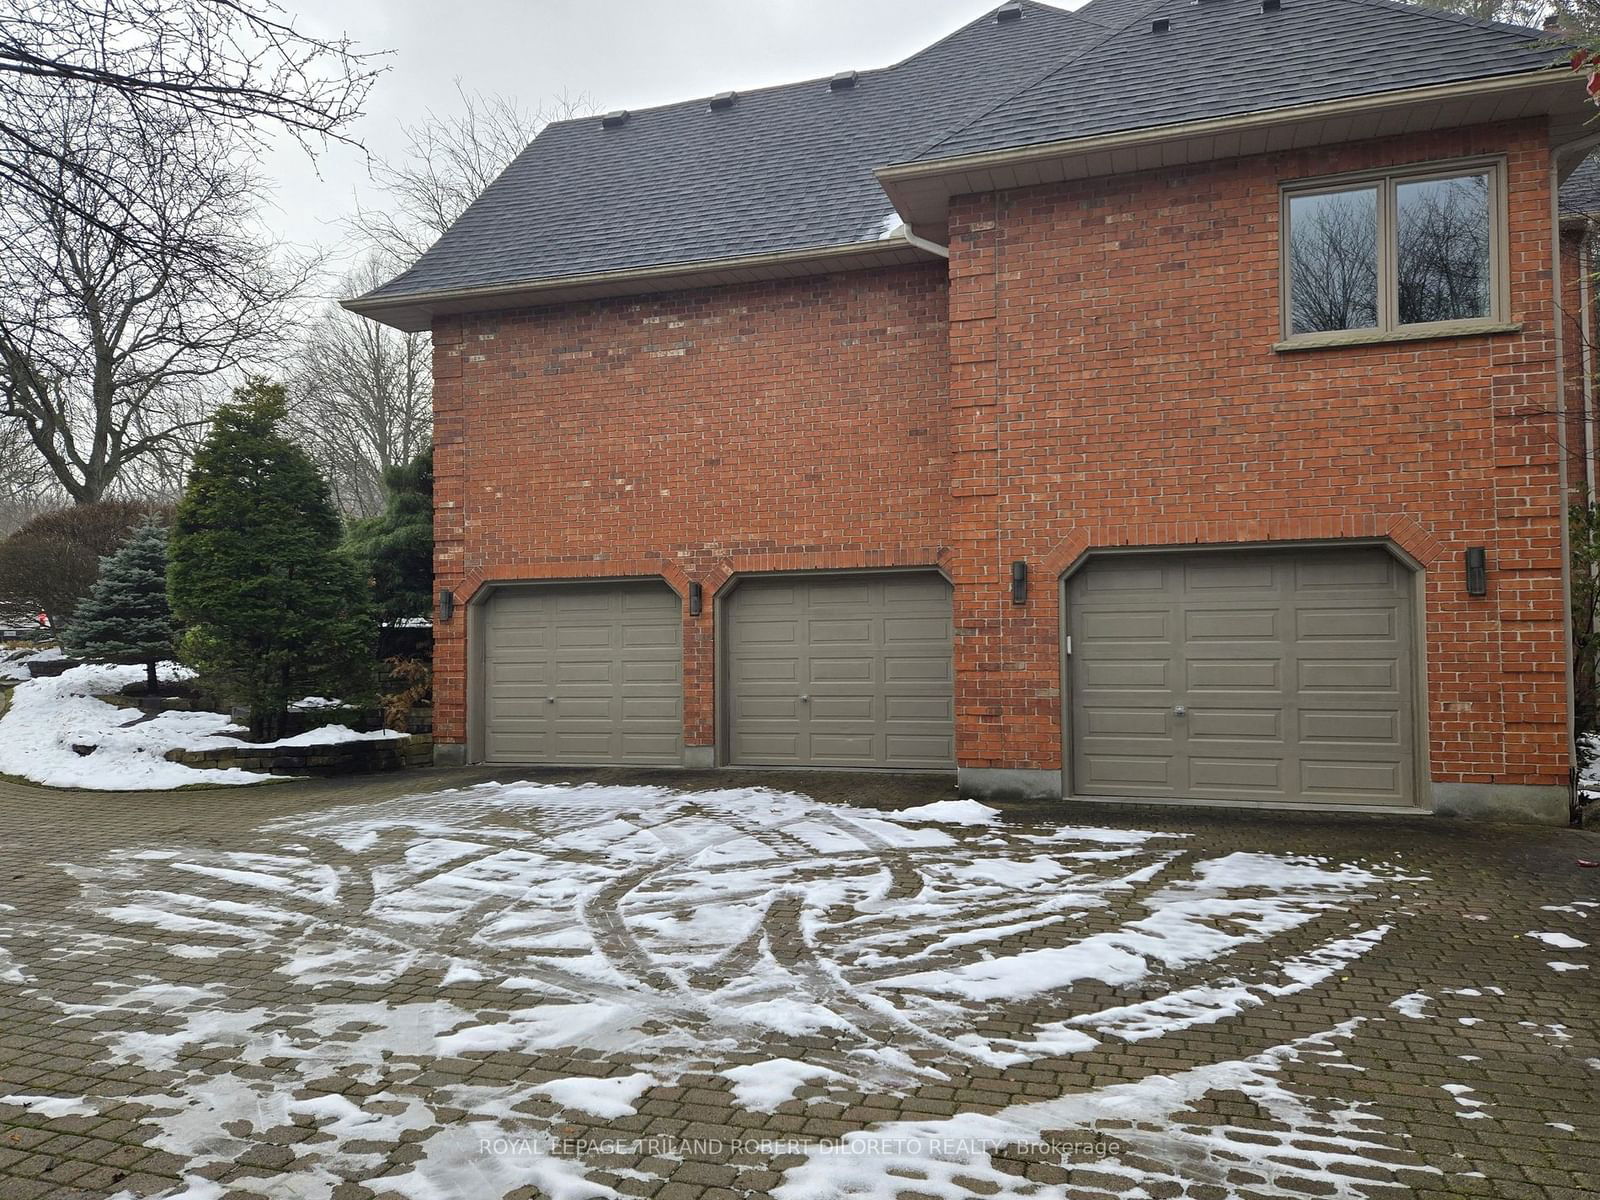
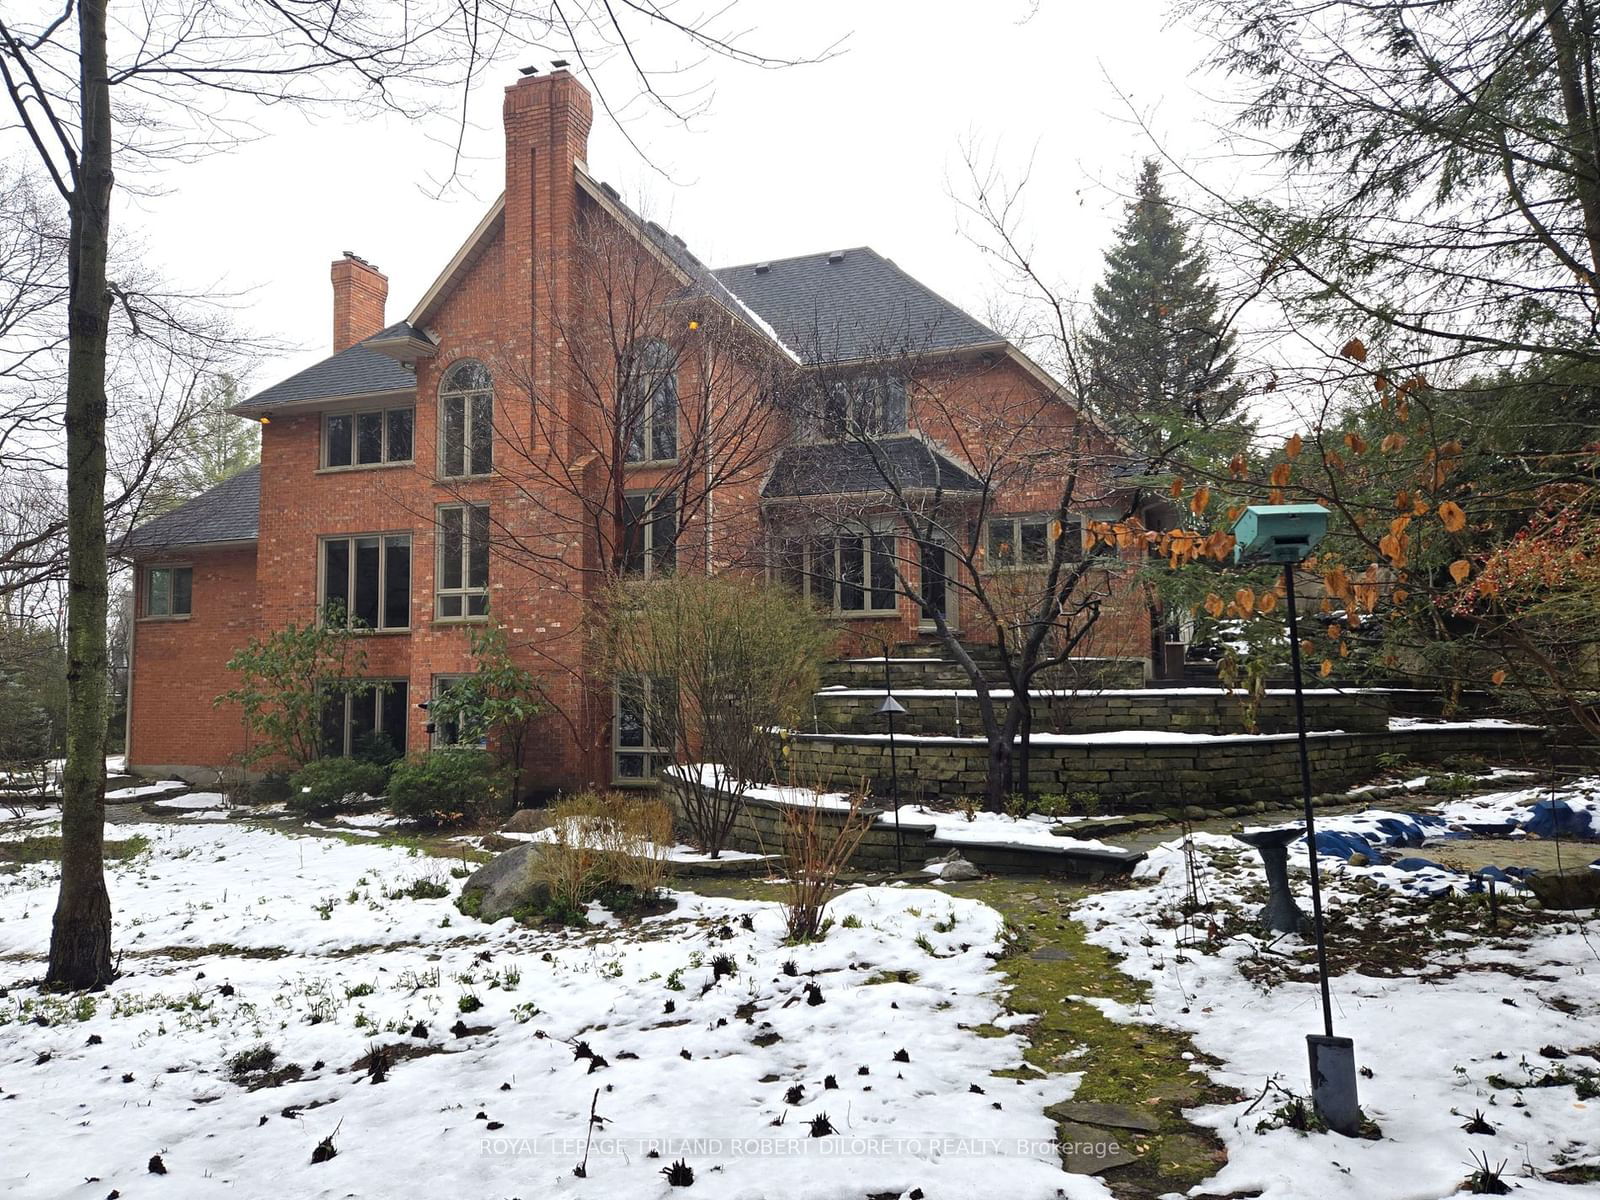
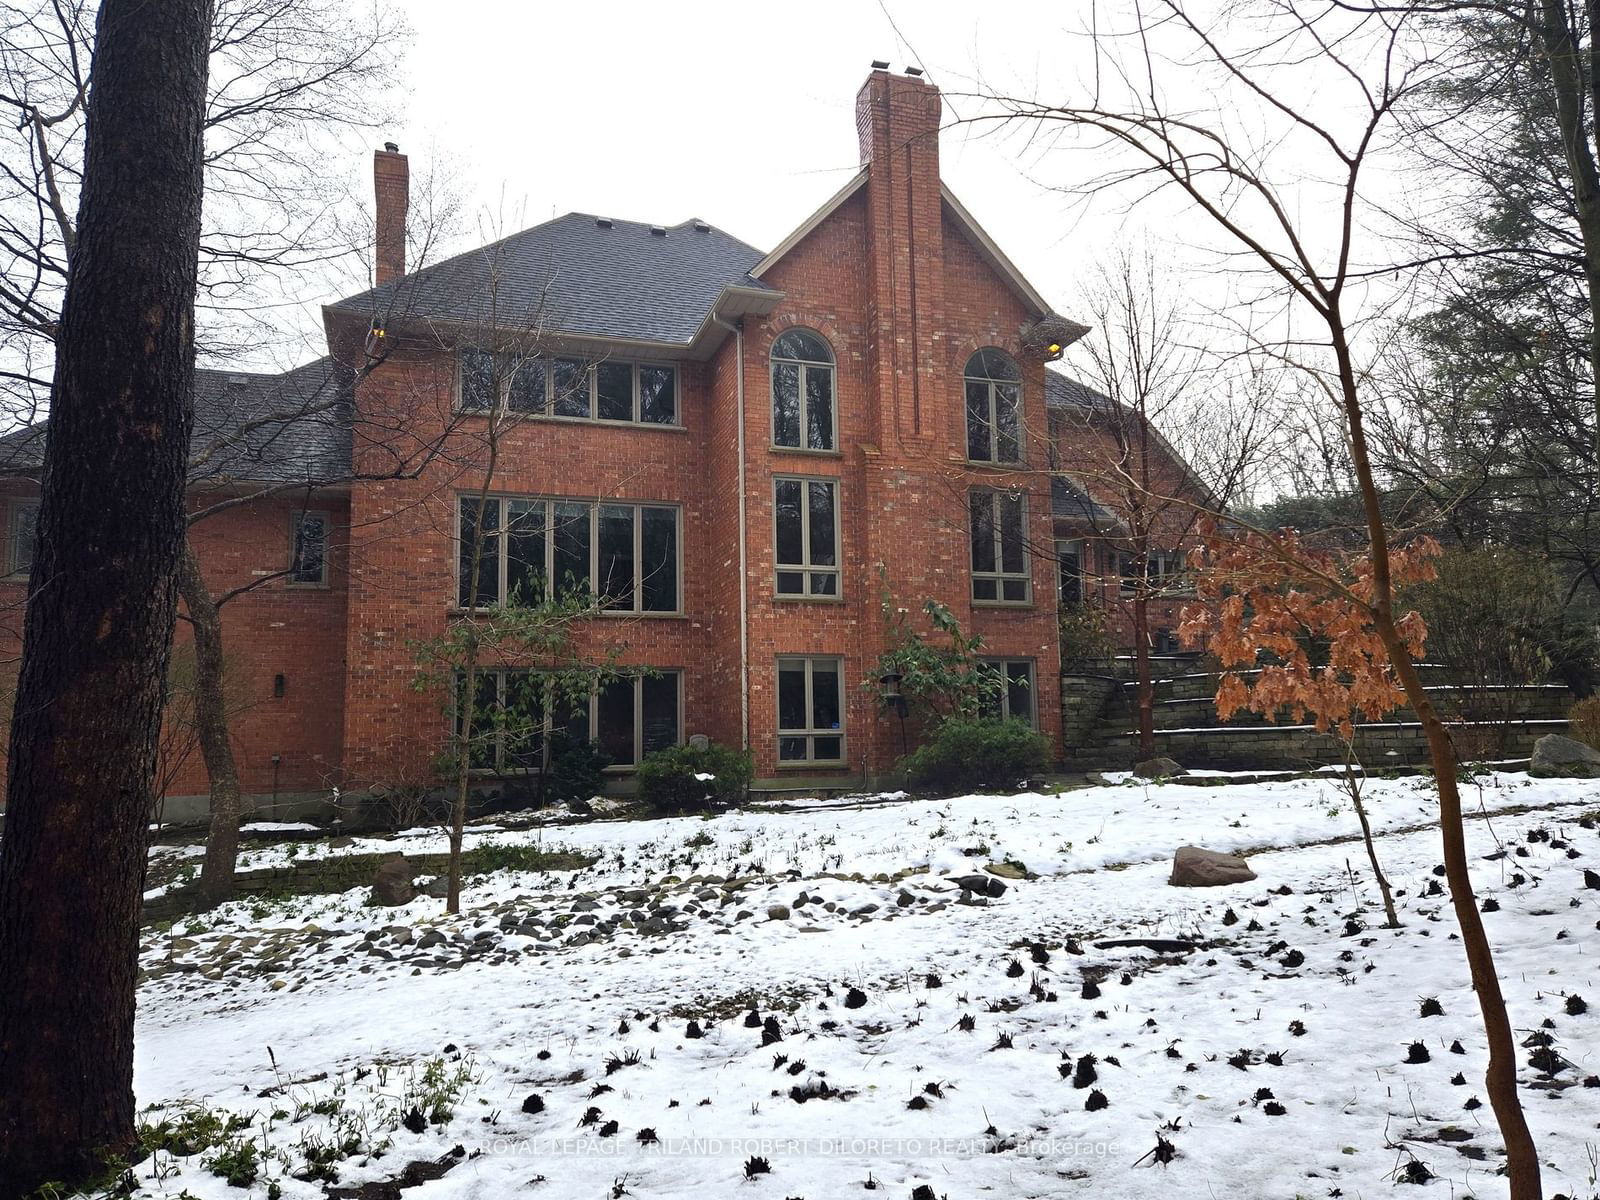
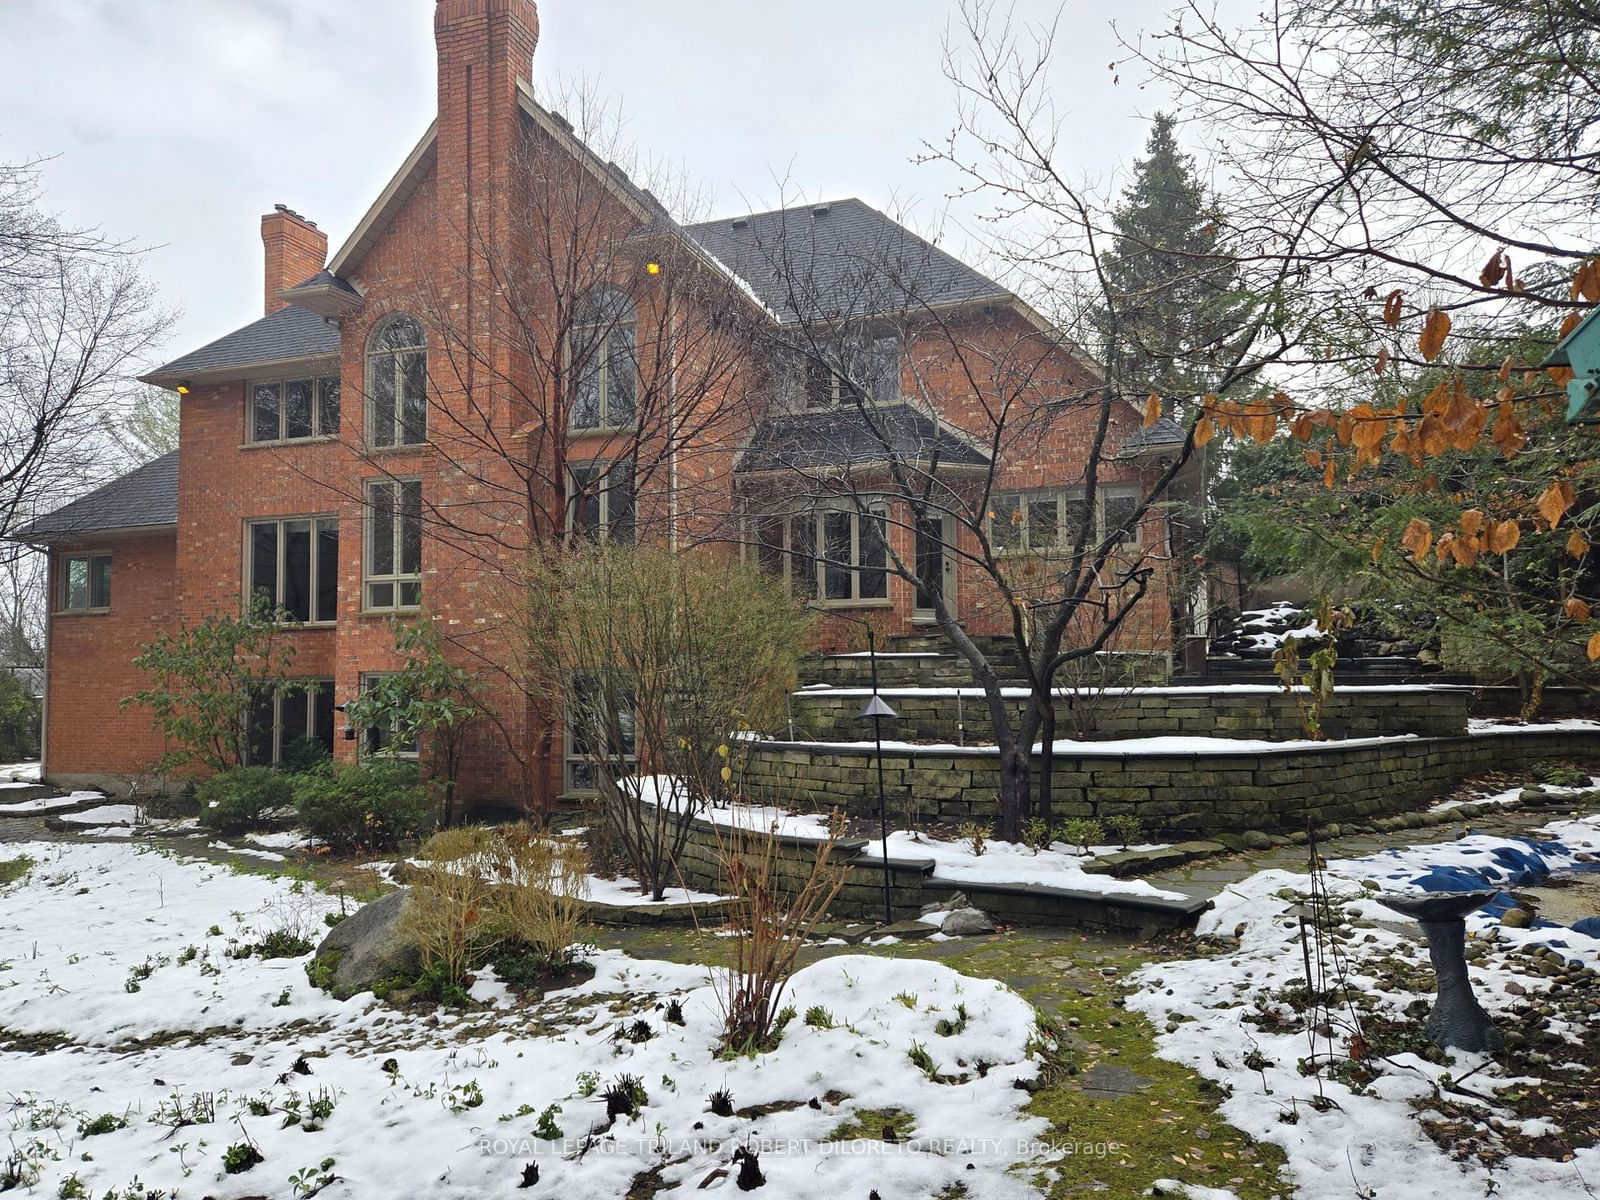
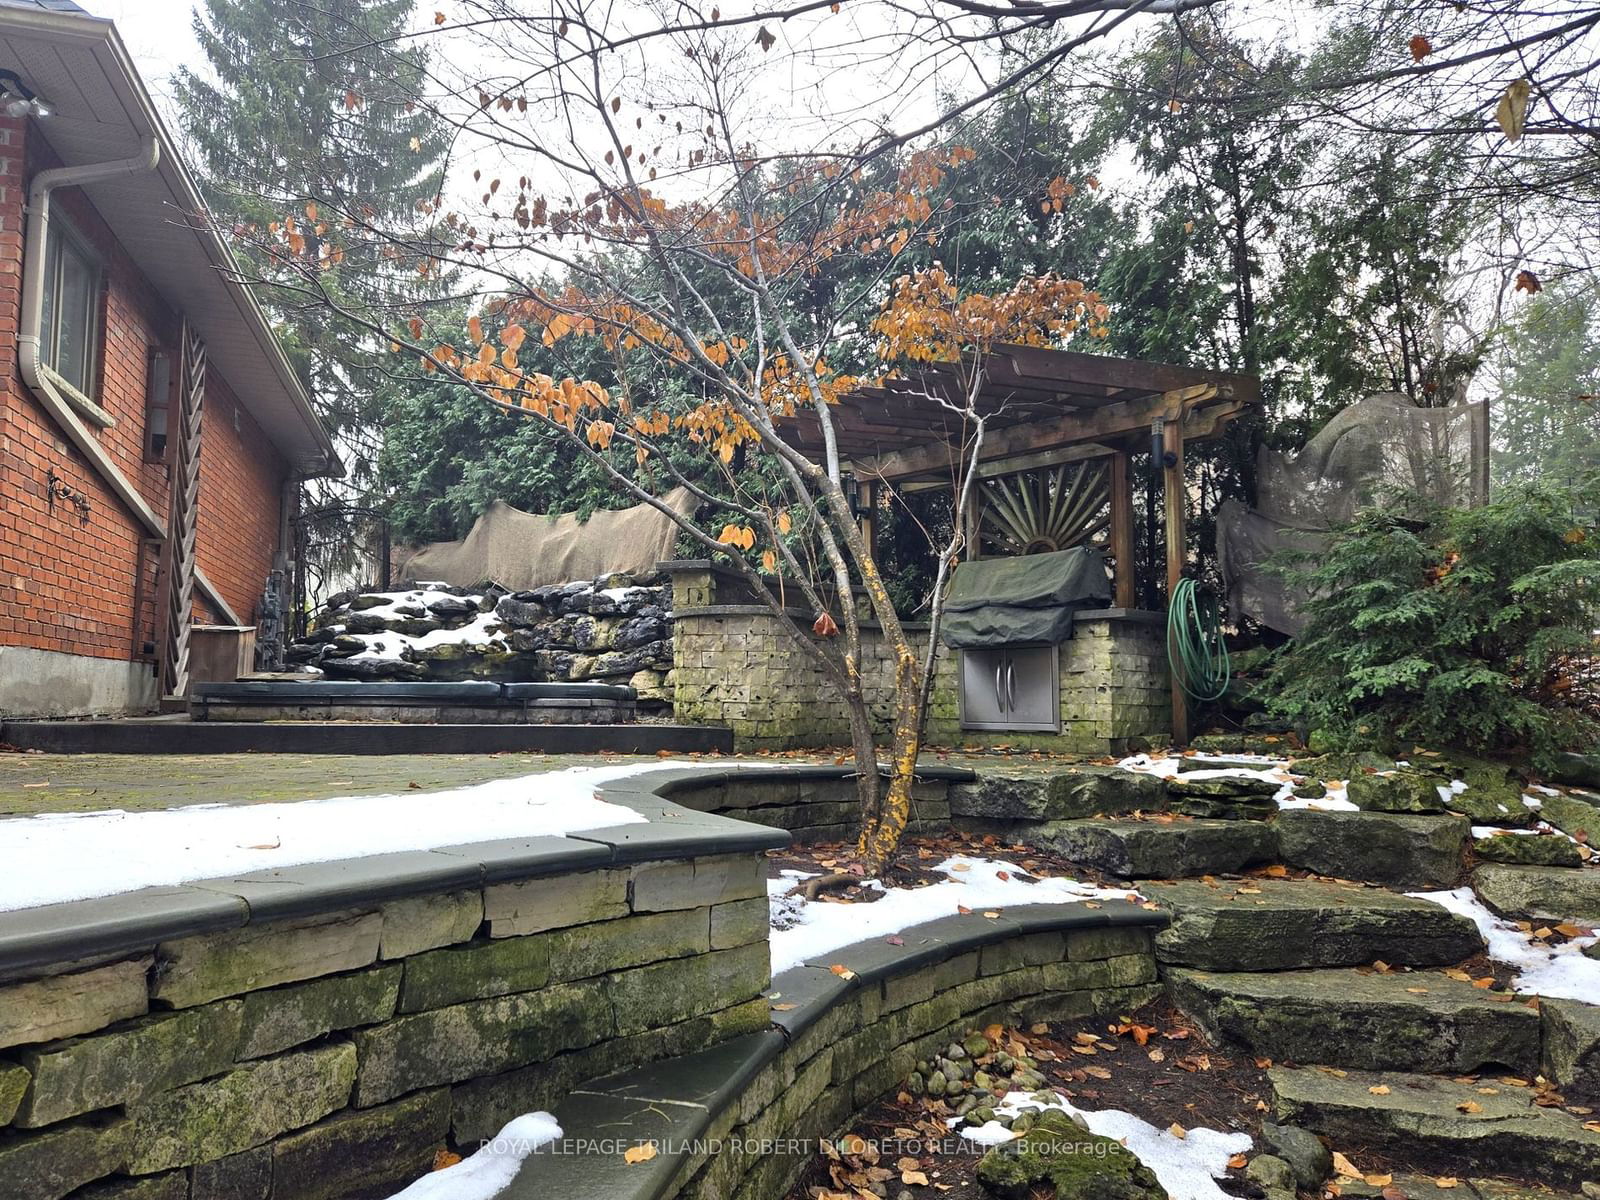
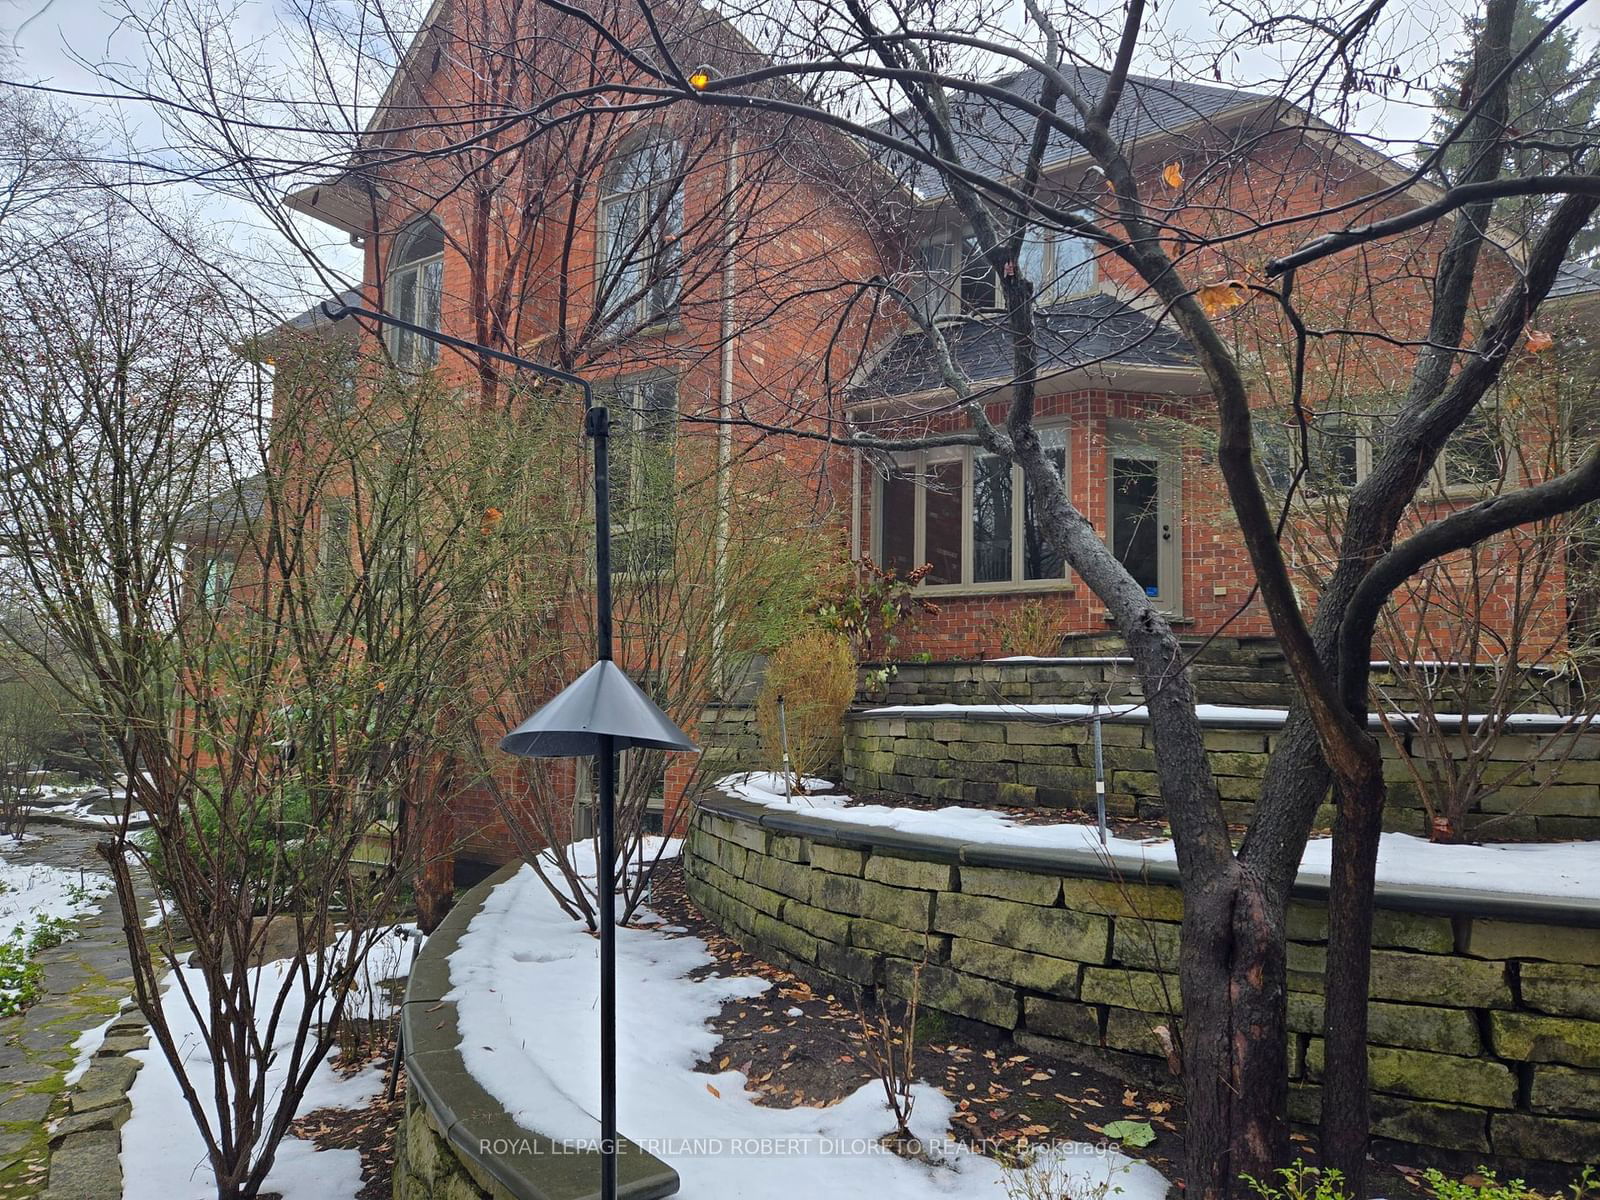
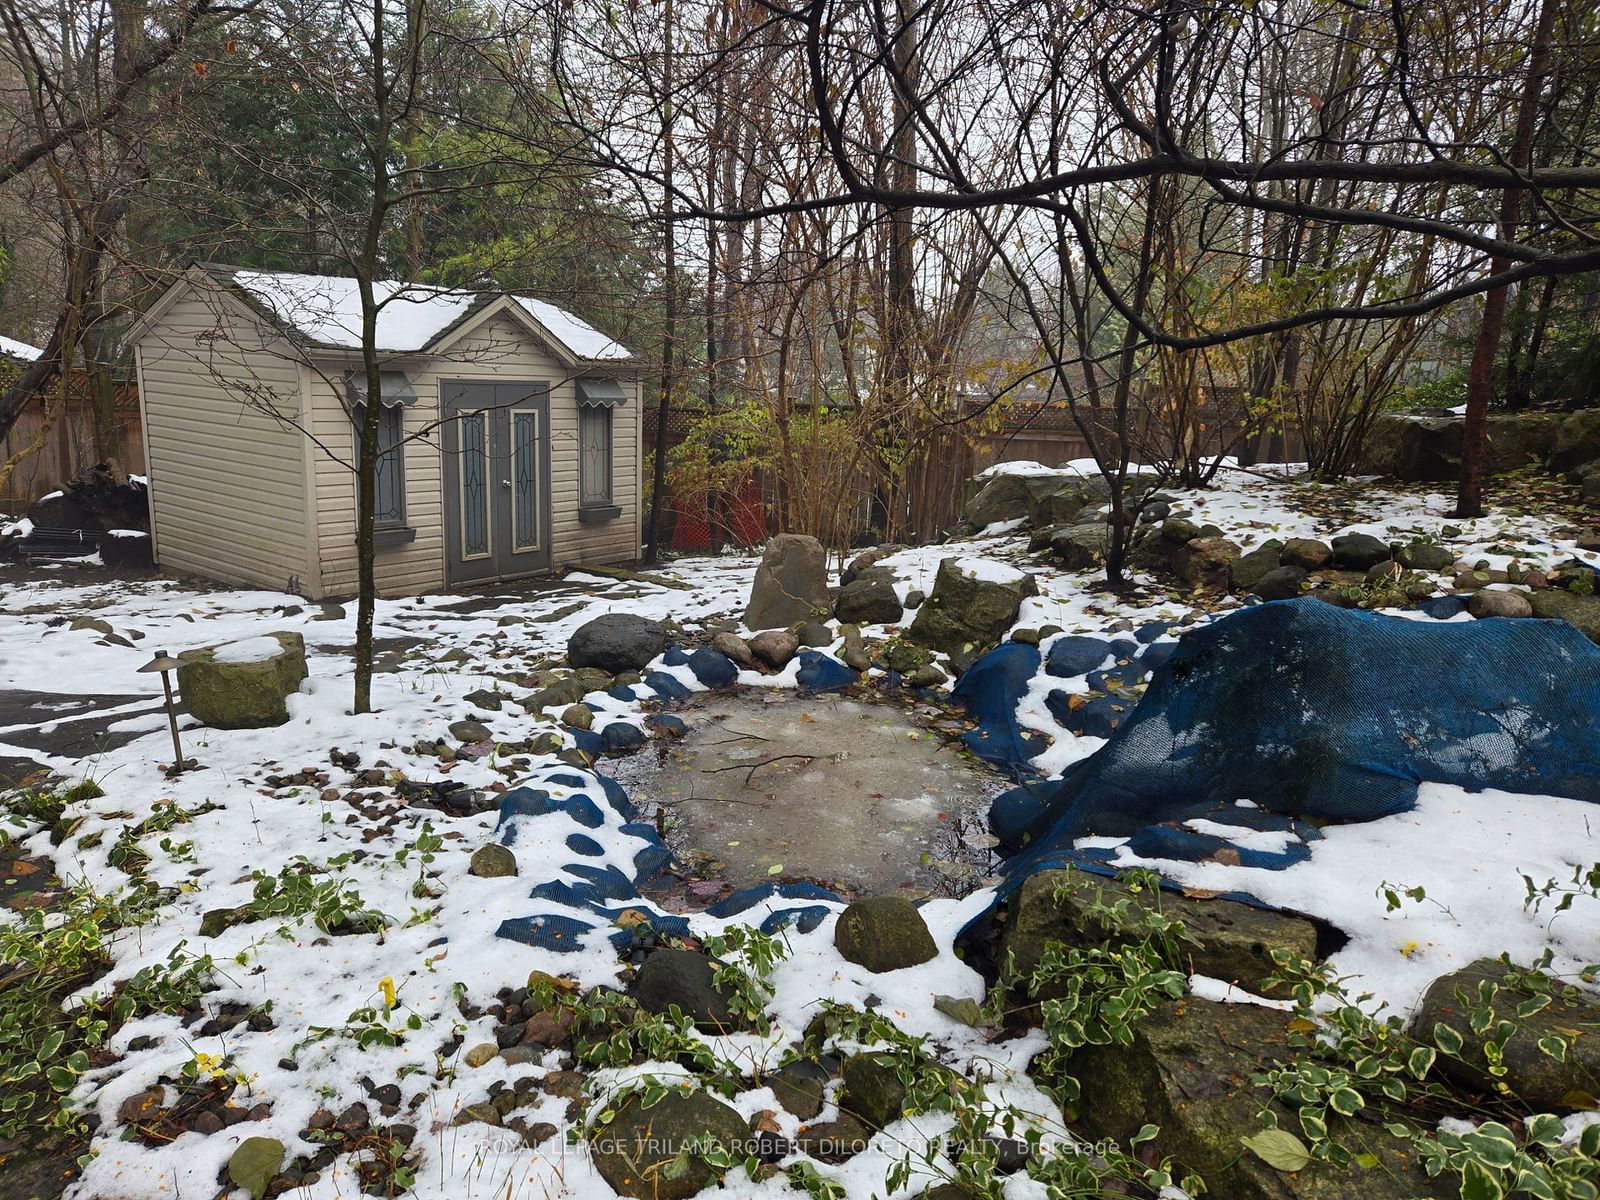
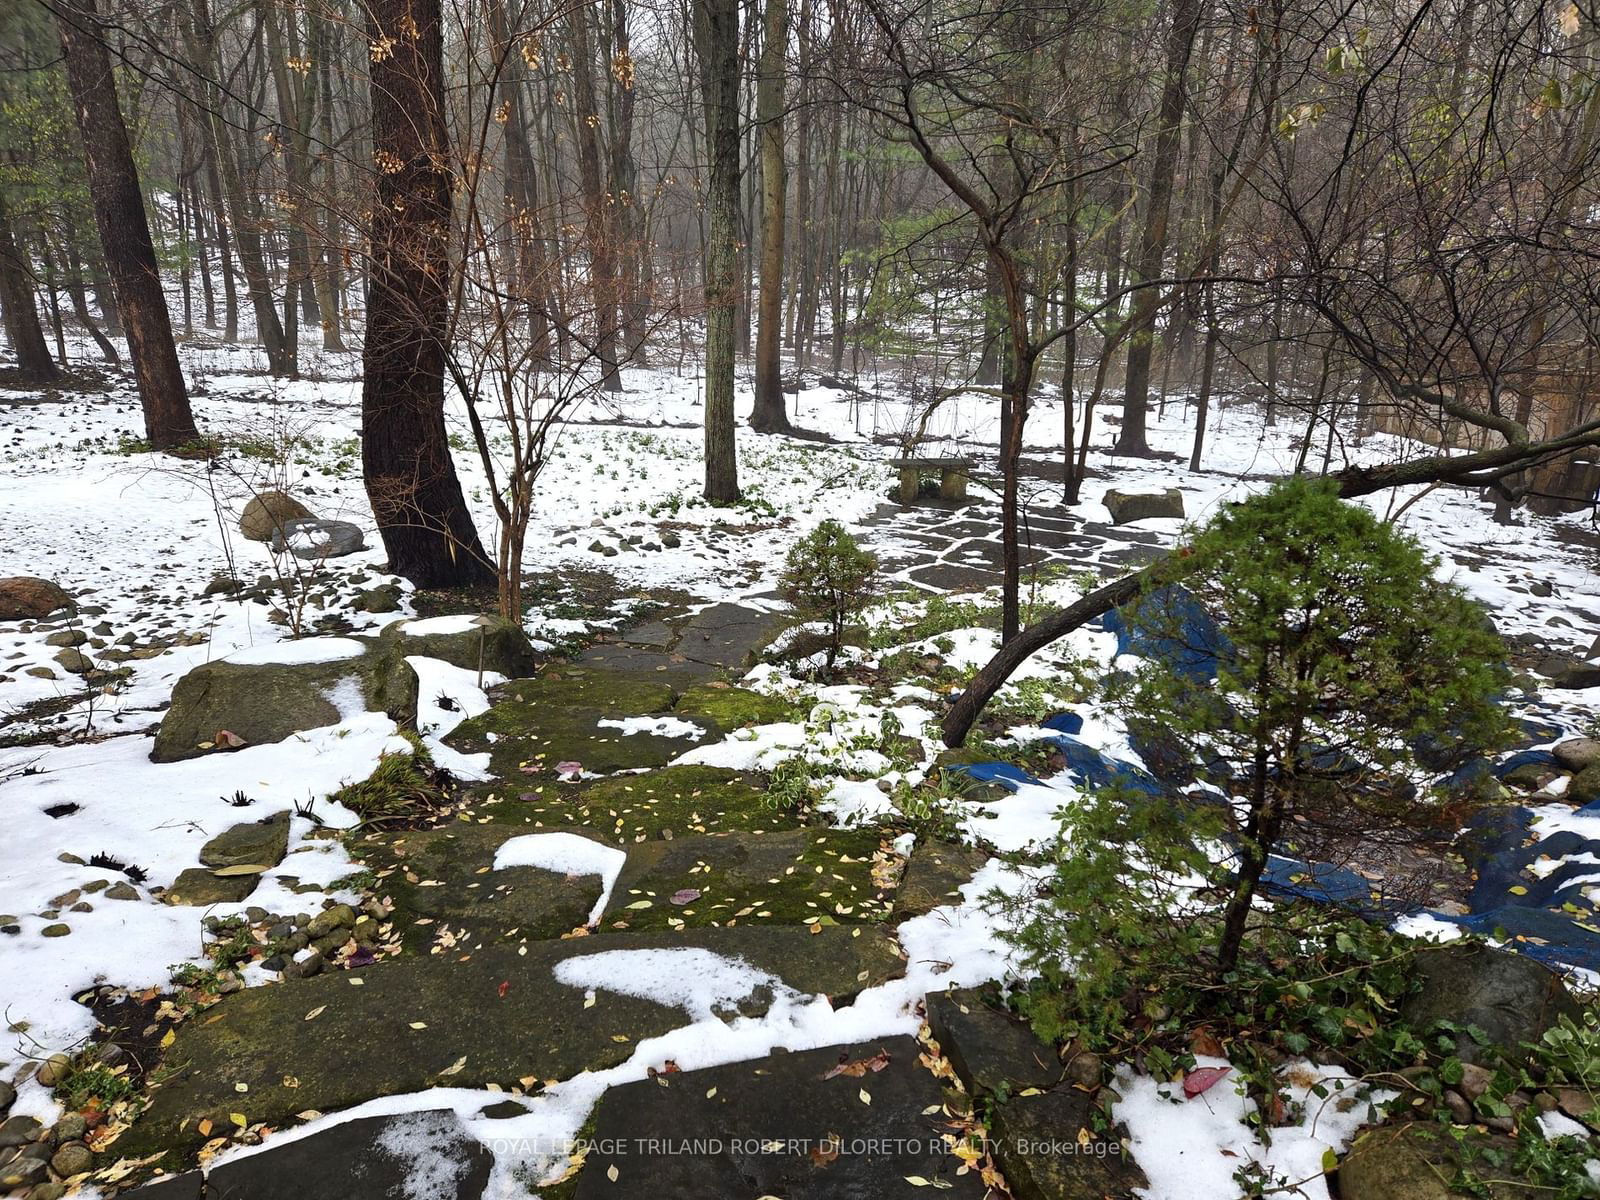
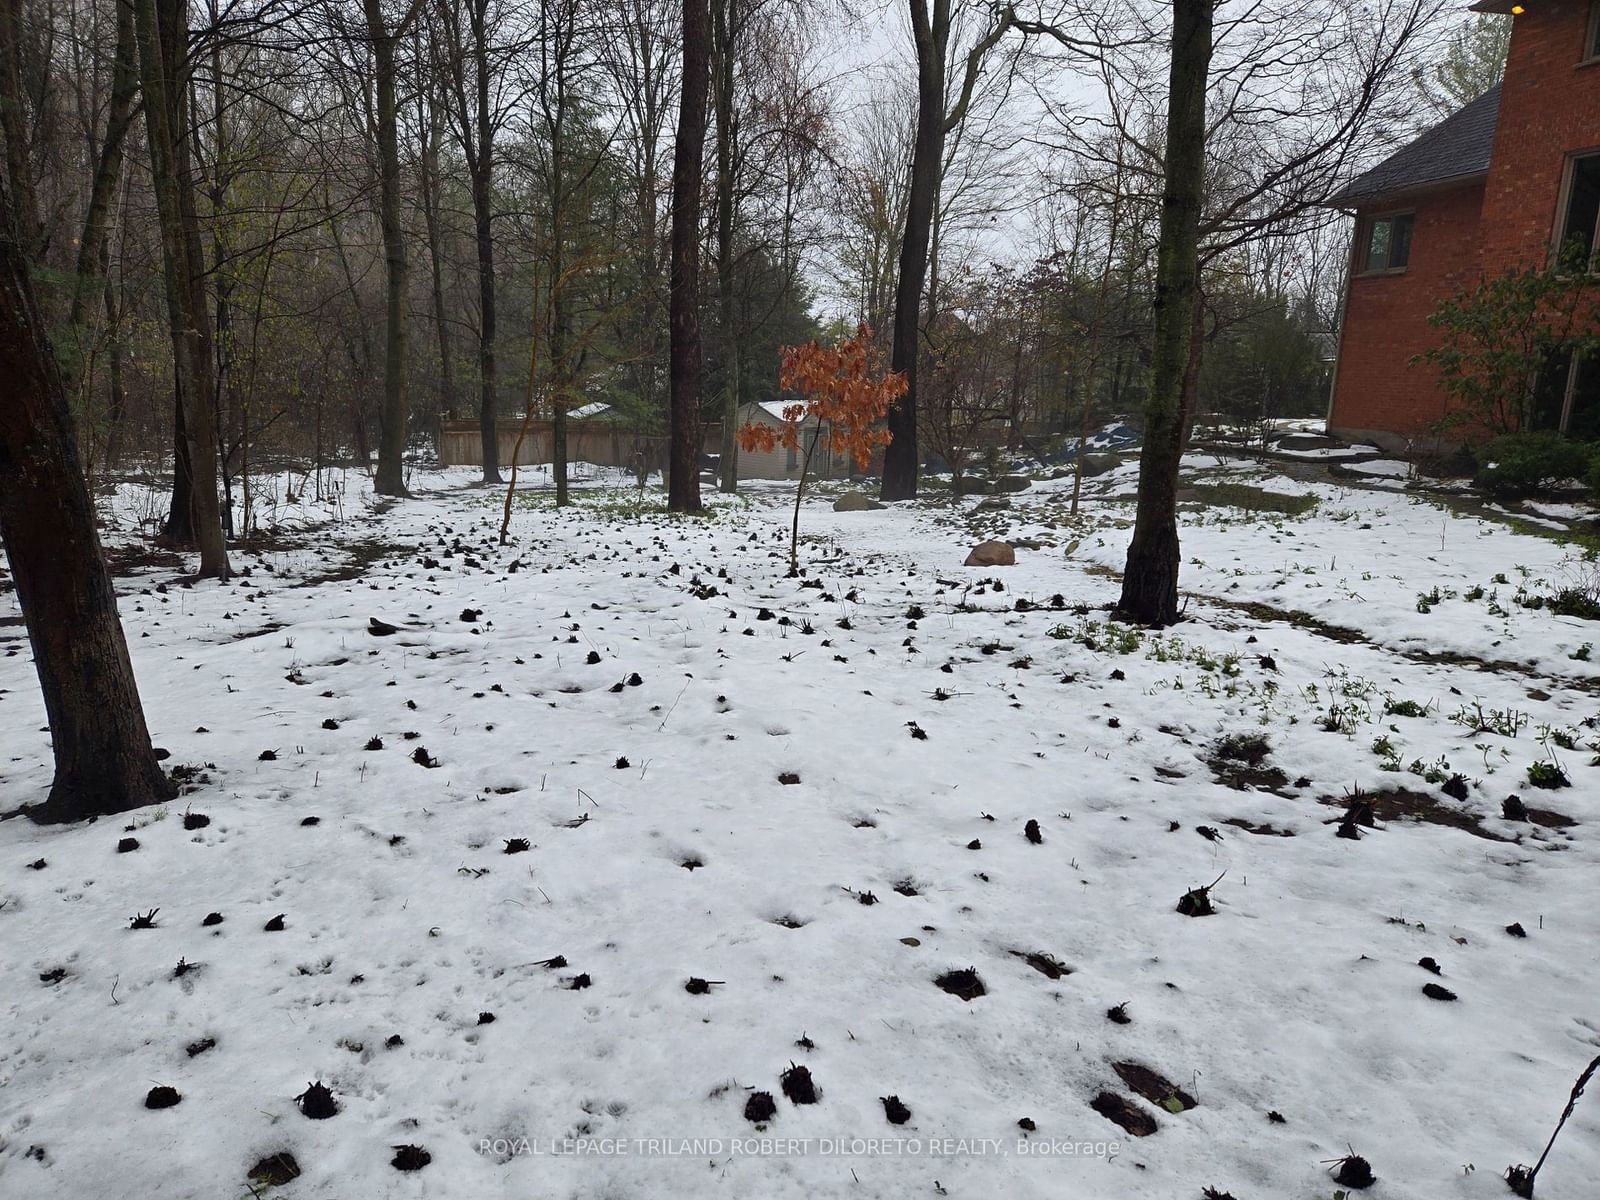
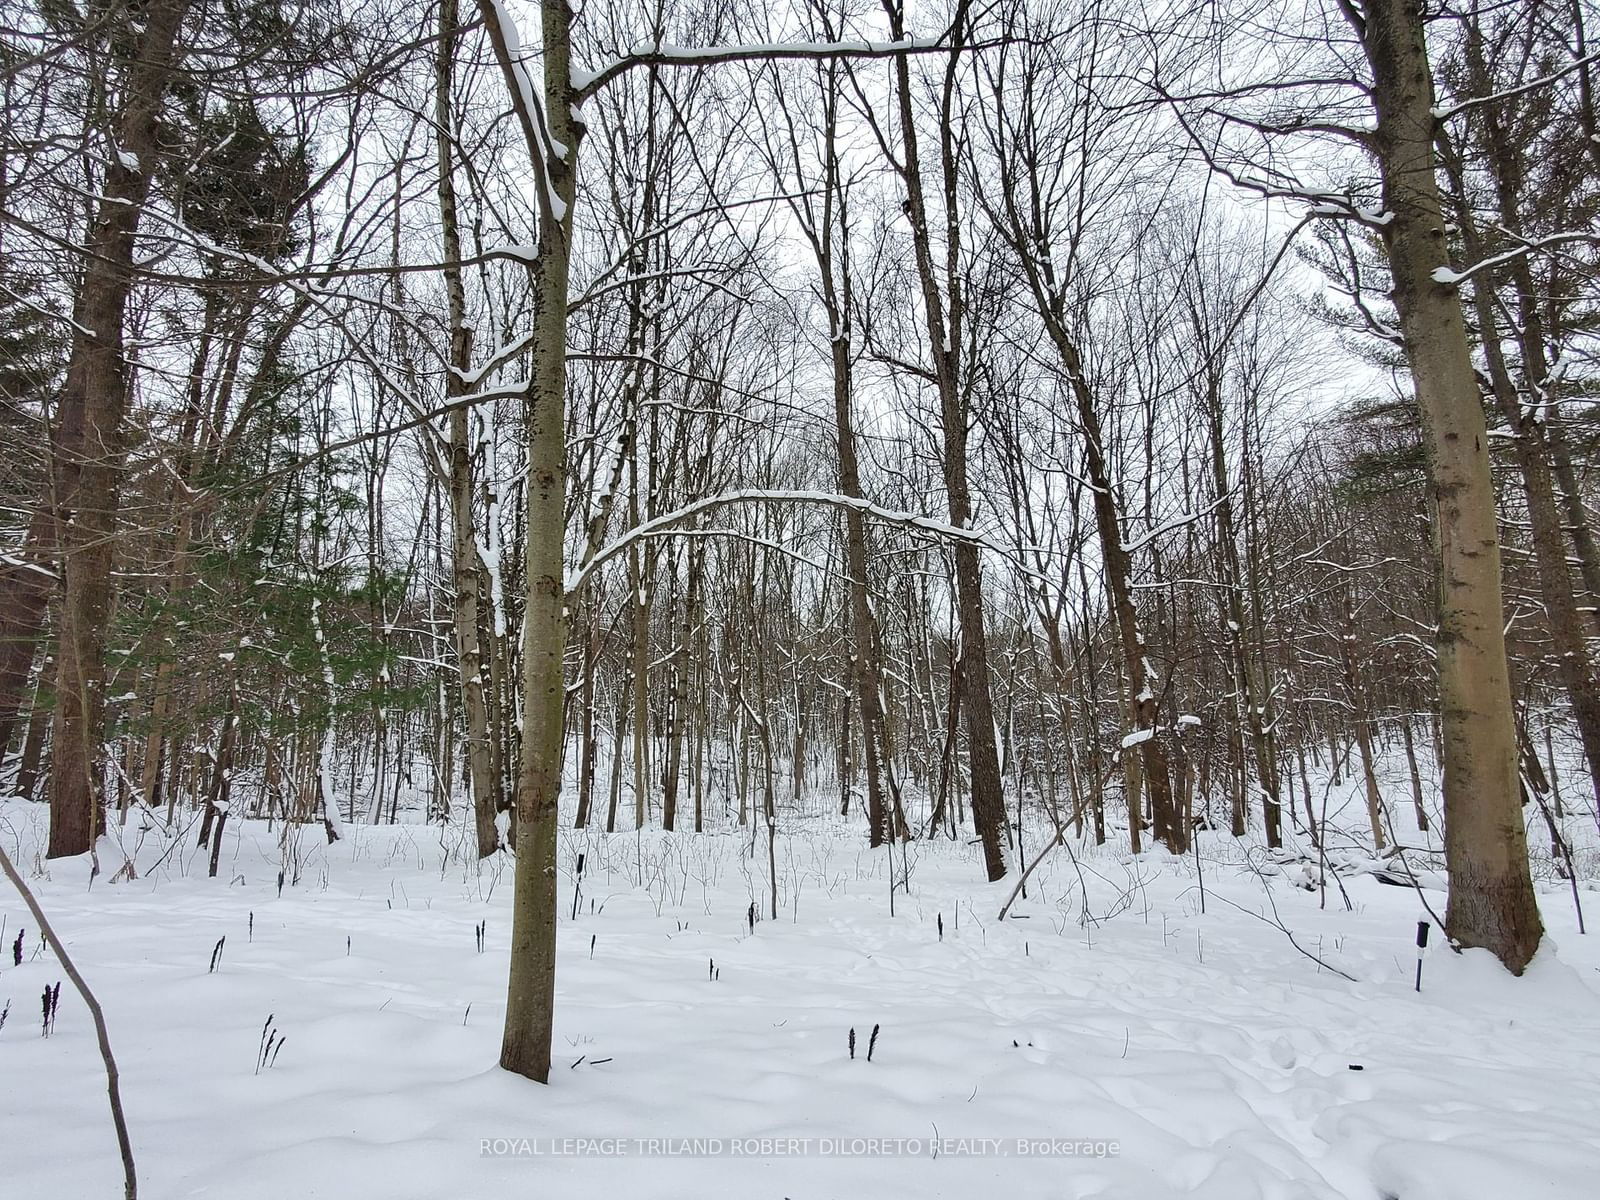
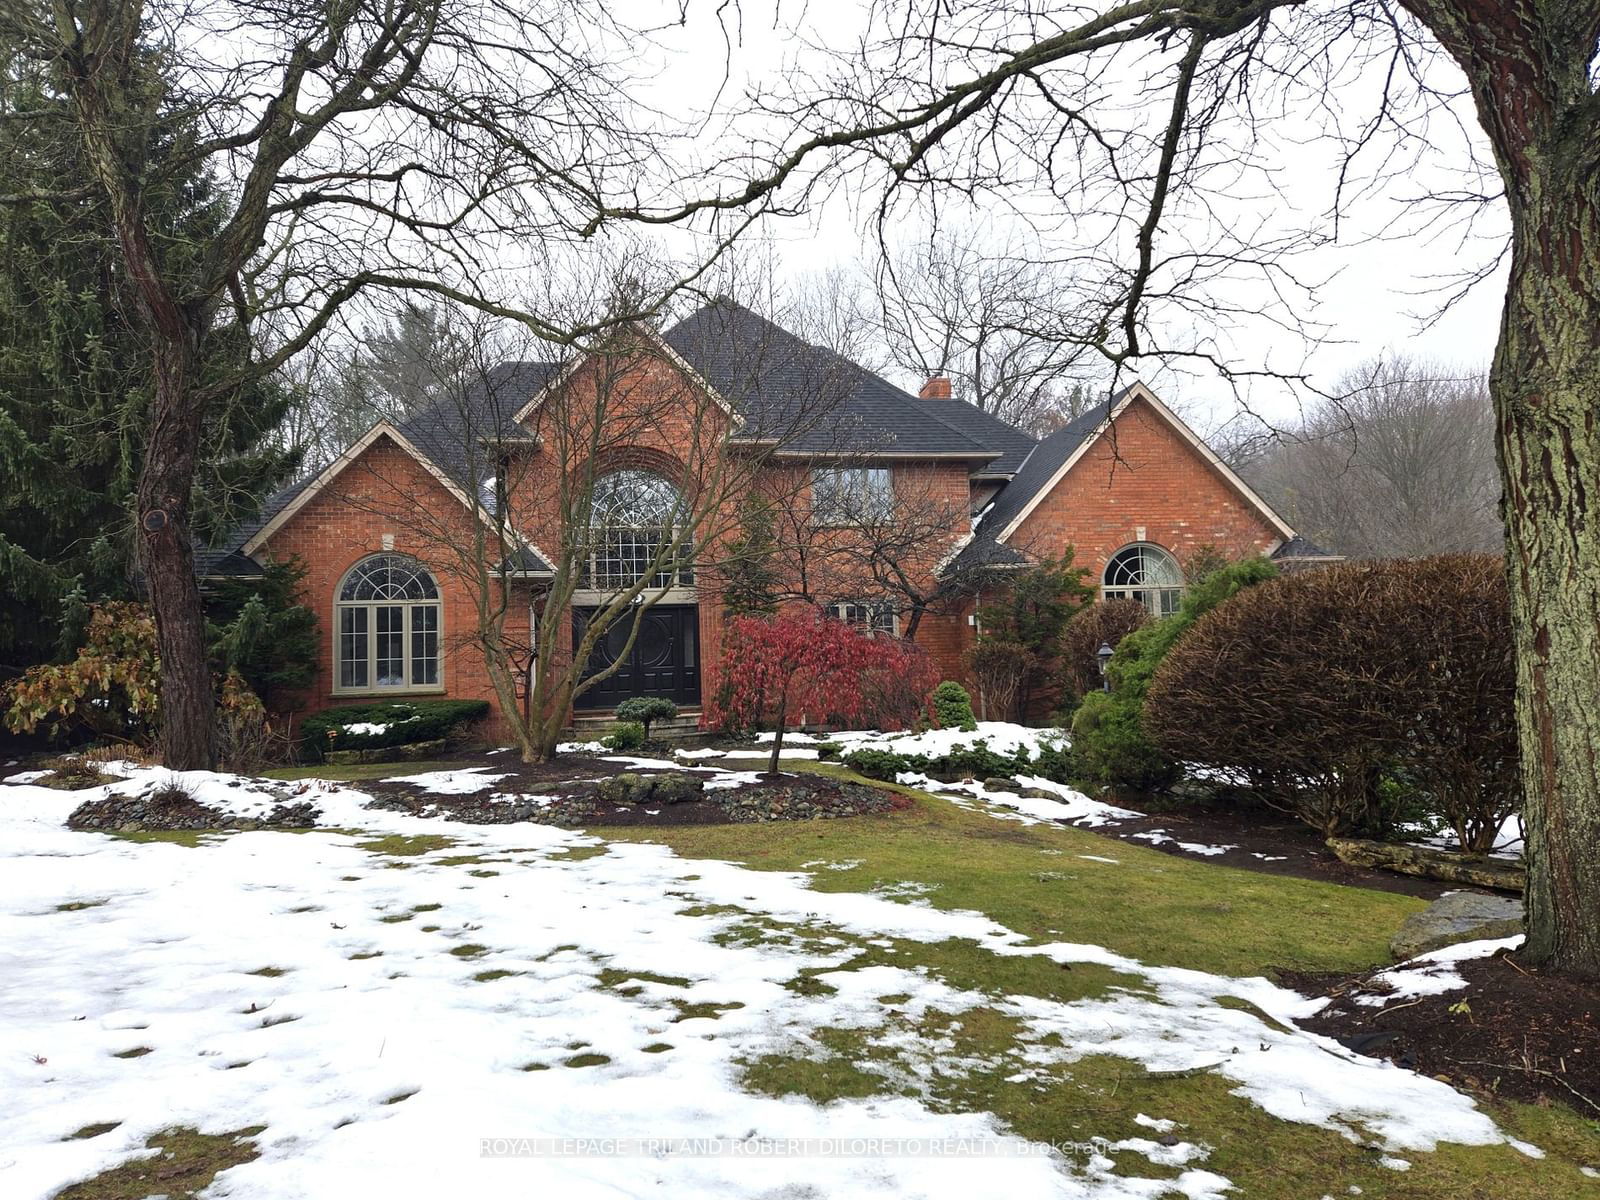
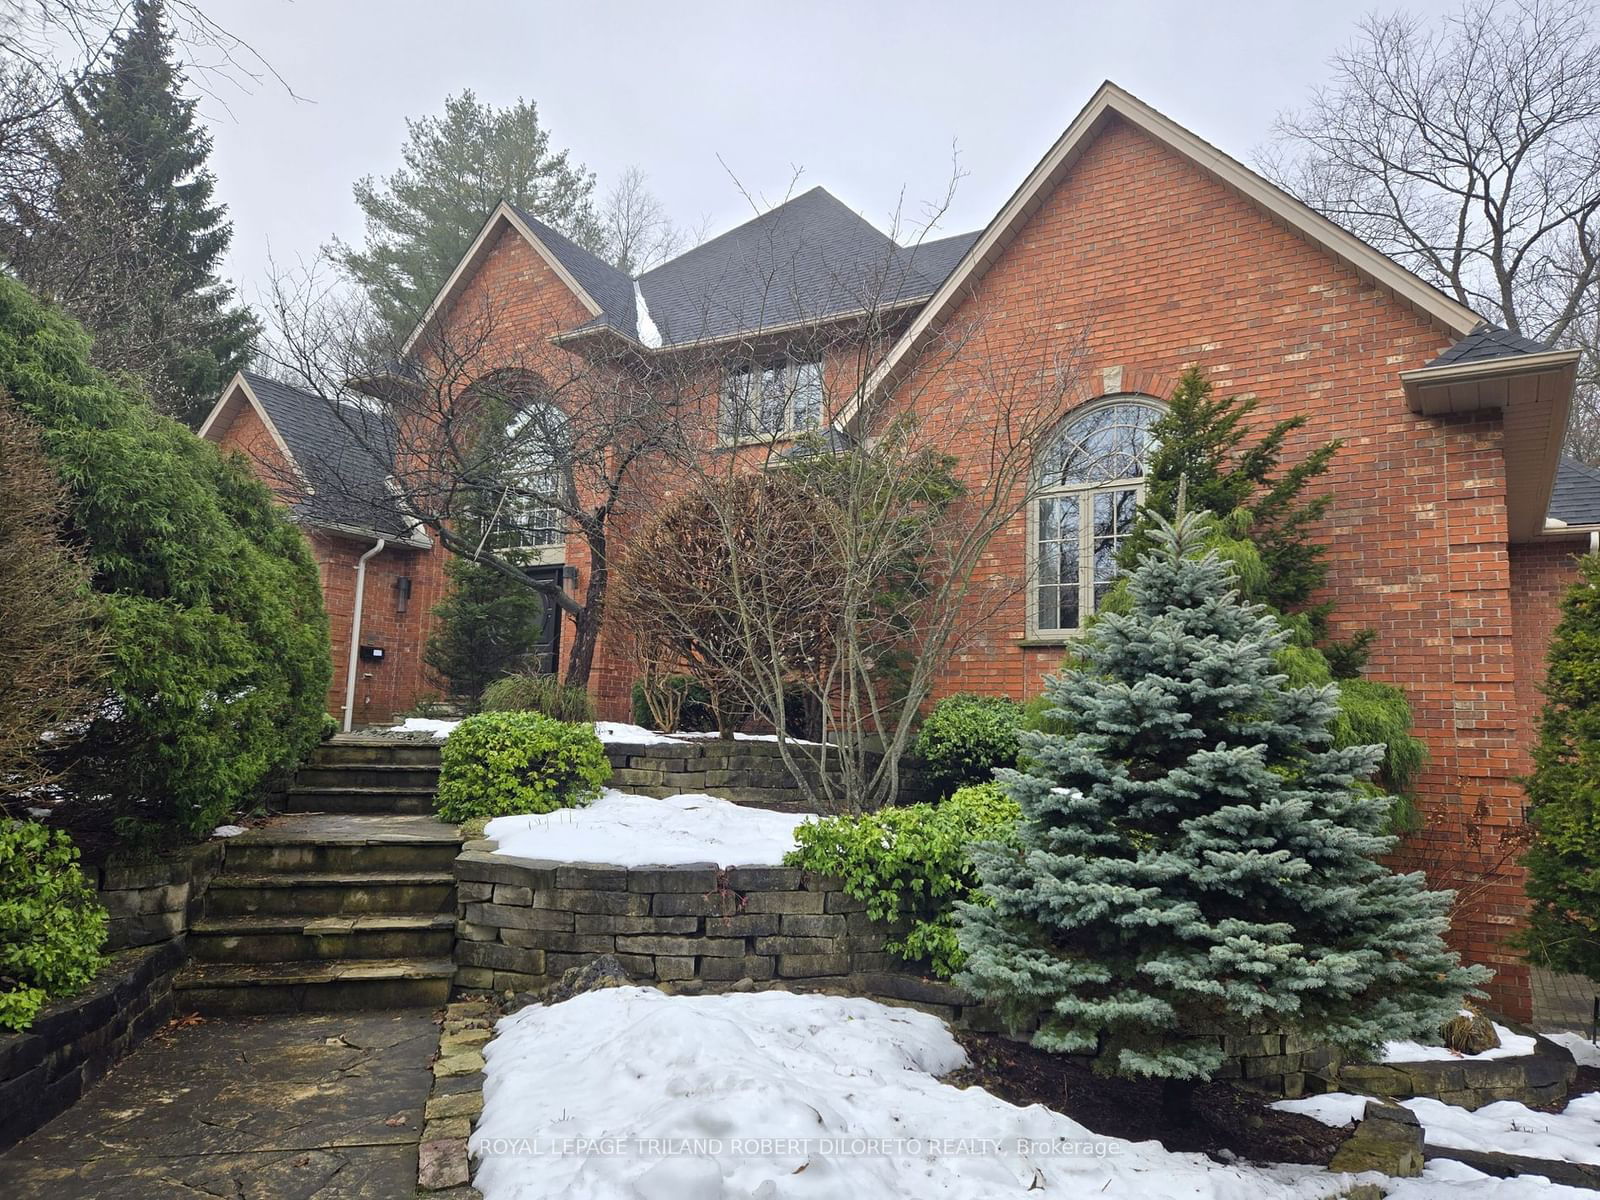
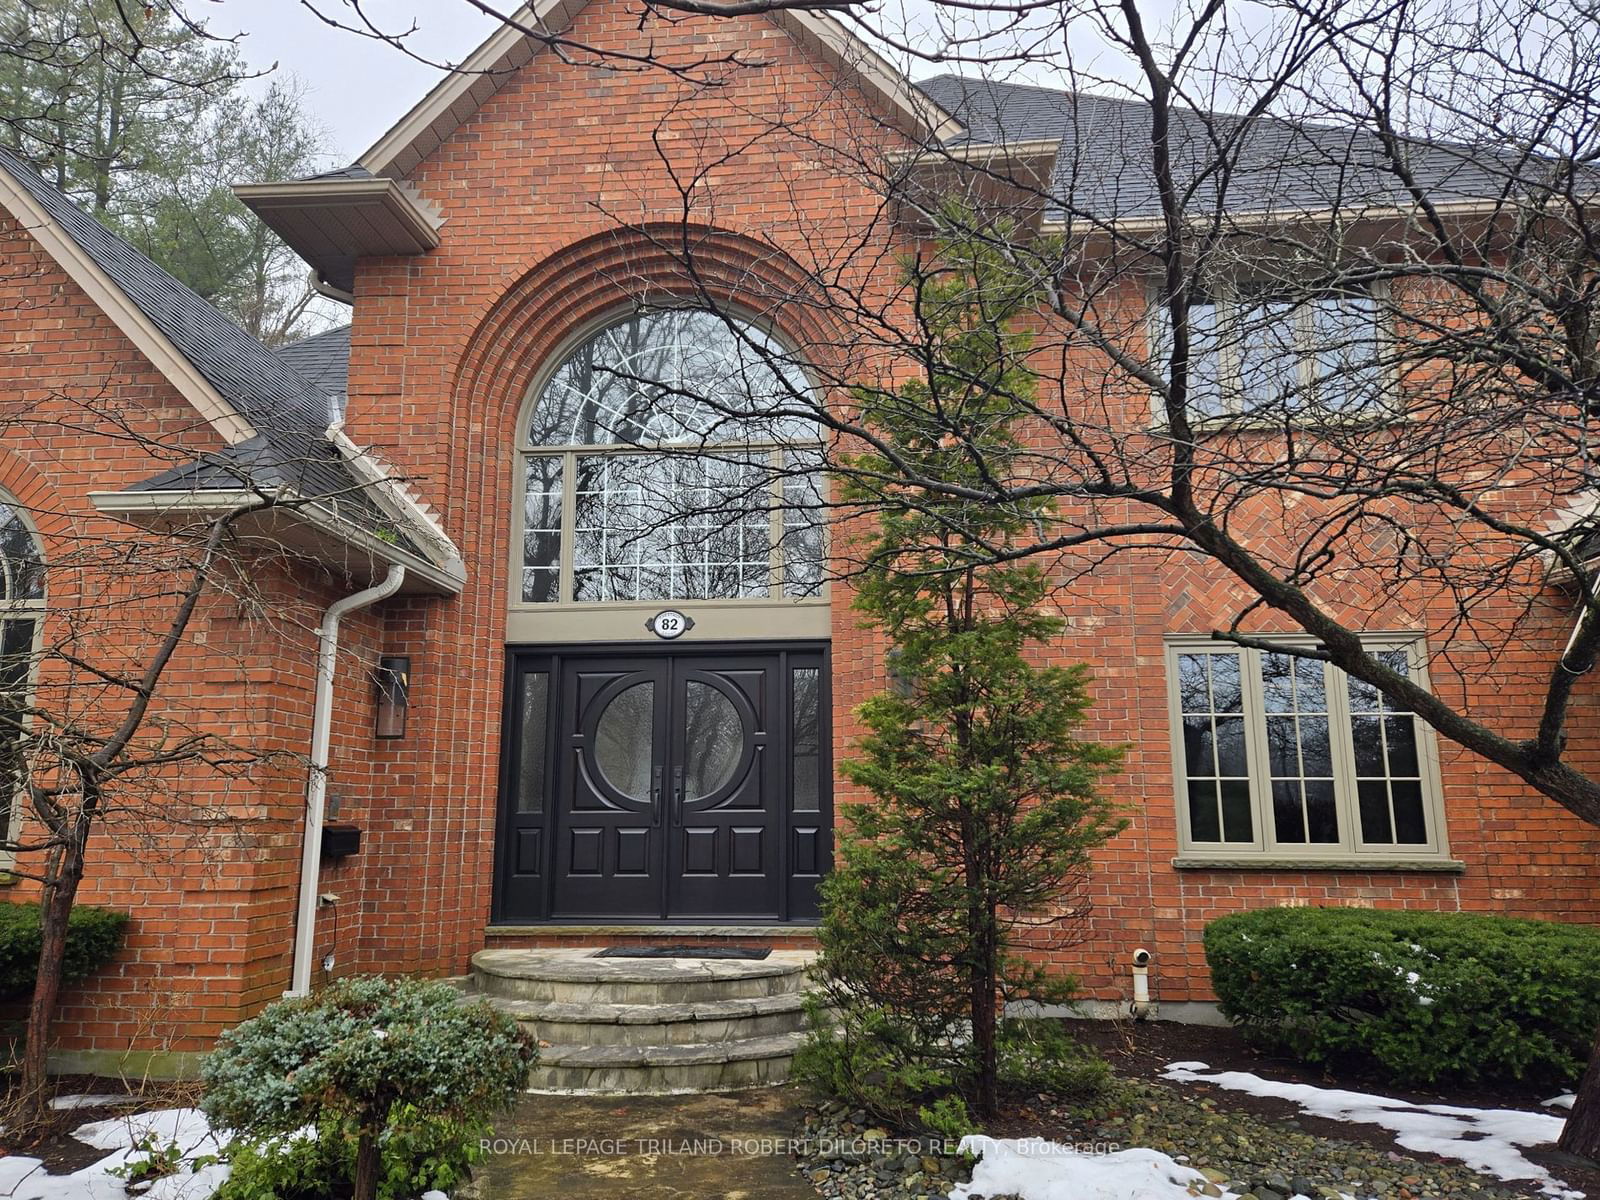
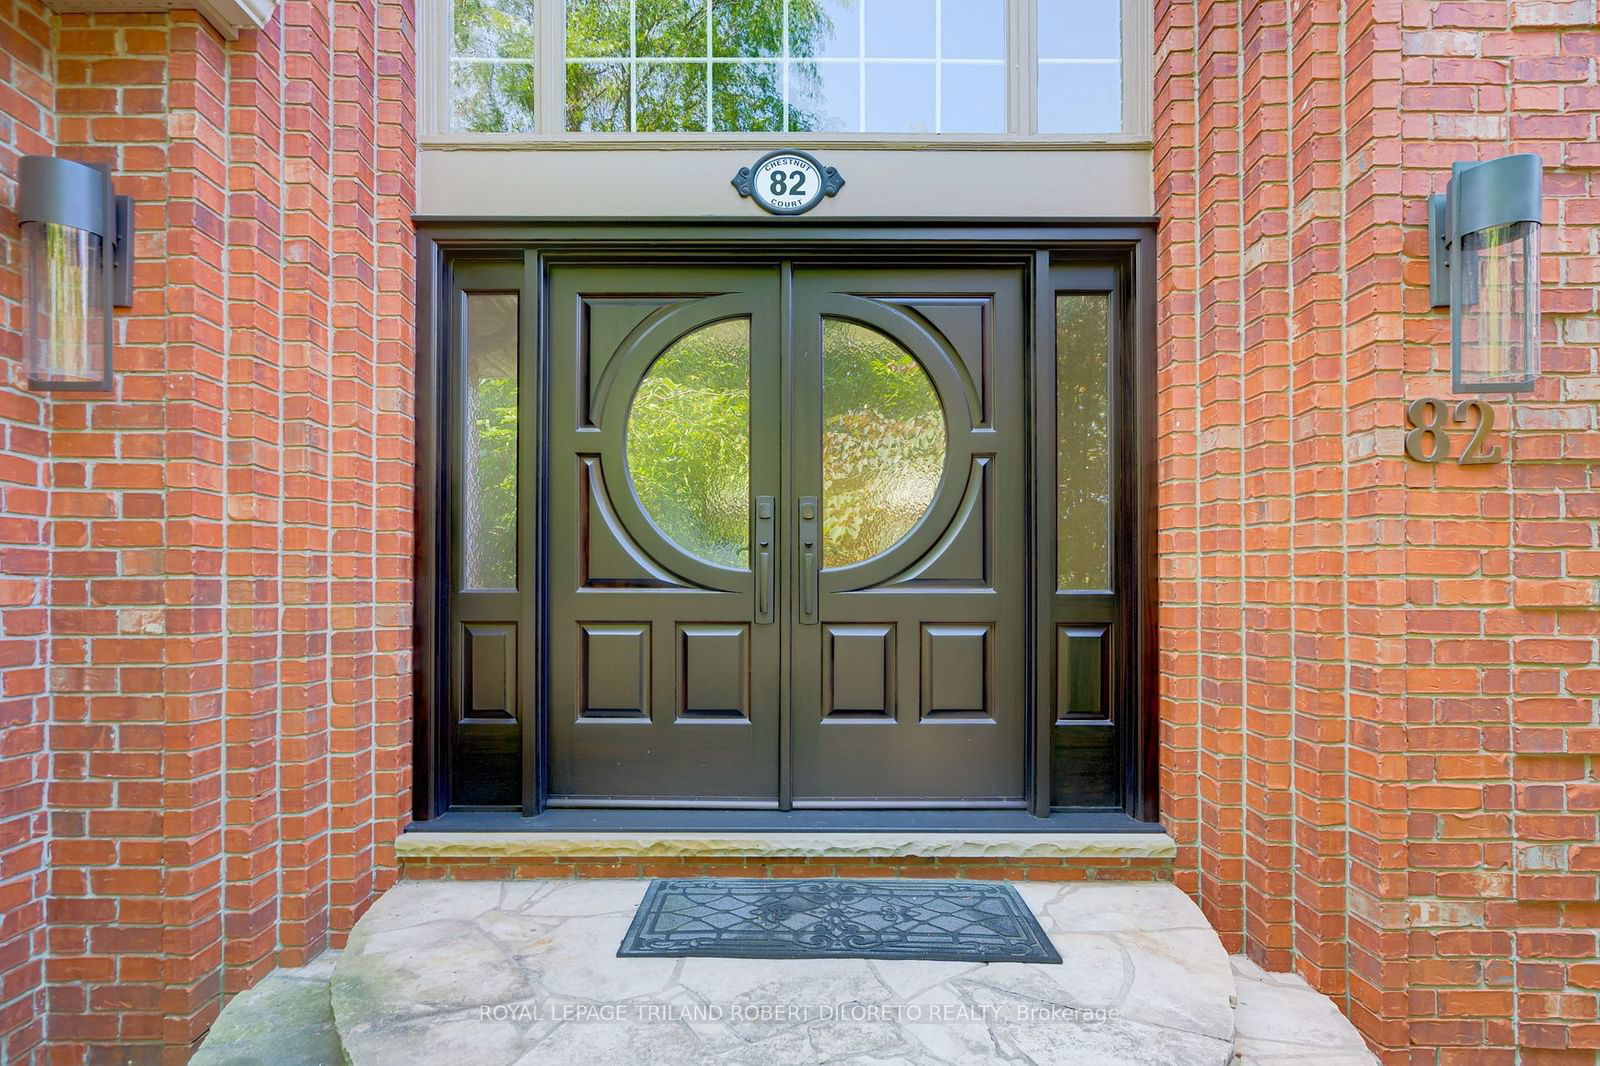
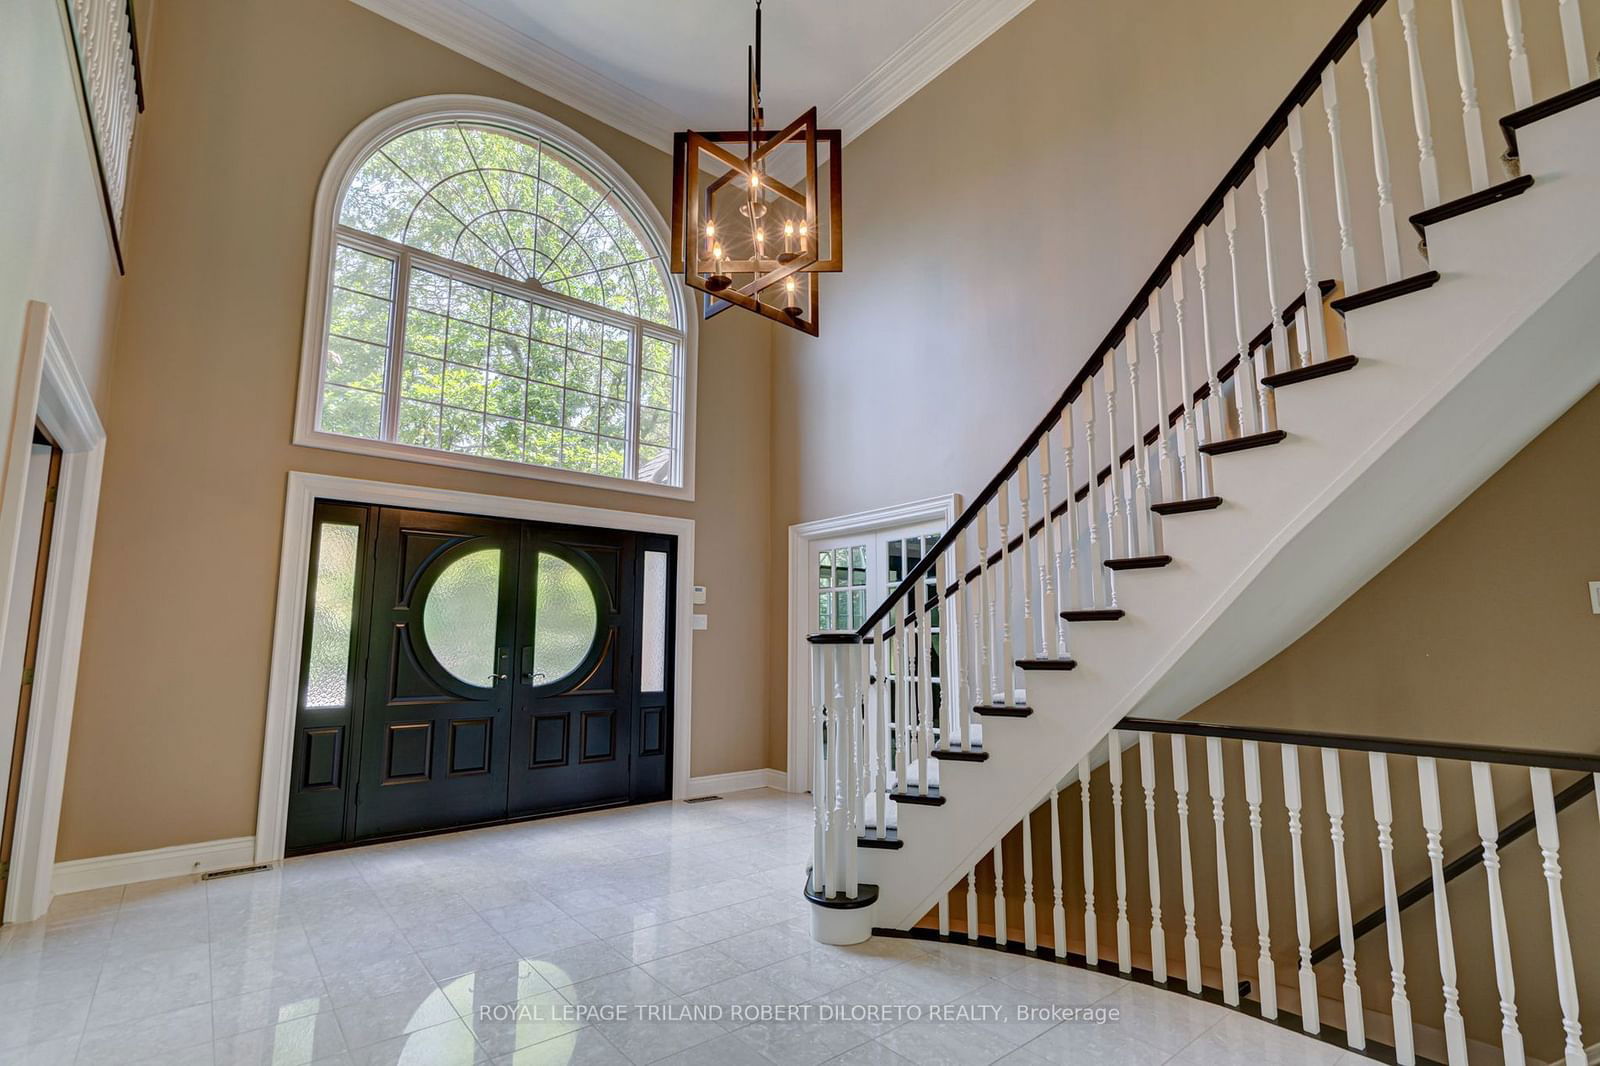
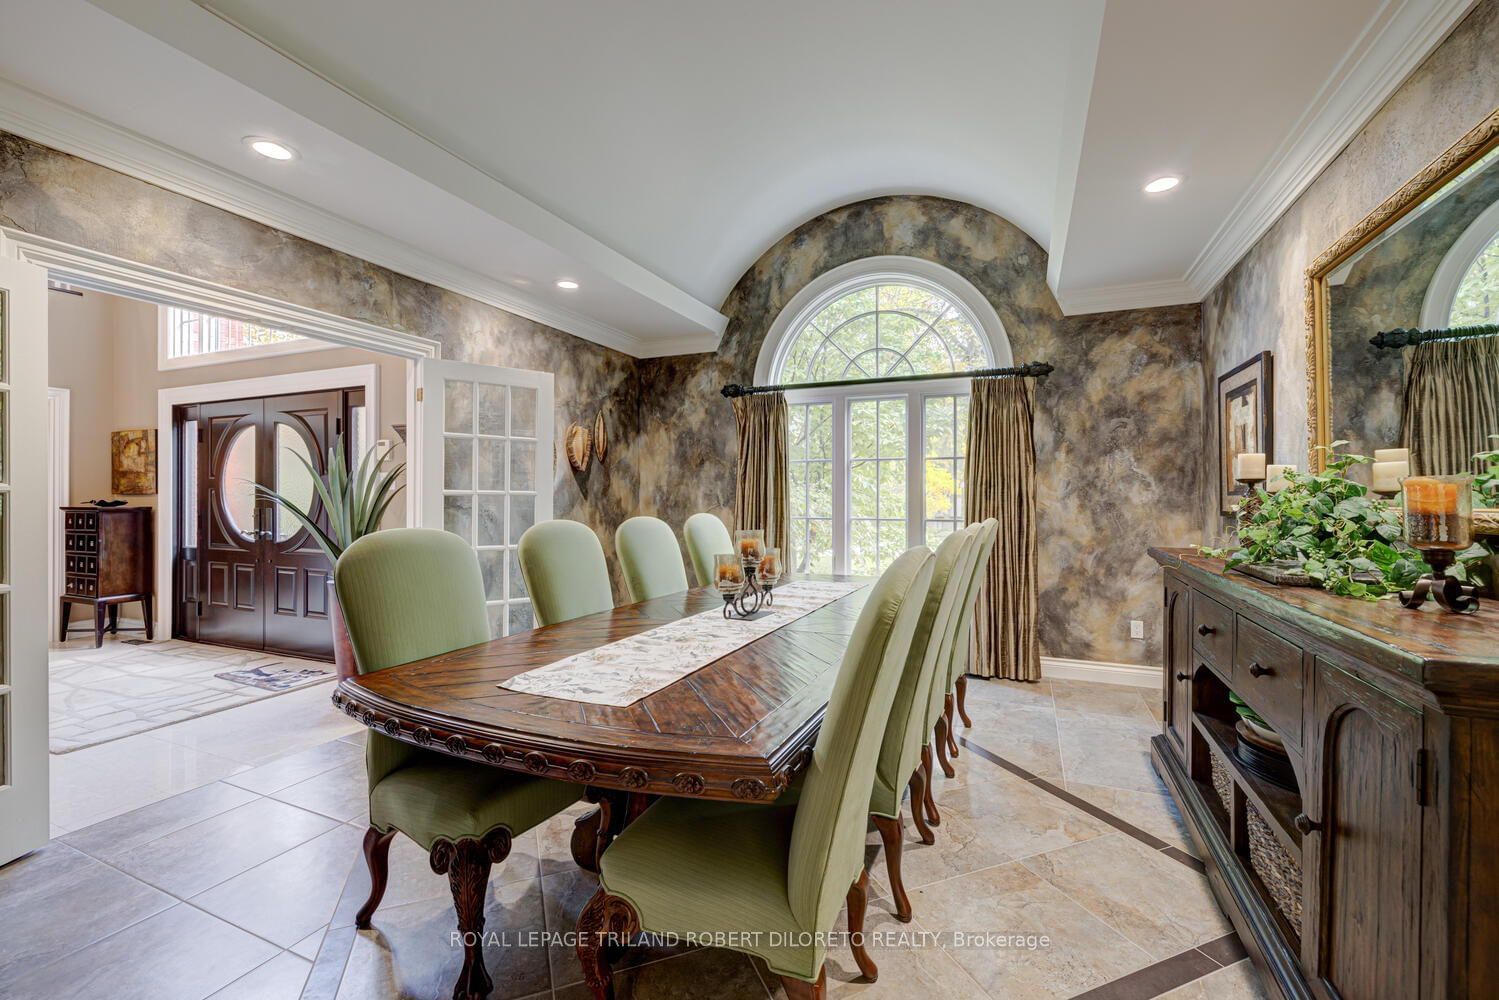
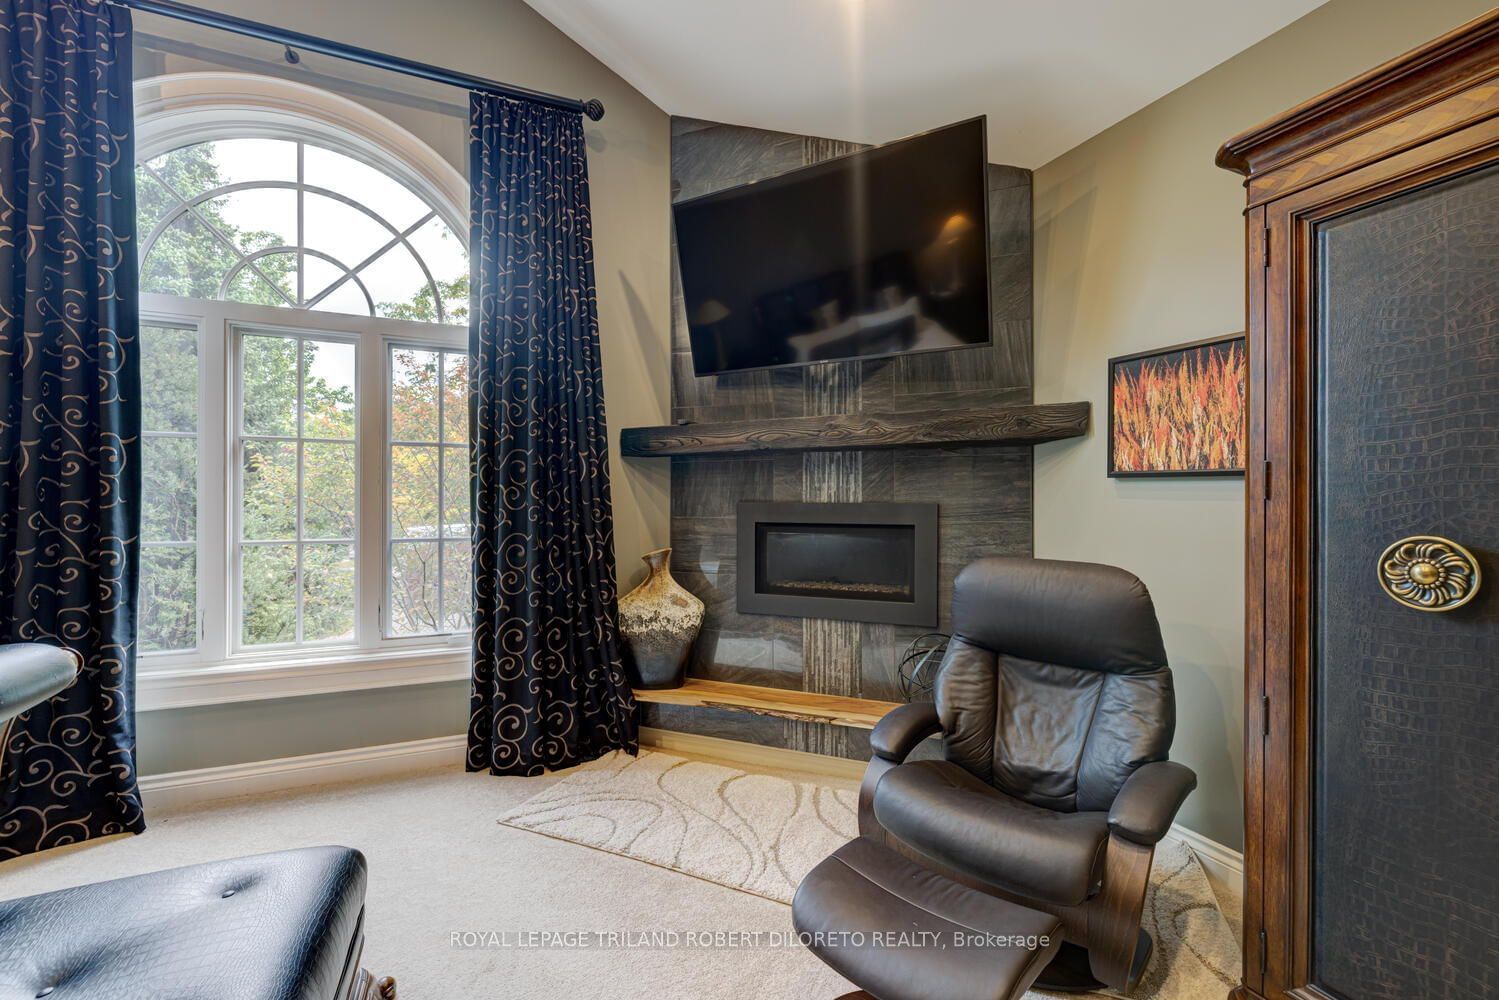
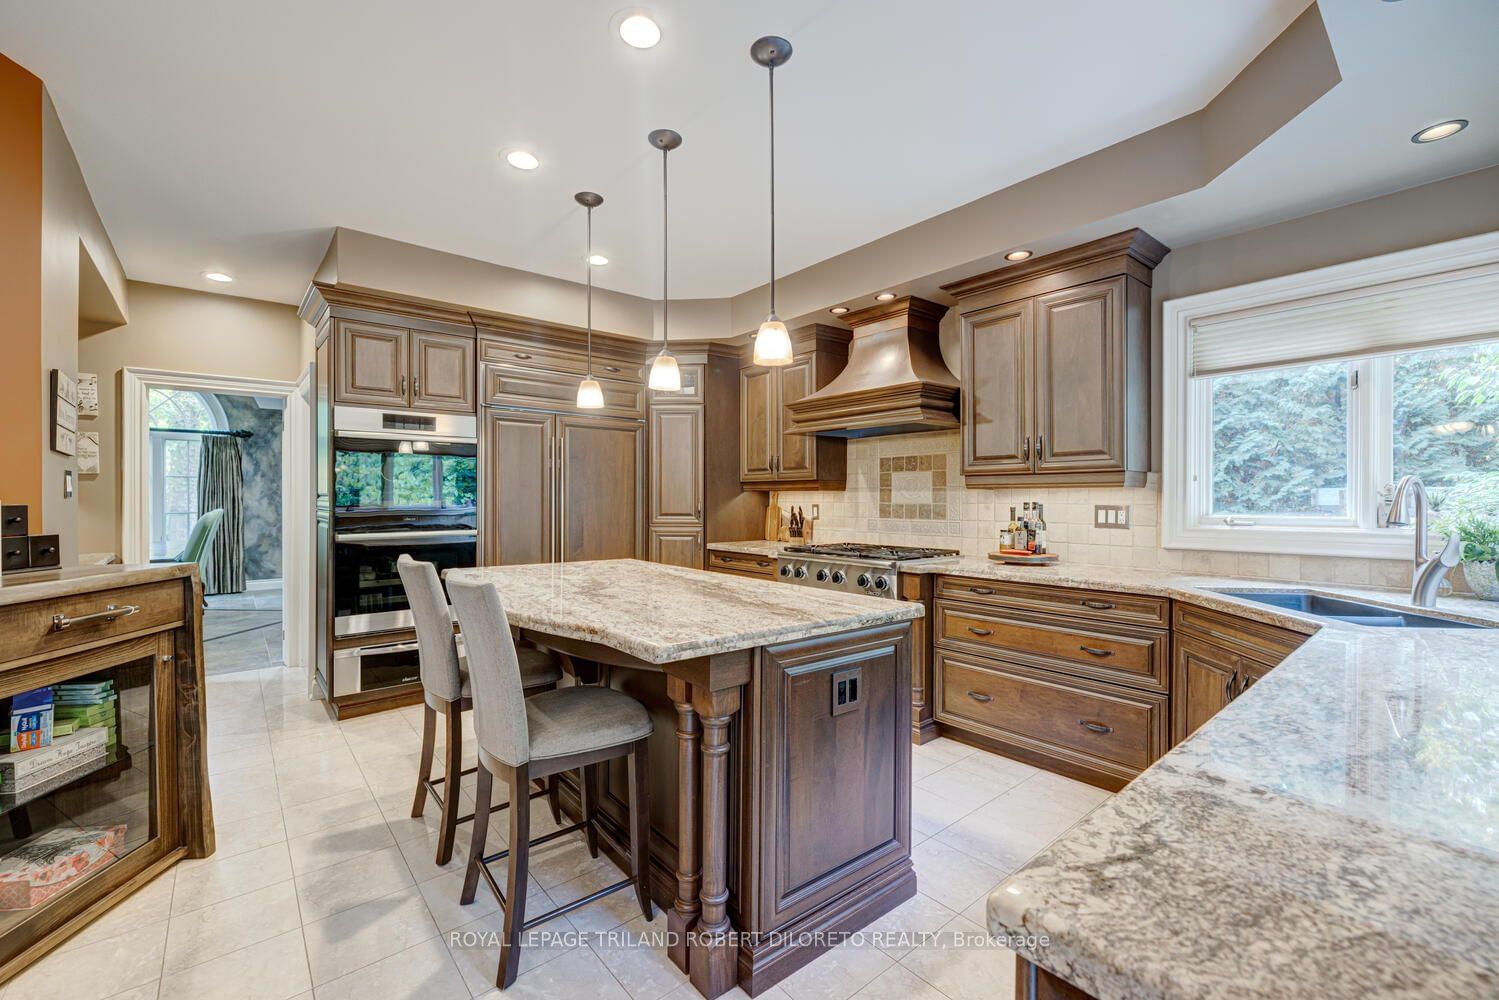
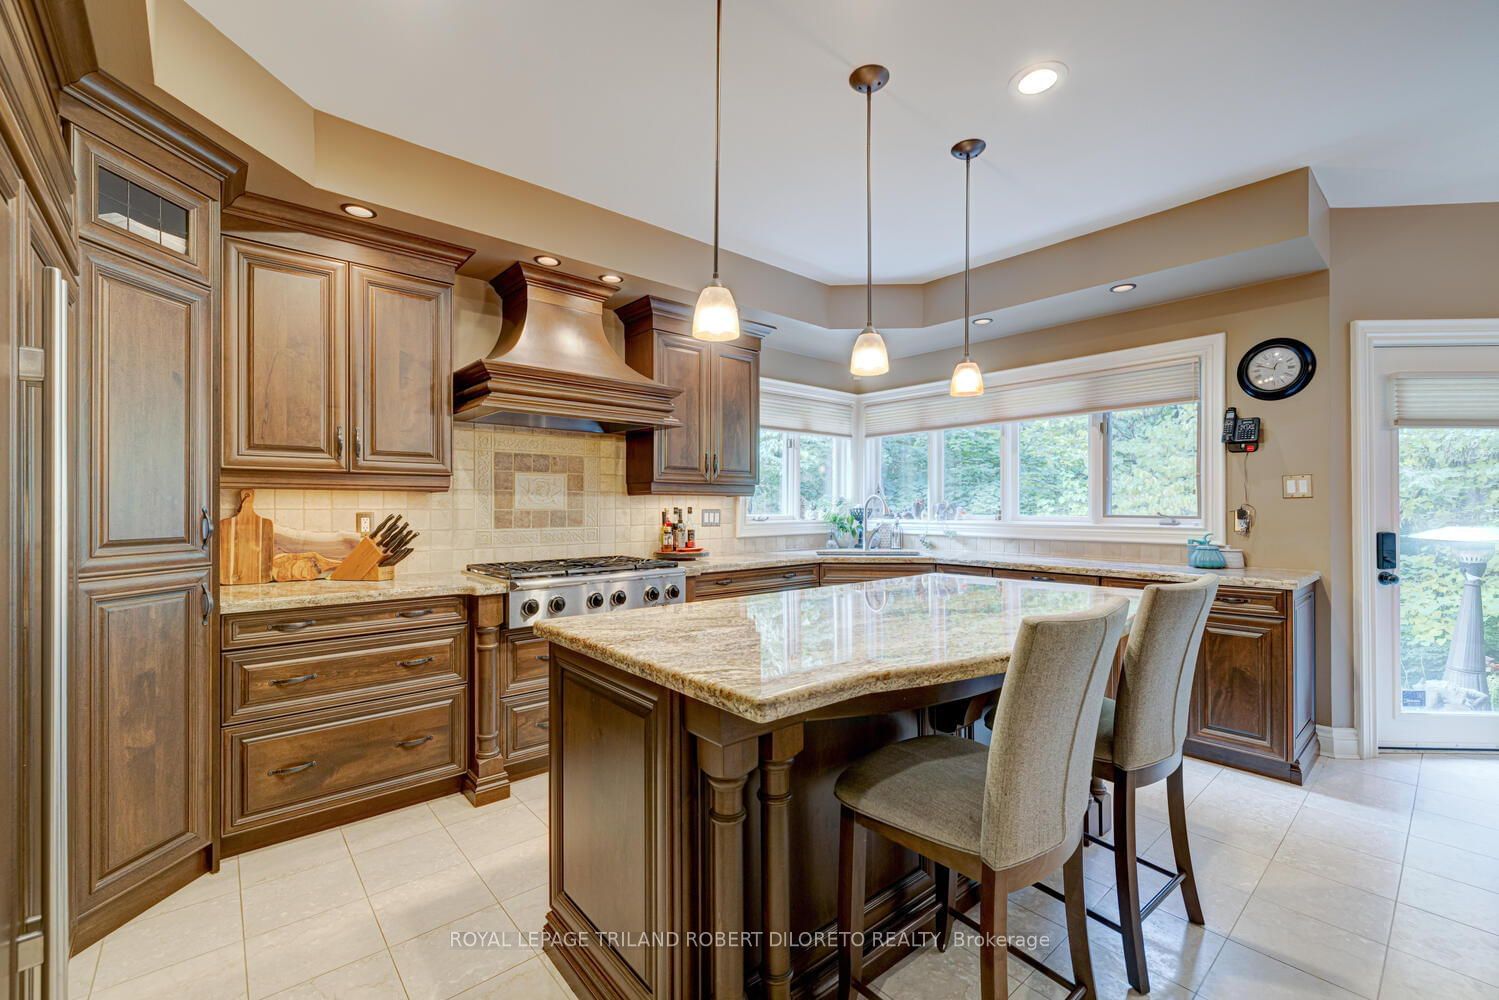
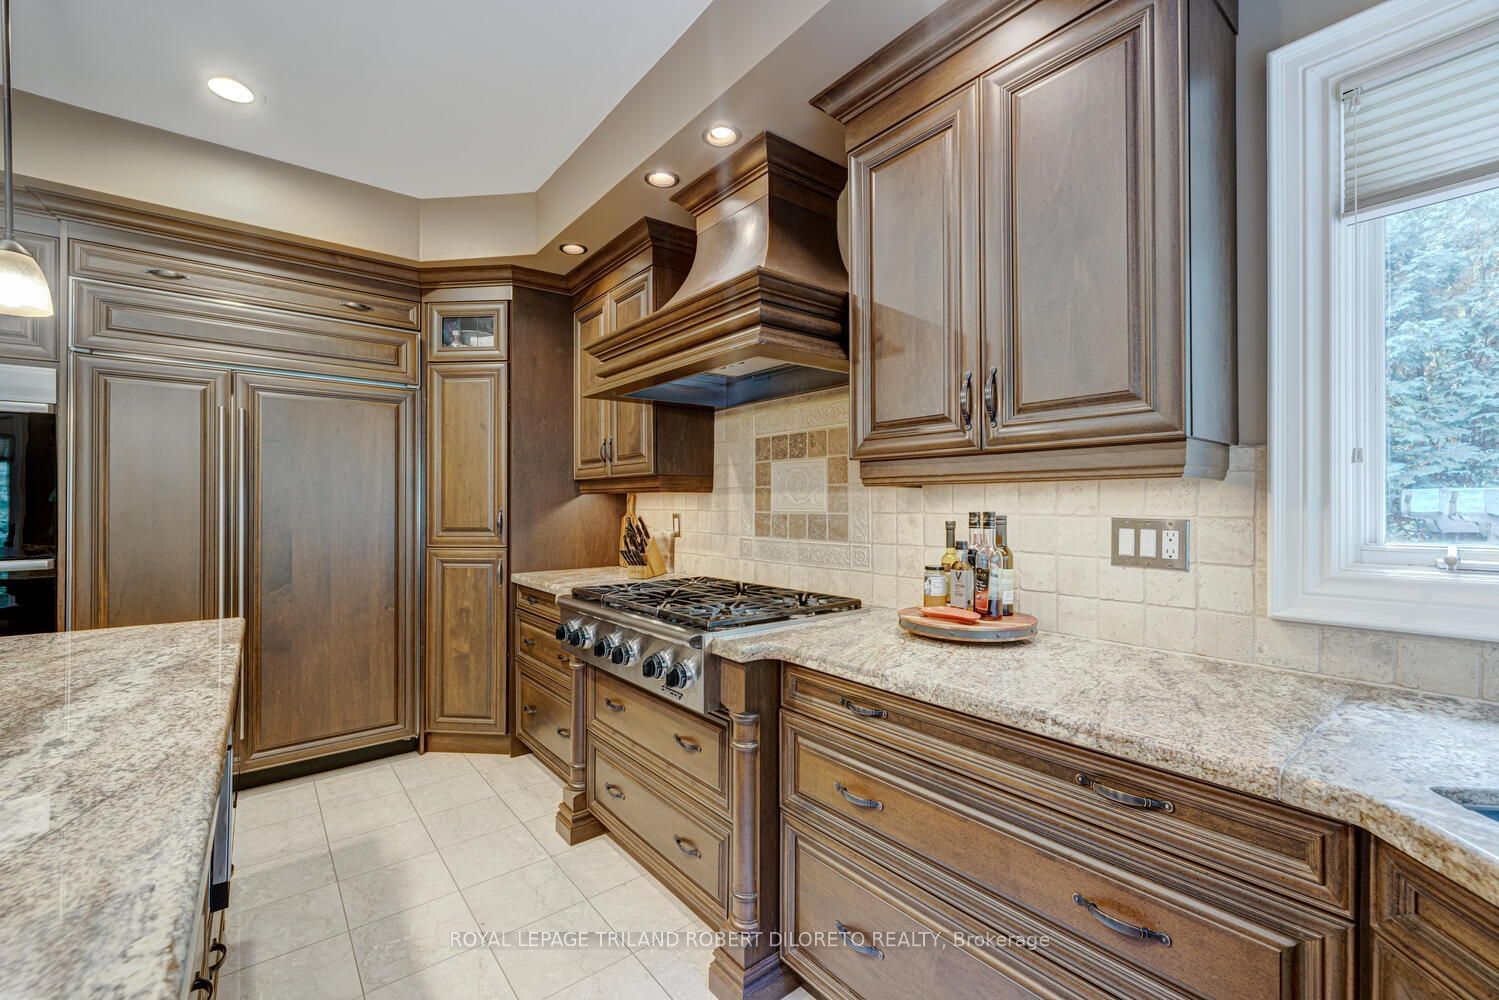
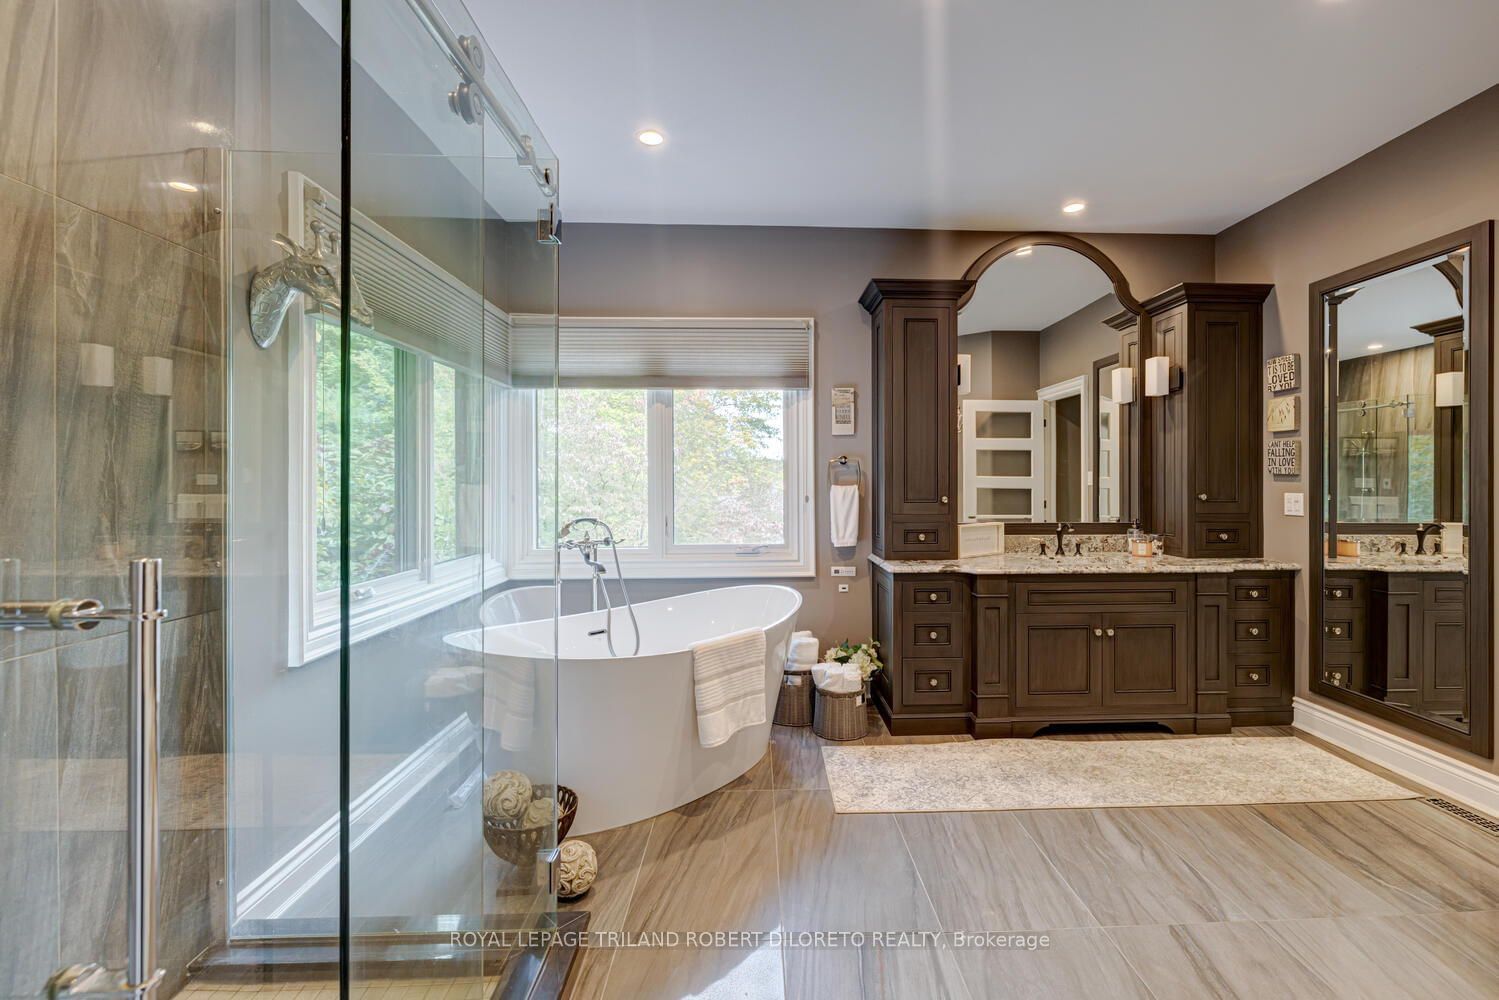
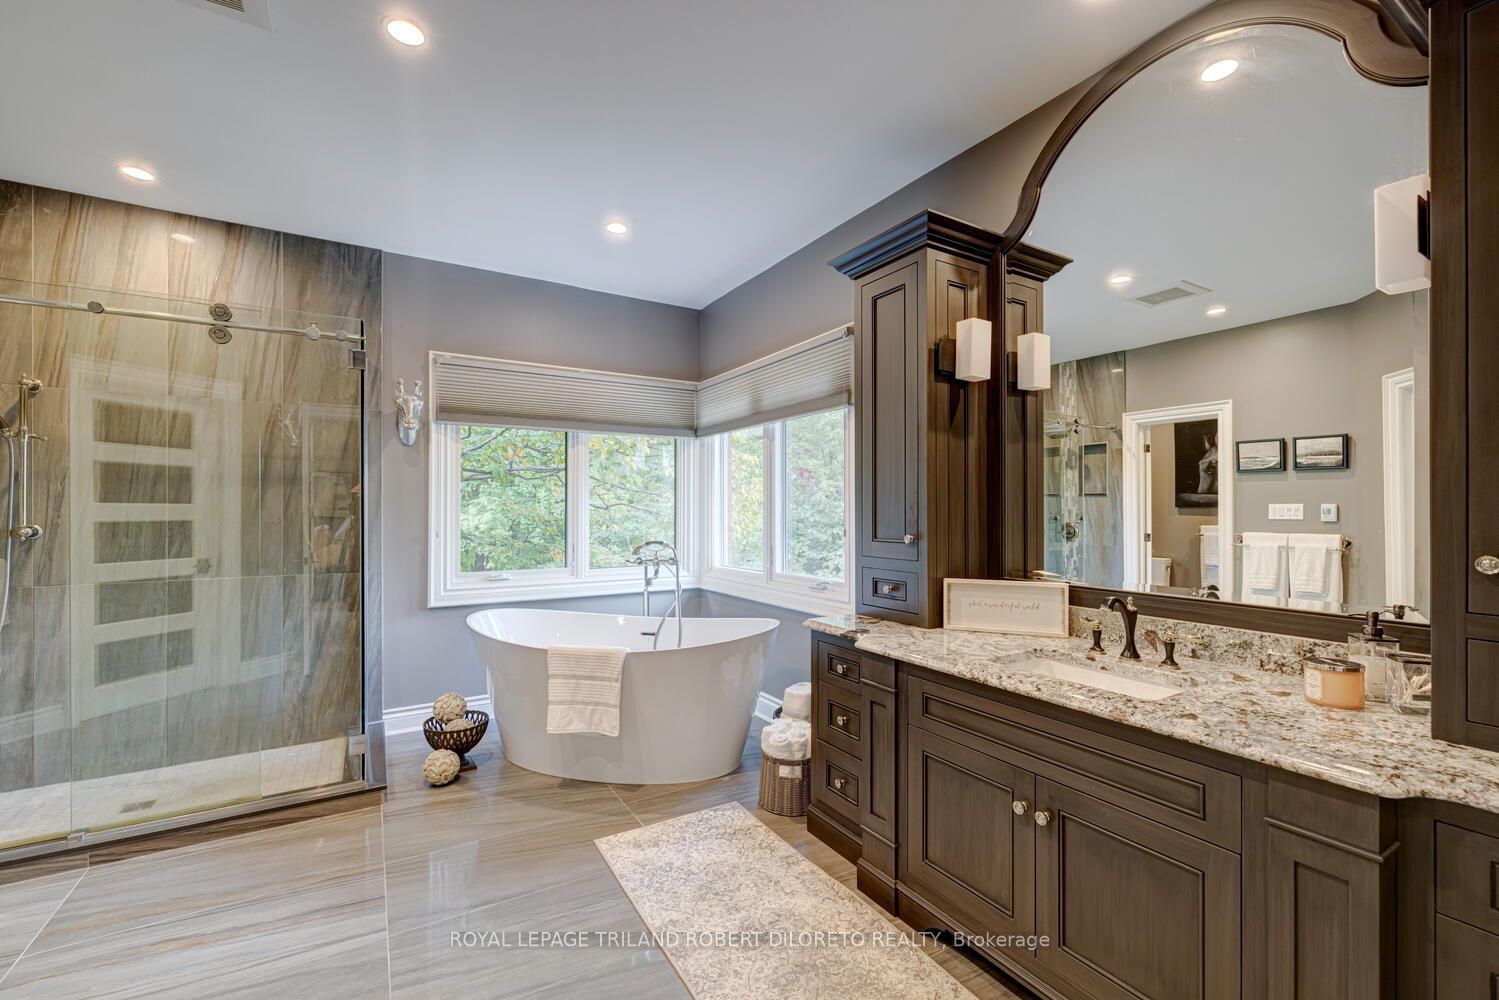
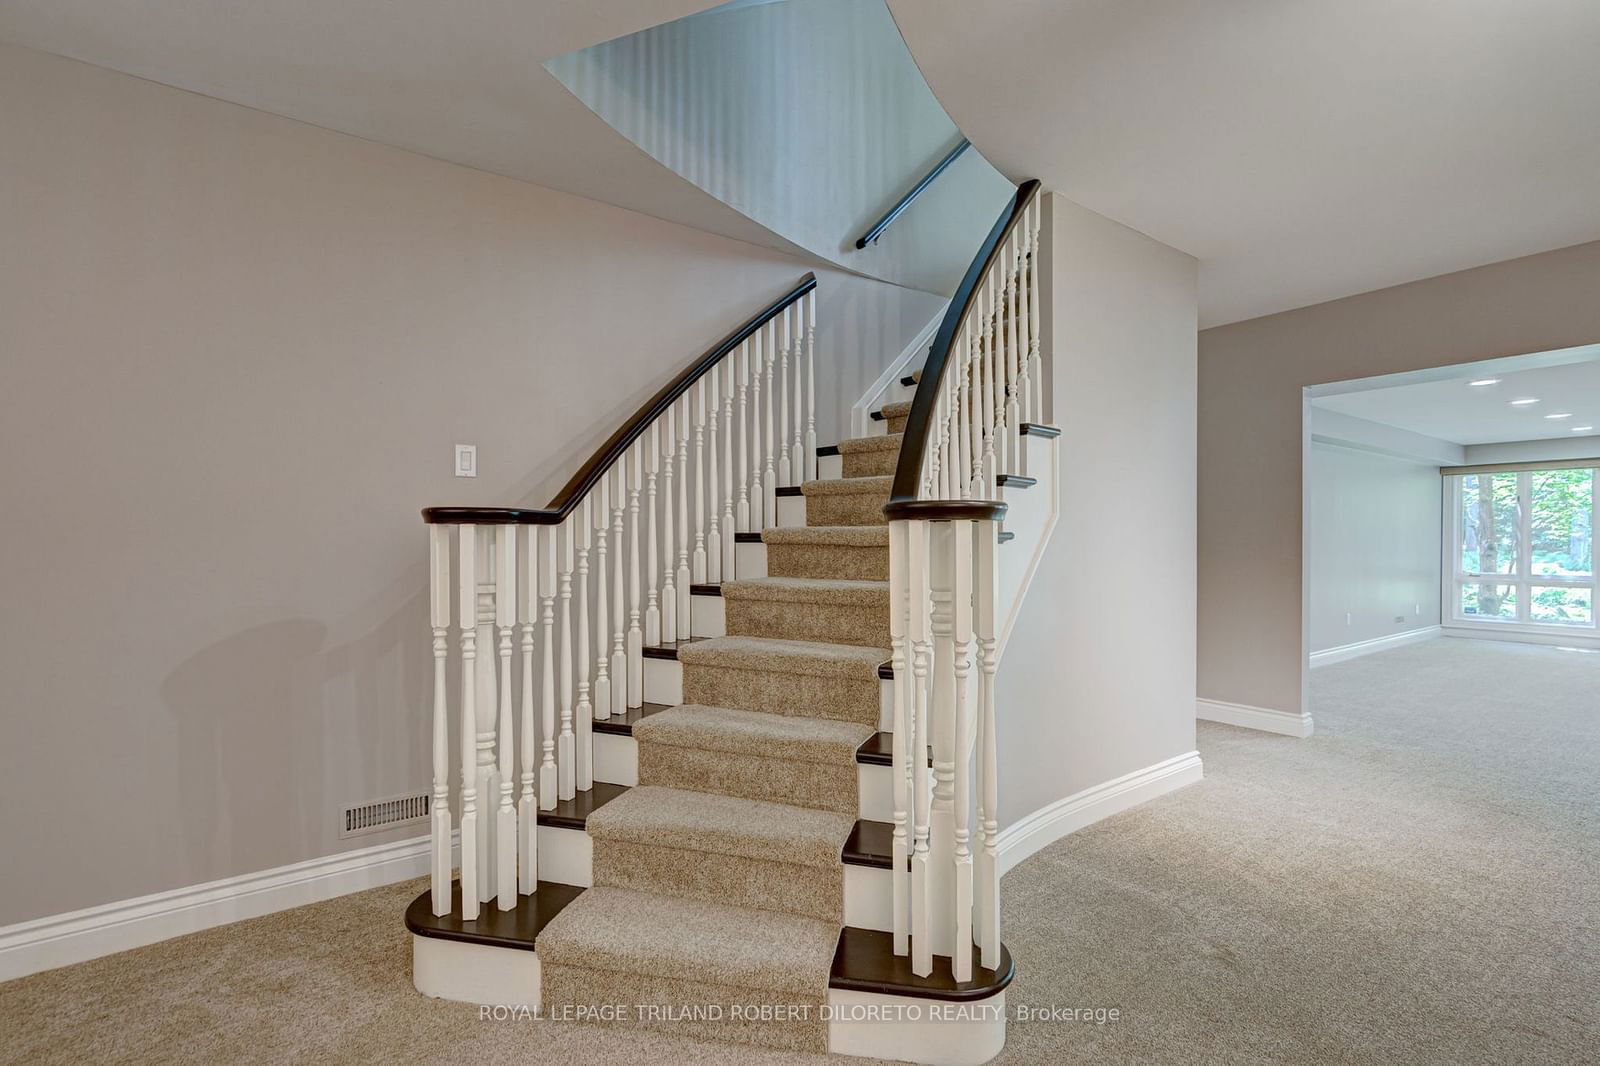
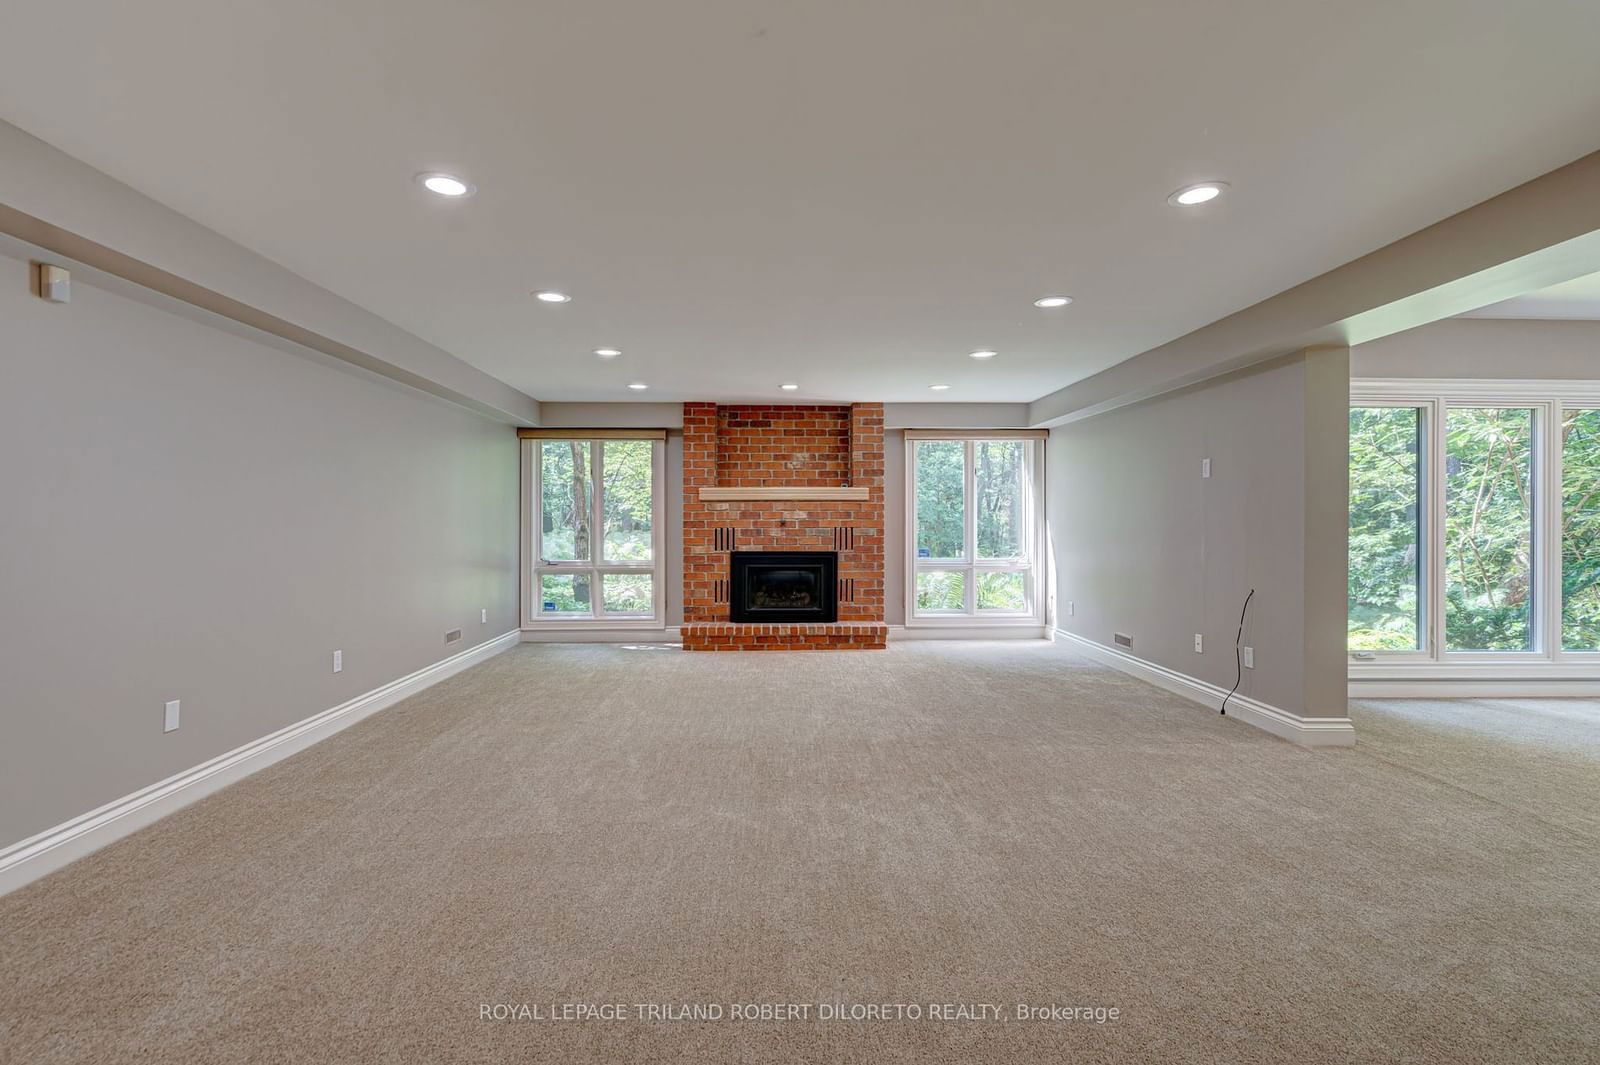
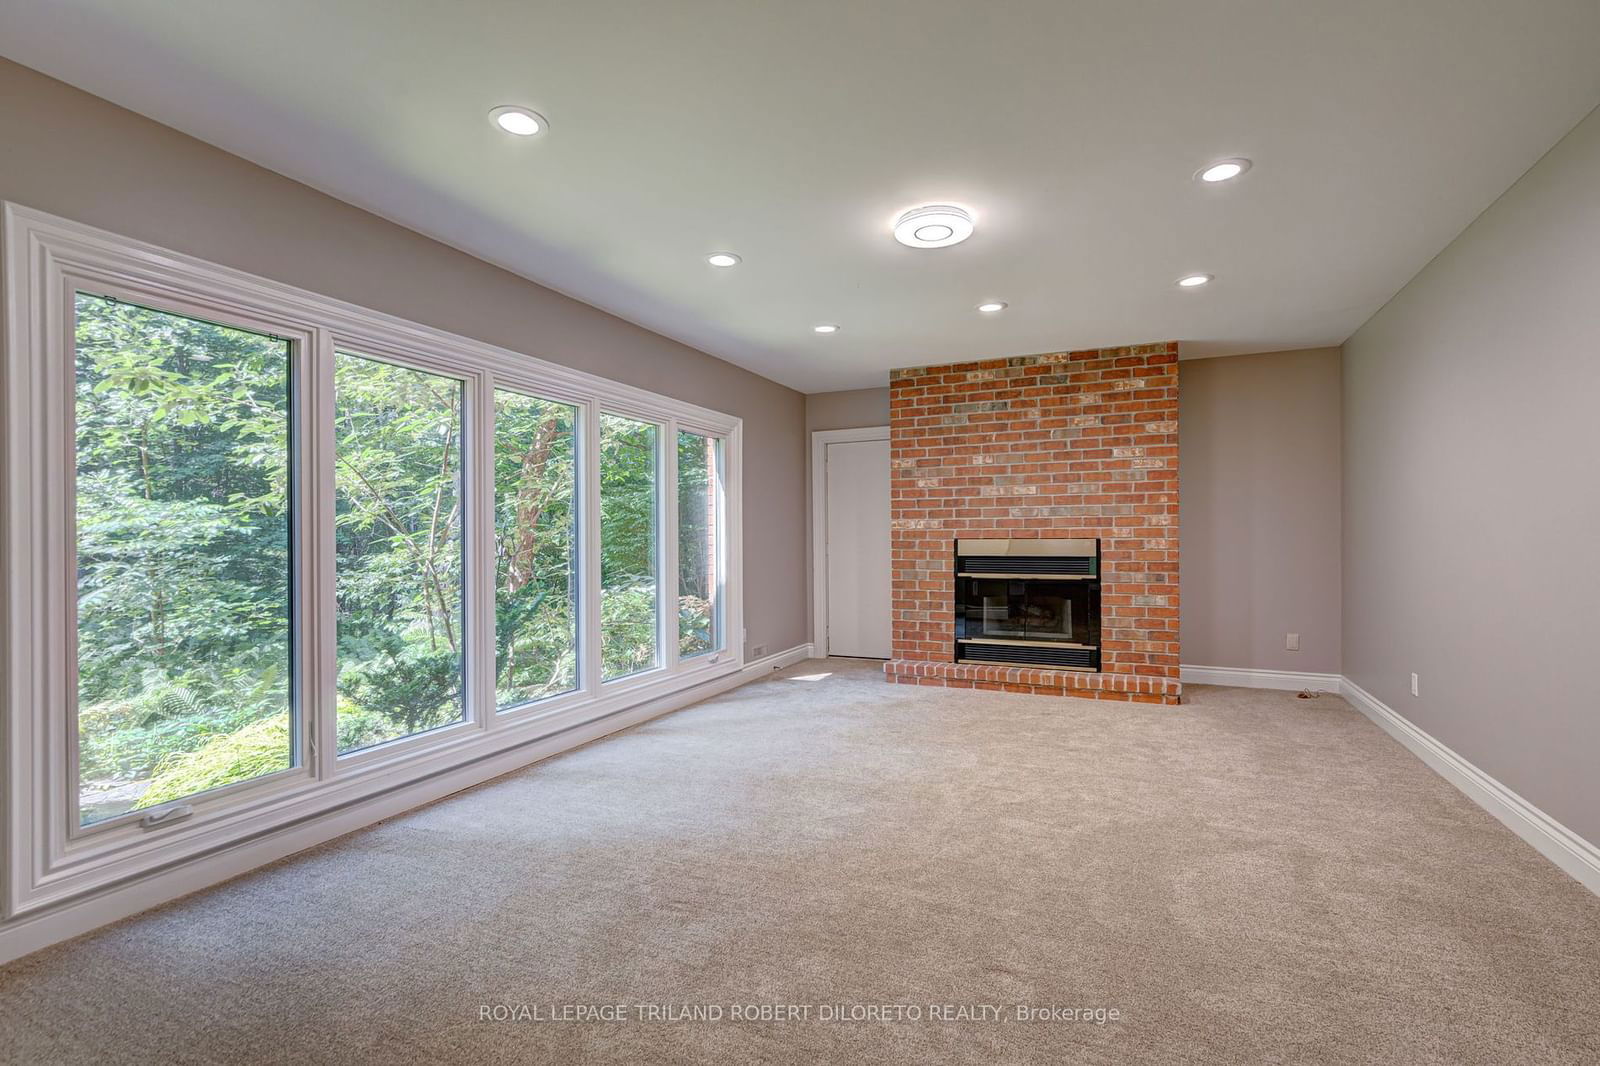
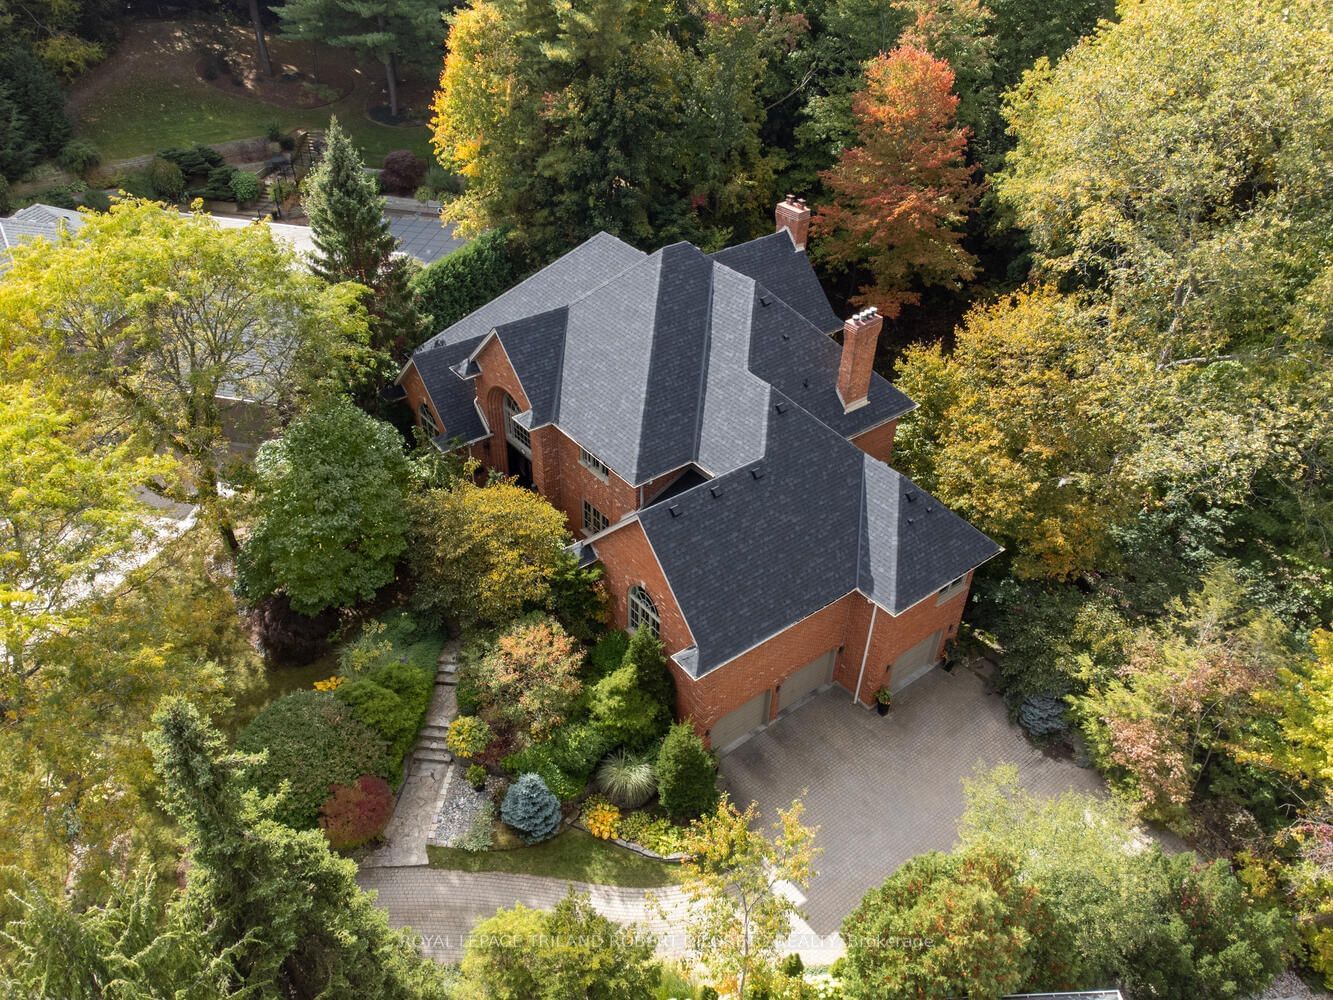
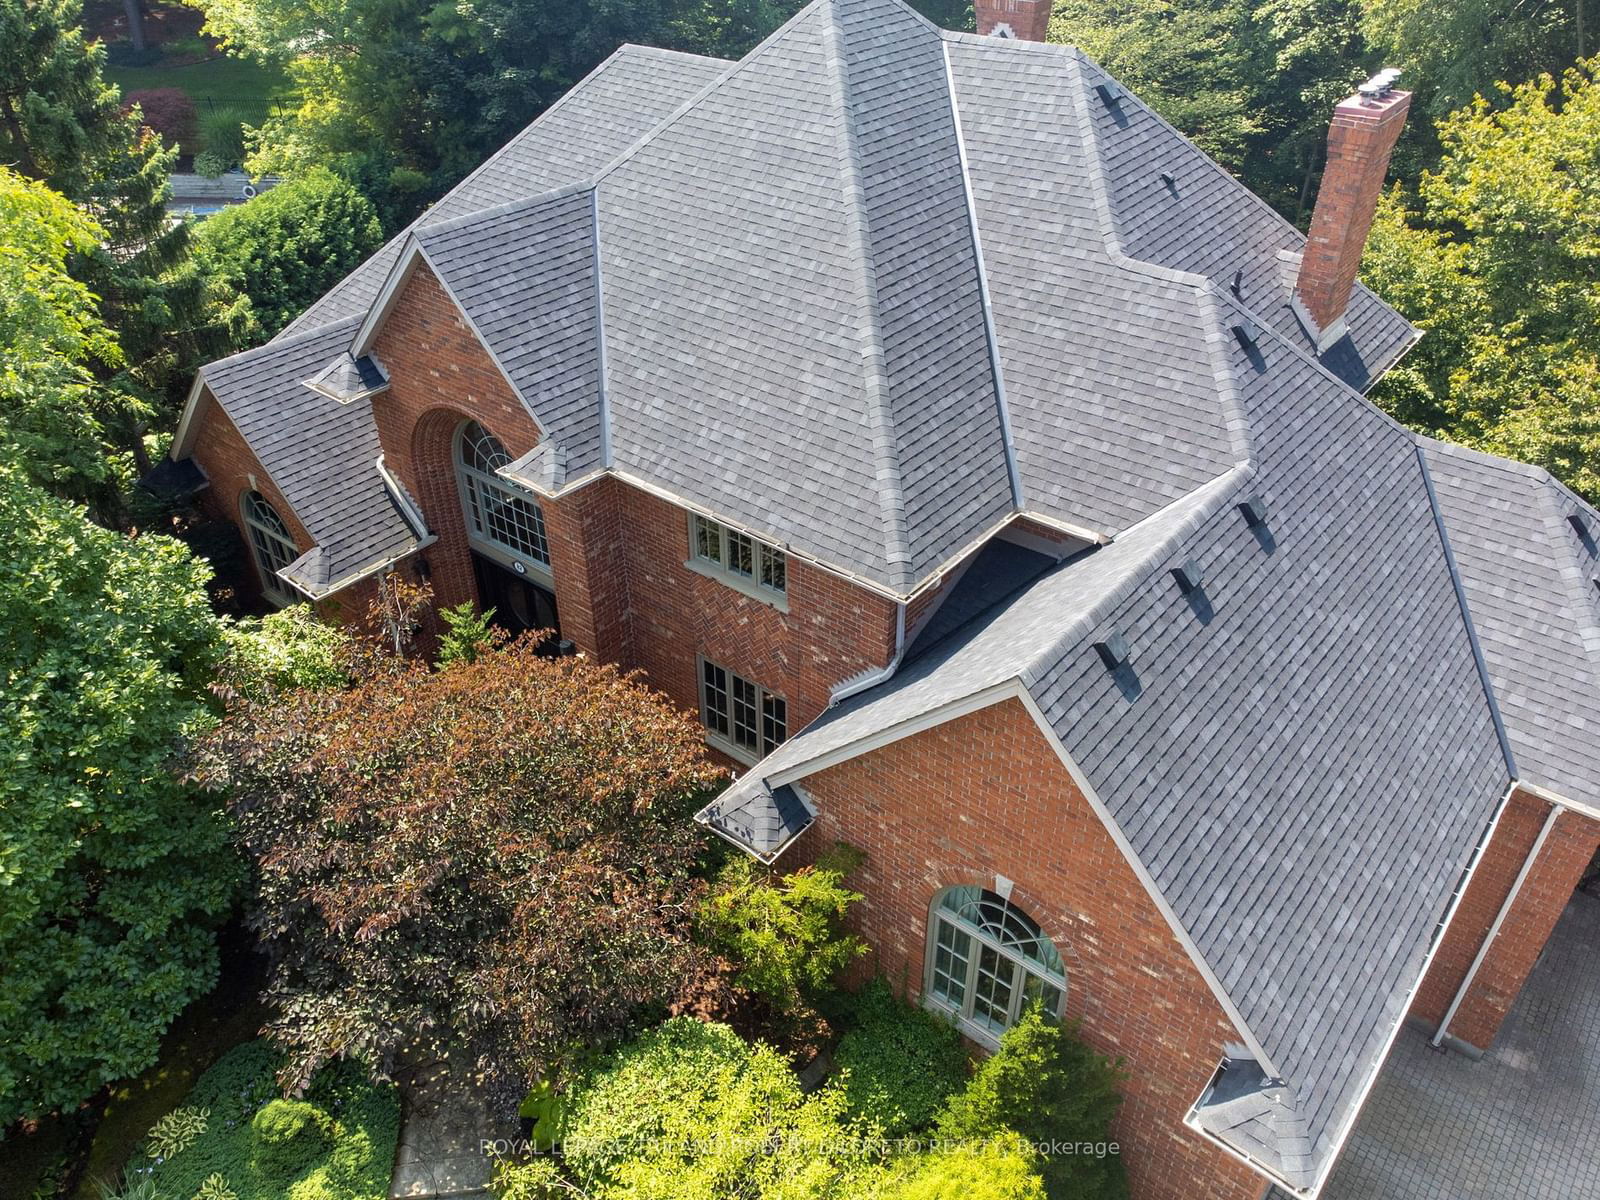
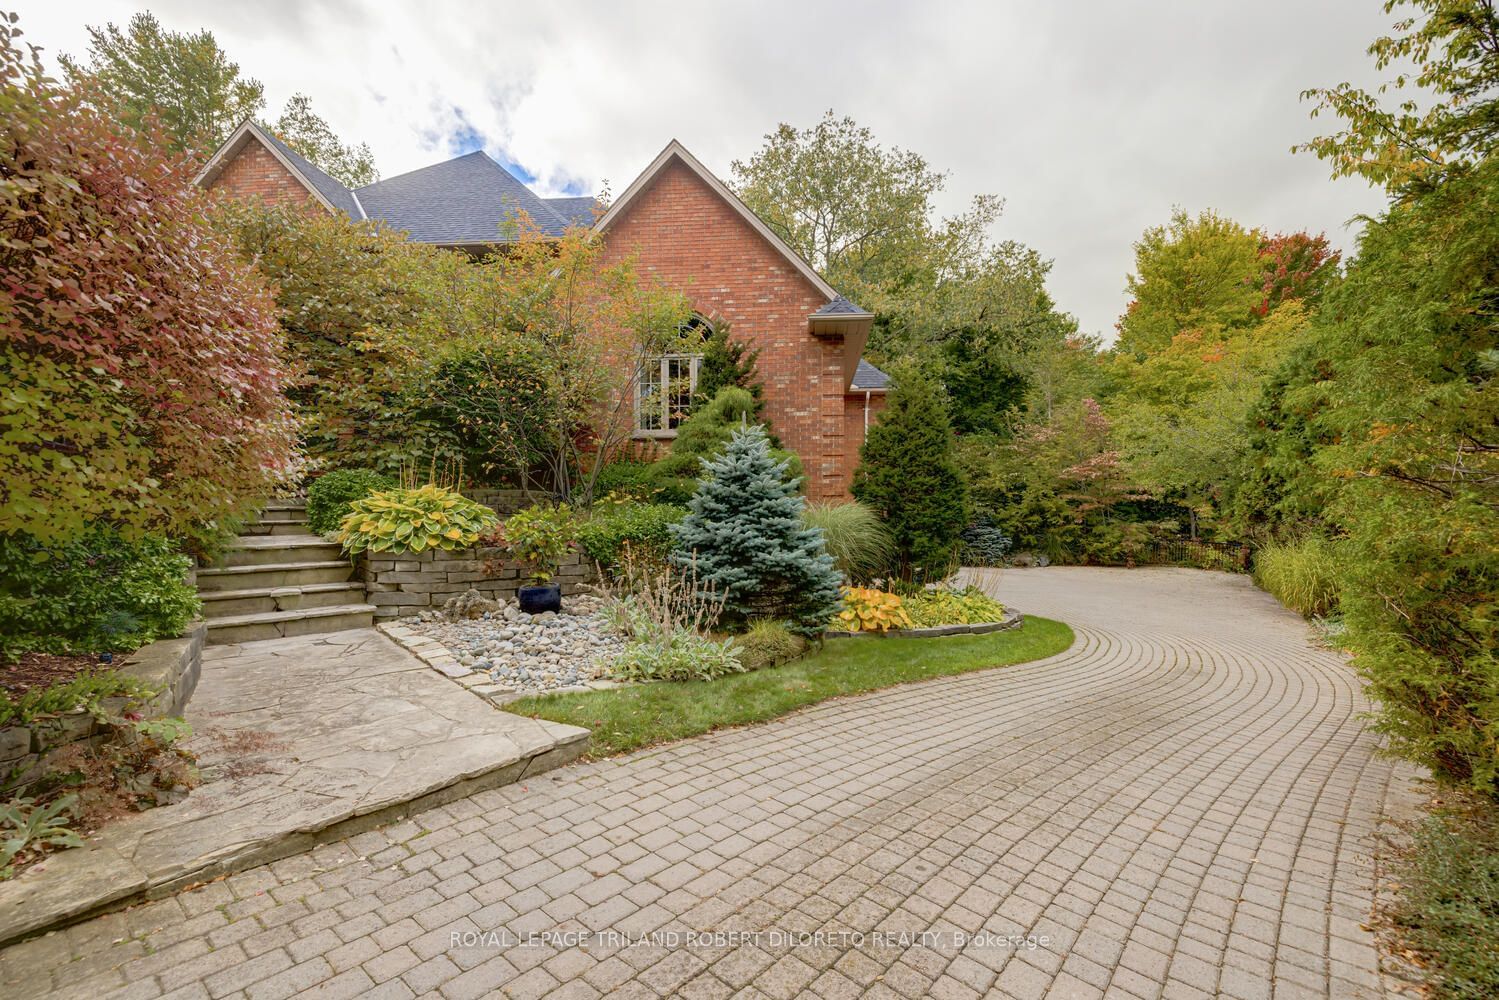
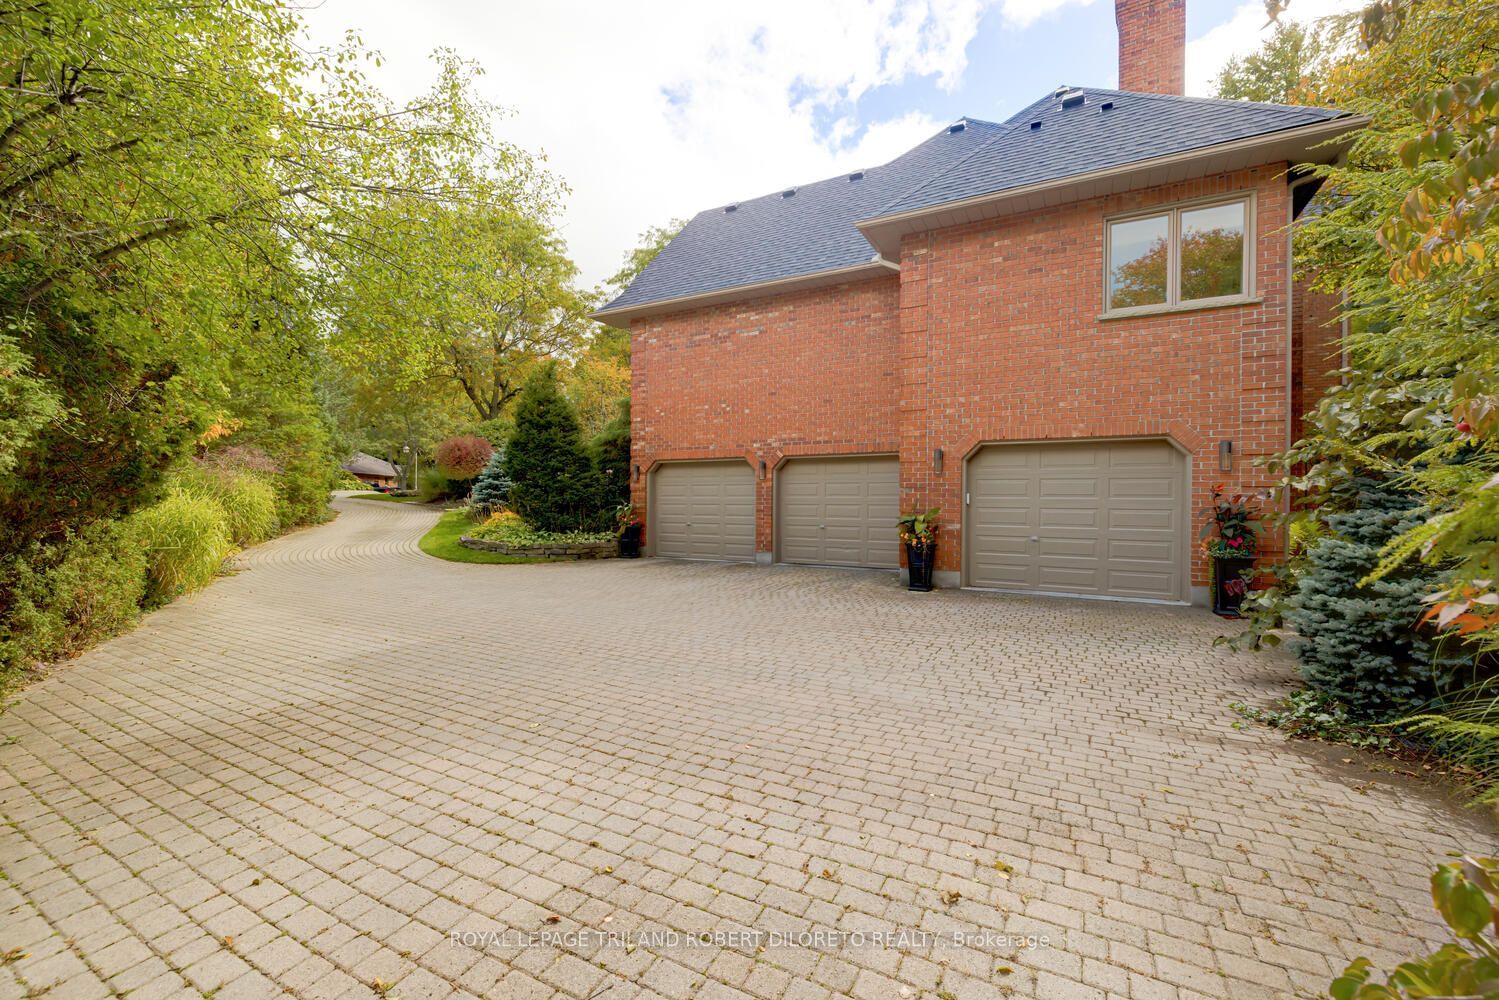
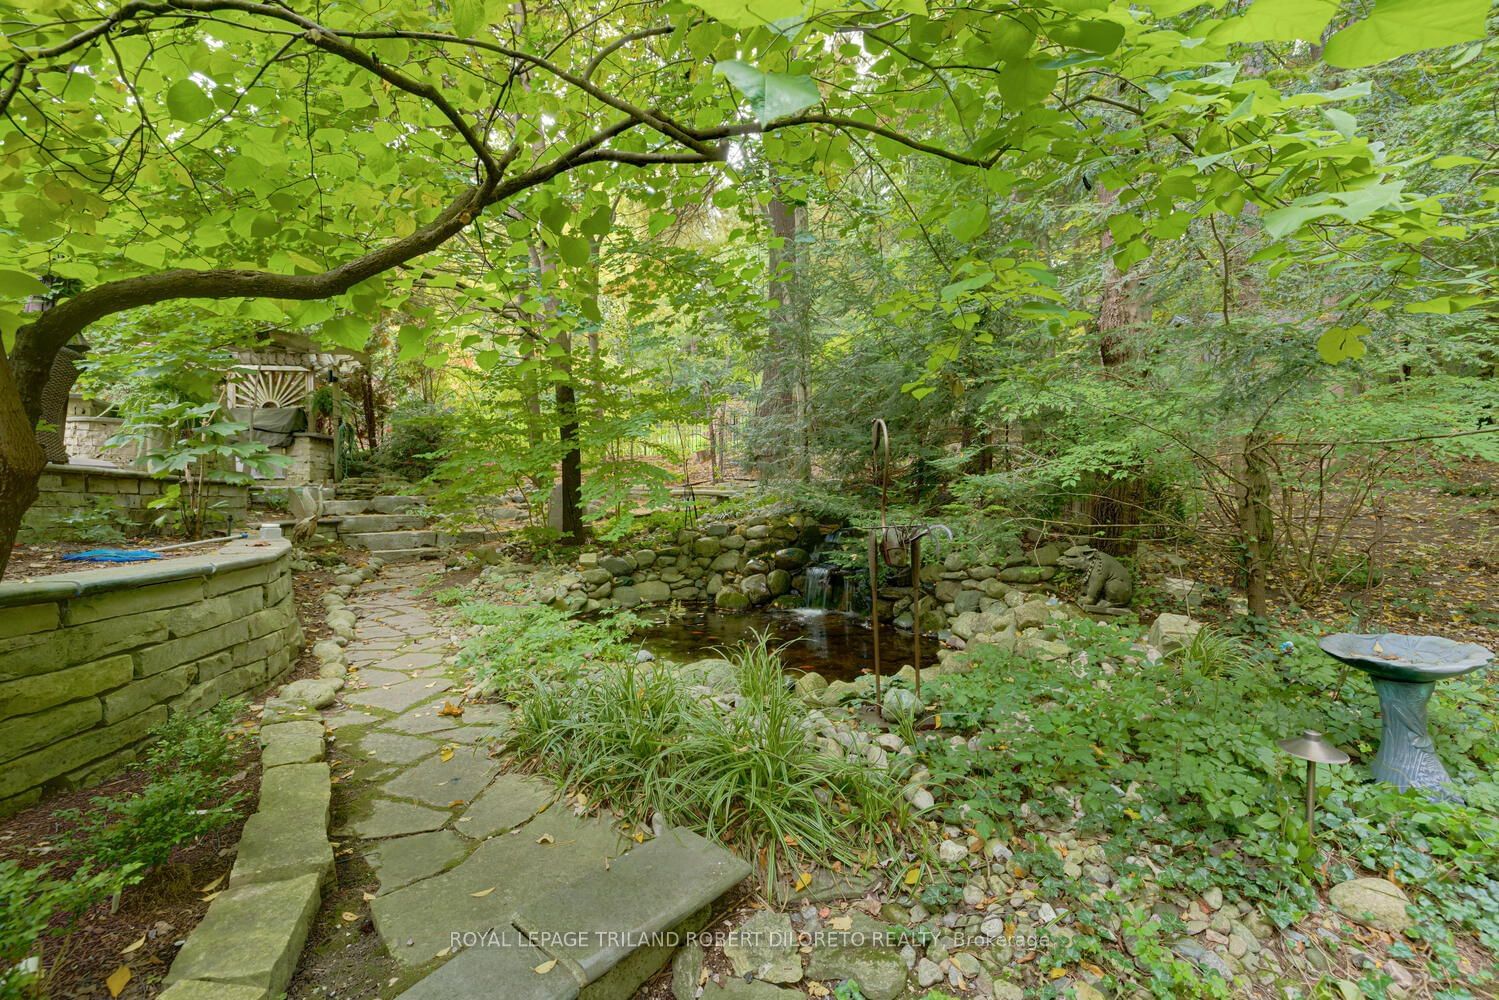
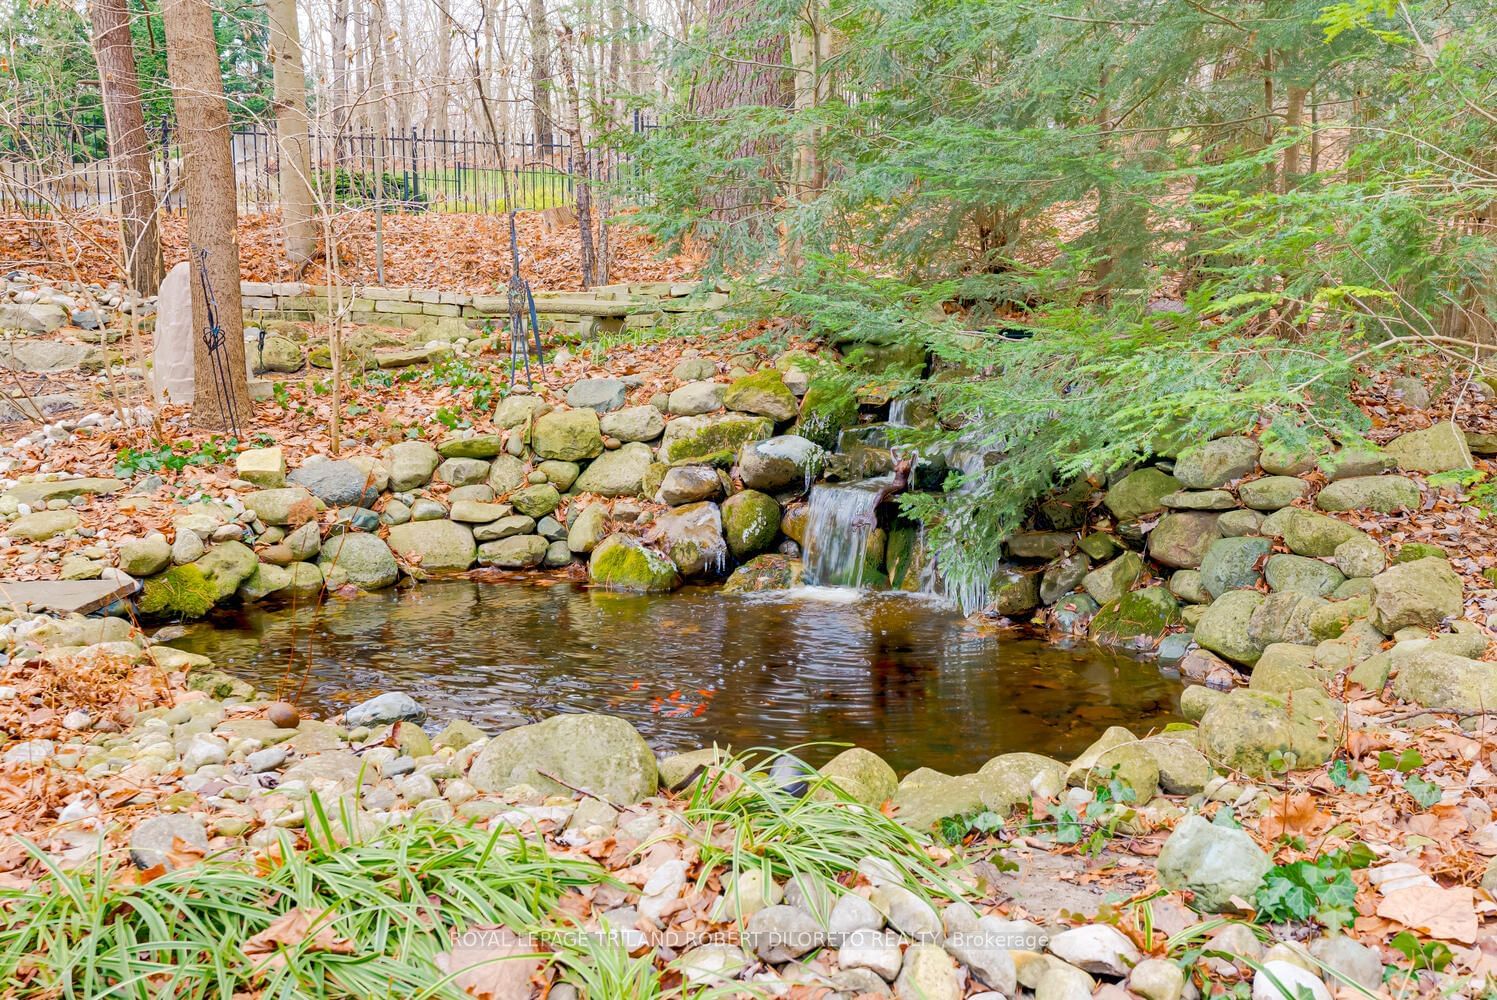
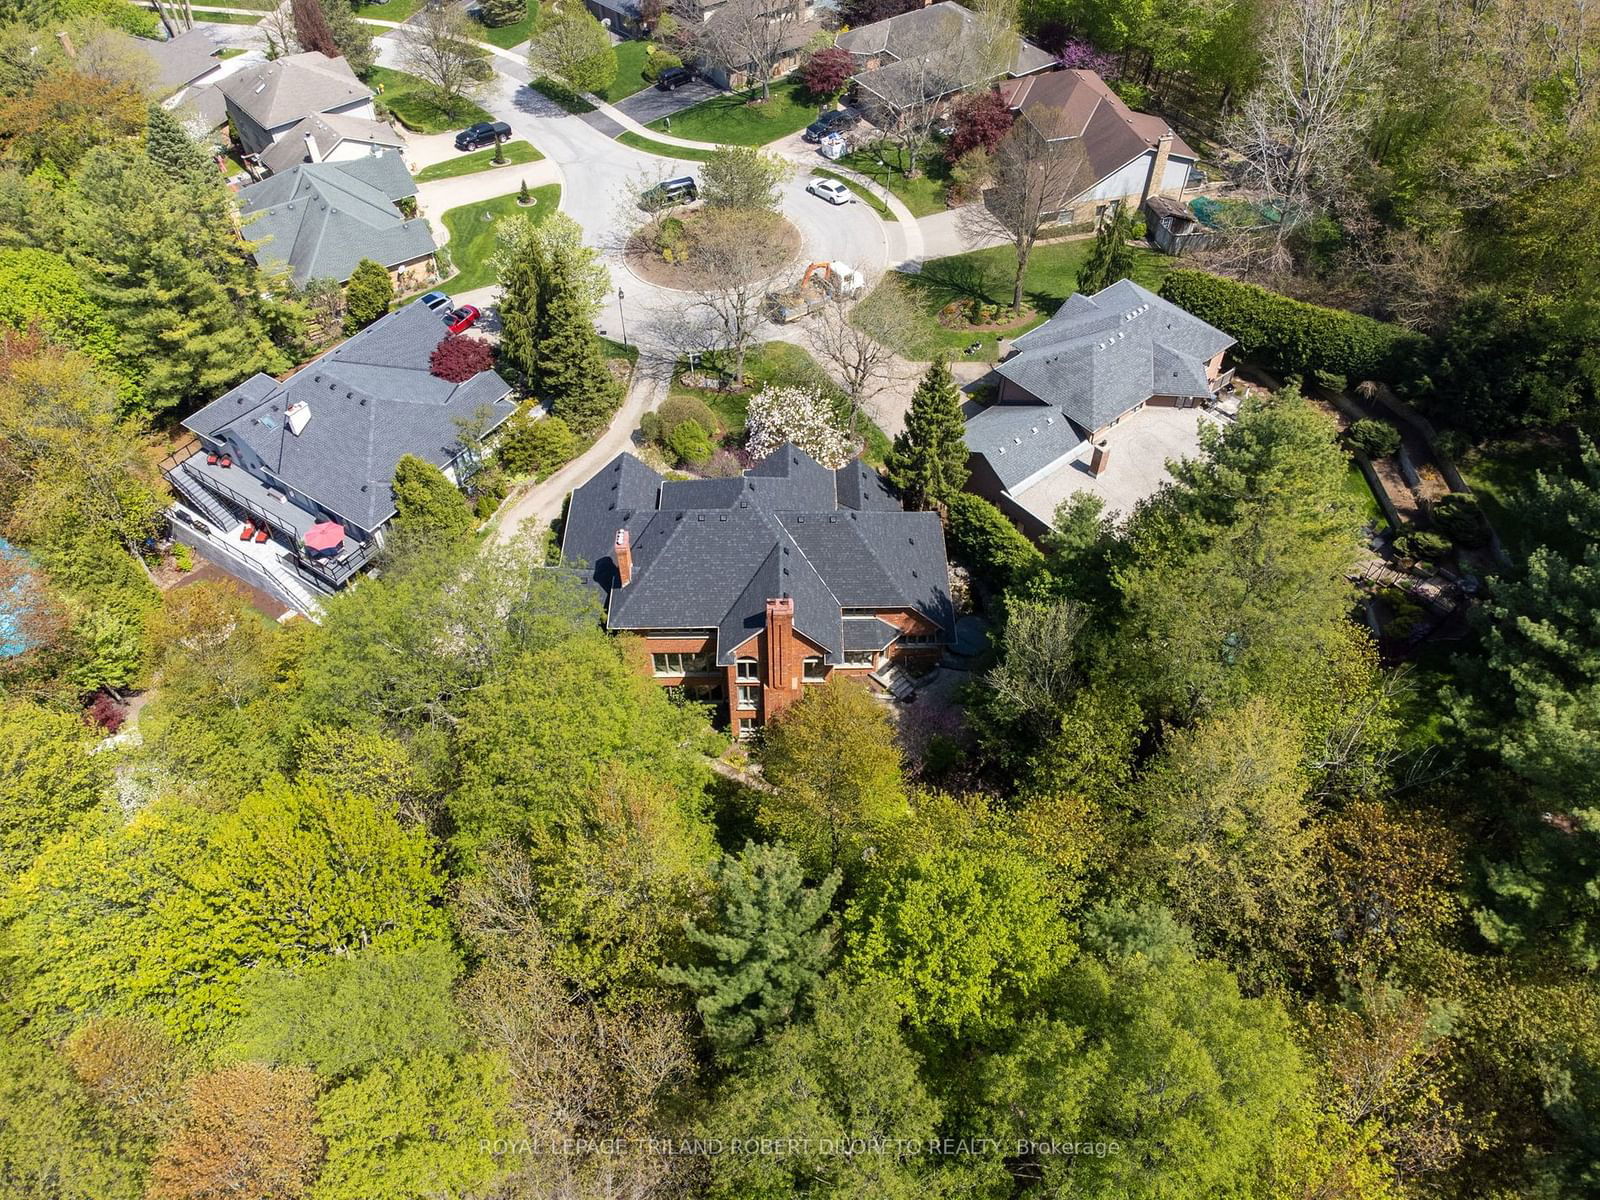
Spectacular Scenery & Privacy in everyone Season! Situated on a rare half acre lot on secluded cul-de-sac in Byron's highly desirable "Chestnut Hill" enclave is this Magnificent custom built 4 BRM, 4.5 BA all brick 2-storey home w/finished walkout lower level & triple garage backing onto prestigious WARBLER WOODS conservation area! Extensive list of features throughout + location like no other. The exterior has been discreetly landscaped to blend seamlessly with nature beyond the lot line & boasts inground sprinkler system, native plants, stone walkways & patios, fish ponds w/waterfall features, hot tub & custom grilling kitchen; impressive curb appeal w/stunning custom double front door-2019; soaring ceilings w/custom millwork throughout; grand 2-storey foyer w/dramatic curved staircase; 6 fireplaces; super spacious rooms & oversized windows to capture exquisite views from every angle; formal dining room with barrel vaulted ceiling; custom kitchen by "CARDINAL CABINETS" overlooks amazing exterior, quality appliances + butler's panty; 2-storey great room room; main floor family room; main floor office w/custom built-in cabinets; stunning main floor primary w/18ft vaulted ceiling, fireplace & spa like ensuite w/in-floor heat, stand alone bubble tub & private 2pc WC all reno'd by BRAAM'S CUSTOM CABINETS; all large upper level bedrooms have ensuite privileges; all closets w/custom organizers; finished lower level w/walkout features 2 family rooms, games room, custom wine cellar and loads of storage; 2 heaters & 3 drains in garage; additional highlights: roof shingles-2022, 2xfurnaces-2022/2016, 2 central air units, hot water heater (owned)-2022, CVAC, HRV + much more!
Great Rm
Dining
Family
Office
Kitchen
Breakfast
Prim Bdrm
2nd Br
3rd Br
4th Br
Family
Family
The graph below compares the average list price and average sale price of homes in this neighborhood by month for the last 24 months. When average sale price is greater than average list price, this may suggest a buyer's market. When average sale price is lower than the average list price this may suggest a seller's market.
The graph below illustrates the average days on market for homes in this neighborhood. The yellow area may indicate a buyer's market, the green area may indicate a balanced market and the red area may indicate a seller's market.
Sales Representative, Century 21 People’s Choice Realty Inc., Brokerage
(647) 576 - 2100