Century 21 People’s Choice Realty Inc., Brokerage
120 MATHESON BLVD E #103
MISSISSAUGA, Ontario
L4Z 1X1

Kawartha Lakes, Emily, K0L 2W0
$1,379,000
Listed by ROYAL LEPAGE FRANK REAL ESTATE.
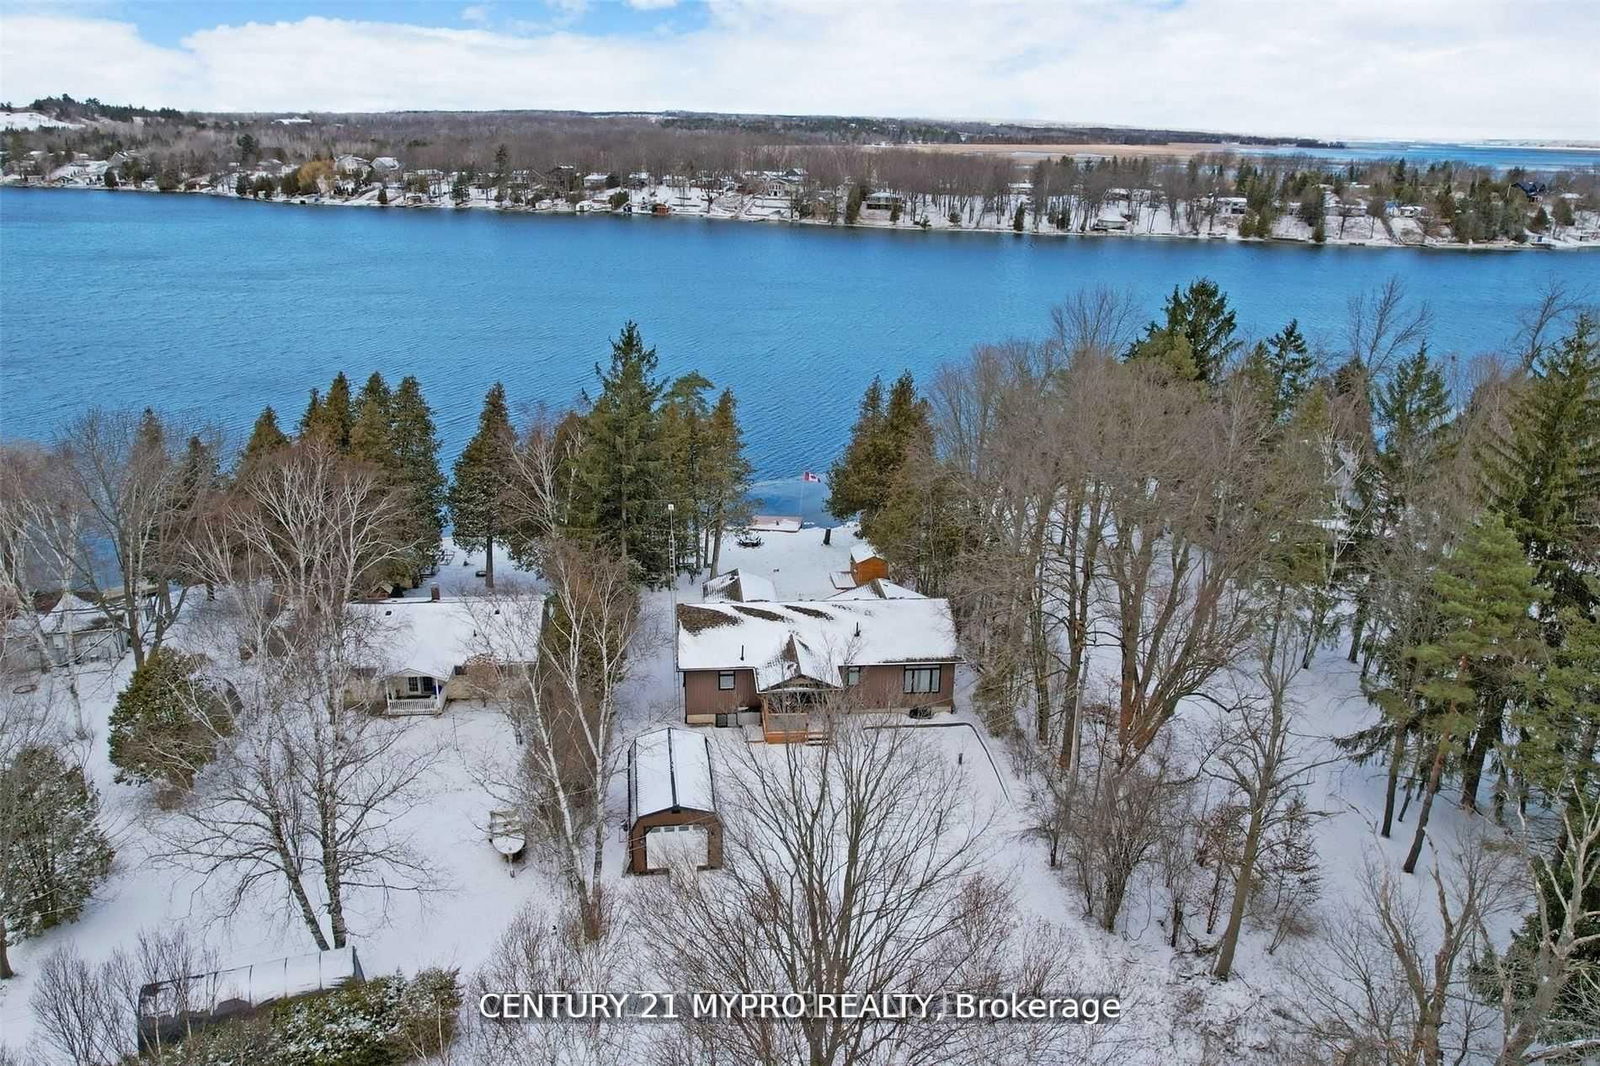
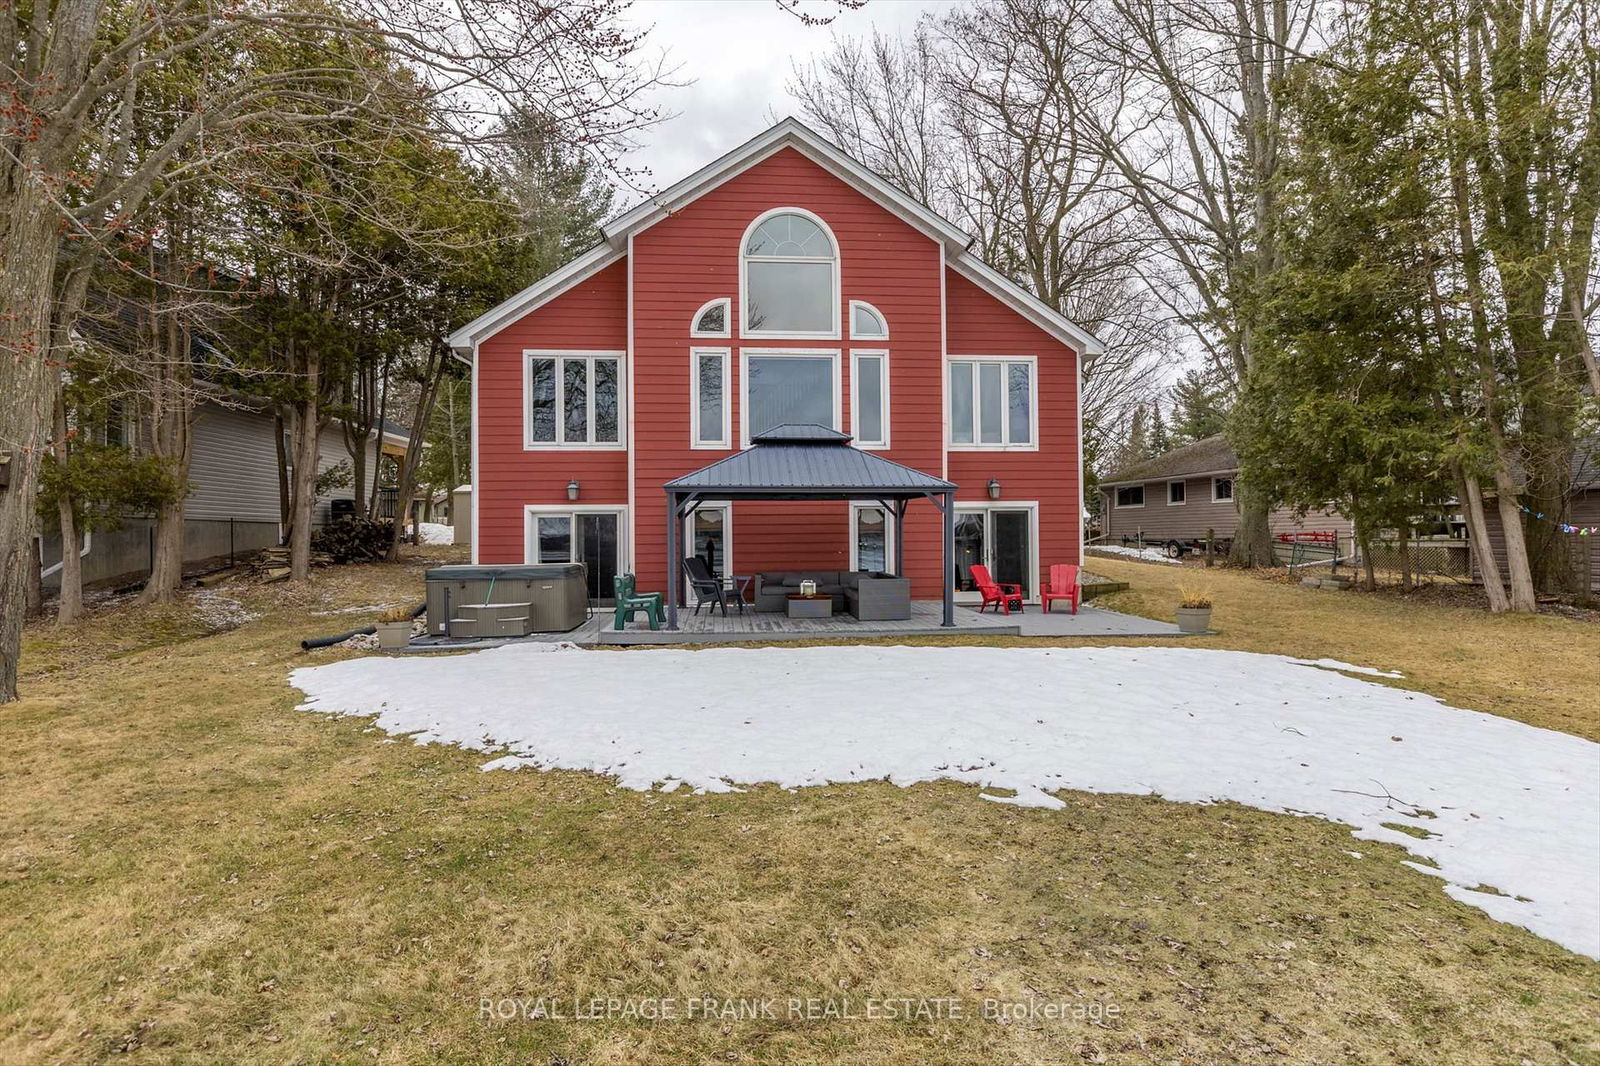
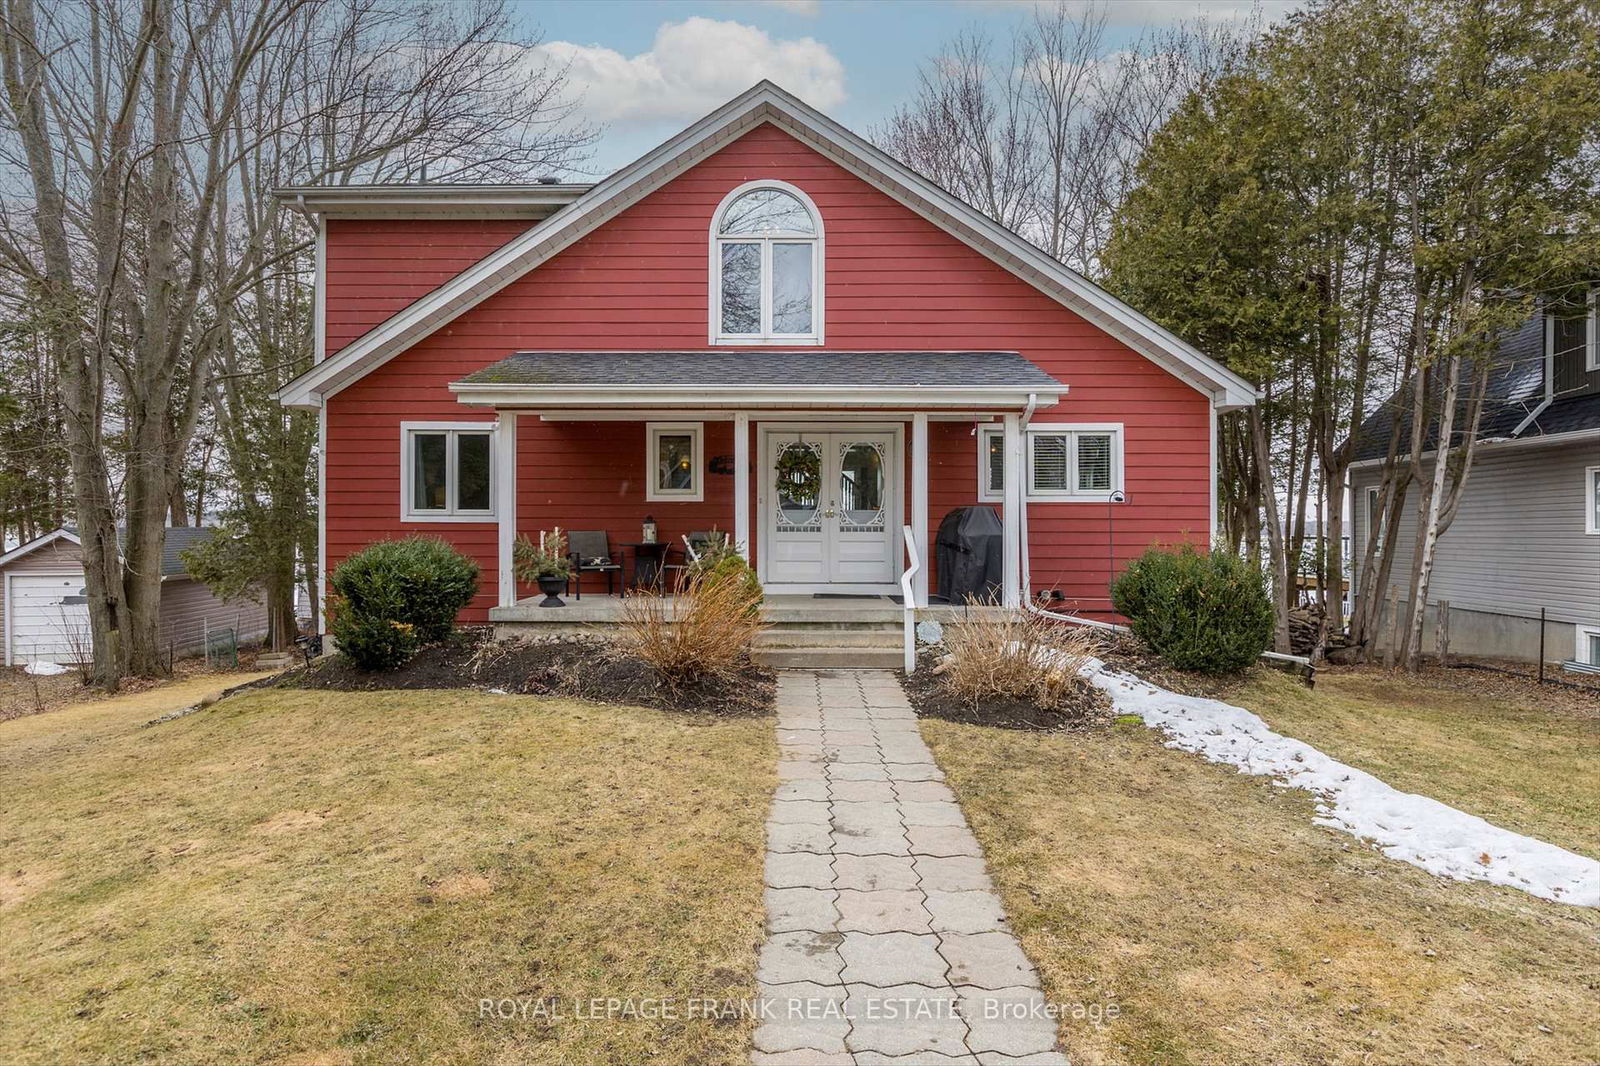
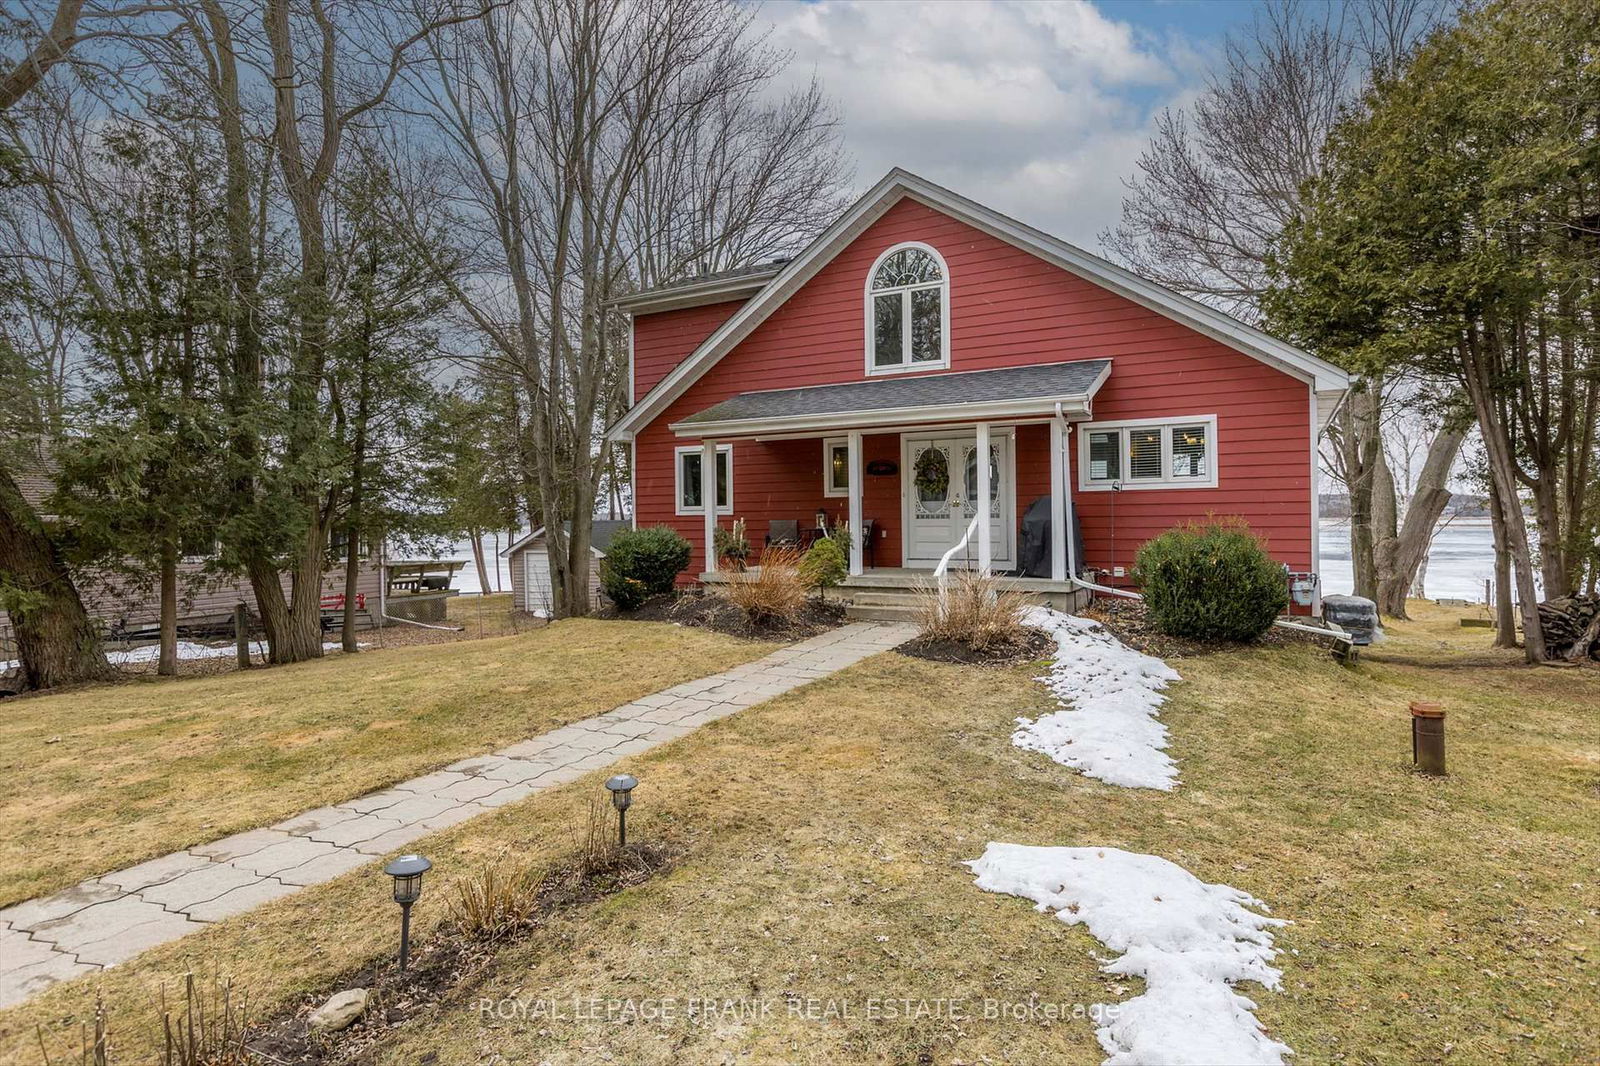
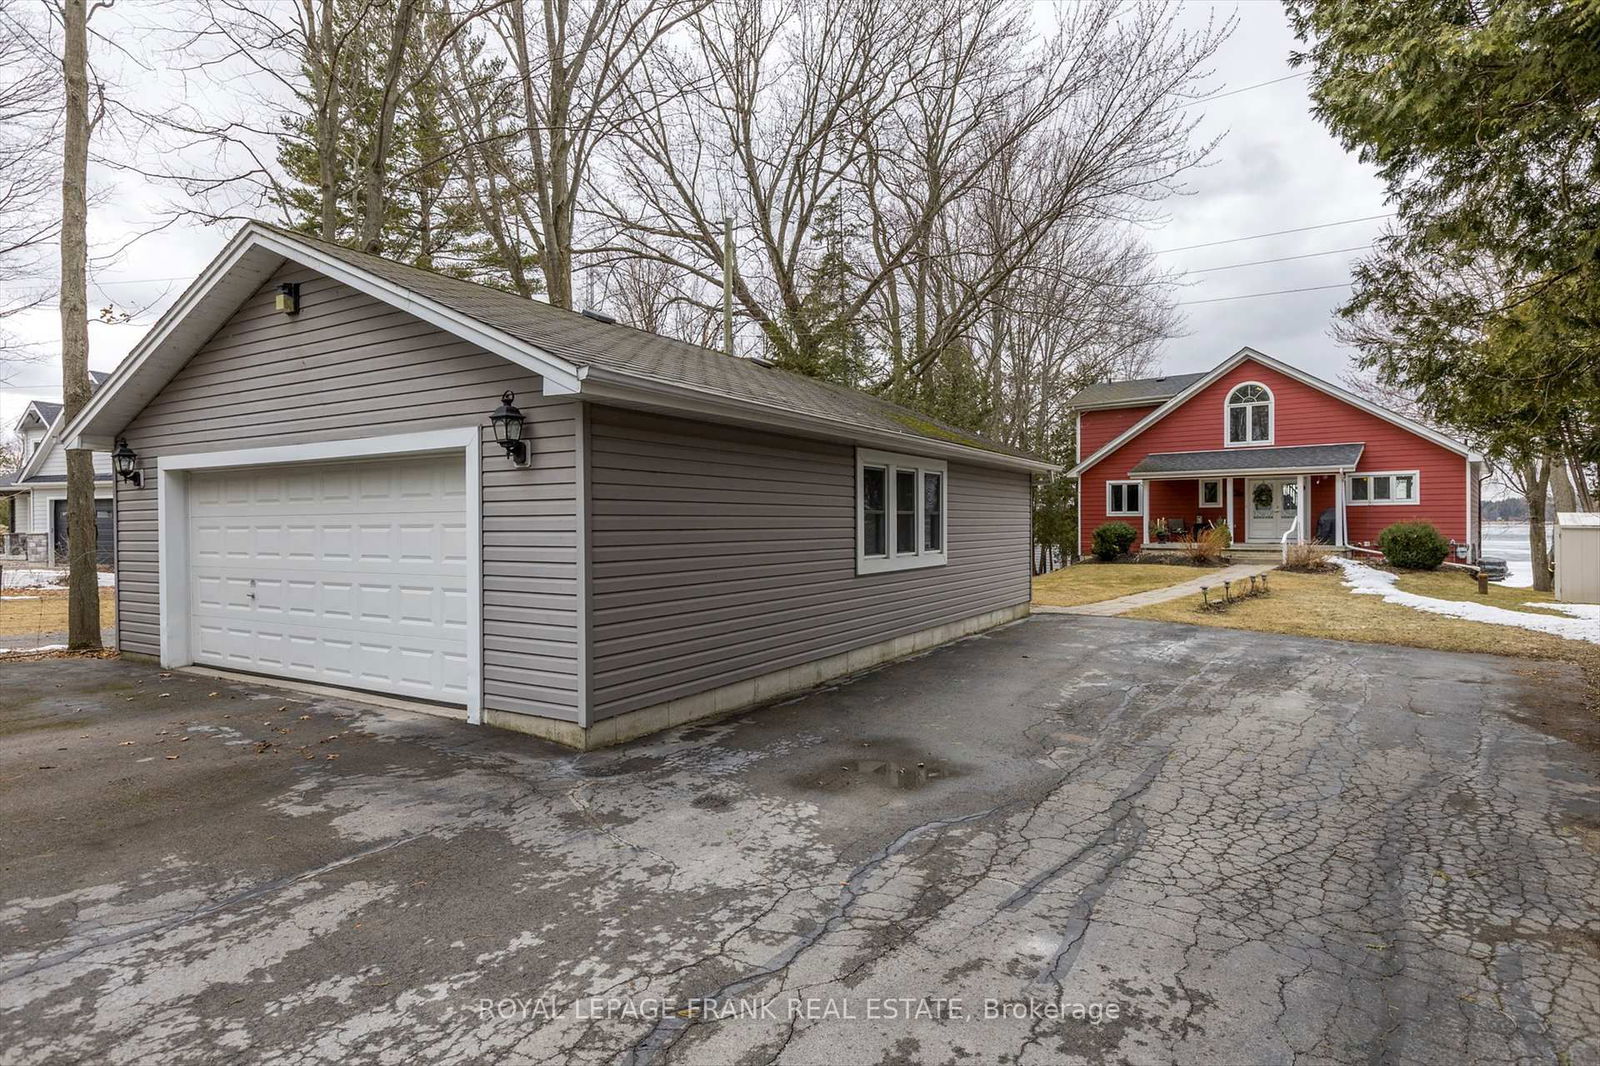
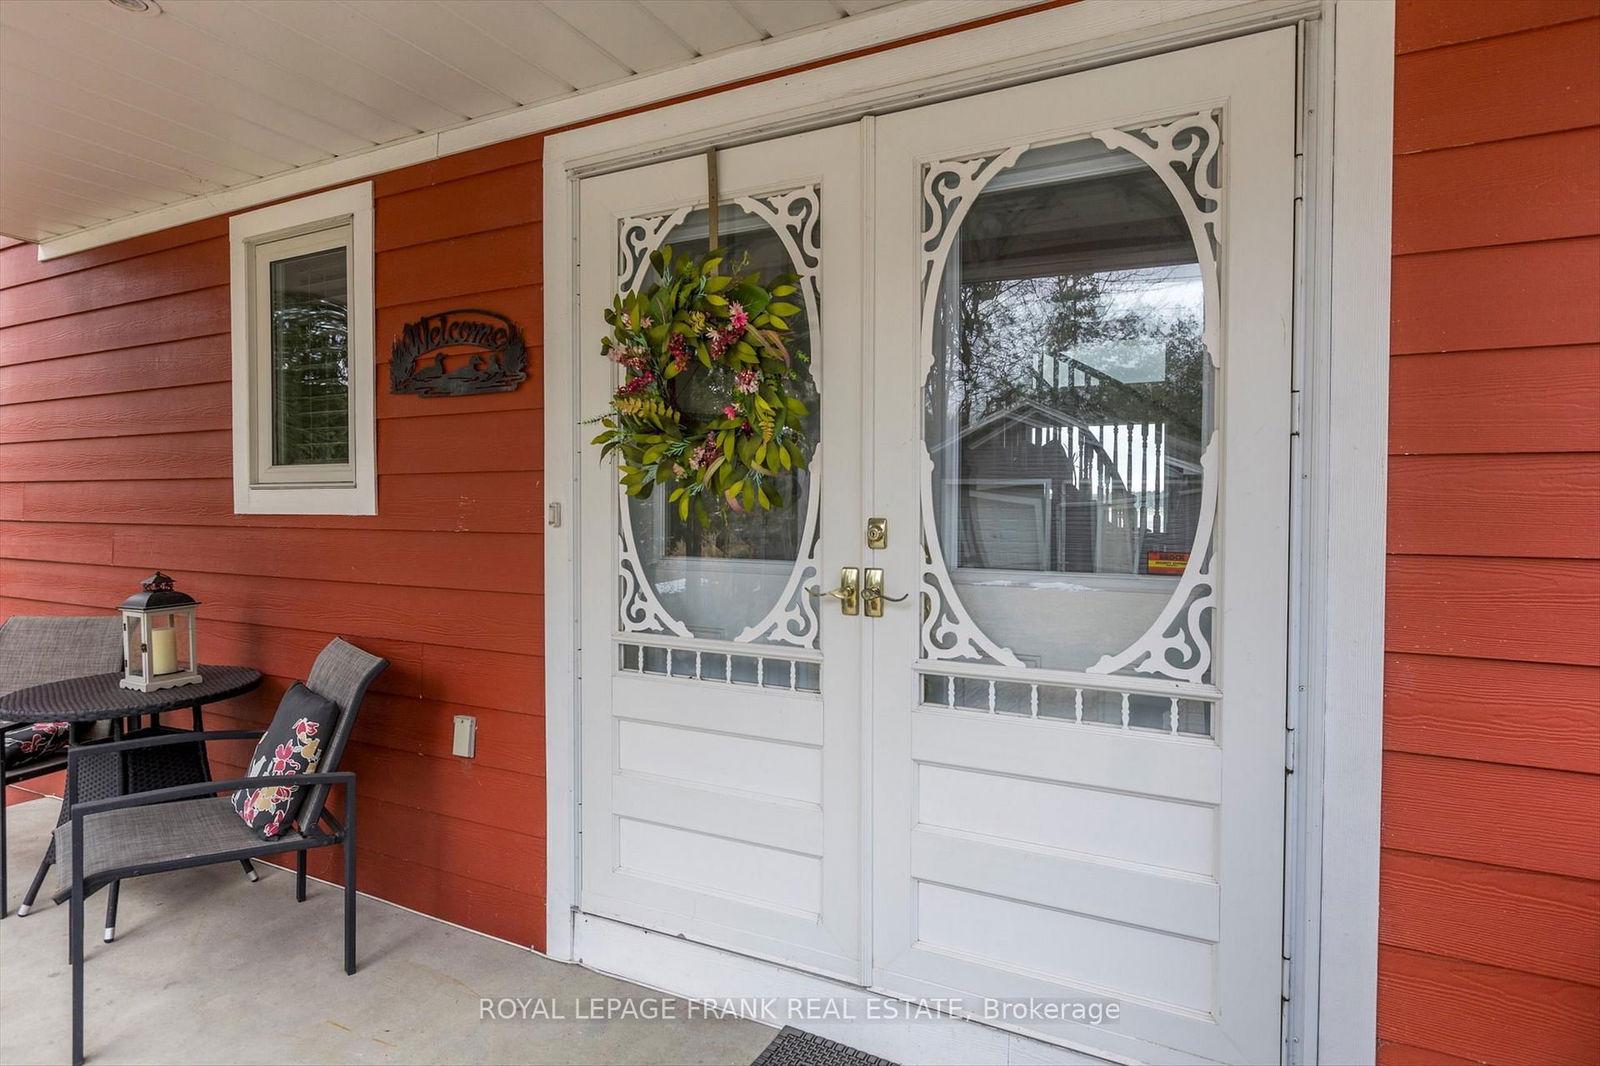
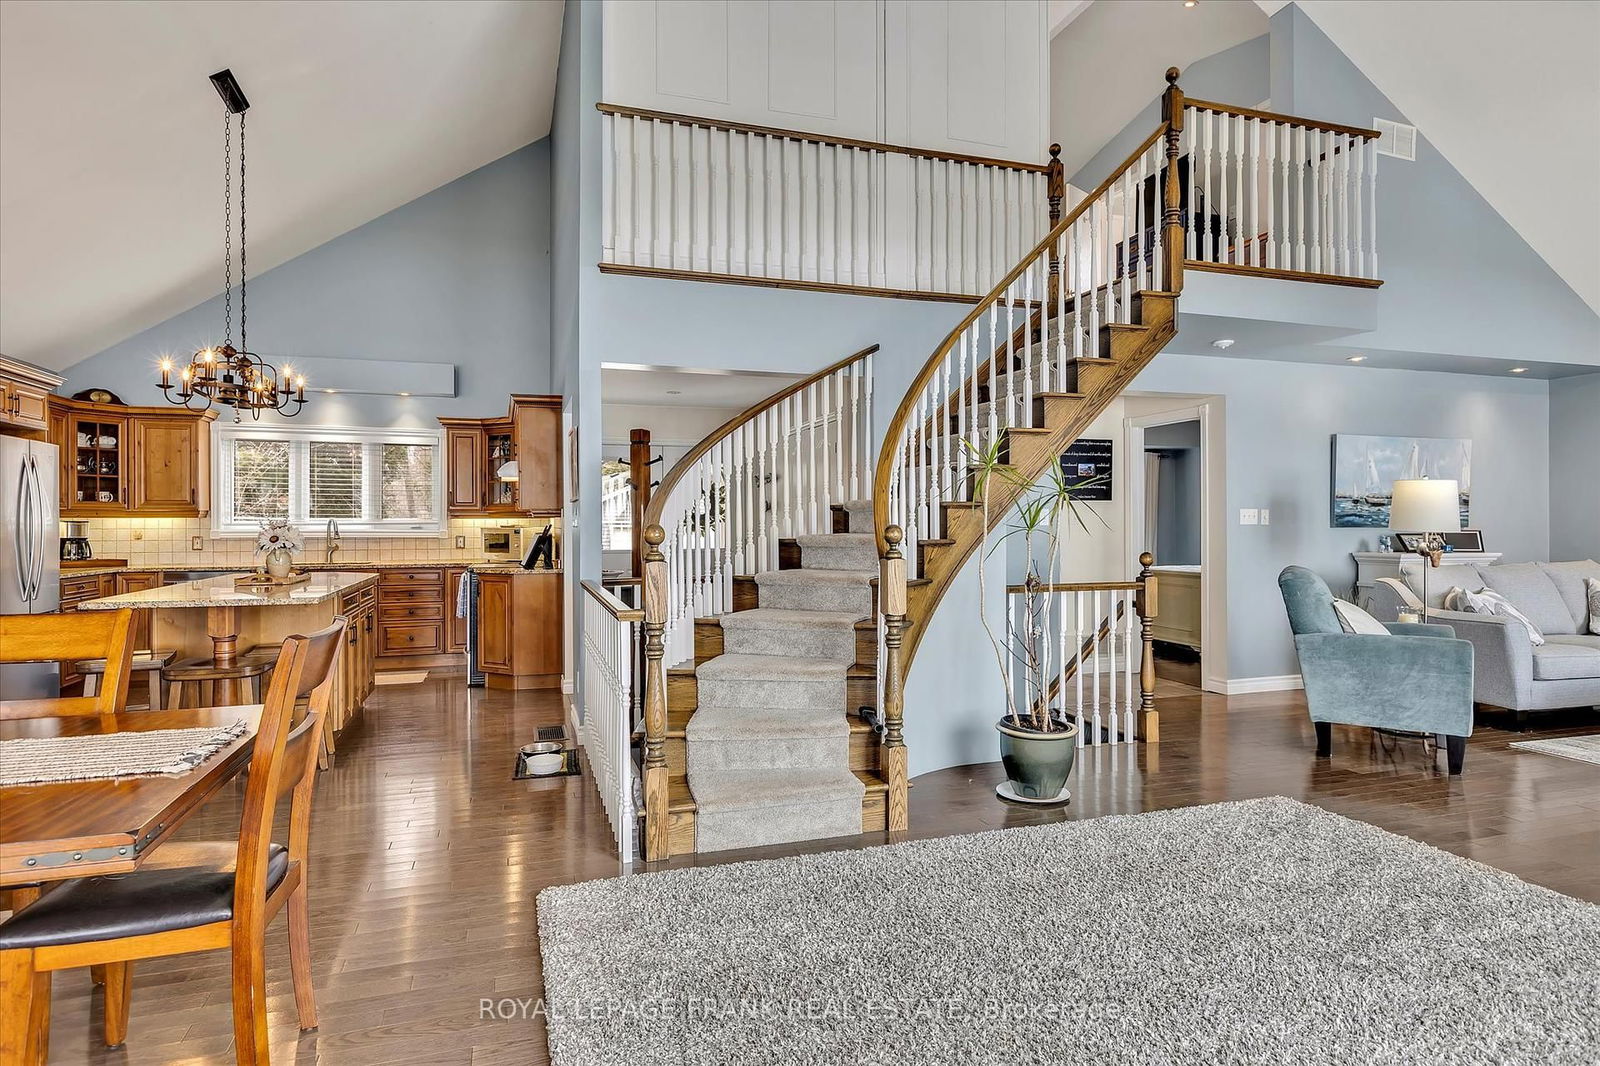
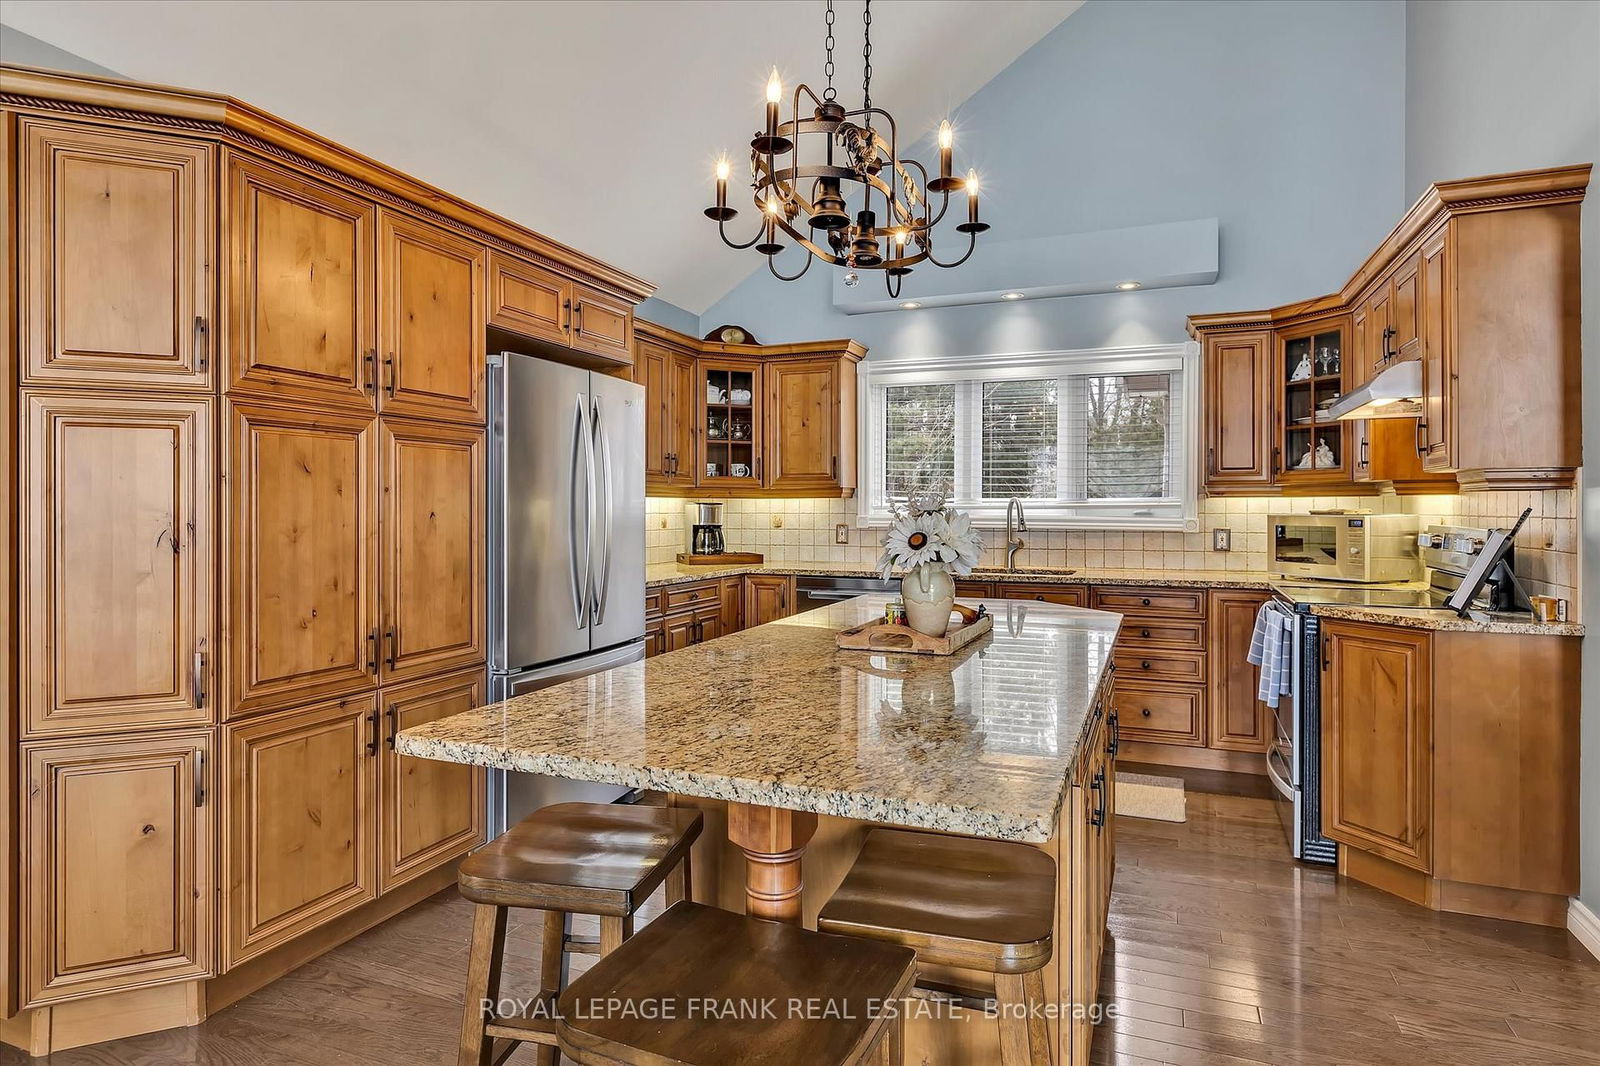
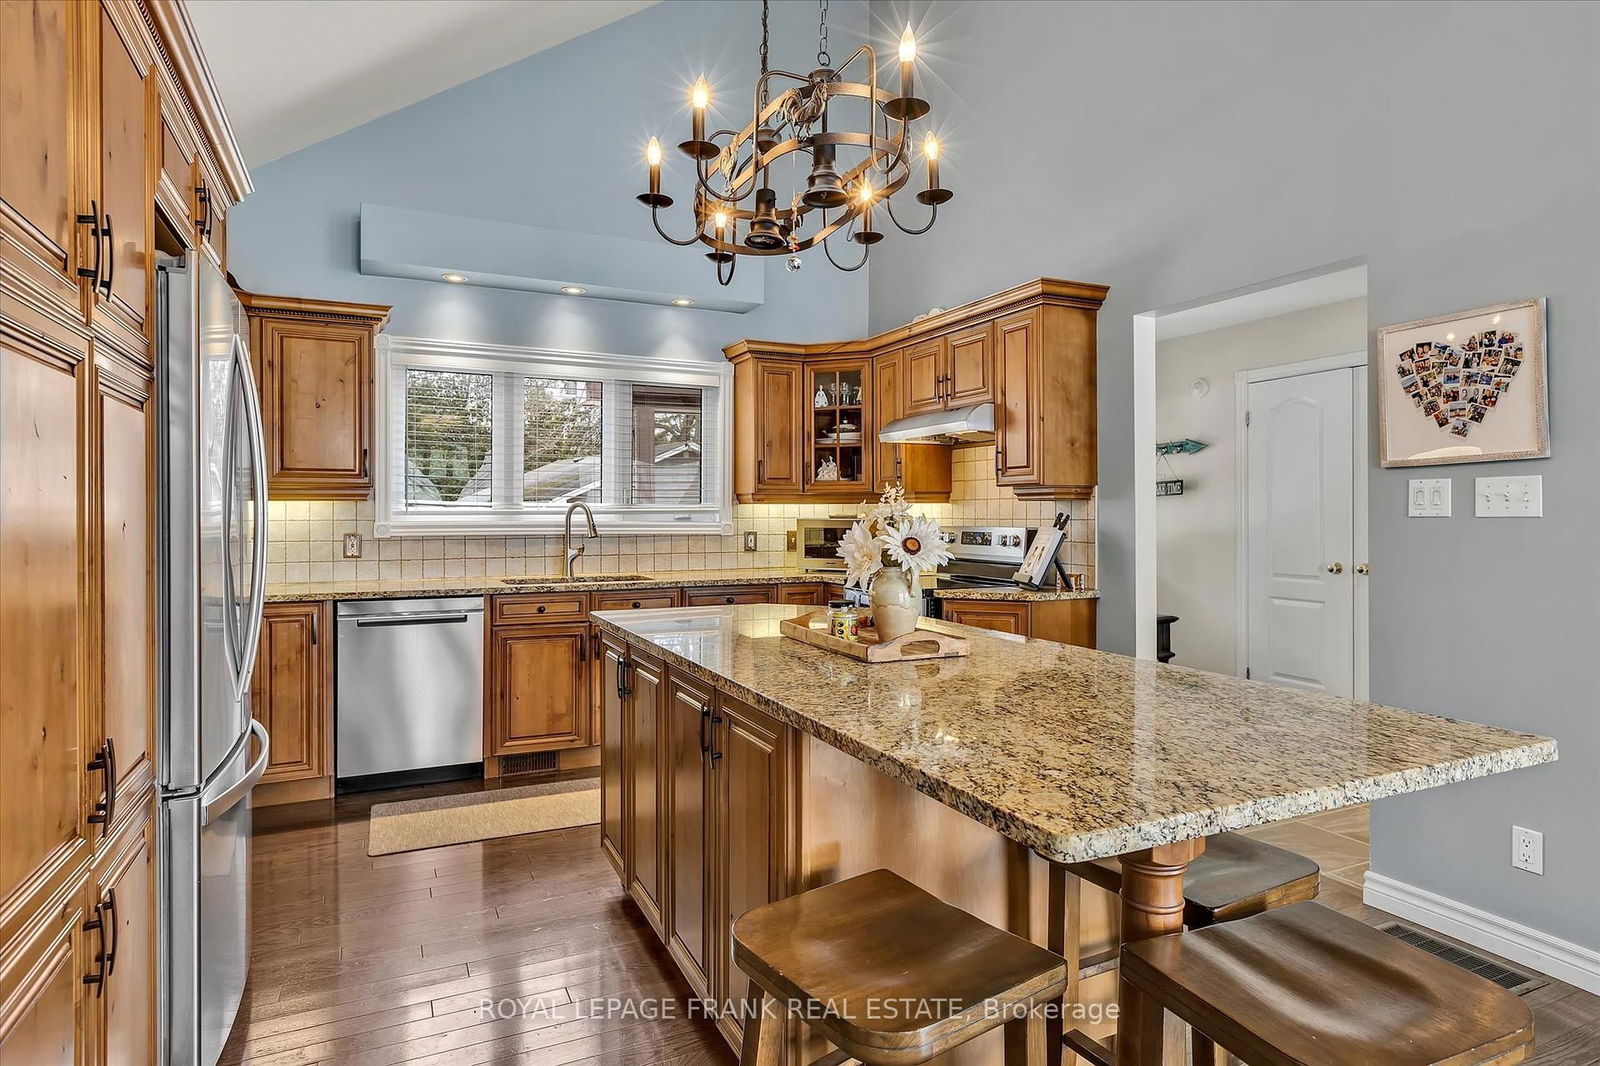
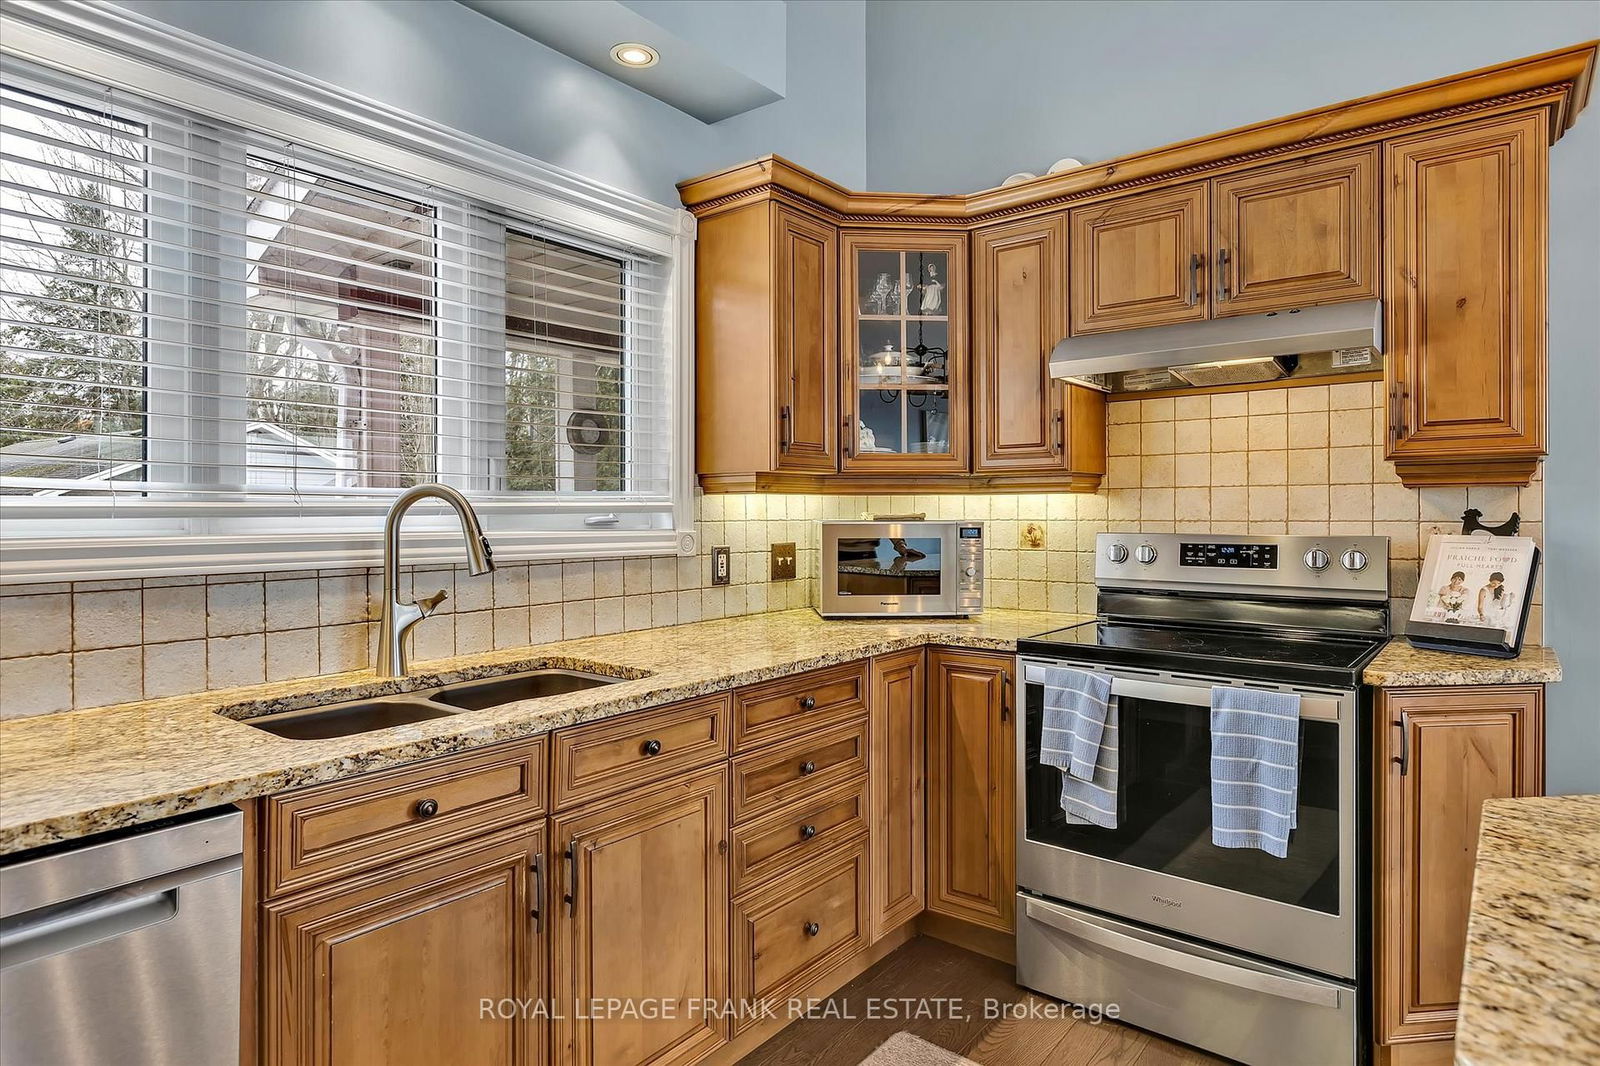
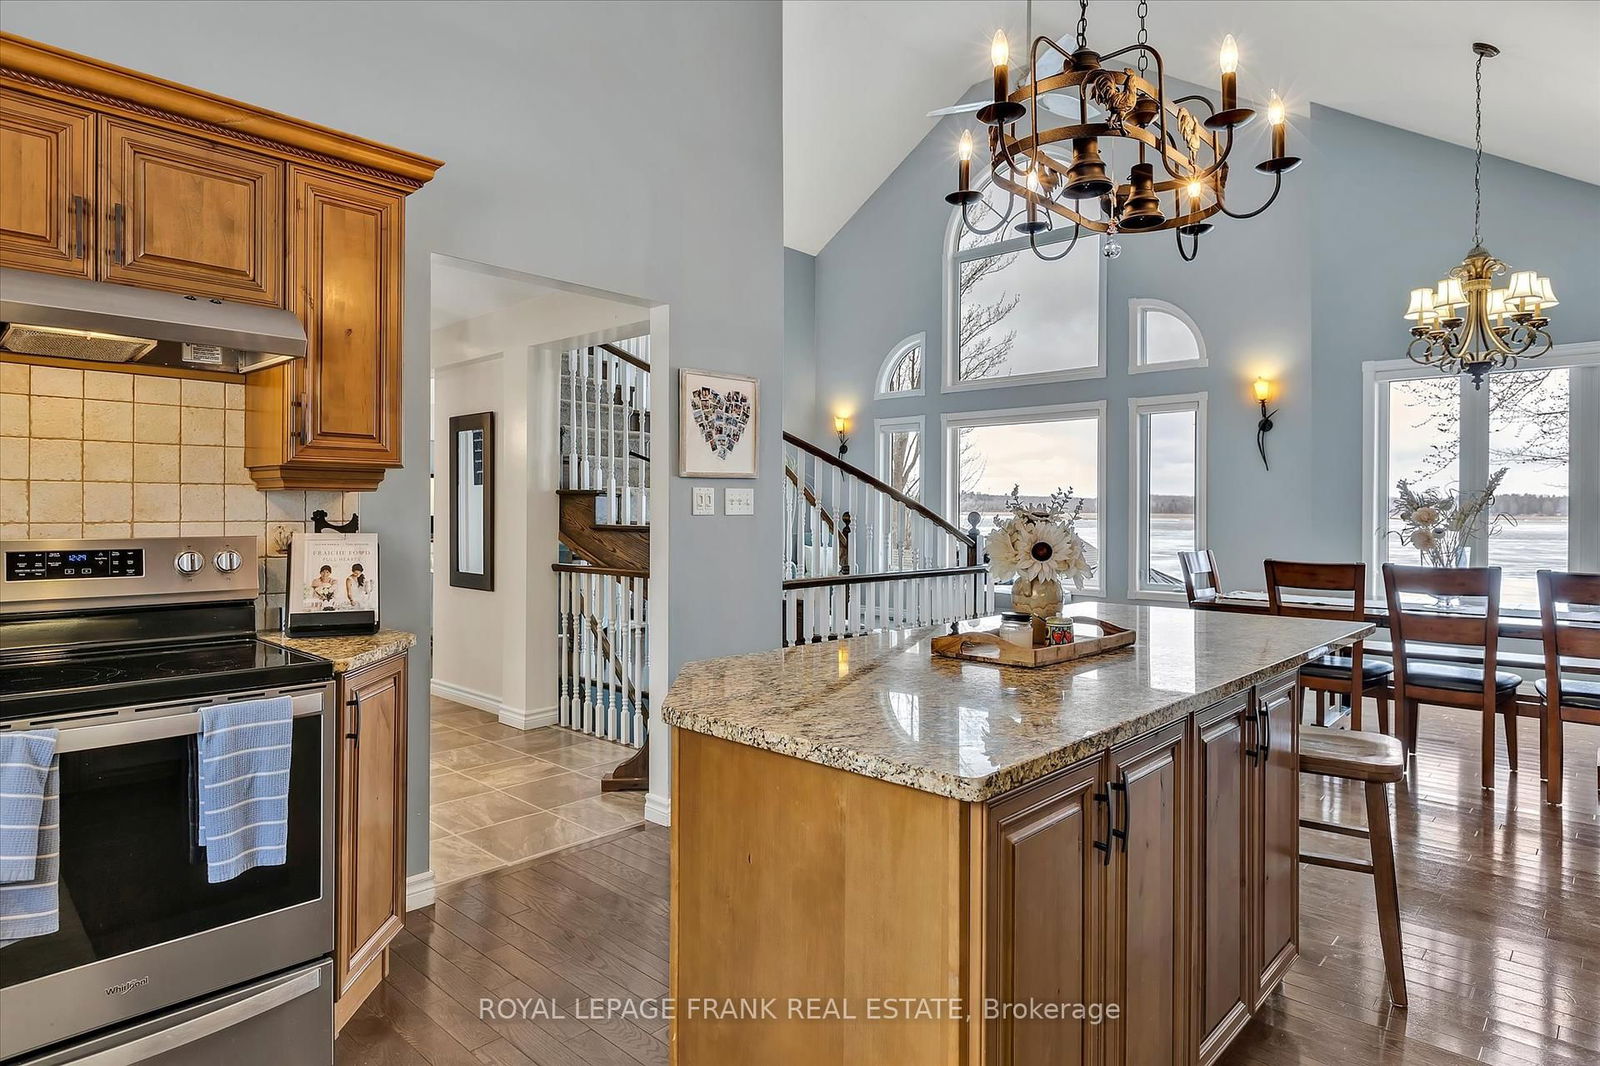
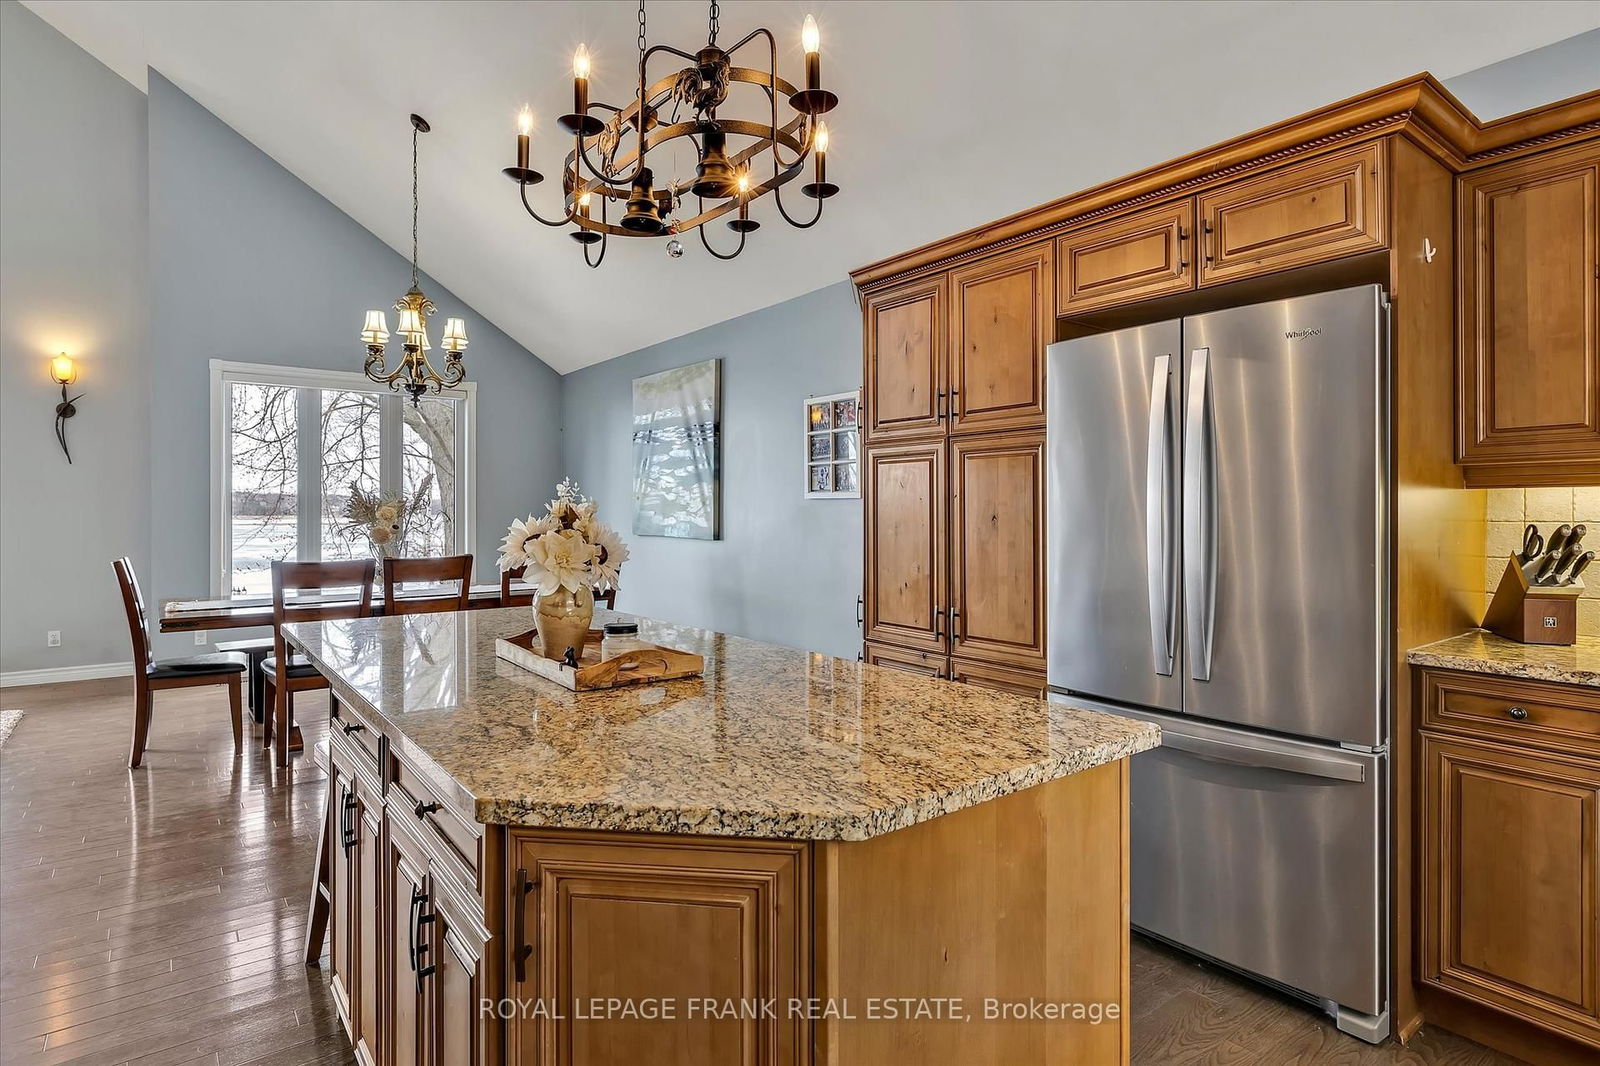
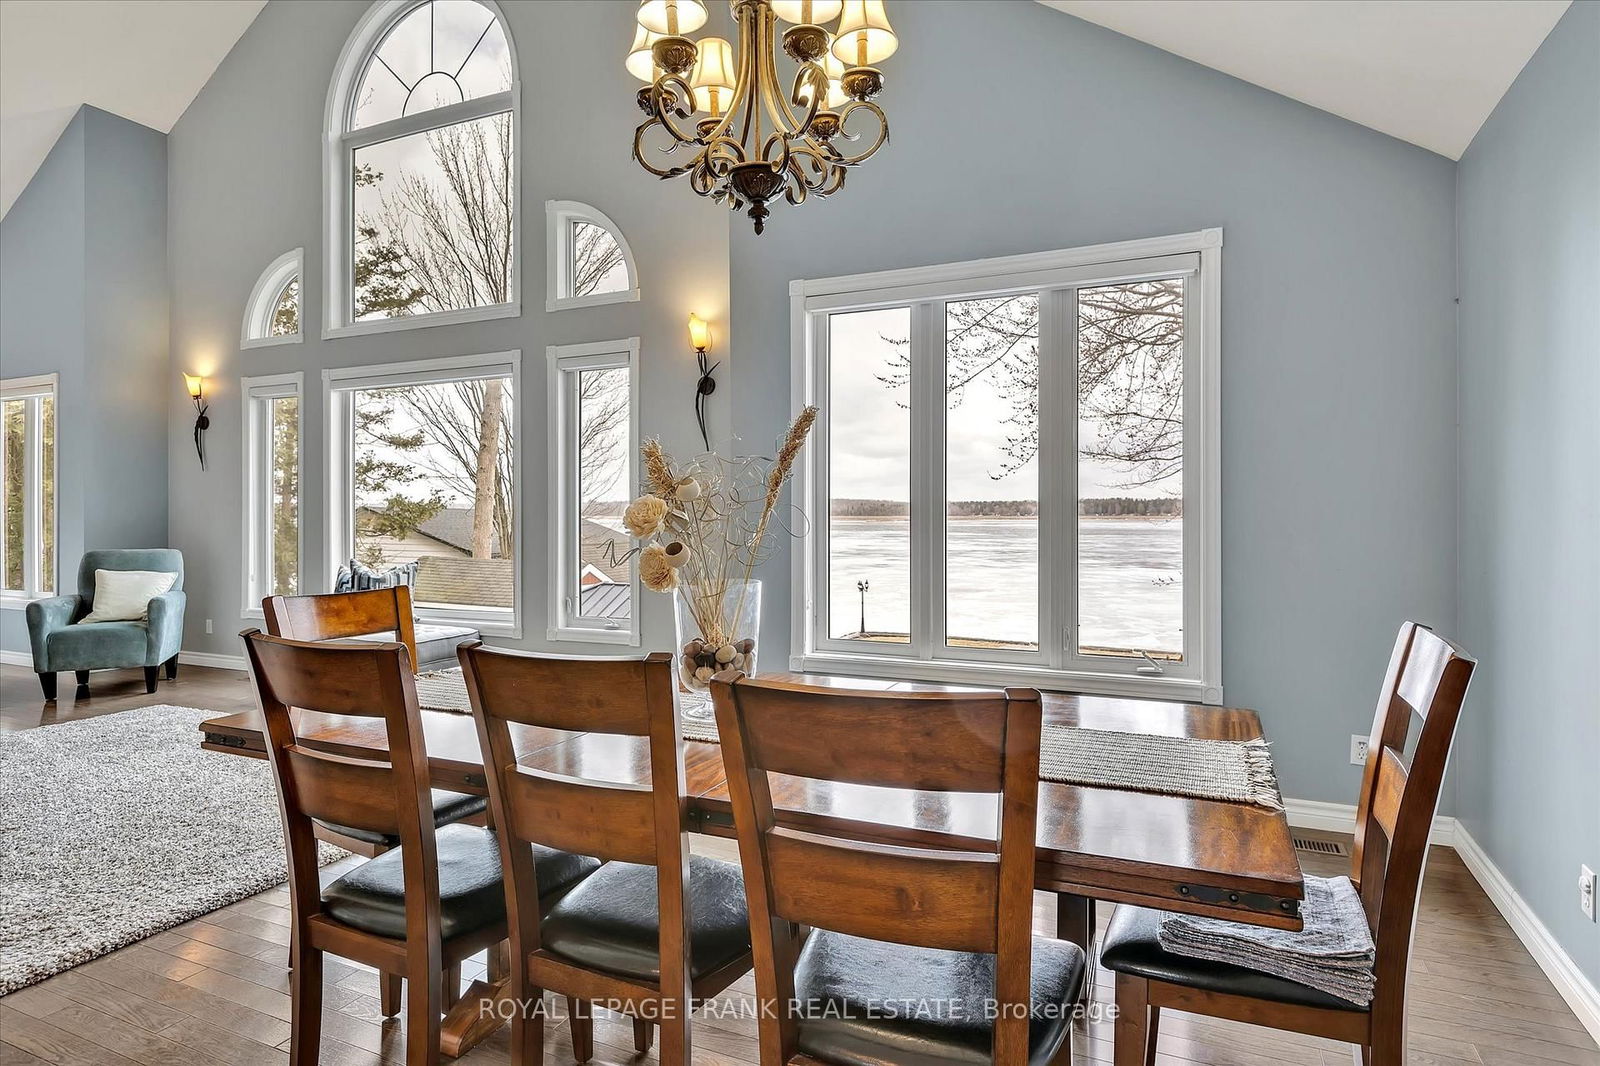
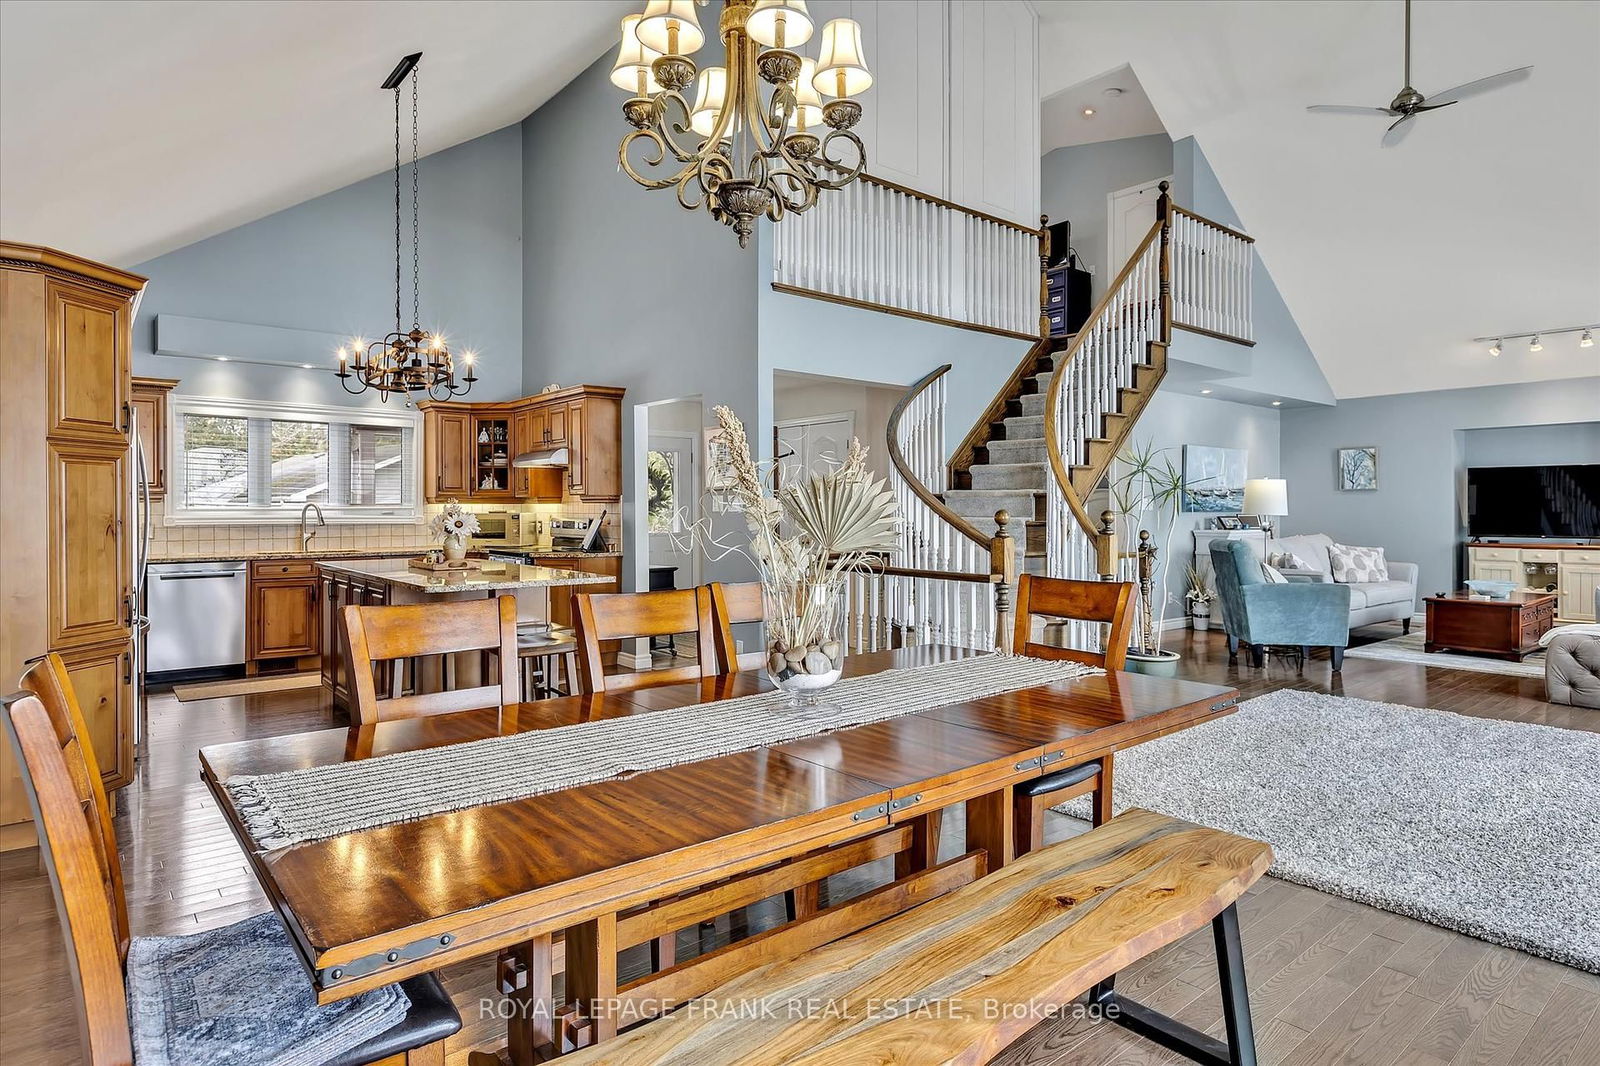
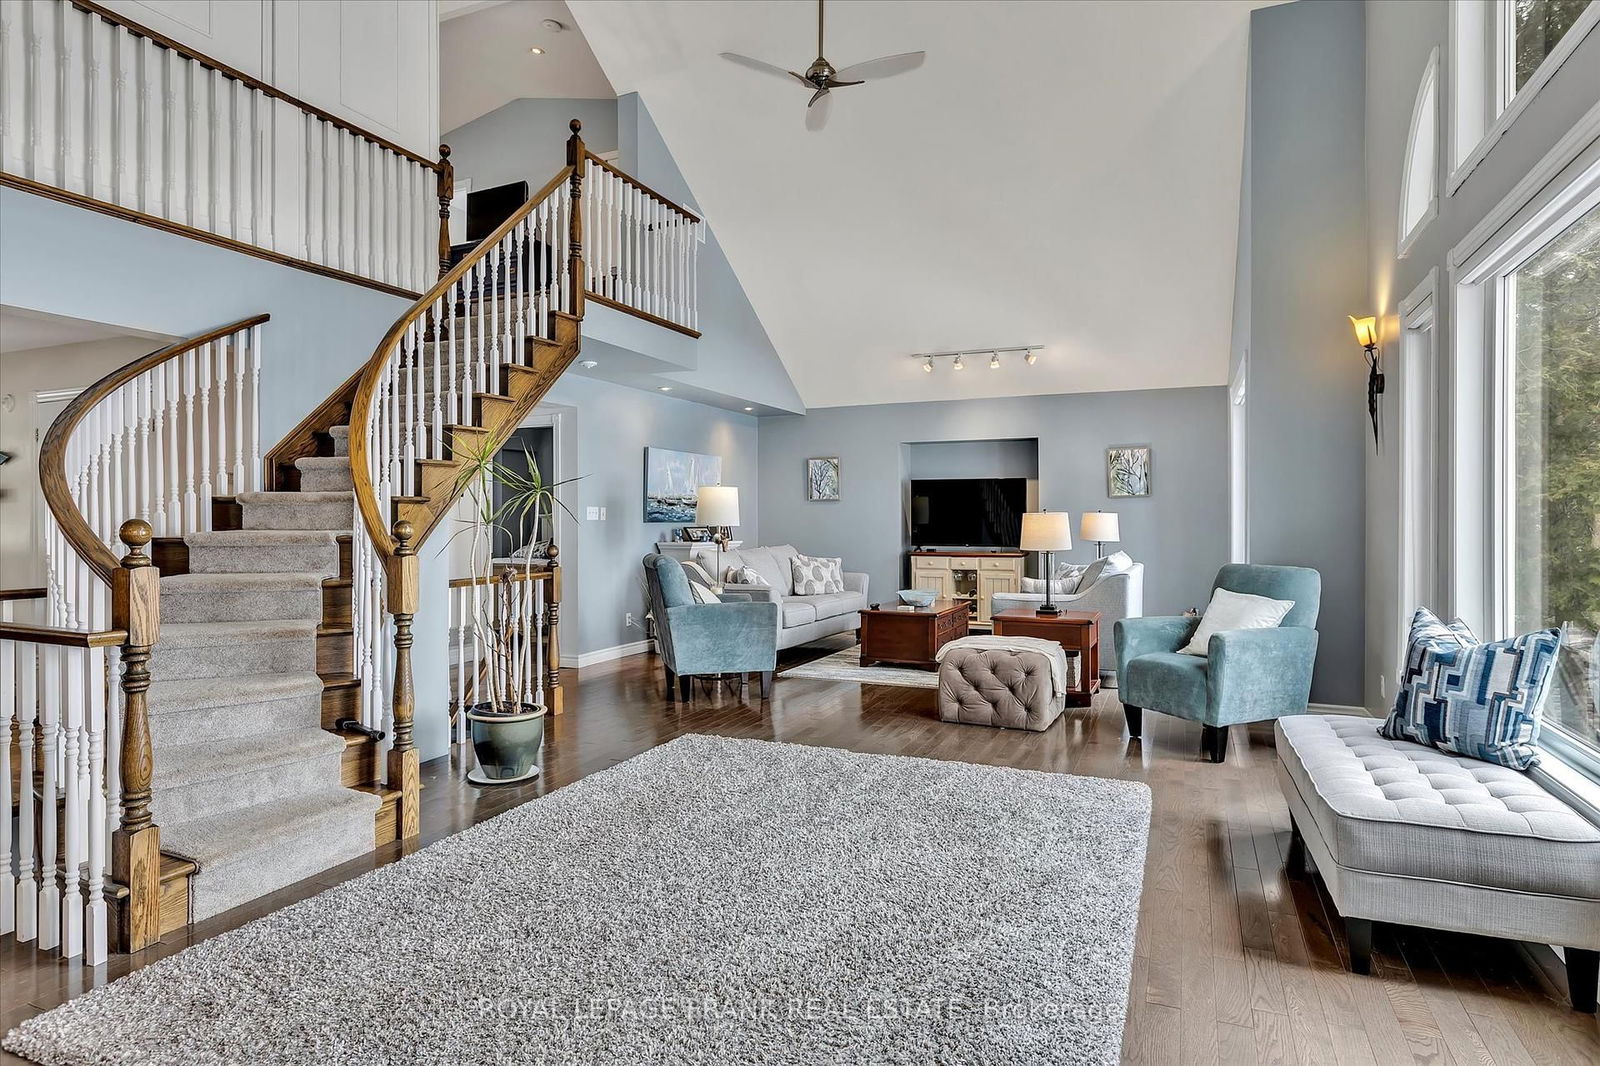
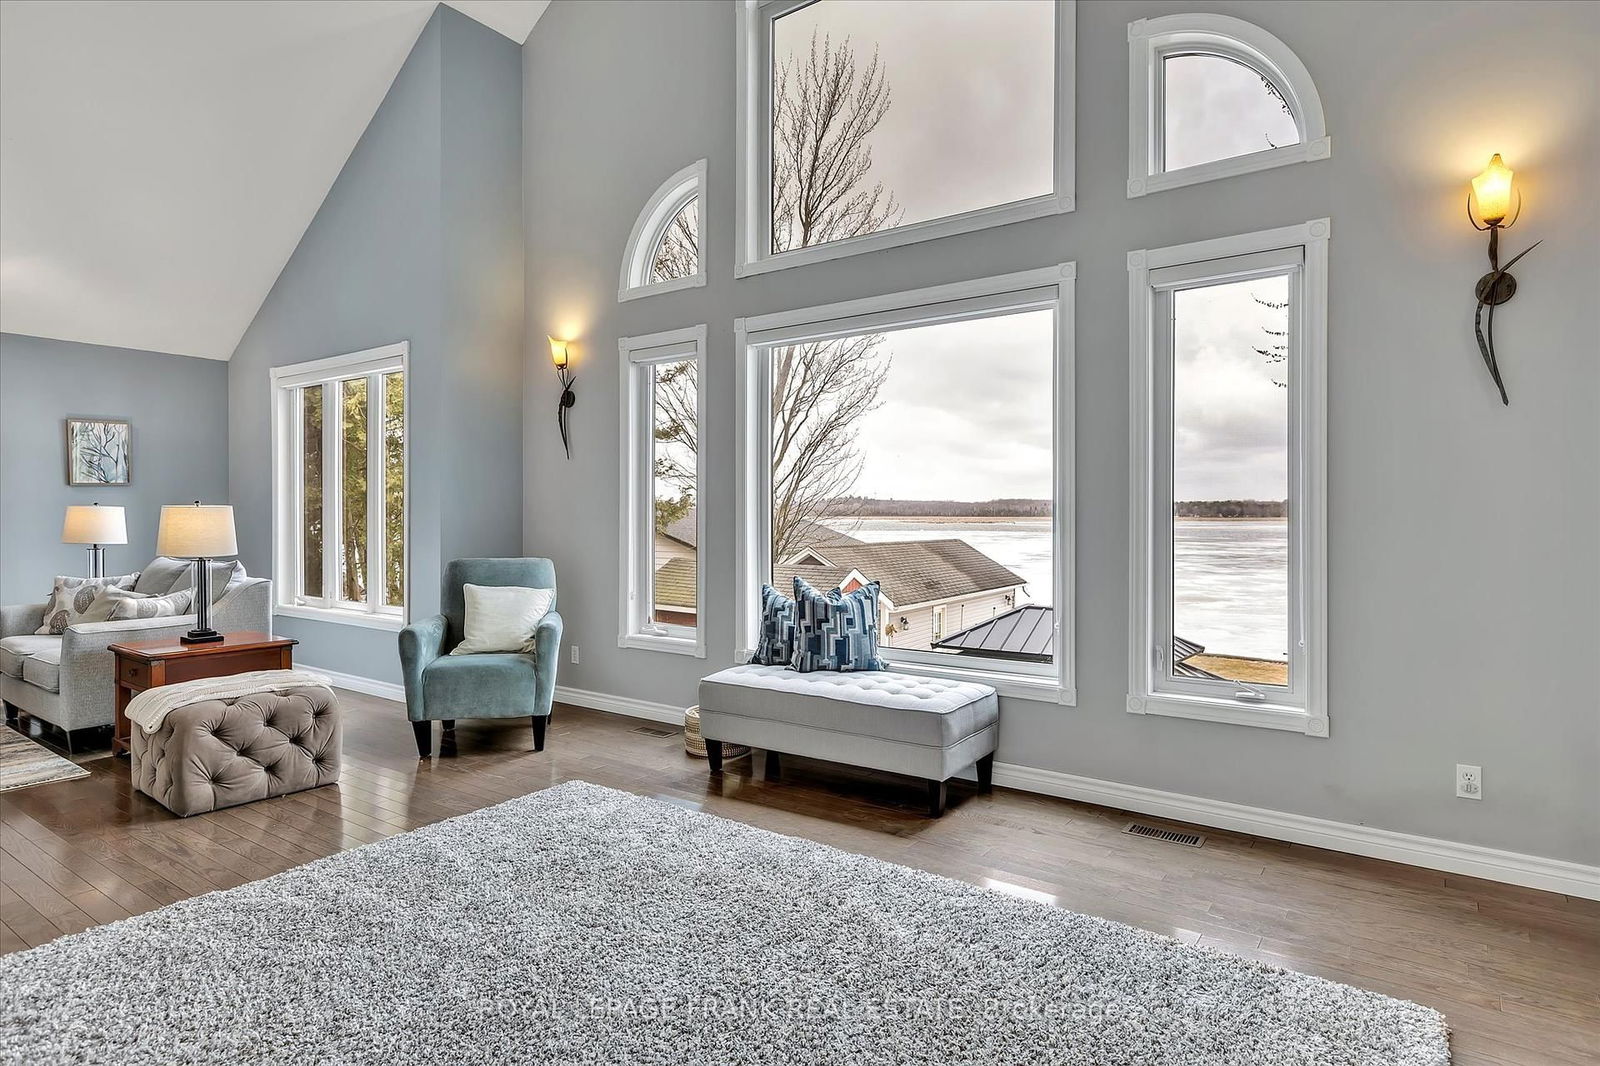
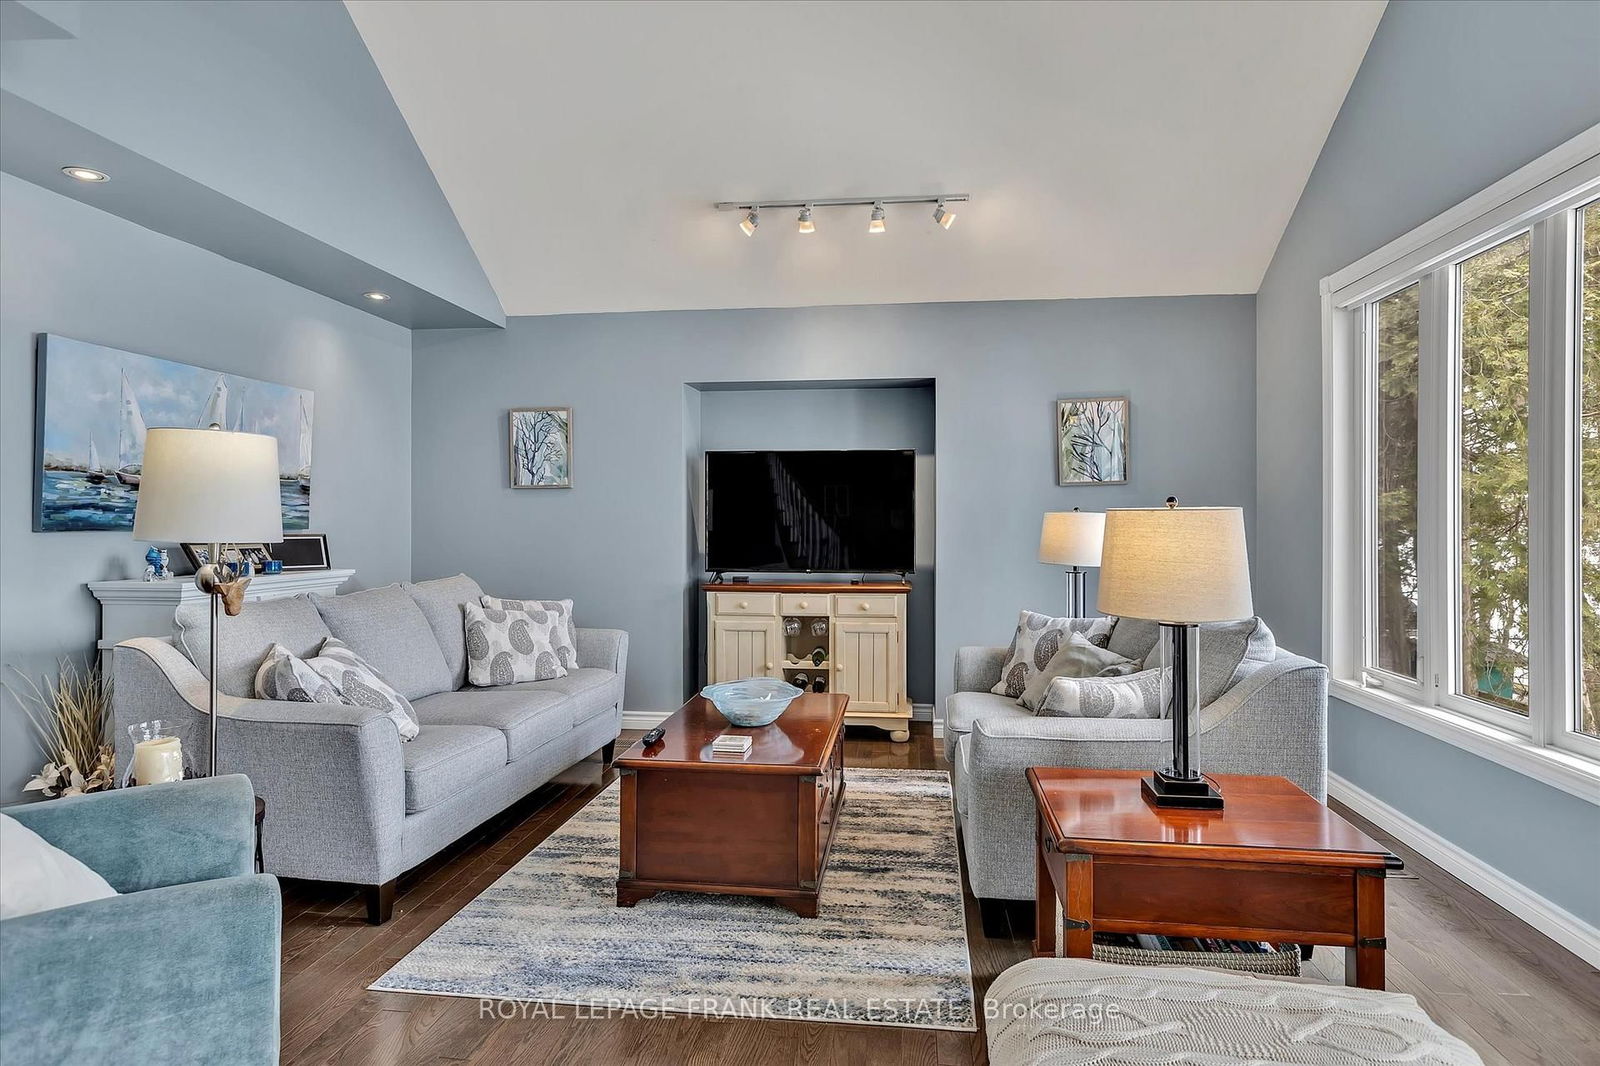
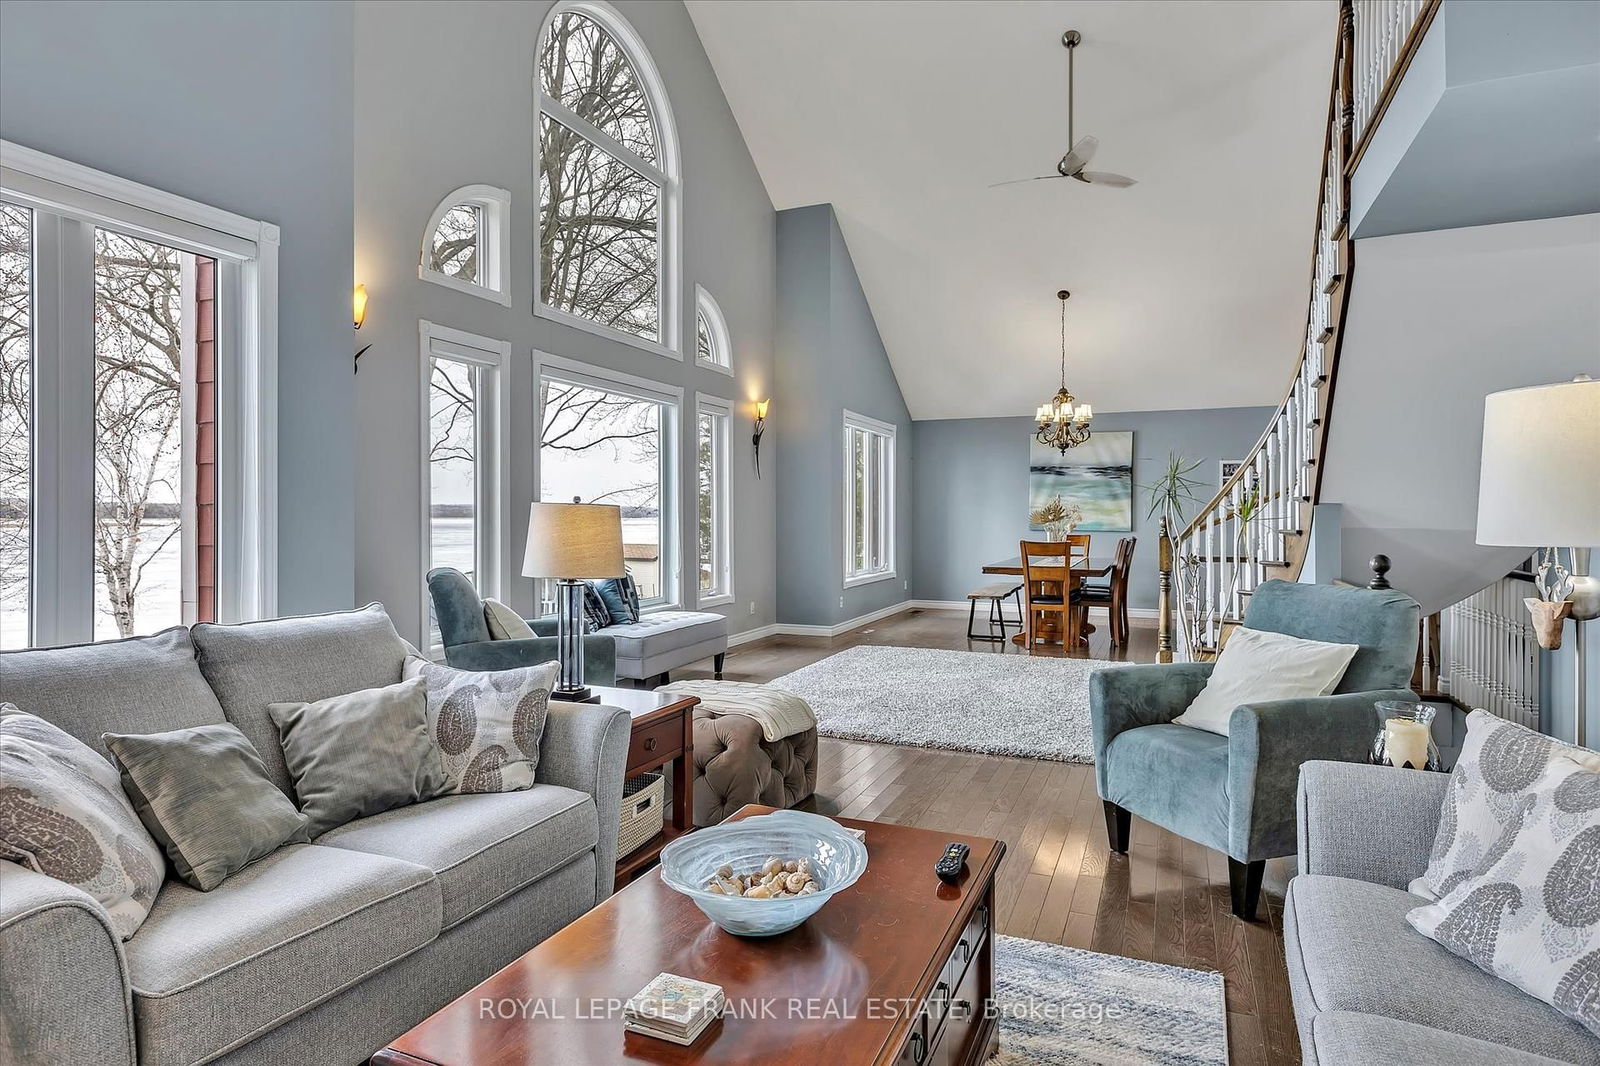
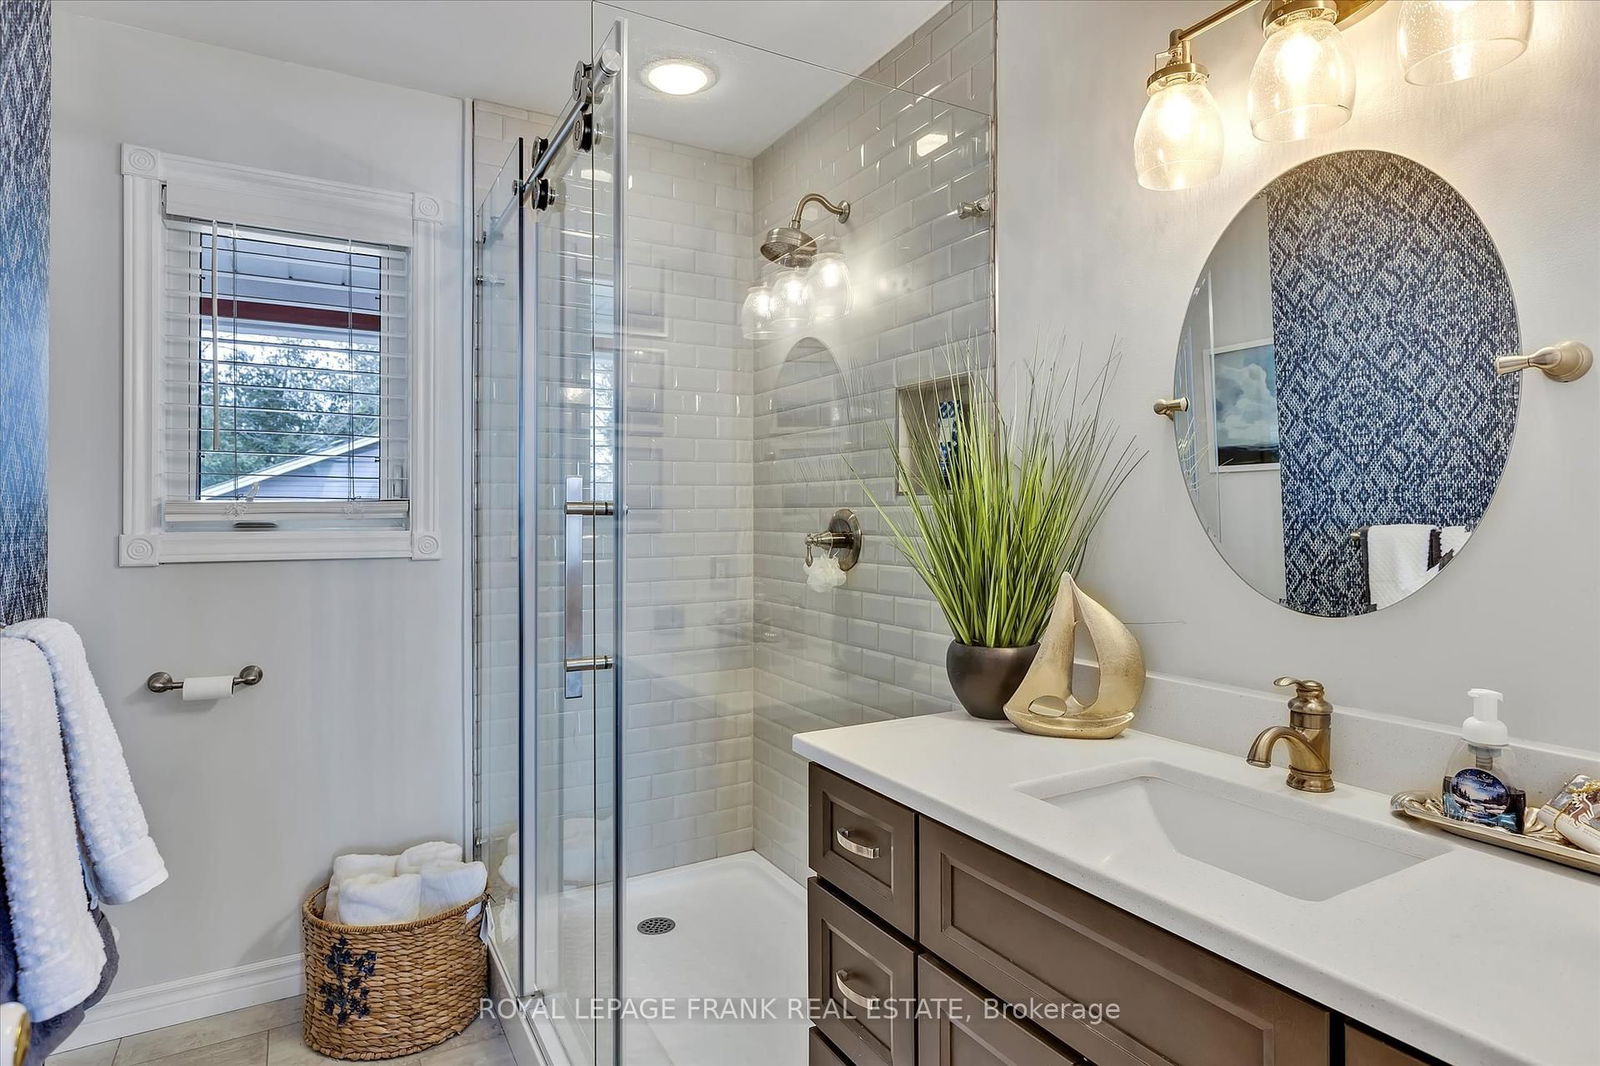
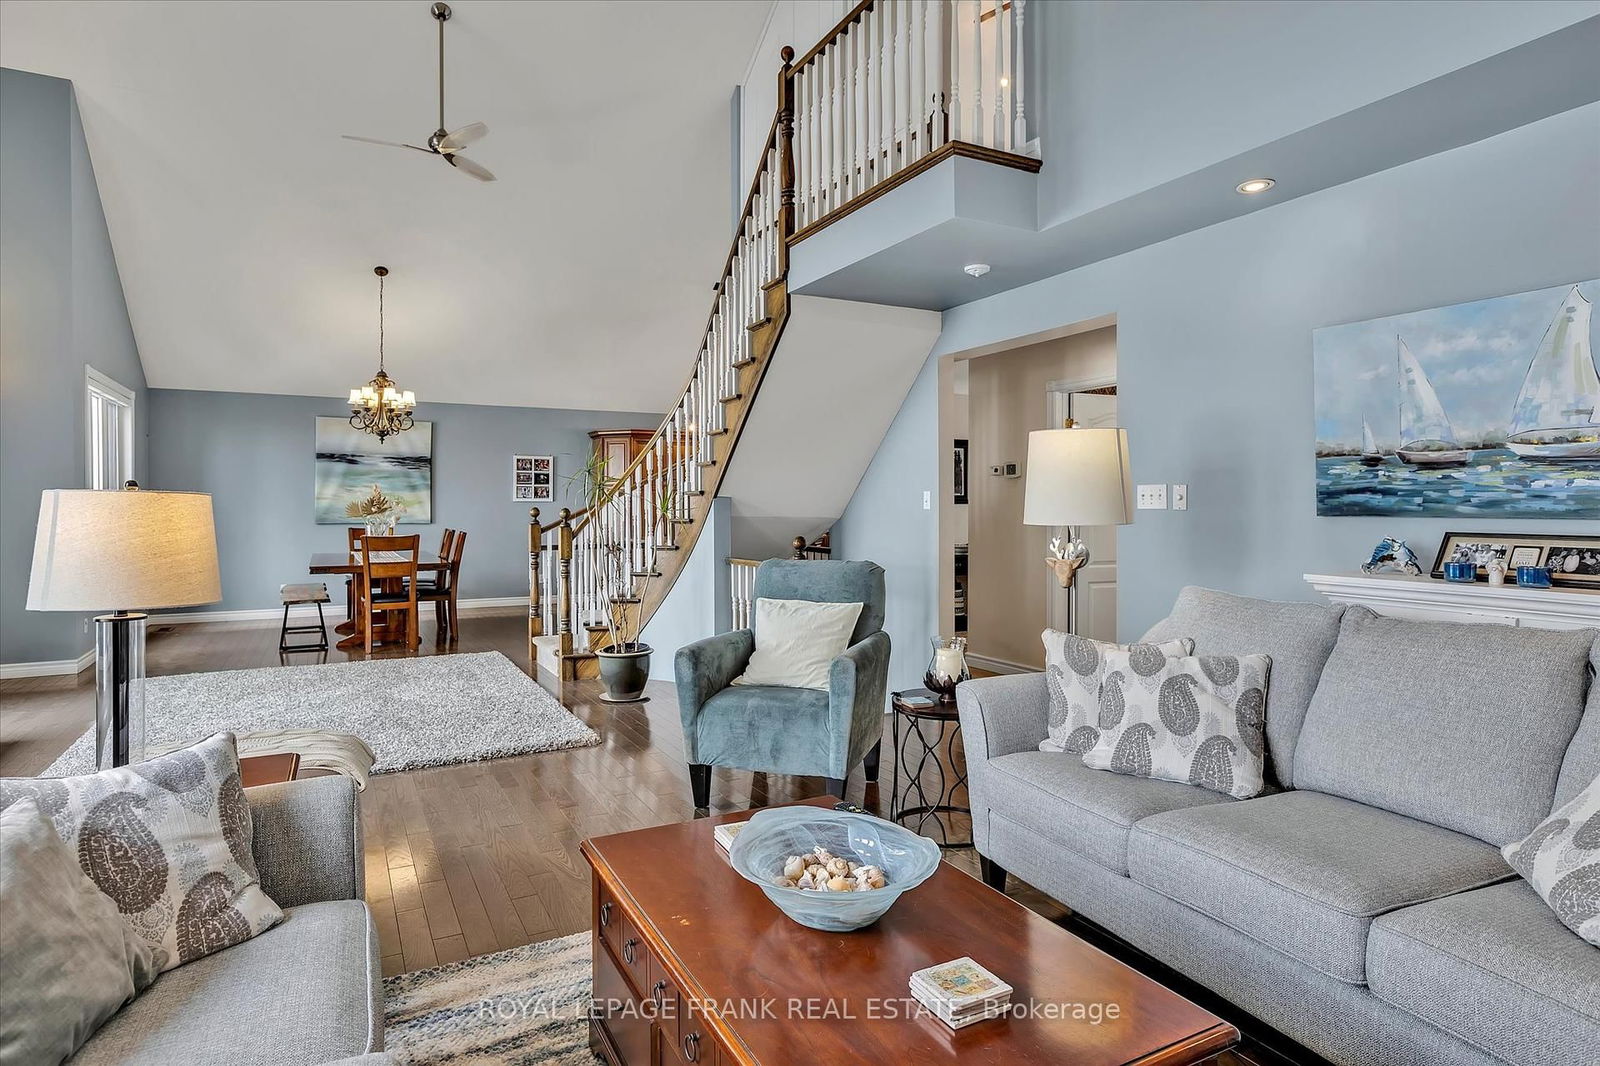
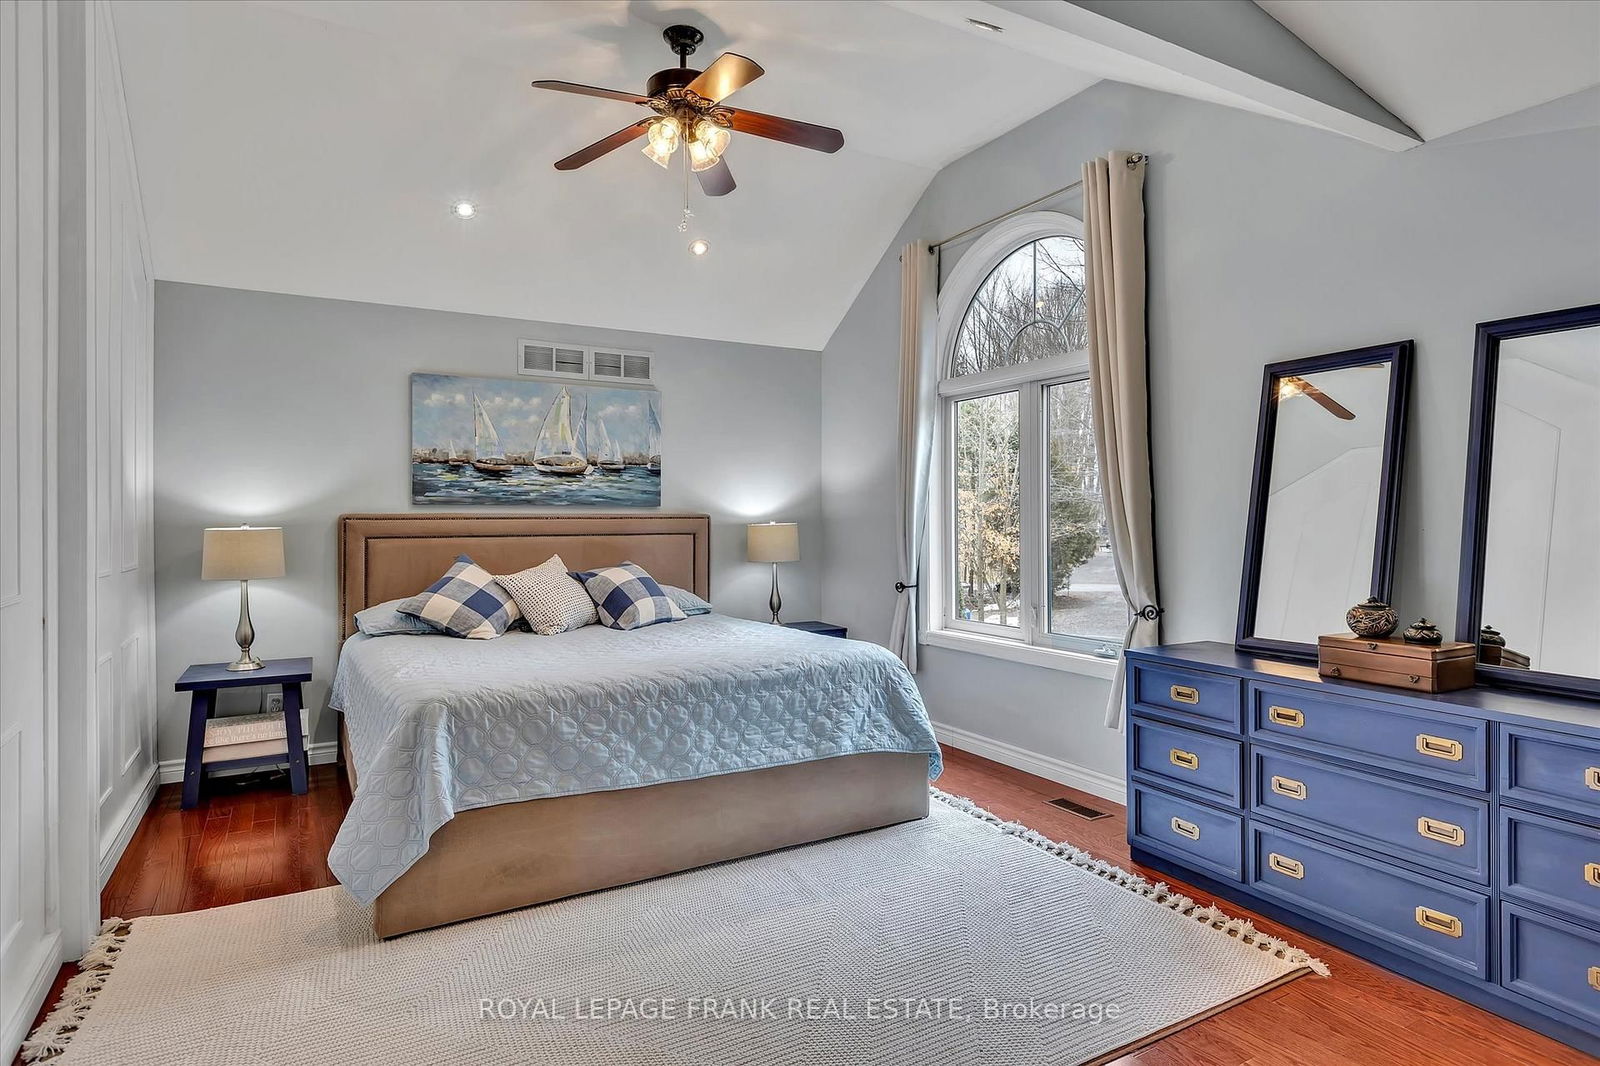
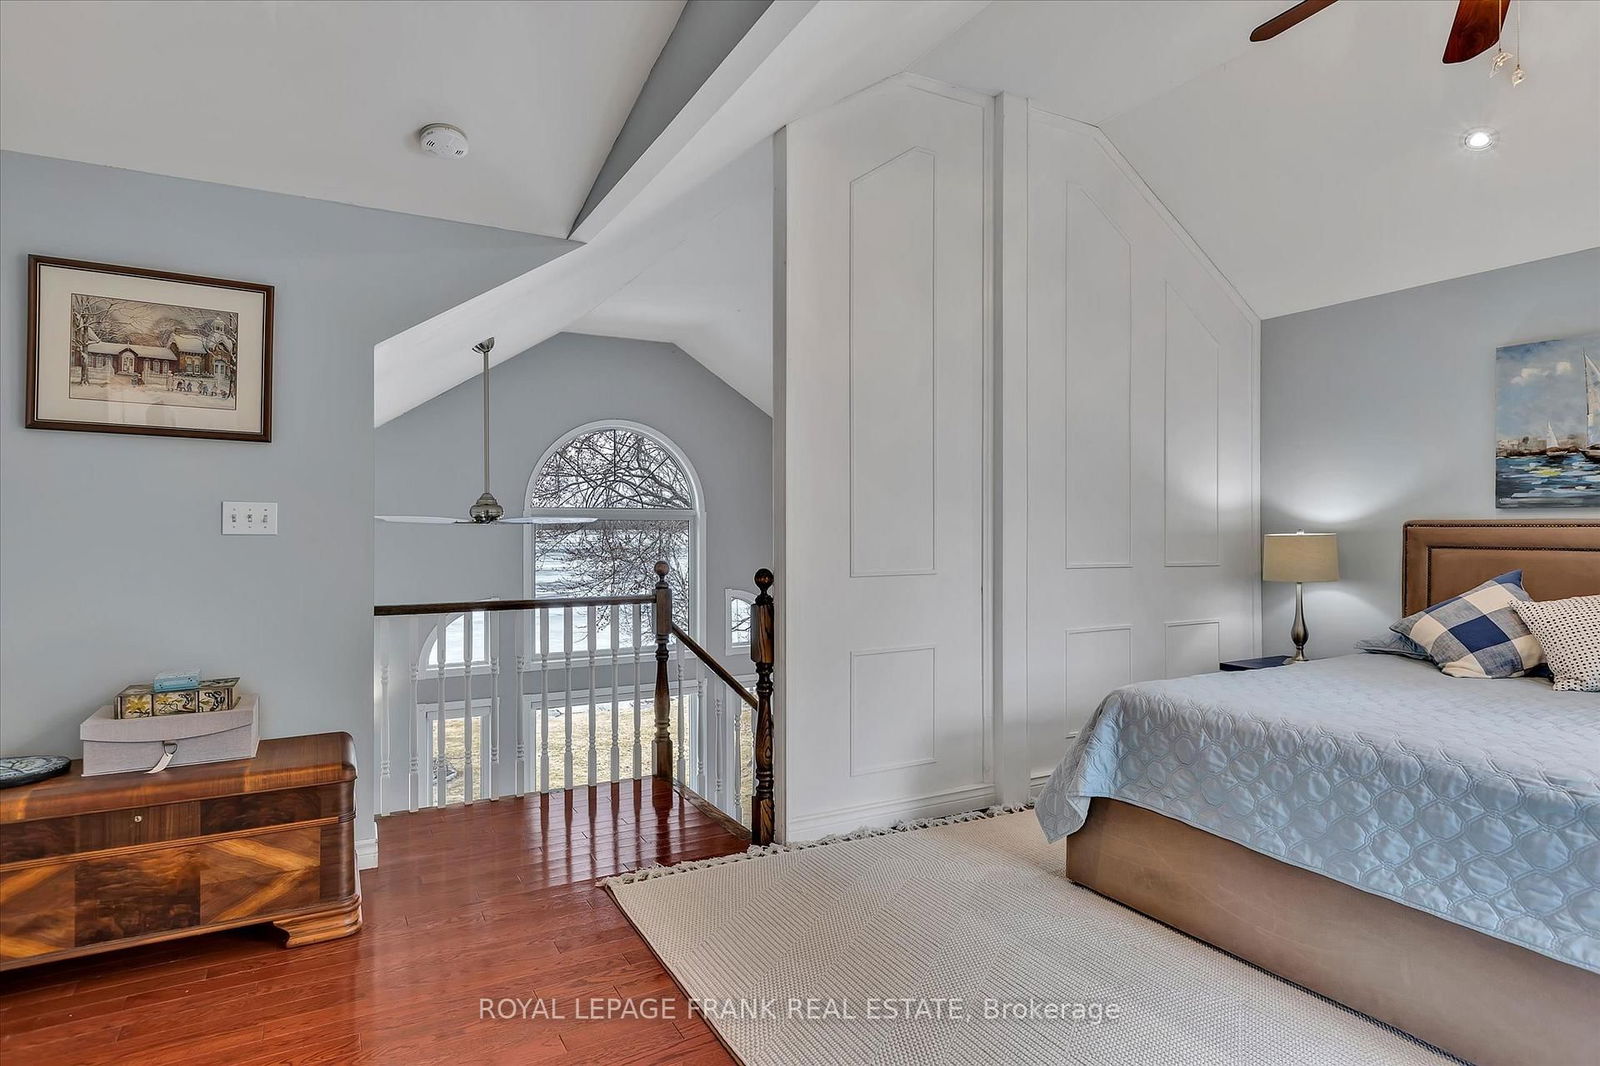
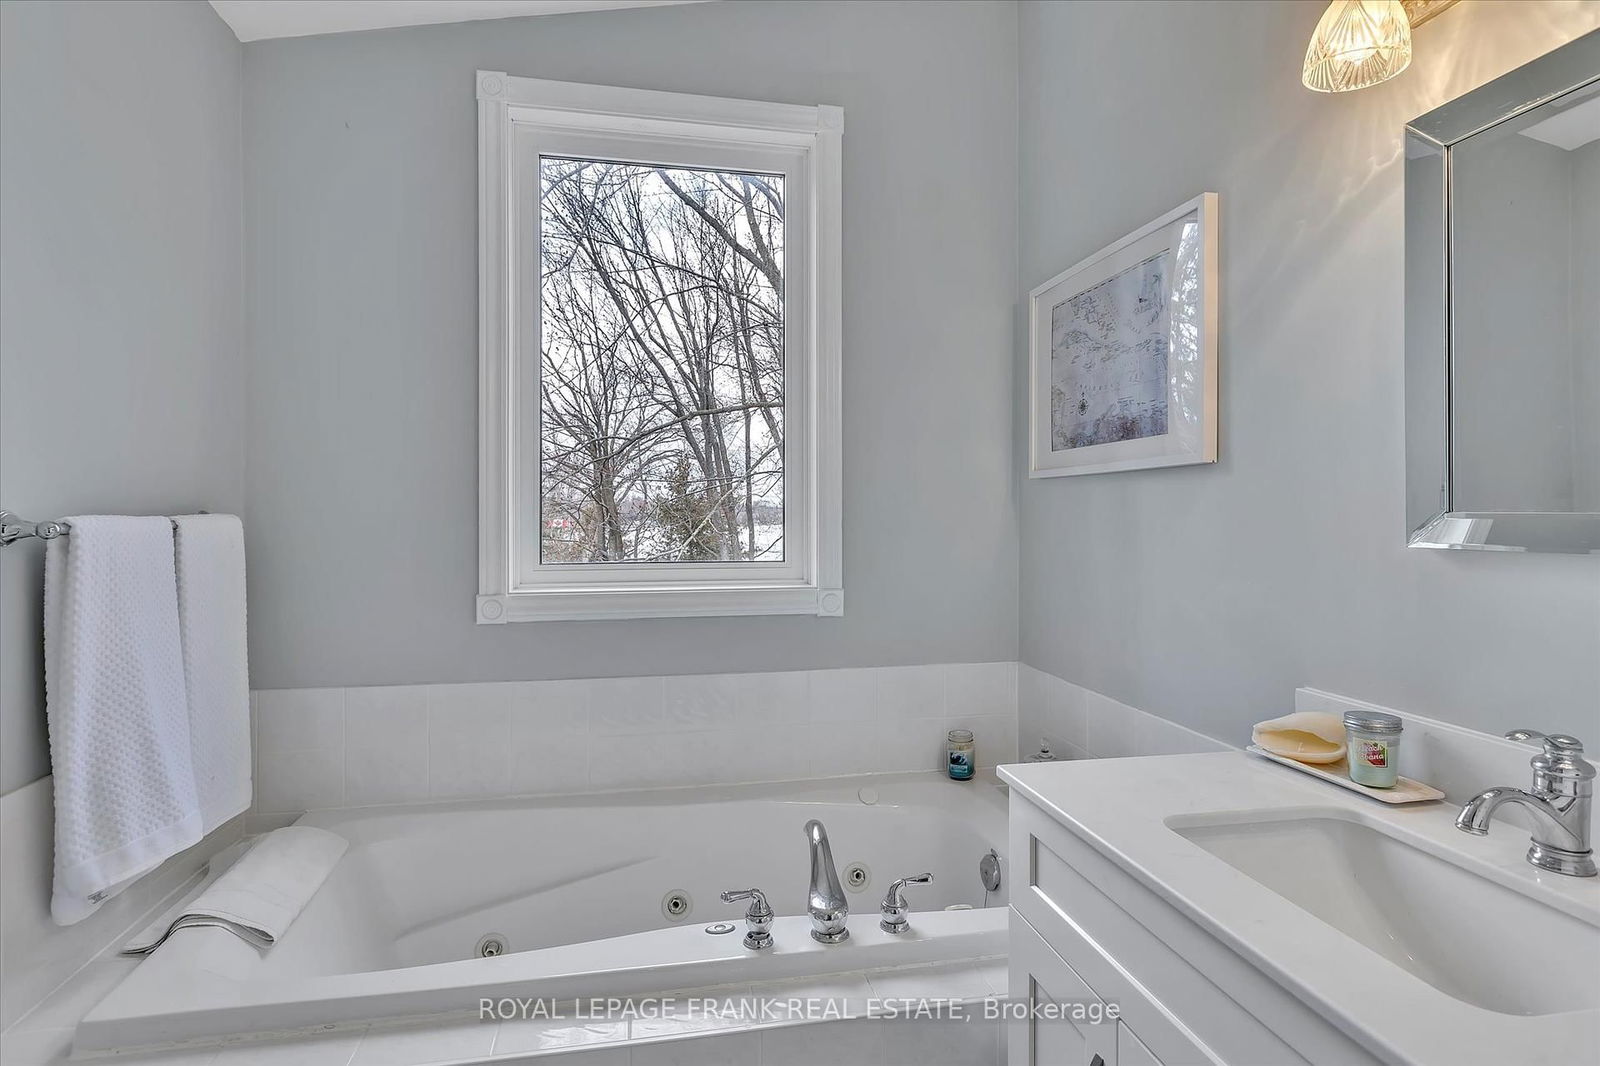
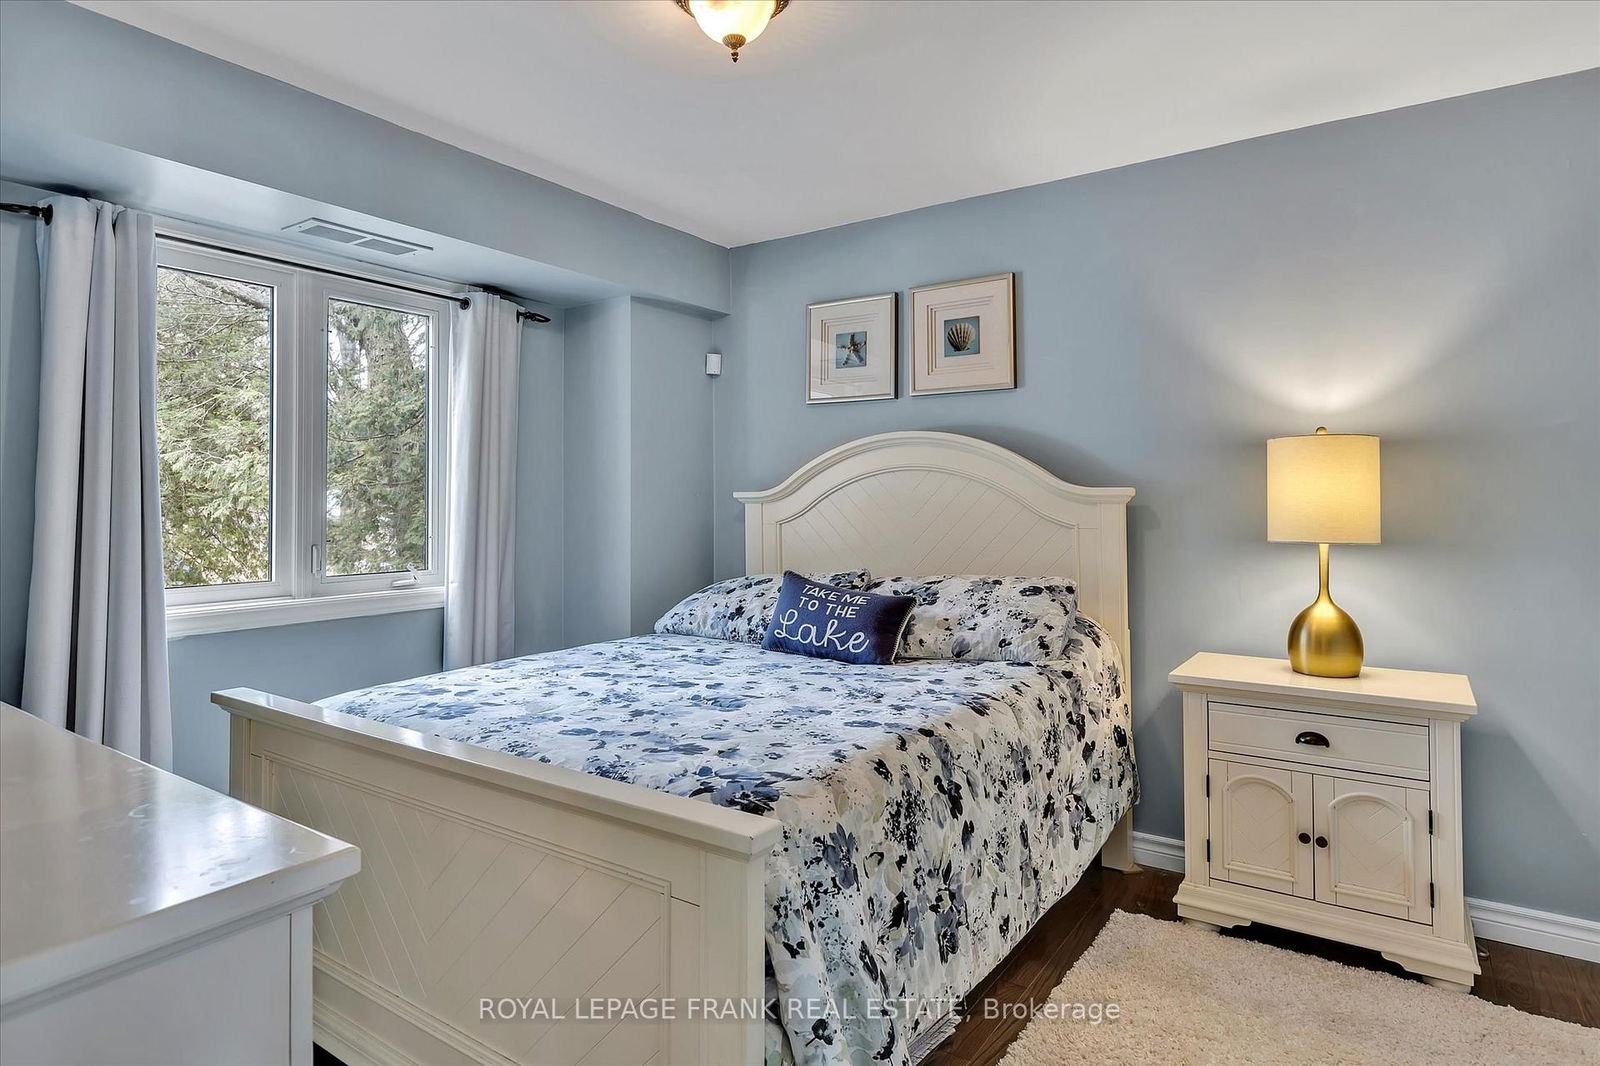
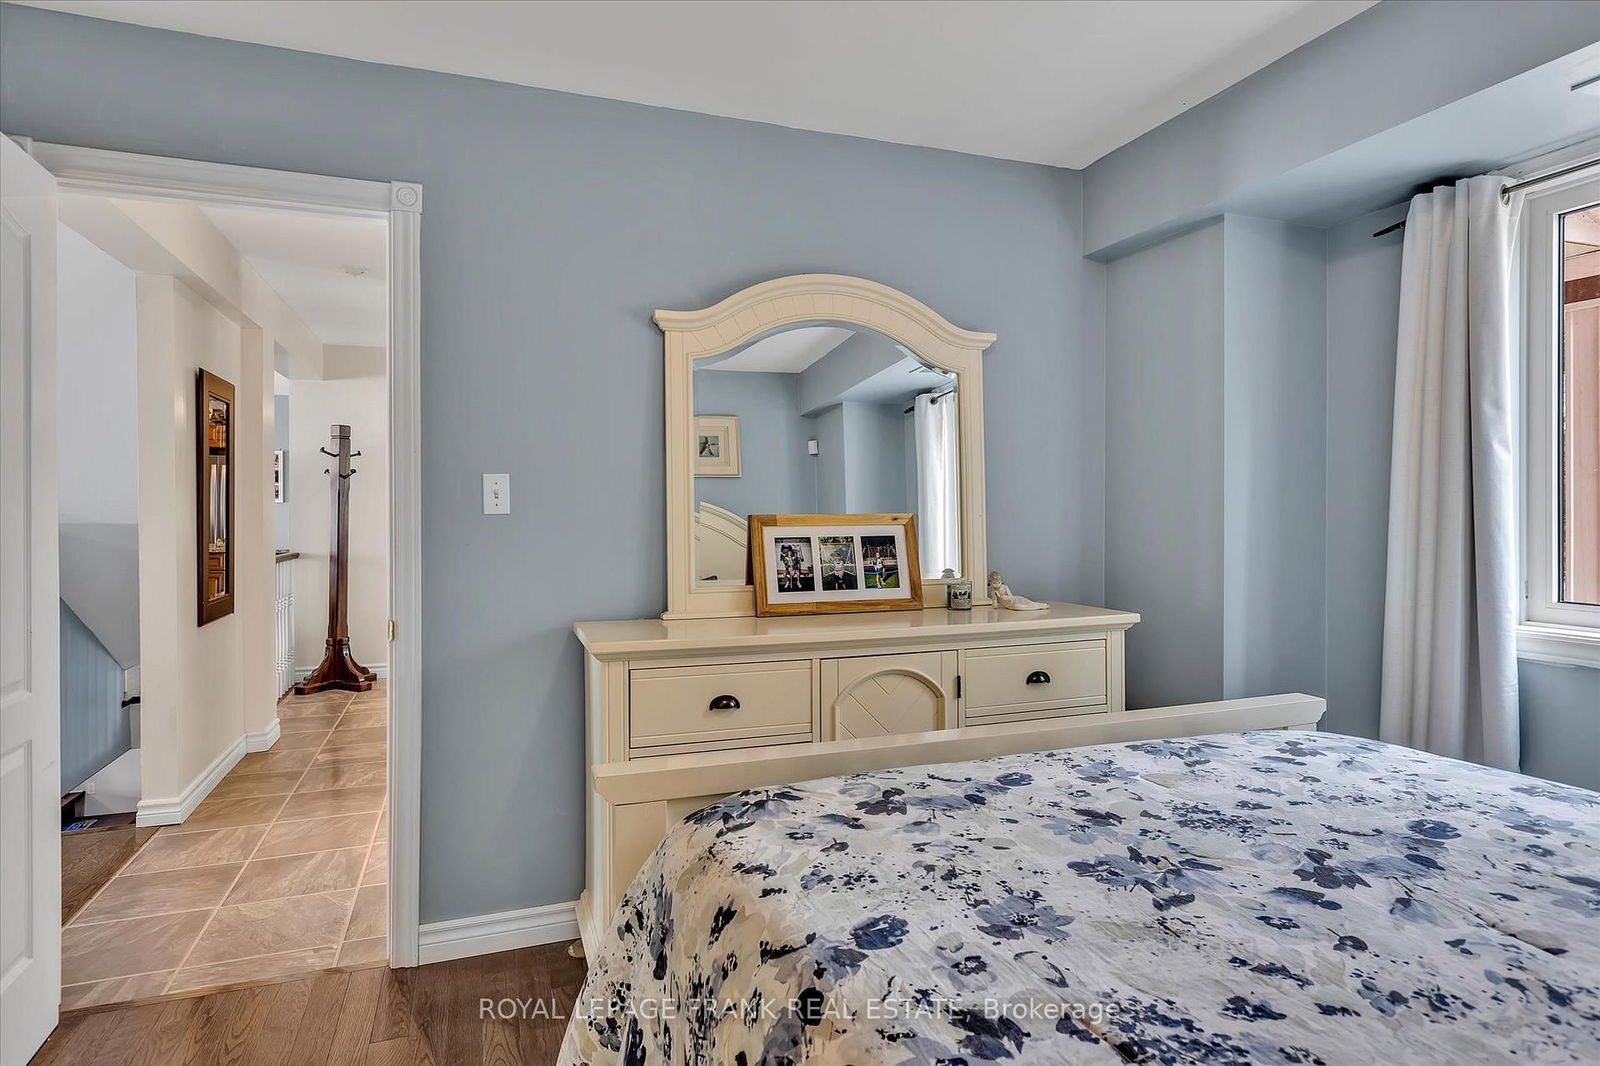
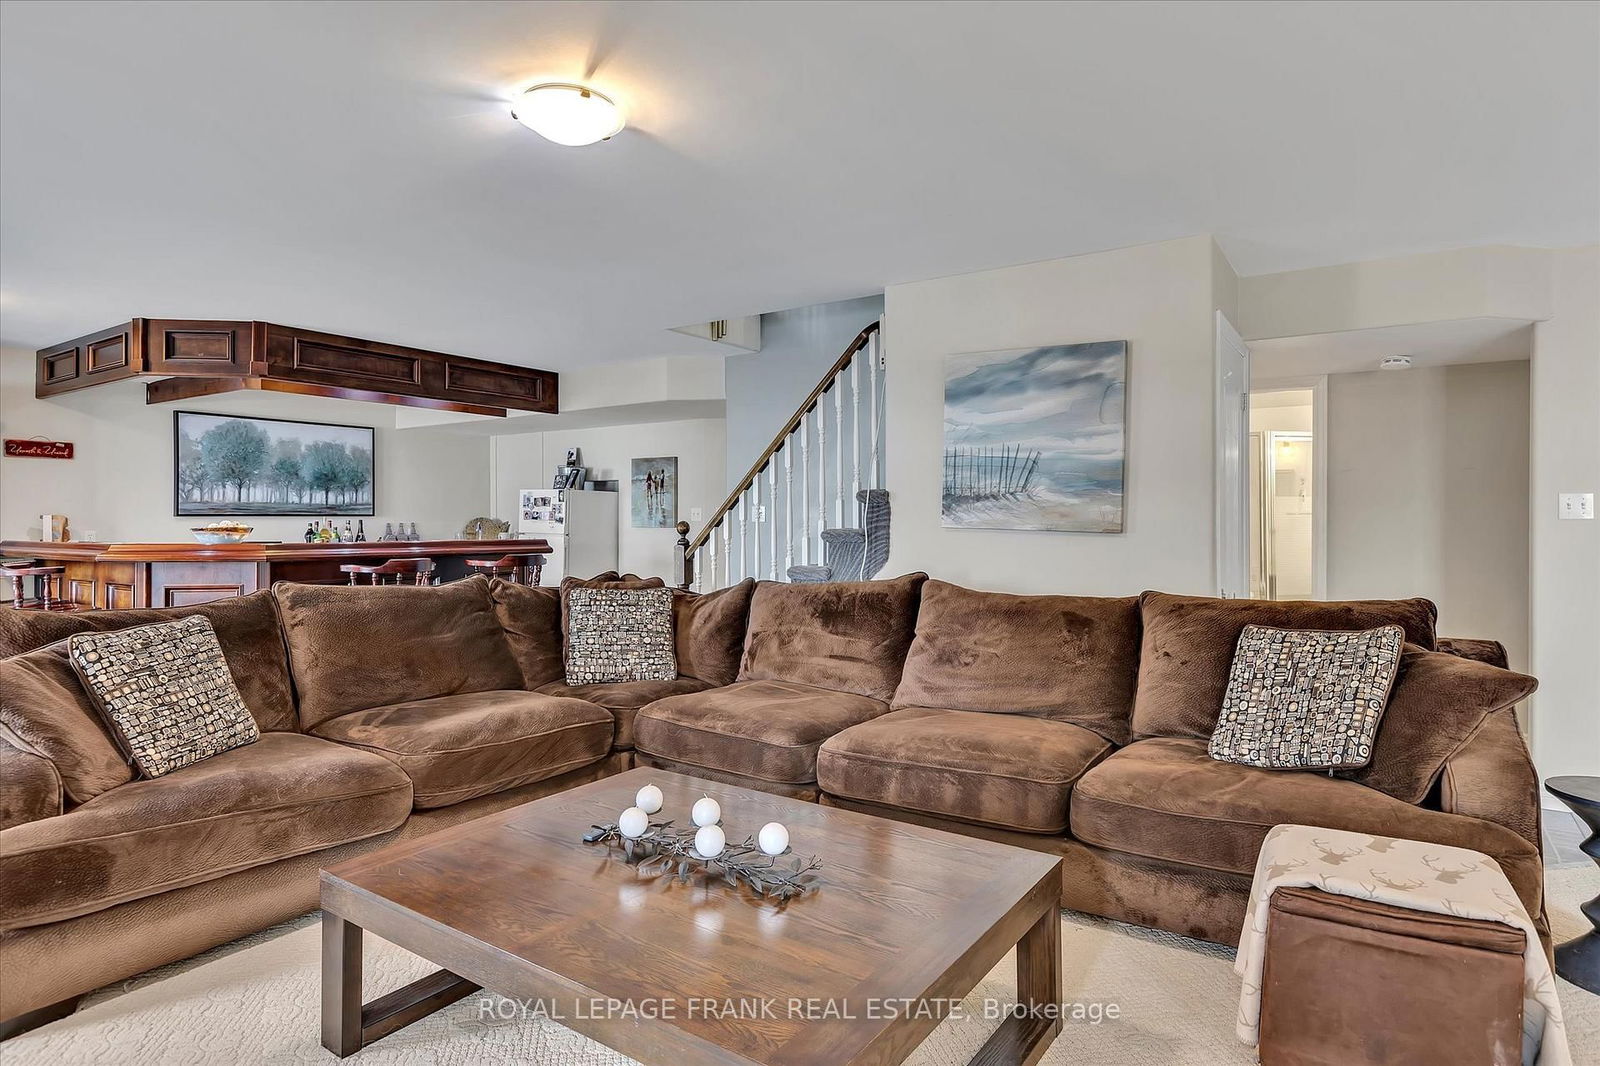
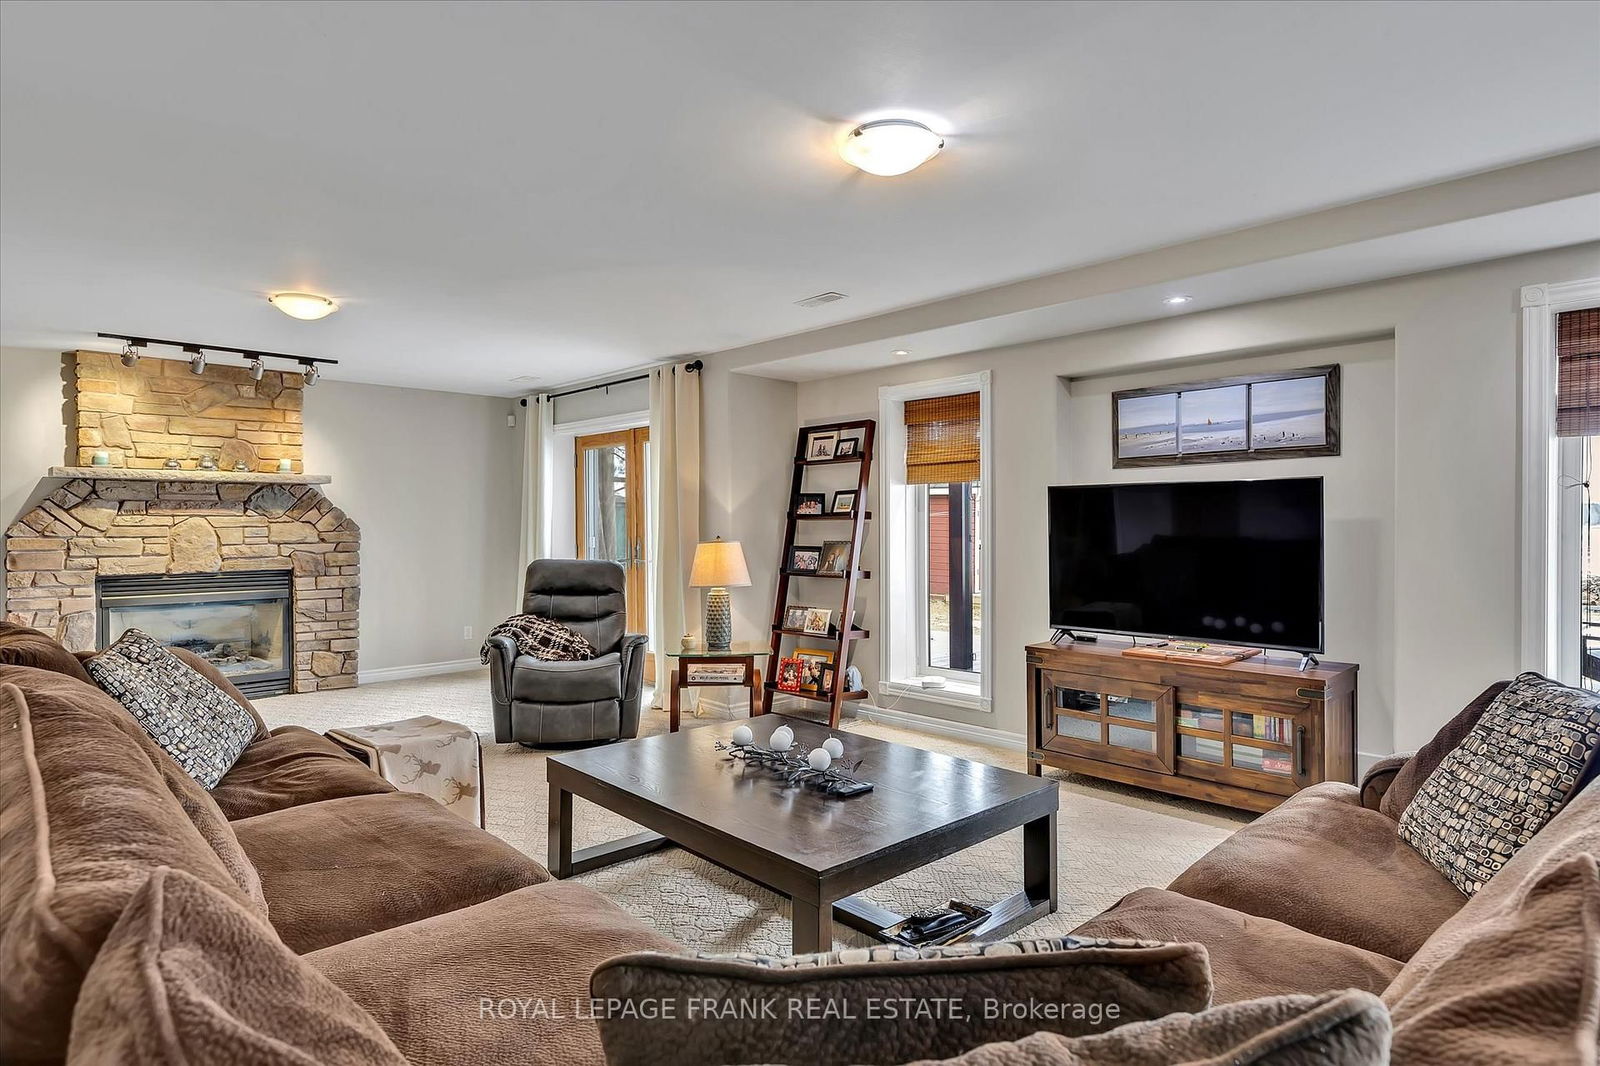
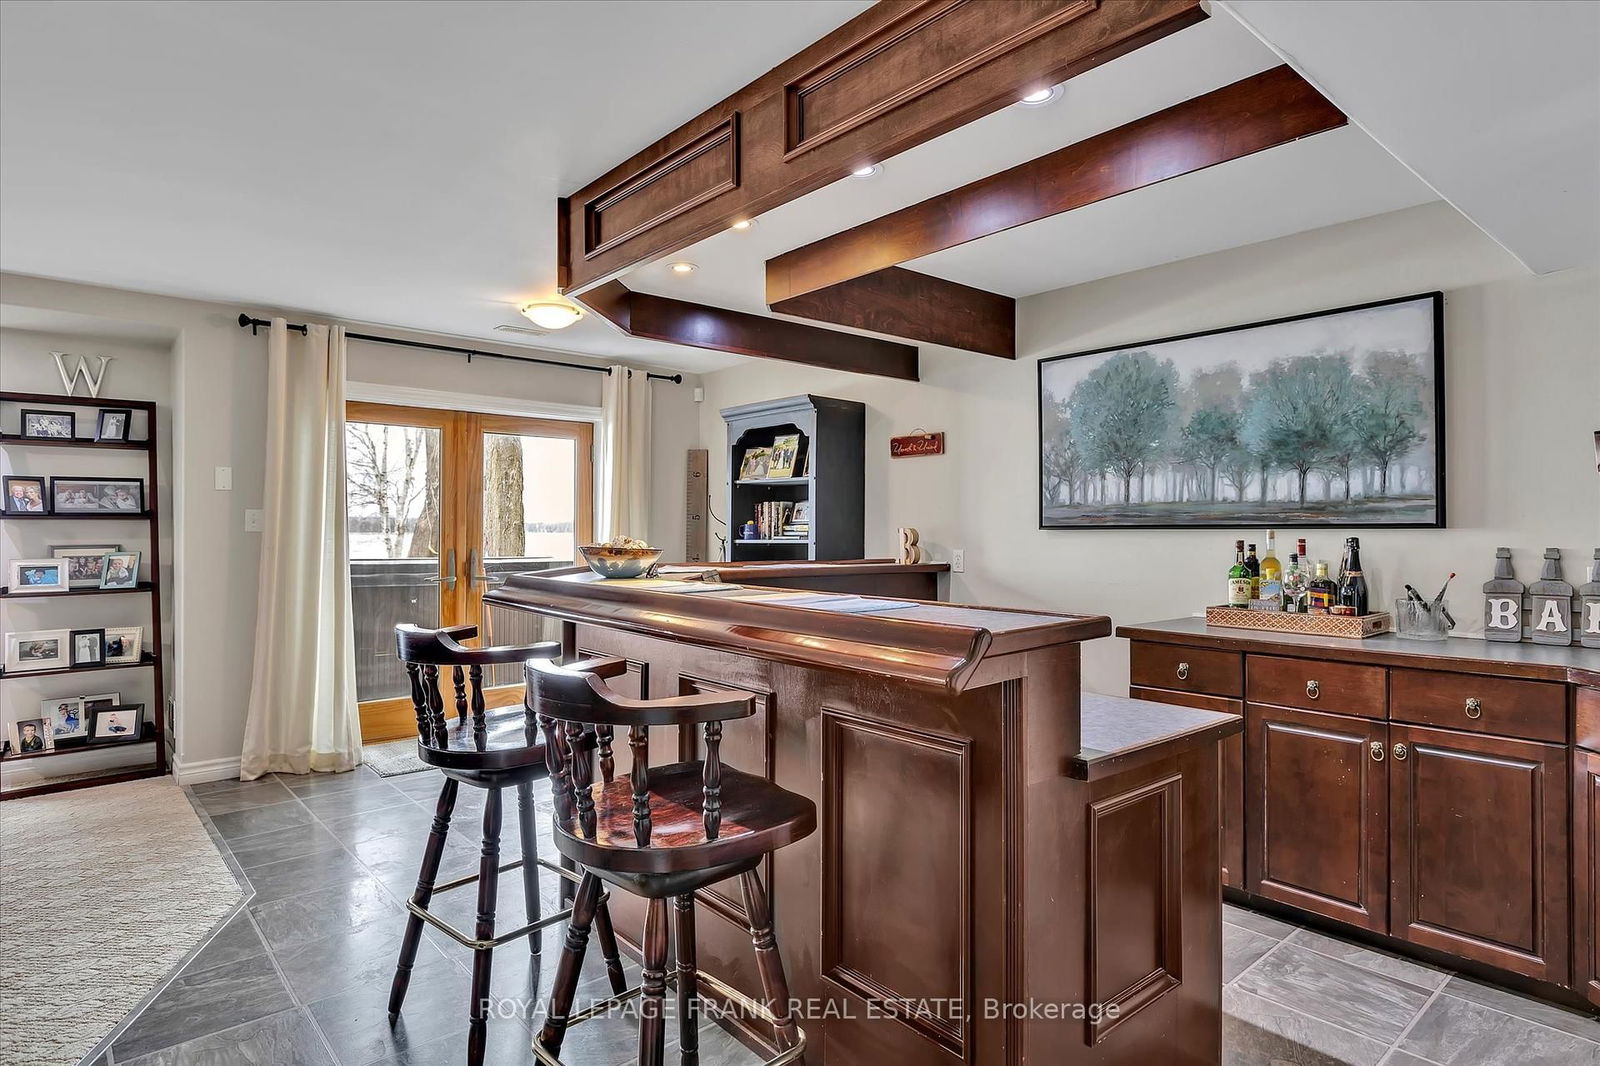
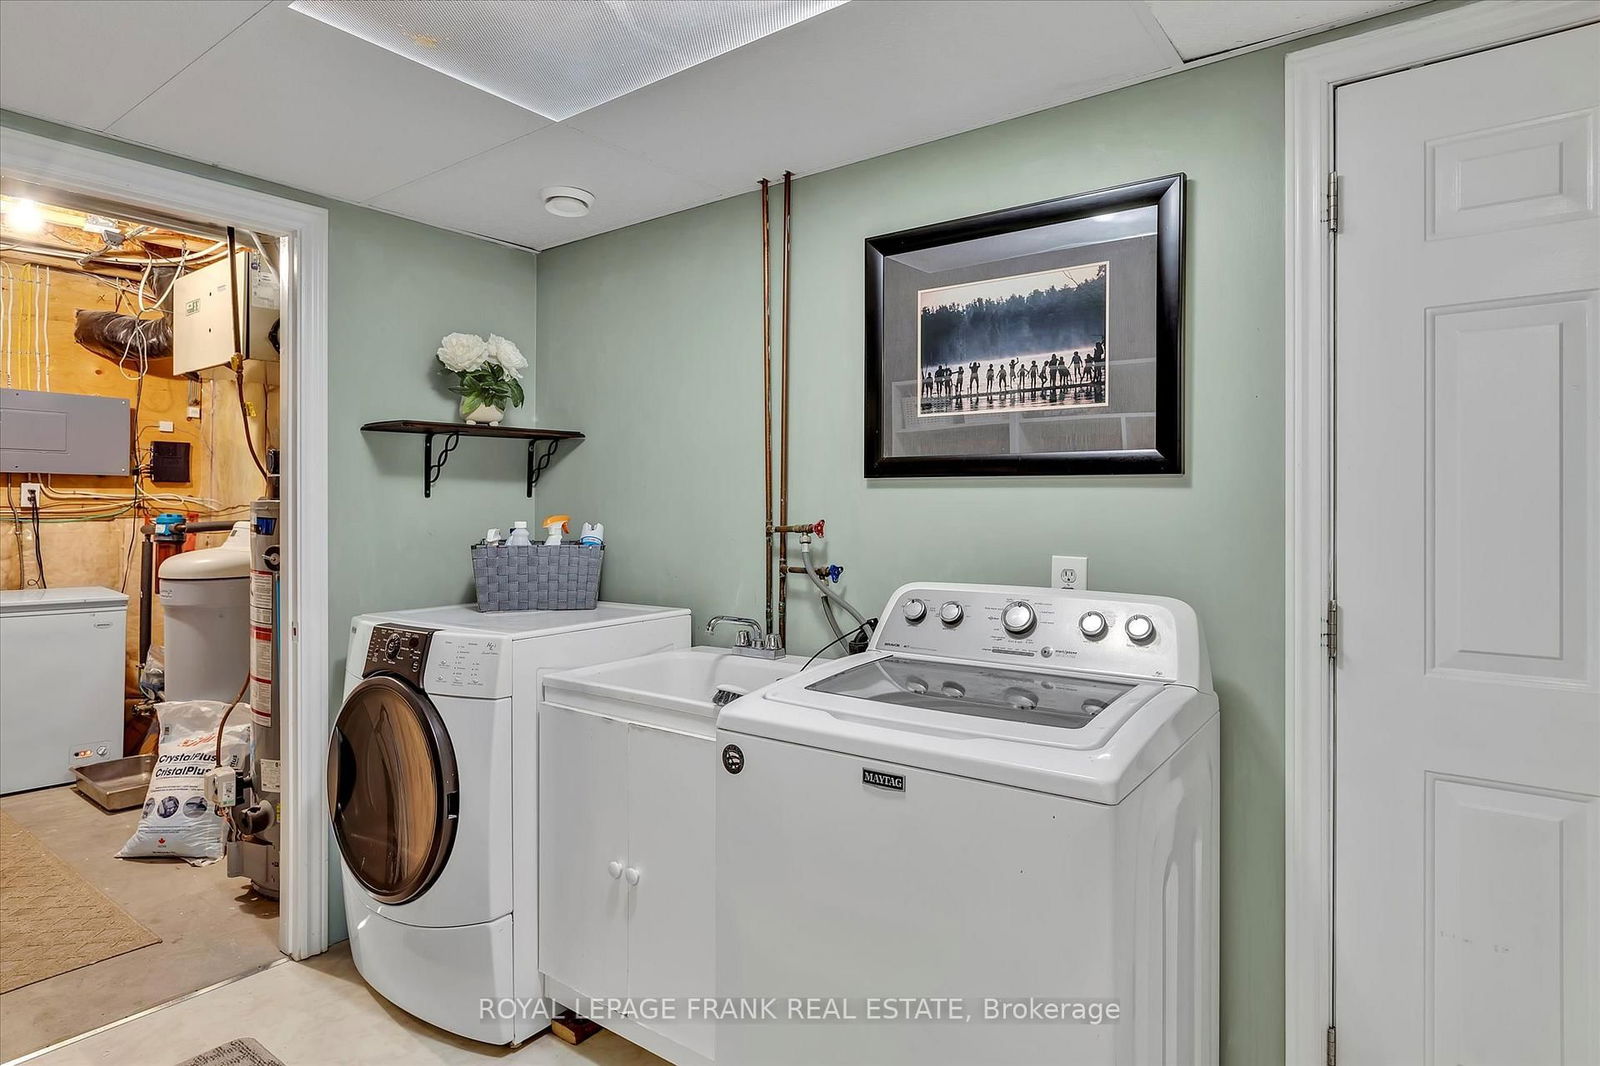
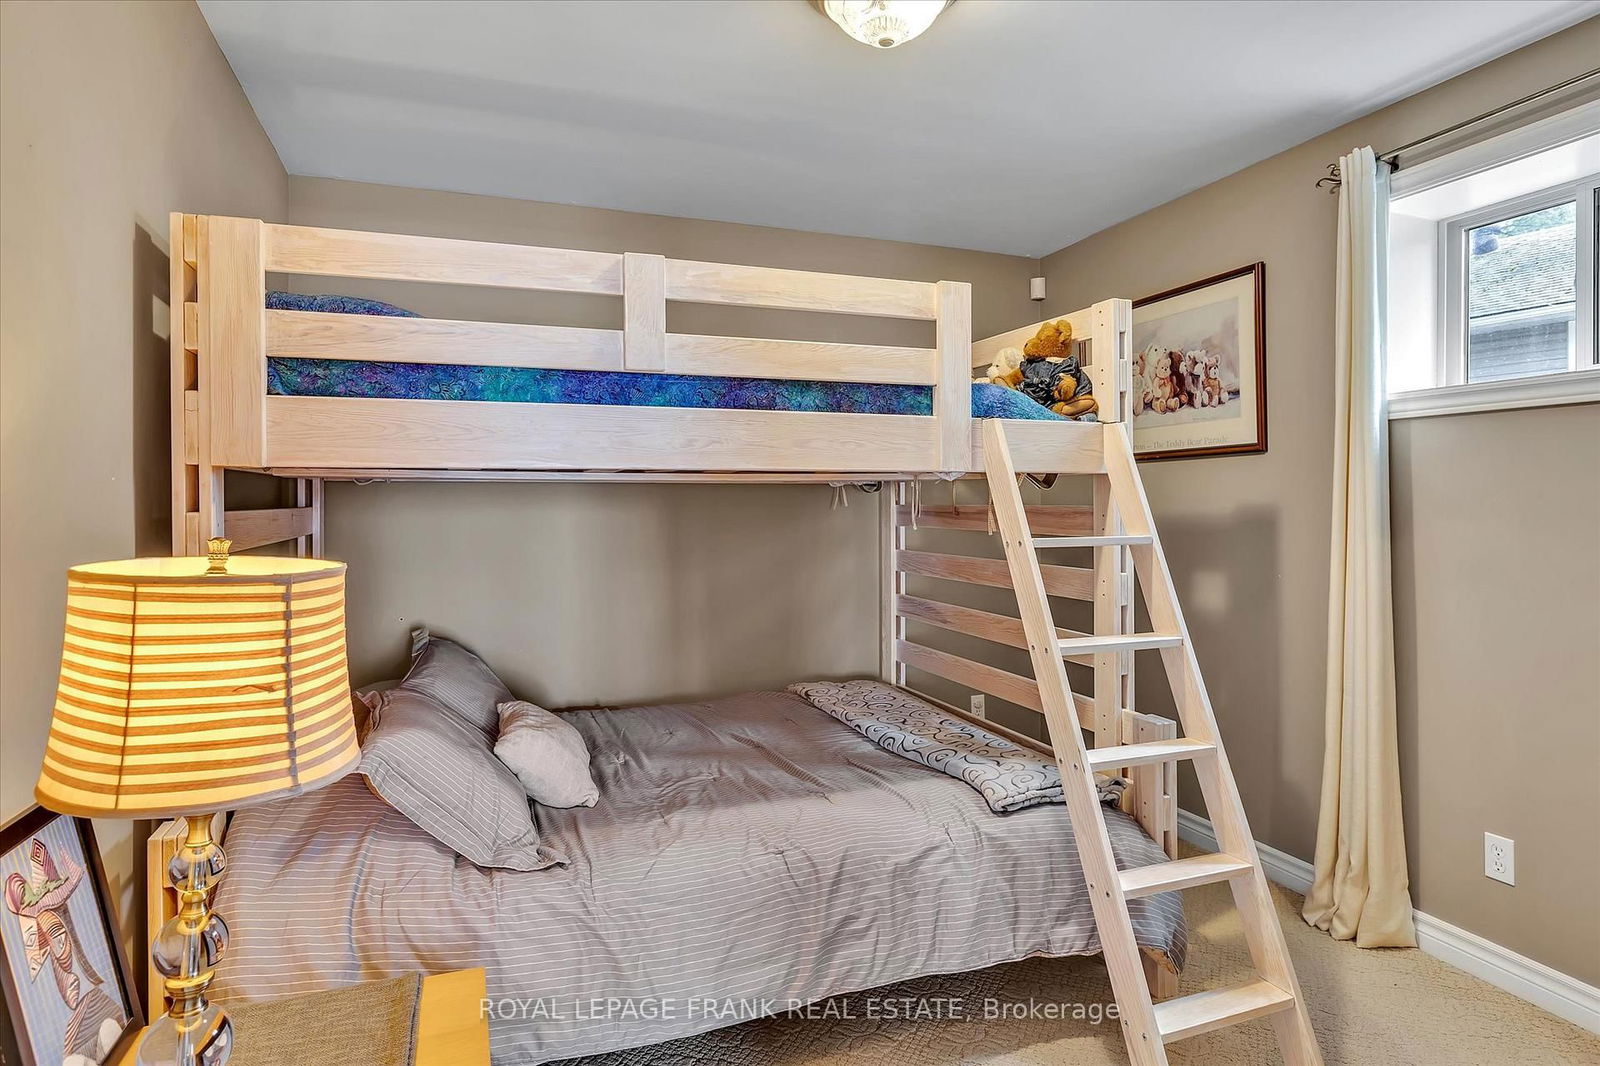
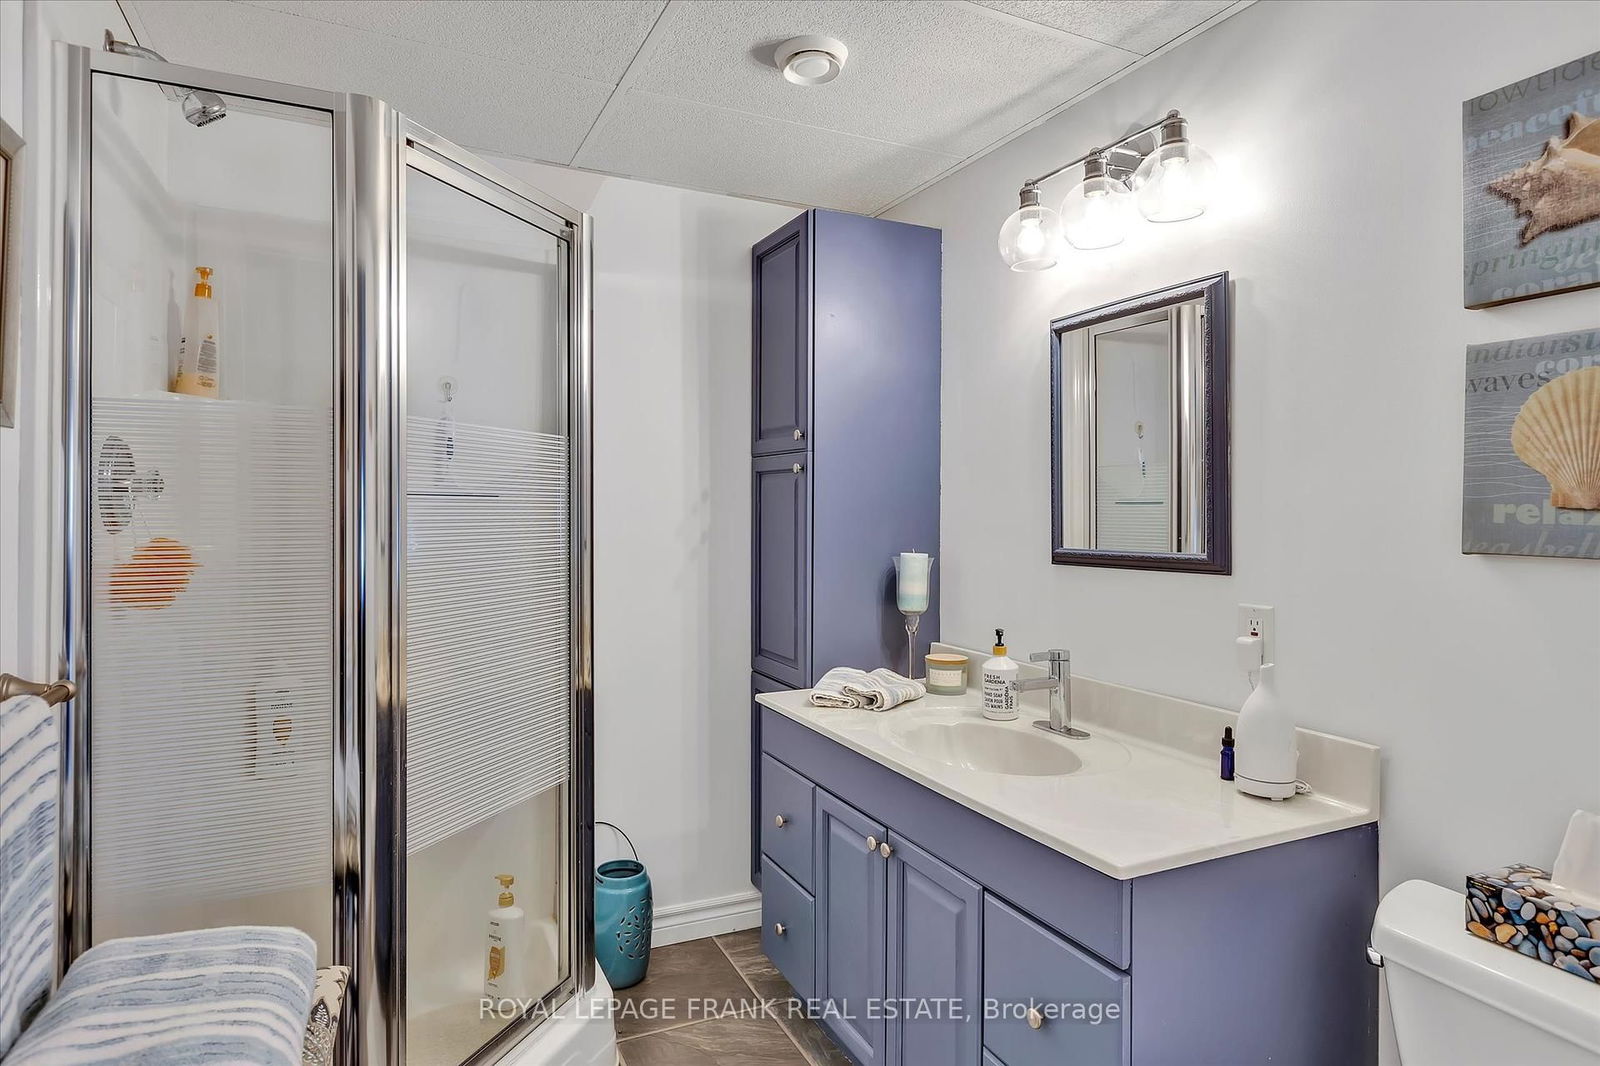
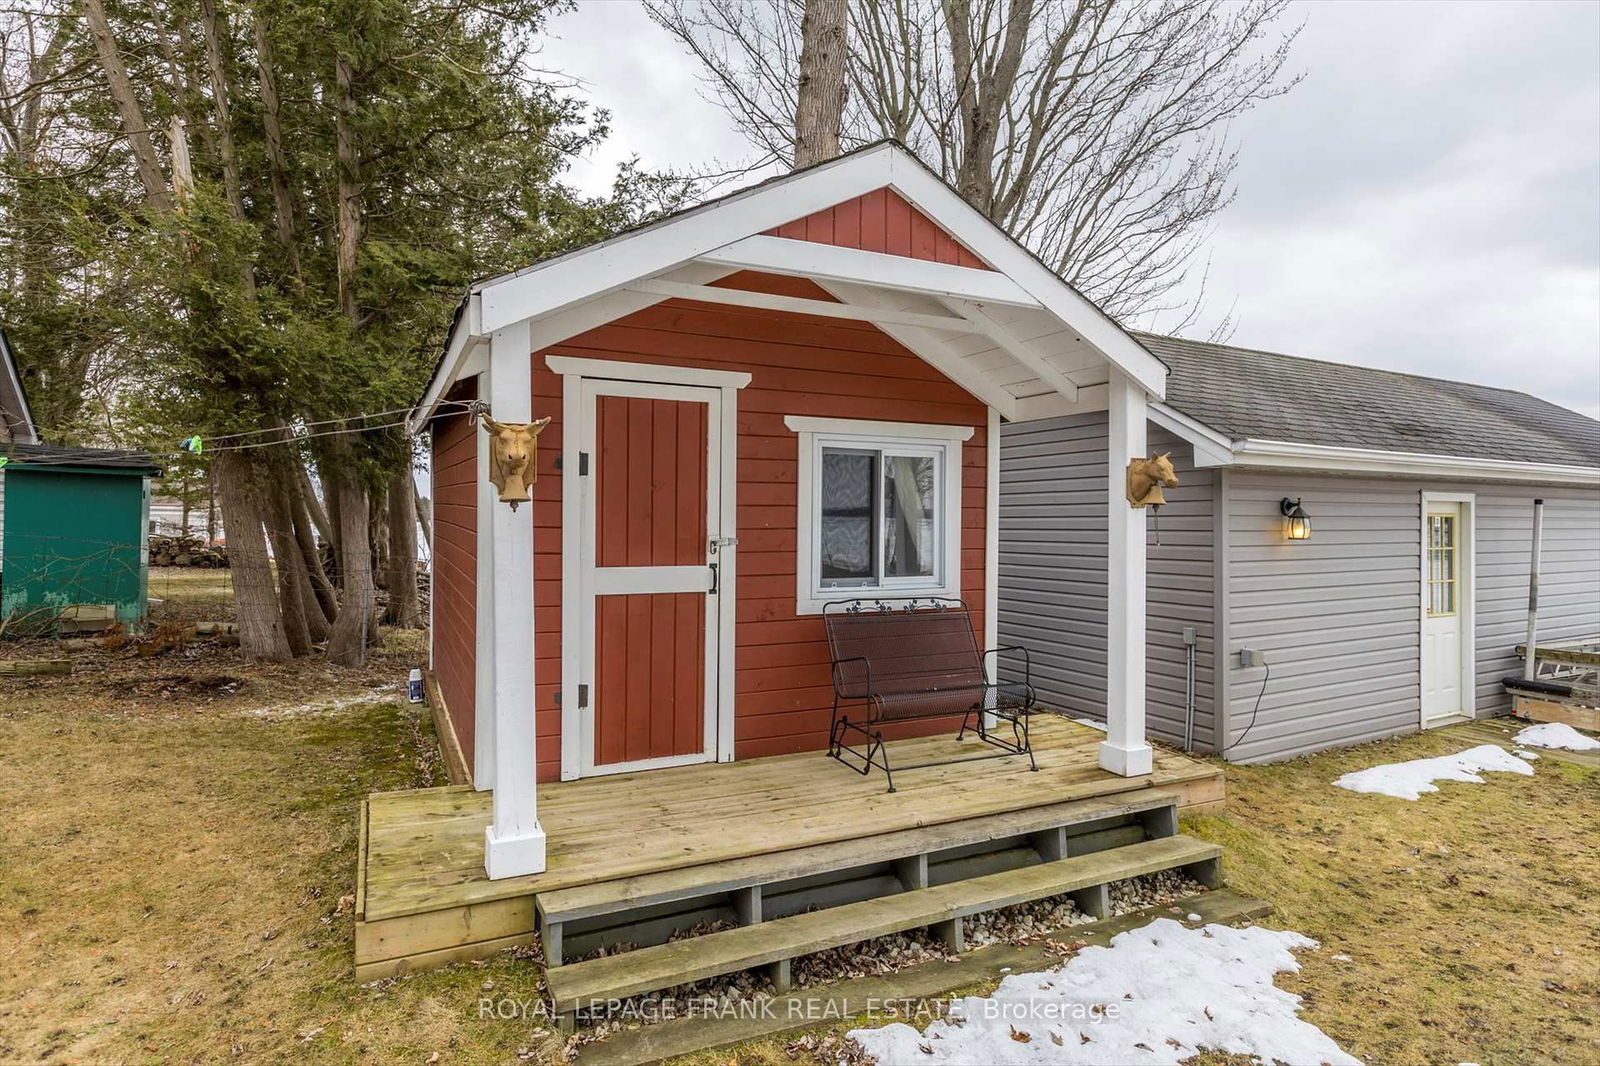
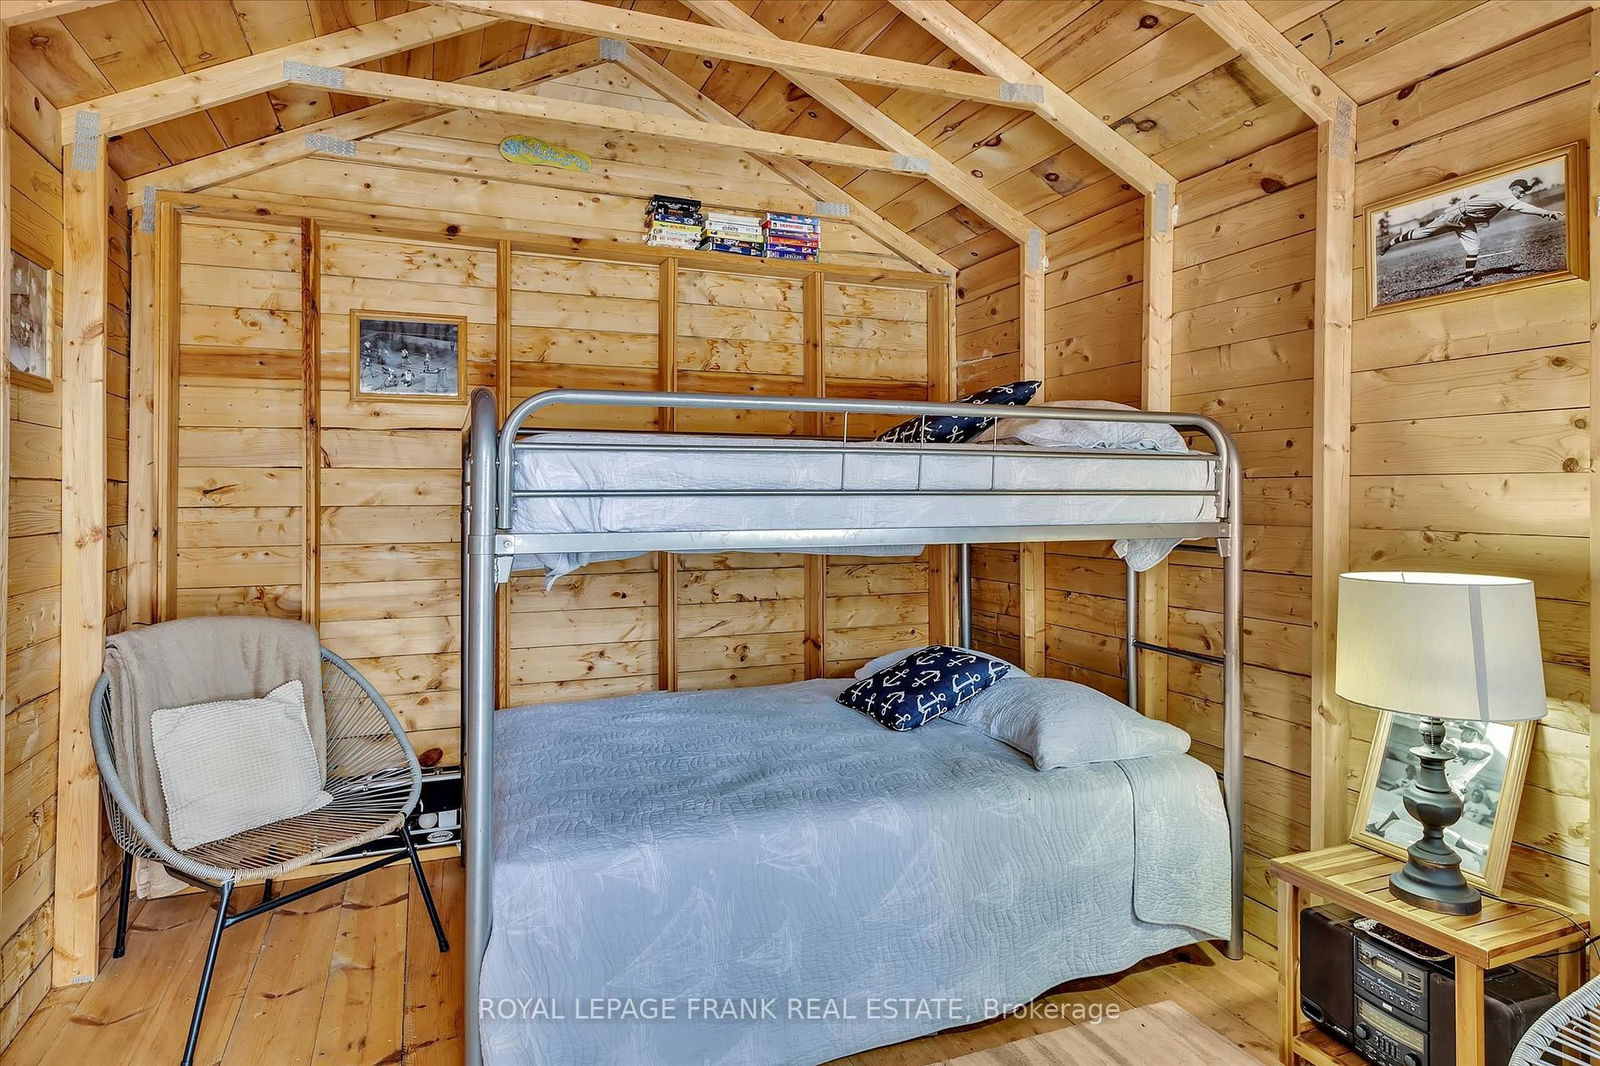
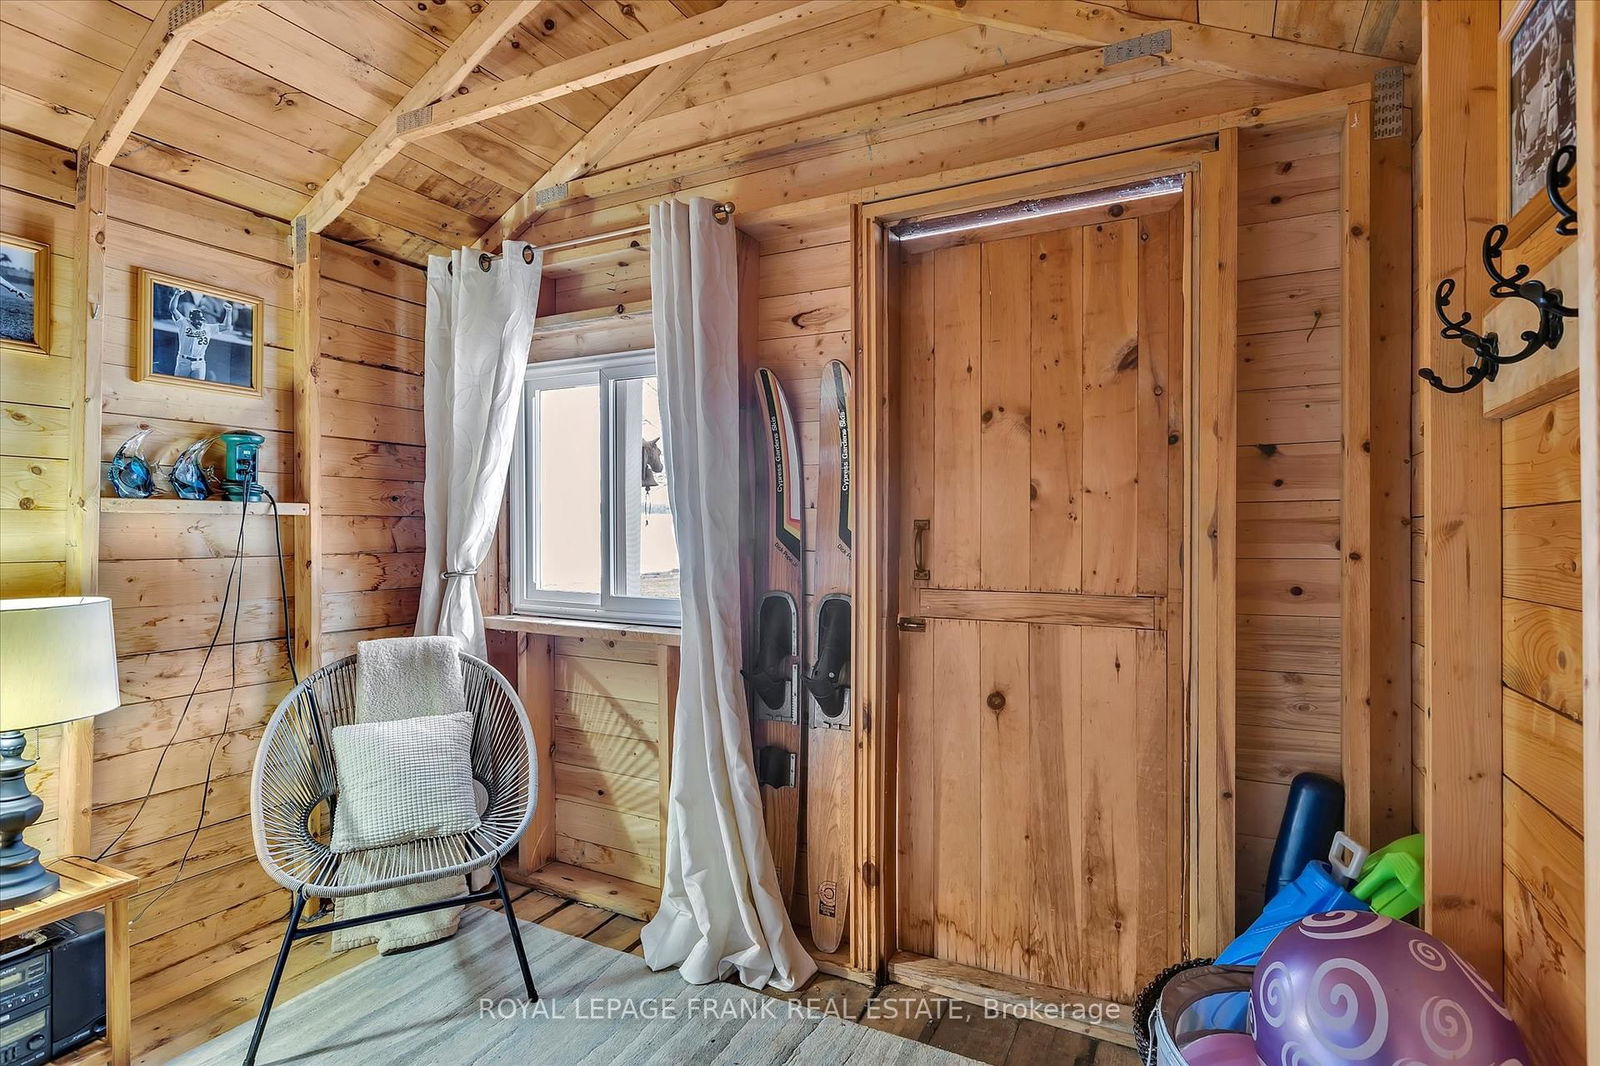
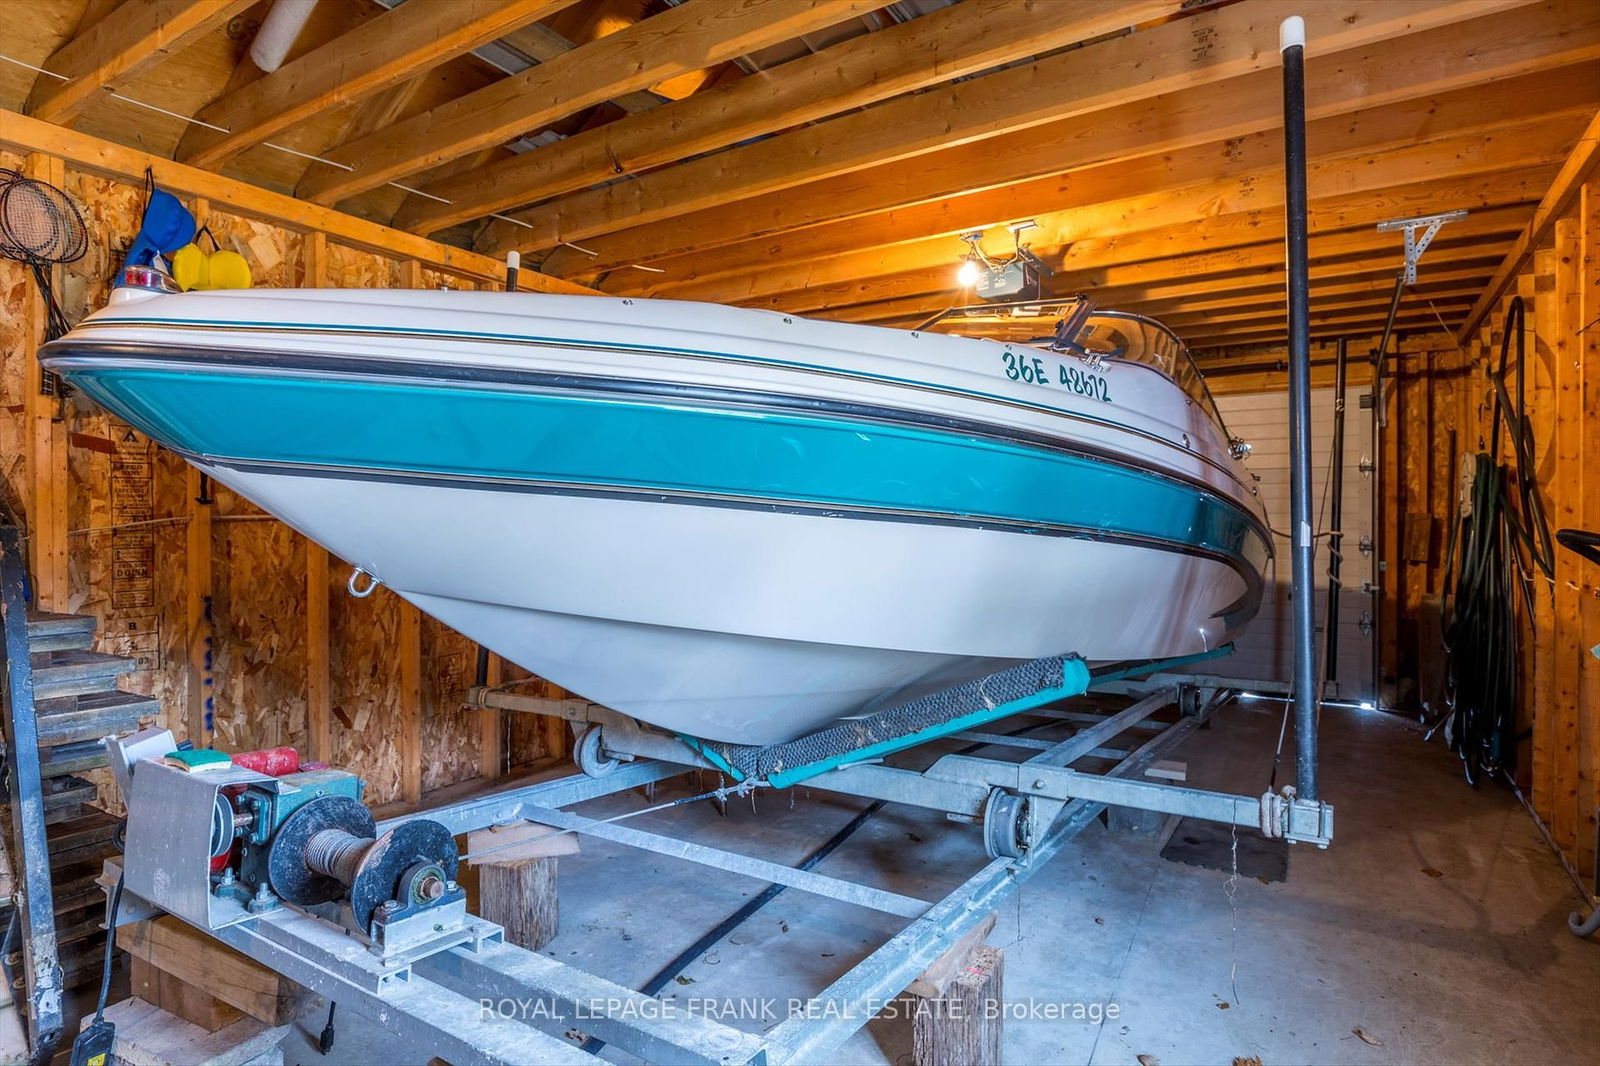
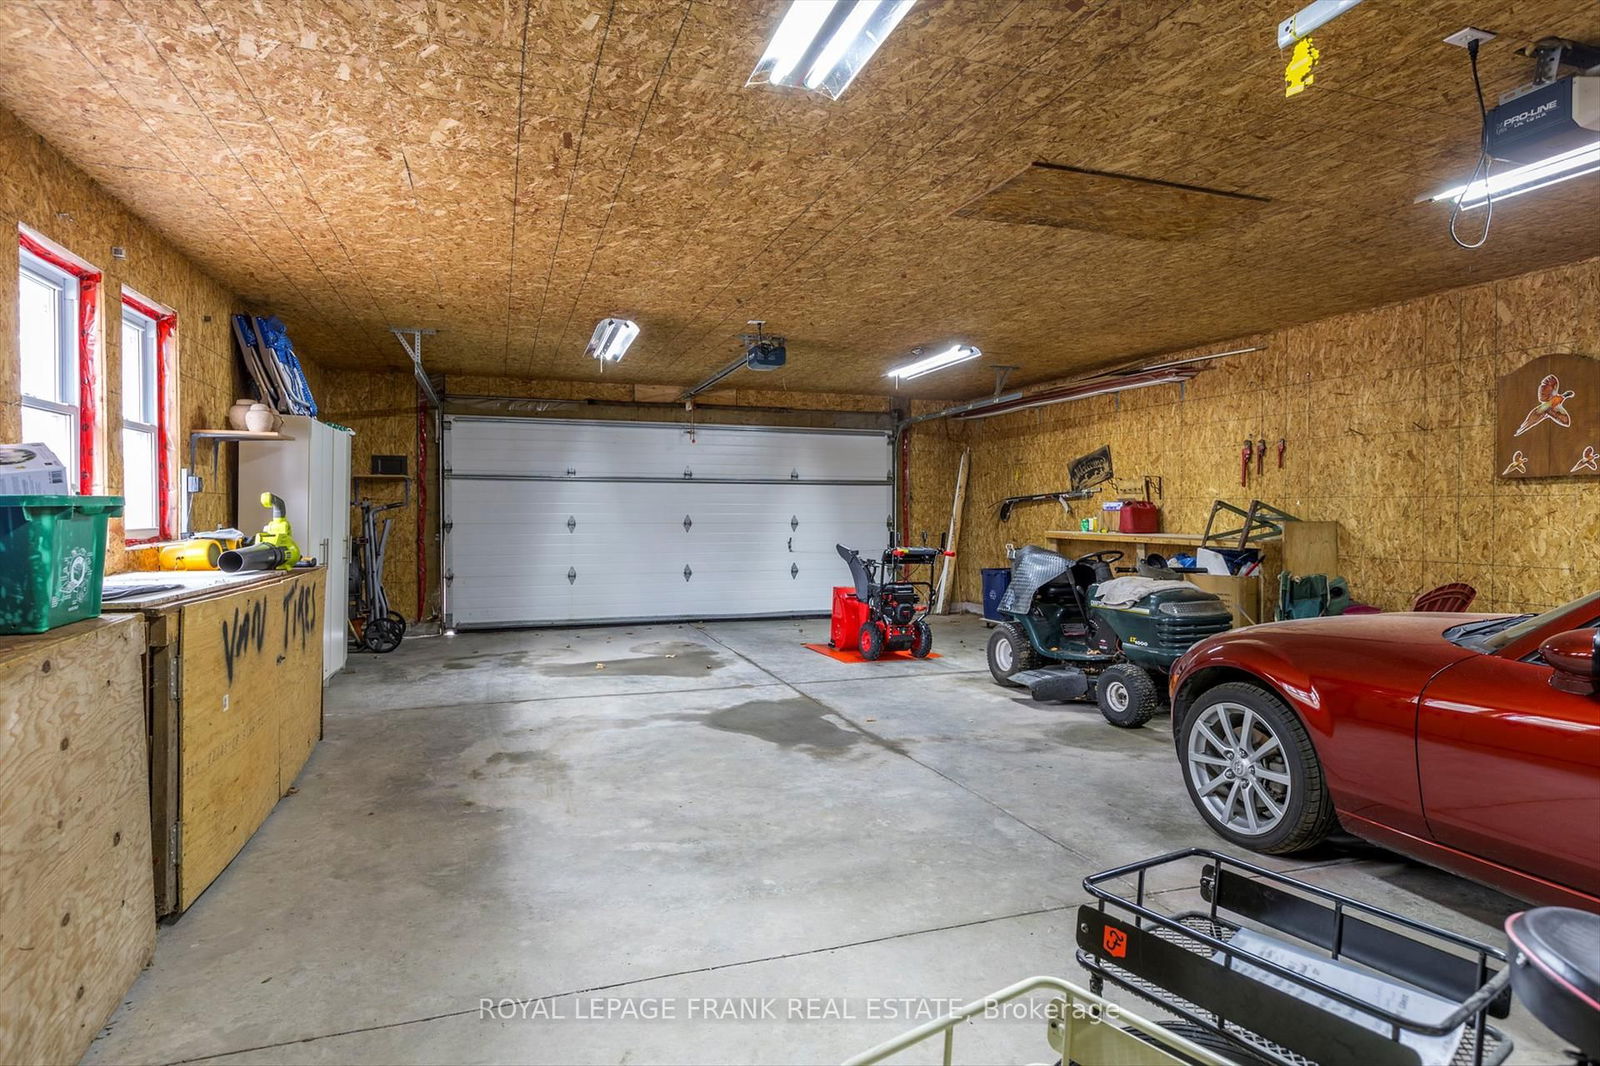
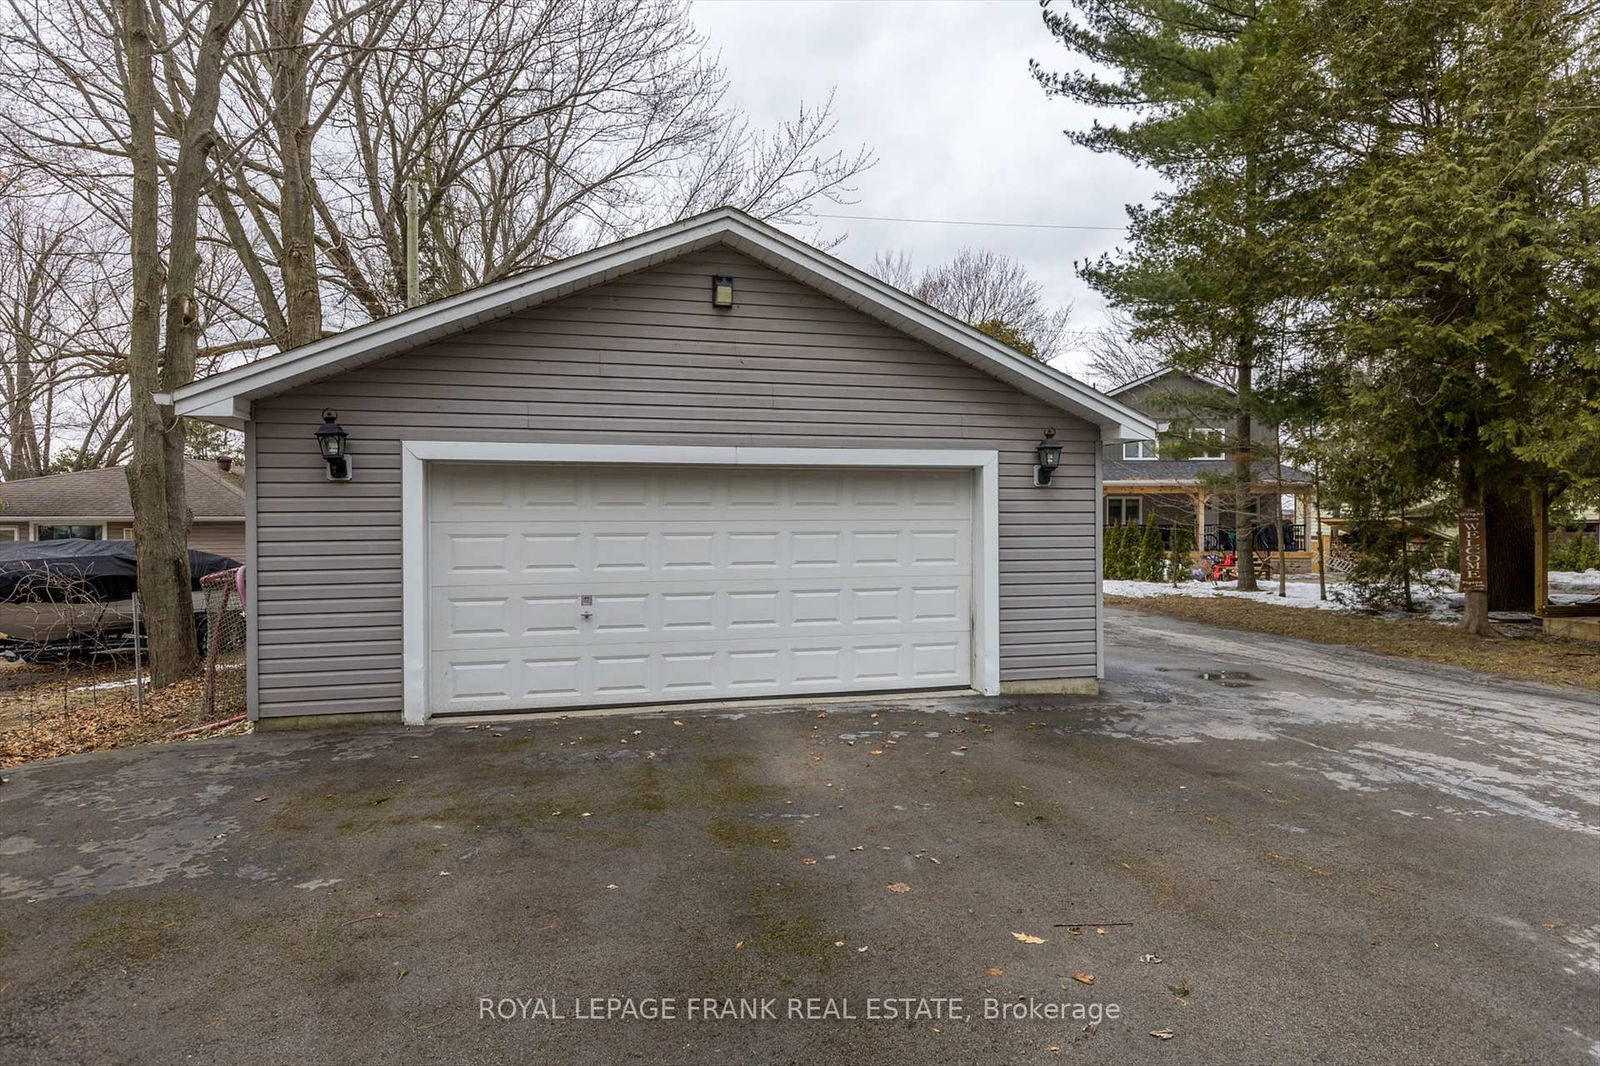
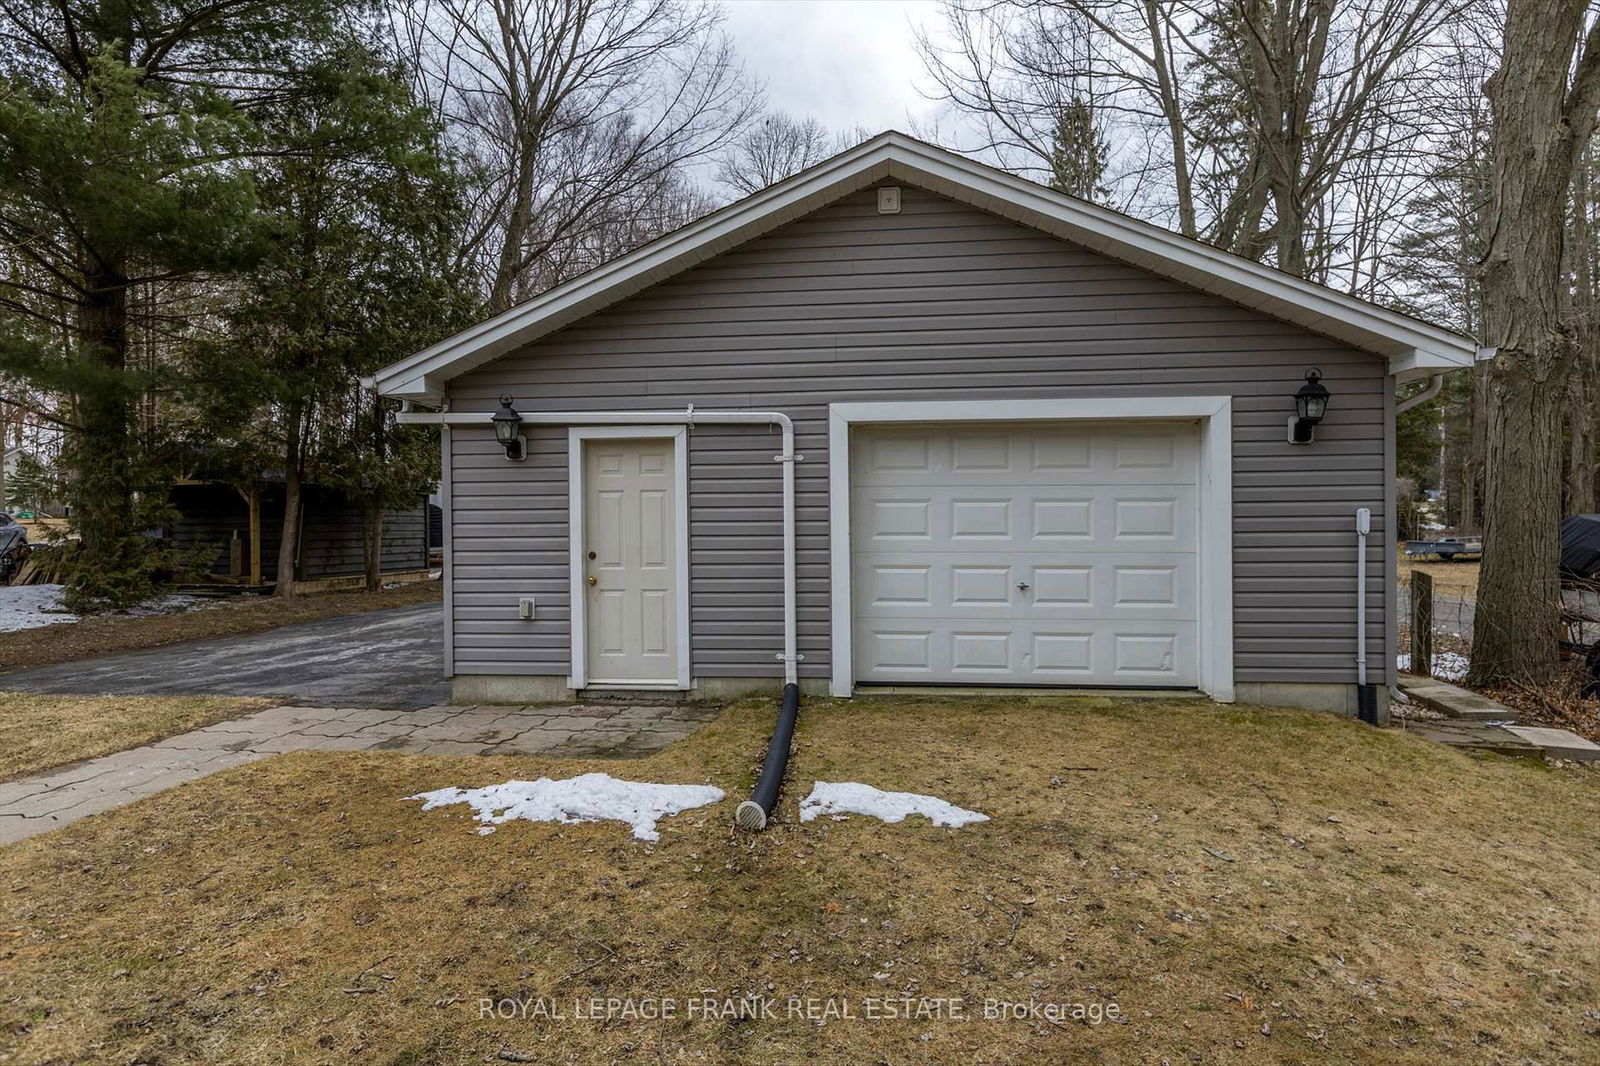
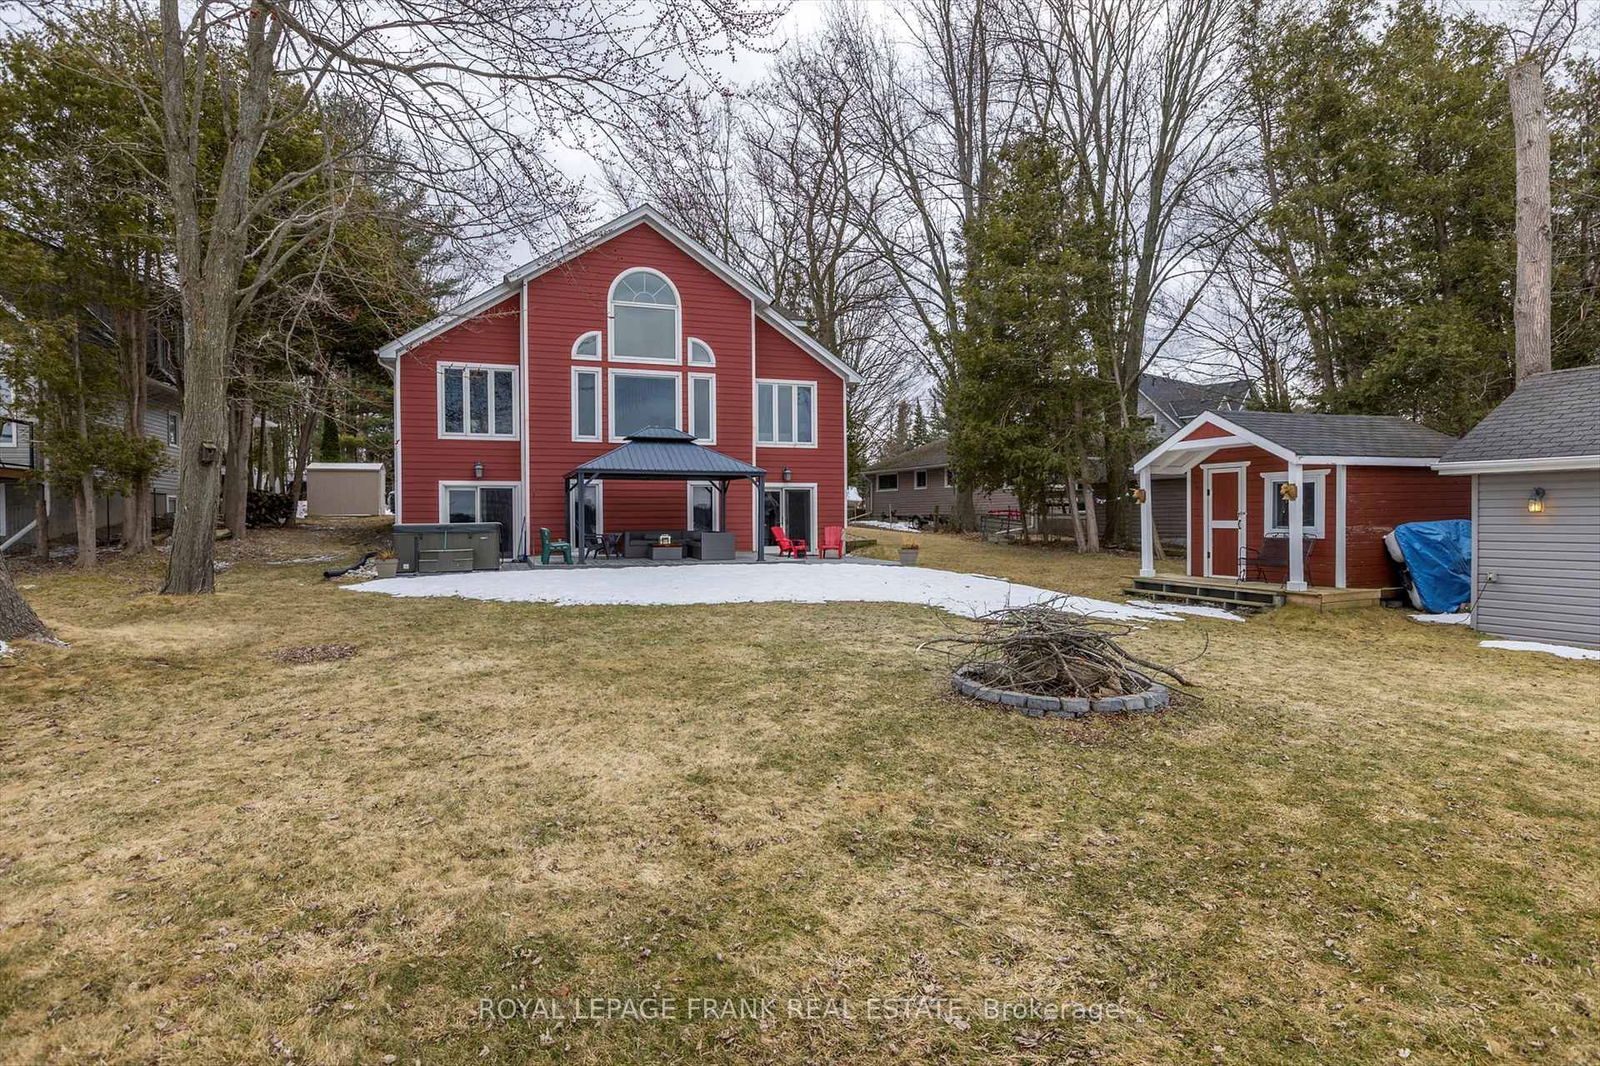
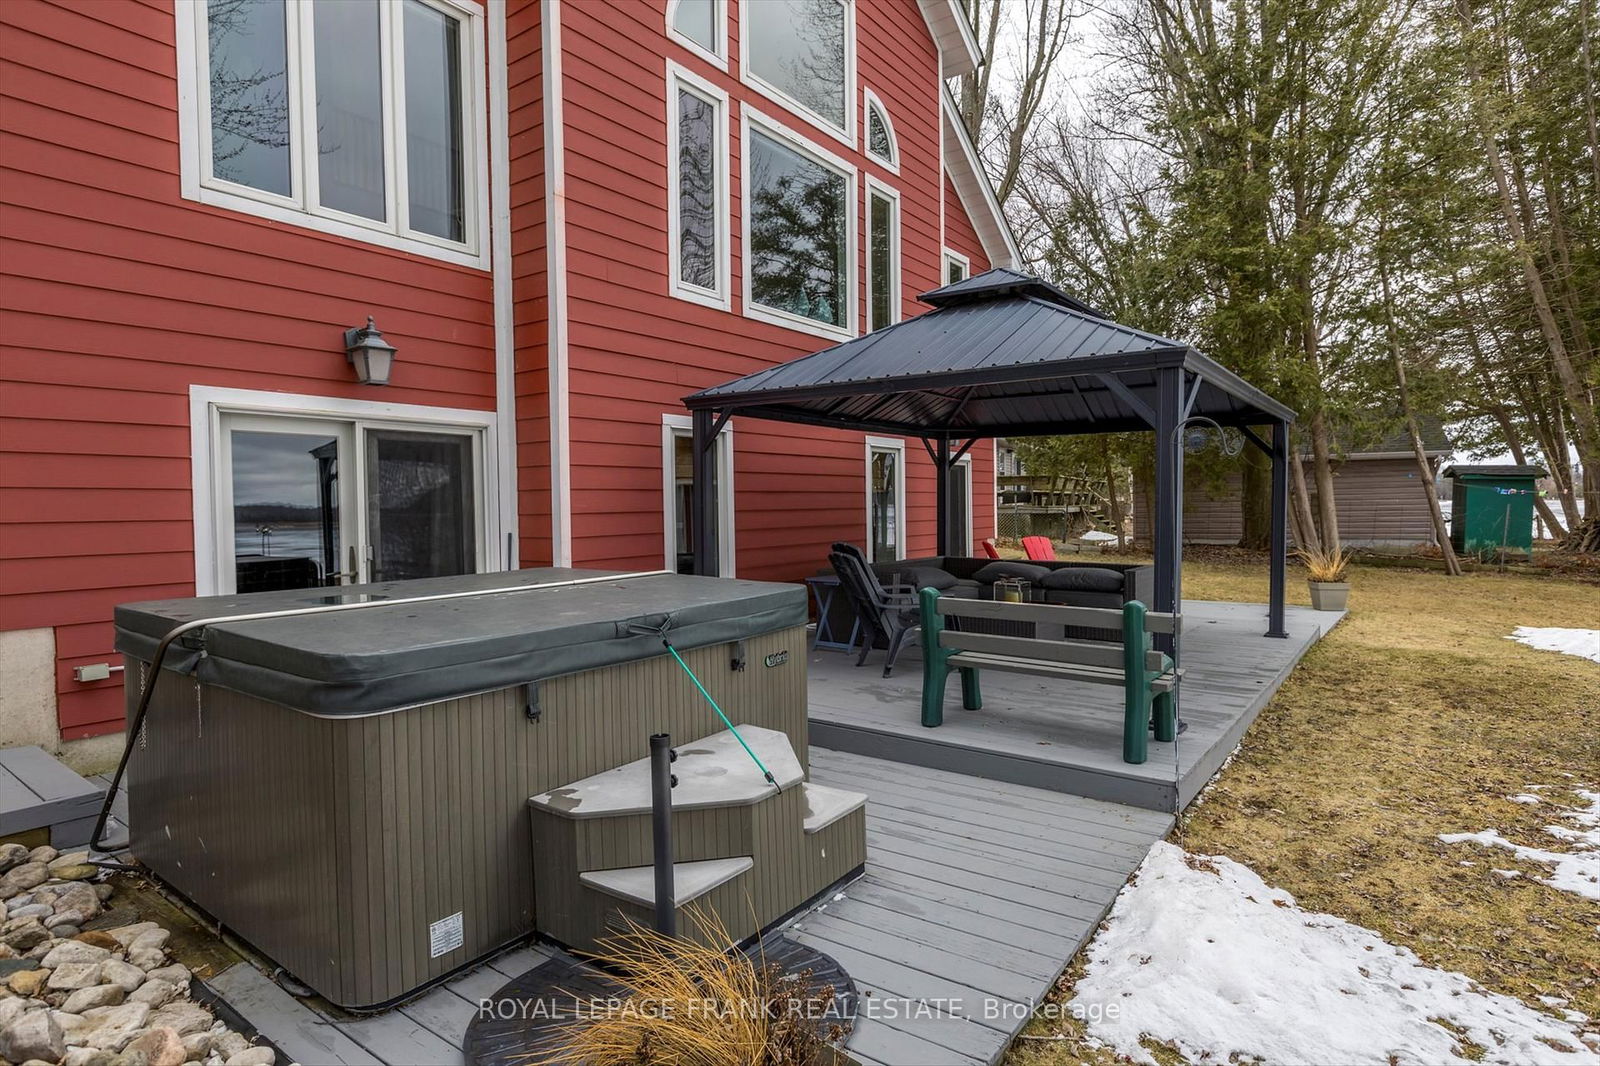
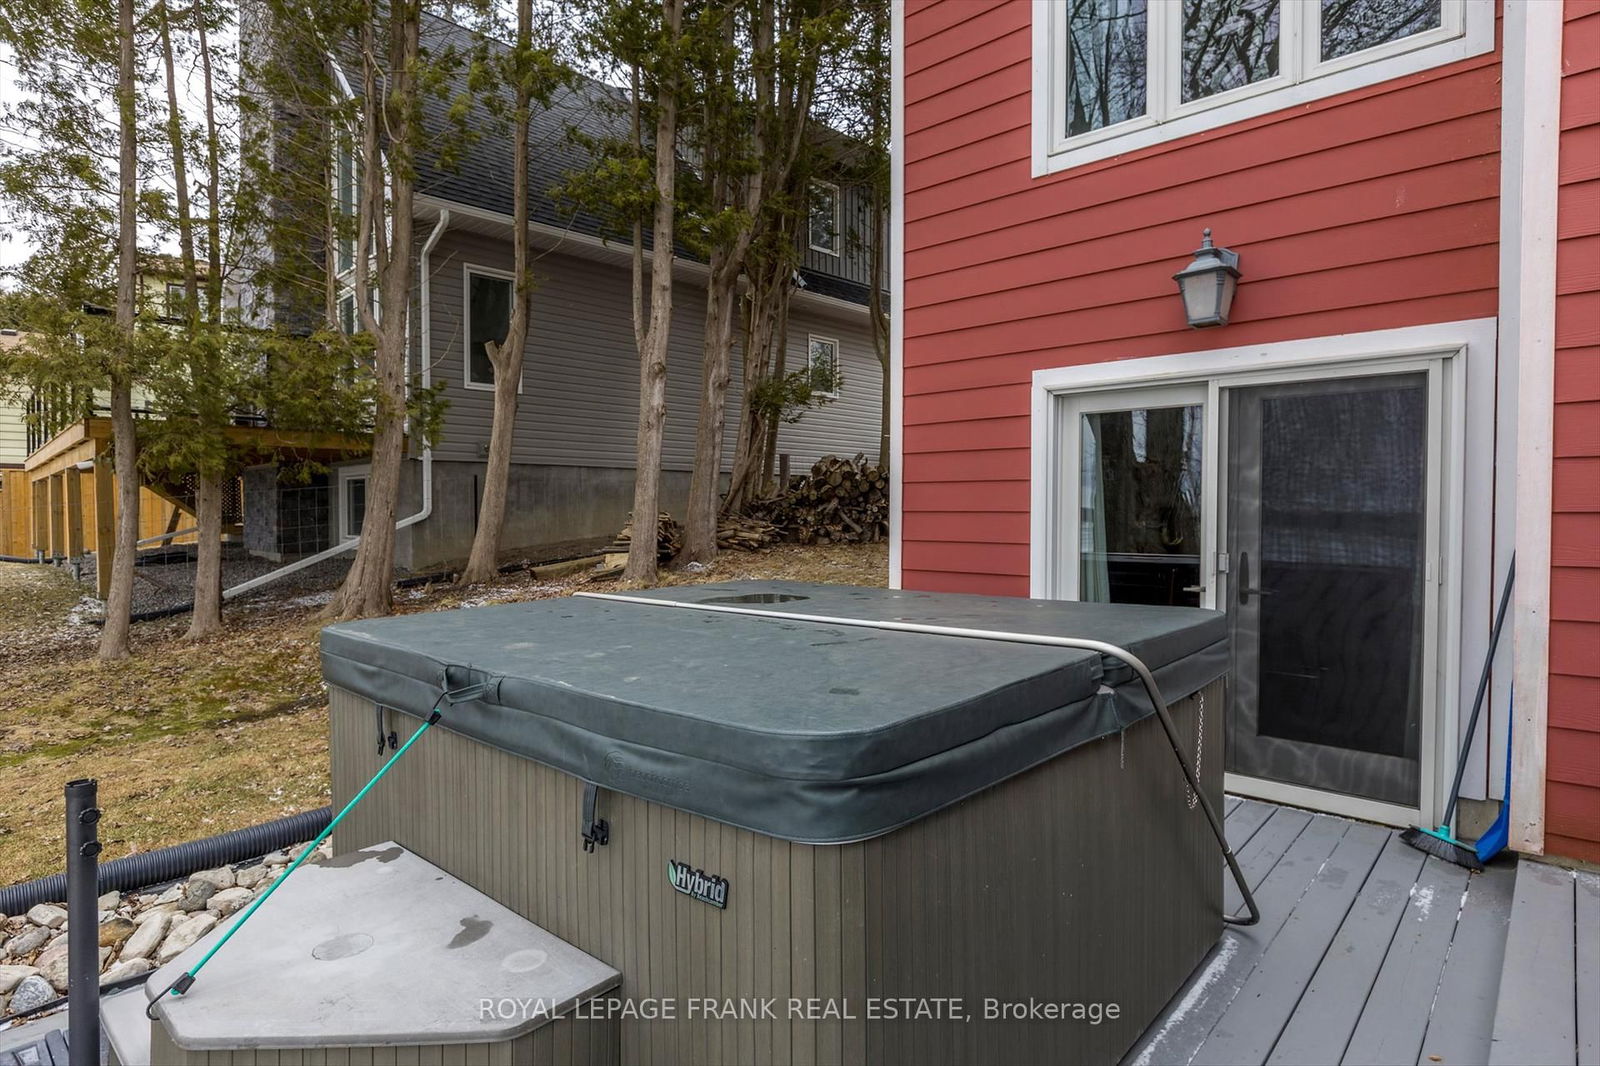
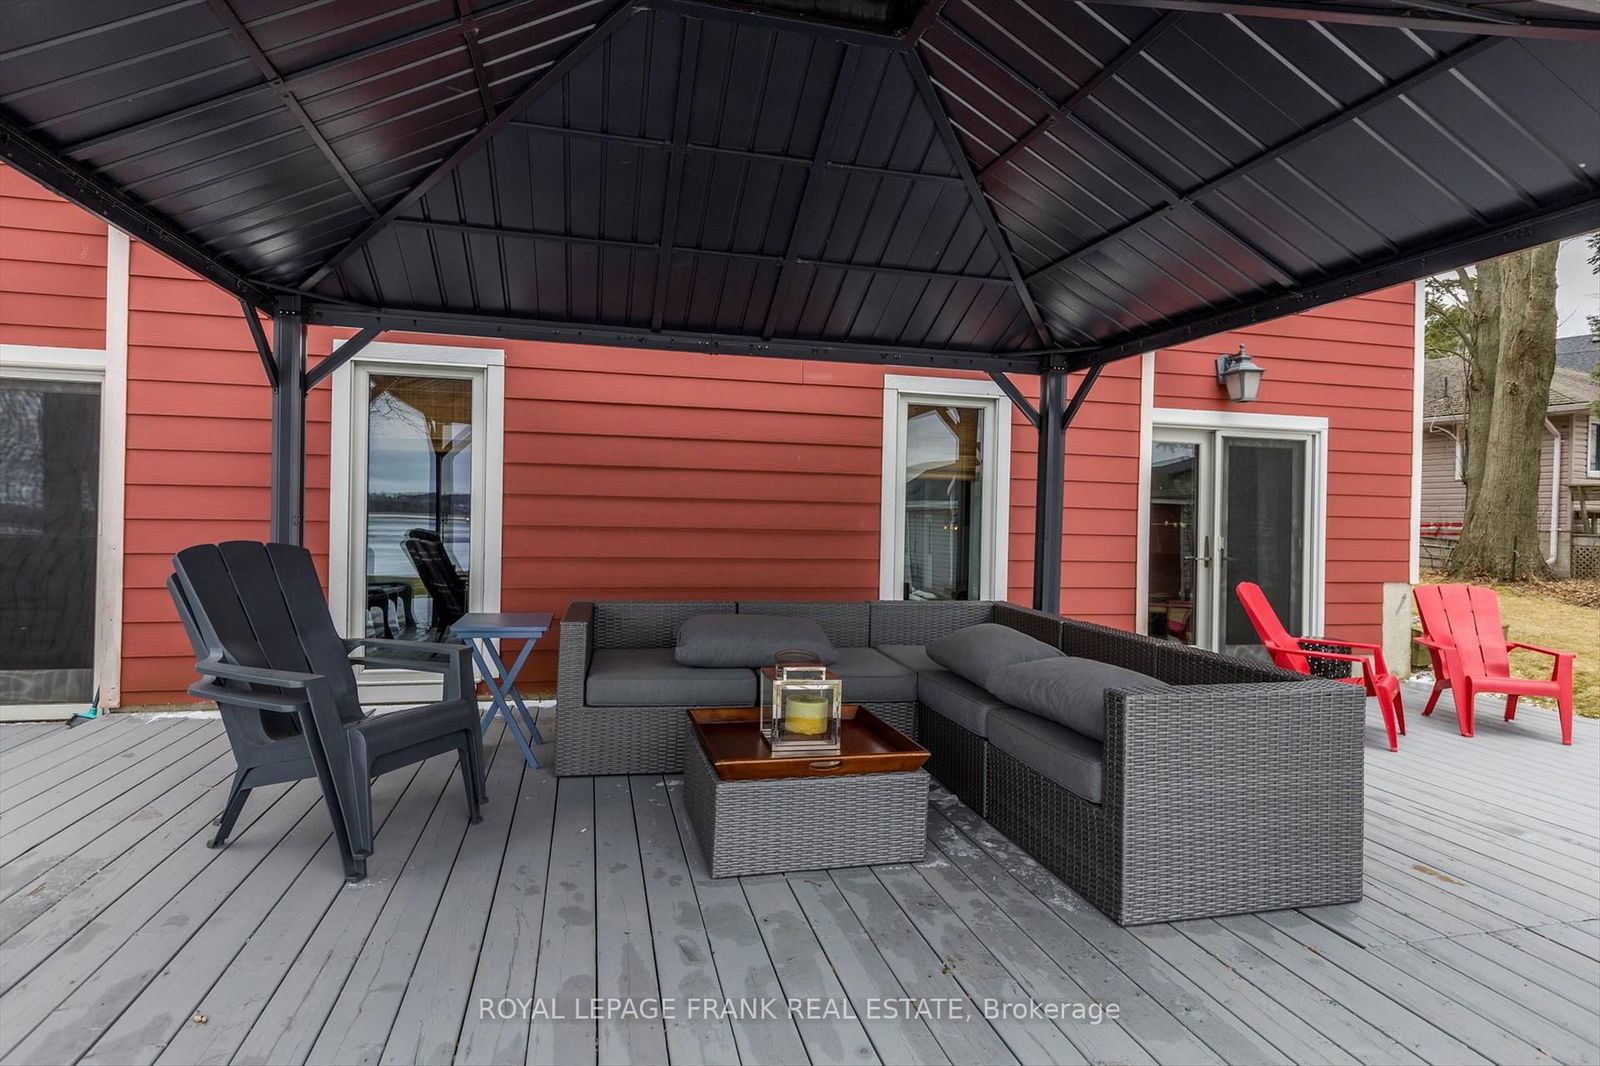
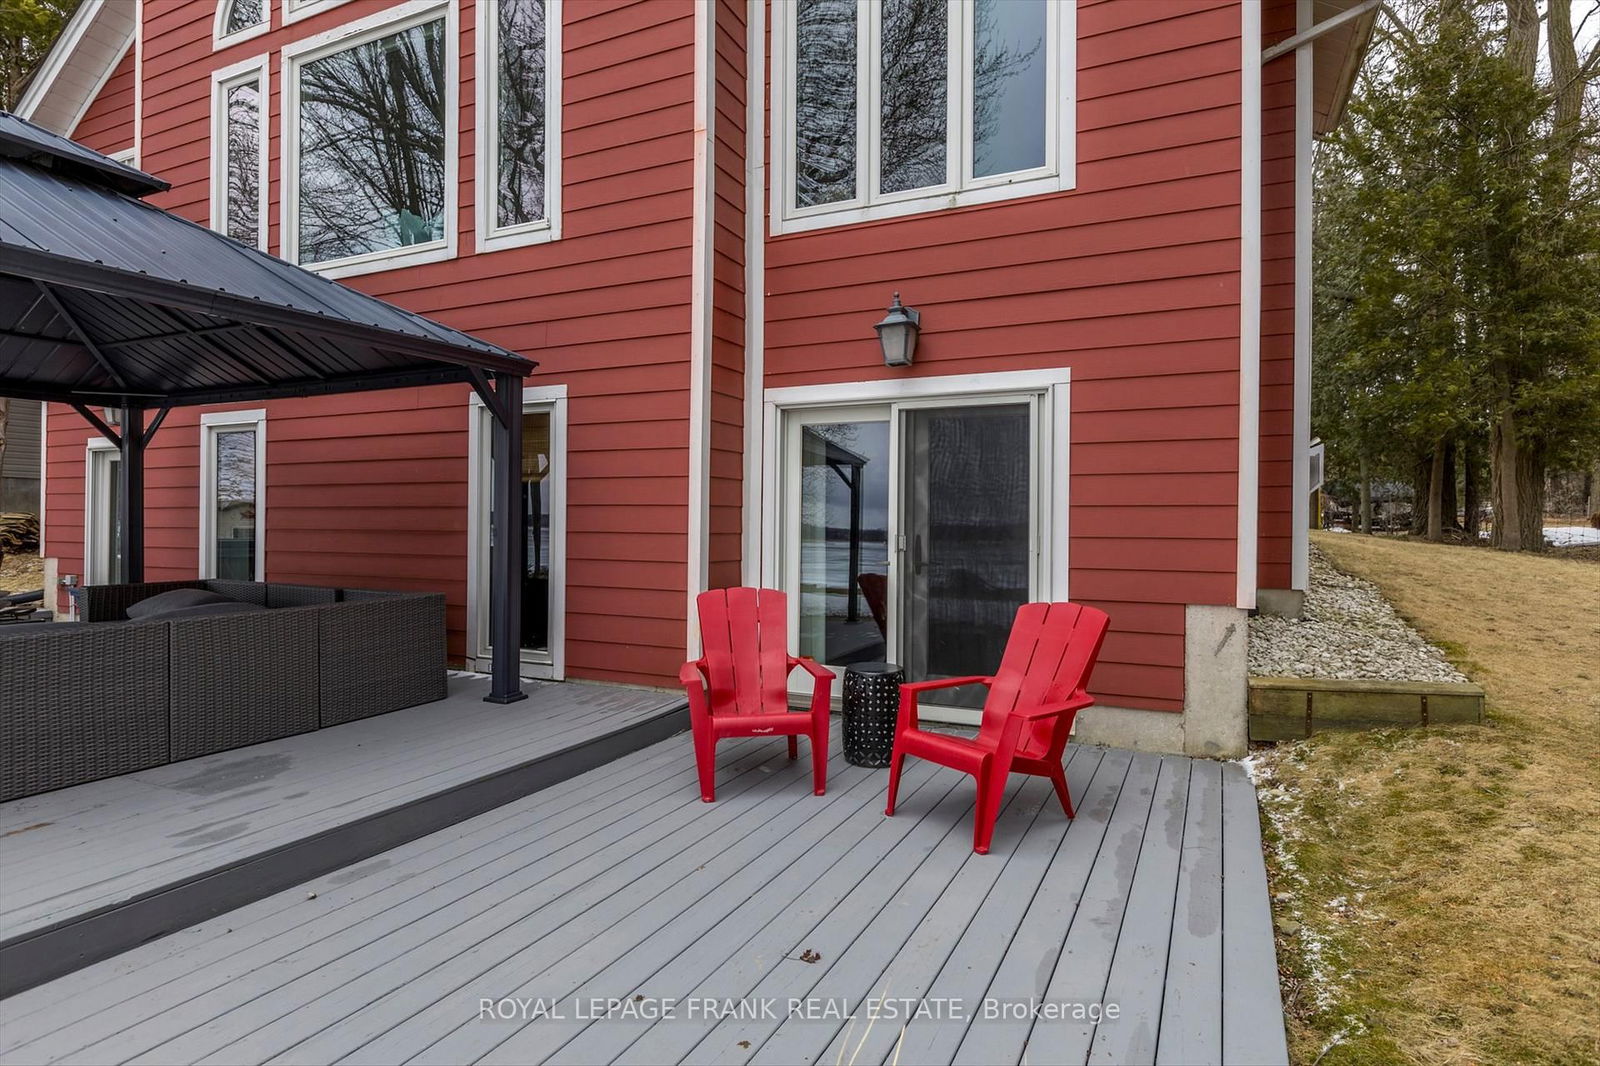
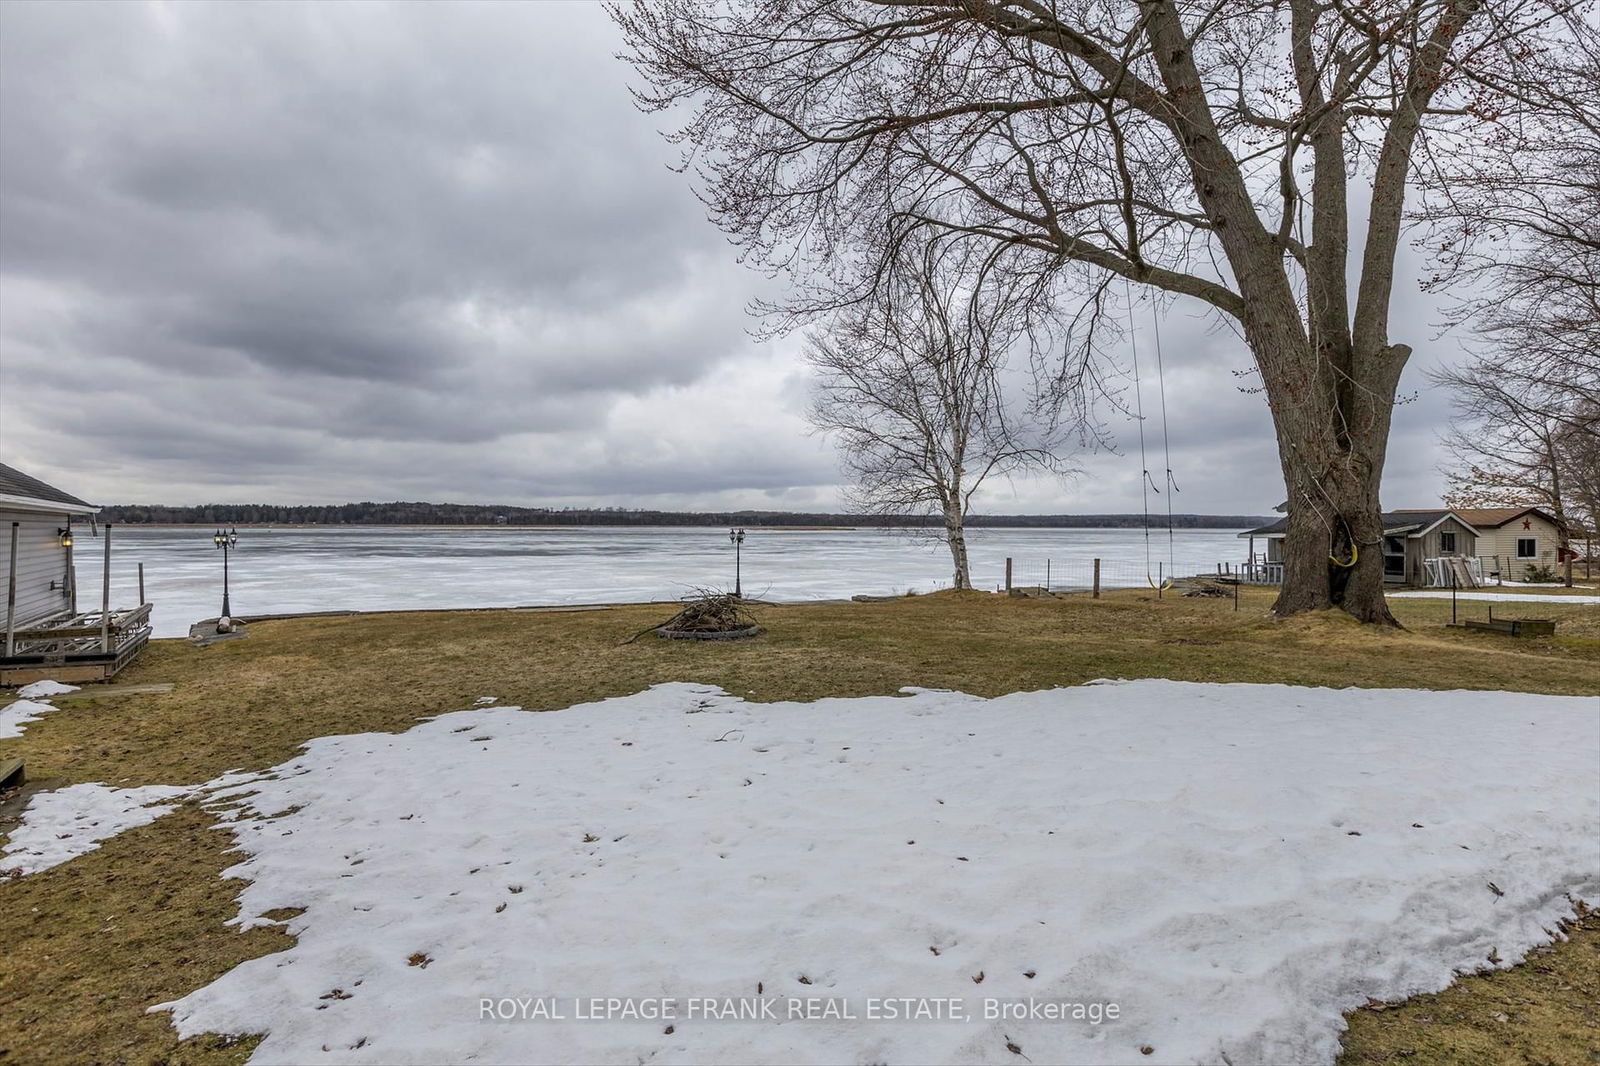
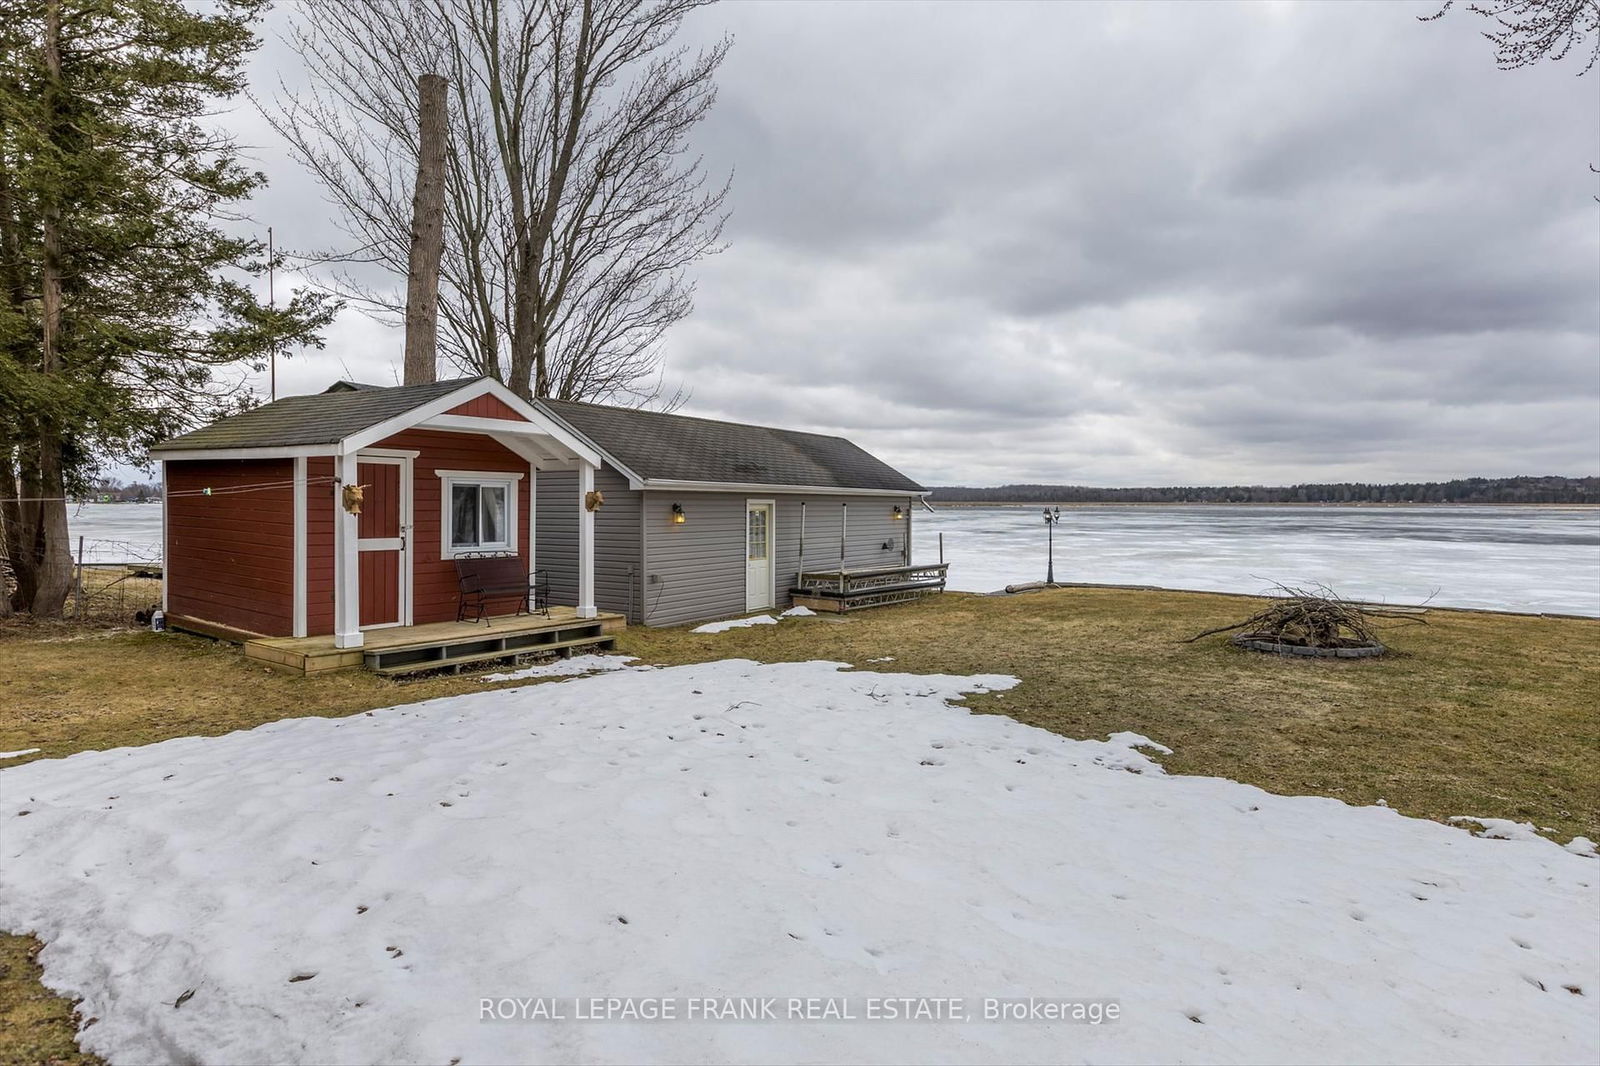
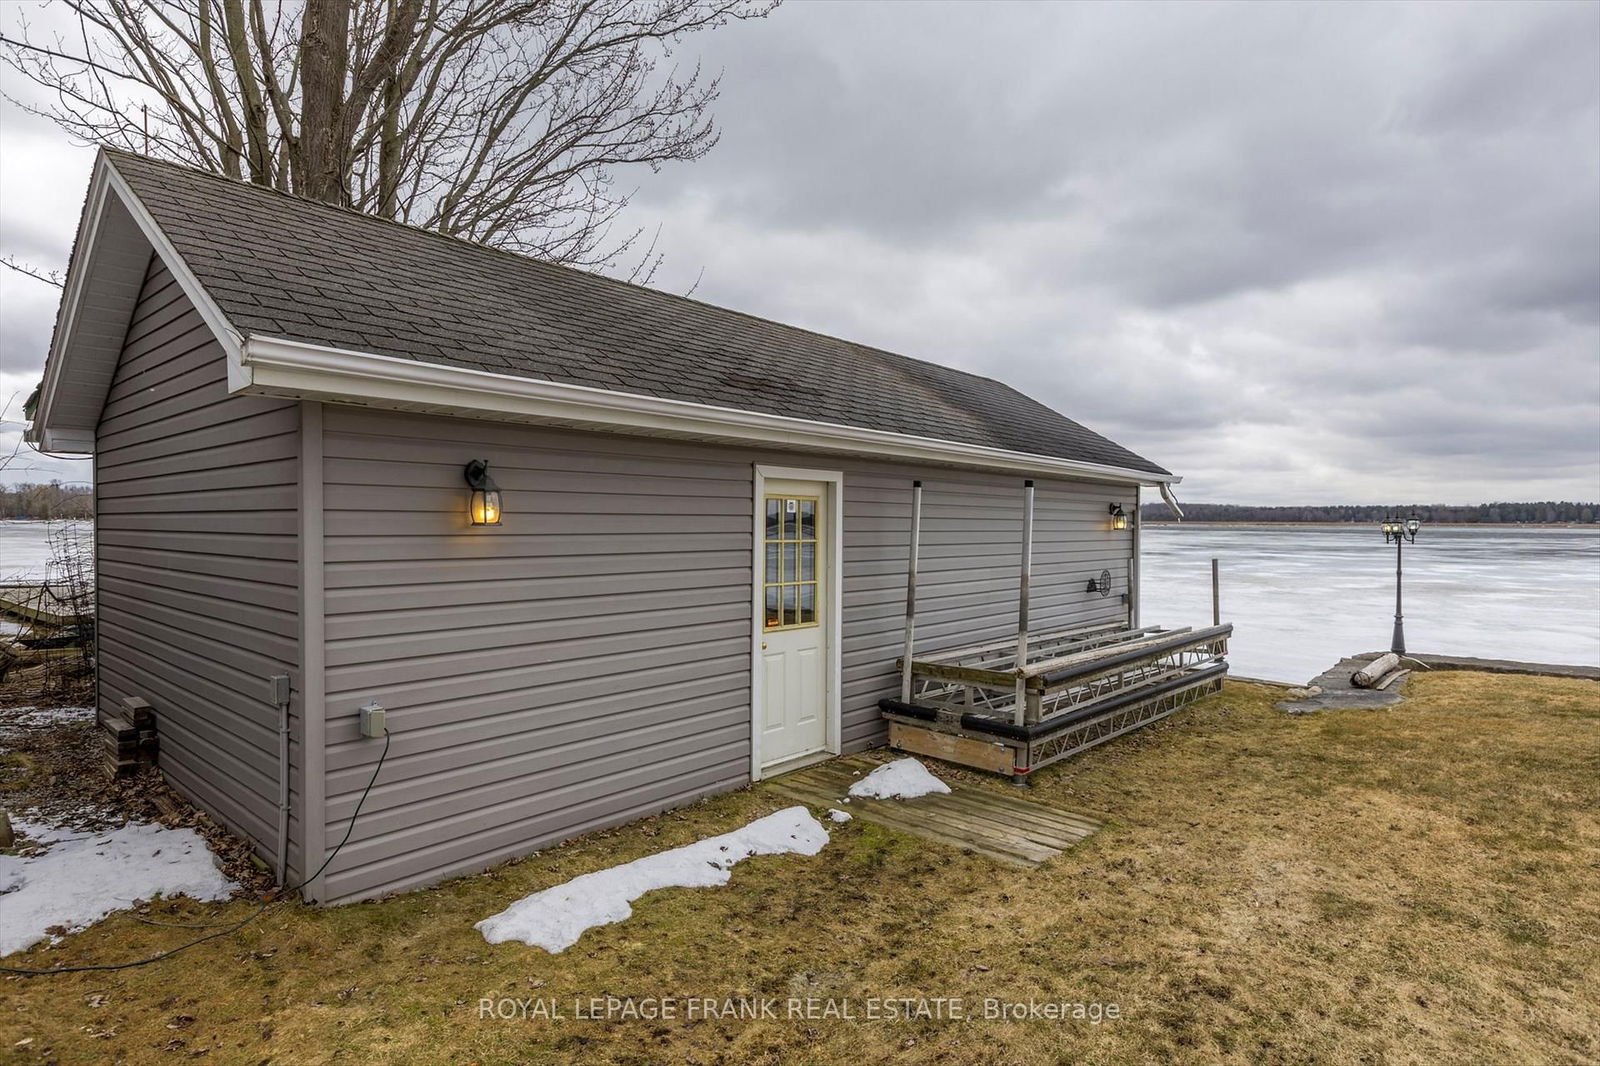
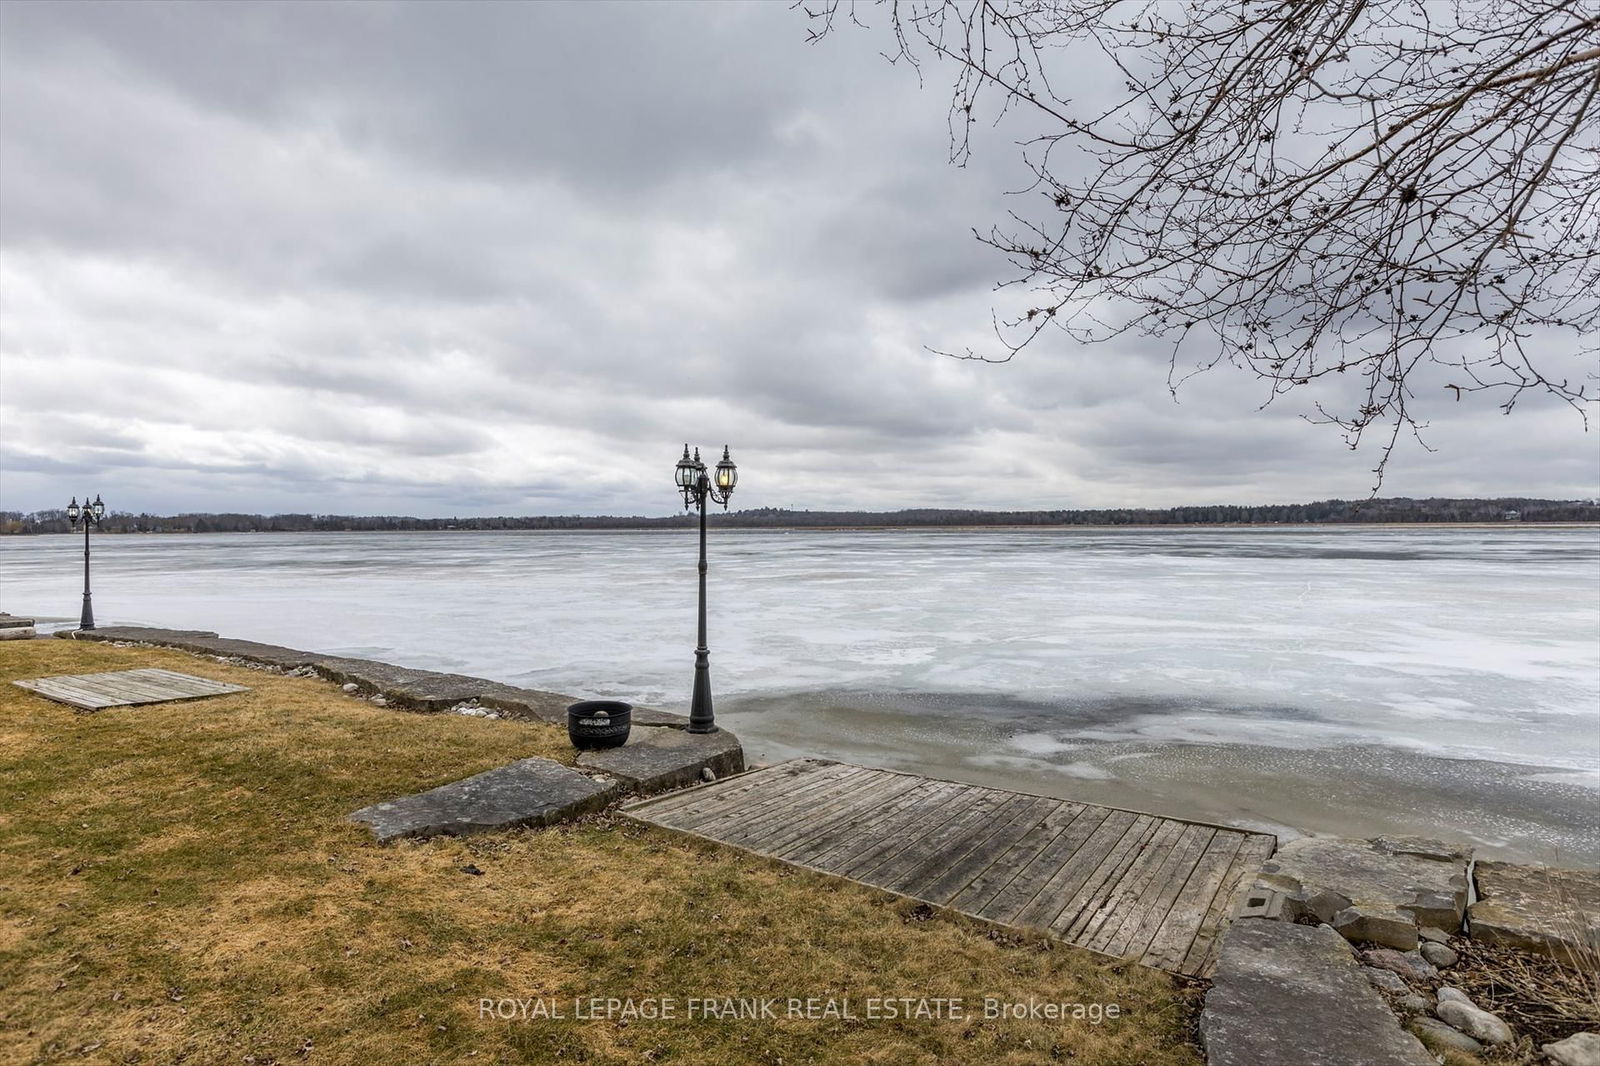
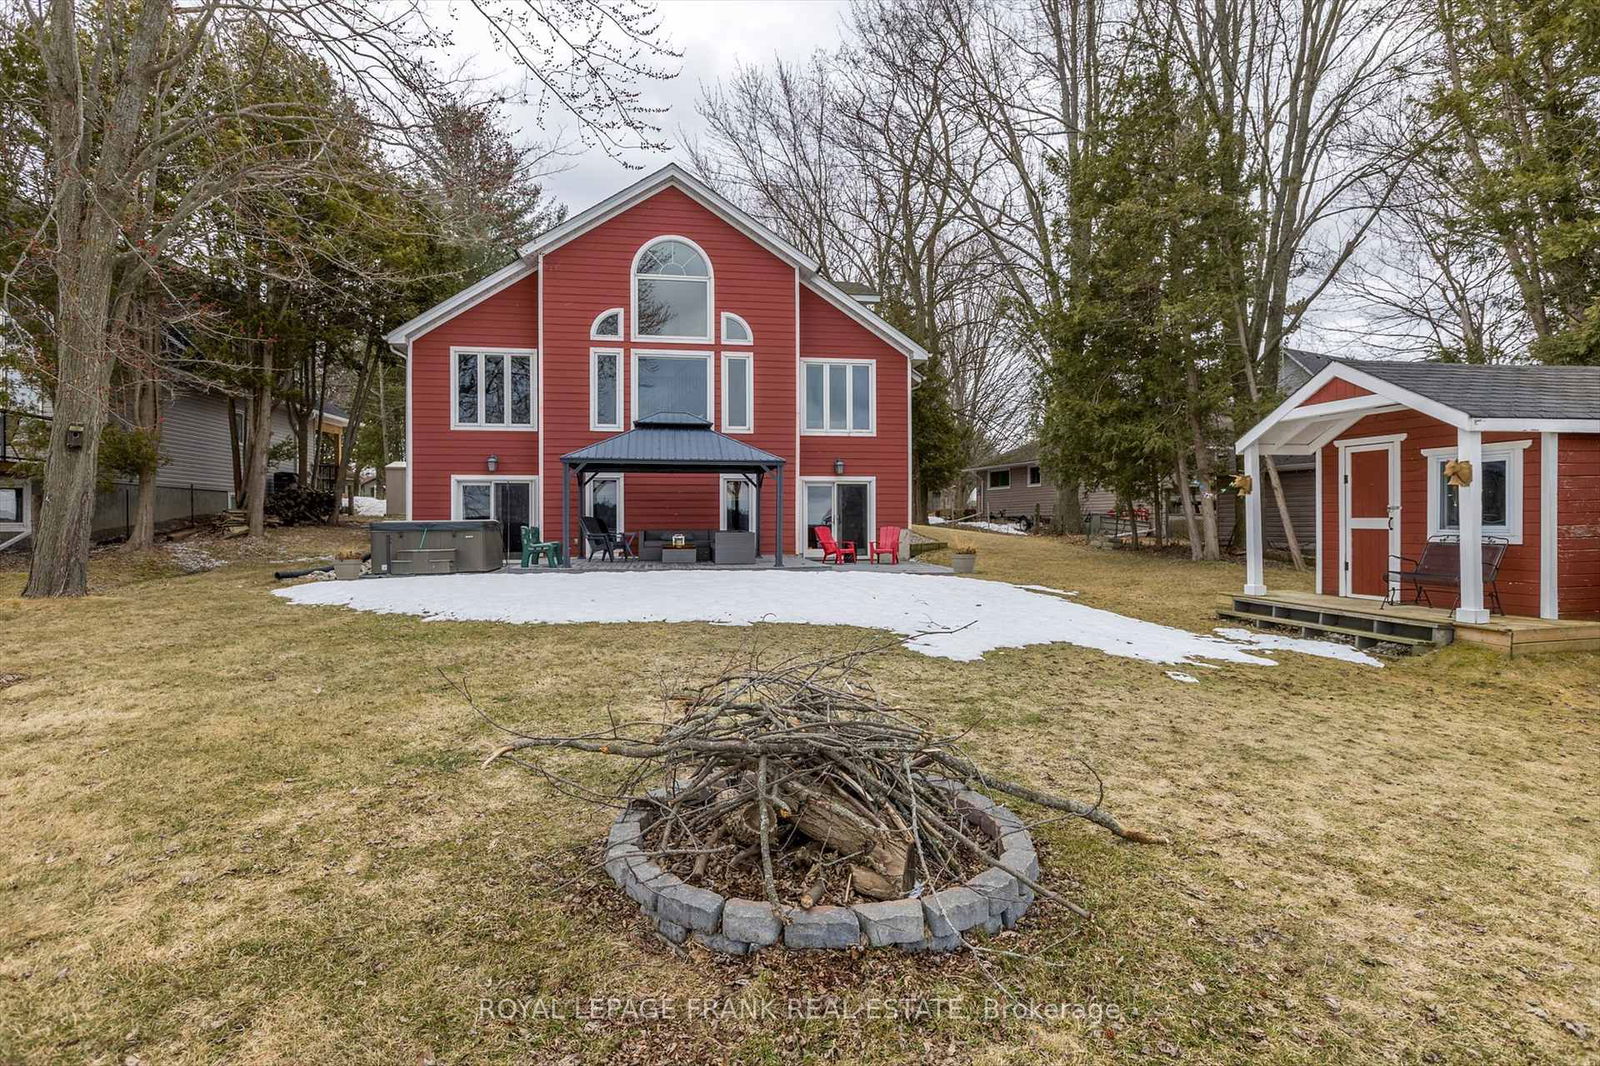
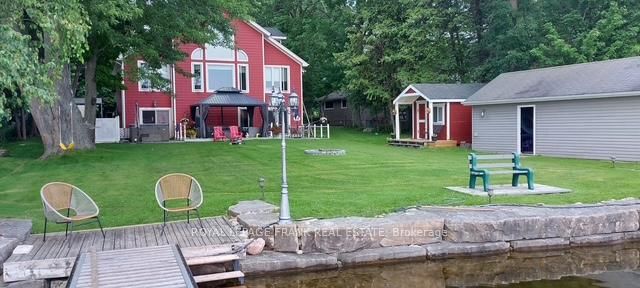
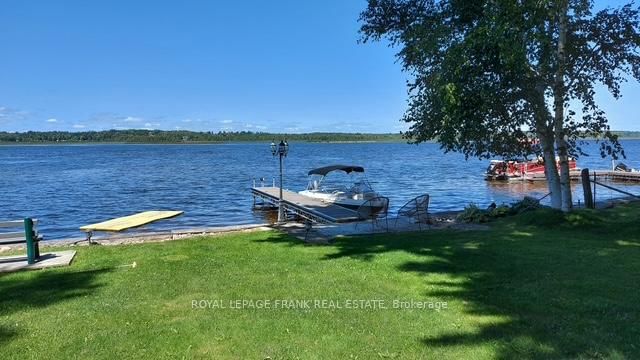
Live on the shore of Pigeon Lake on the Trent Severn Waterway, in this gorgeous 3 bedroom, 3 bath home with many updates. Only 15 minutes to town for any and all amenities, but exquisite privacy on the lake. Jump in the boat and head to the sand bar minutes away, or travel over 350kms of the Trent Severn from your private dock. Open concept living dining with newer granite countertops in the spacious kitchen with island. Huge floor to ceiling windows lakeside, flooding the living space with natural light. Primary bedroom with walk-in closet and three piece ensuite in the second floor loft. Main floor bedroom and newer 3 pc bath, nice bright welcoming foyer, hardwood floors on main and second floor. Downstairs, a lovely family room with gas fireplace, a wall of windows to the lake and a spacious wet bar. Third bedroom, third 3 pc bath, laundry room, and utility room round out this lovely home. High end construction with Hardie board siding and energy efficient windows and doors. Forced air natural gas furnace and fireplace and natural gas hookup for your bbq. Waterside, a lovely armourstone shoreline, both sandy and natural shoreline, boathouse with marine rail and adorable bunkie - a great spot for the kids. The waterfront gazebo is a fabulous place to enjoy the west facing views - sunsets to die for! Or relax in the hot tub to soak away the city. The driveway is paved and room for many cars, the detached garage has room for four cars. A welcoming neighbourhood offering the best of both worlds, a sense of community and privacy.
Fridge, Stove, Dishwasher, Washer, Dryer, Light Fixtures, Window Coverings, Dock, Marine Rail, Paddleboat, Garage Door Opener, Gazebo, Hot Tub & Accessories
Living
Dining
Kitchen
Br
Bathroom
Primary
Bathroom
Rec
Br
Bathroom
Laundry
Cold/Cant
Utility
The graph below compares the average list price and average sale price of homes in this neighborhood by month for the last 24 months. When average sale price is greater than average list price, this may suggest a buyer's market. When average sale price is lower than the average list price this may suggest a seller's market.
The graph below illustrates the average days on market for homes in this neighborhood. The yellow area may indicate a buyer's market, the green area may indicate a balanced market and the red area may indicate a seller's market.
Sales Representative, Century 21 People’s Choice Realty Inc., Brokerage
(647) 576 - 2100