Century 21 People’s Choice Realty Inc., Brokerage
120 MATHESON BLVD E #103
MISSISSAUGA, Ontario
L4Z 1X1

Clarence-Rockland, Town of Rockland, K4K 1V7
$584,999$000000
Listed by EXP REALTY.
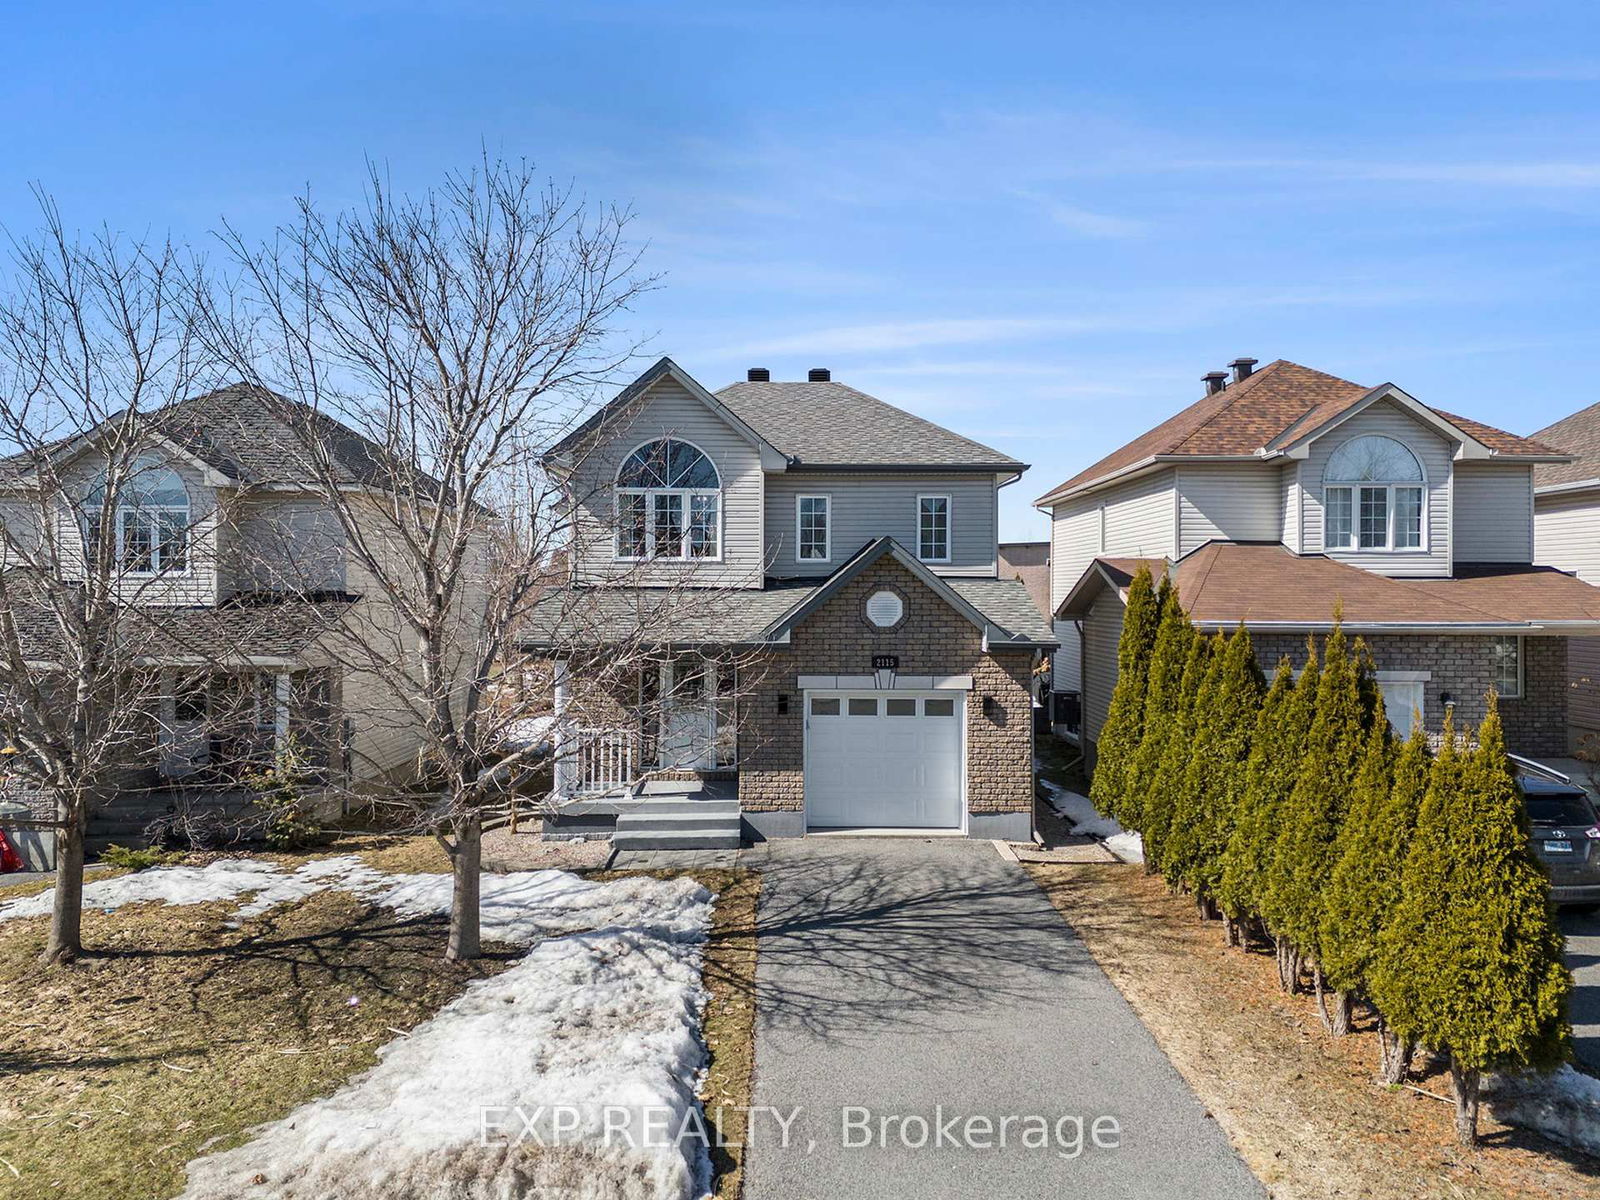
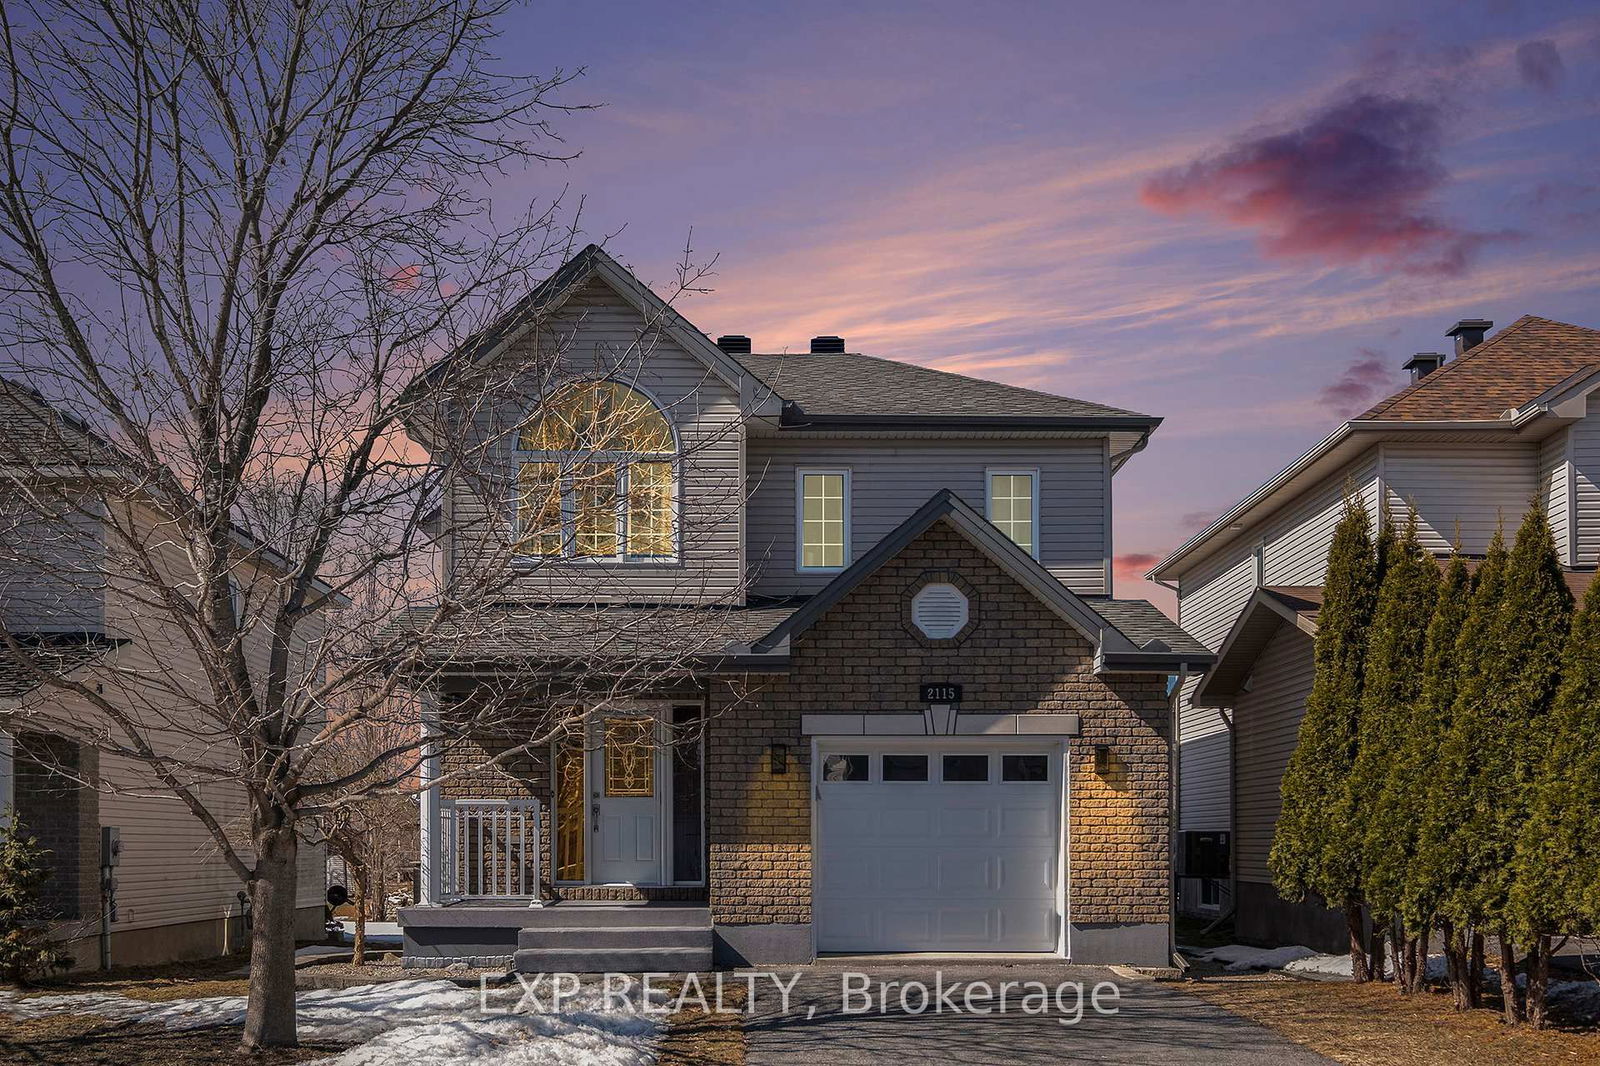
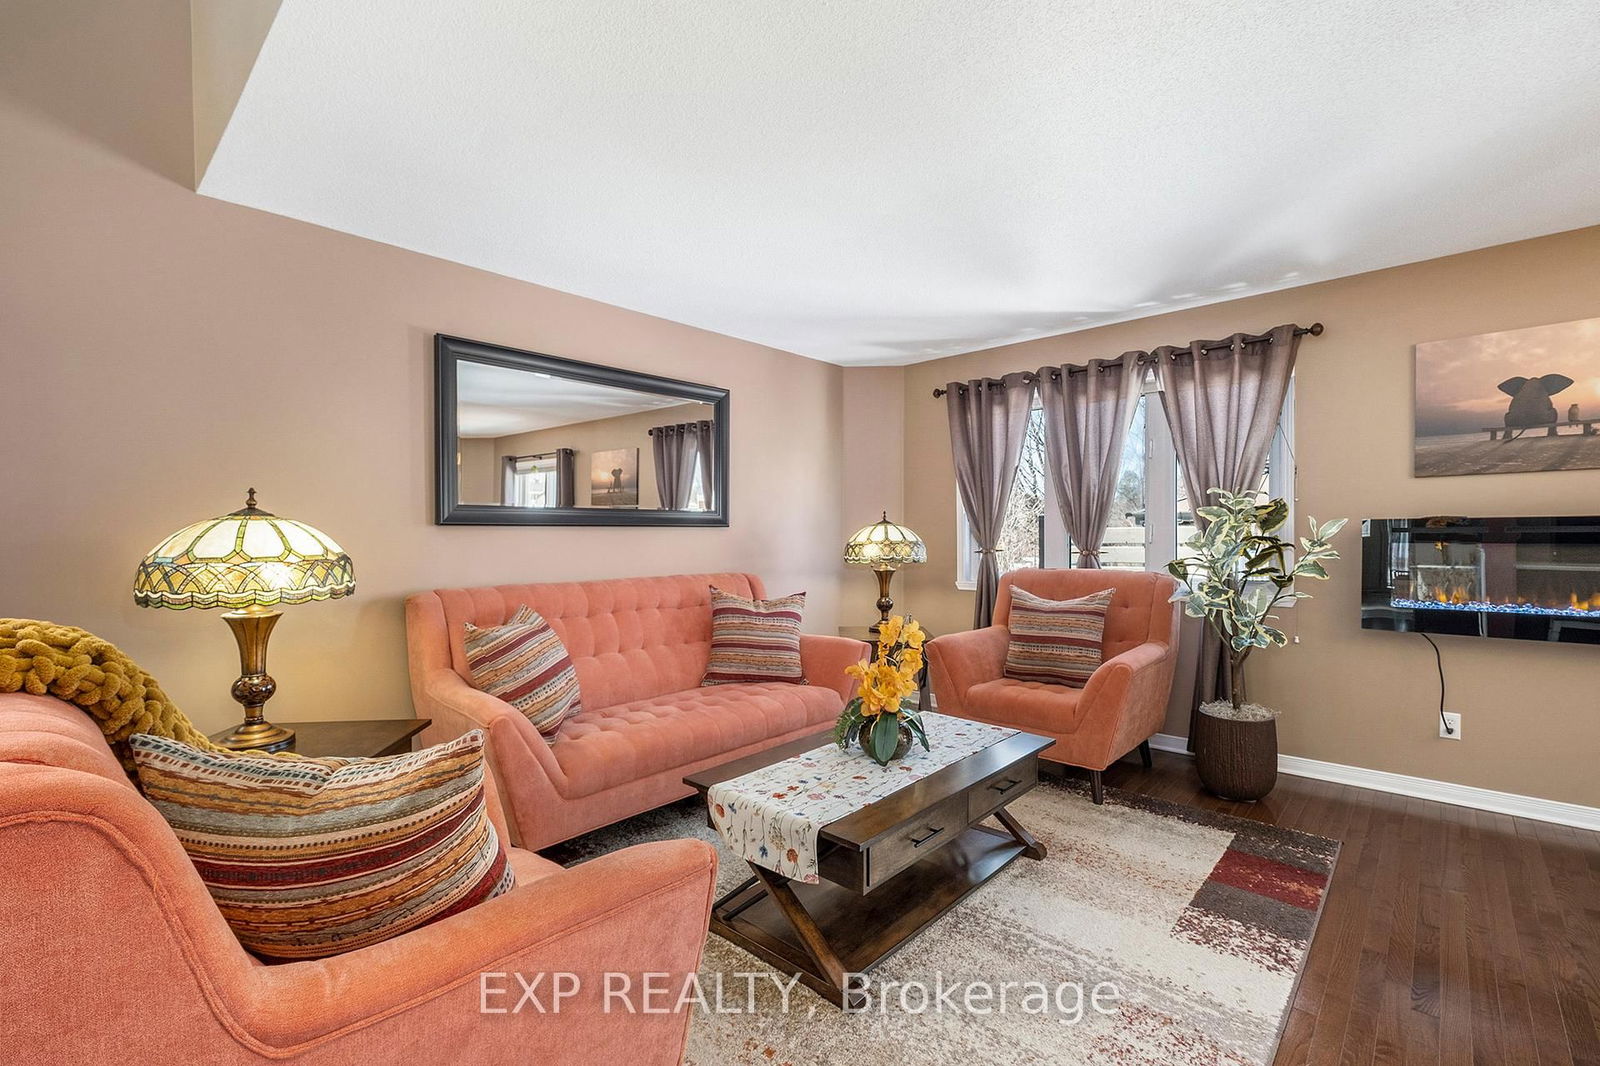
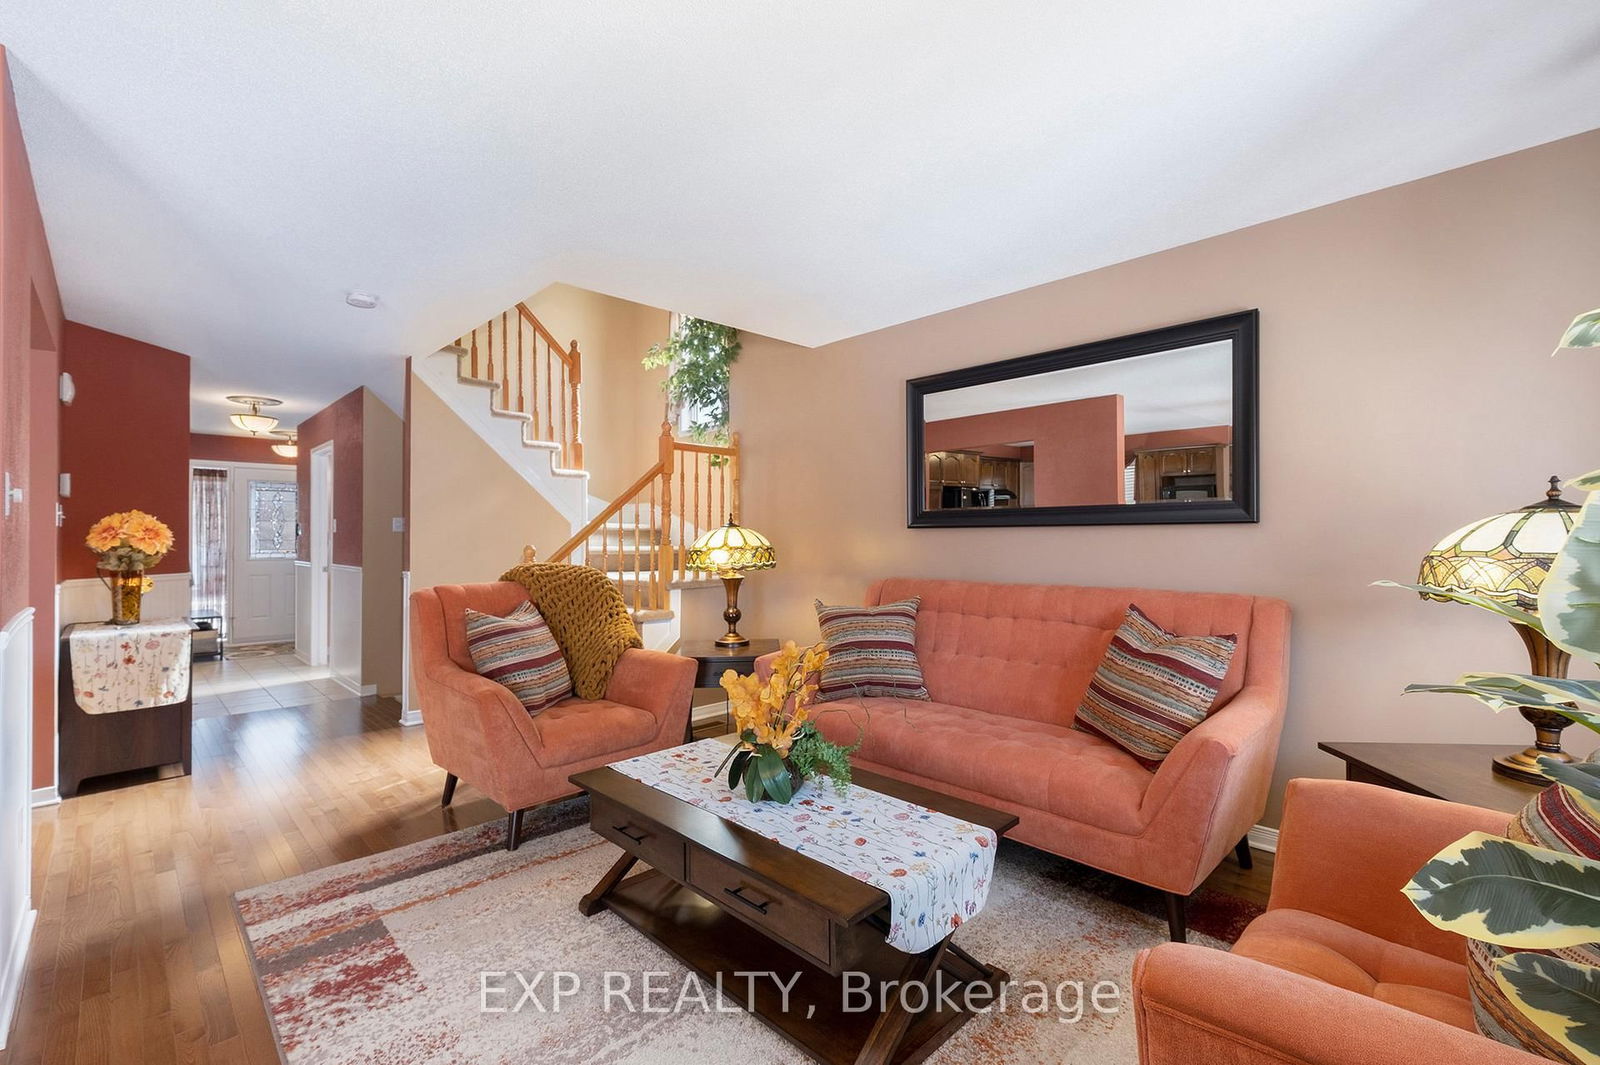
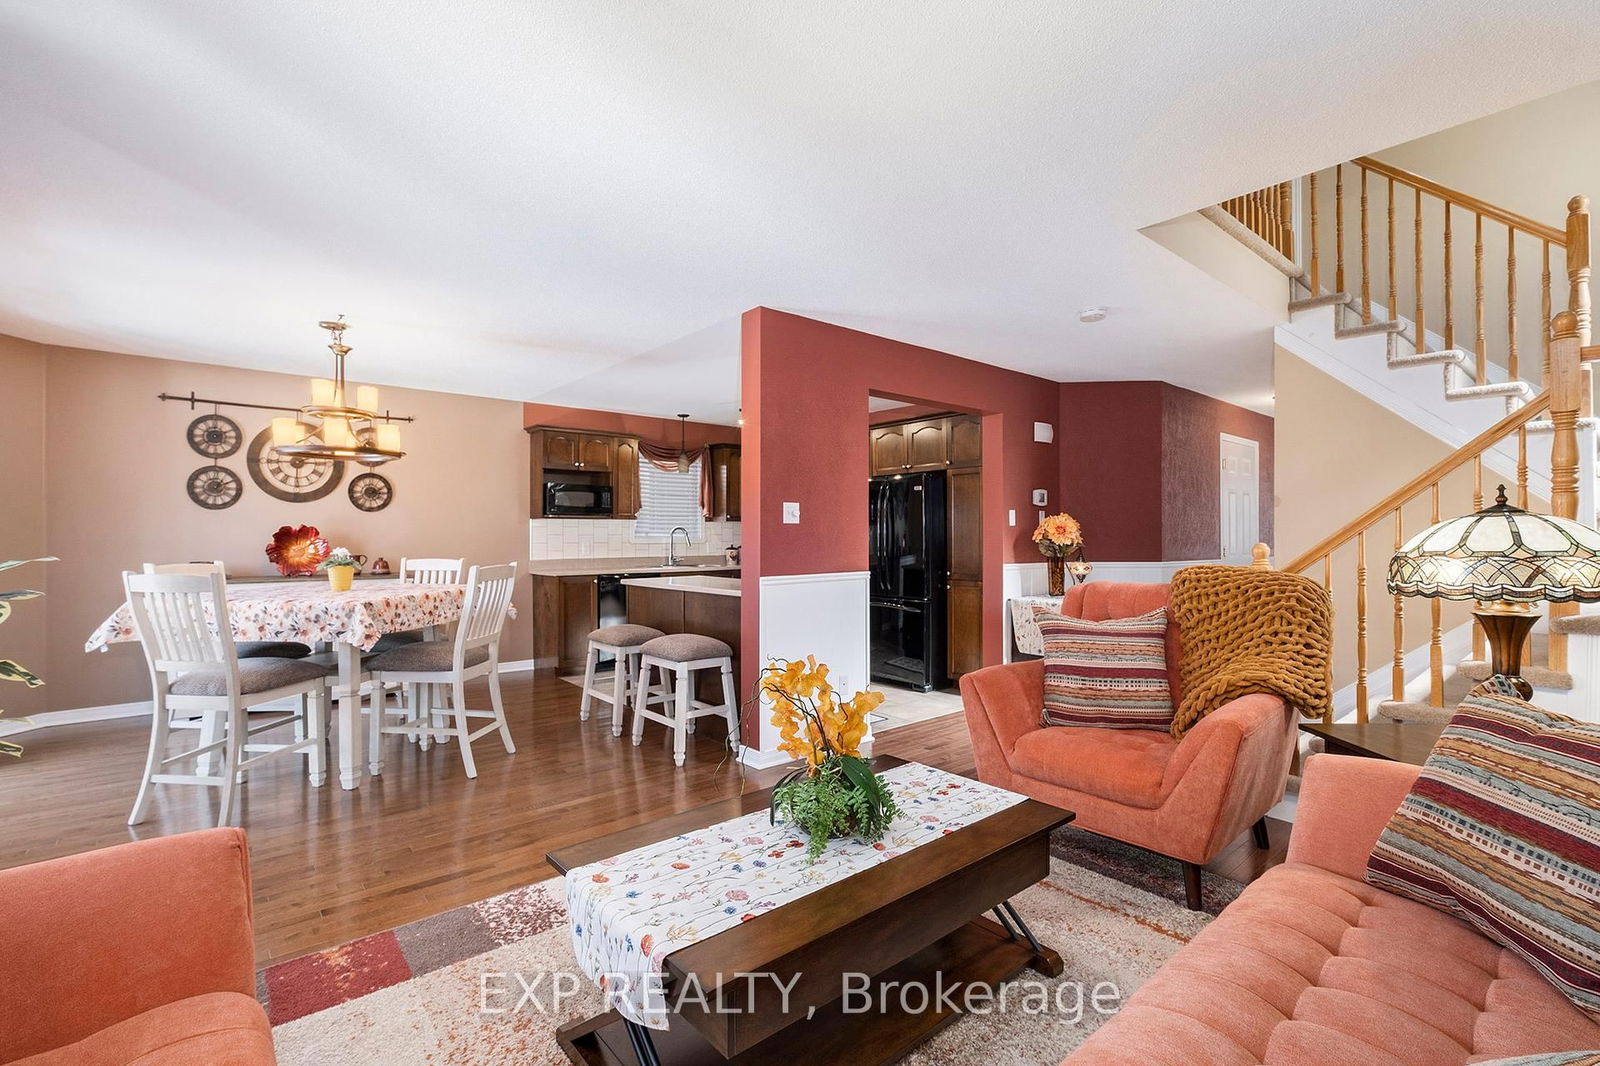
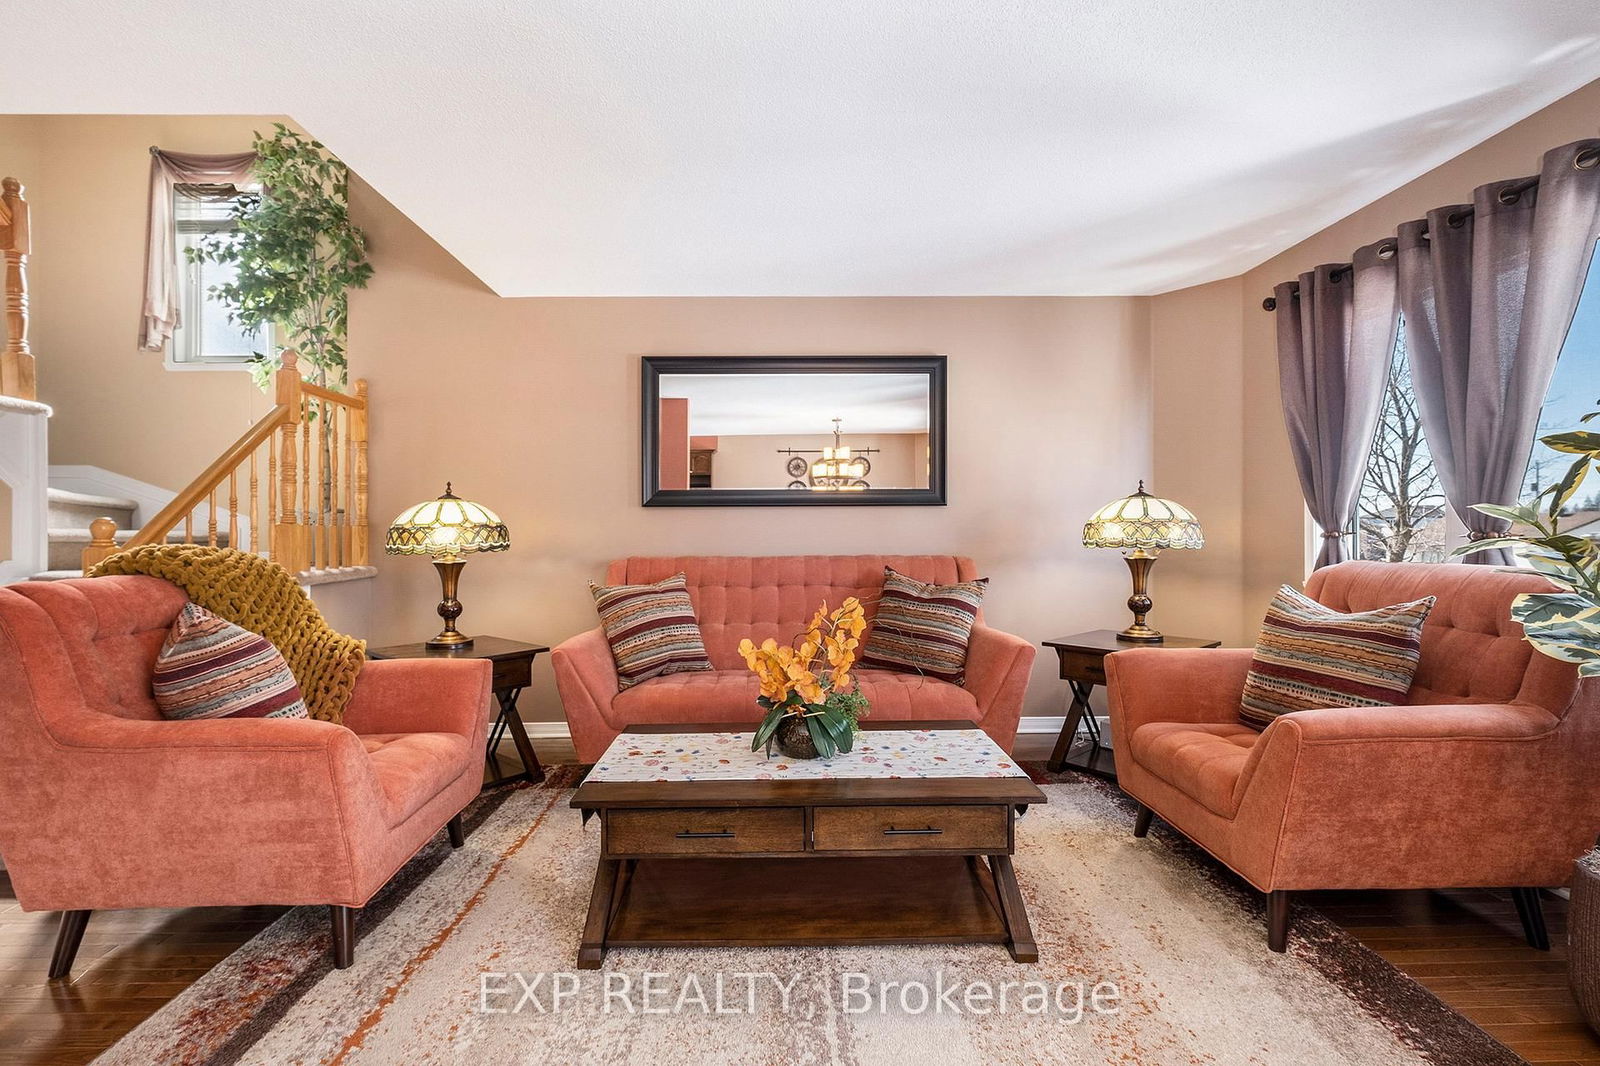
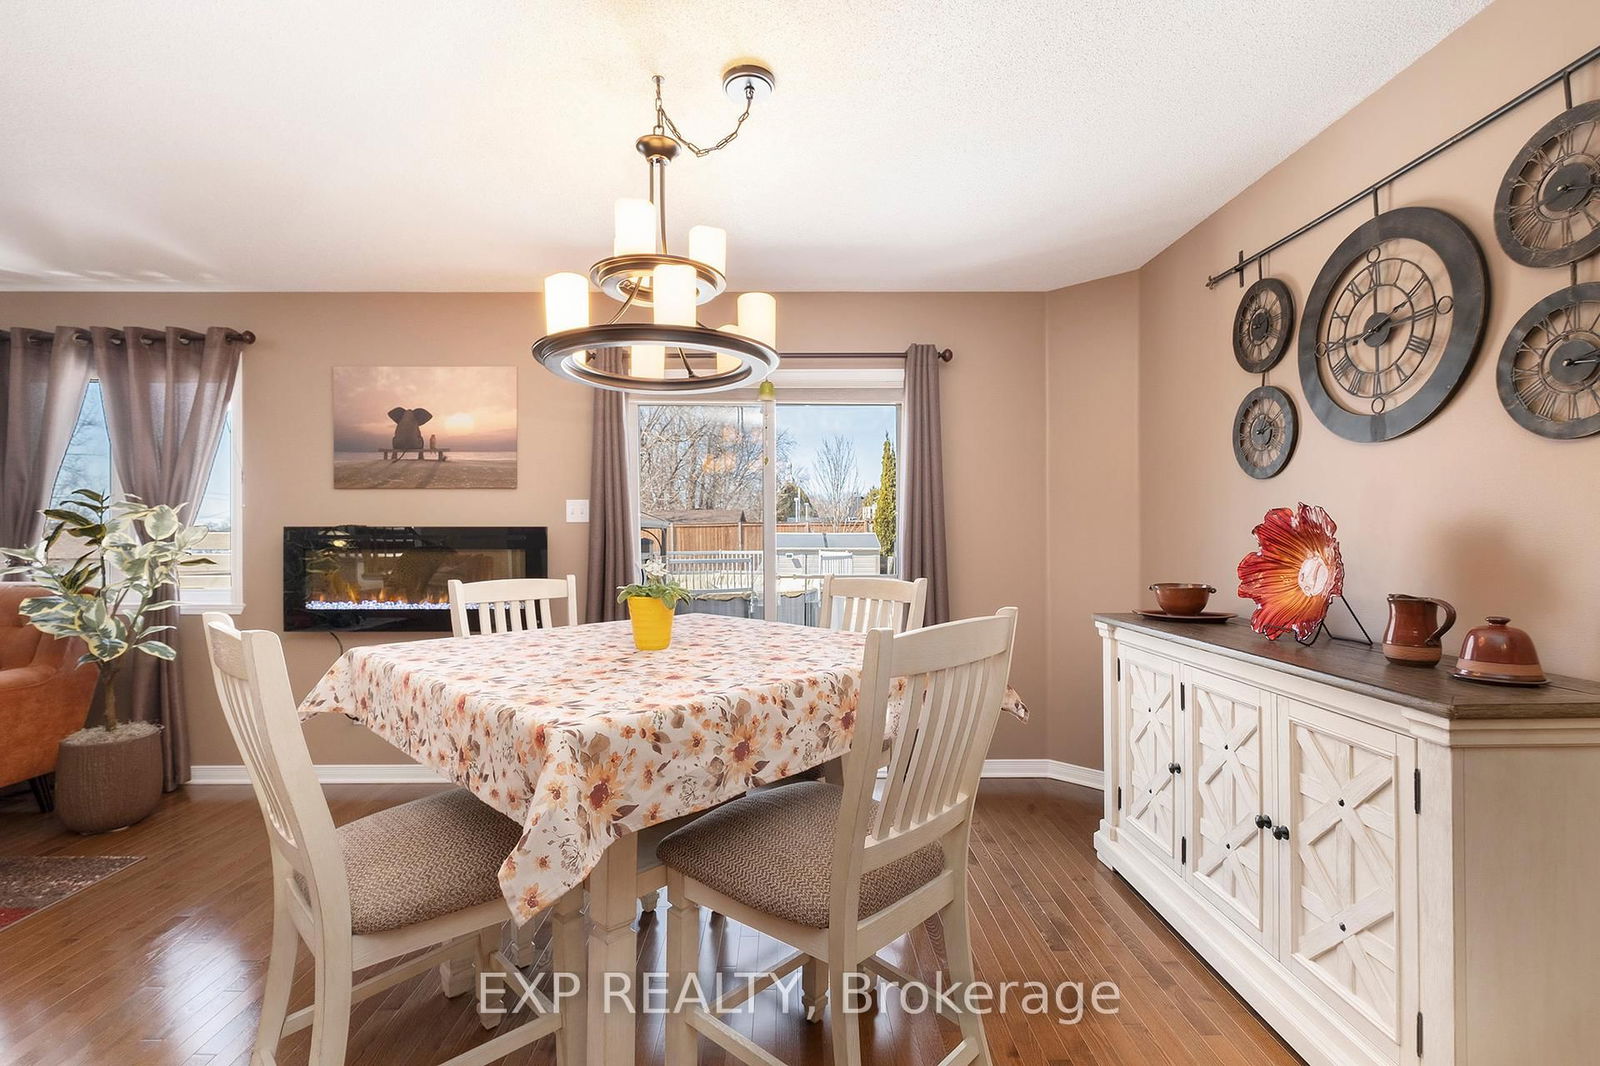
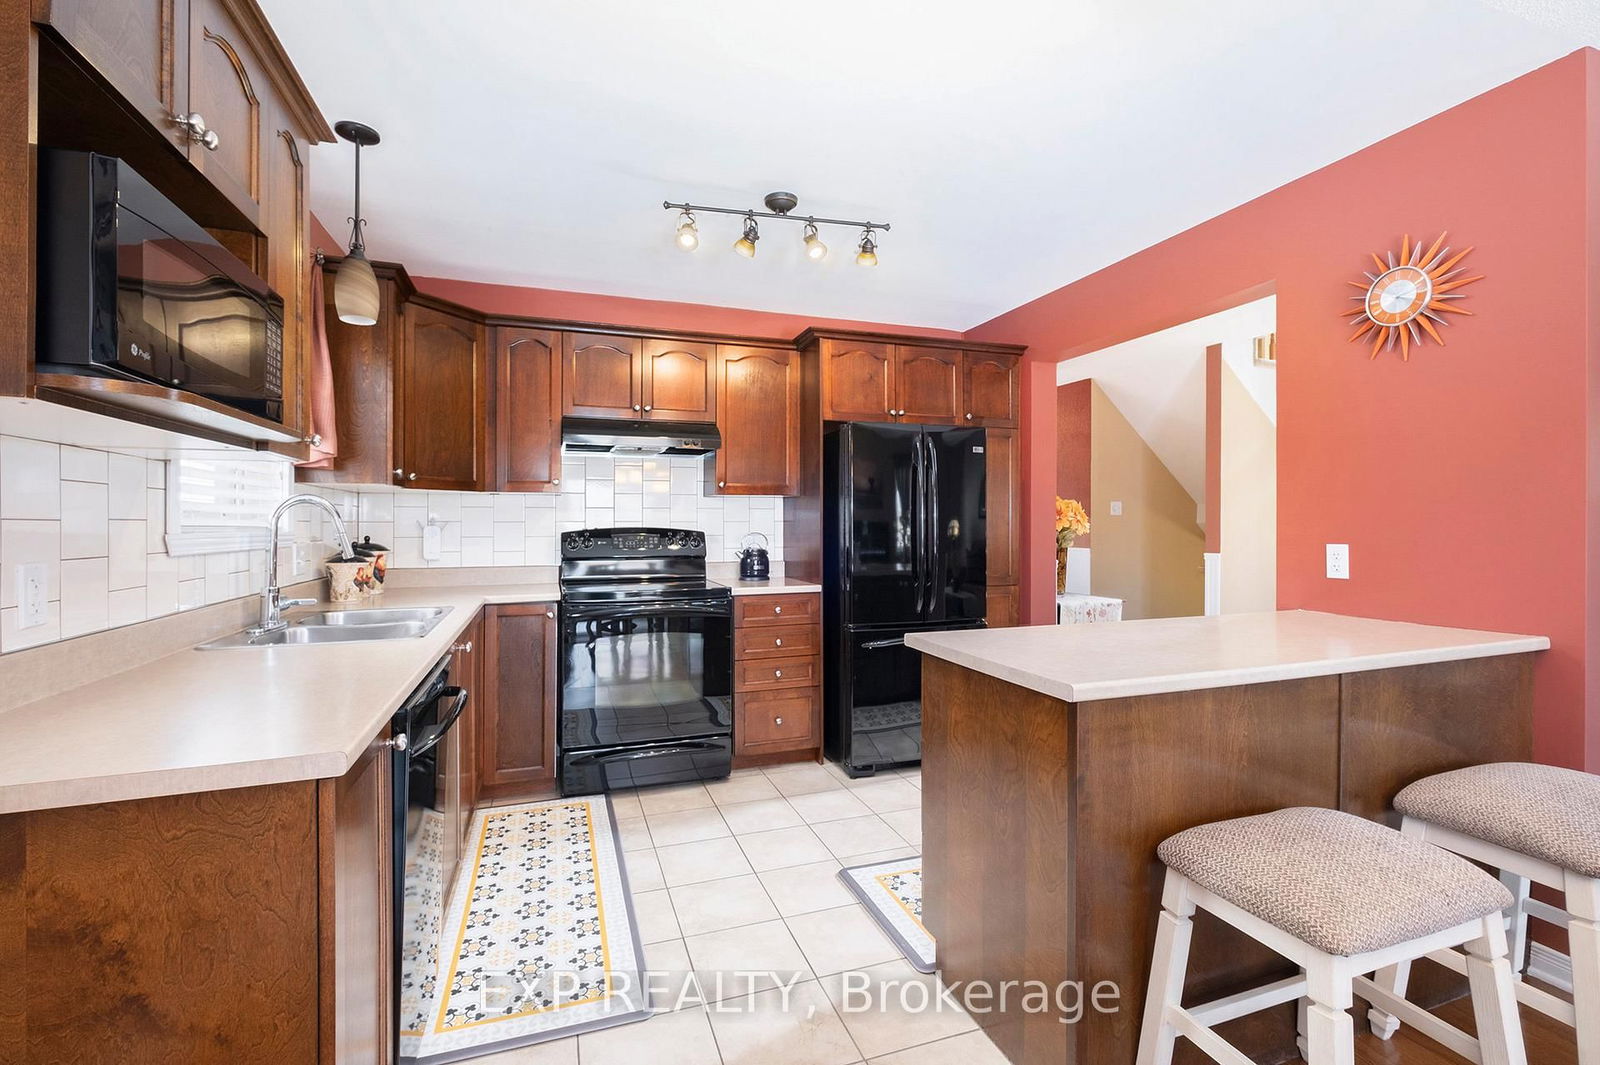
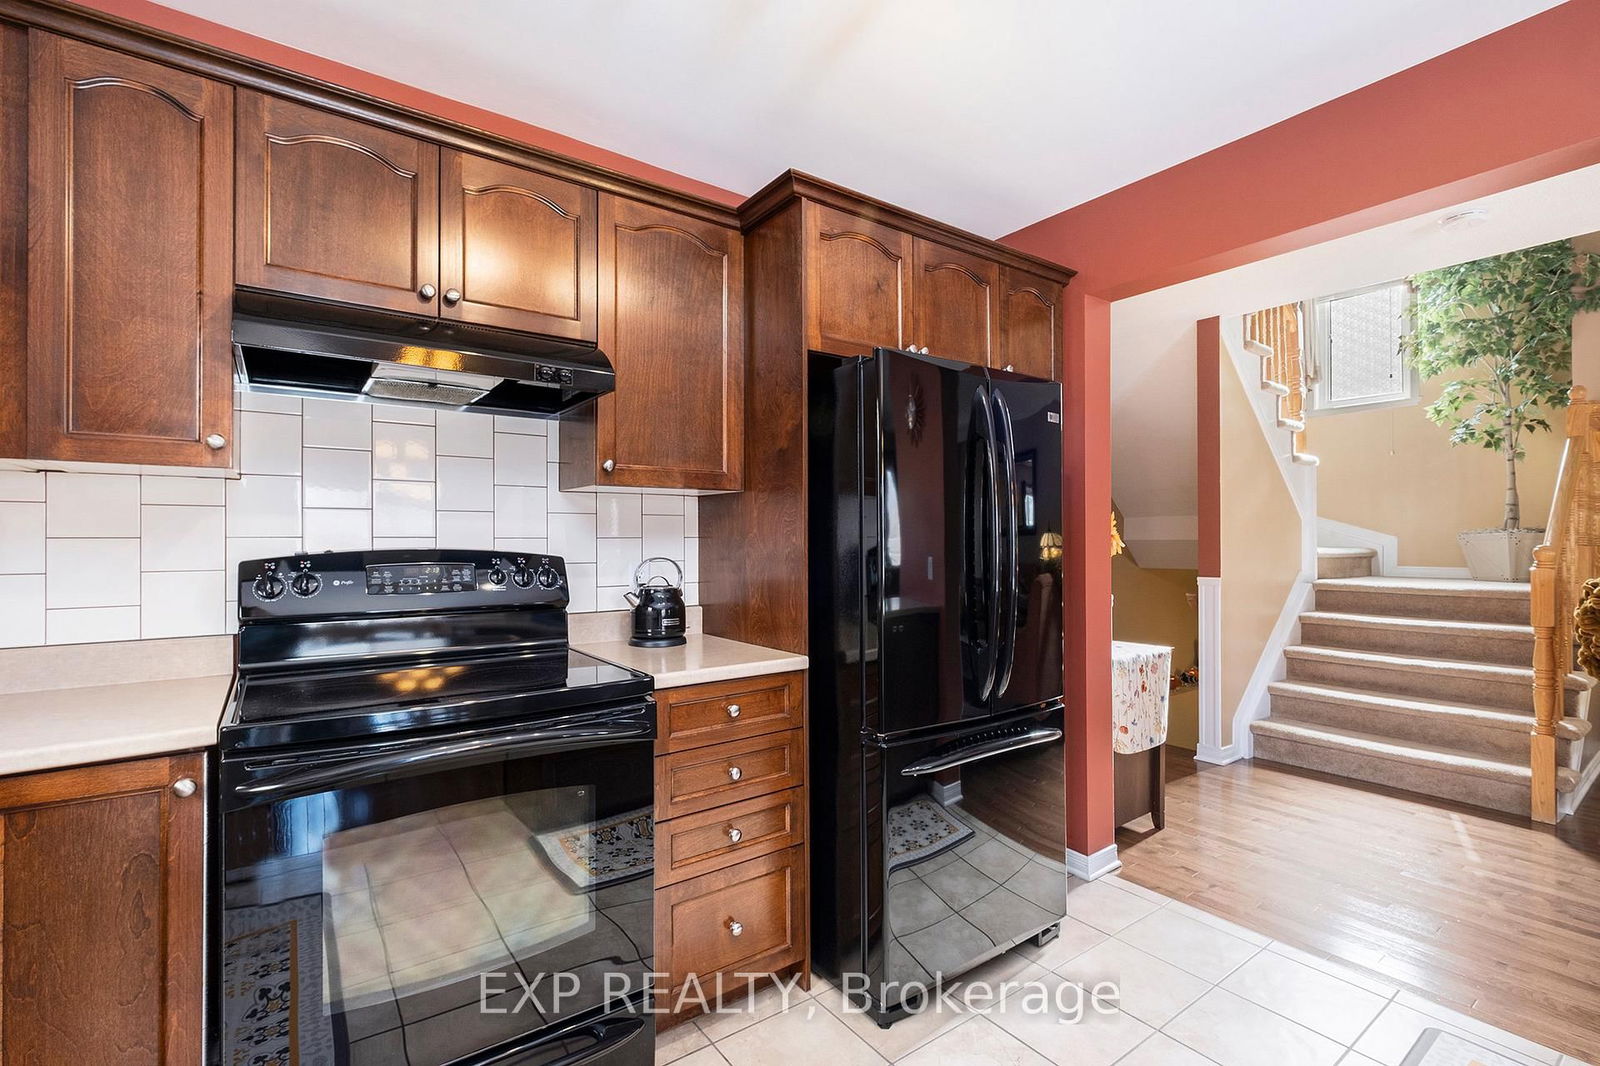
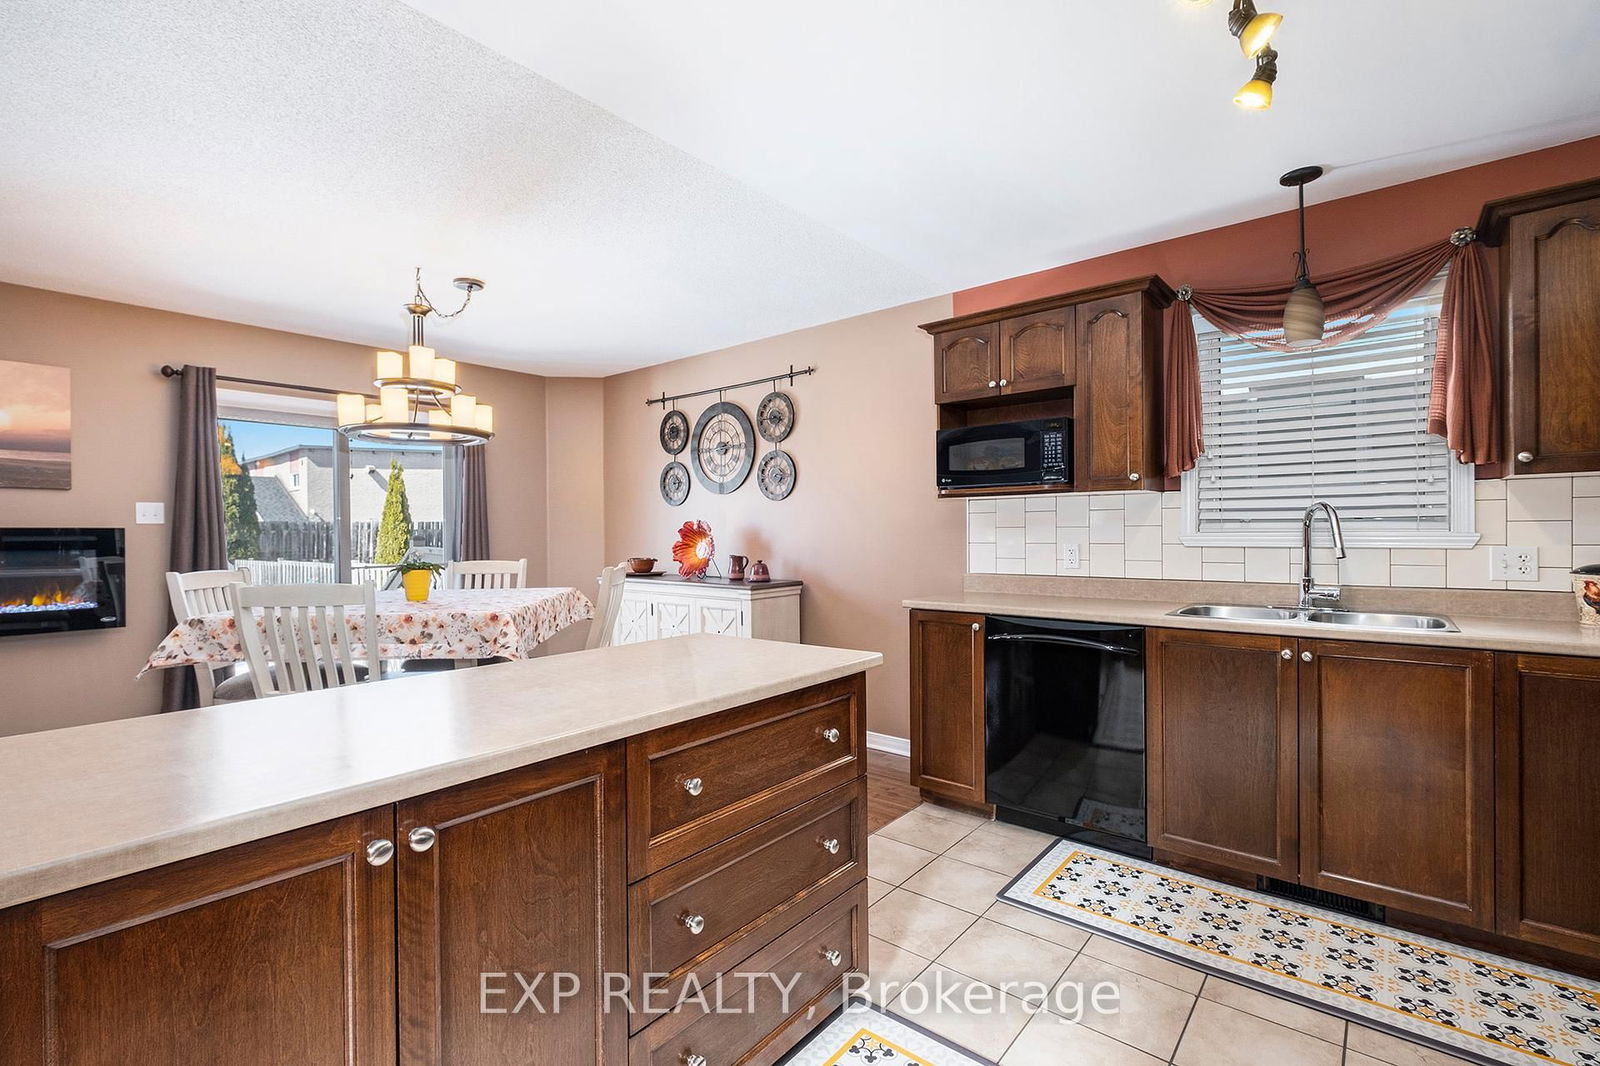
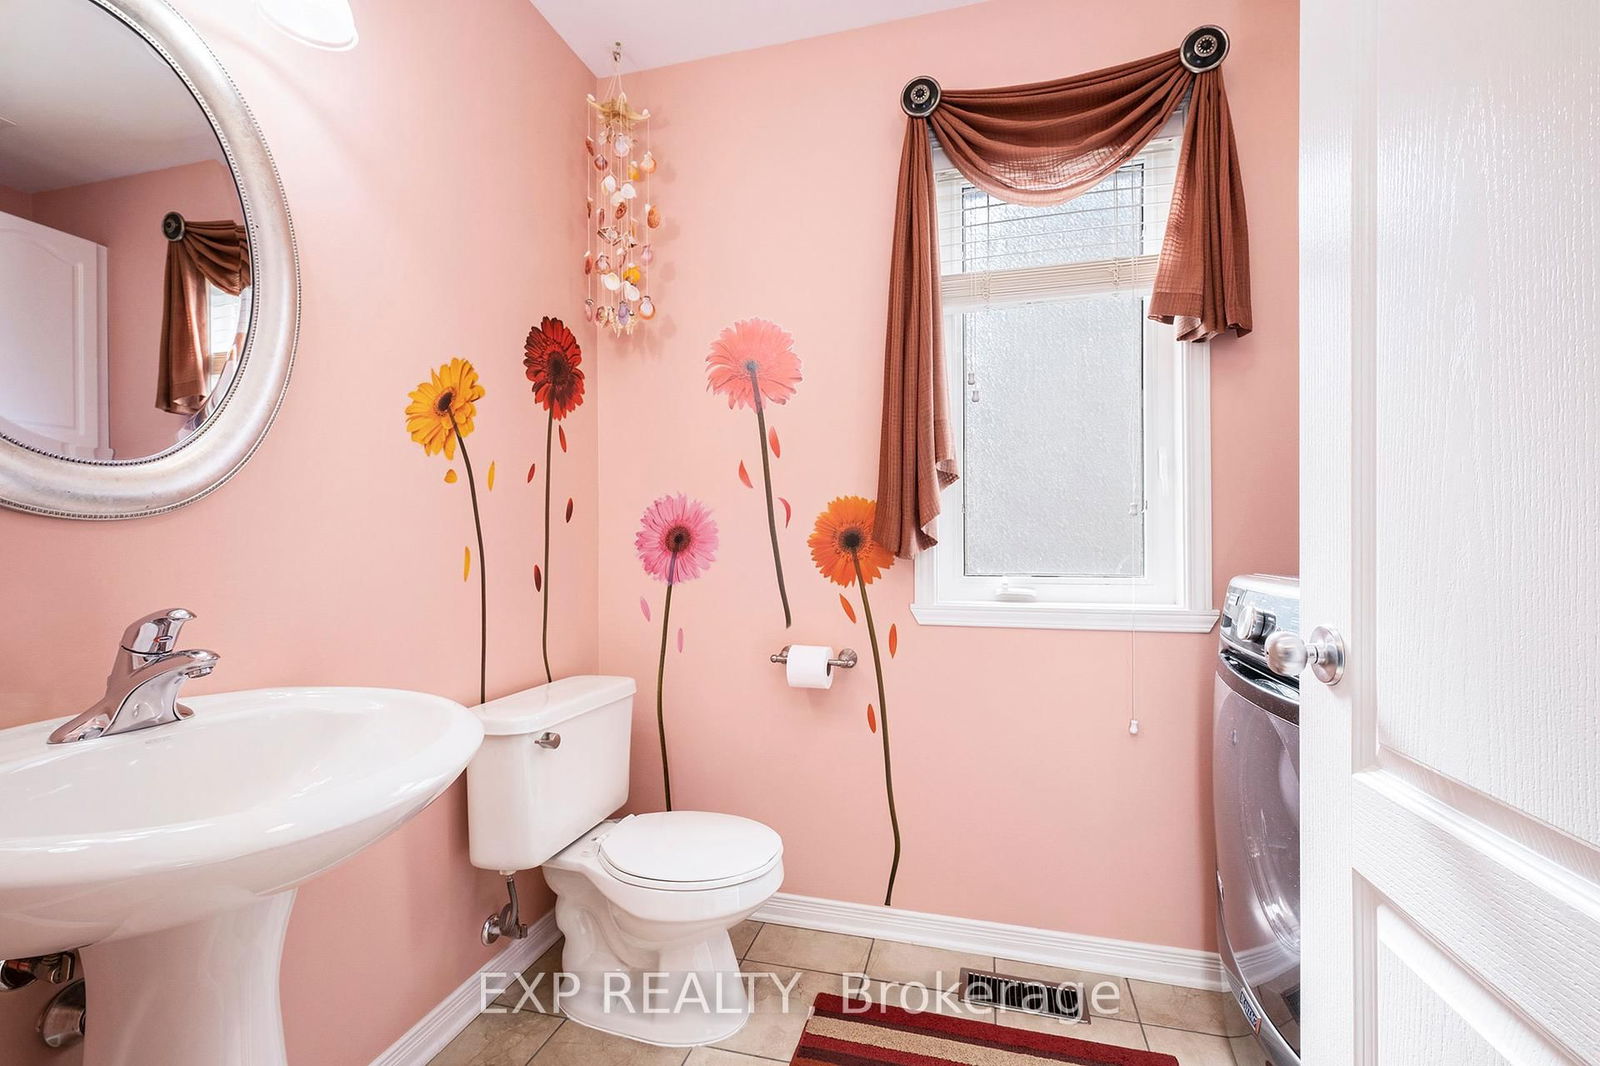
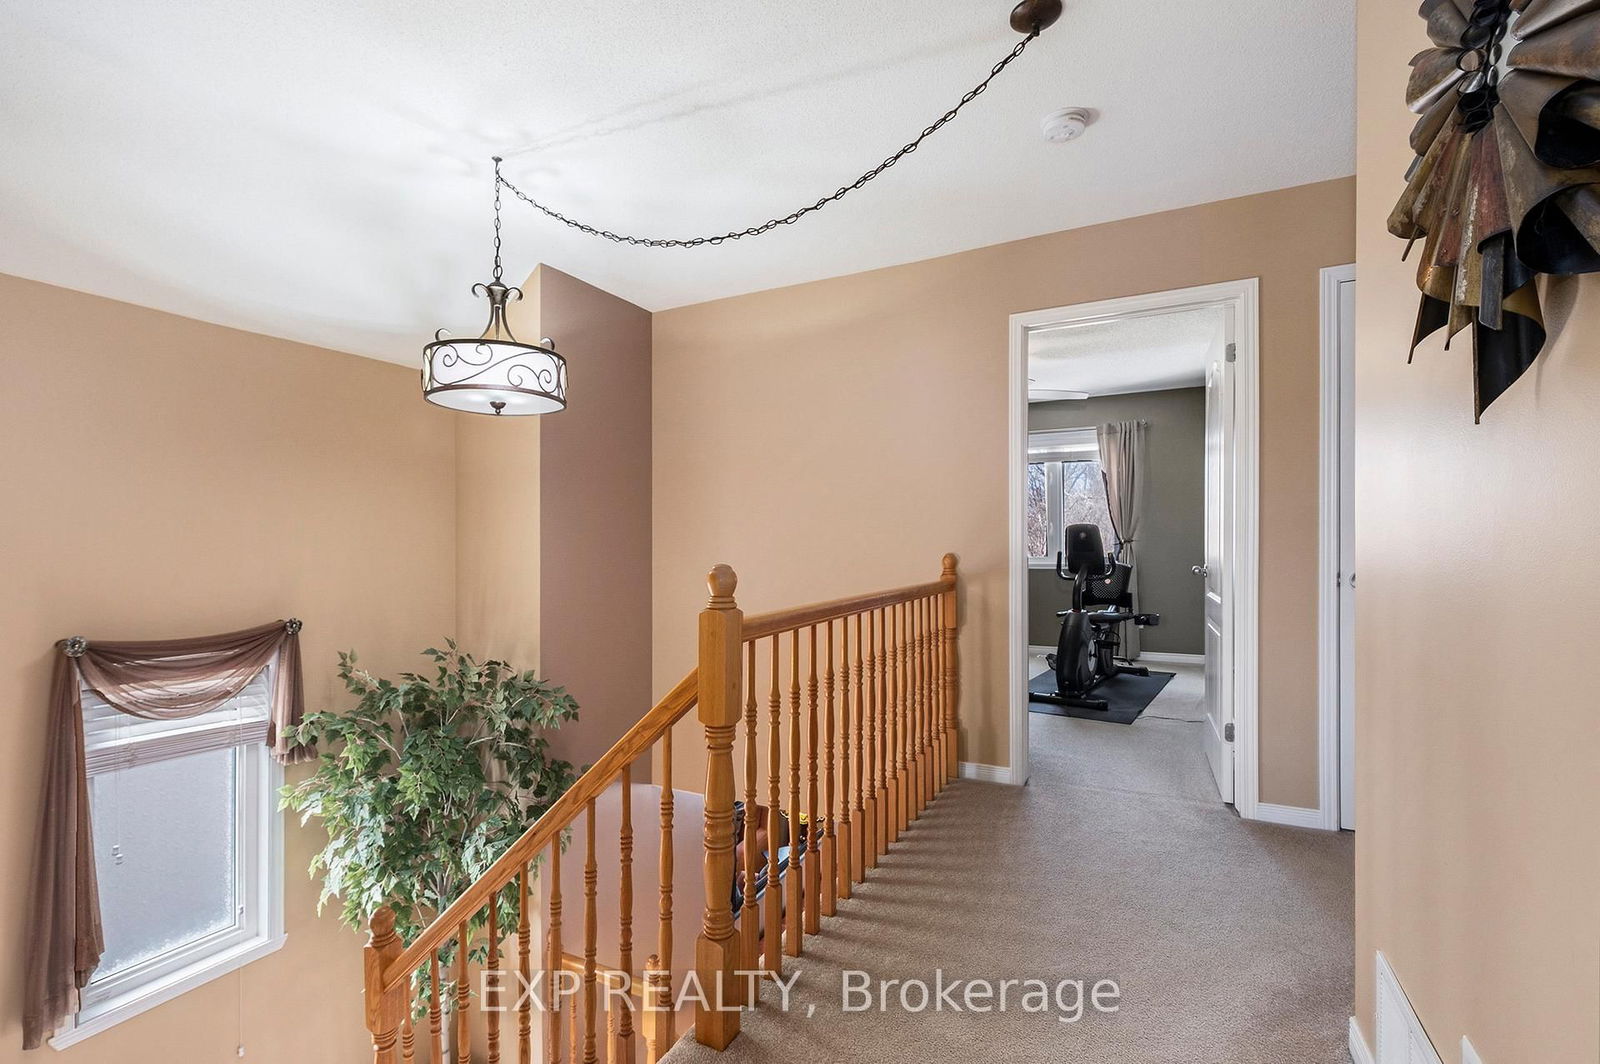
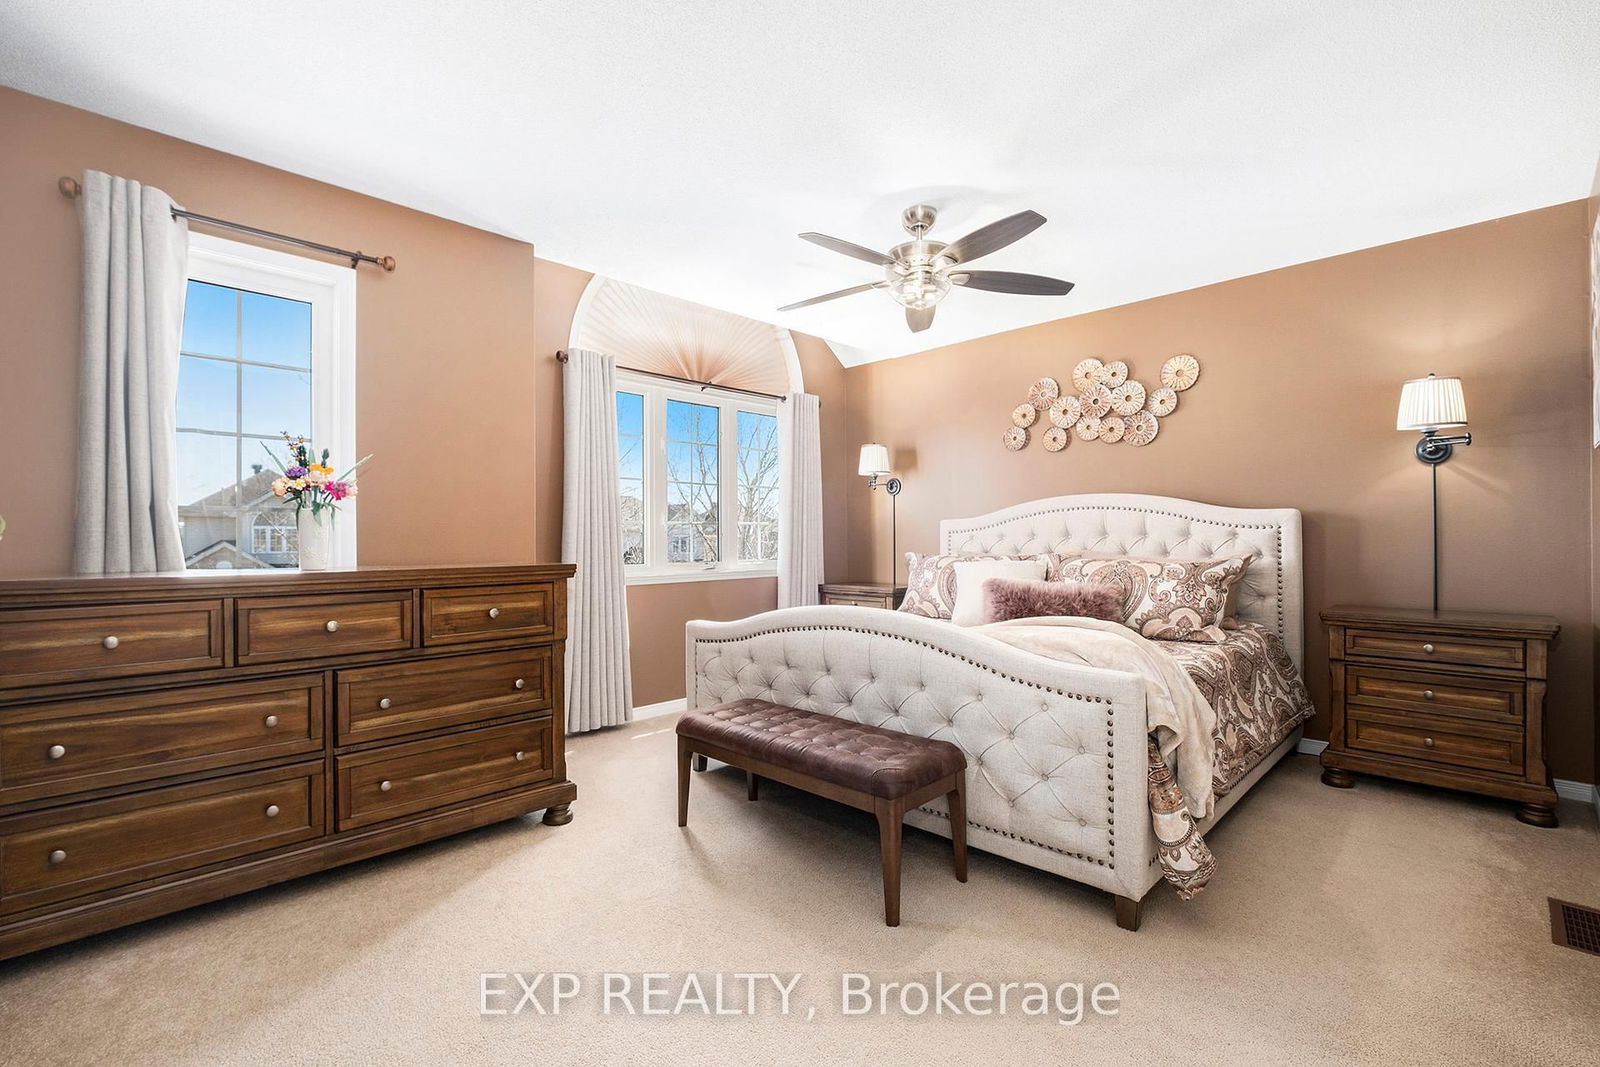
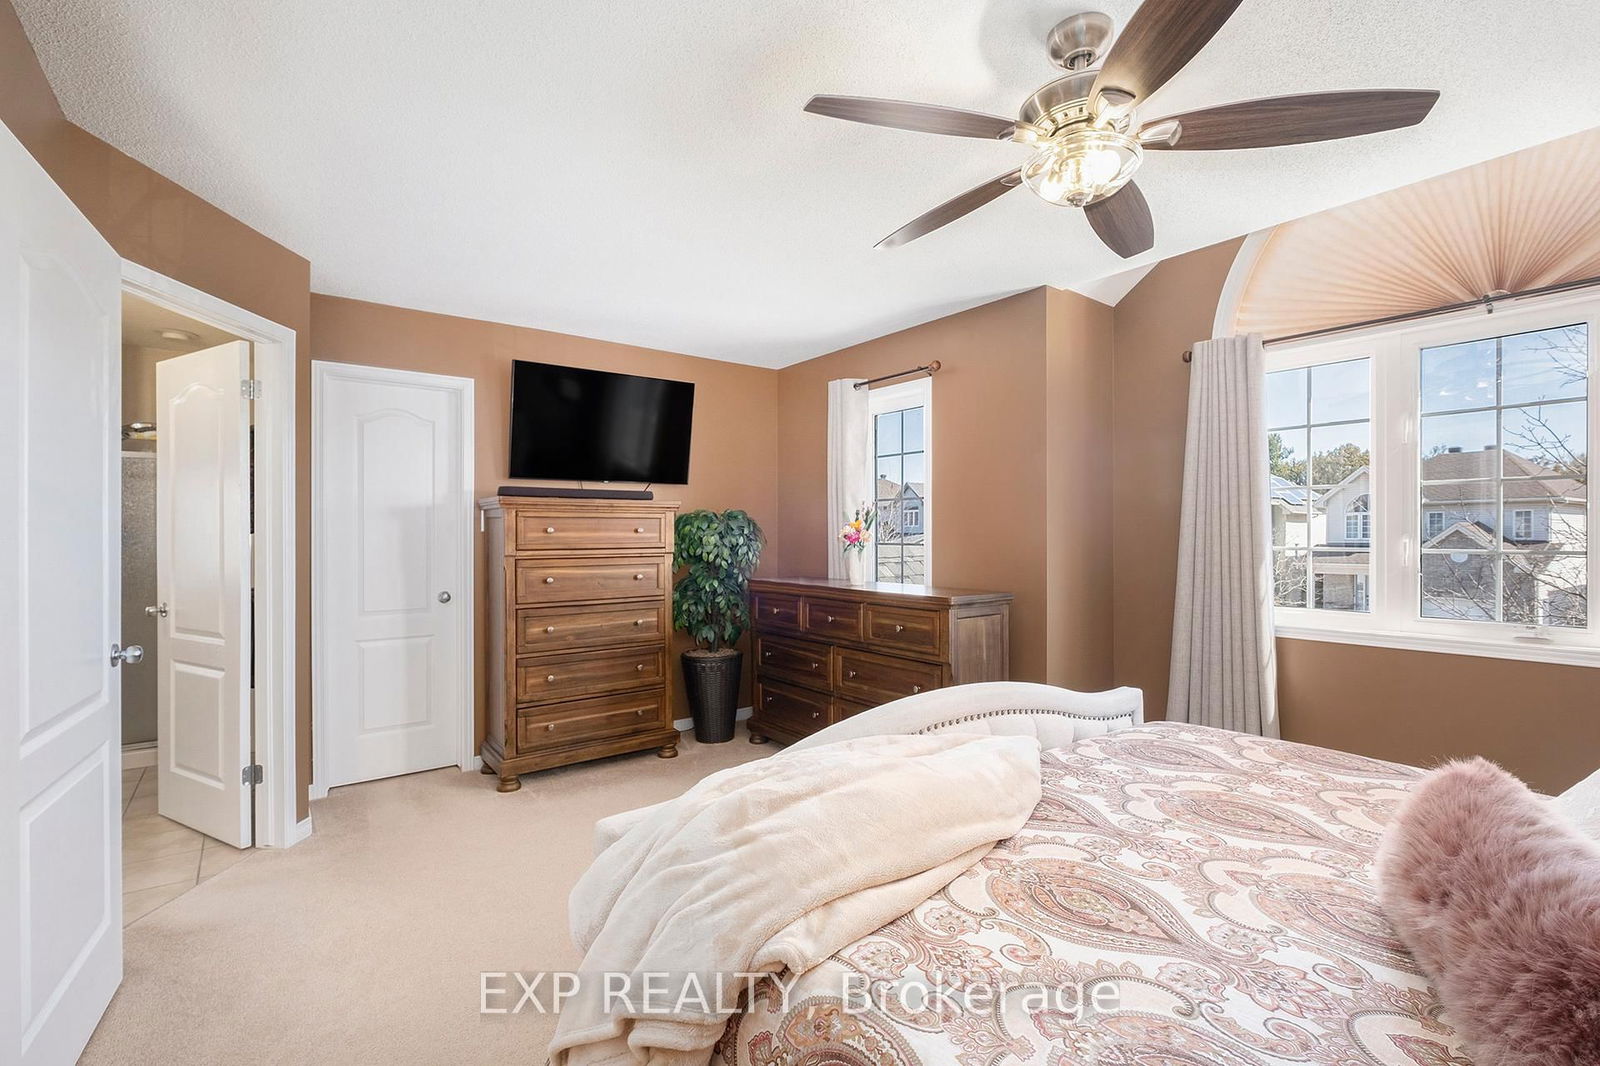
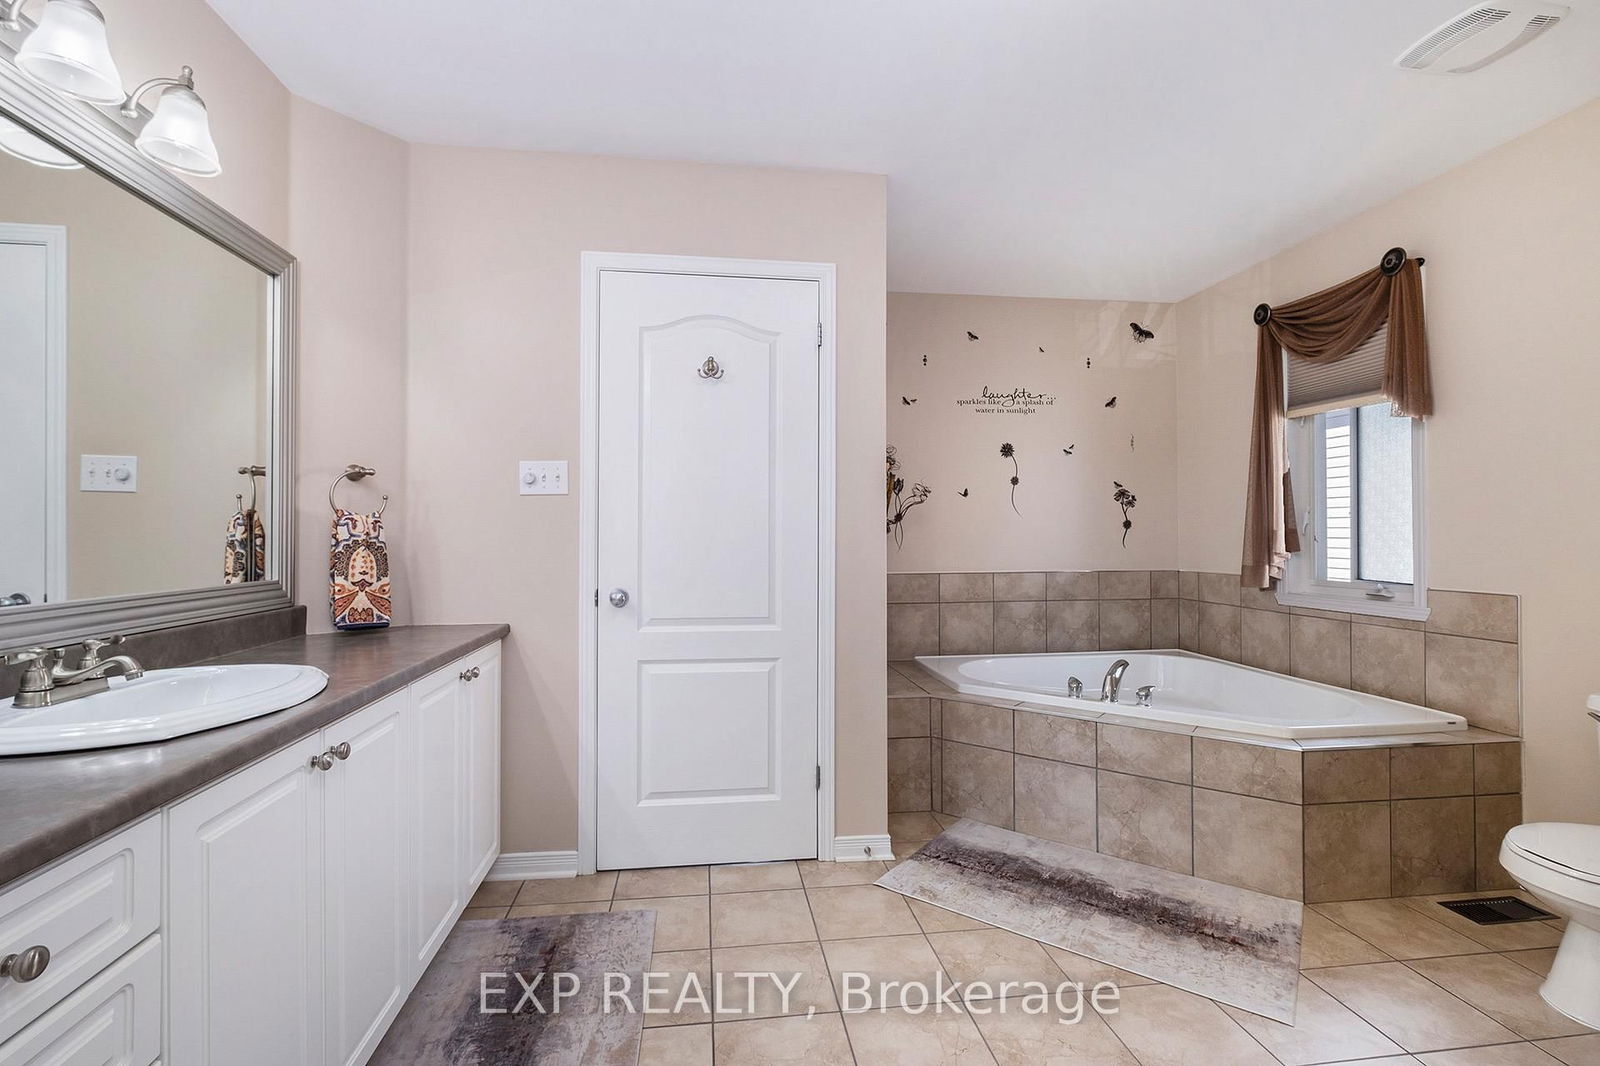
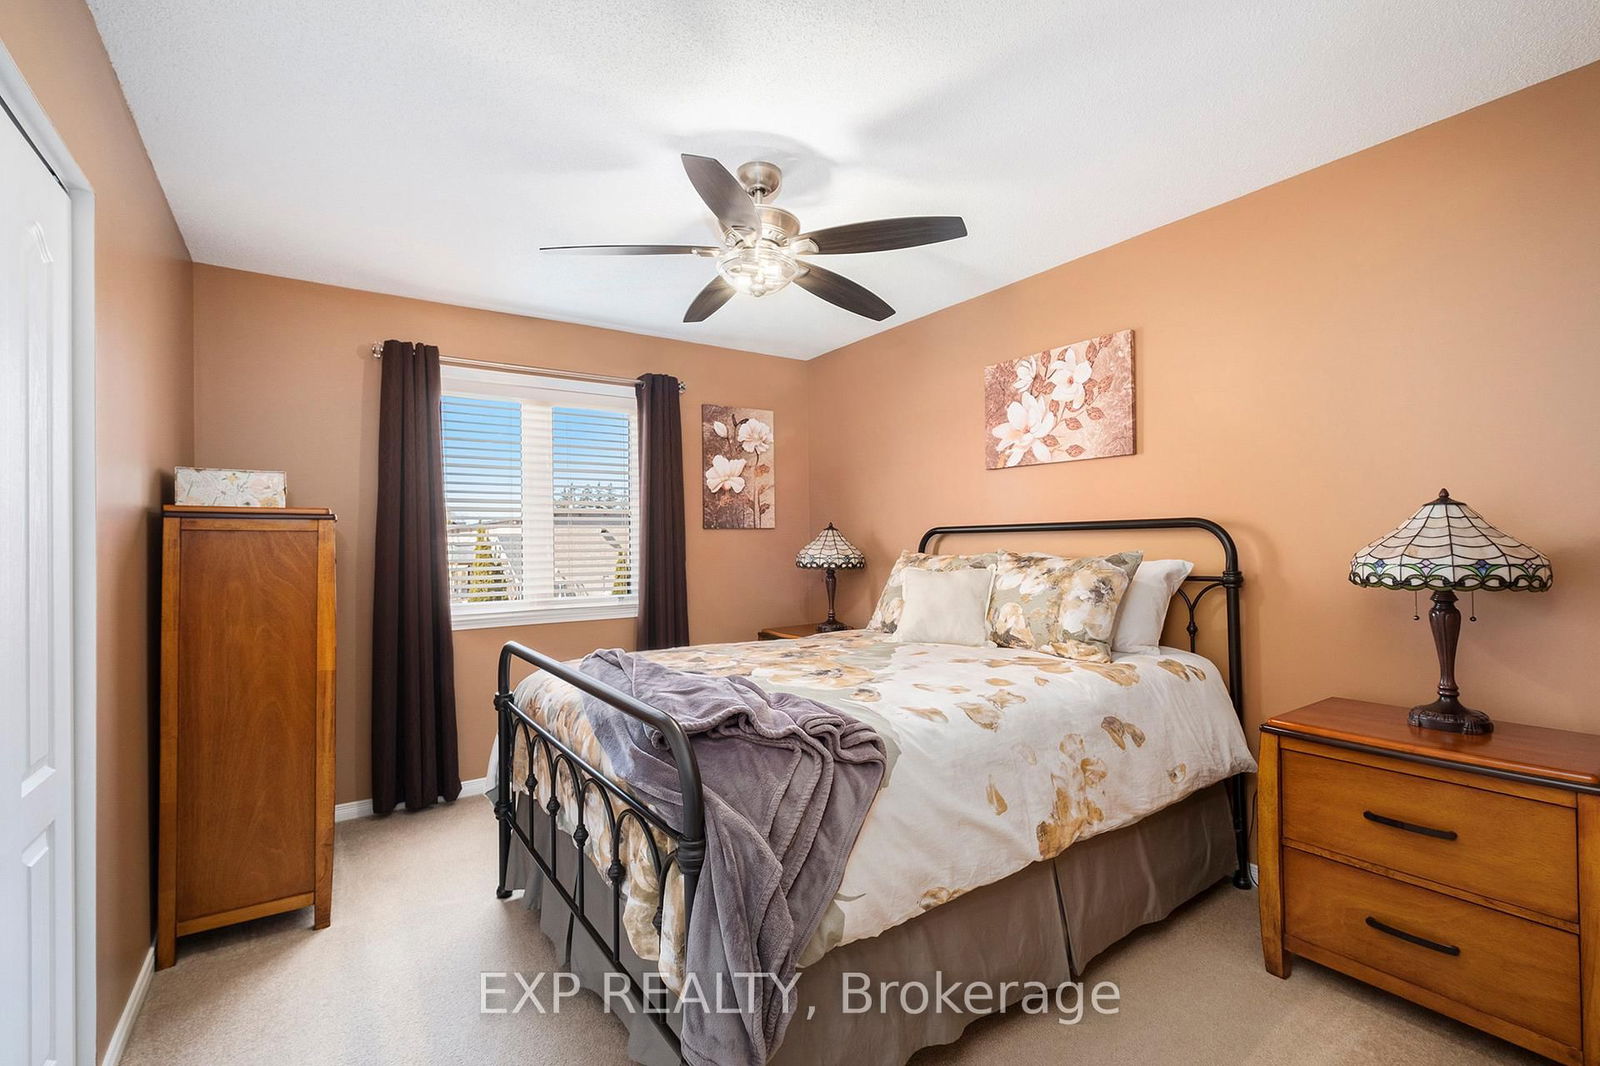
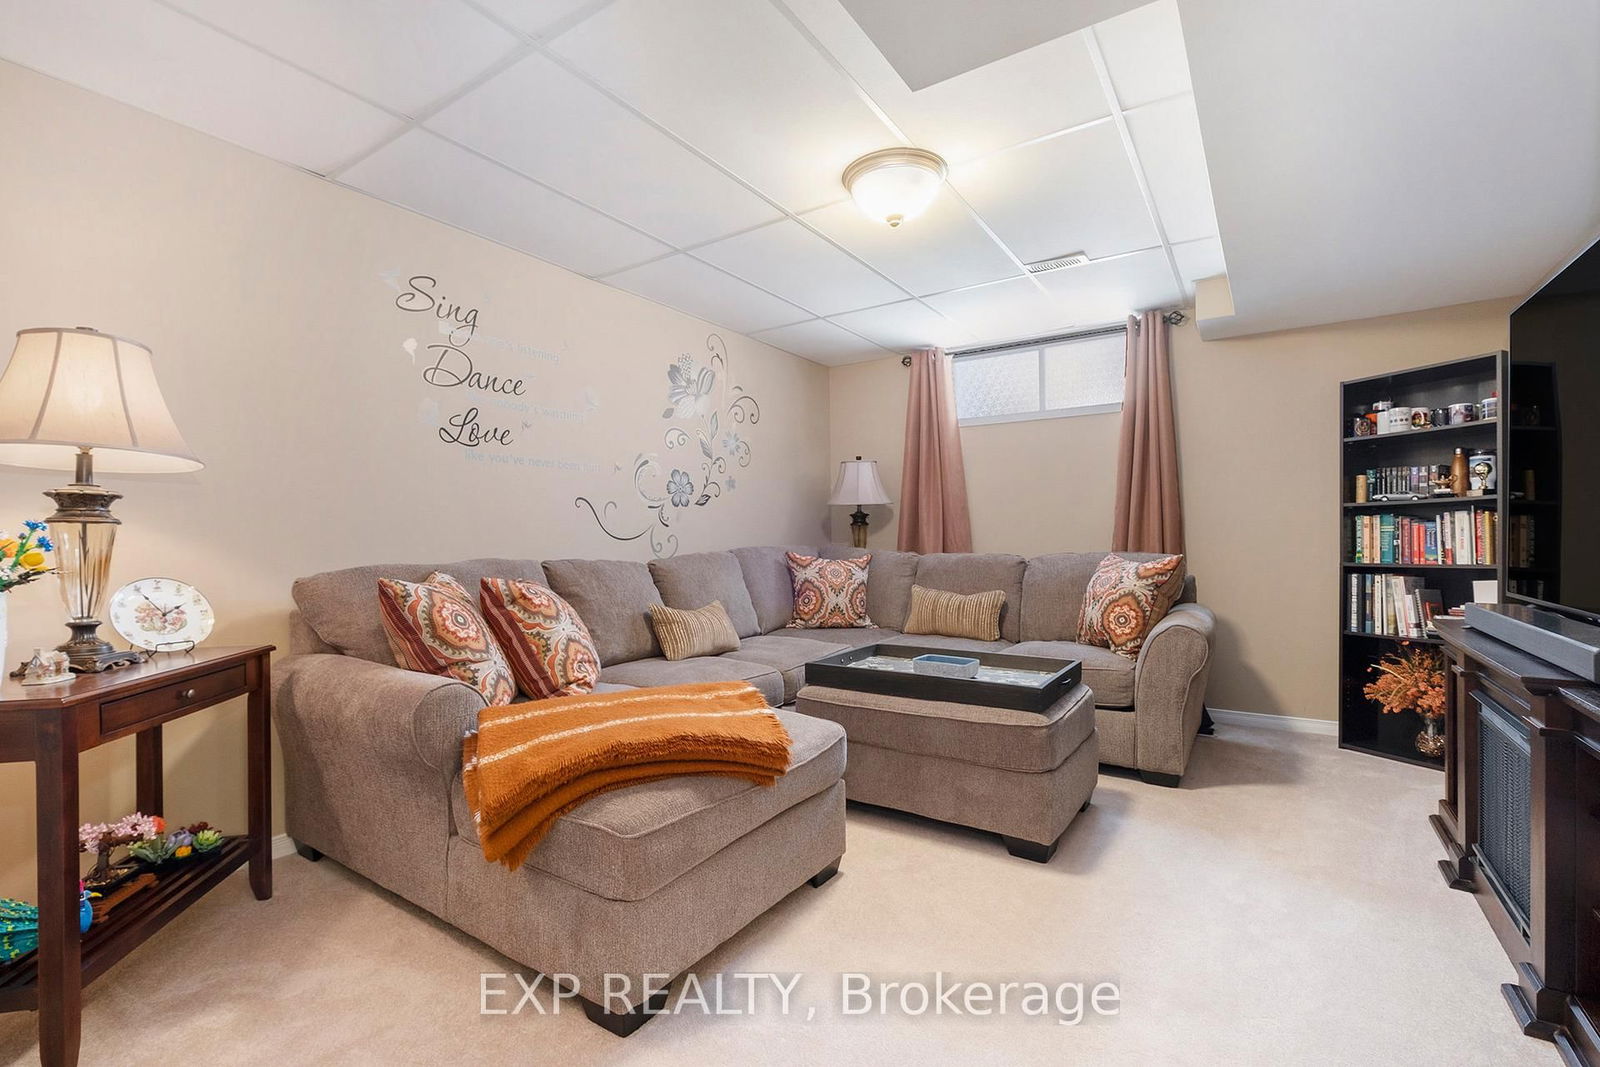
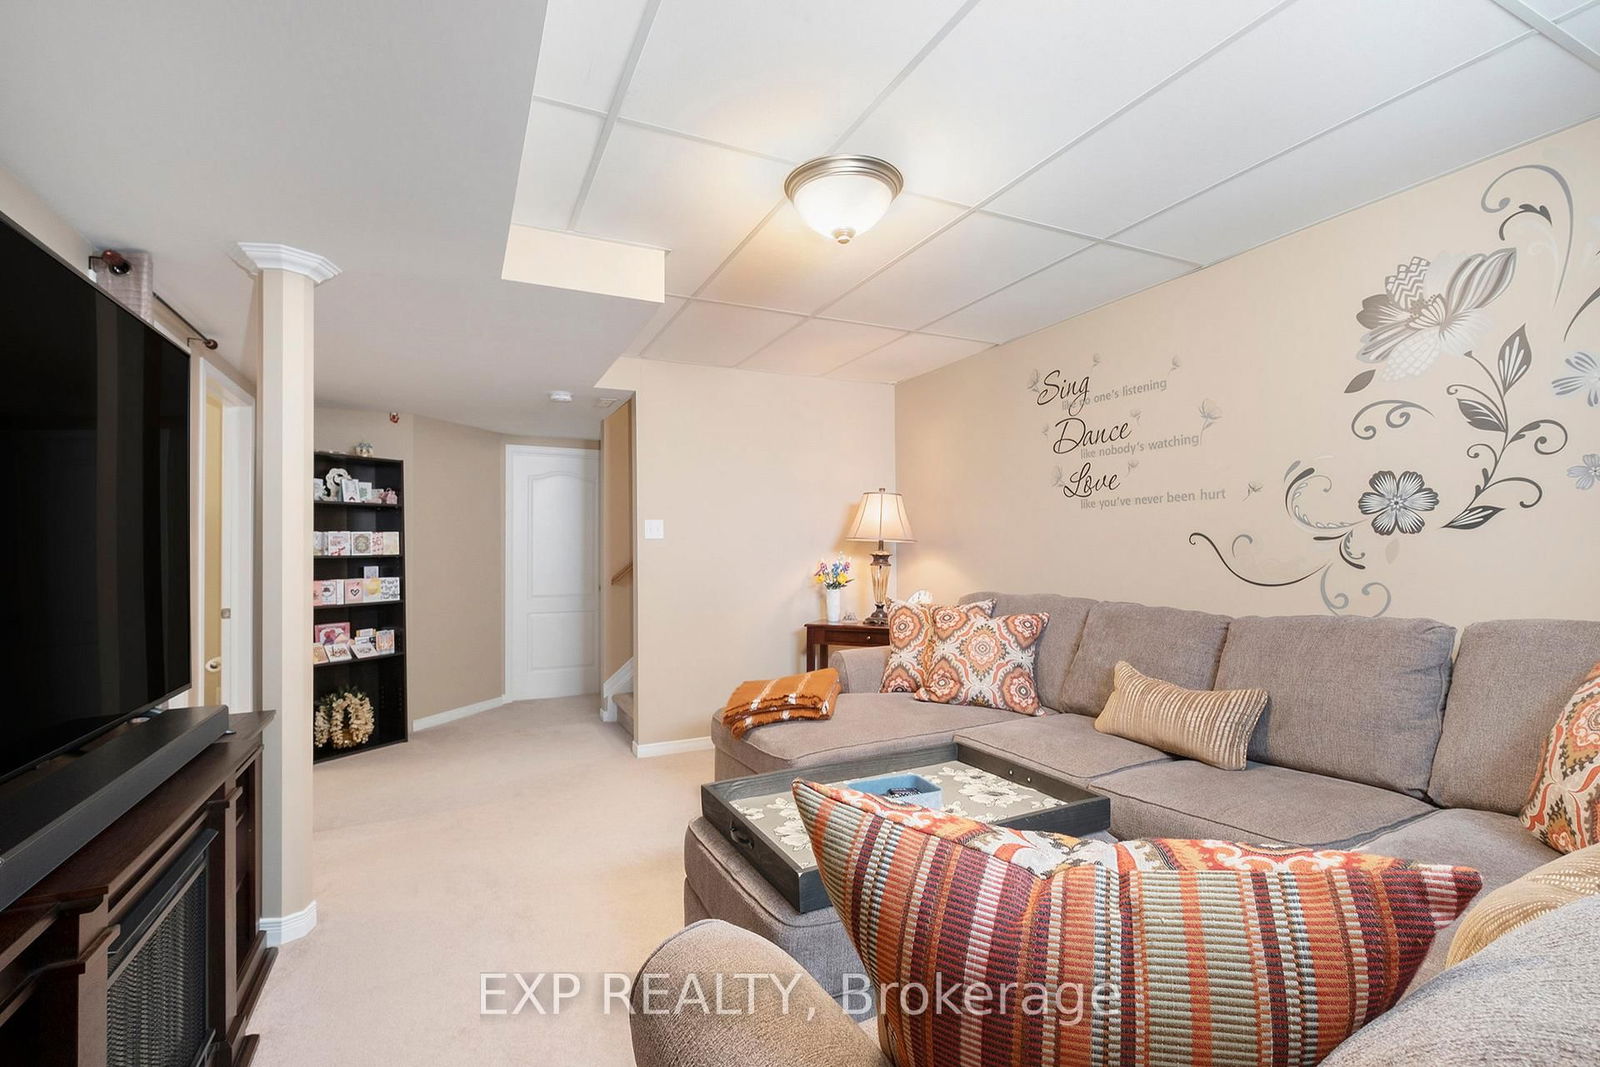
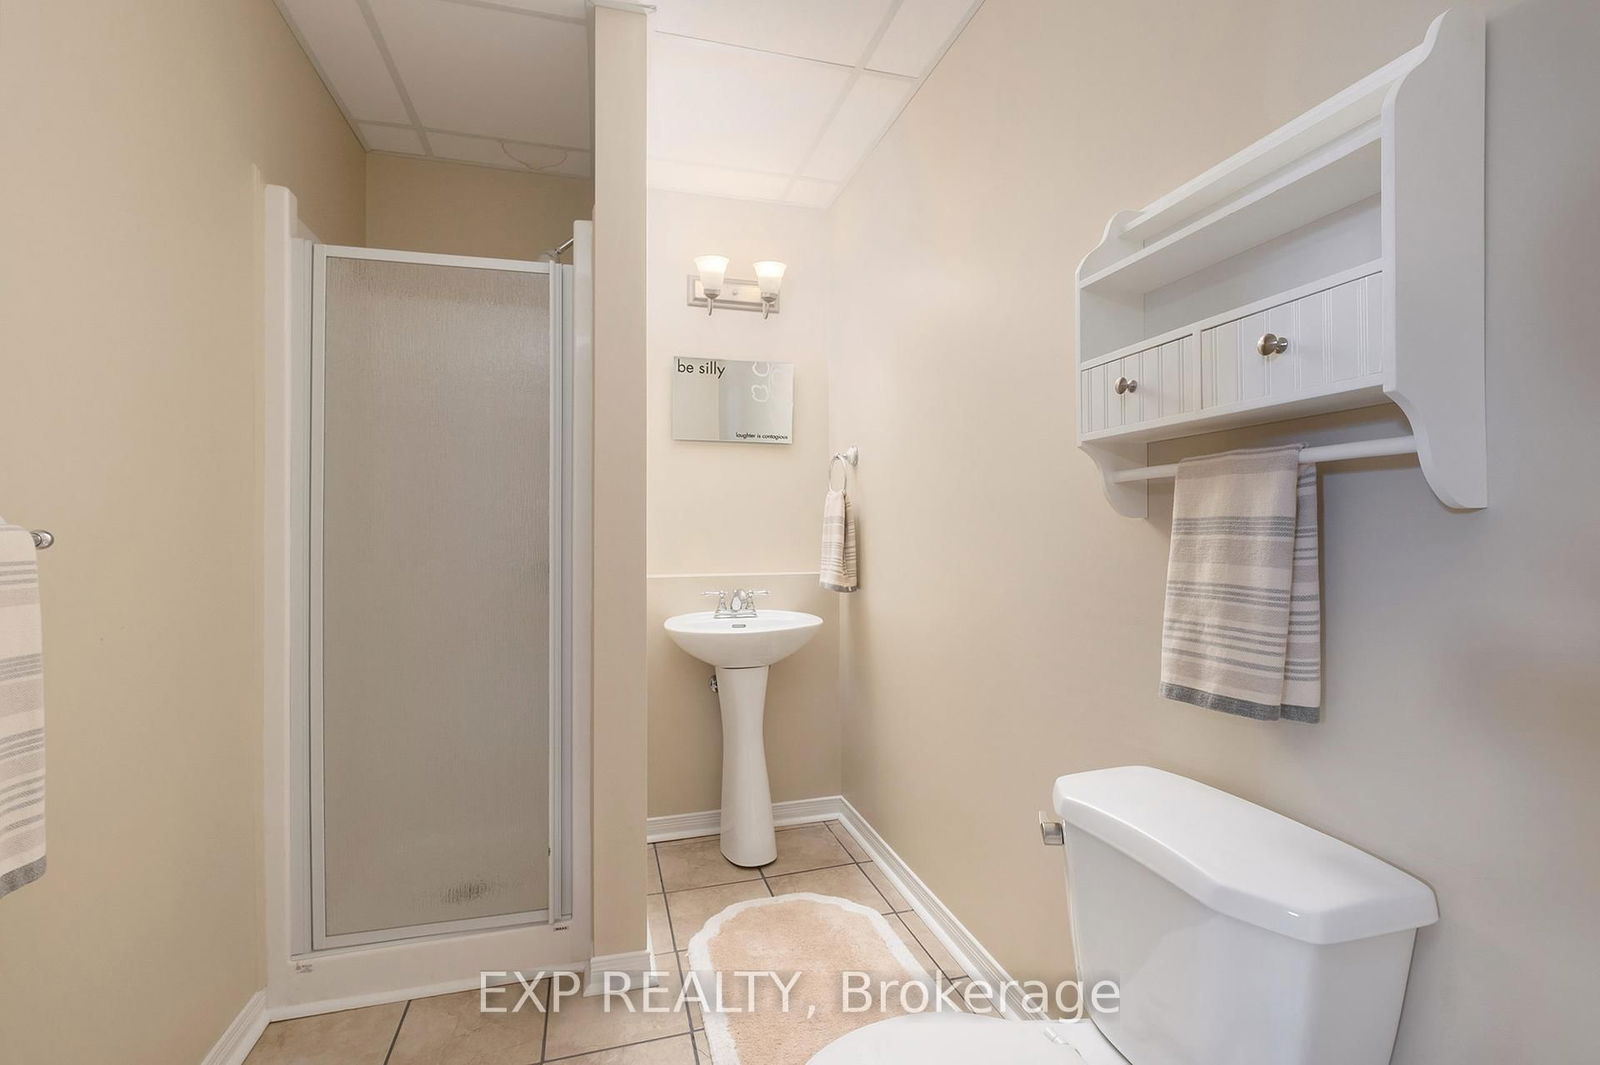
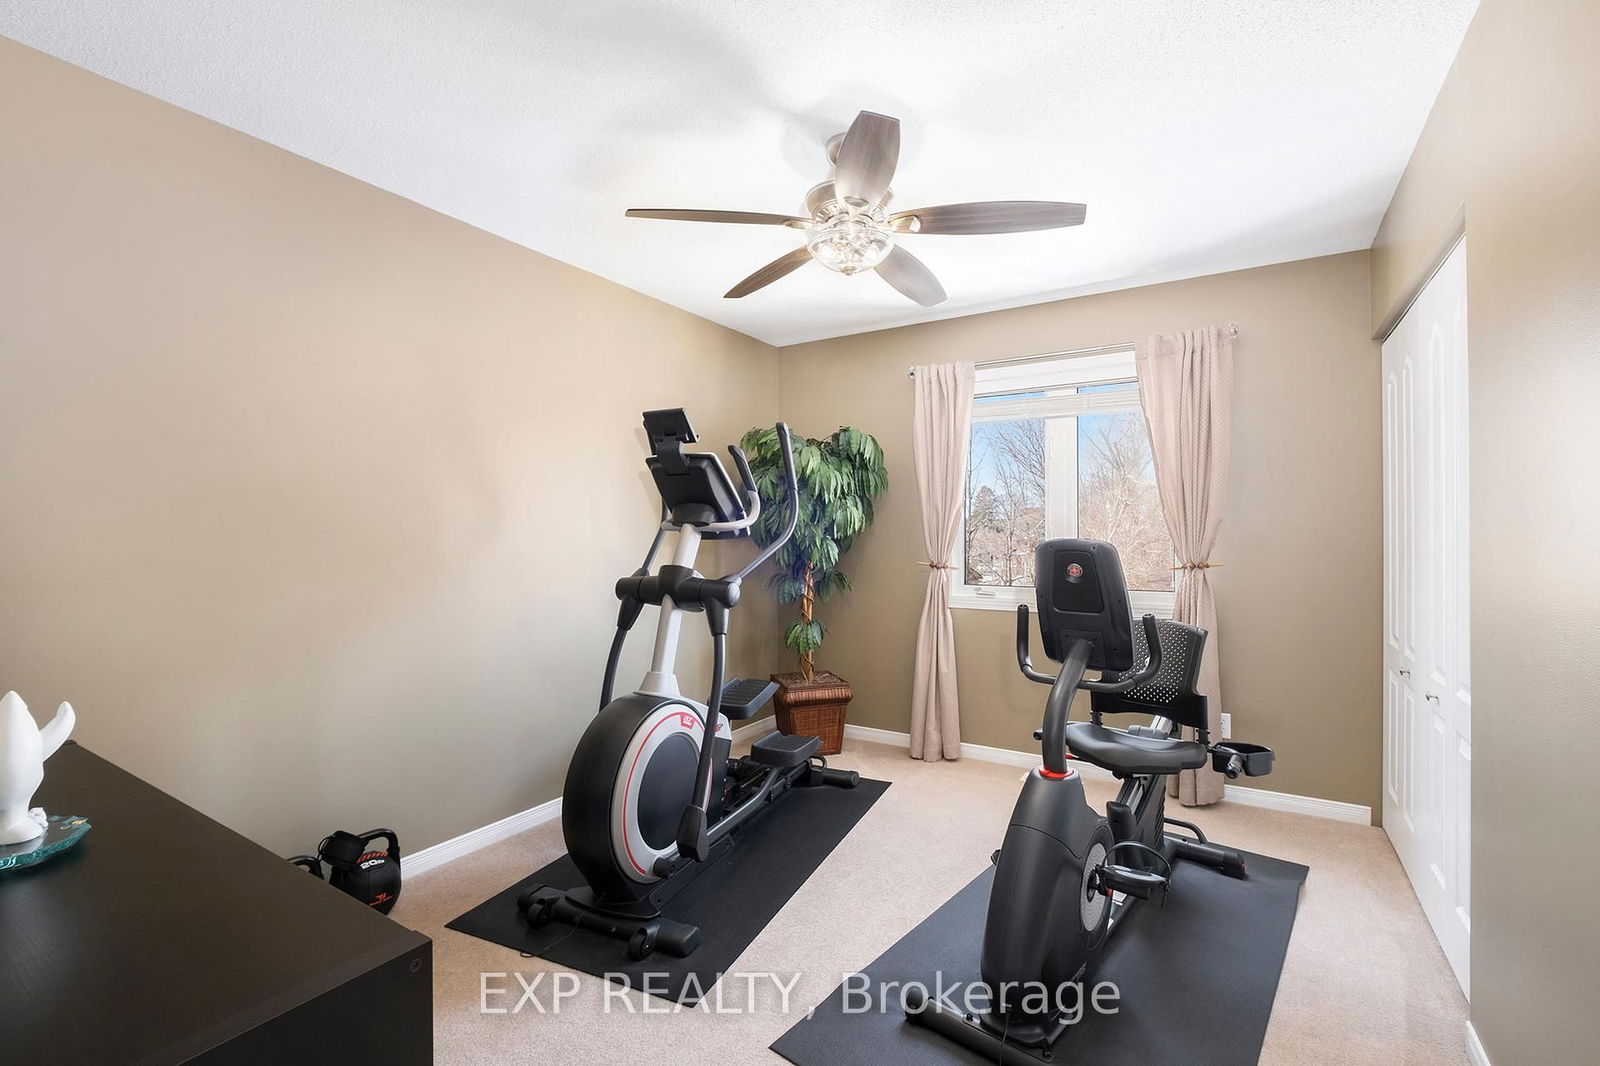
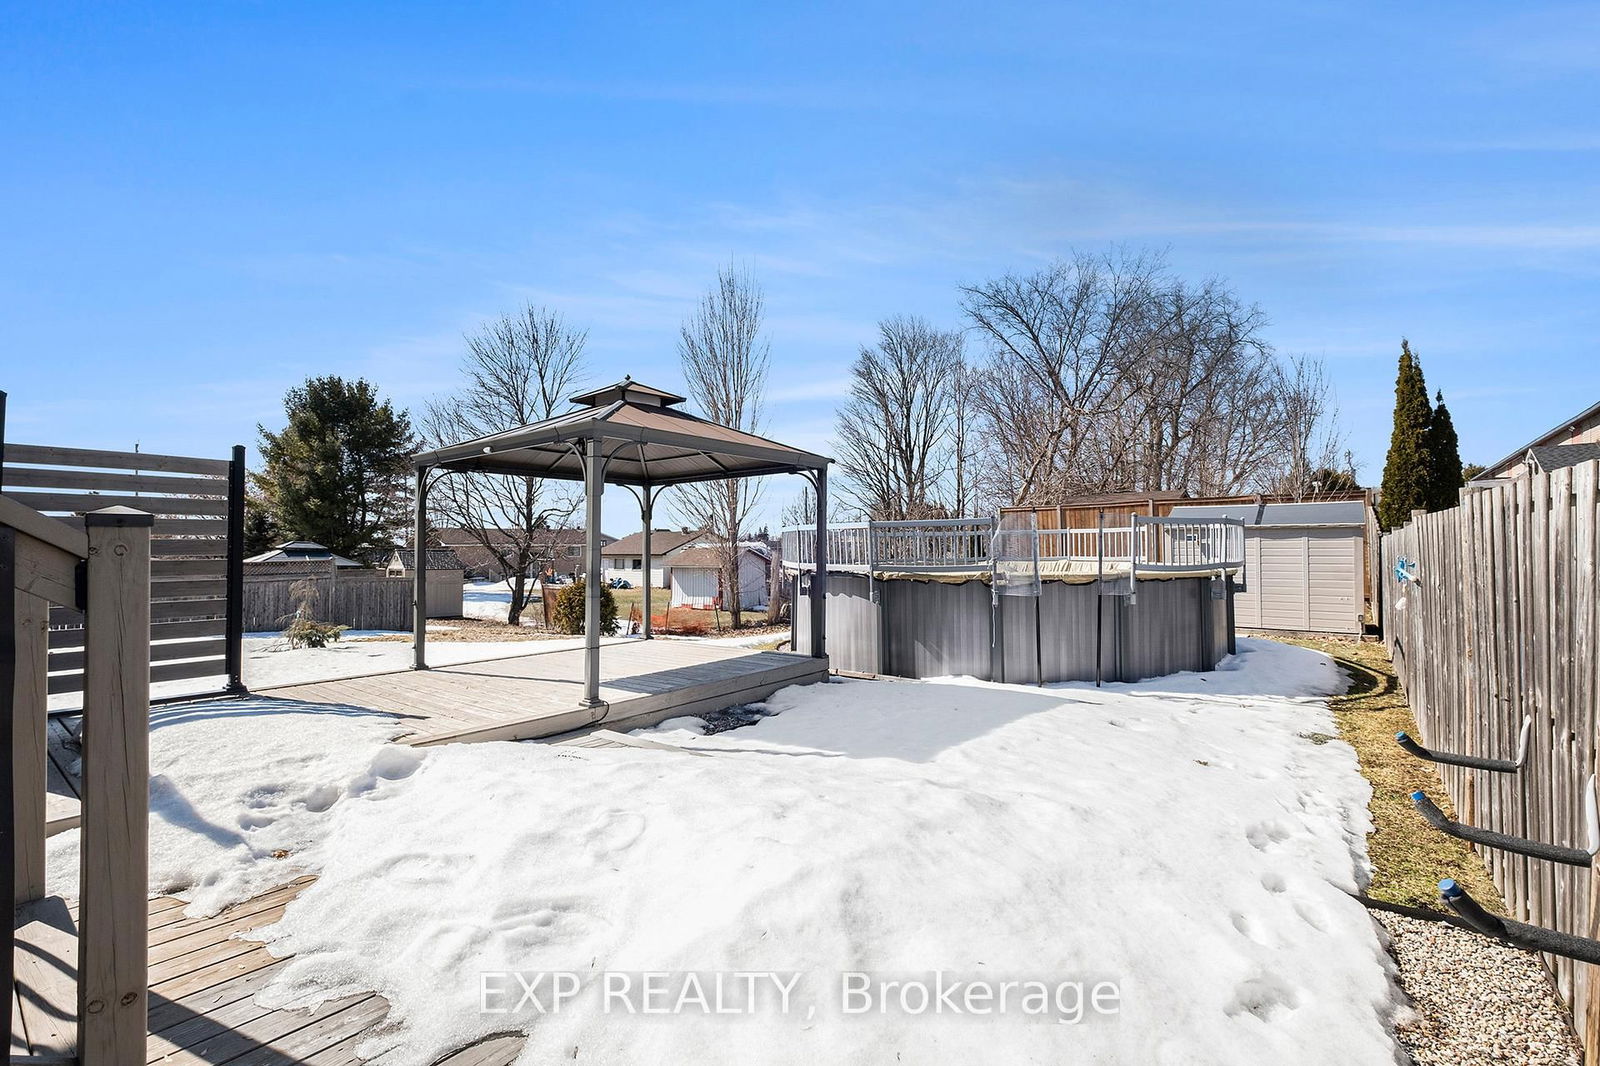
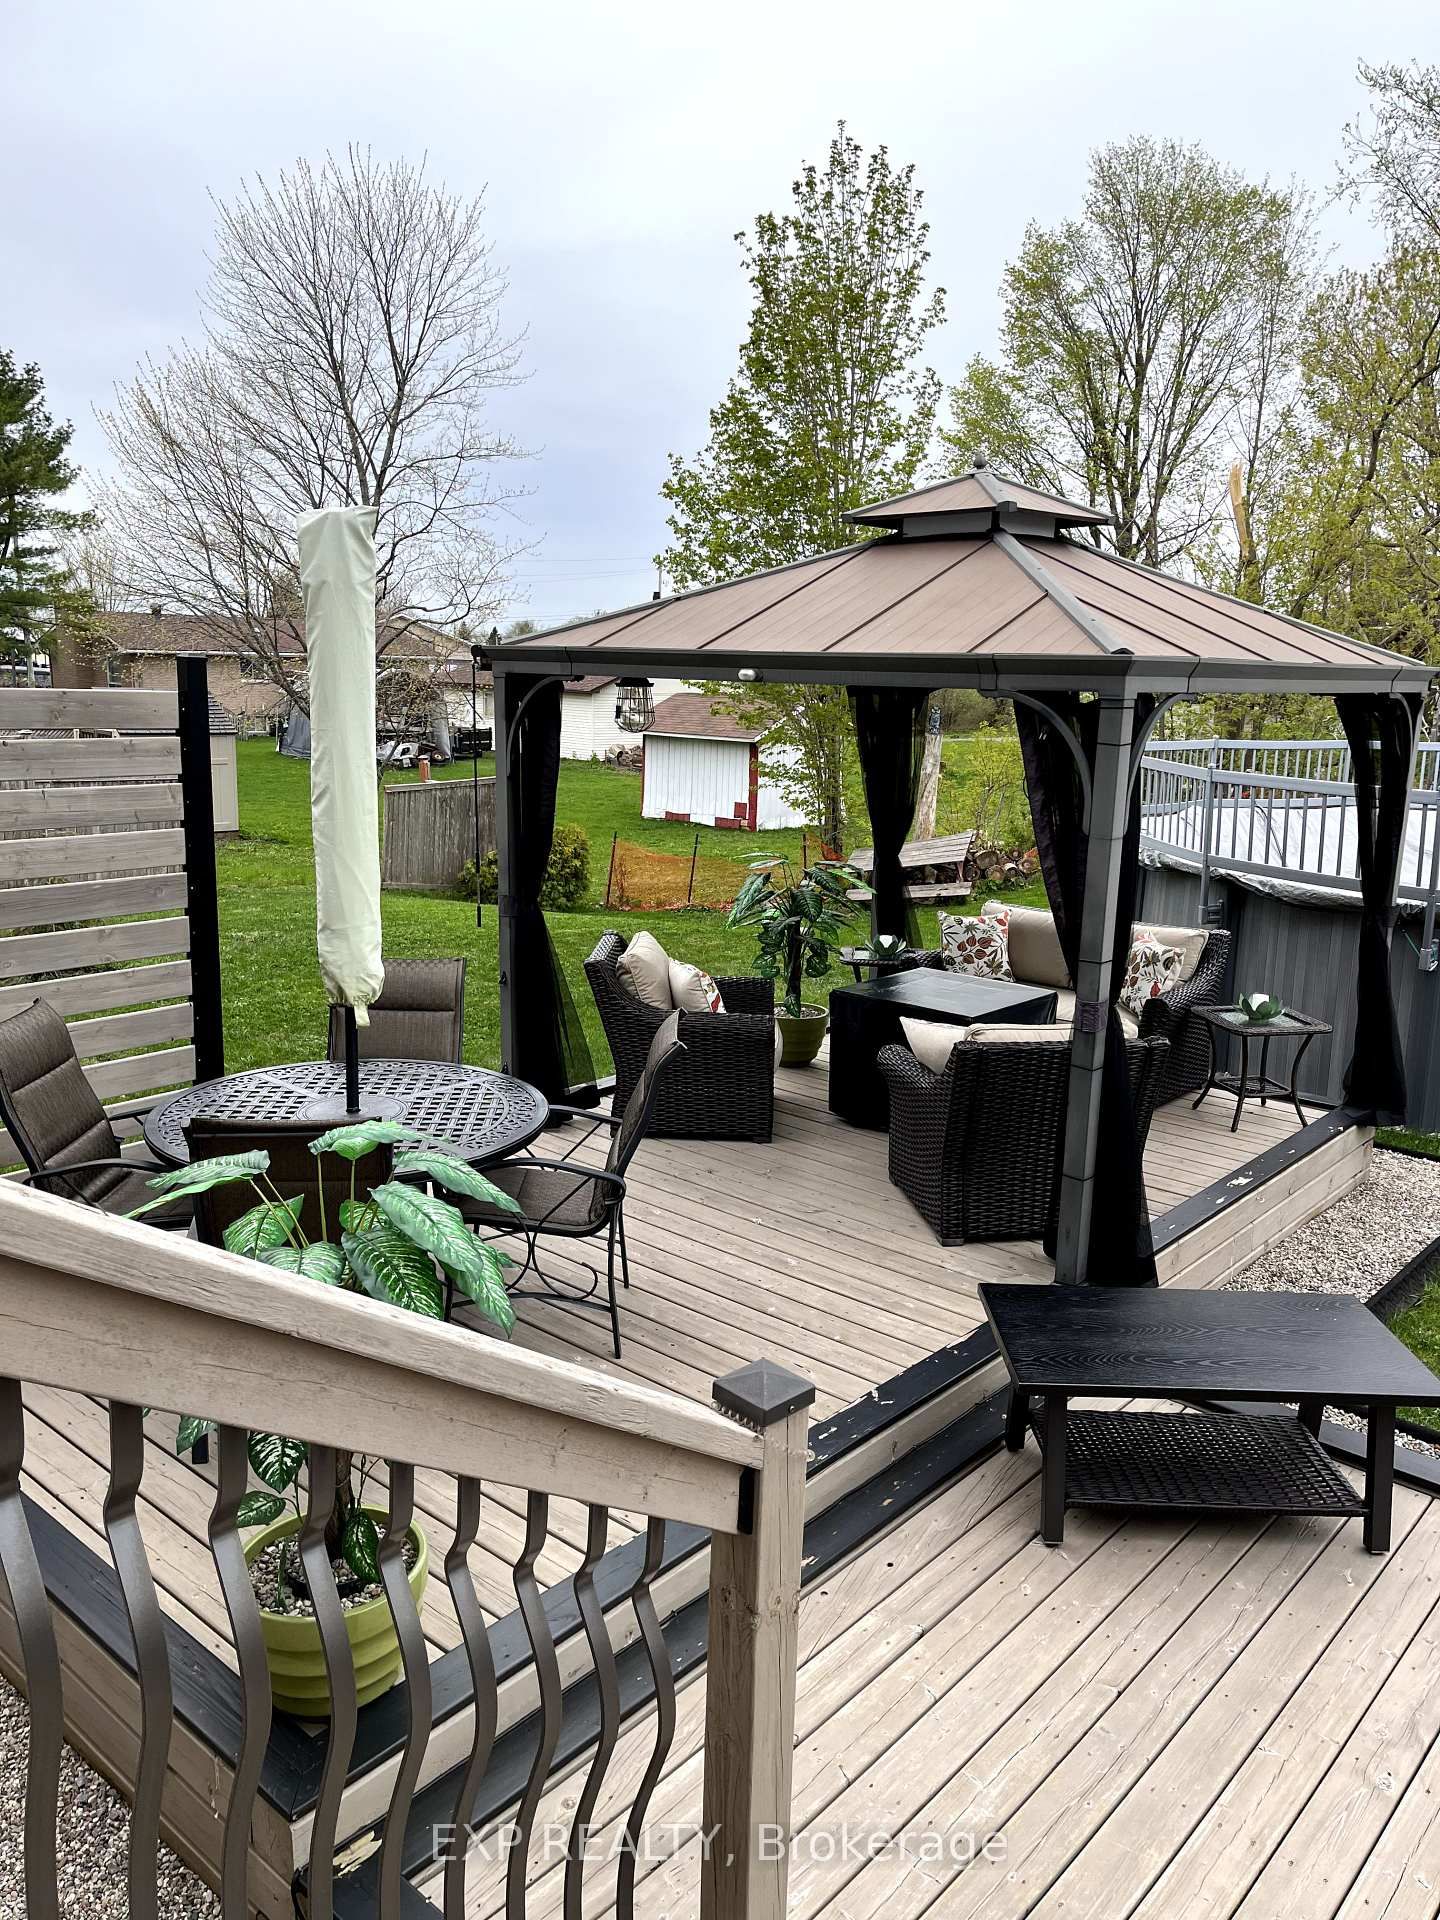
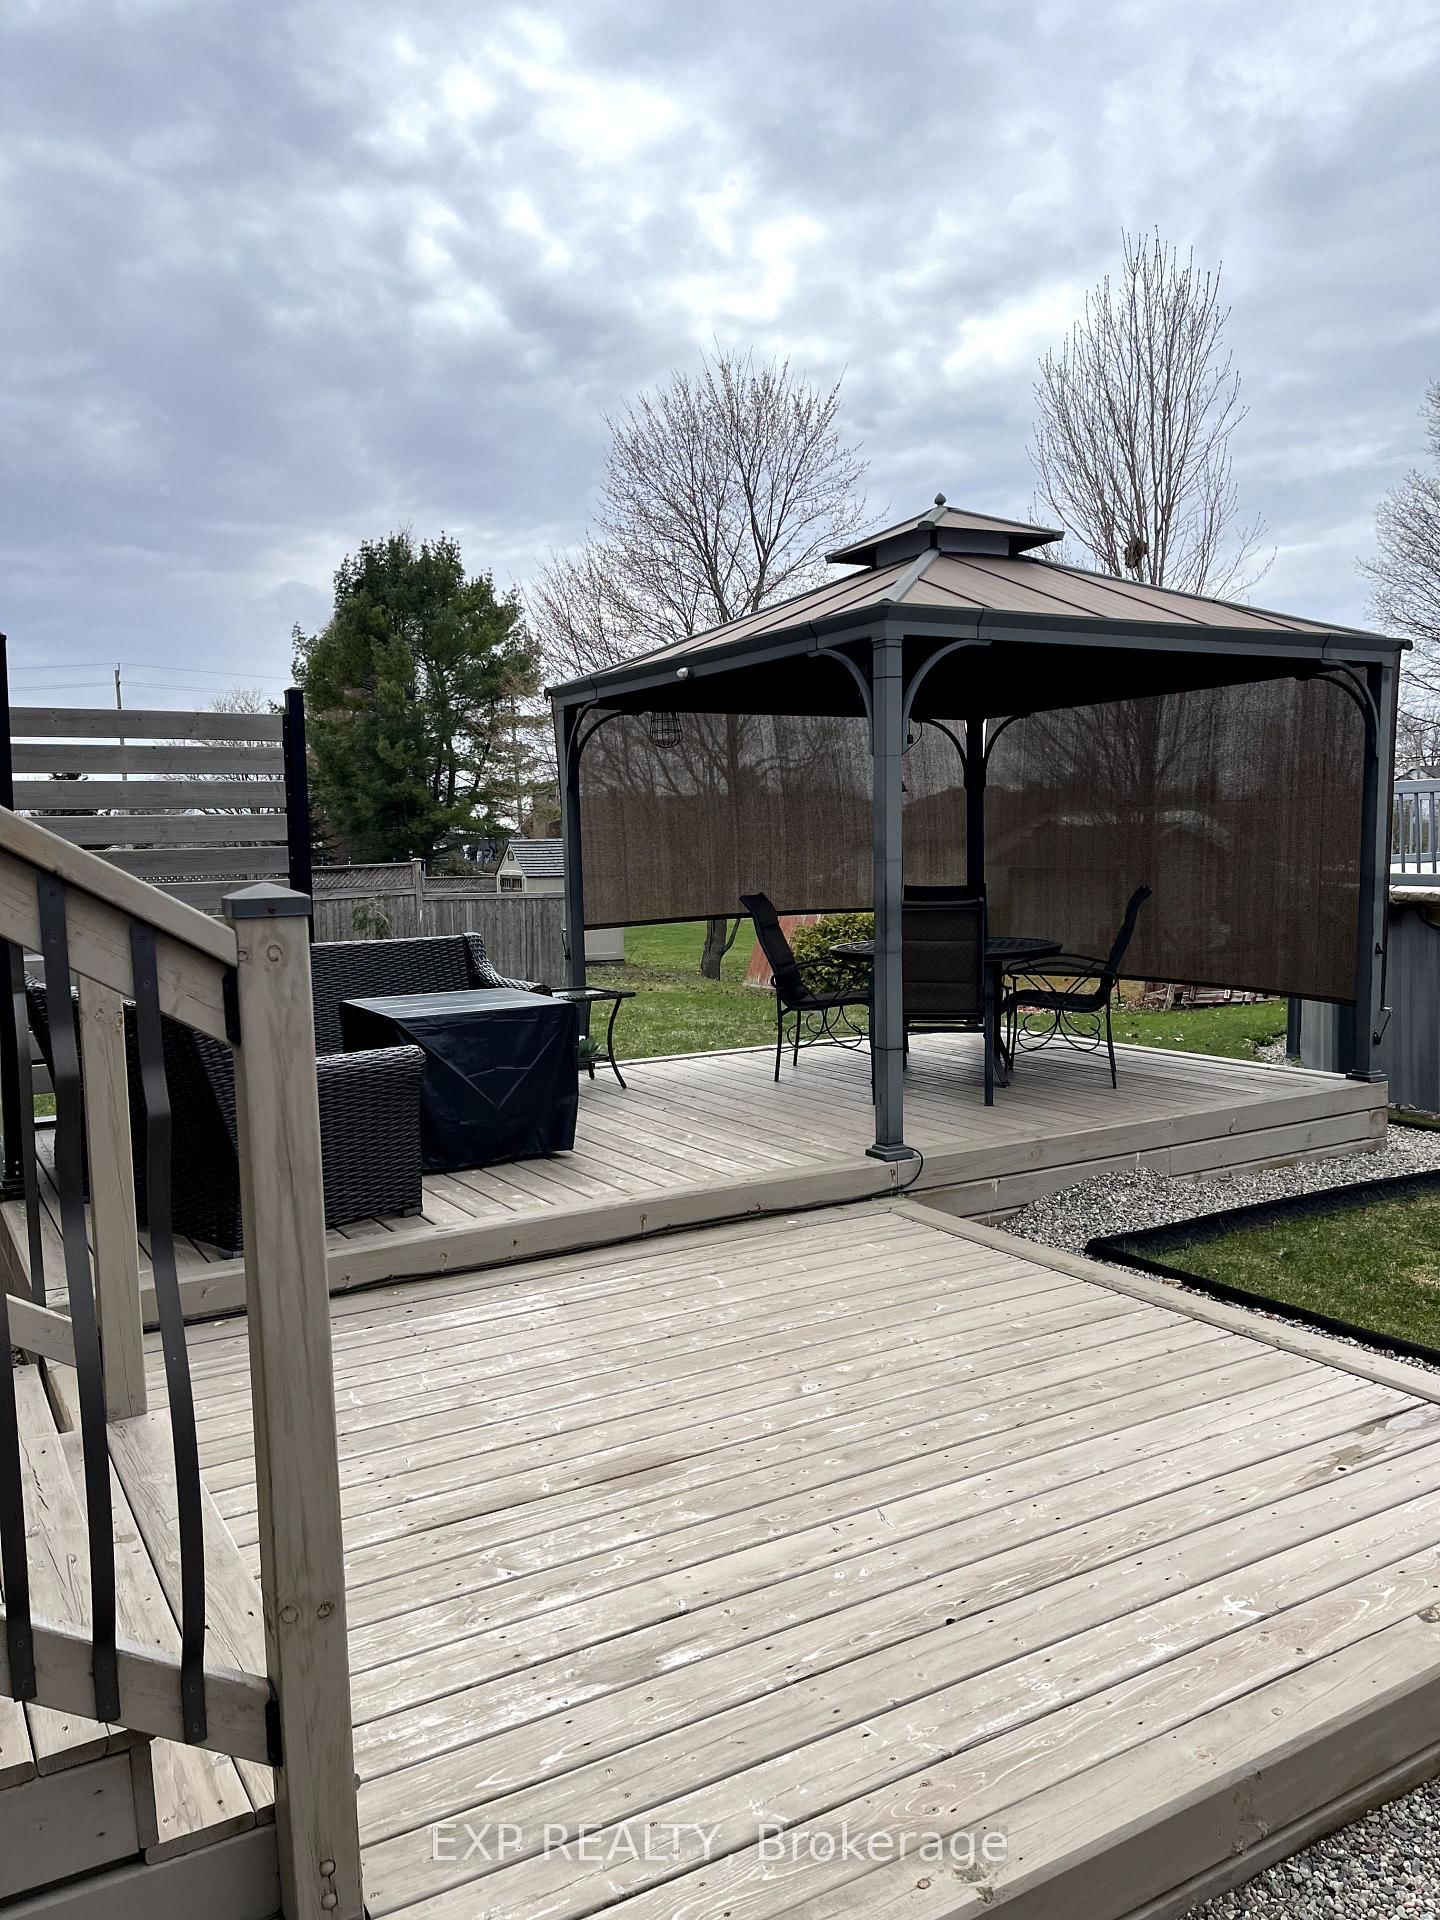
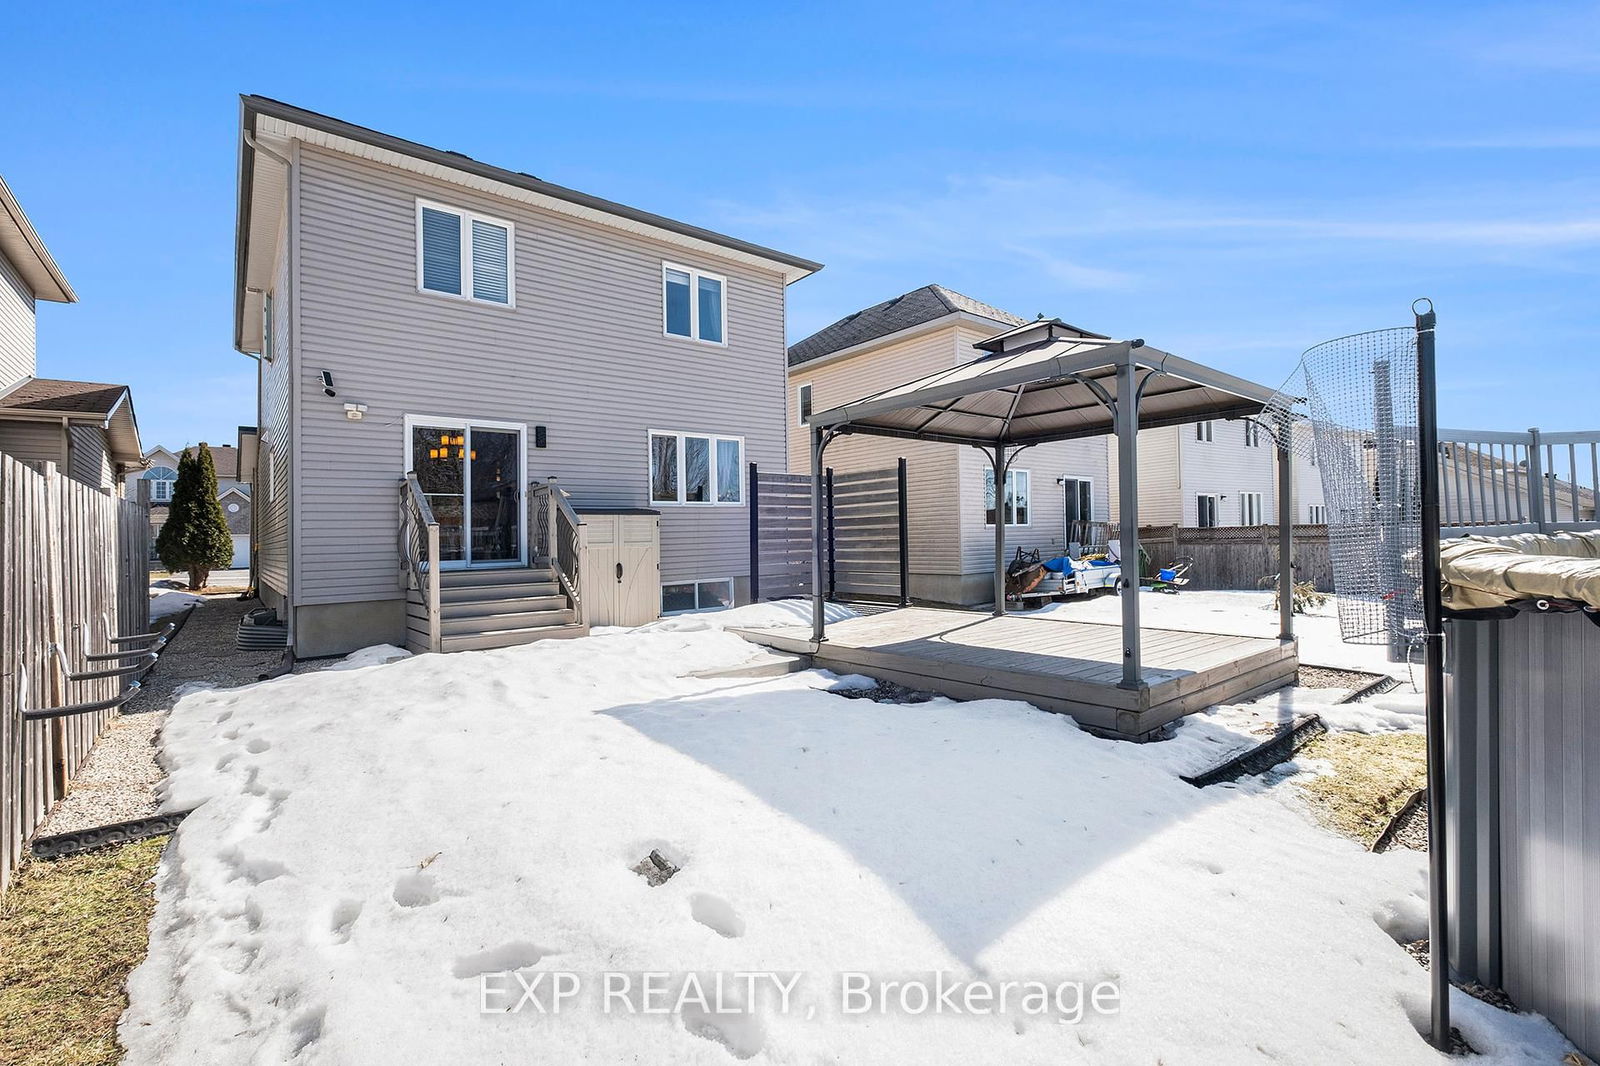
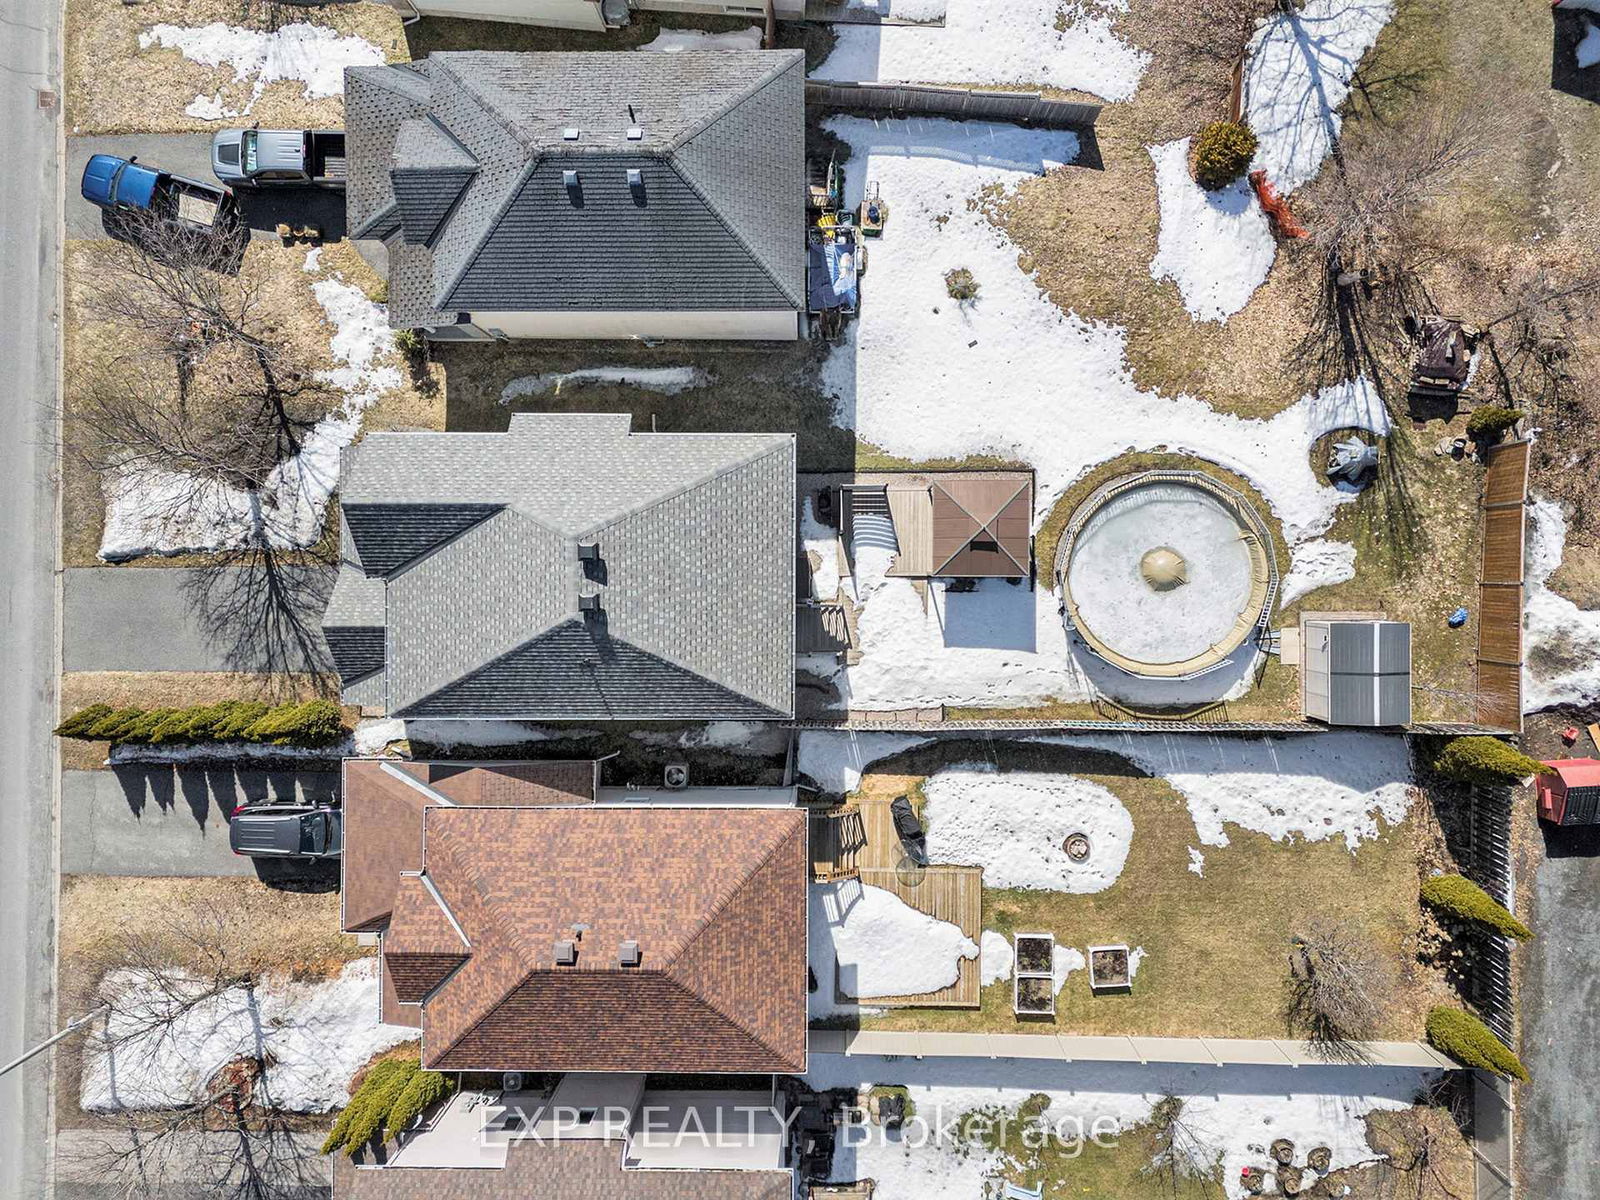
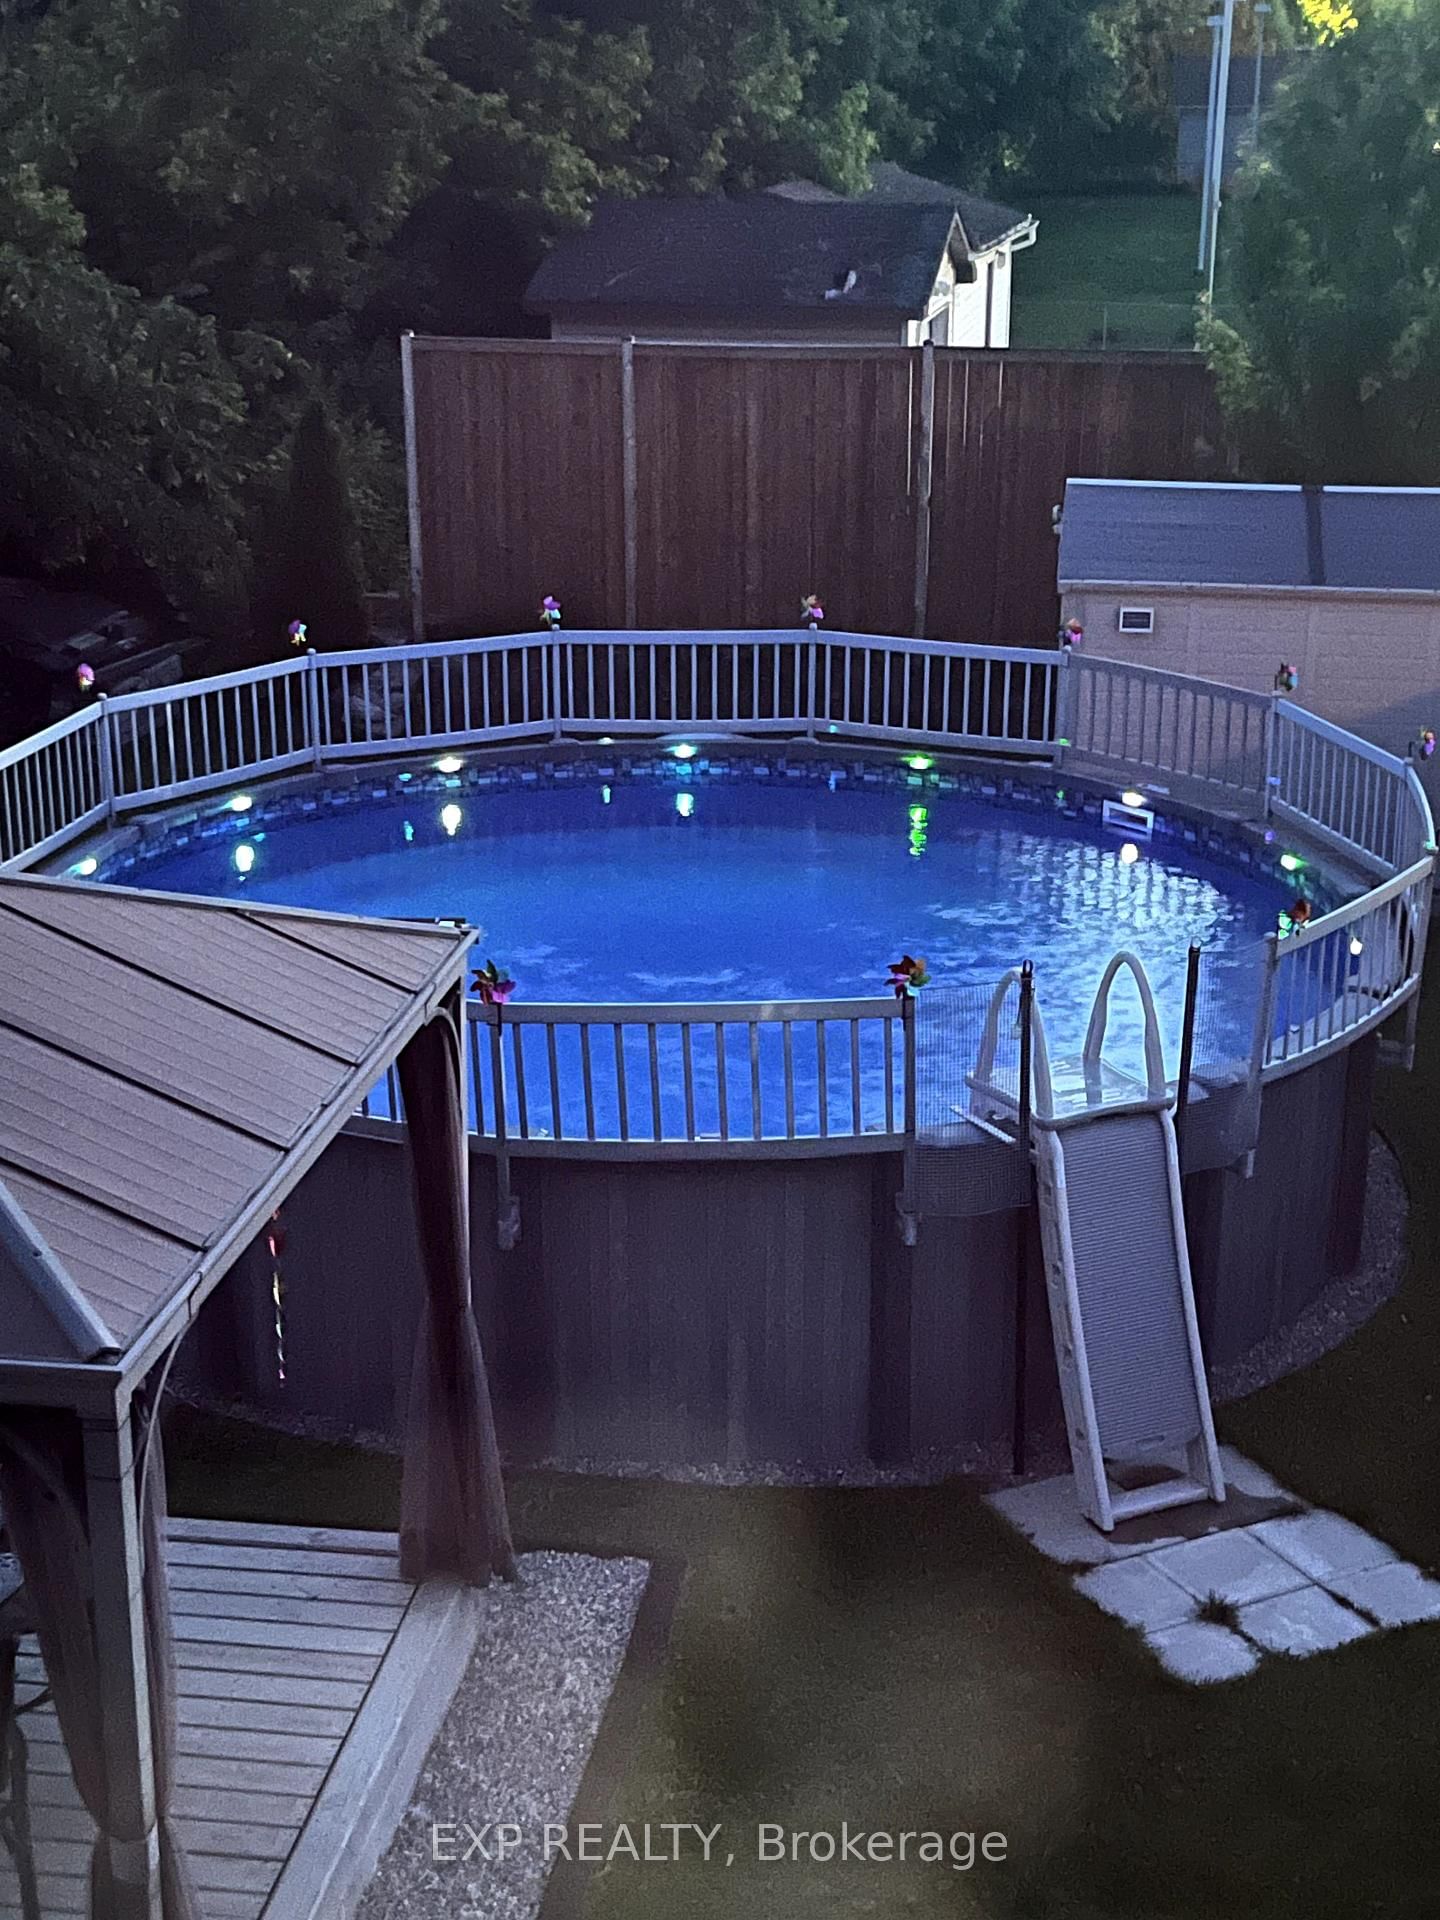
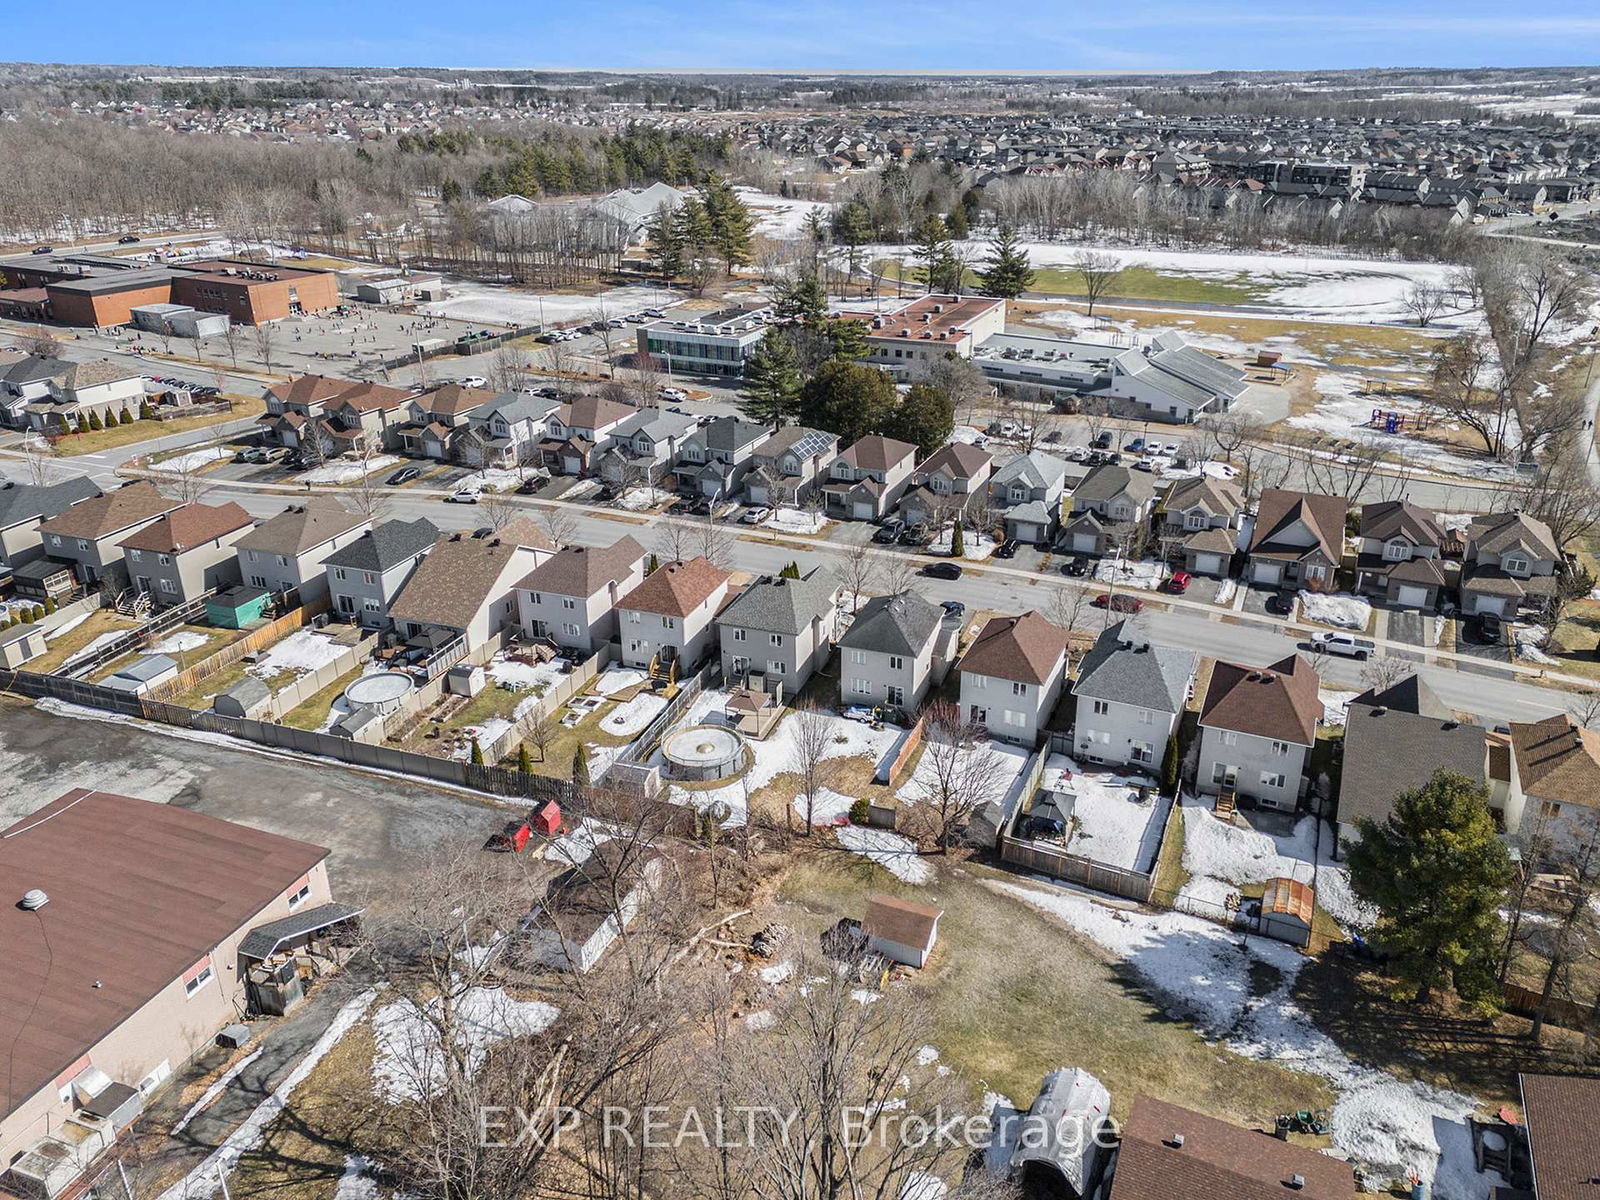
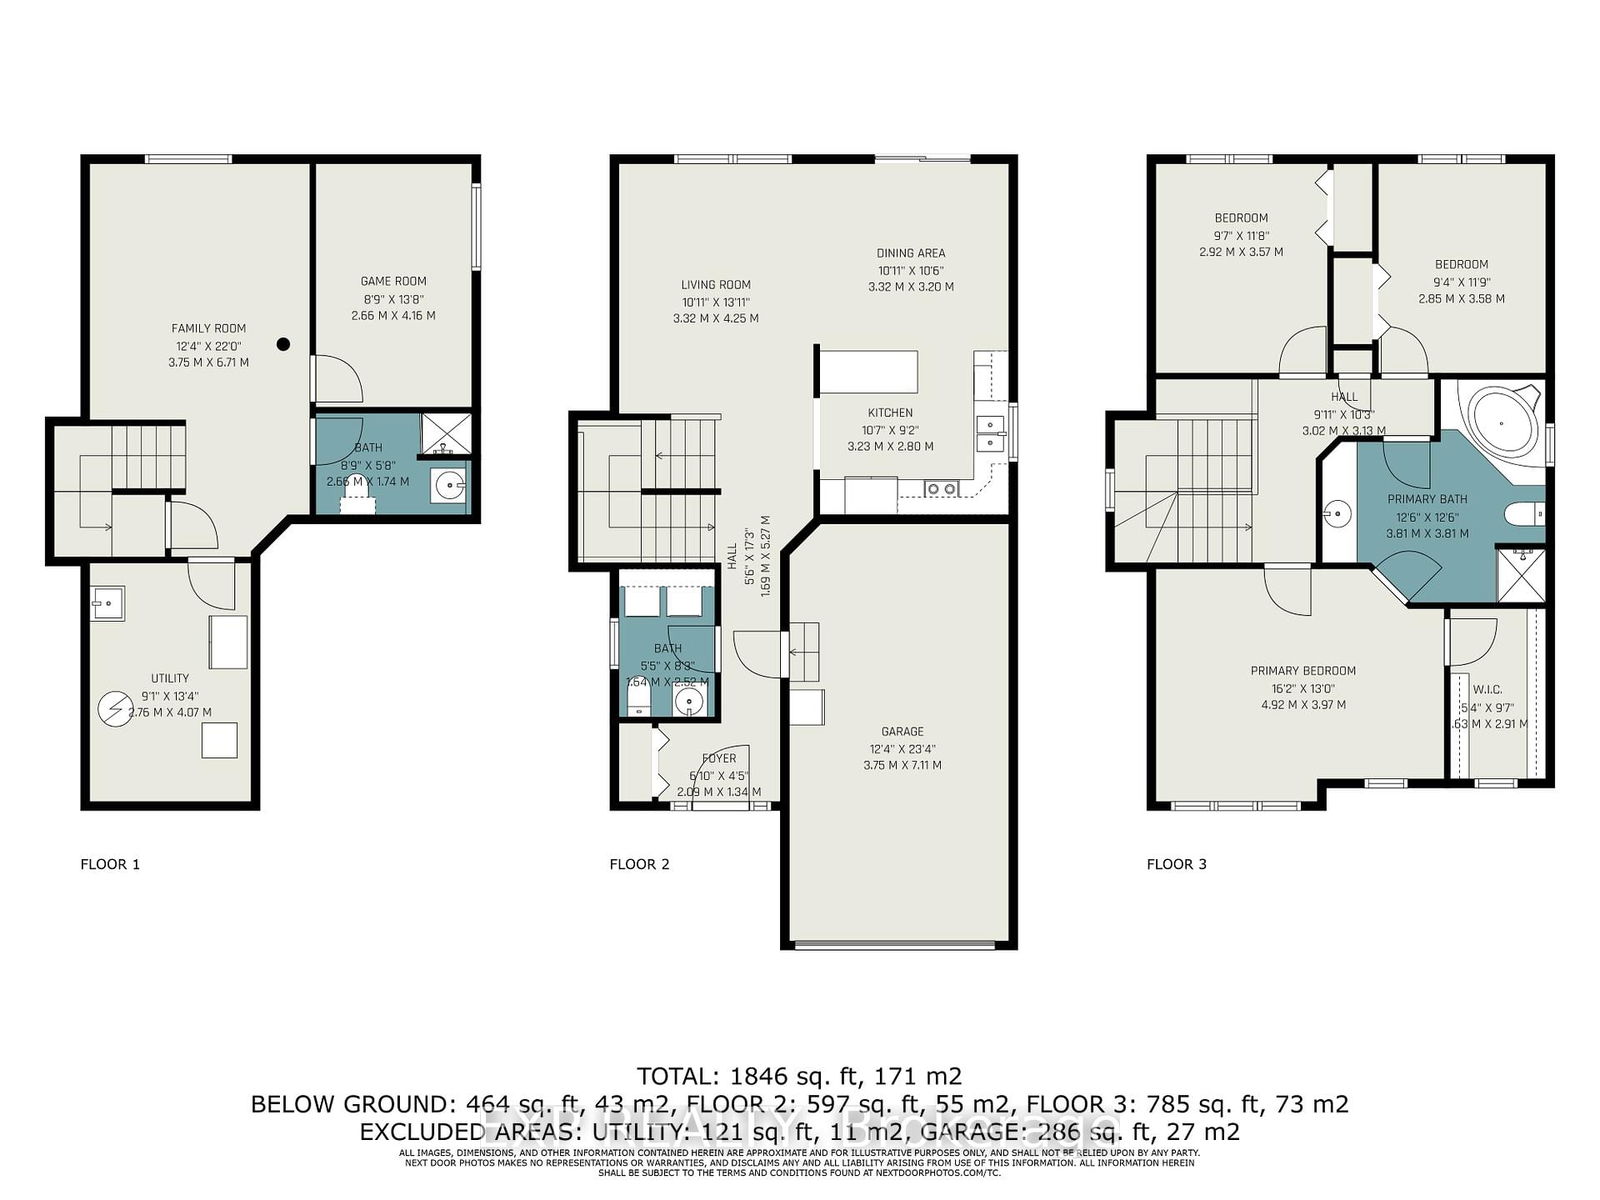
Welcome to 2115 Patricia Street a beautifully maintained 4-bed, 3-bath single-family home in the heart of Rockland, just 30 minutes from downtown Ottawa. With over 1,840 sq. ft. of finished living space, this move-in-ready gem offers the perfect blend of comfort, functionality, and style. The main floor features an open-concept layout with gleaming hardwood floors, an electric fireplace, and a spacious kitchen with ample cabinetry and counter space ideal for both daily living and entertaining. Enjoy seamless flow into the bright living and dining areas. Upstairs, you'll find three generous bedrooms, including a sun-filled primary with a large walk-in closet and a semi-ensuite featuring a soaker tub and walk-in shower. The fully finished basement offers a fourth bedroom, a full 3-piece bathroom with walk-in shower, and a versatile rec room. Outside, enjoy a private backyard oasis with a 300 sq. ft. deck, two sheds, and a 2020 ionized above-ground pool perfect for relaxing or hosting guests. Additional features include main-level laundry, two Eufy security cameras, a second freezer, a hideaway screen door, a Gazebo, and more! Located near bilingual schools, parks, shopping, and the Ottawa River, this home combines small-town charm with city convenience. A must-see for families looking for space, style, and a welcoming community!
Dishwasher, Dryer, Freezer (in basement), Microwave/Hood Fan, Refrigerator, Stove, Washer, Window Blinds, Drapes & Drapery Tracks (except primary bedroom), Automatic Garage Door Opener, Two Sheds , Electric Fire Place, and Gazebo.
Foyer
Powder Rm
Living
Dining
Kitchen
Primary
2nd Br
3rd Br
Bathroom
4th Br
Family
Bathroom
Utility
The graph below compares the average list price and average sale price of homes in this neighborhood by month for the last 24 months. When average sale price is greater than average list price, this may suggest a buyer's market. When average sale price is lower than the average list price this may suggest a seller's market.
The graph below illustrates the average days on market for homes in this neighborhood. The yellow area may indicate a buyer's market, the green area may indicate a balanced market and the red area may indicate a seller's market.
Sales Representative, Century 21 People’s Choice Realty Inc., Brokerage
(647) 576 - 2100