

Century 21 People’s Choice Realty Inc., Brokerage
120 MATHESON BLVD E #103
MISSISSAUGA, Ontario
L4Z 1X1

Carp, Huntley Ward (South East), K0A 1L0
$599,000
Listed by ROYAL LEPAGE TEAM REALTY.
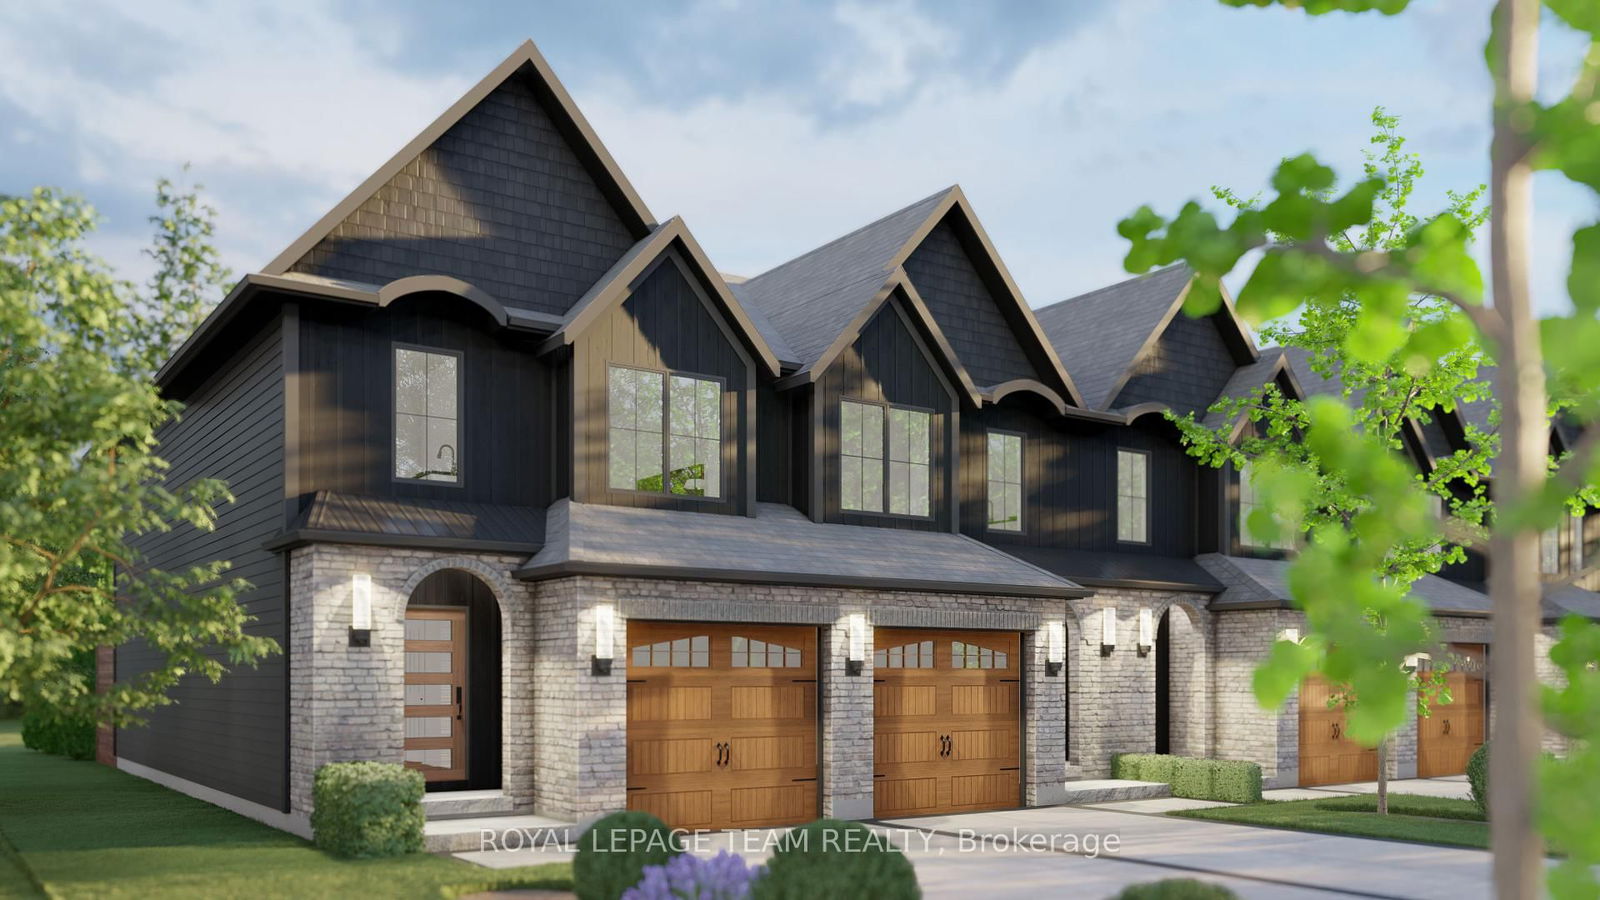
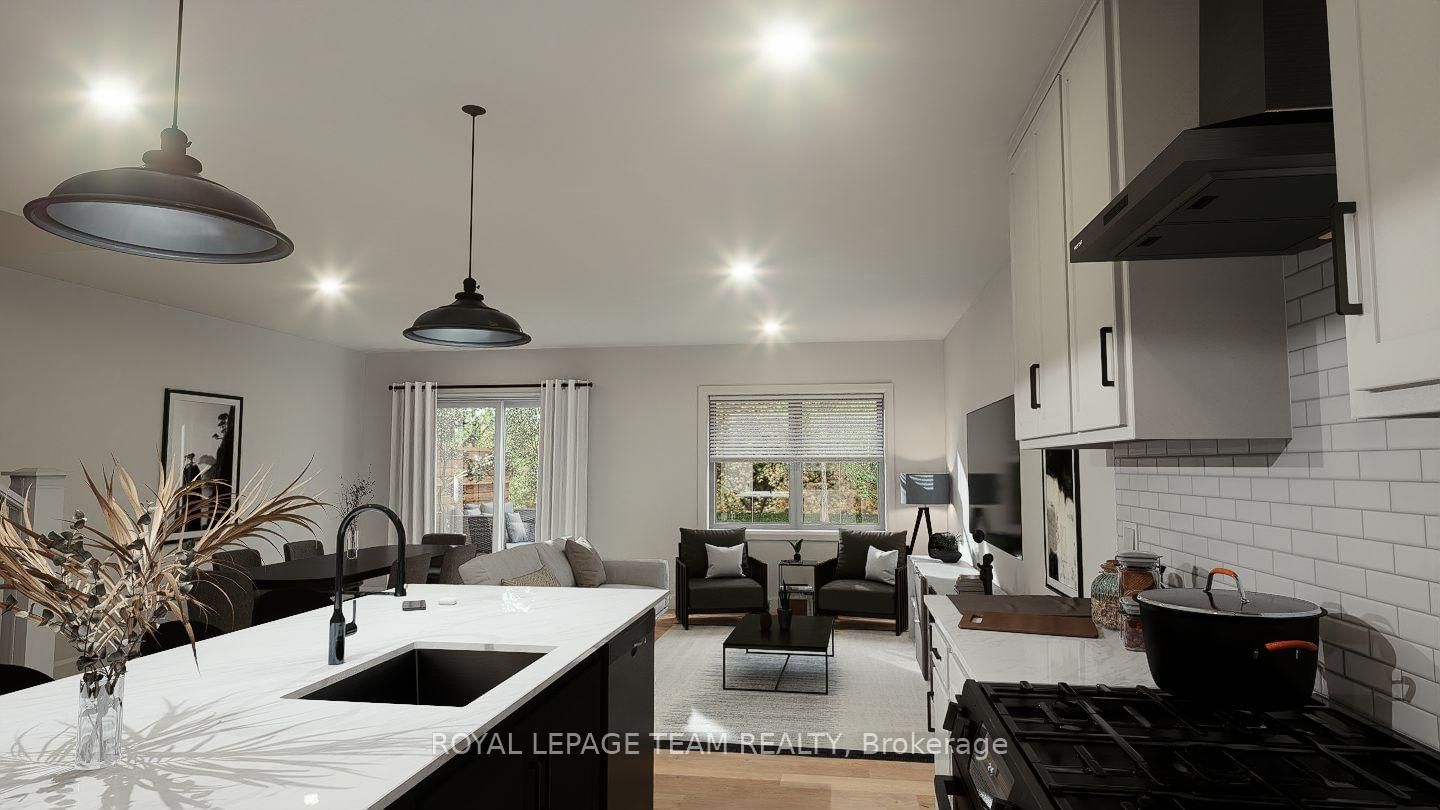
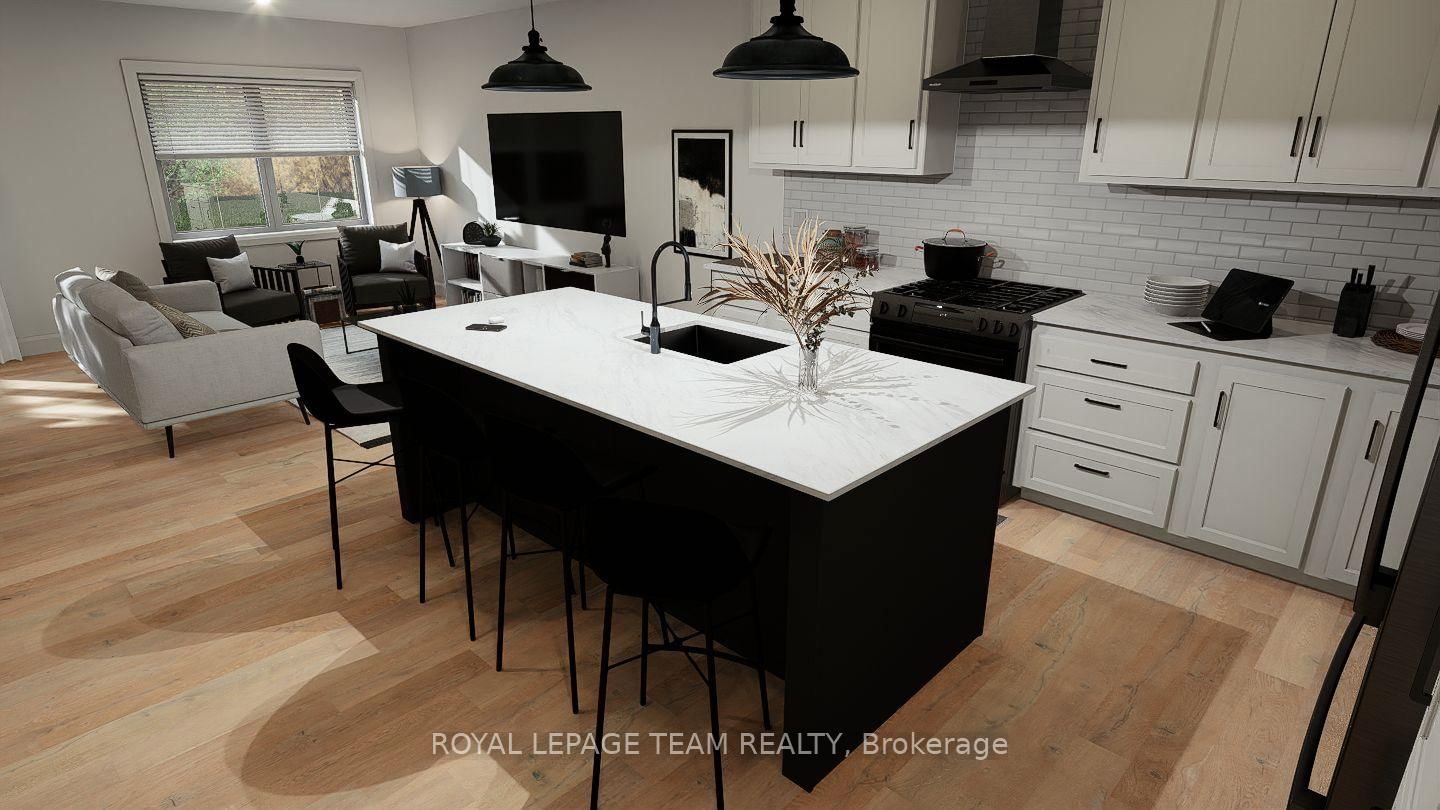
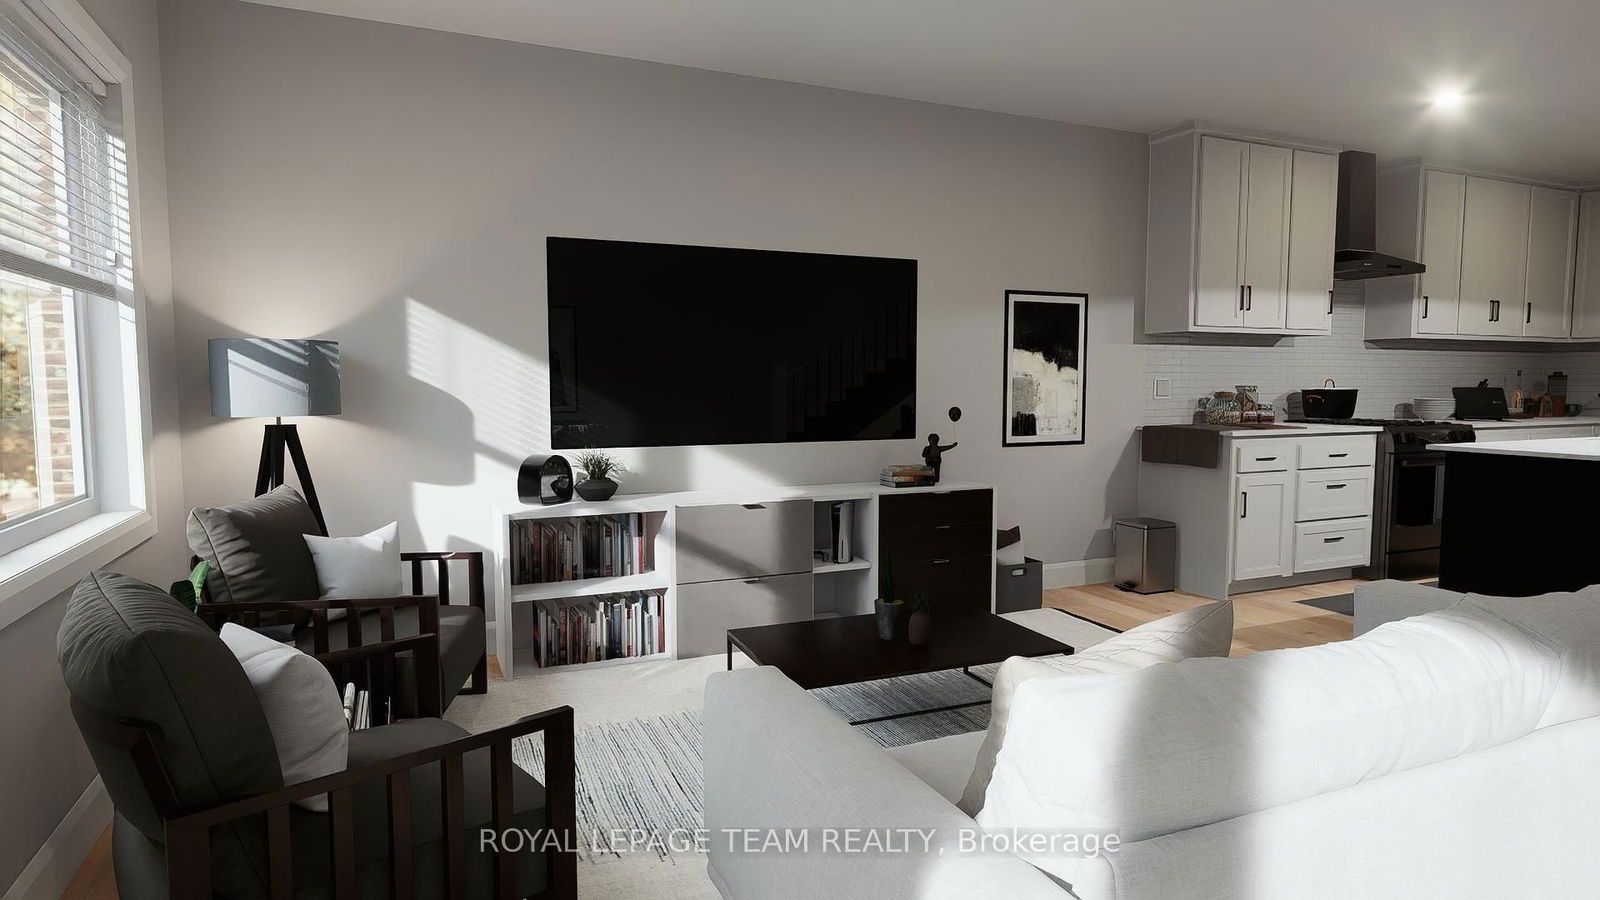
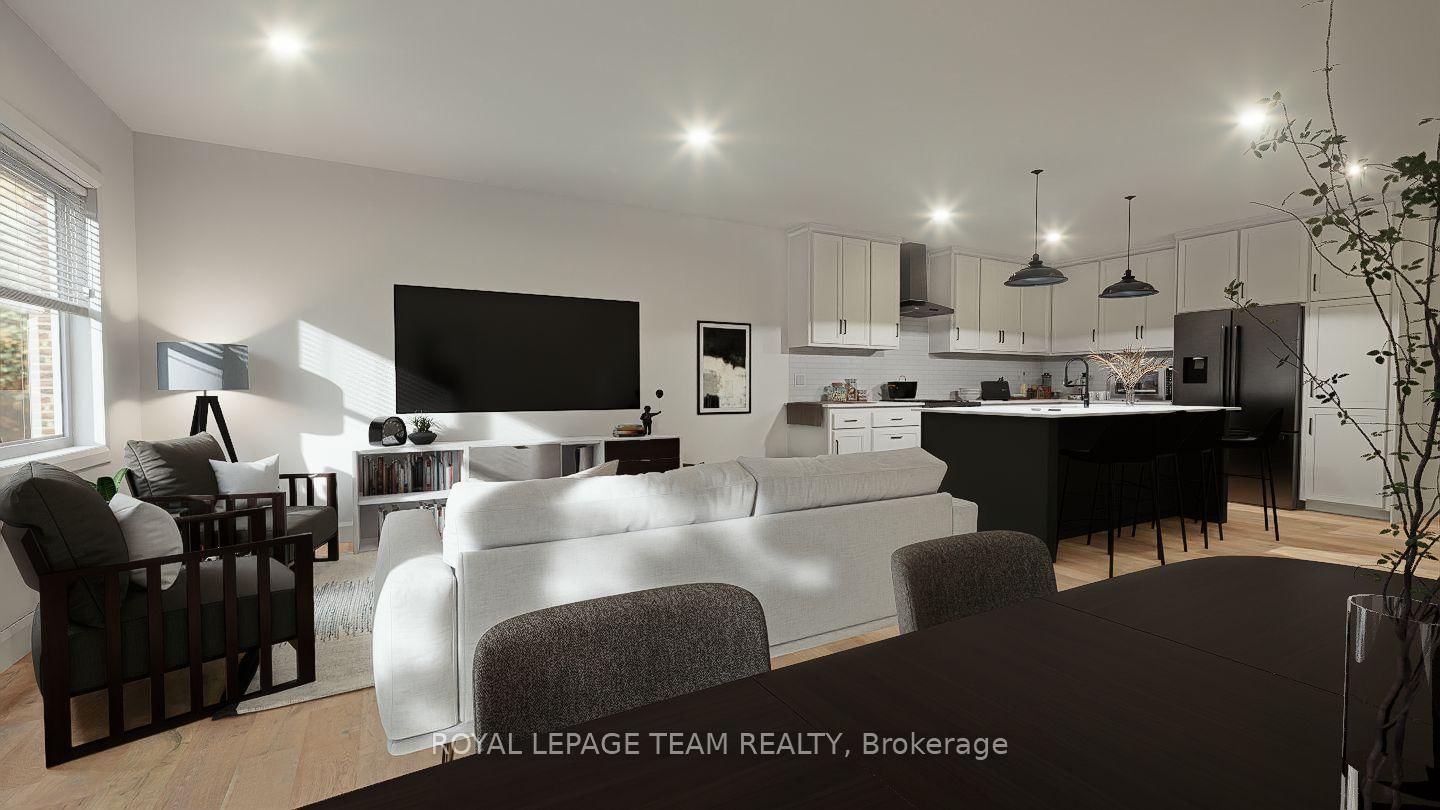
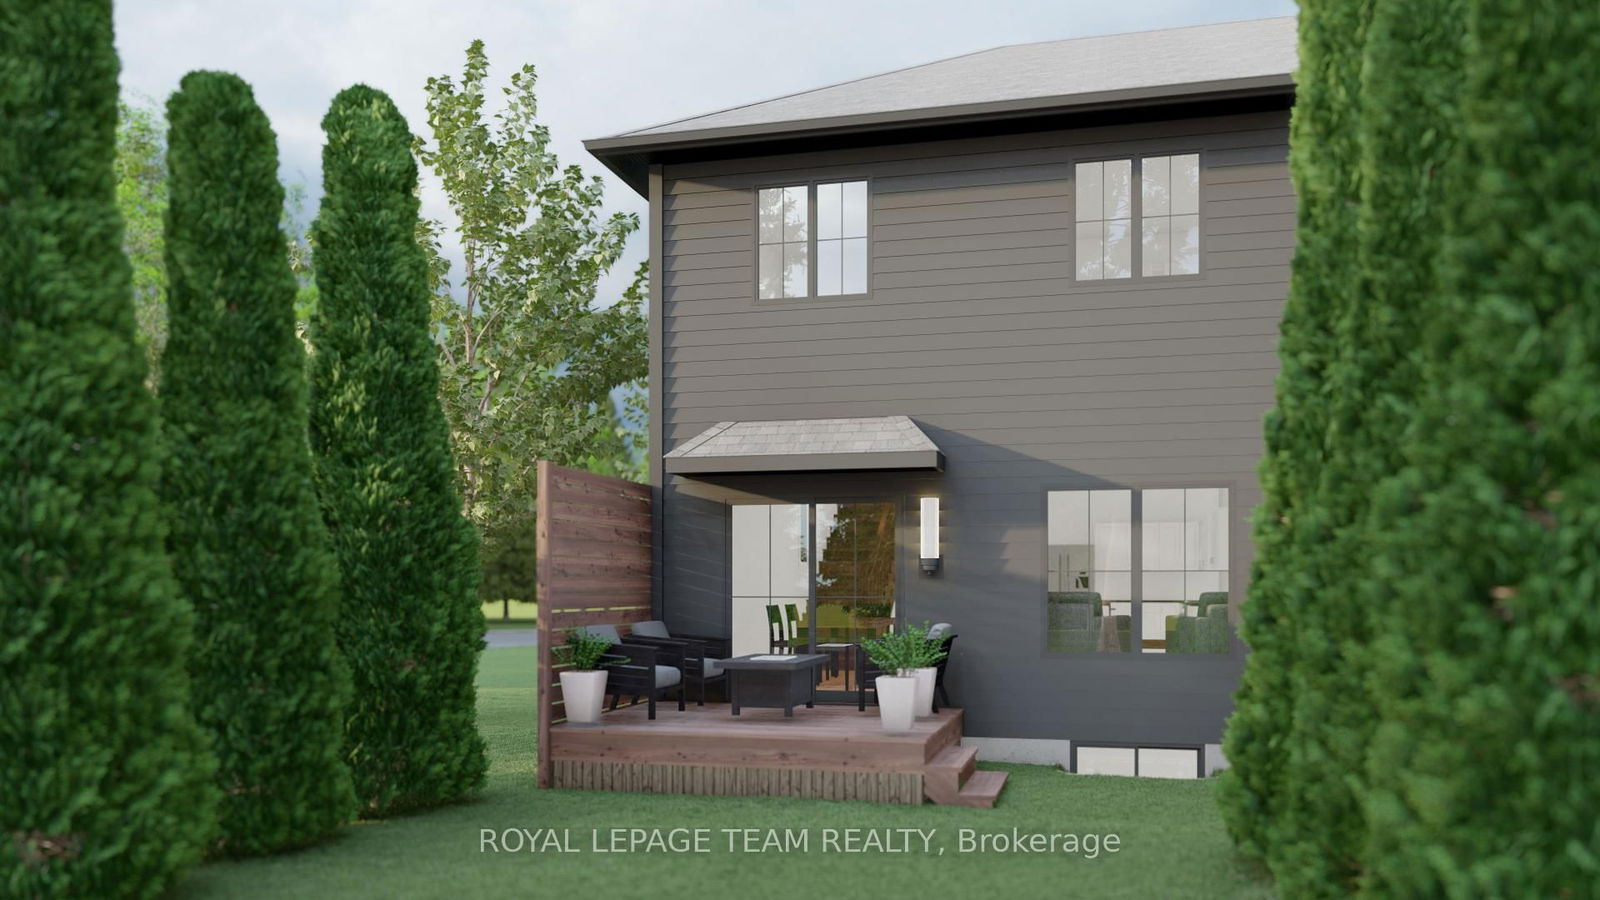
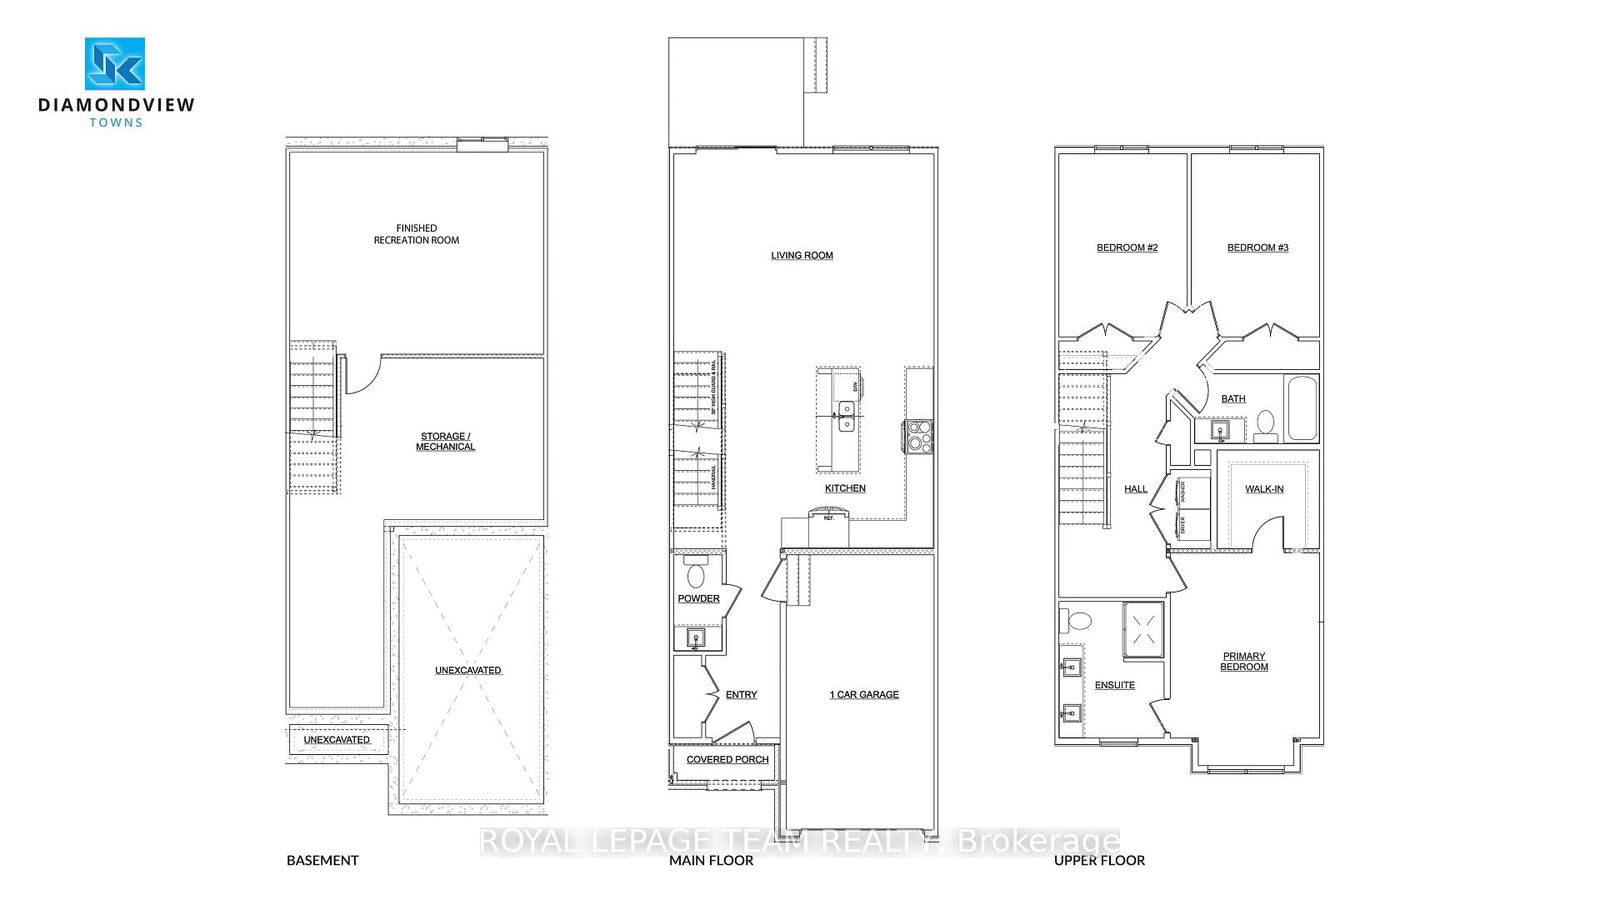
WOW - AMAZING VALUE! Act Now! 2024 pricing still in effect! + FREE Kitchen Appliances! Executive town radiating curb appeal & exquisite design, on an extra deep lot. Their high-end, standard features set them apart. Exterior: Genuine wood siding on front exterior w/ metal roof accent, wood inspired garage door, arched entry way, 10x 8 deck off rear + eavesthroughing! Inside: Finished recroom incl. in price along w/ 9' ceilings & high-end textured vinyl floors on main, designer kitchen w/ huge centre island, extended height cabinetry, backsplash & quartz counters, pot lights & soft-close cabinetry throughout! The 2nd floor laundry adds convenience, while the large primary walk-in closet delights. Rare community amenities incl. walking trails, 1st class community center w/ sport courts (pickleball & basketball), playground, covered picnic area & washrooms! Lower property taxes & water bills make this locale even more appealing. Experience community, comfort & rural charm mere minutes from the quaint village of Carp & HWY for easy access to Ottawa's urban areas. Whether for yourself or as an investment, Sheldon Creek Homes in Diamondview Estates offers a truly exceptional opportunity! Don't miss out - Sheldon Creek Homes, the newest addition to Diamondview Estates! With 20 years of residential experience in Orangeville, ON, their presence in Carp marks an exciting new chapter of modern living in rural Ottawa. Sales Centre @ Carp Airport Terminal by appointment - on Thomas Argue Rd, off March Rd. *End unit also available.
Stove, Refrigerator, Dishwasher, Hood Fan
Foyer
Kitchen
Living
Bathroom
Primary
Bathroom
2nd Br
3rd Br
Bathroom
Laundry
Rec
The graph below compares the average list price and average sale price of homes in this neighborhood by month for the last 24 months. When average sale price is greater than average list price, this may suggest a buyer's market. When average sale price is lower than the average list price this may suggest a seller's market.
The graph below illustrates the average days on market for homes in this neighborhood. The yellow area may indicate a buyer's market, the green area may indicate a balanced market and the red area may indicate a seller's market.
Sales Representative, Century 21 People’s Choice Realty Inc., Brokerage
(647) 576 - 2100
Carp, Huntley Ward (South East), K0A 1L0