Century 21 People’s Choice Realty Inc., Brokerage
120 MATHESON BLVD E #103
MISSISSAUGA, Ontario
L4K 0A4


Carp - Huntley Ward, 9101 - Carp, K0A 1L0
$789,900
Listed by INNOVATION REALTY LTD..
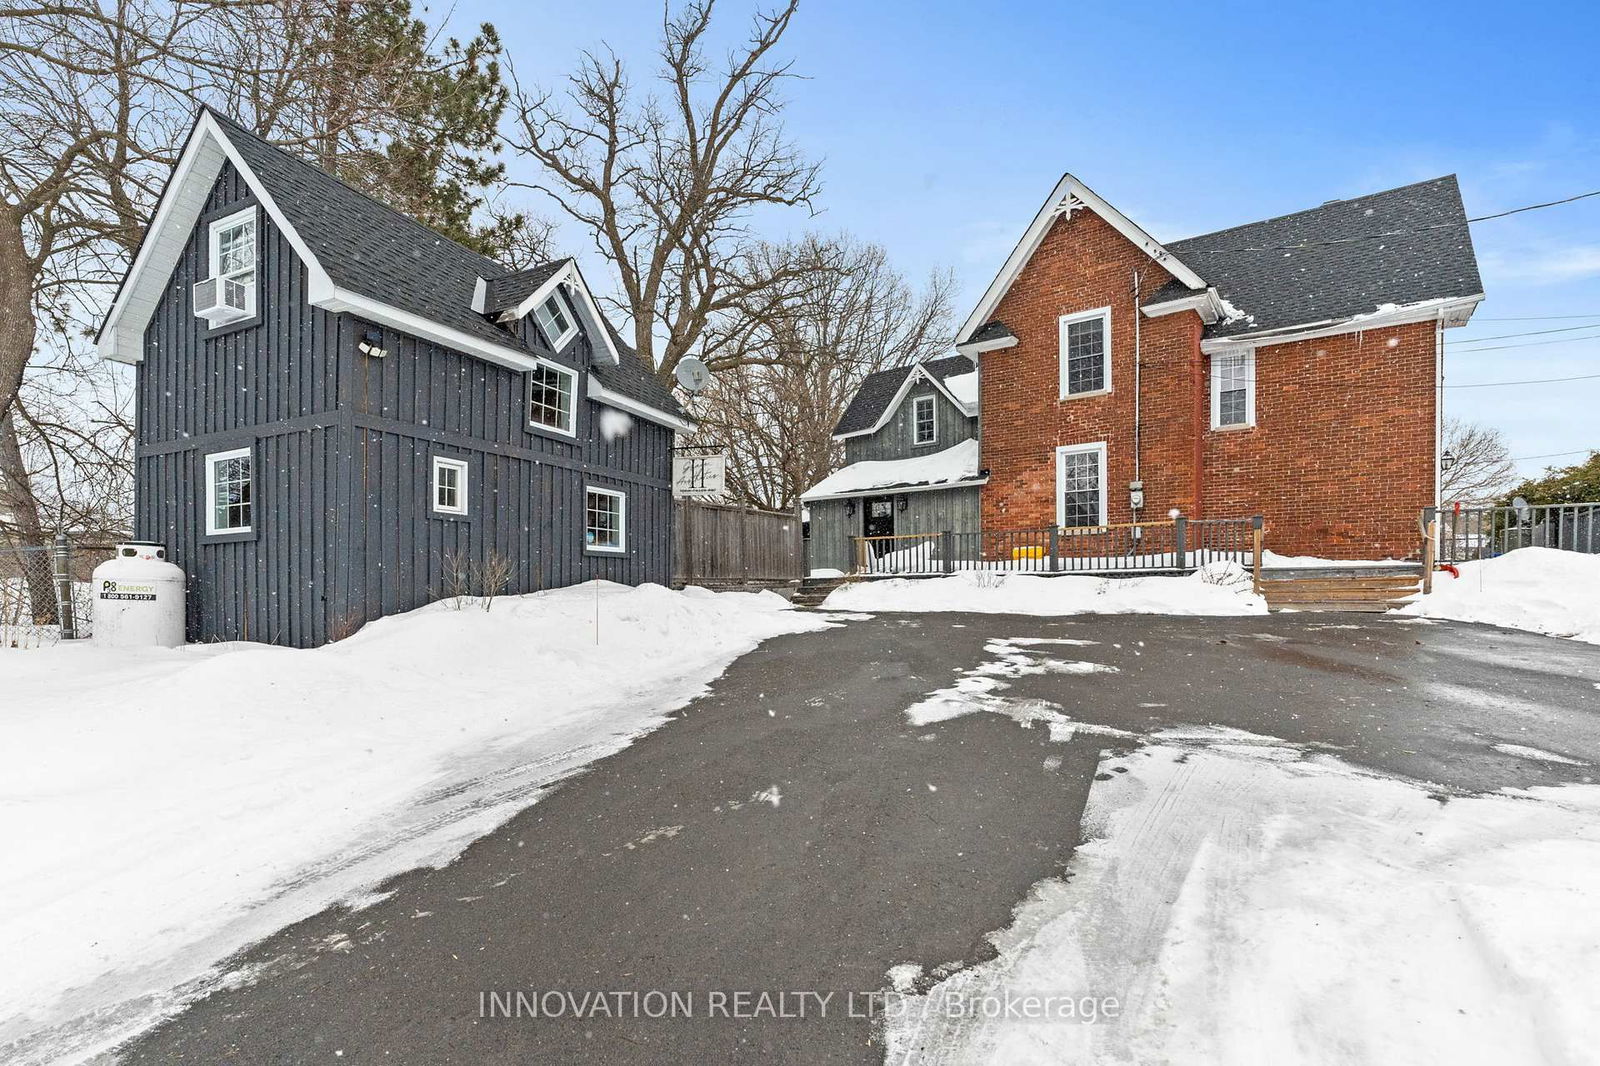
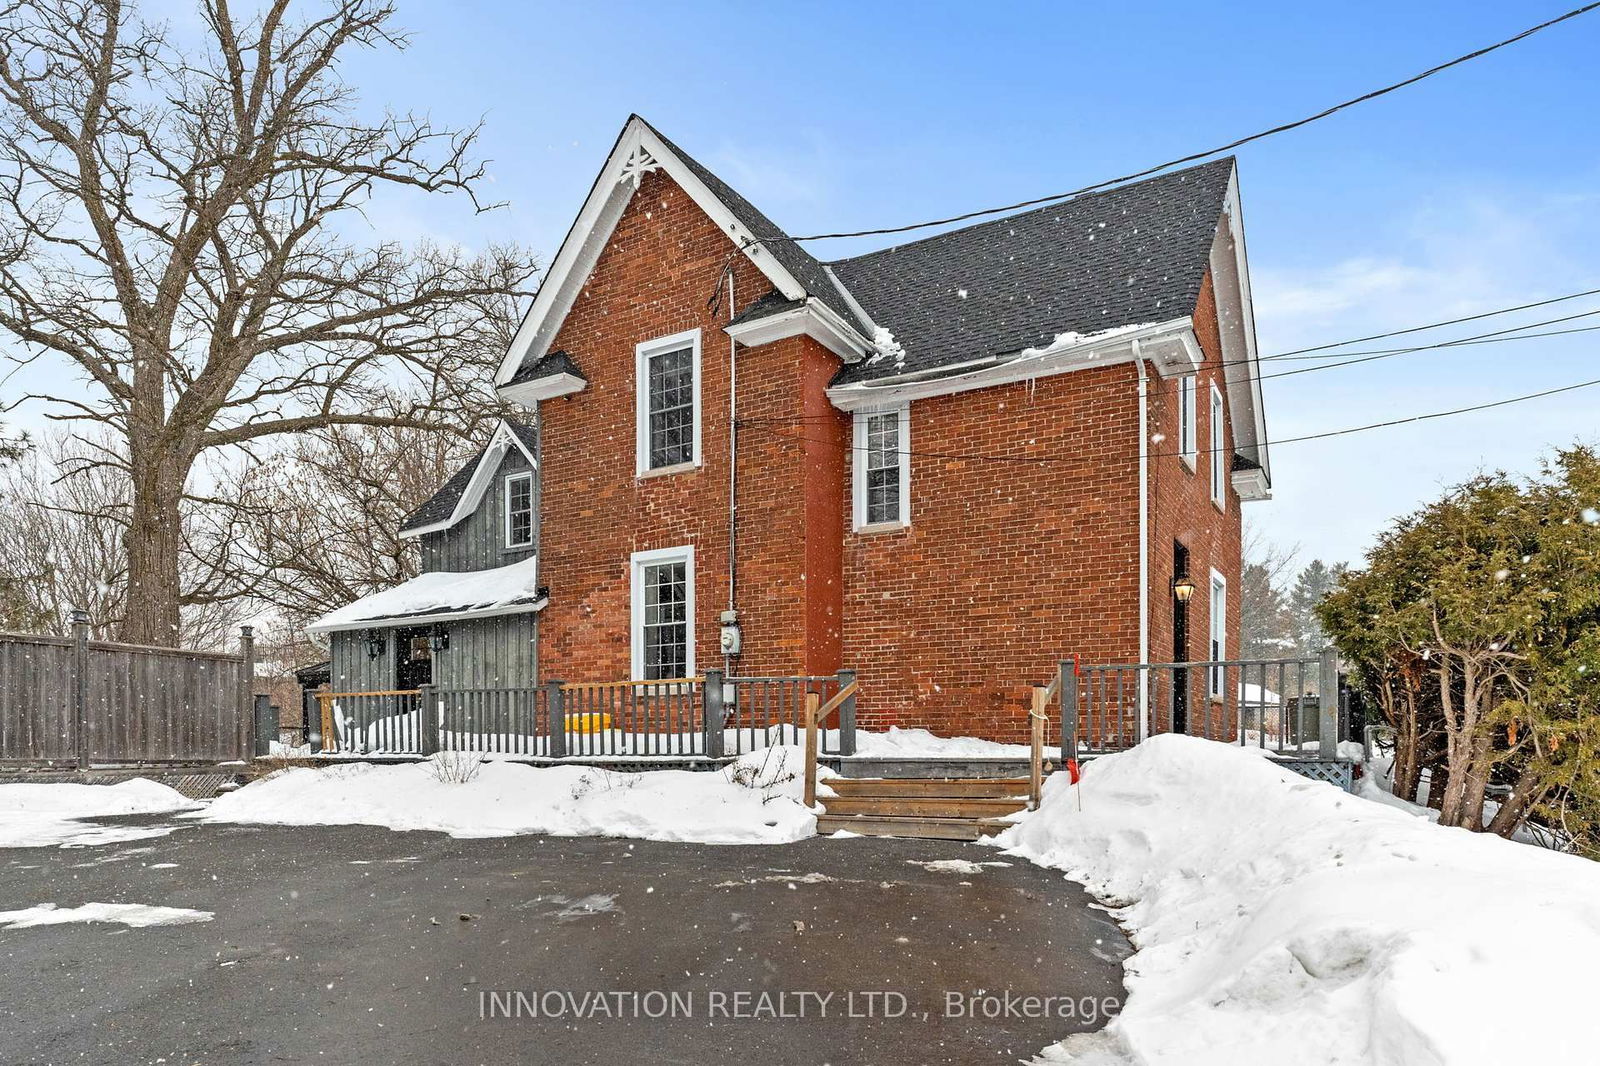
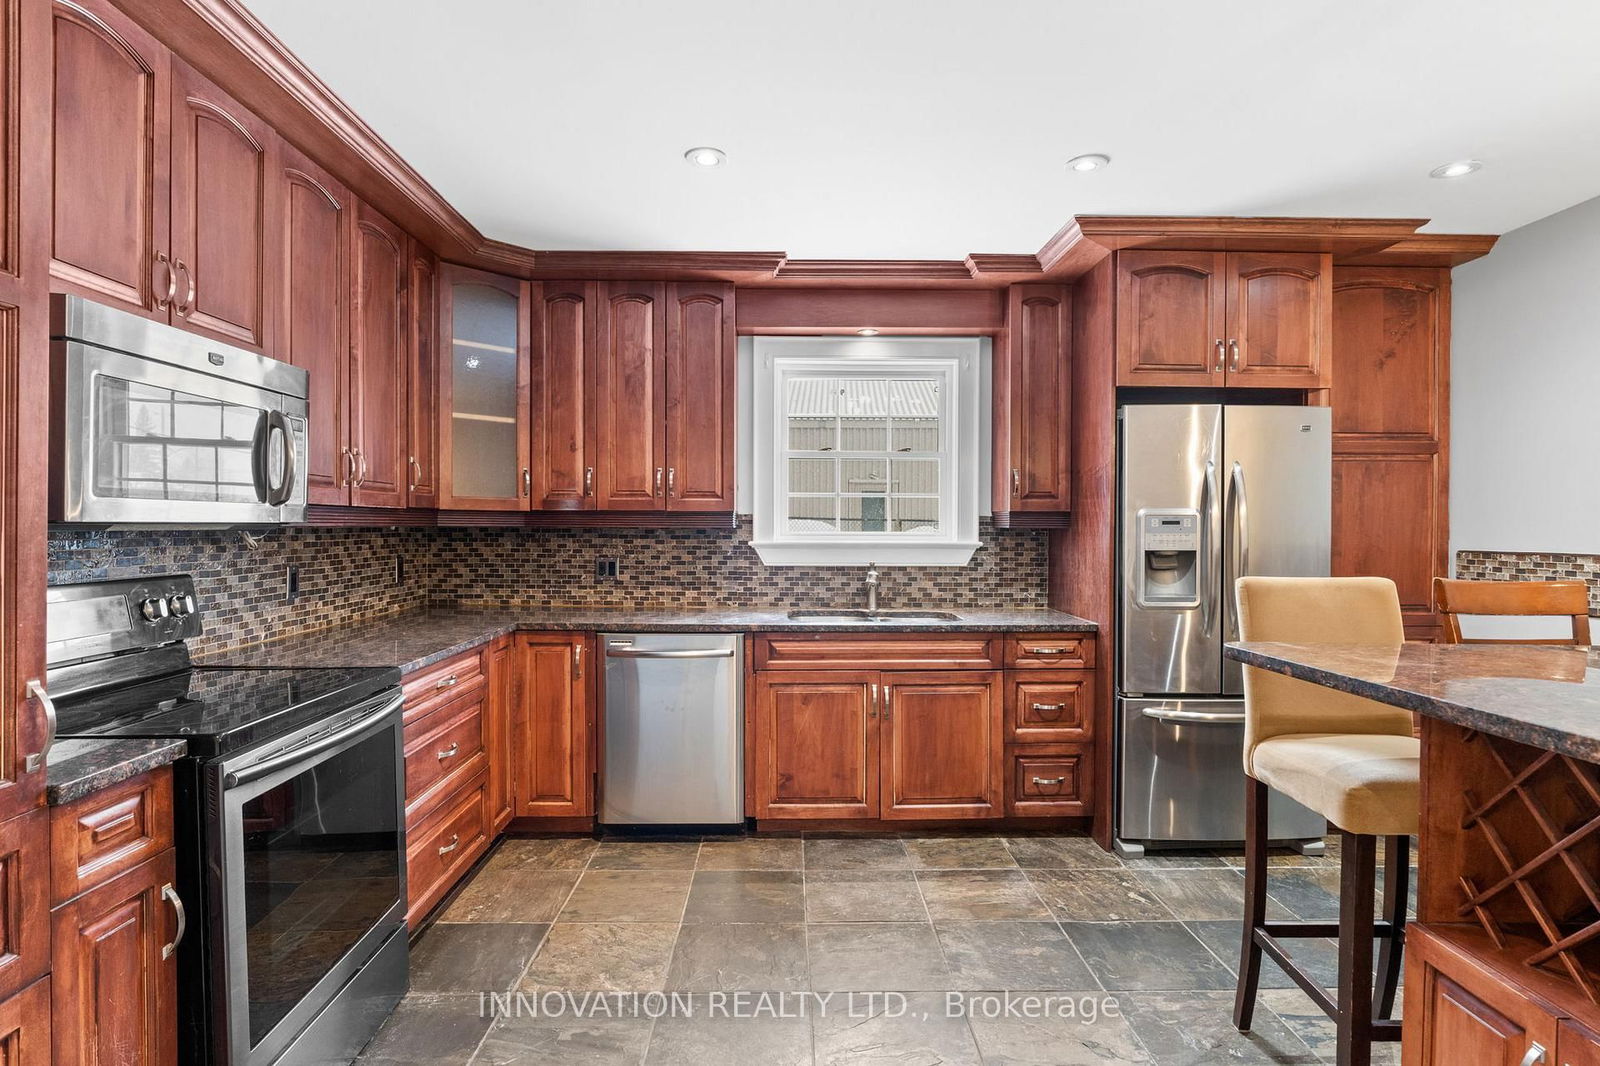
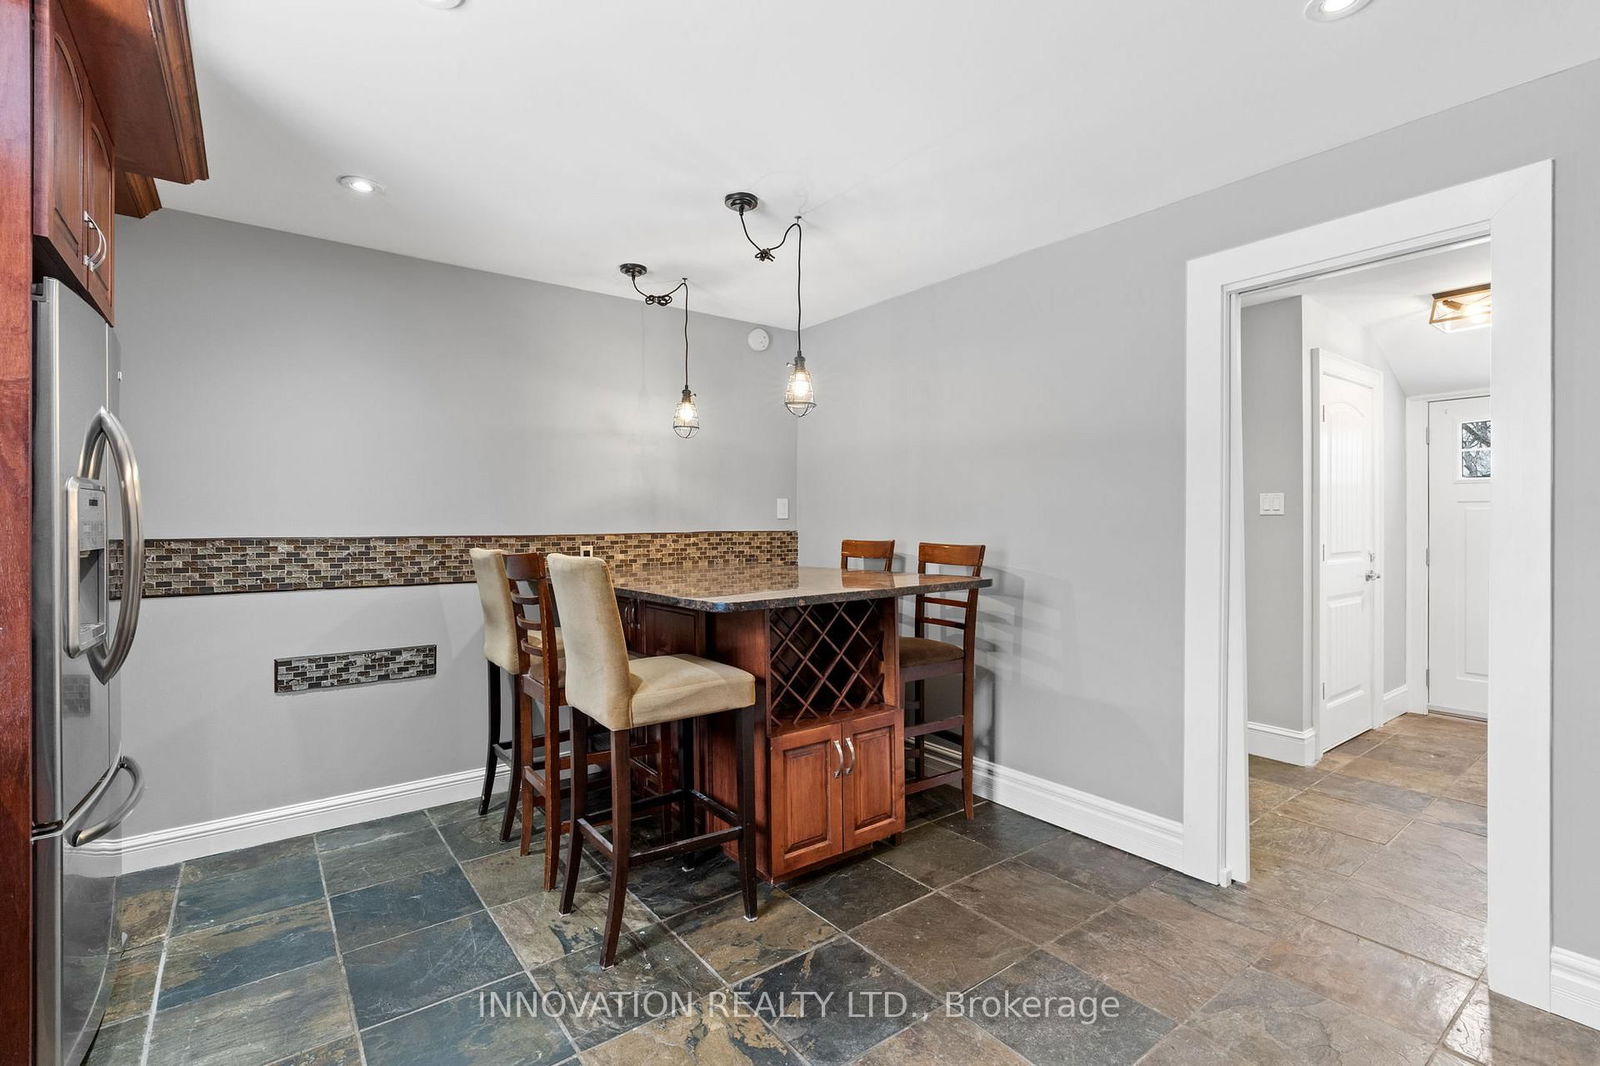
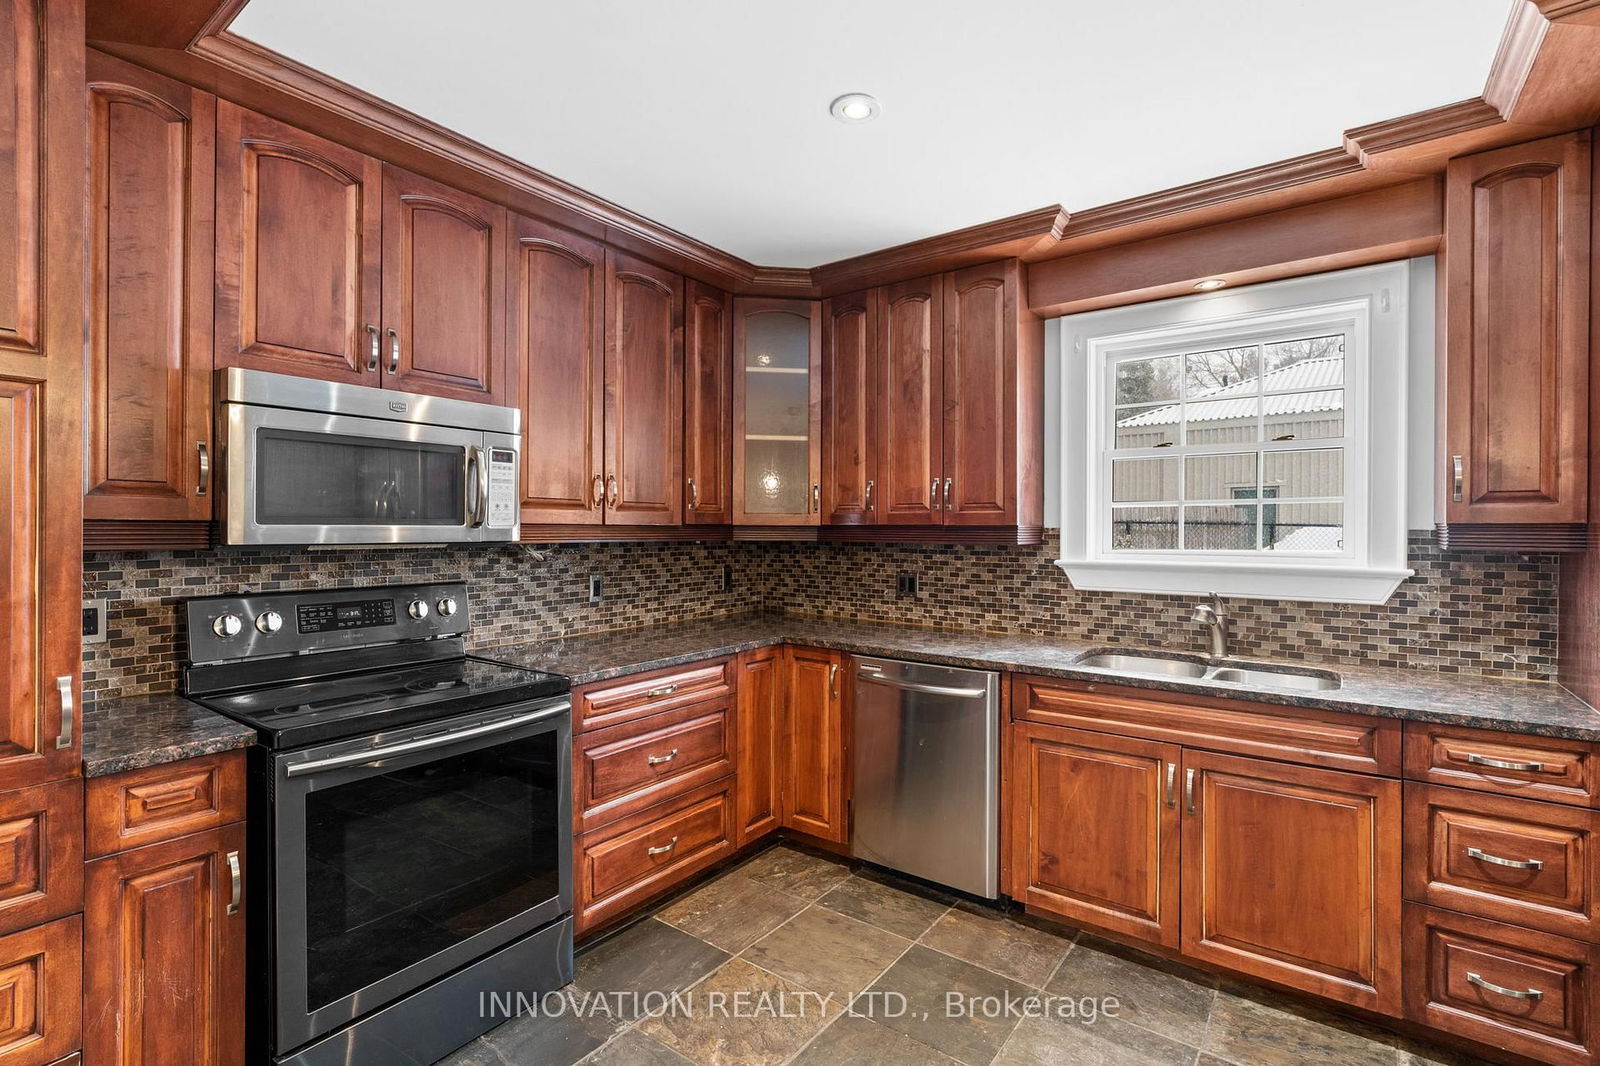
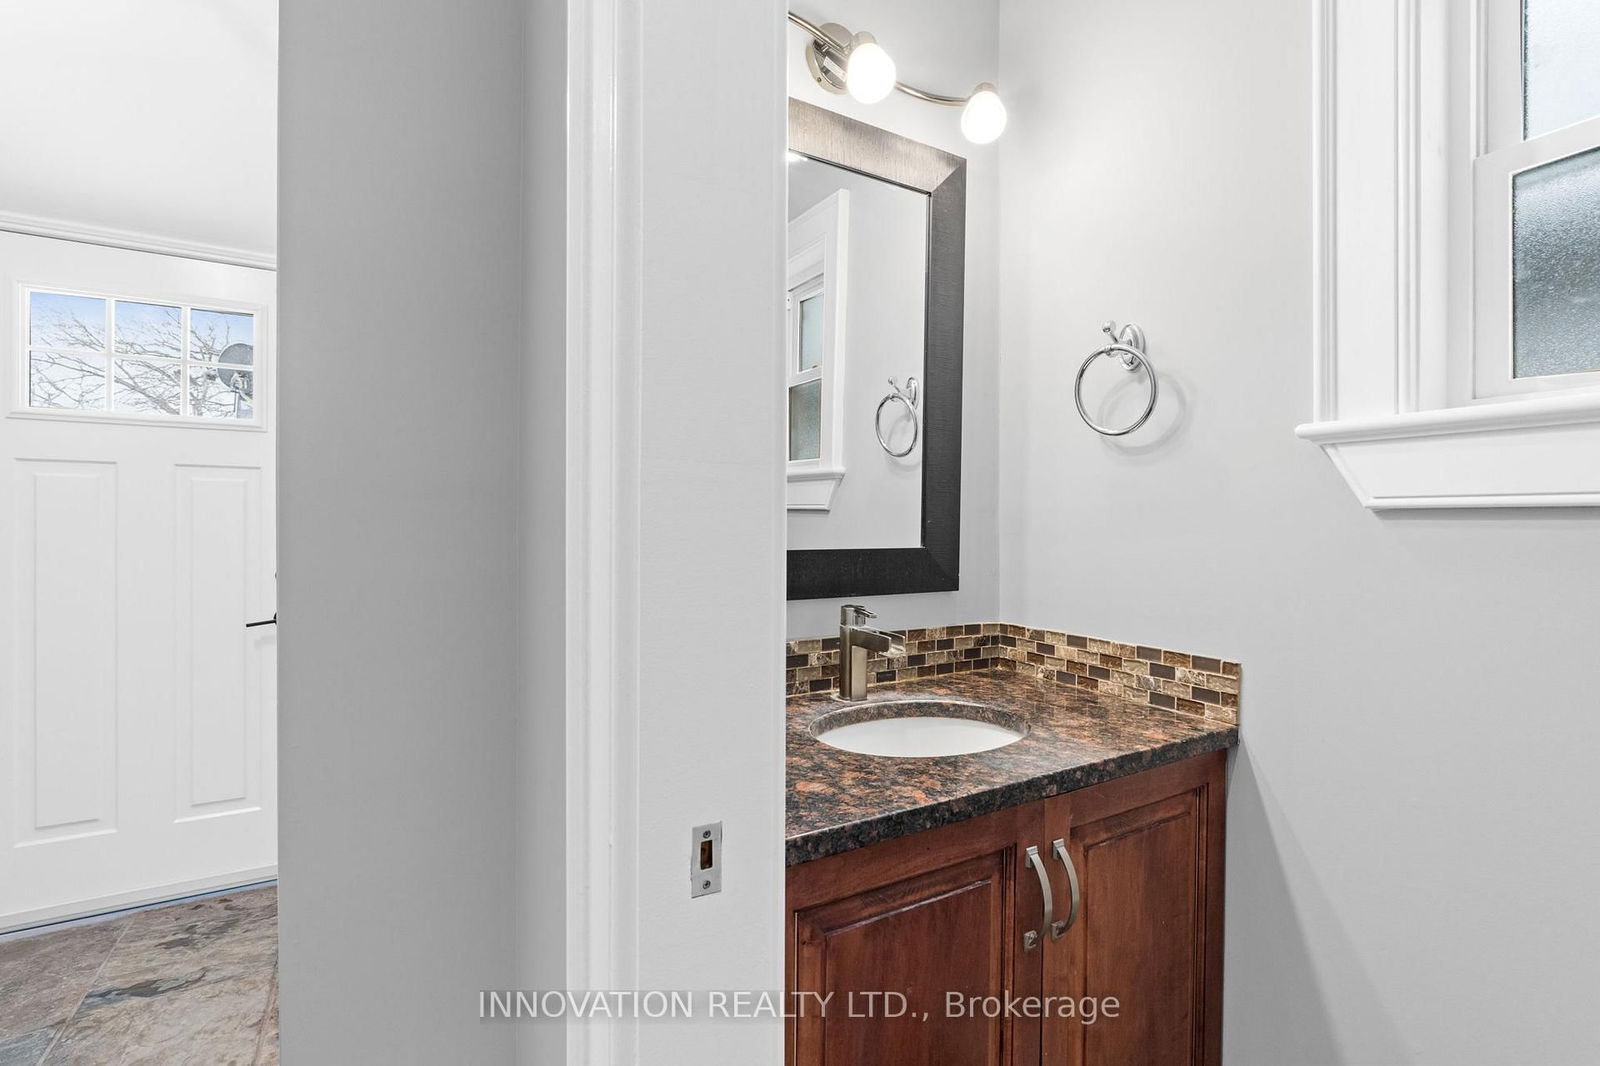
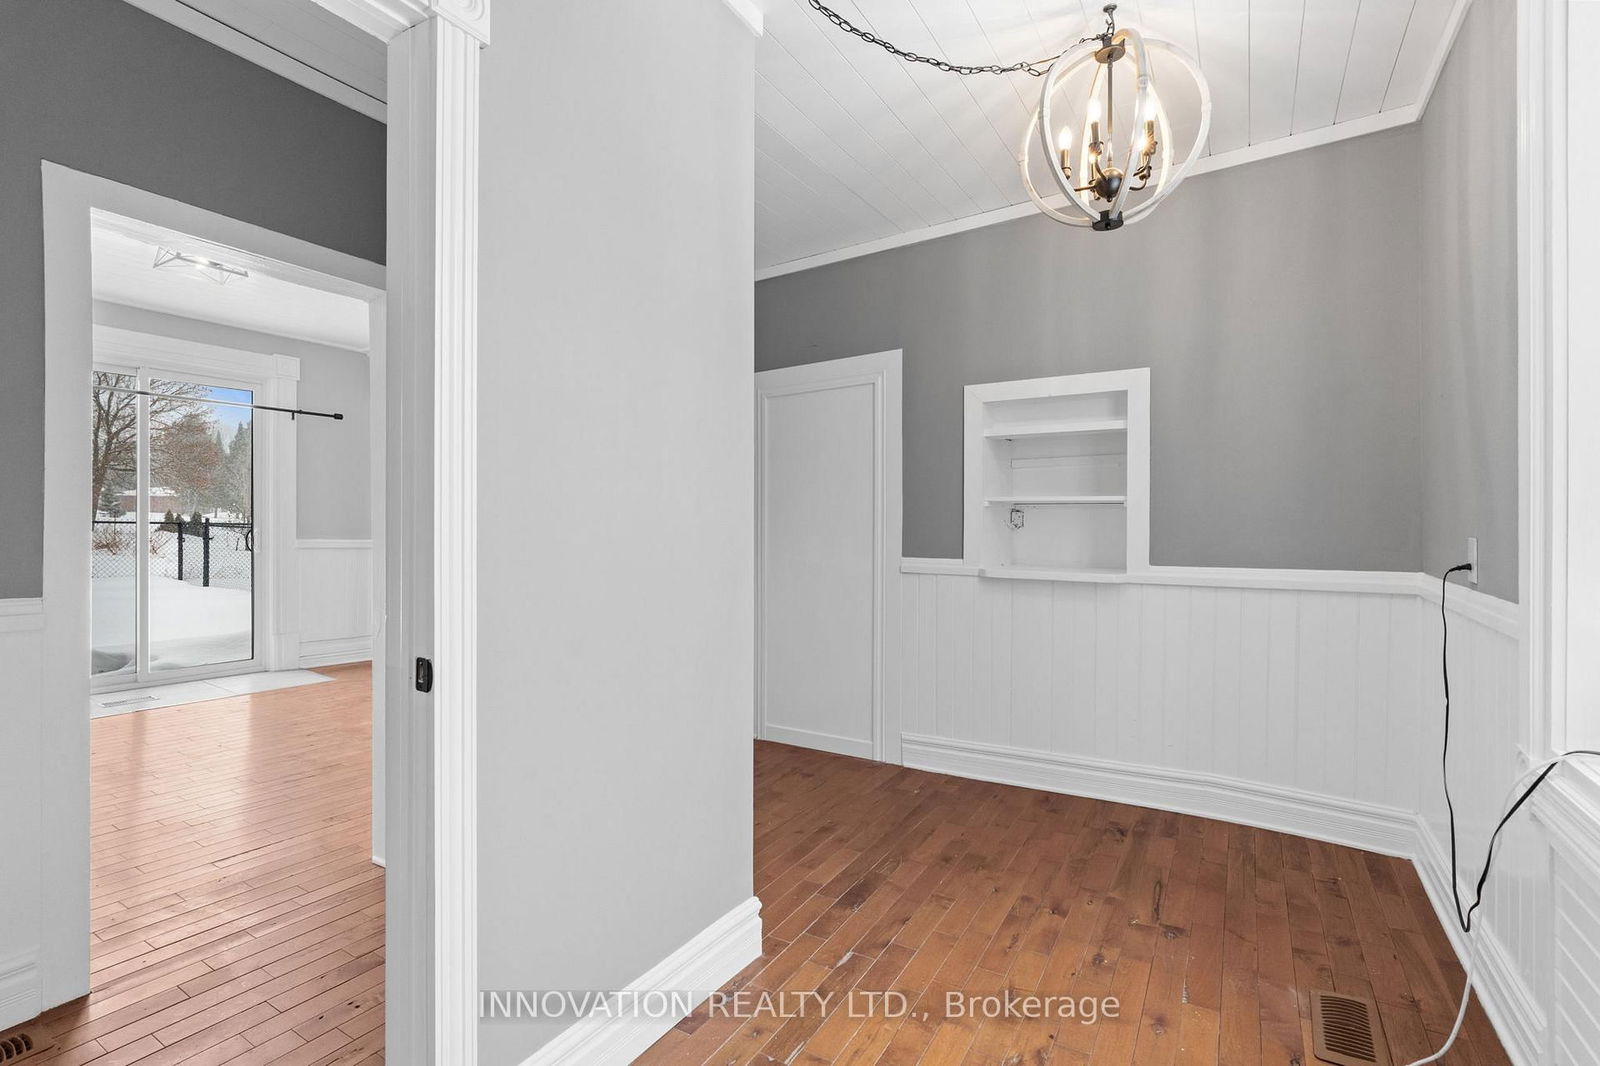
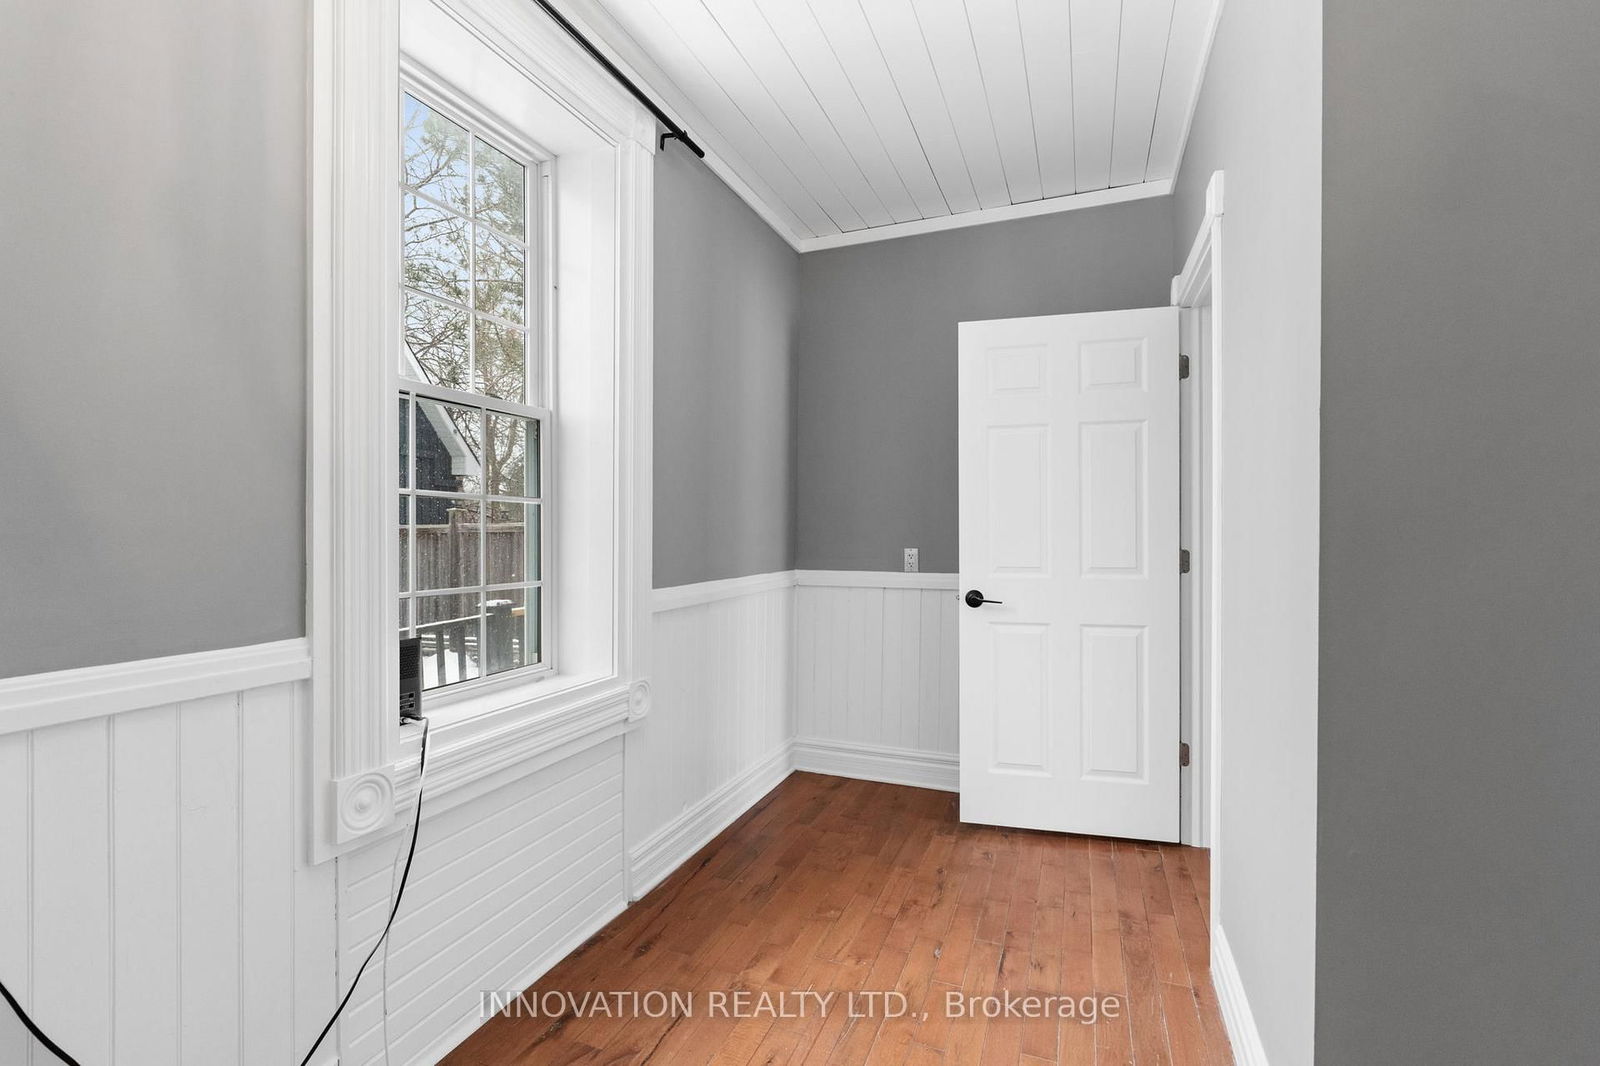
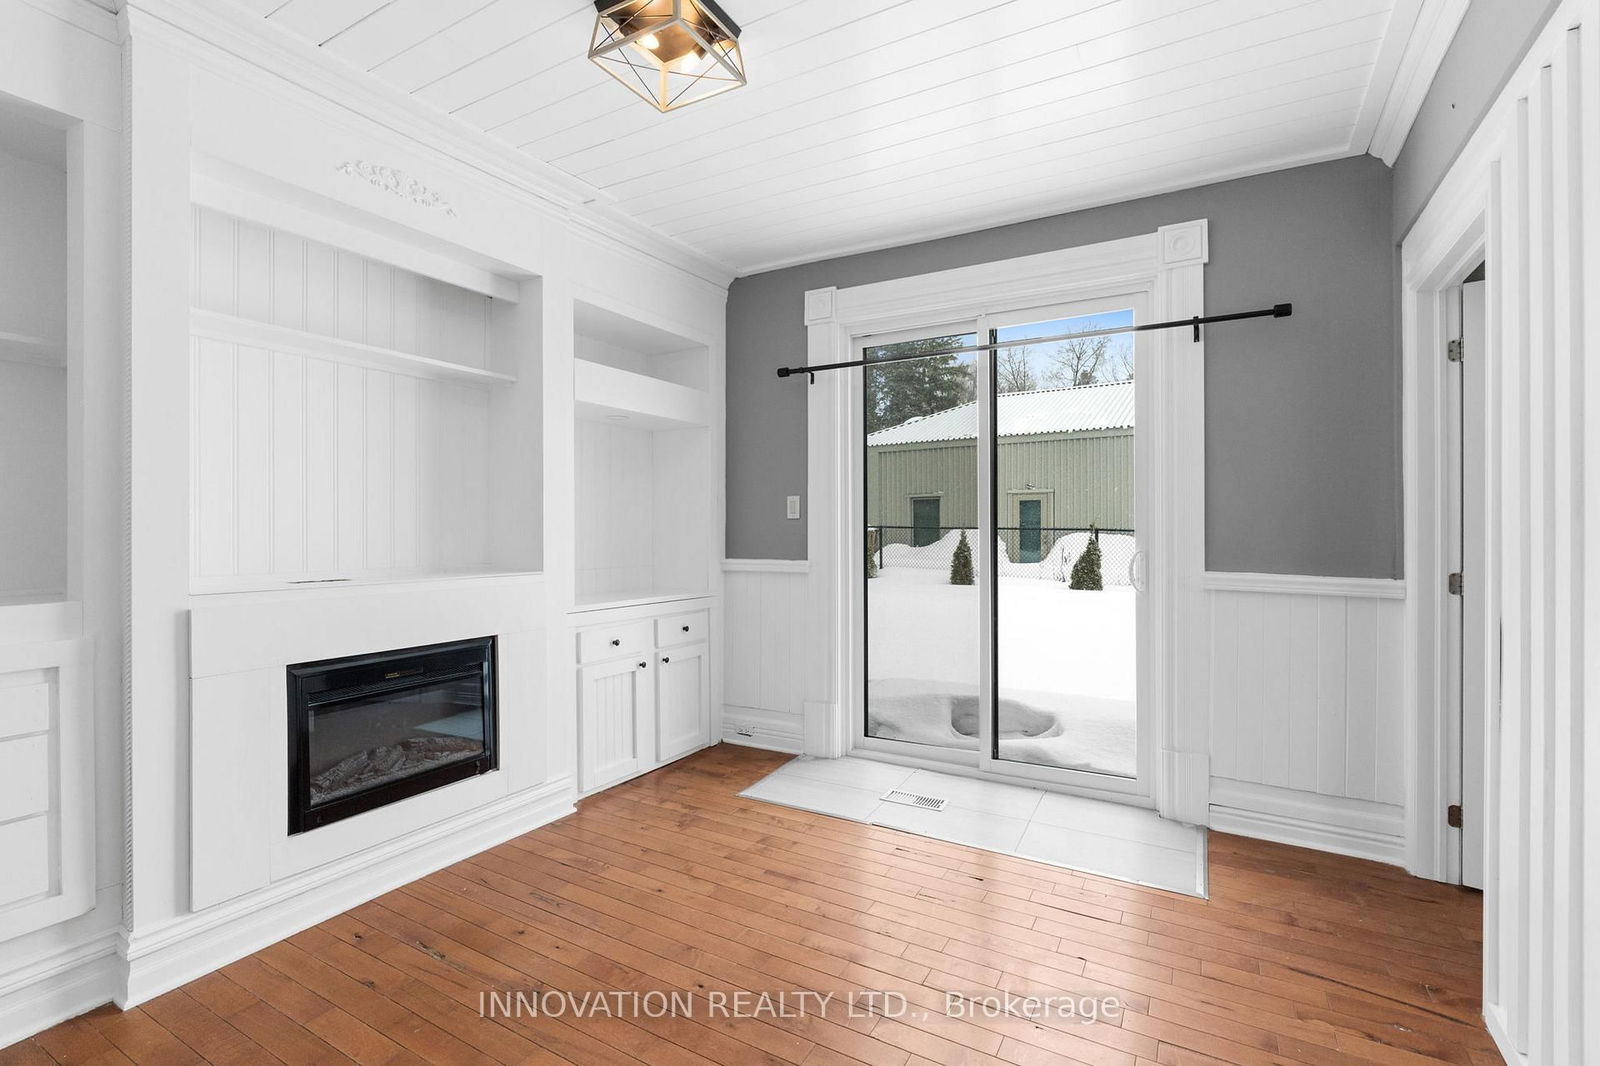
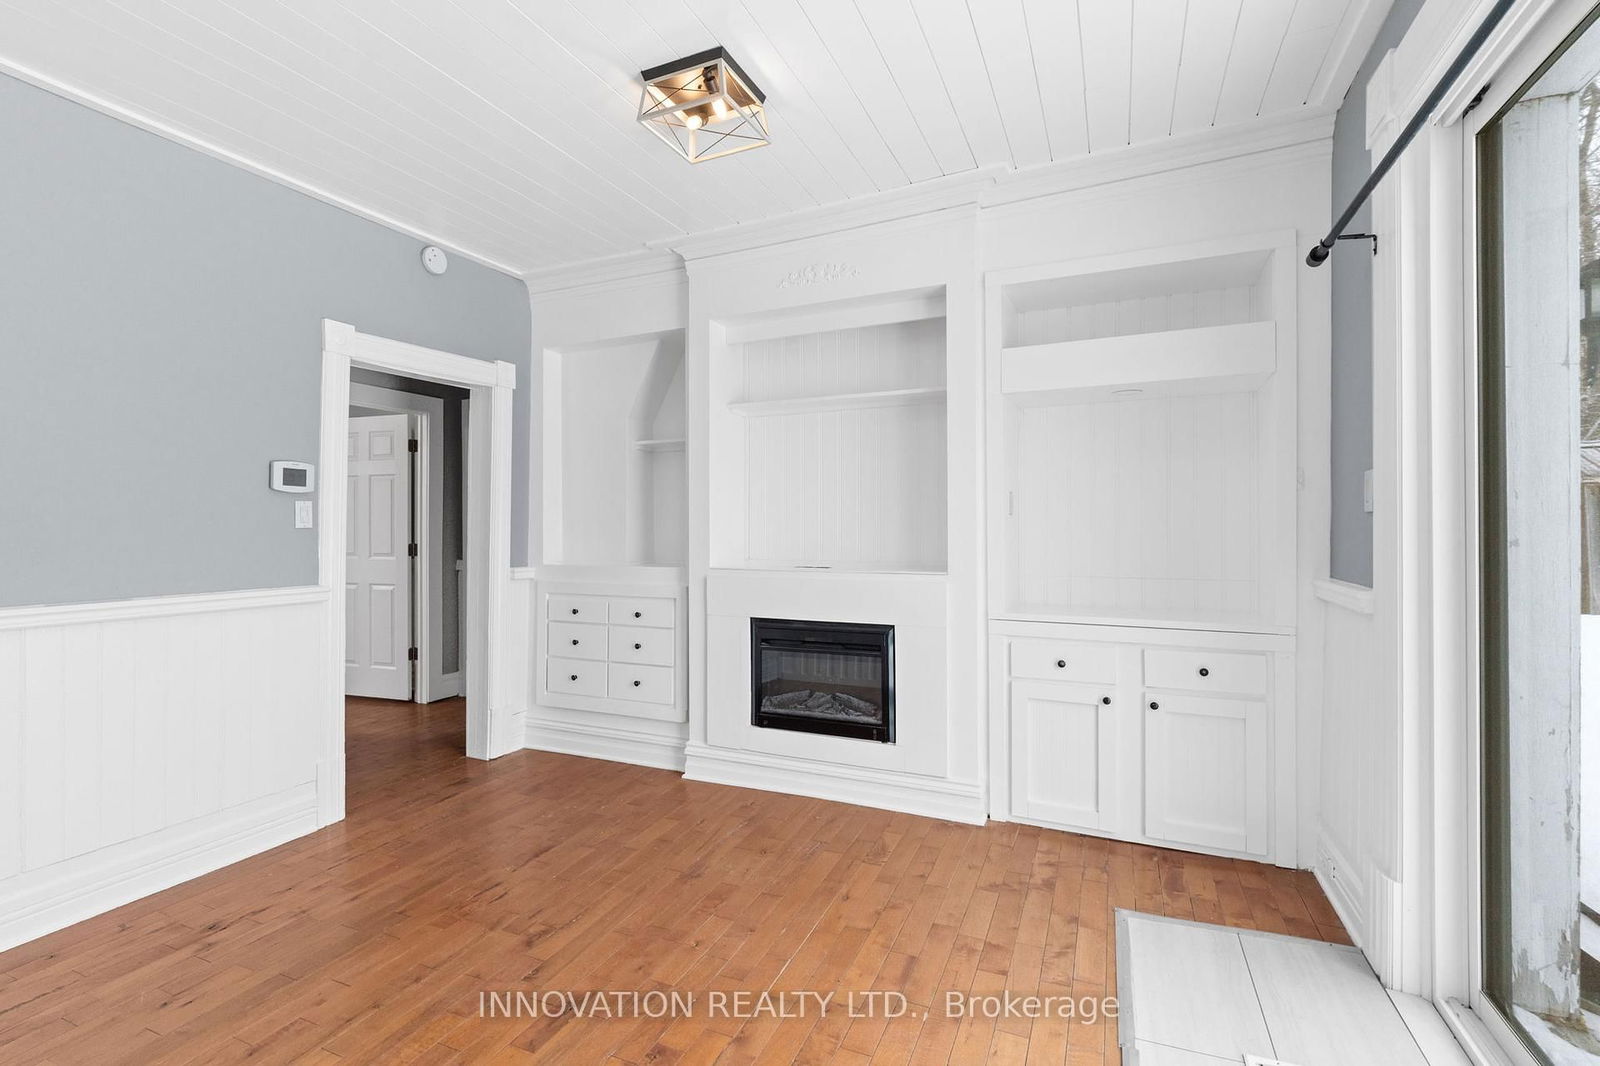
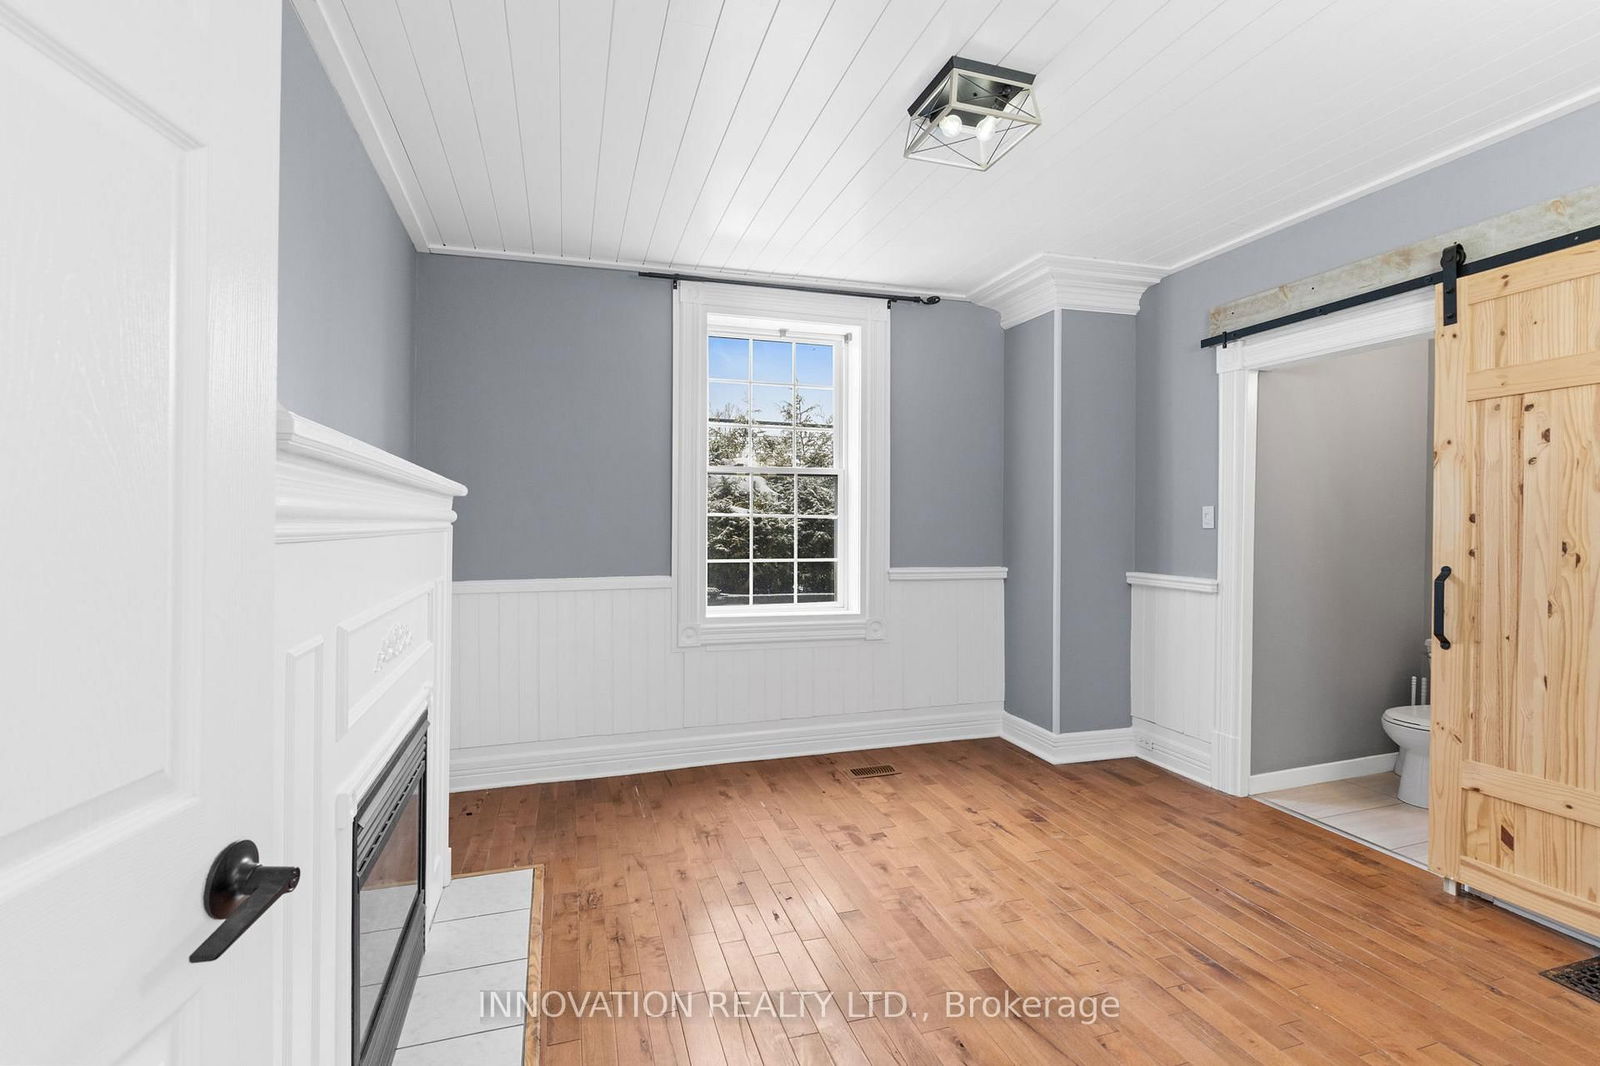
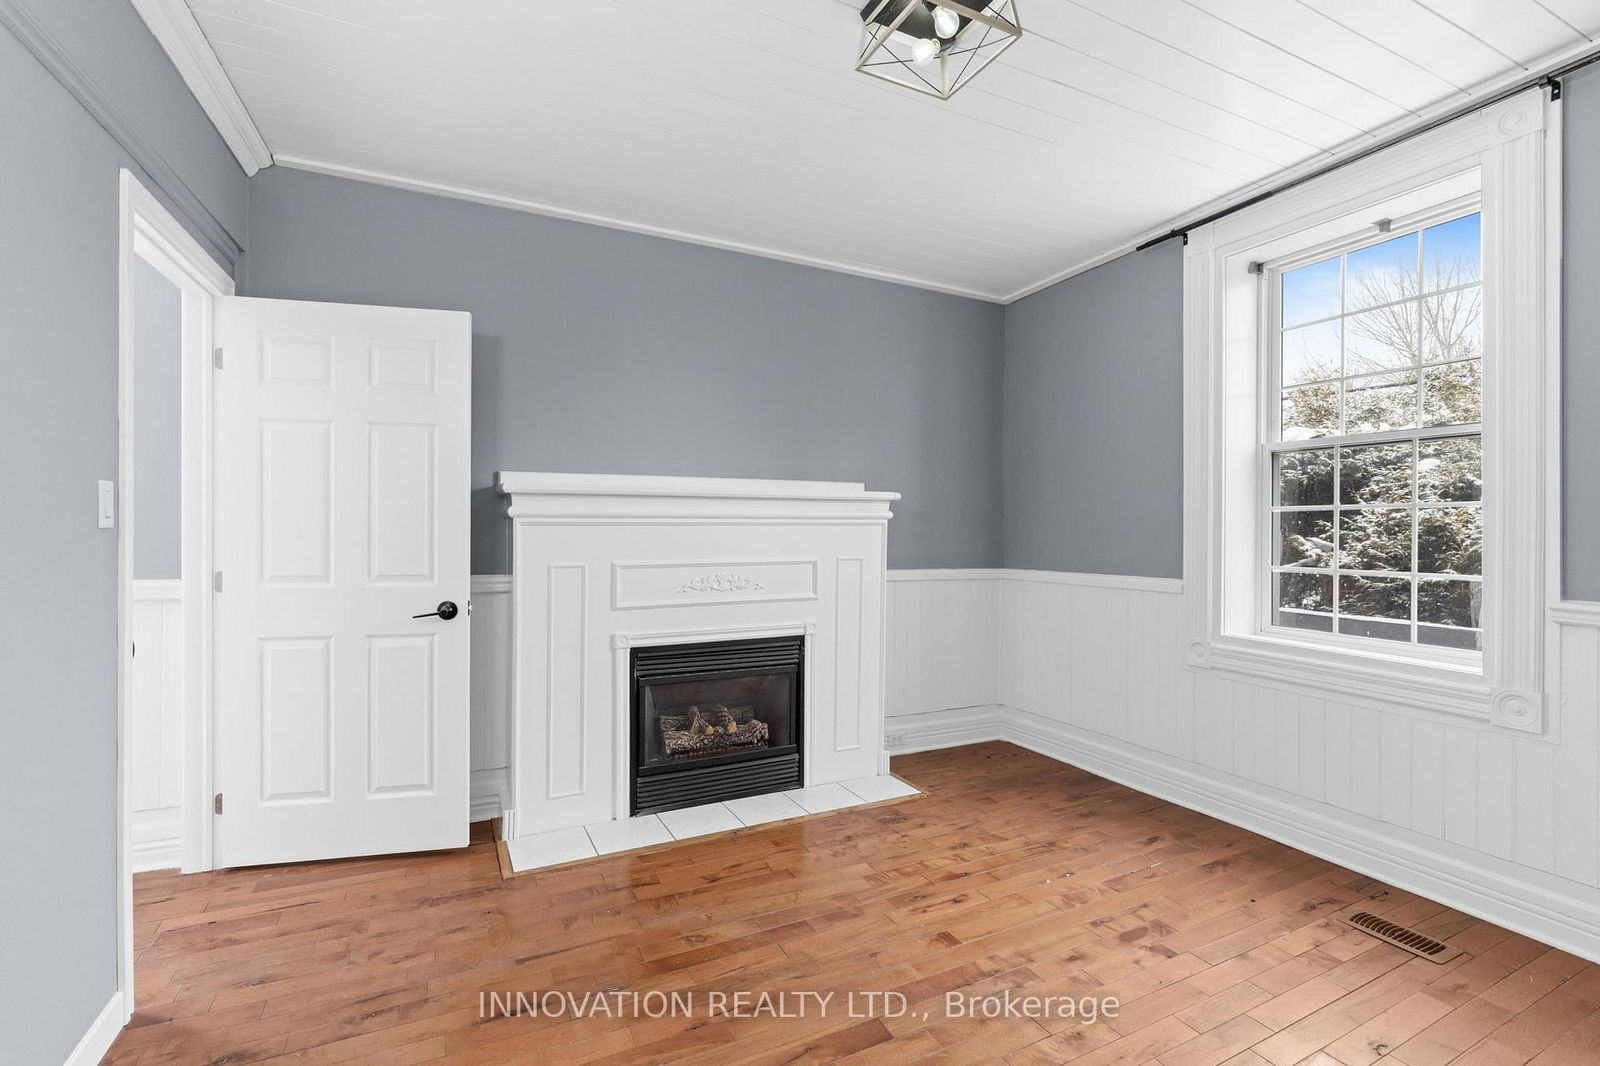
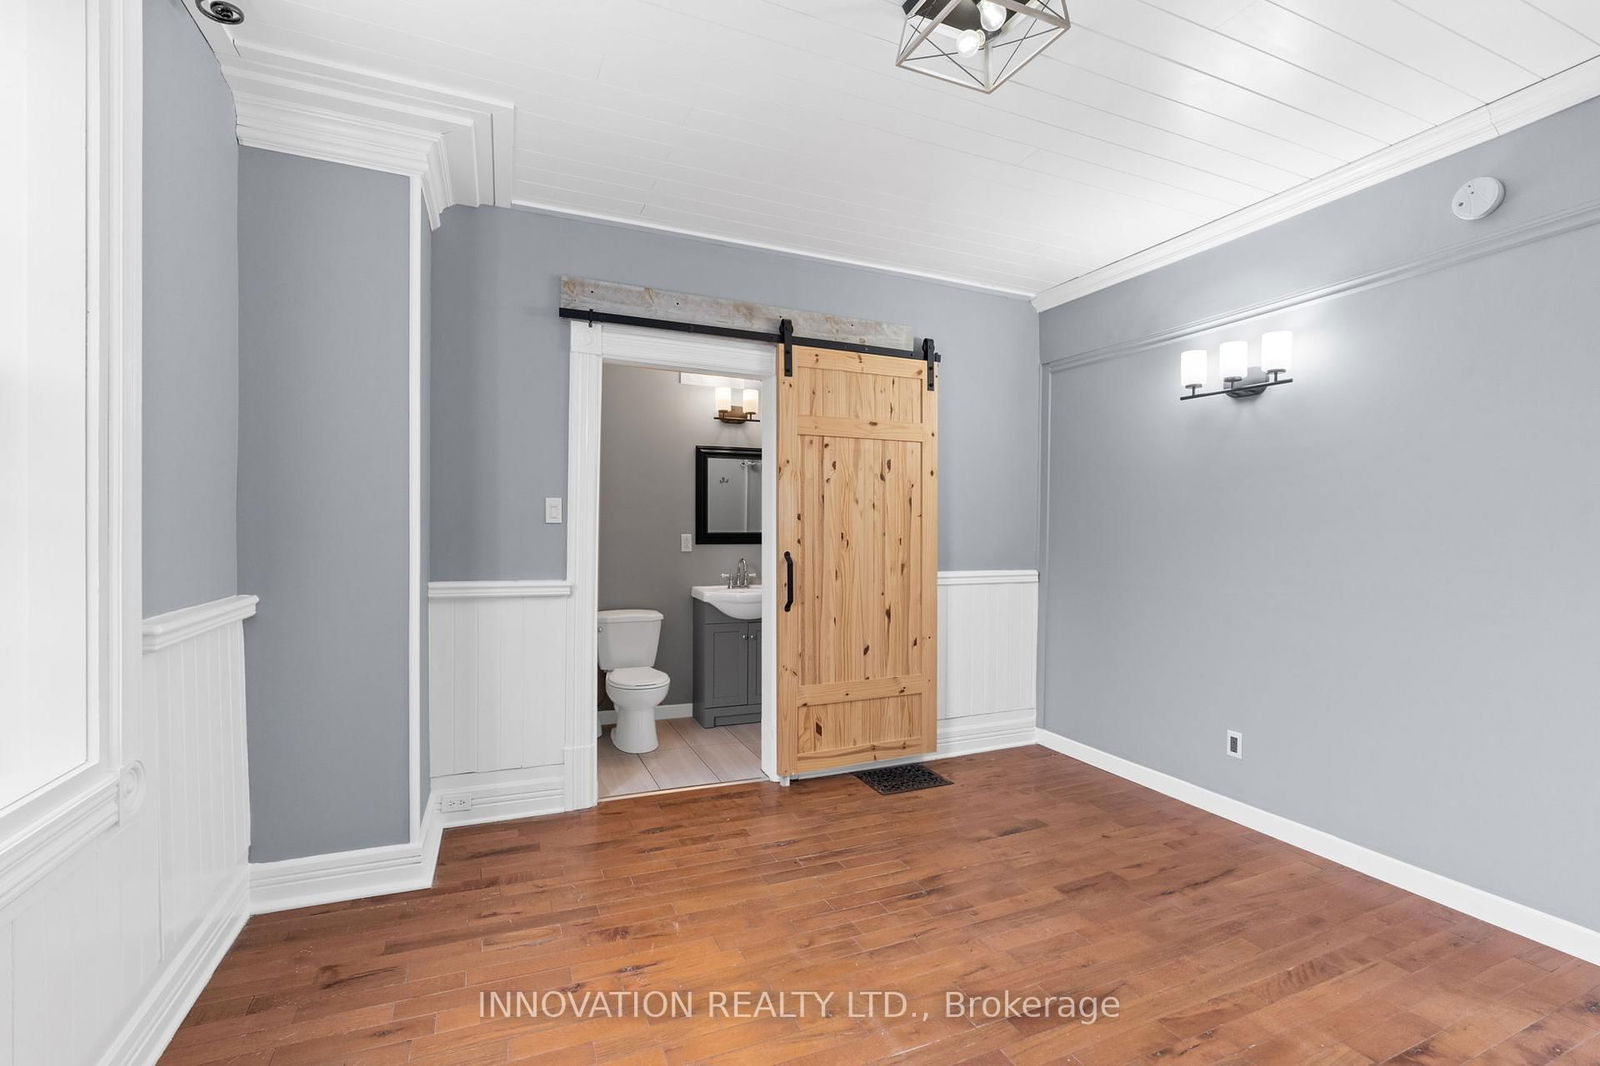
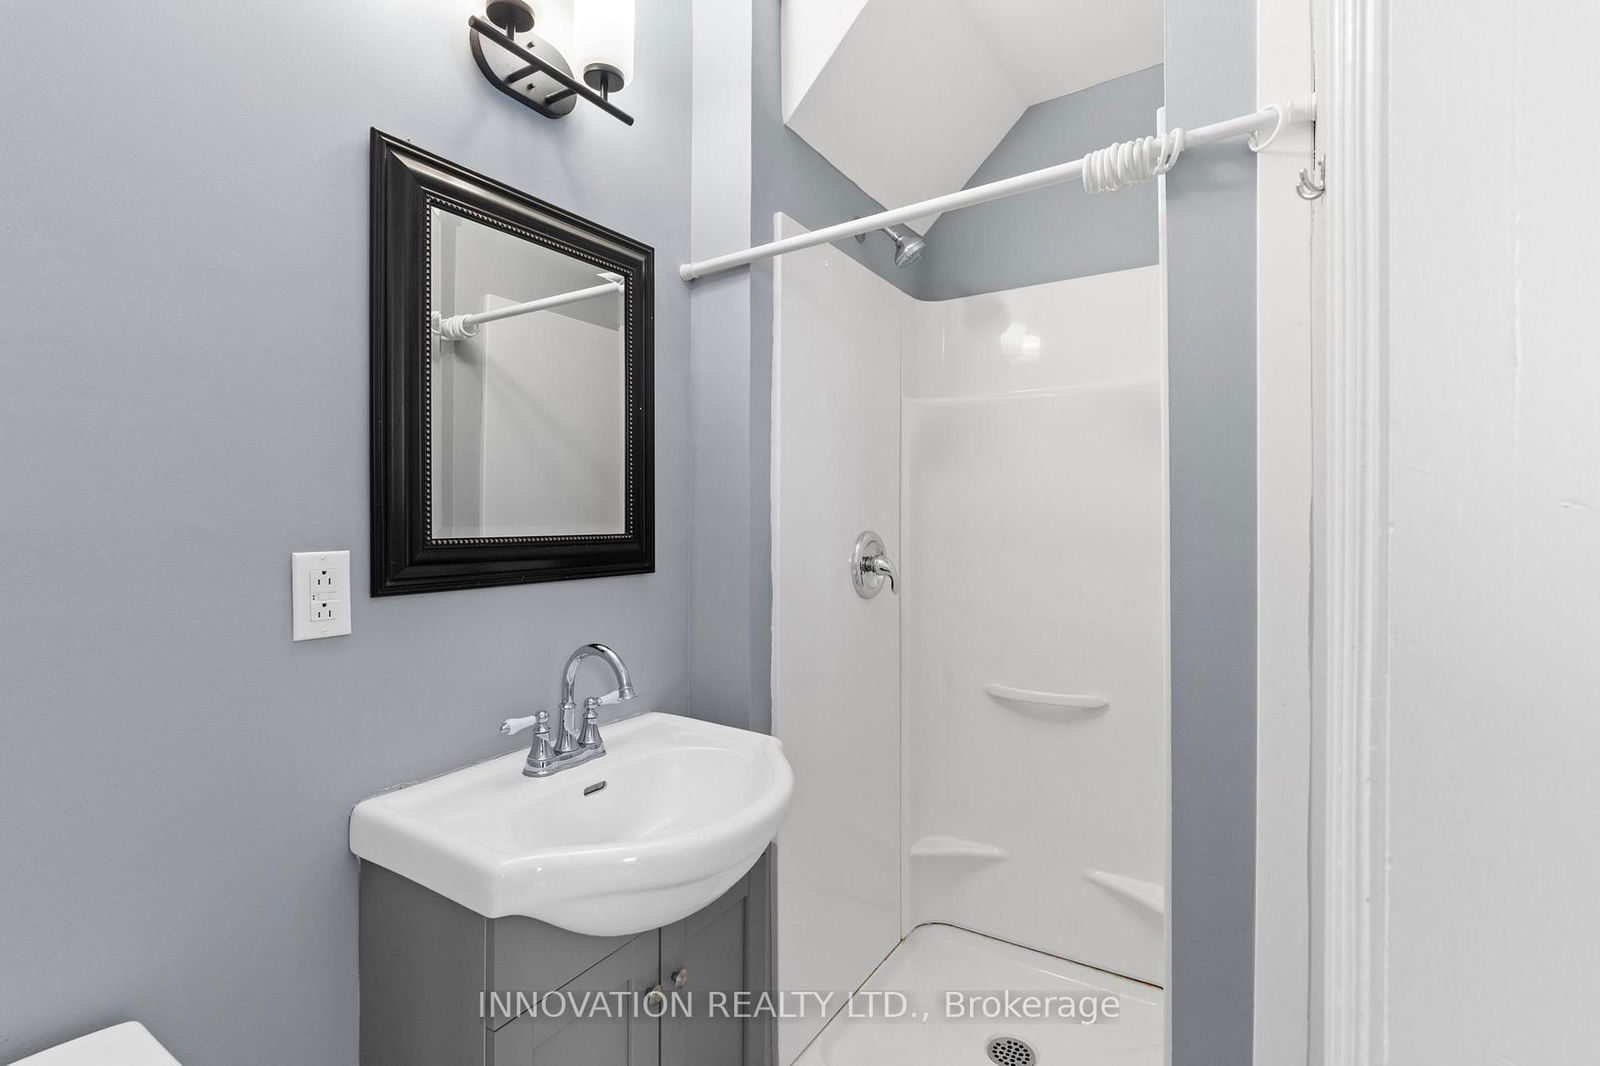
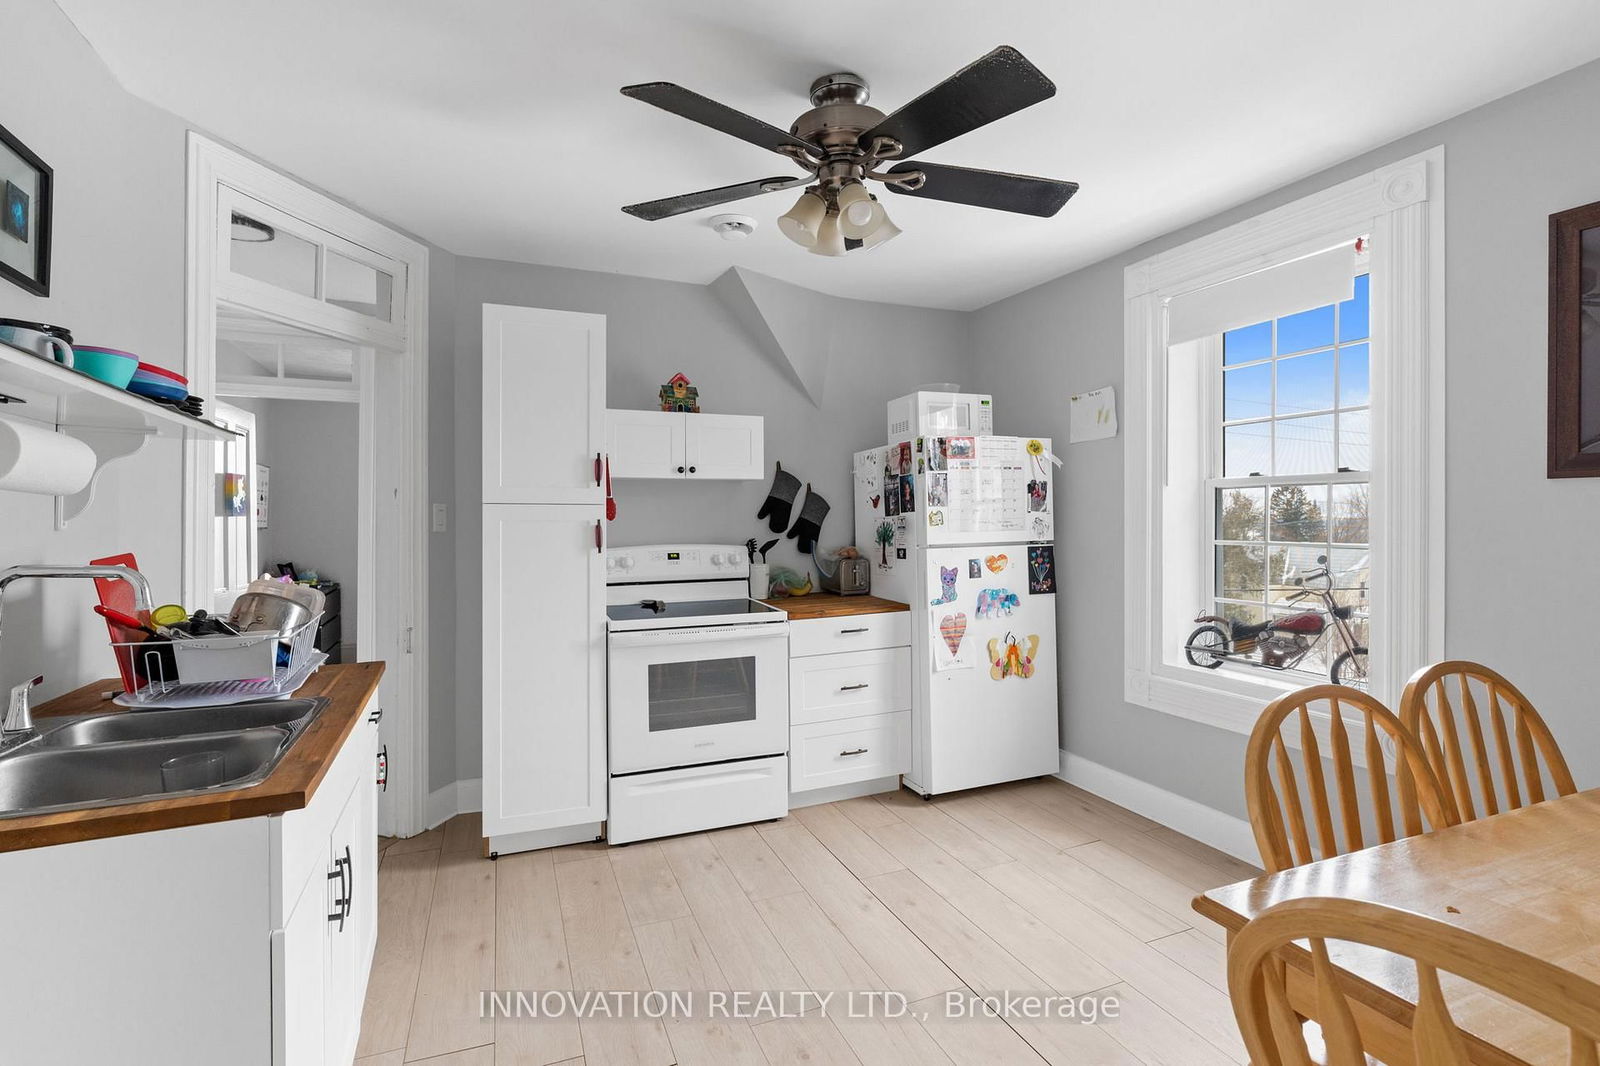
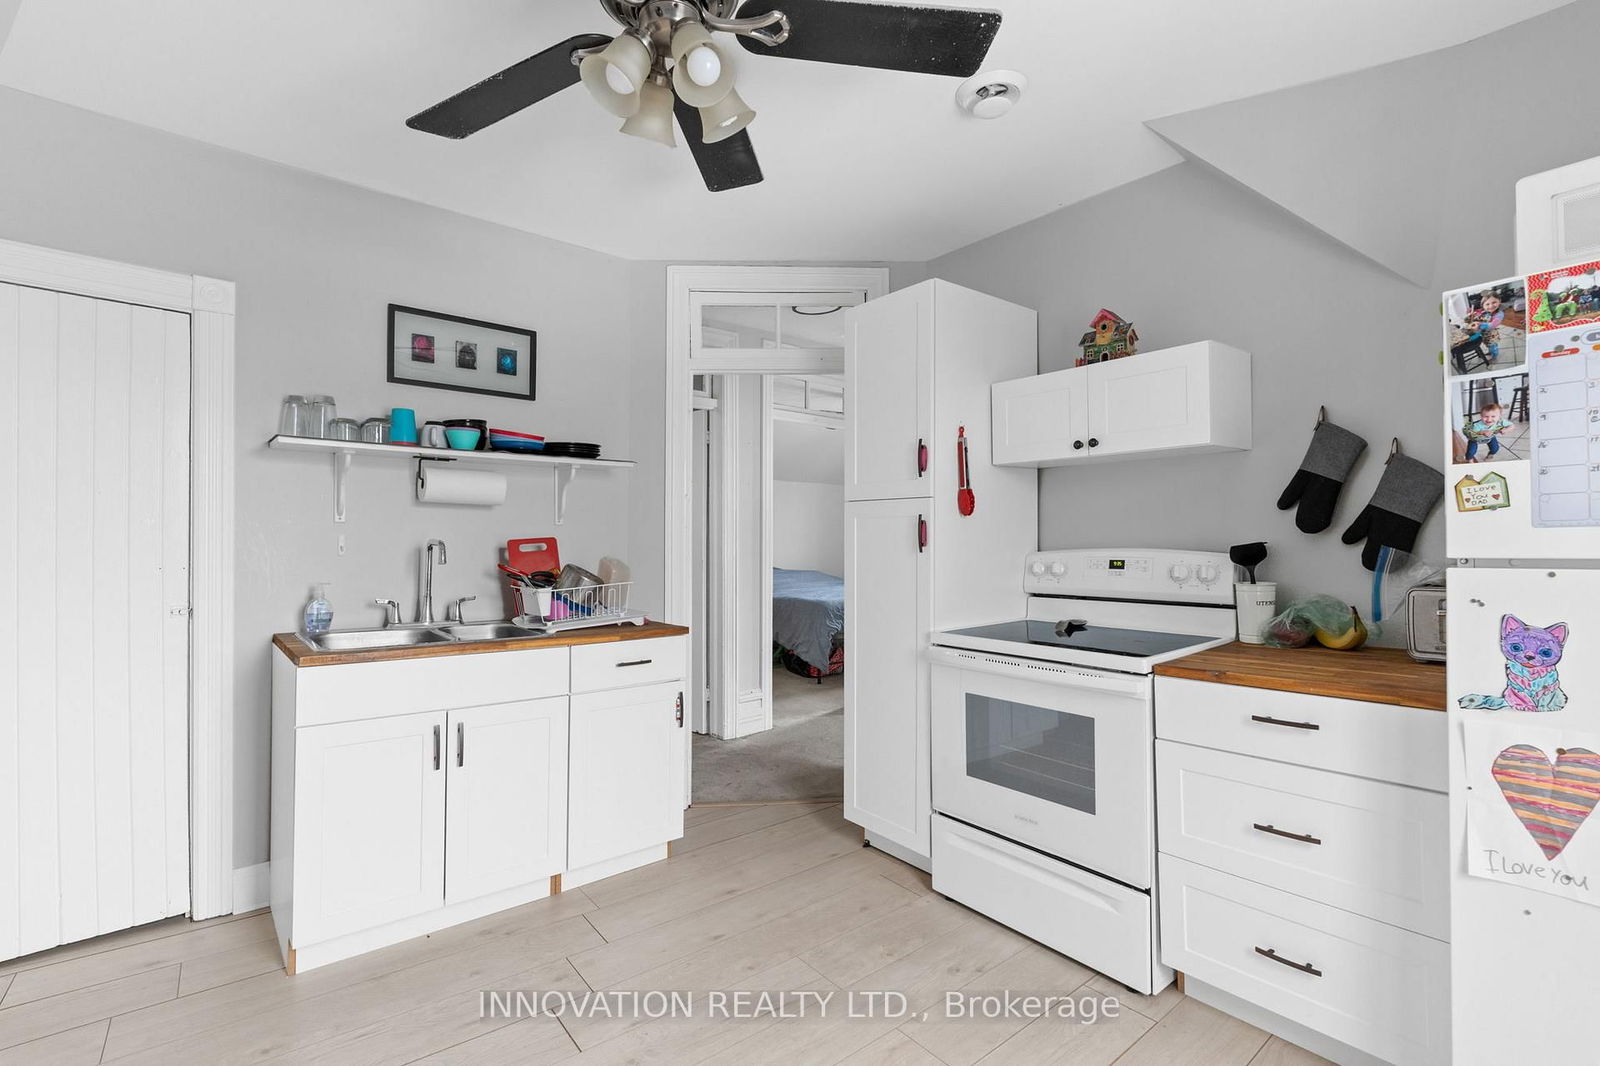
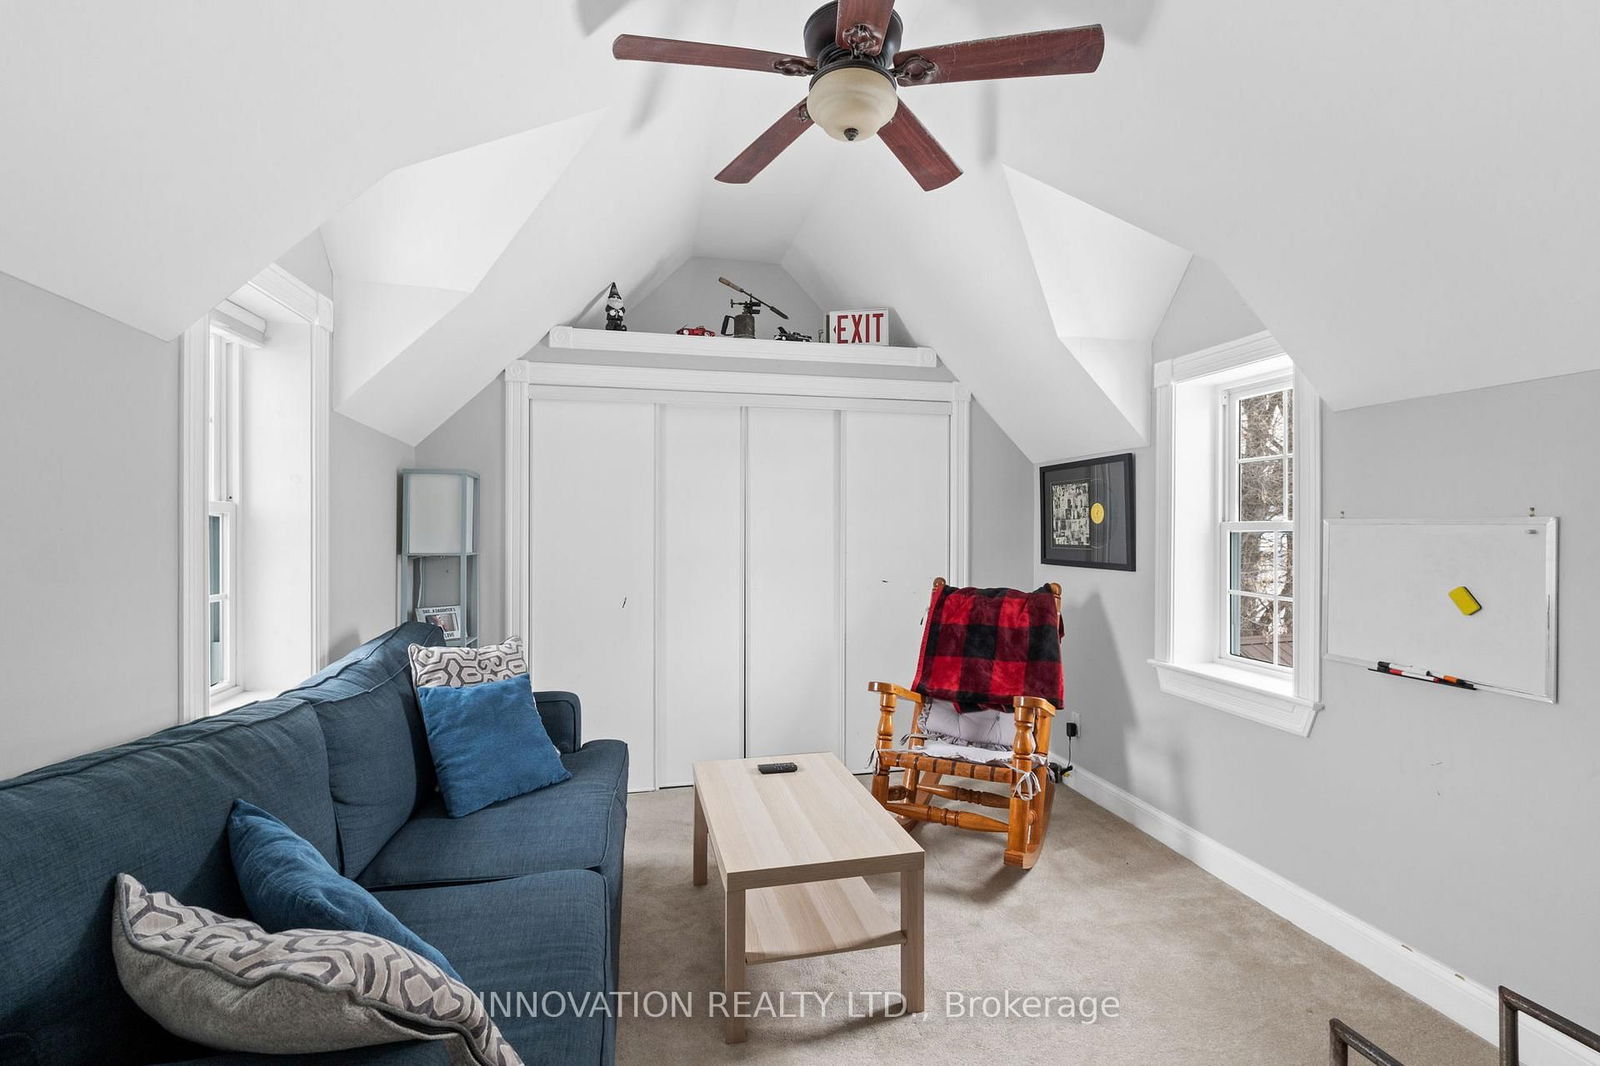
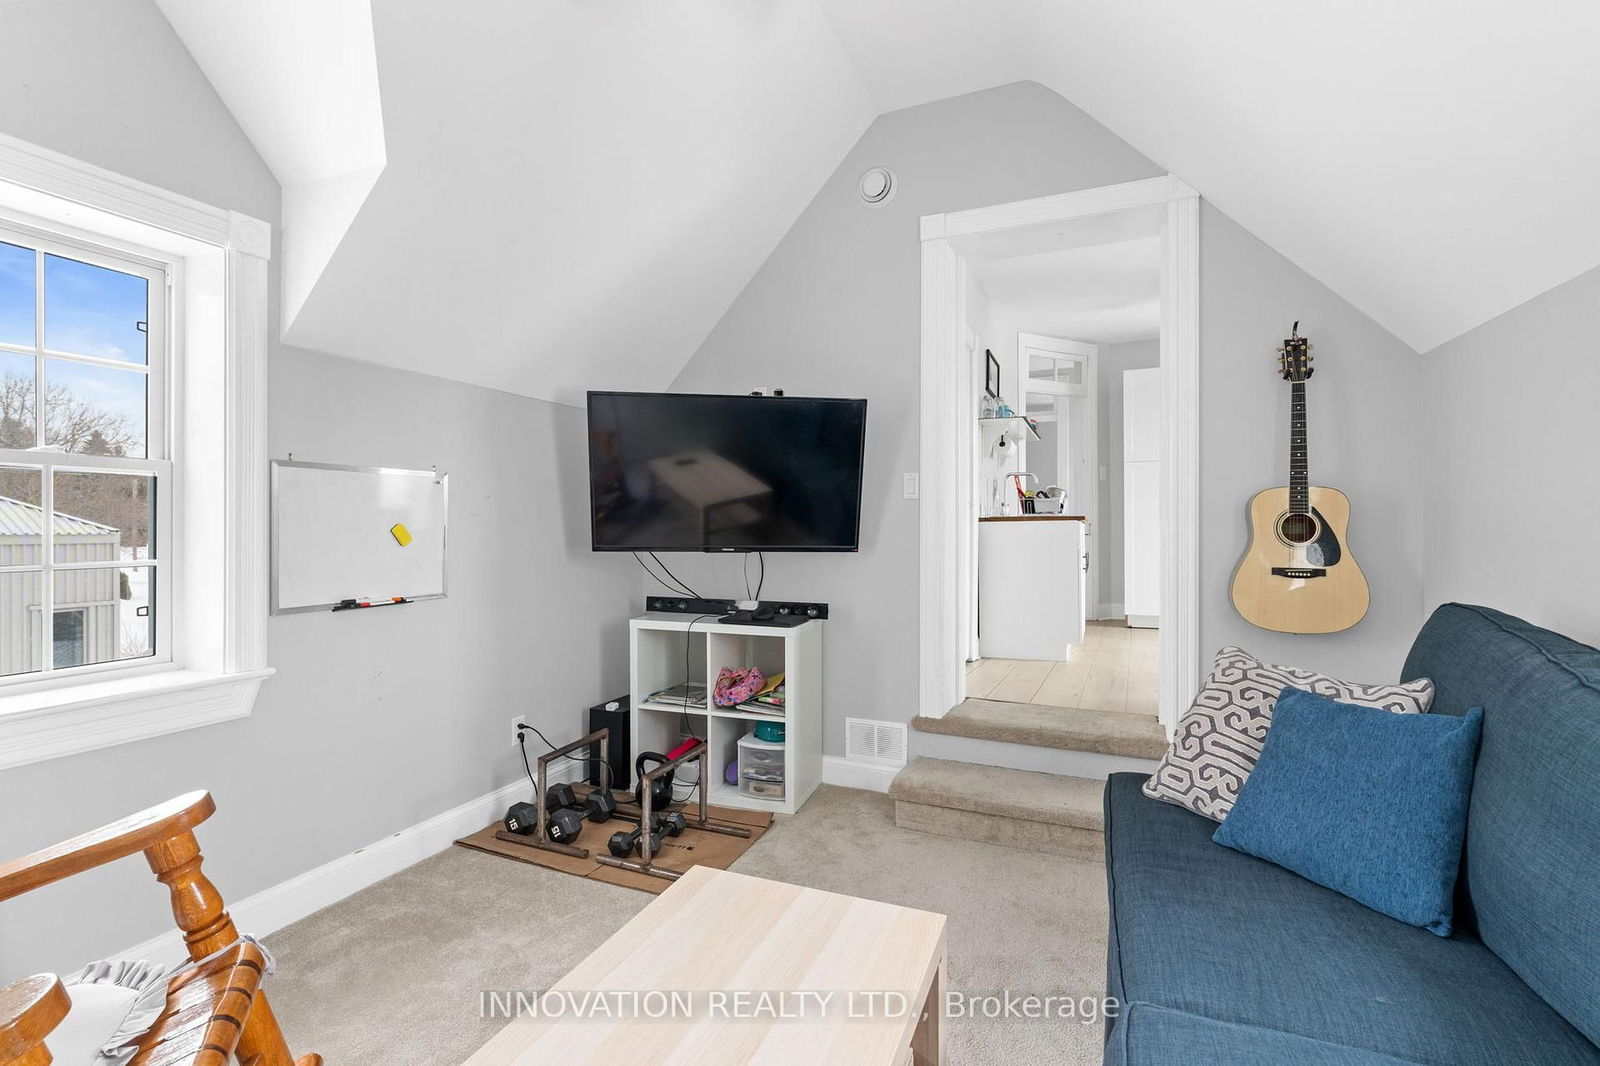
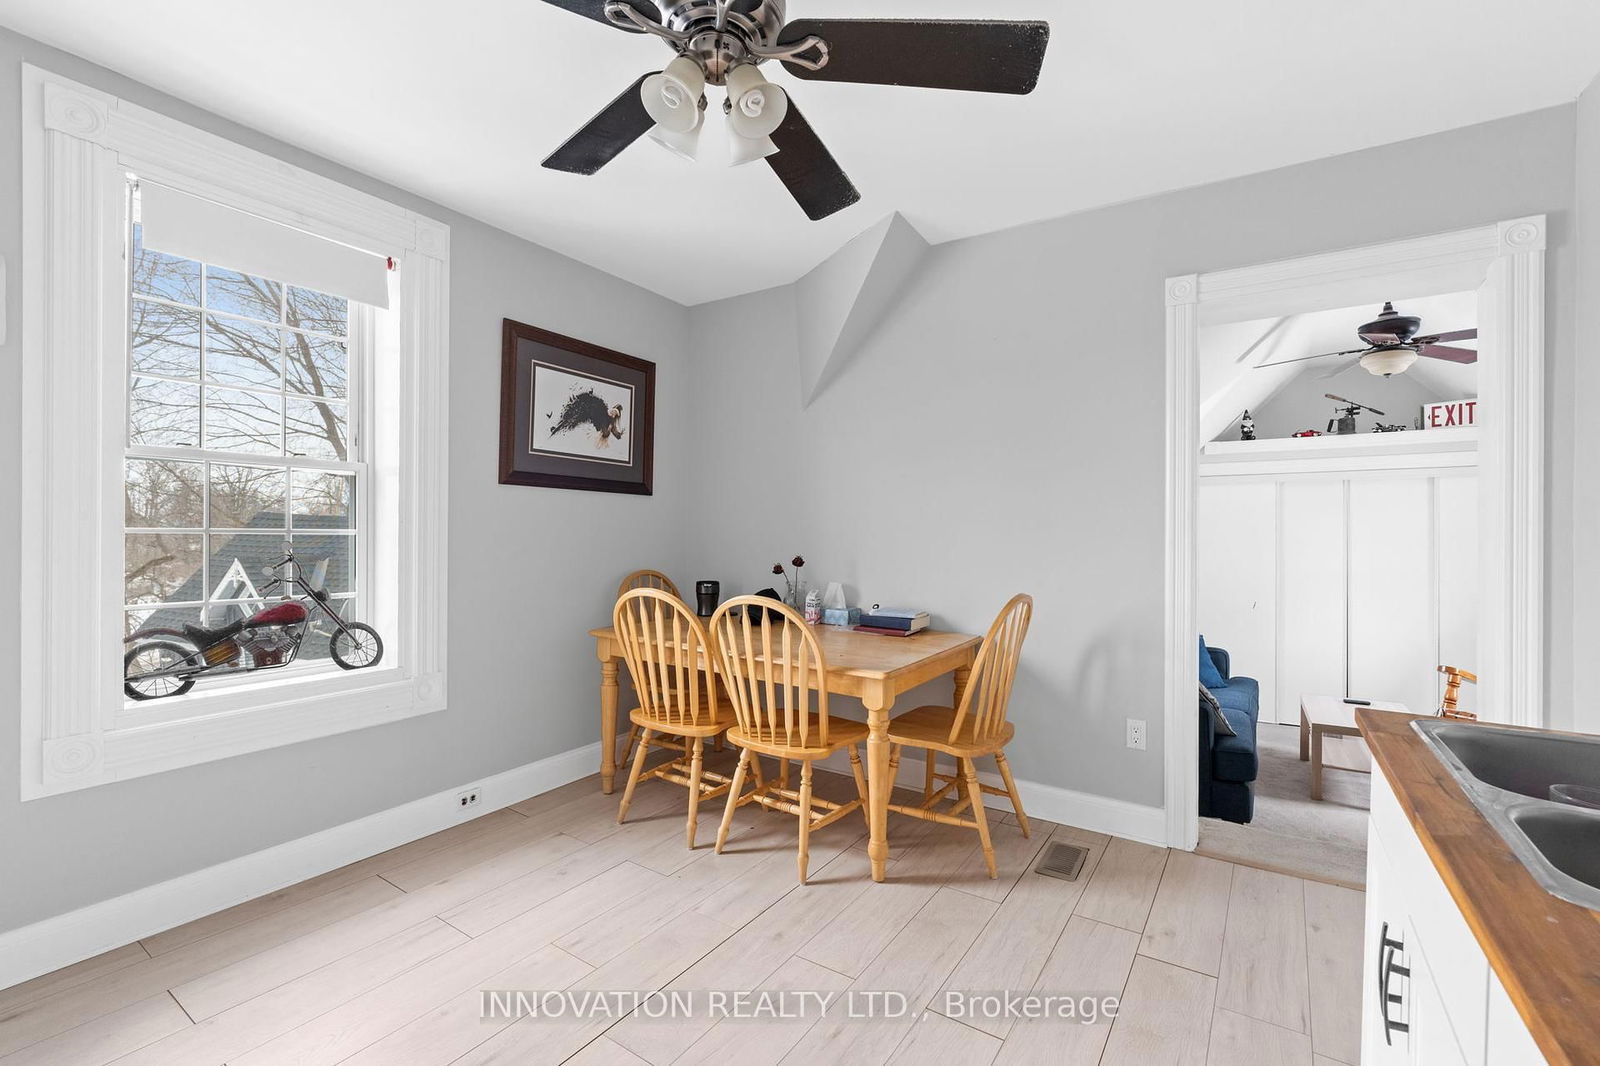
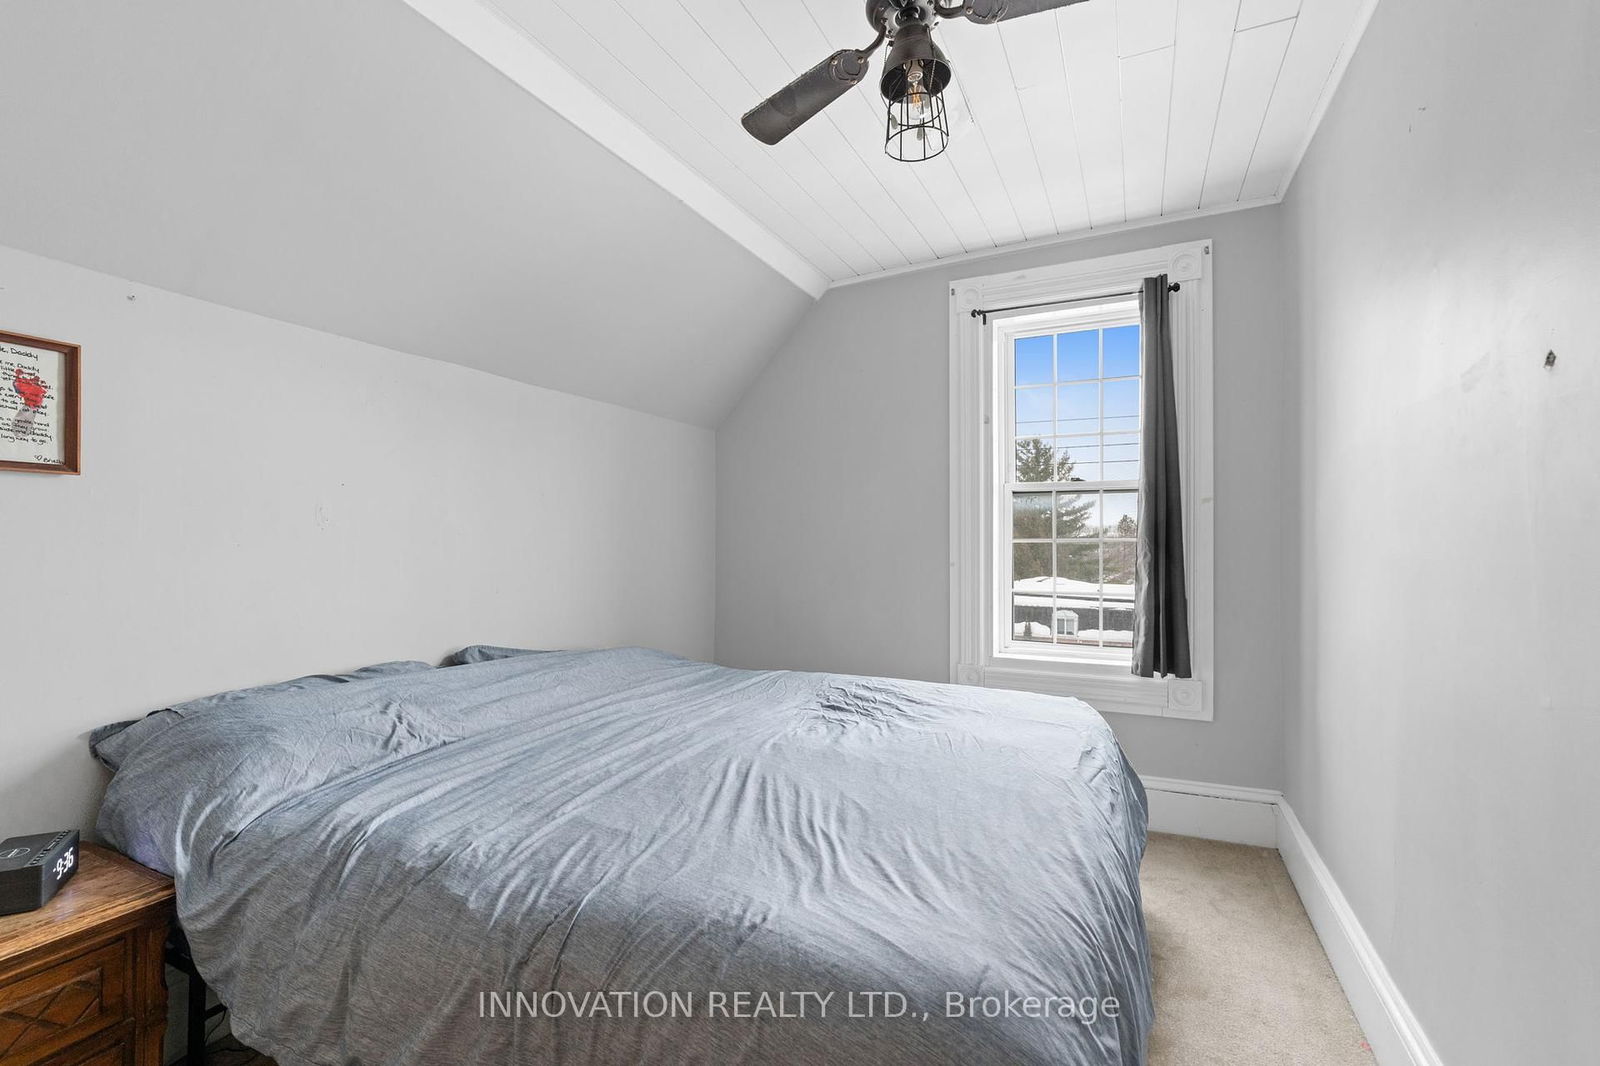
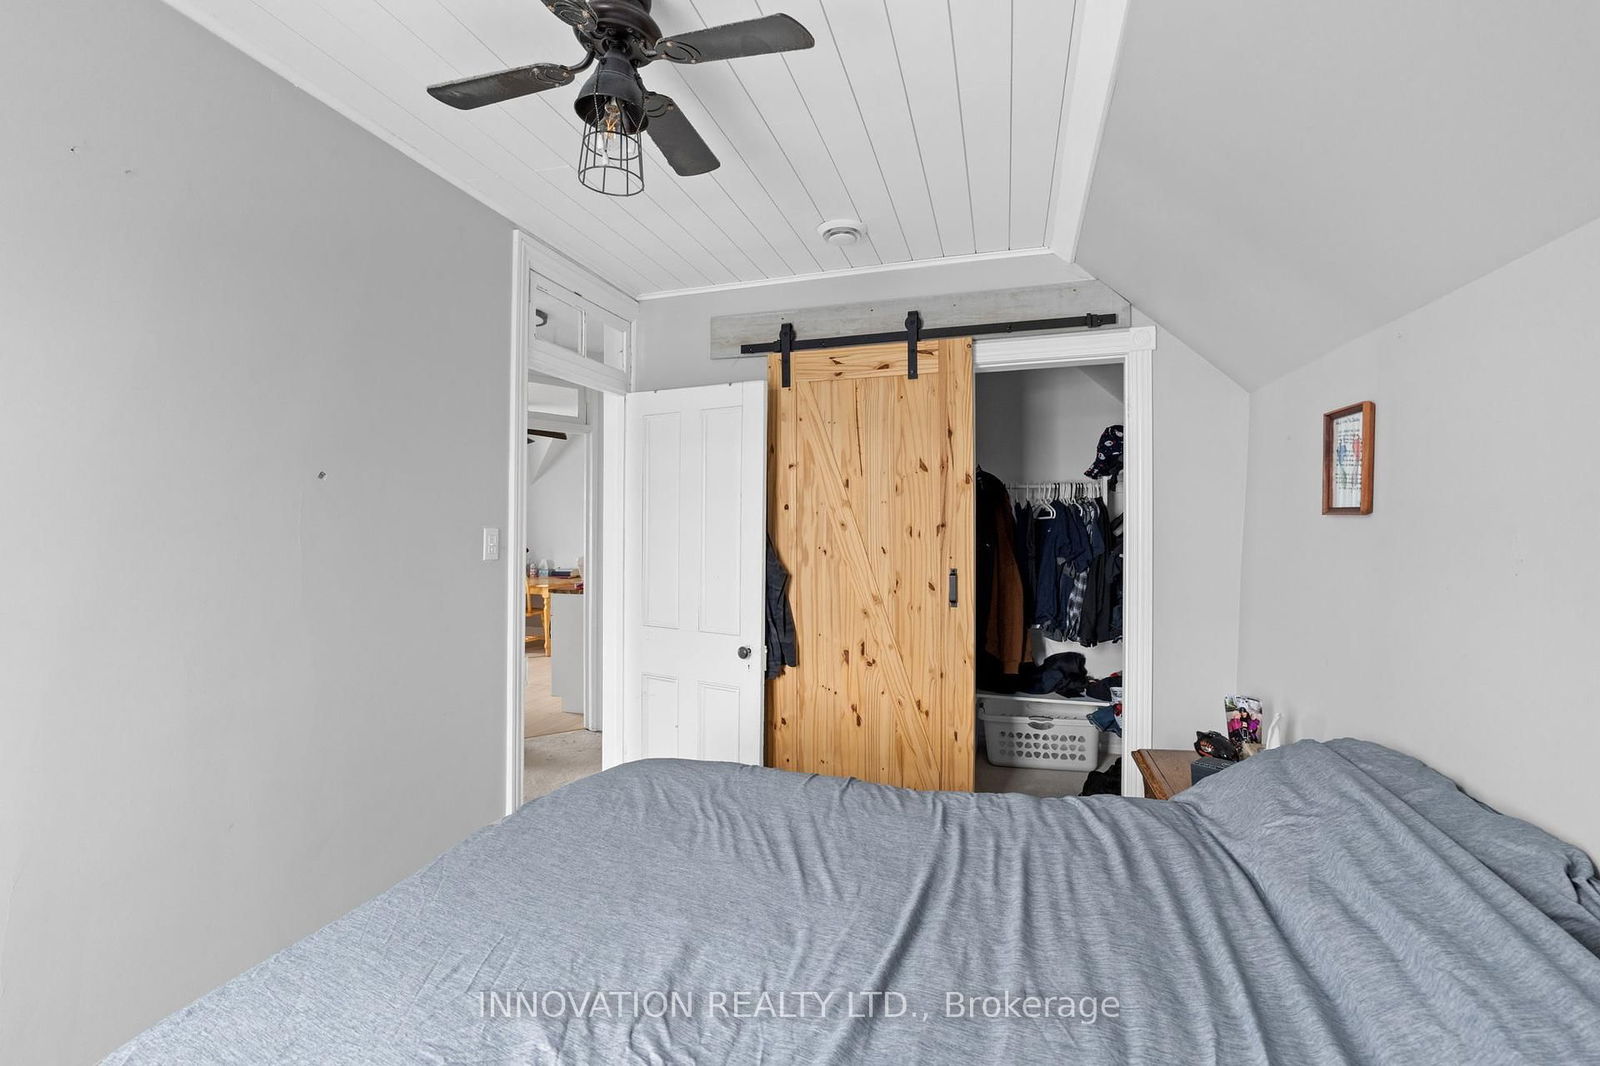
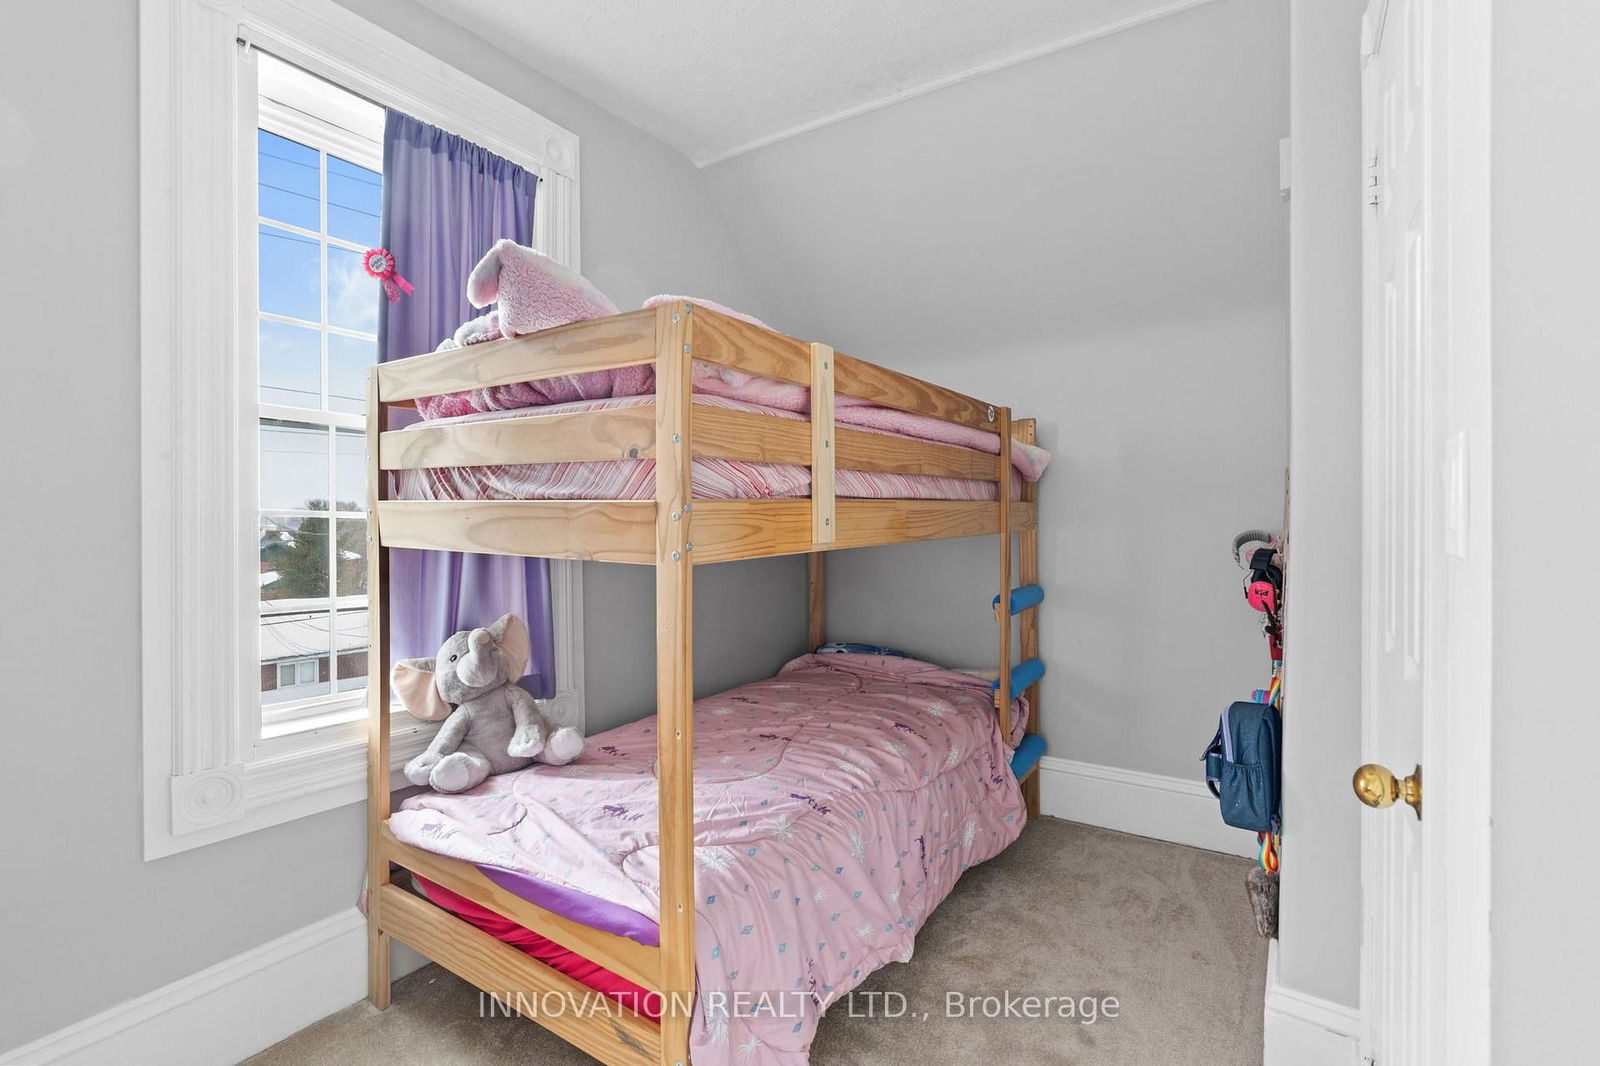
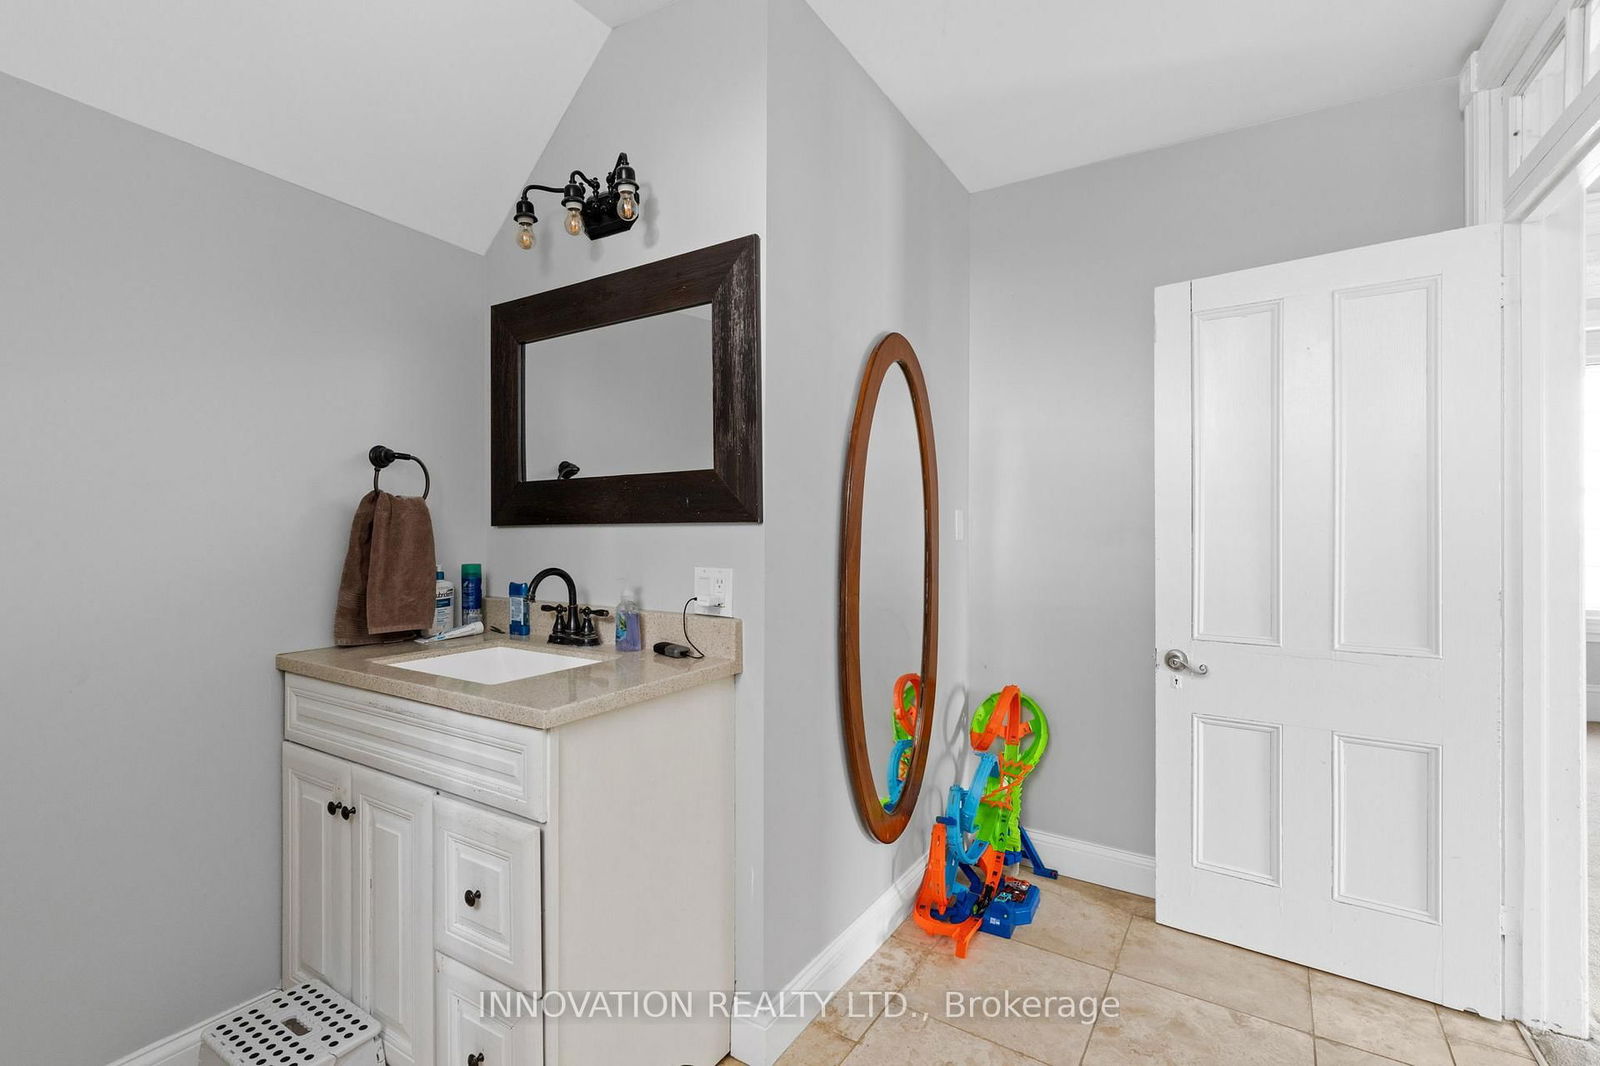
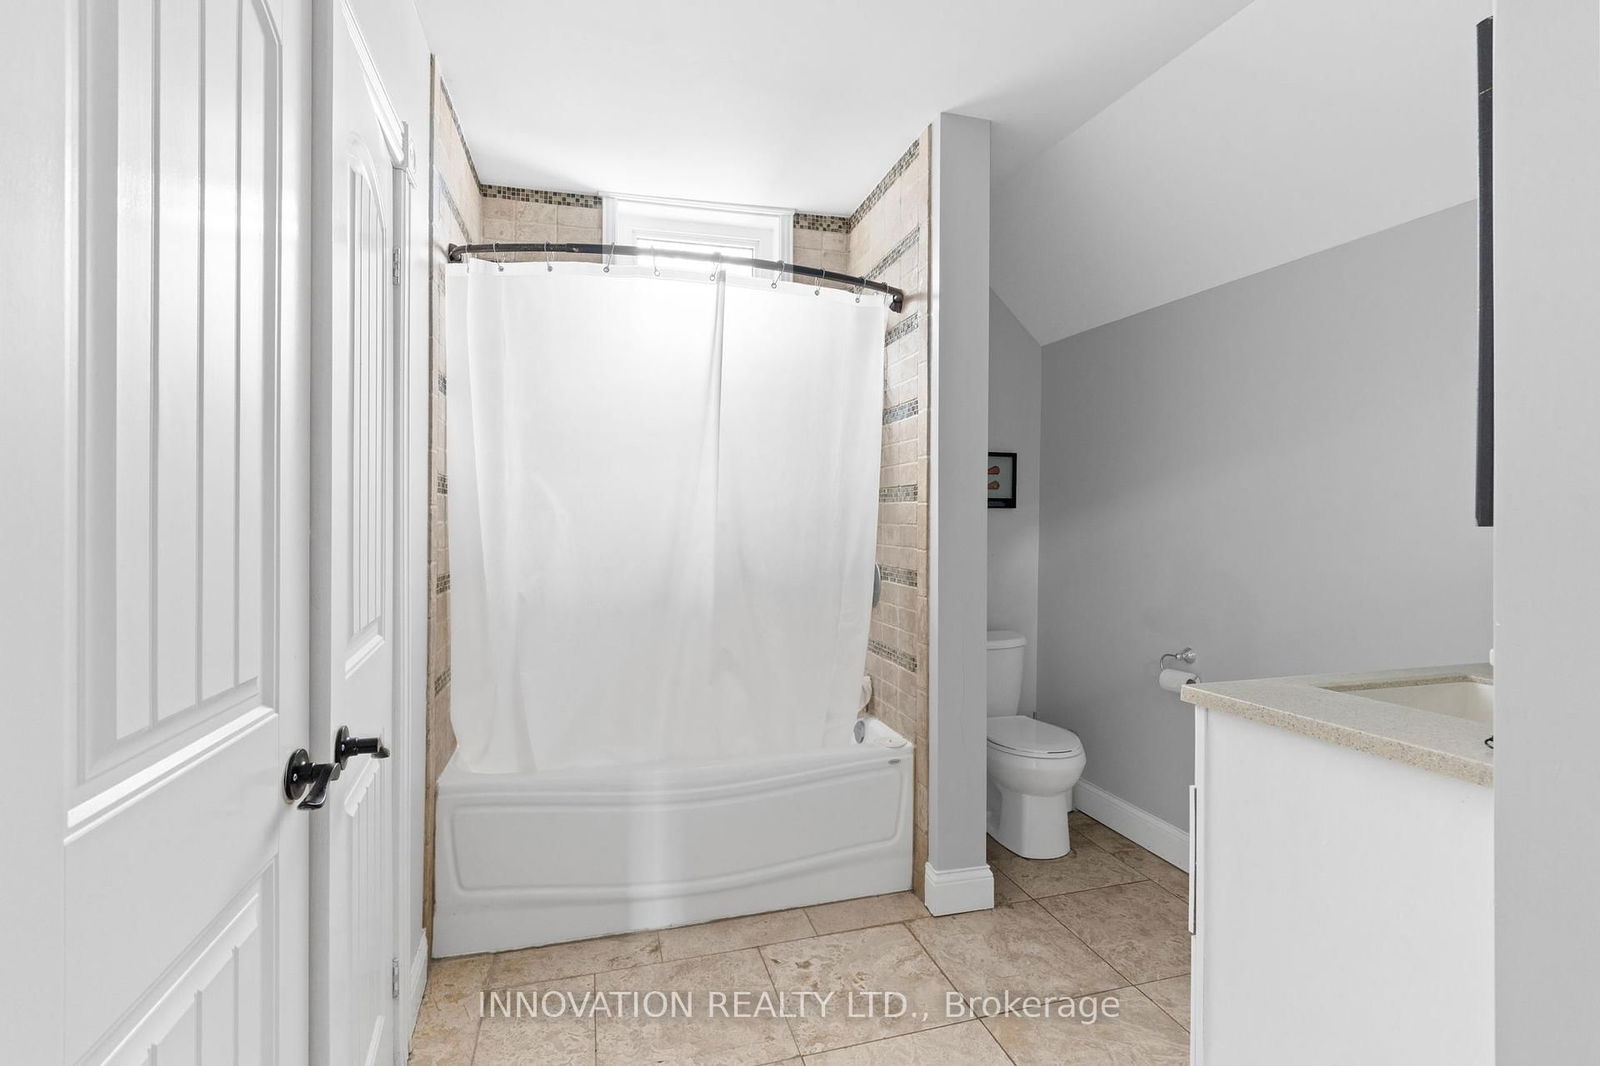
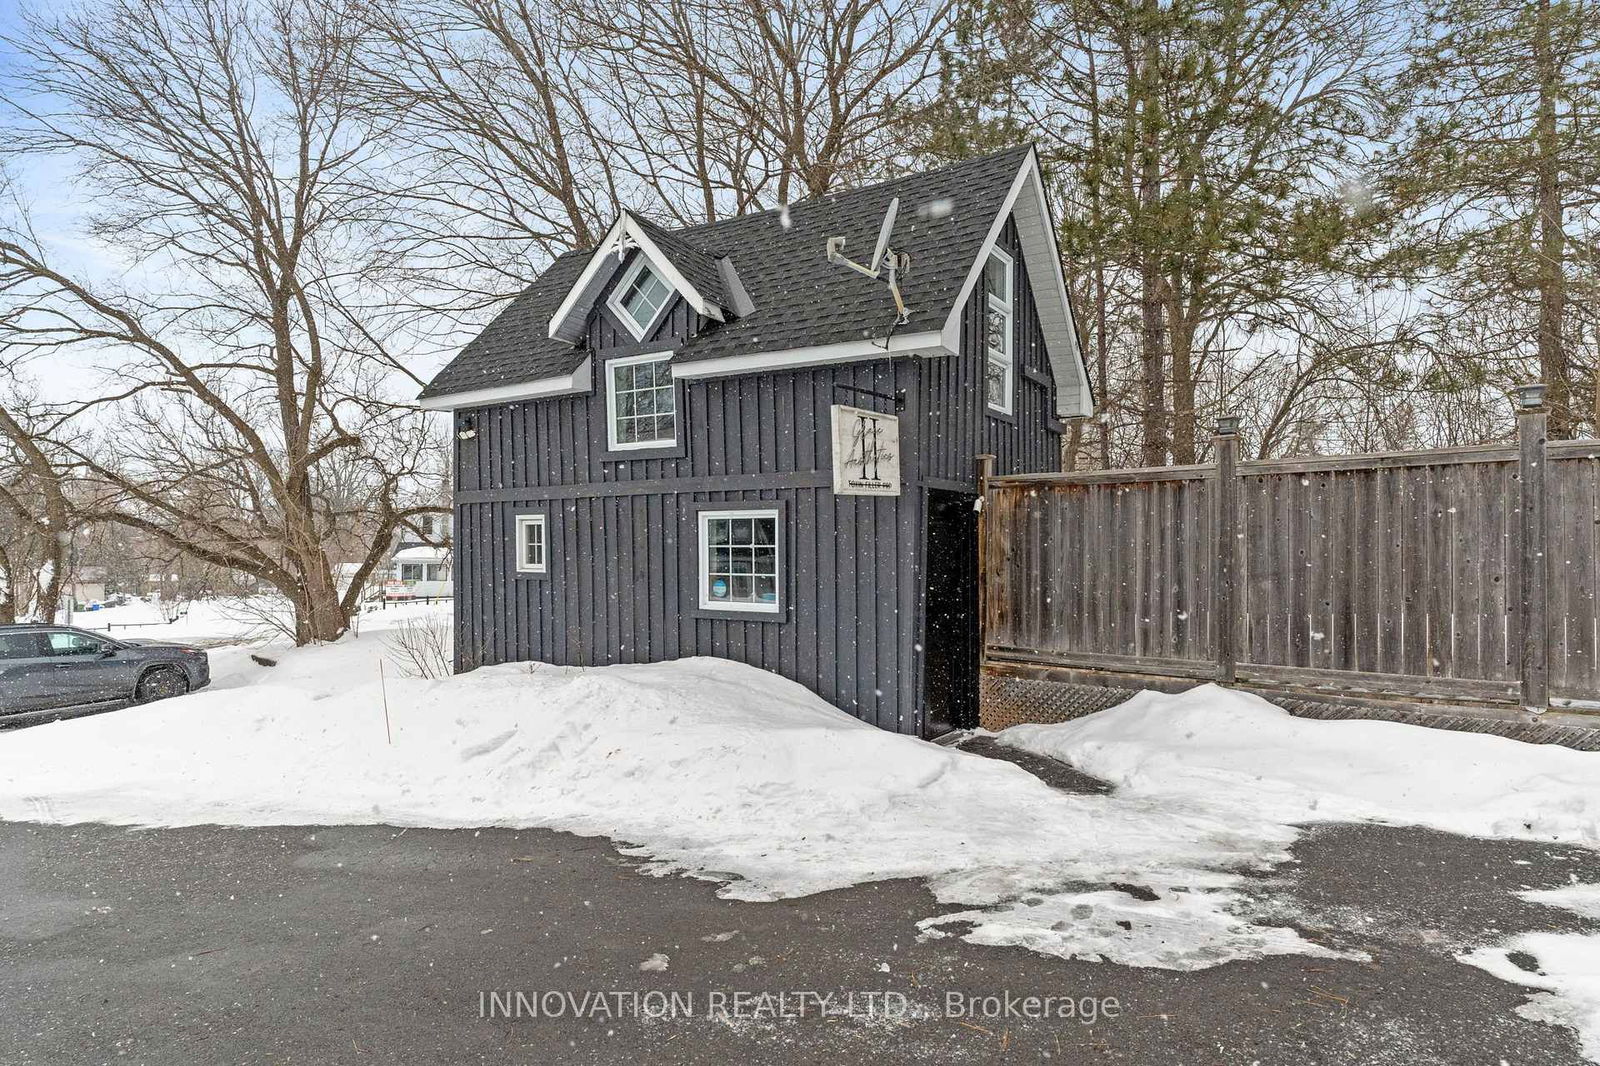
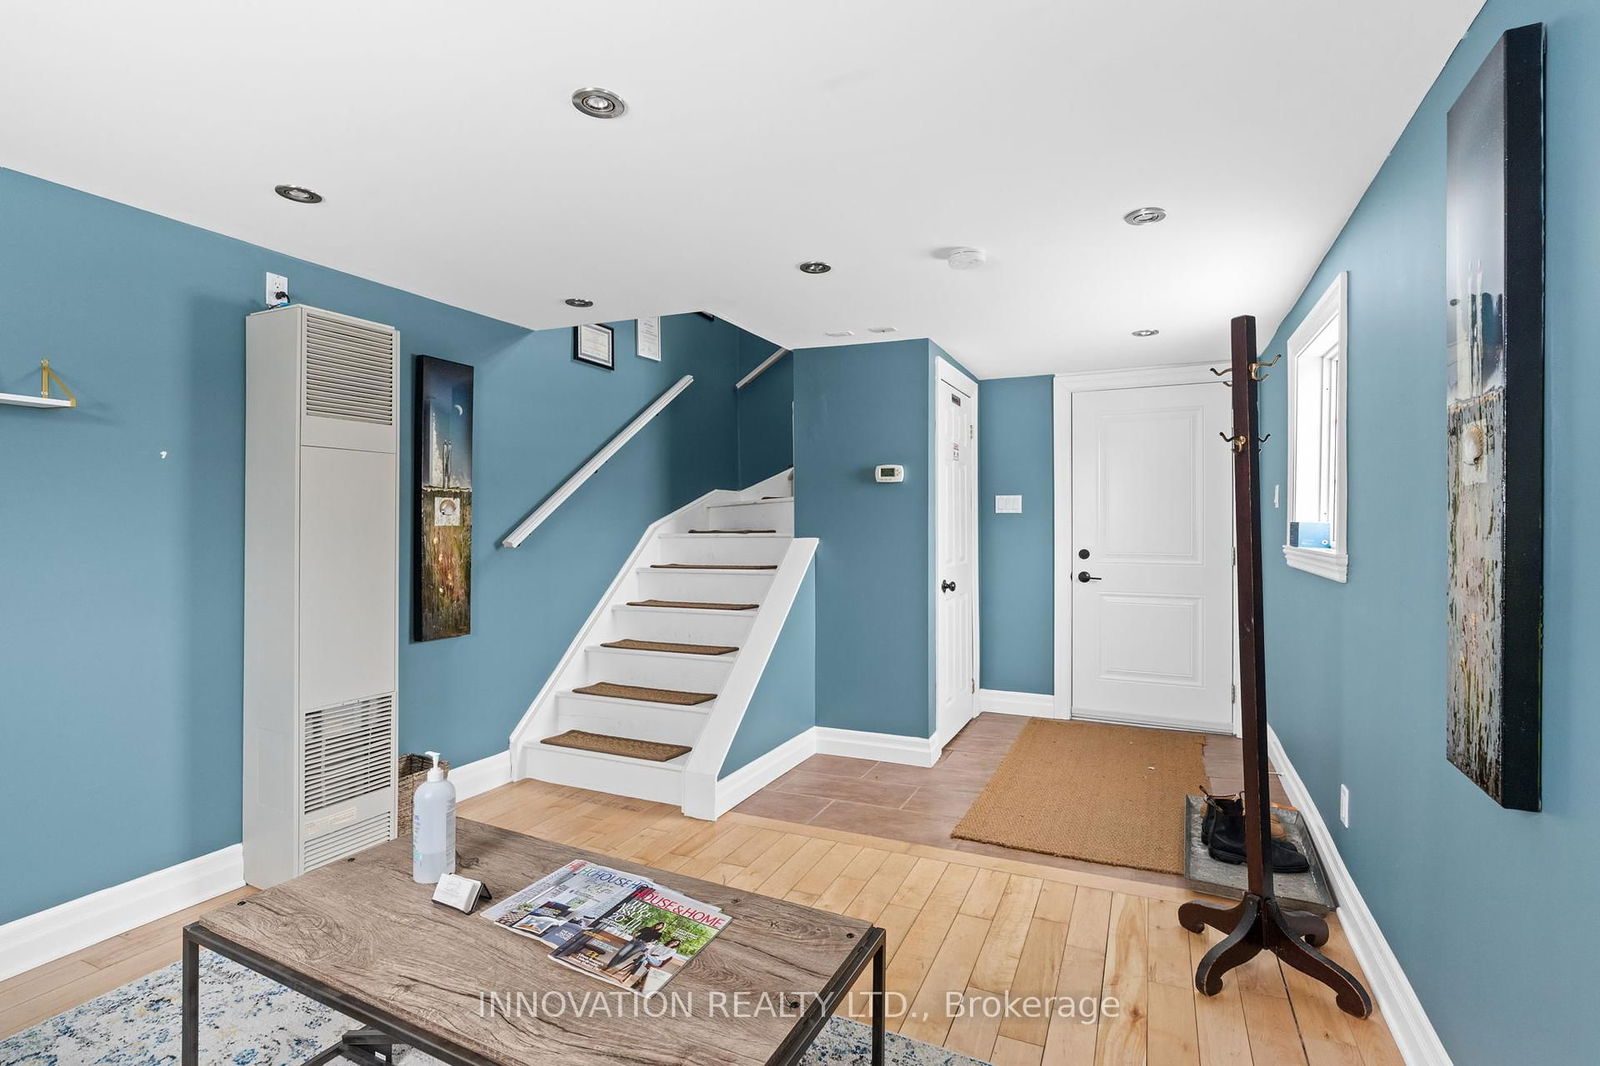
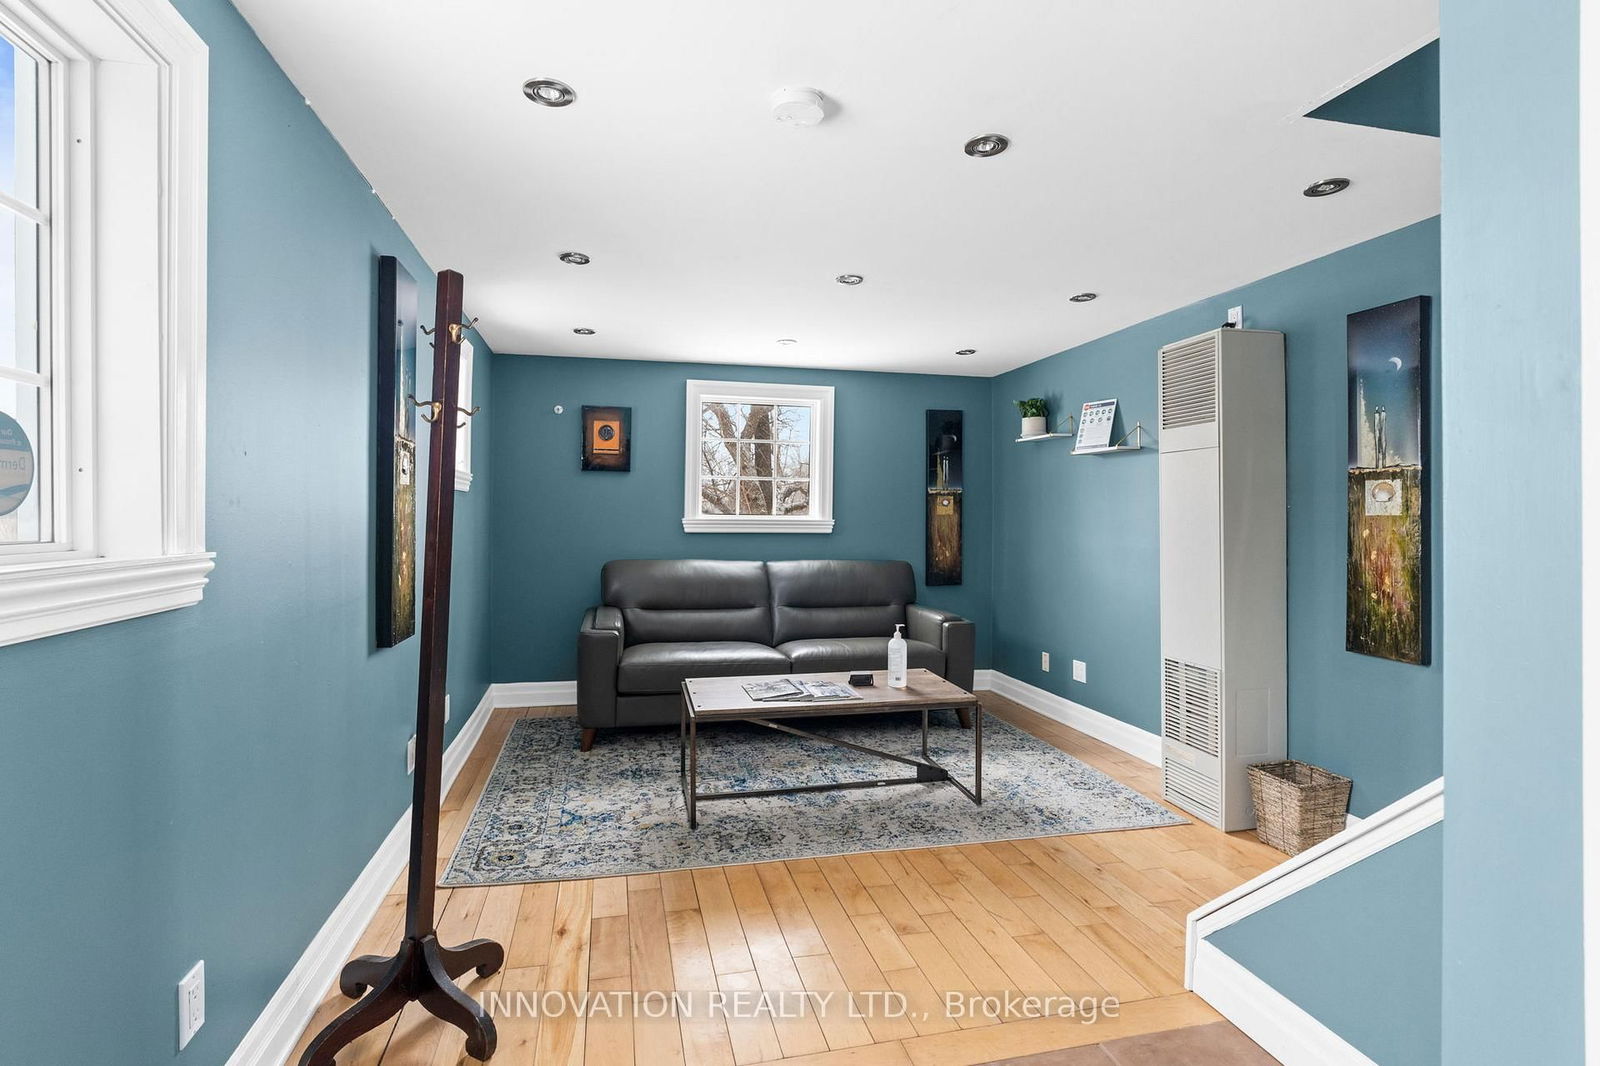
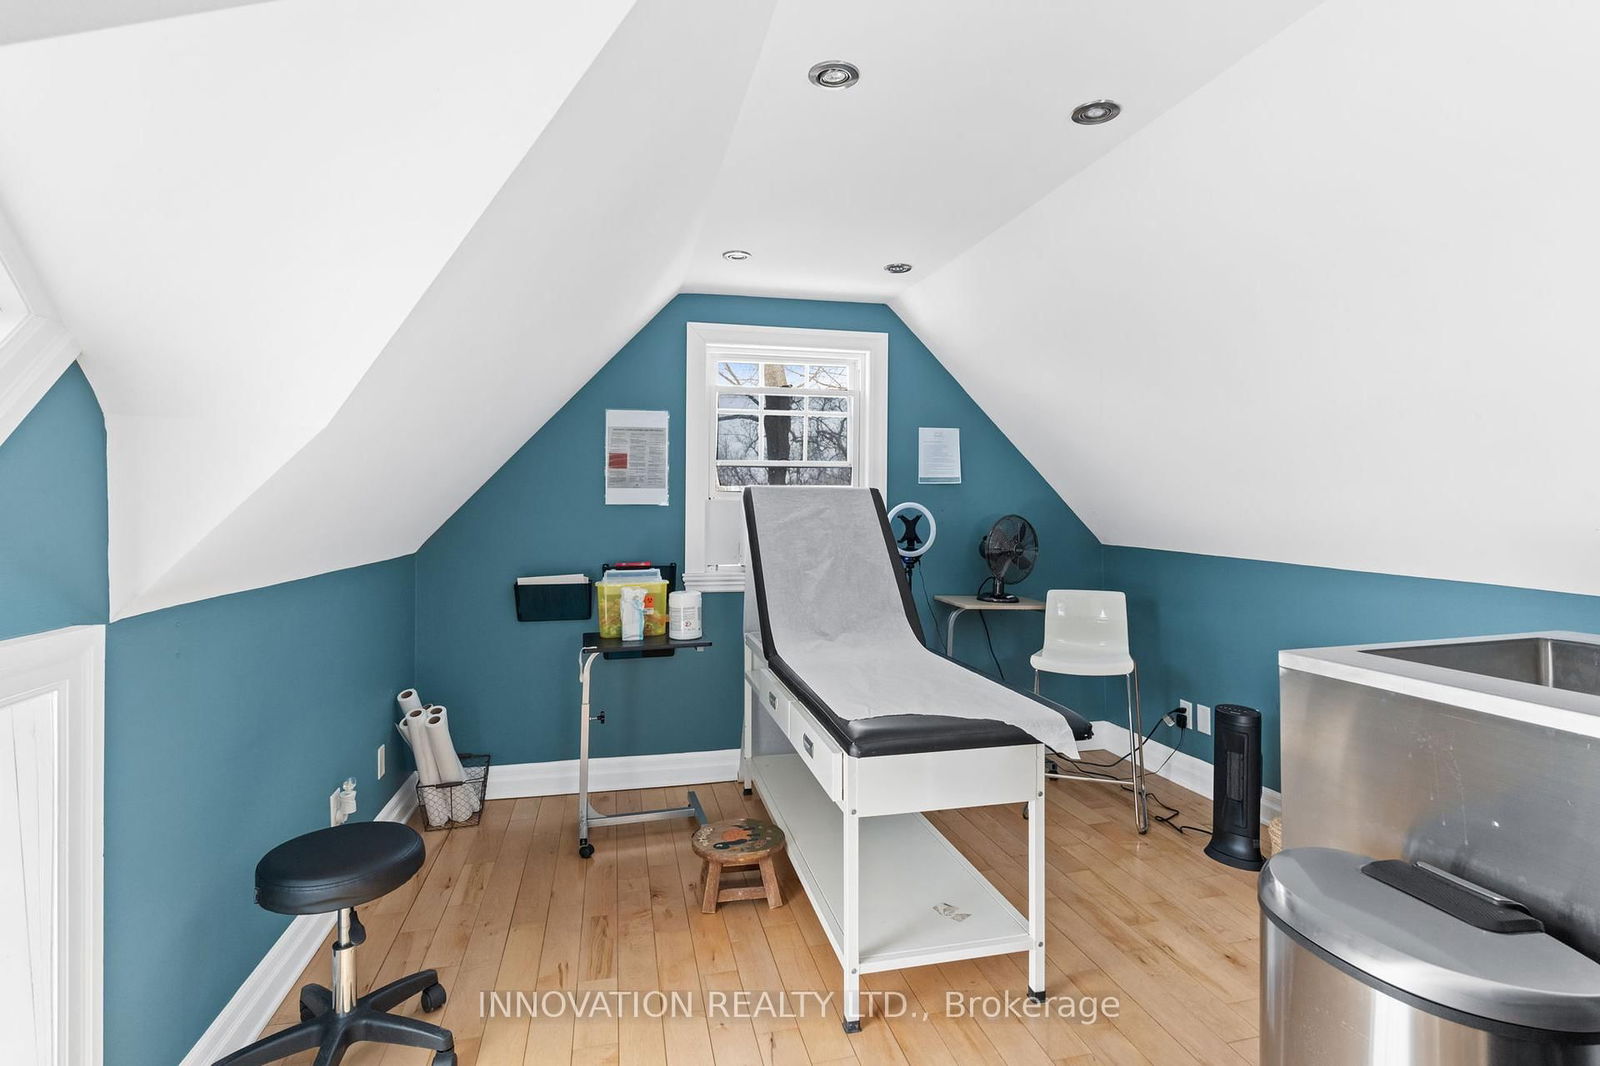
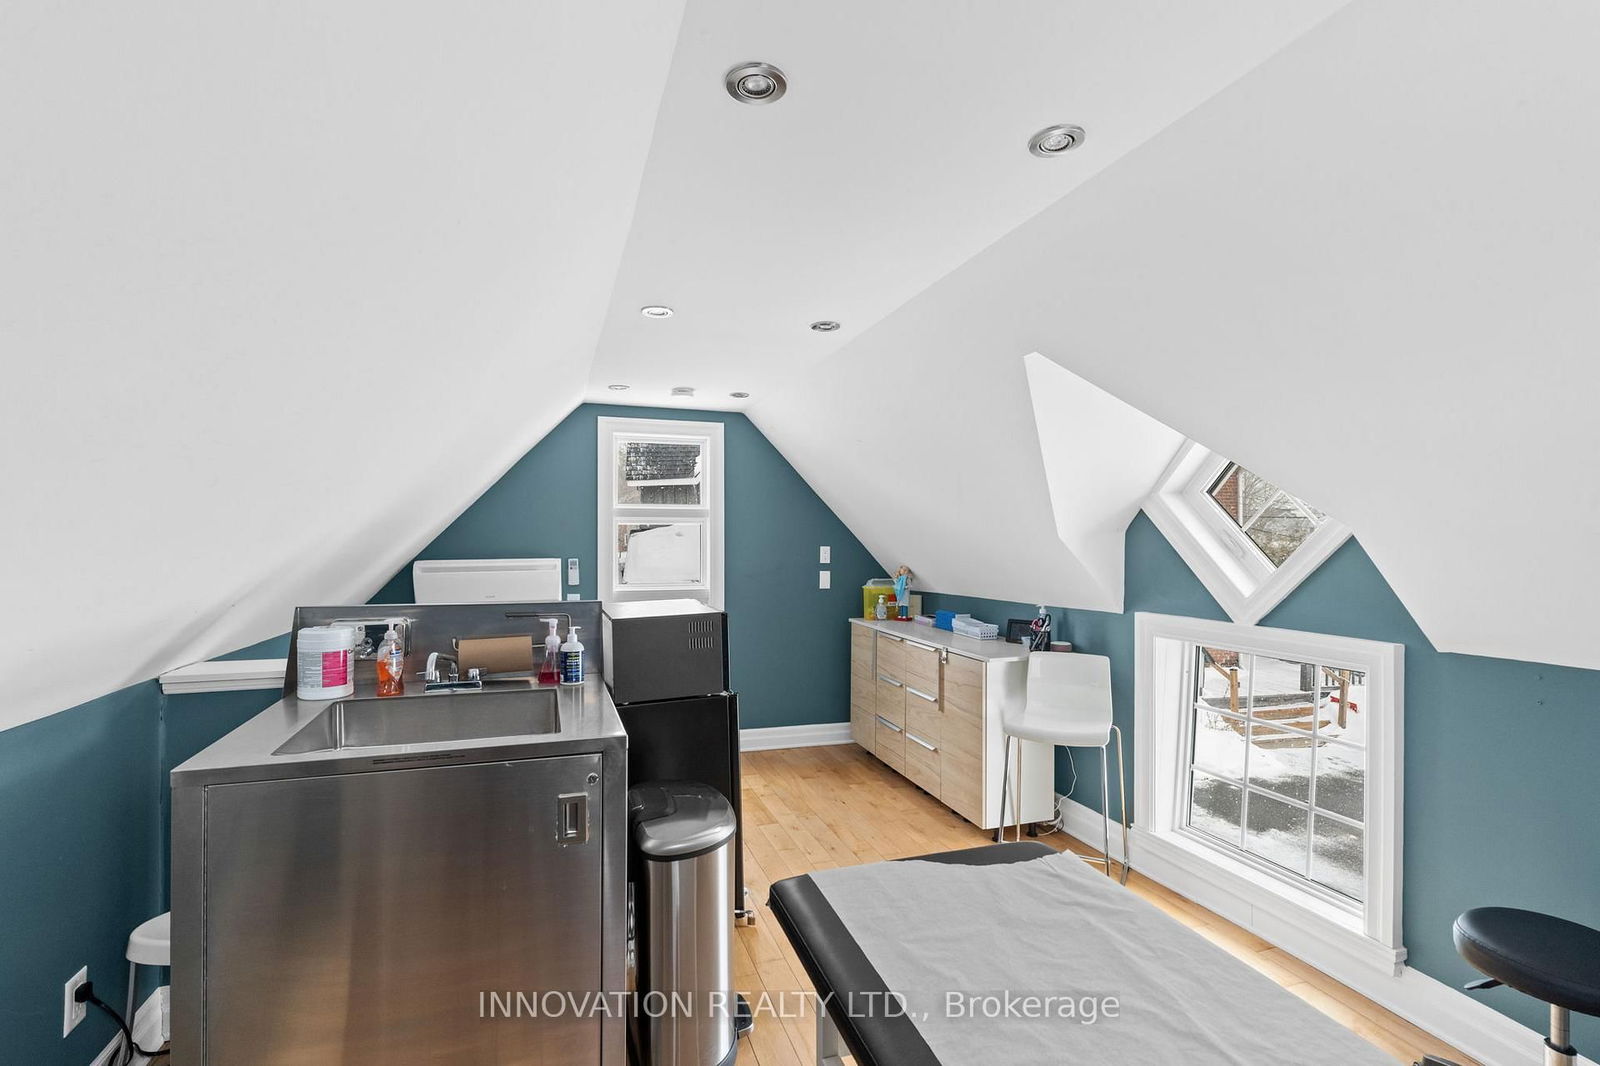
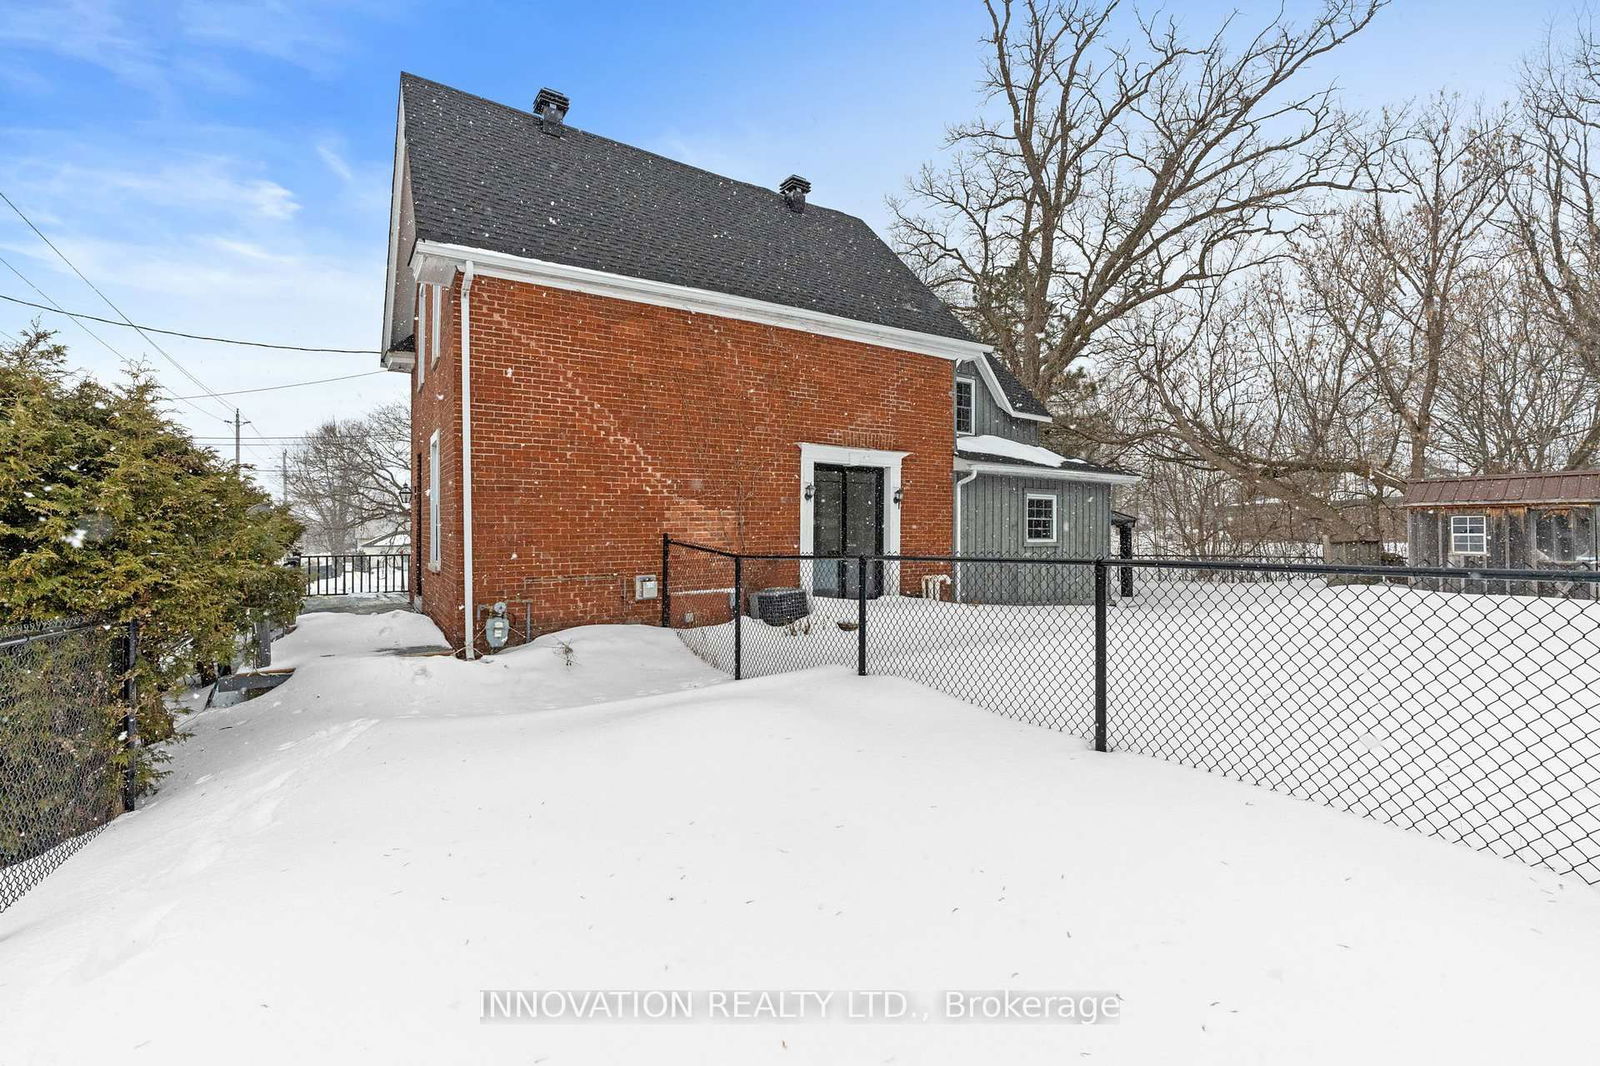
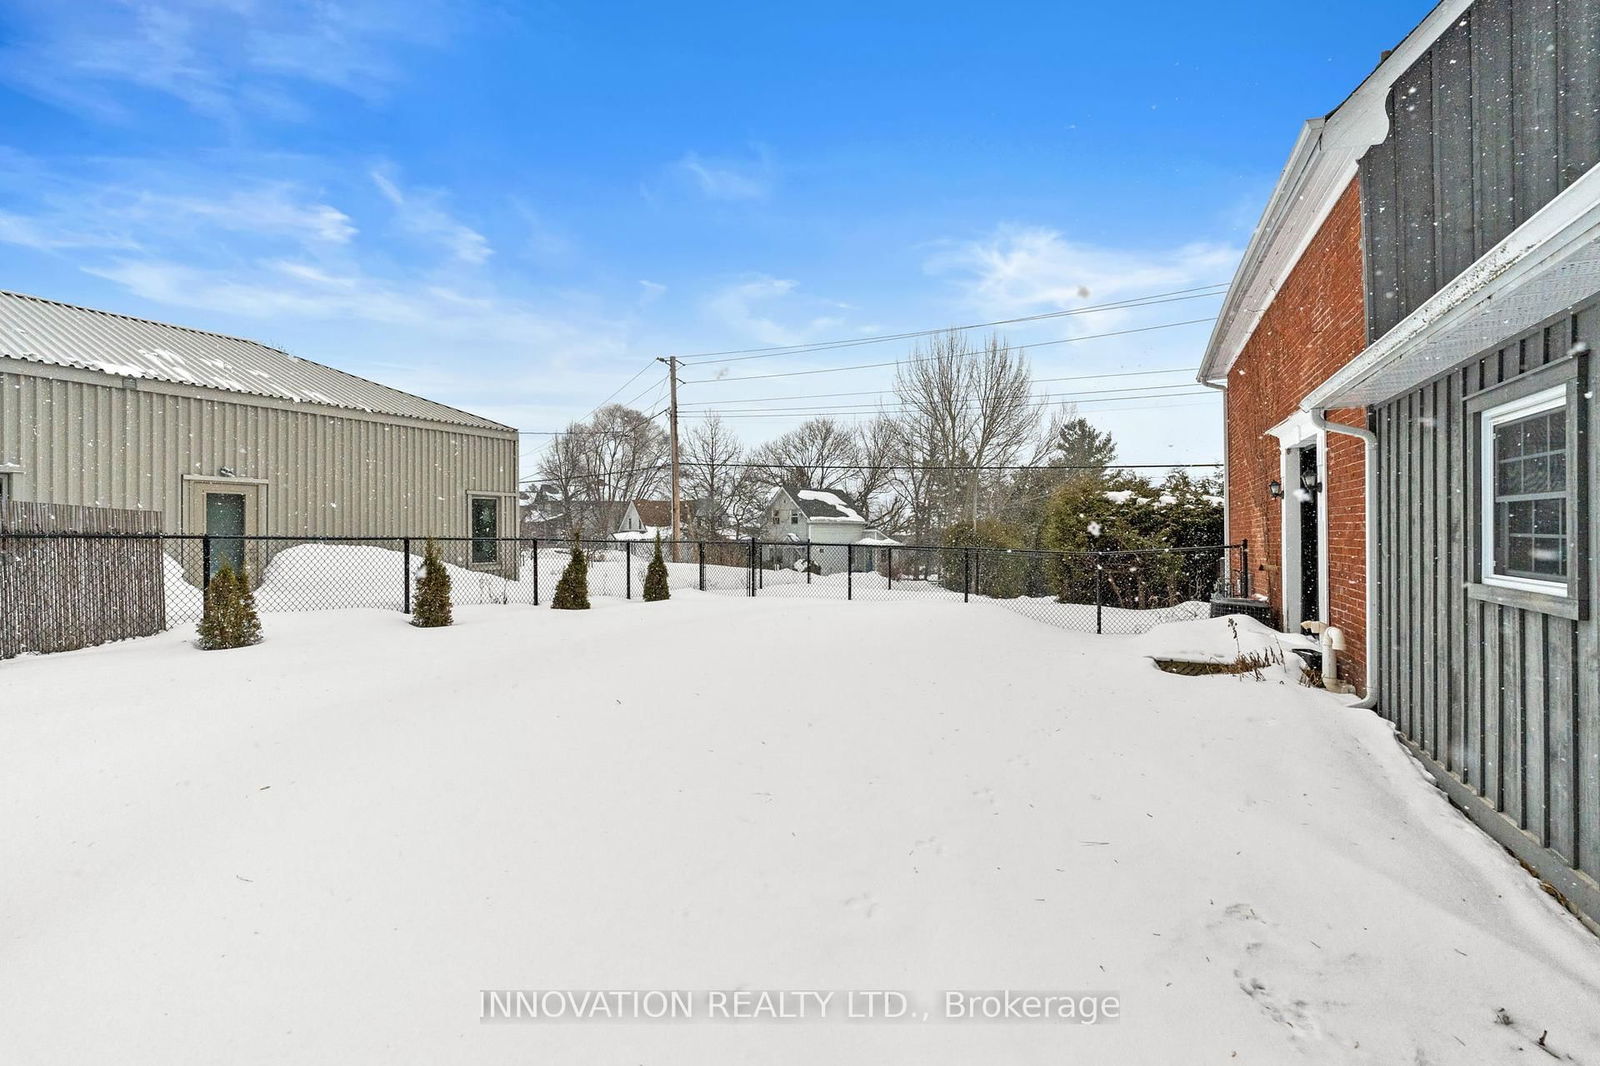
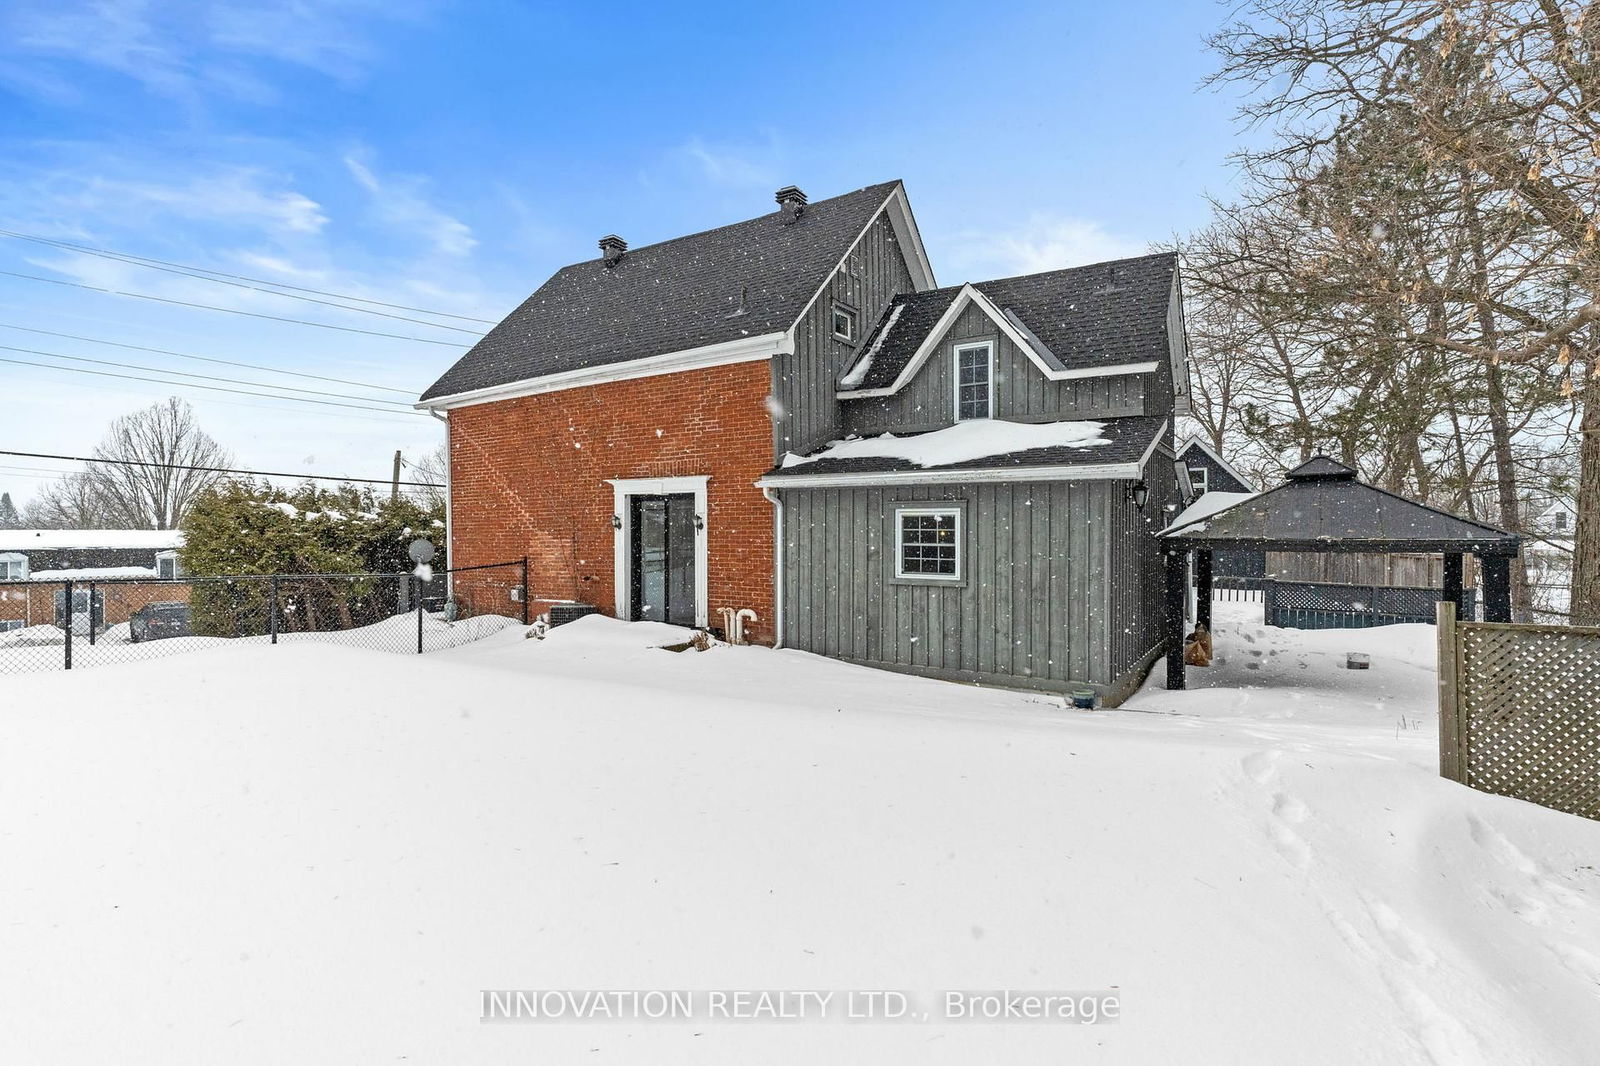
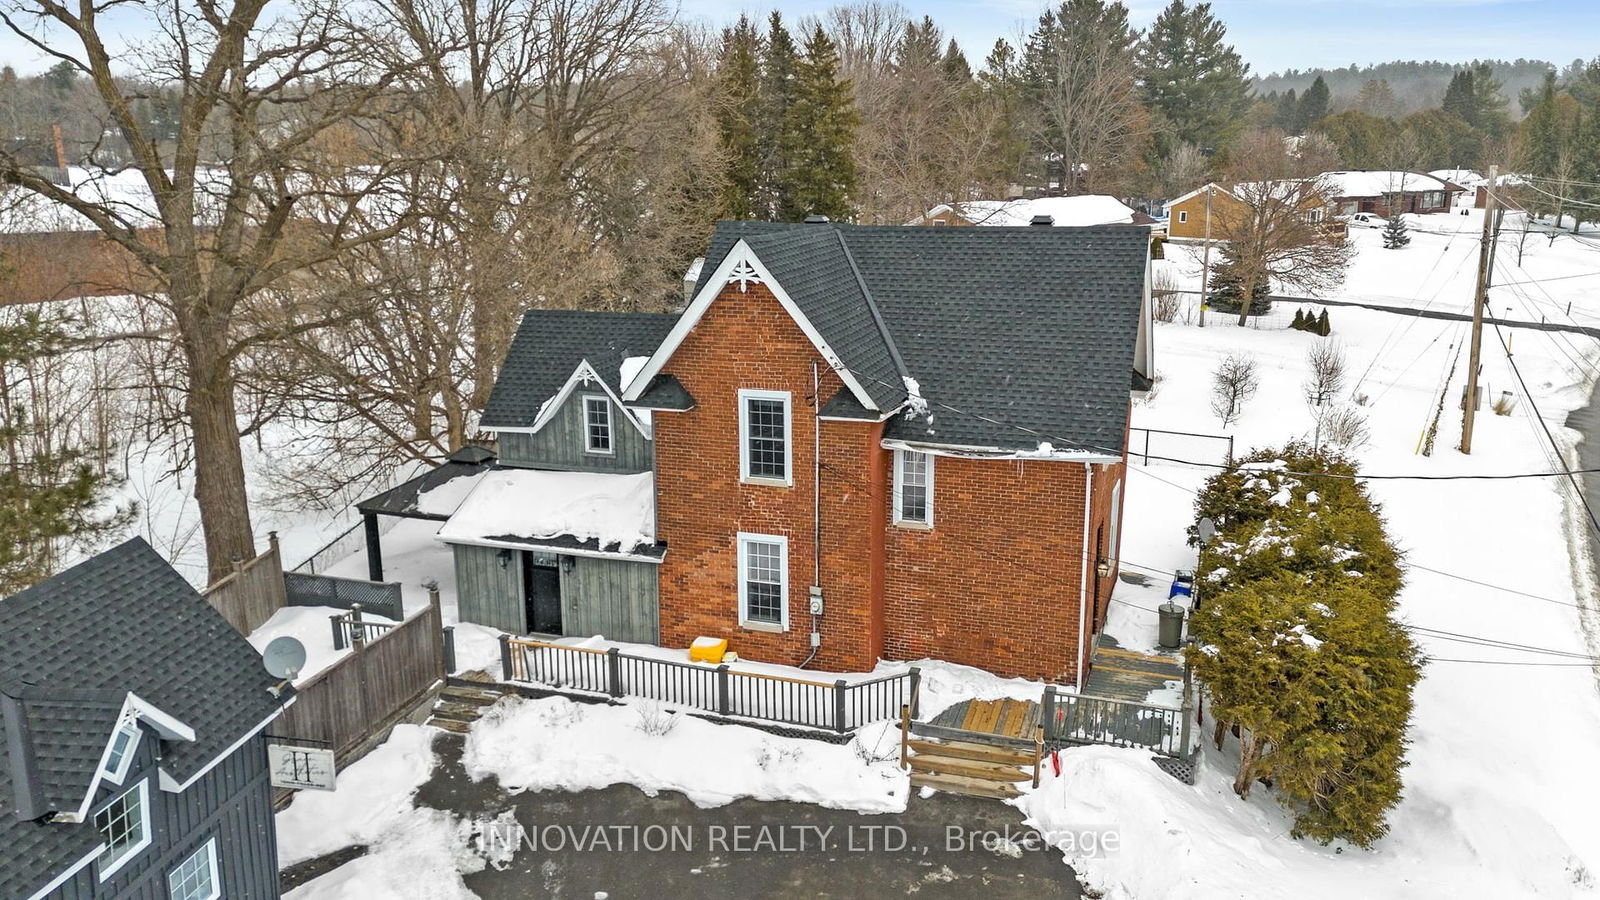
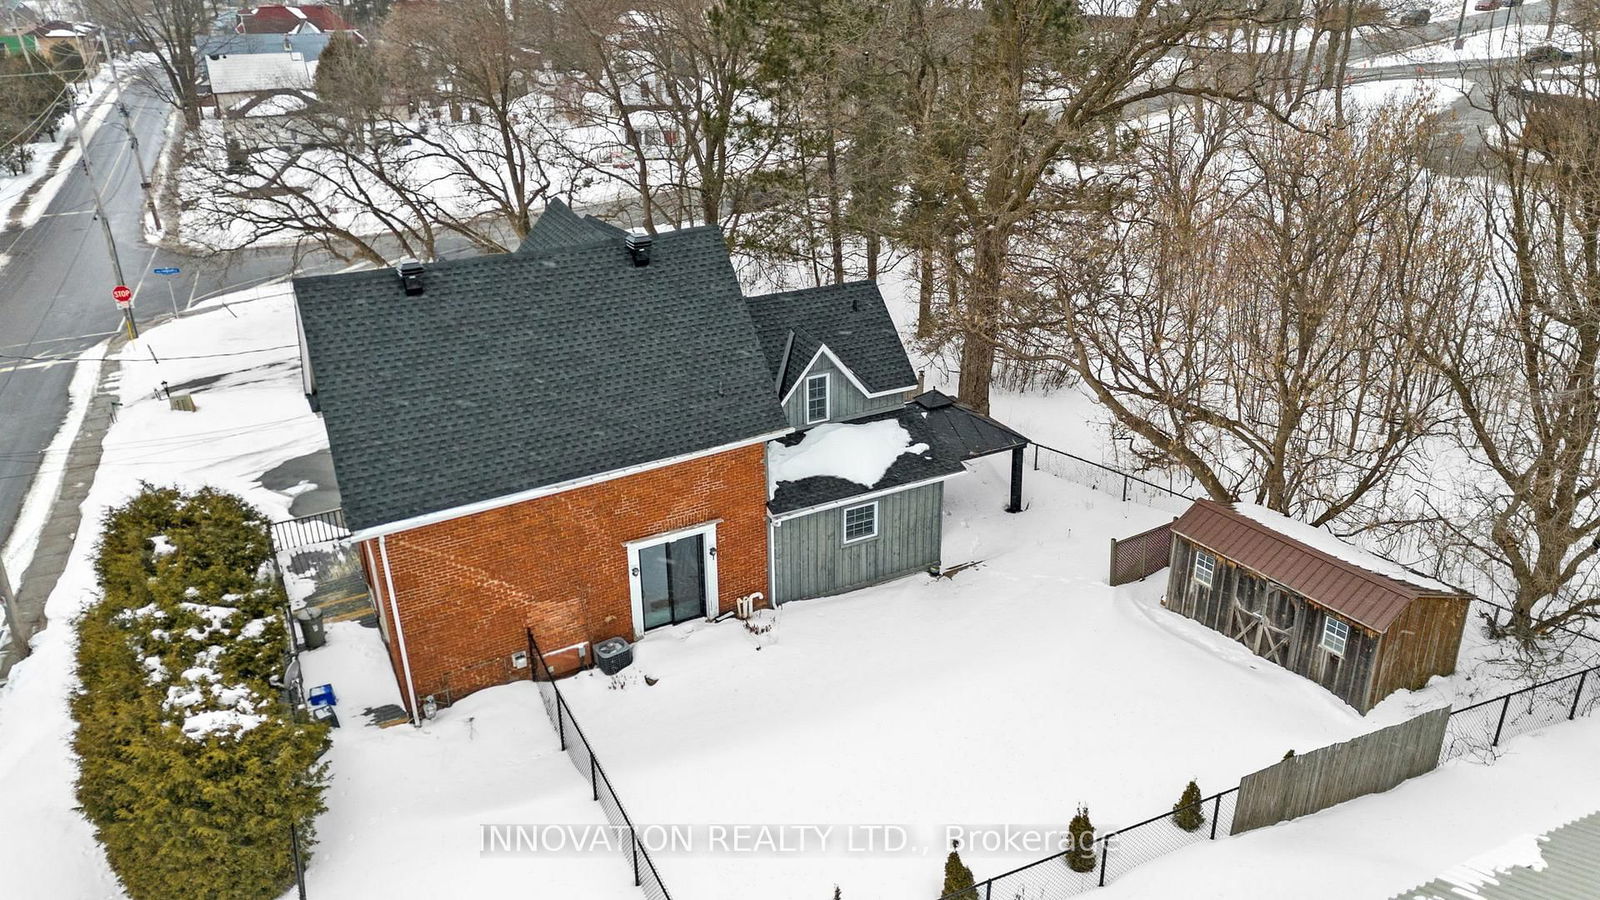
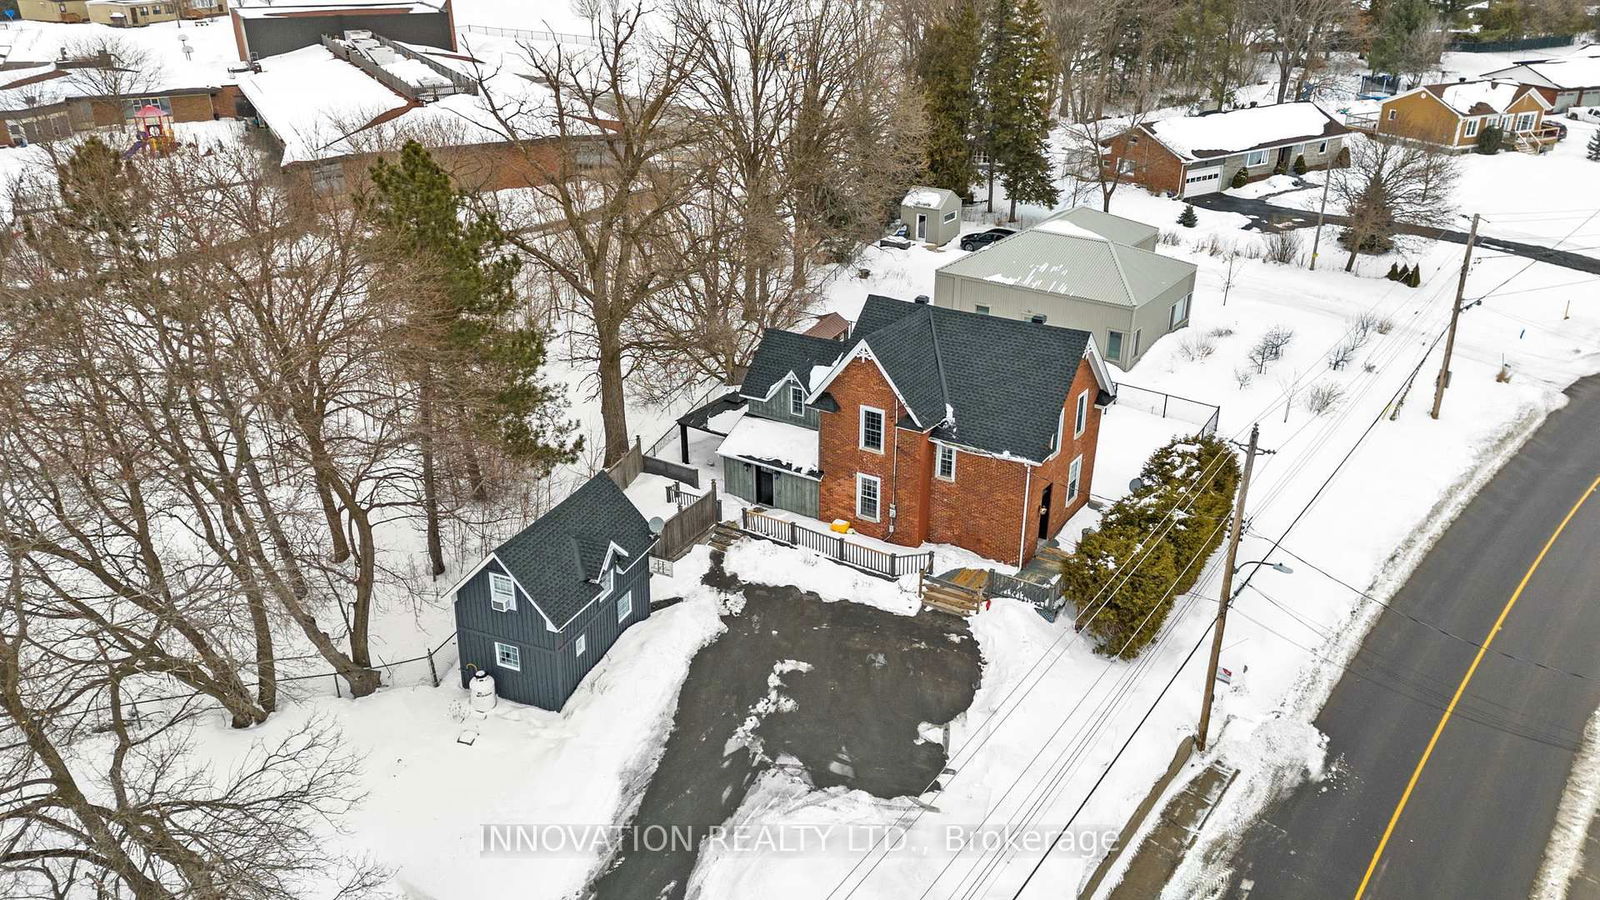
Welcome to 348 Donald B Munro Dr.! This non-conforming Duplex is a beautiful Victorian Brick home filled with character and charm located in the quaint Village of Carp with a bonus detached studio/flex space. Main level unit was rented for $2,200/m and the upper unit is currently being rented for $2,000/m. Insurance, Utilities, Water/Sewer, Snow removal and Taxes are ($12,138). Giving you an annual cash flow ($38,262). This unique property features numerous modern updates throughout. The renovated main level unit has a welcoming layout with hardwood and ceramic flooring throughout, spacious living/dining room and modern chef-style eat-in kitchen with an abundance of cabinetry, granite countertops and stainless-steel appliances. 1 bedroom + den features plenty of closet space with easy access to a fully renovated bathroom. Main Floor powder room & Laundry room. The second level unit is equally beautiful and mimics the lower level with a spacious living/dining room and modern chef-style eat in kitchen. 2 sun-filled bedrooms and plenty of closet space with easy access to a fully renovated bathroom. Second Floor Laundry. There are numerous options for this property, great for investment, a single-family home and with the potential for a home-based business or a teenage retreat. This incredible property is zoned V1M and is situated in a great community, close to schools, indoor arena, outdoor rink, Medical Centre, Farmers Market, tennis courts, restaurants, coffee shops and bakeries. Also ideal for the outdoor enthusiasts, nature lovers and golfers and within proximity to Trails, Ottawa River, Boating, Fishing, Irish Hills Golf and Country Club and so much more!
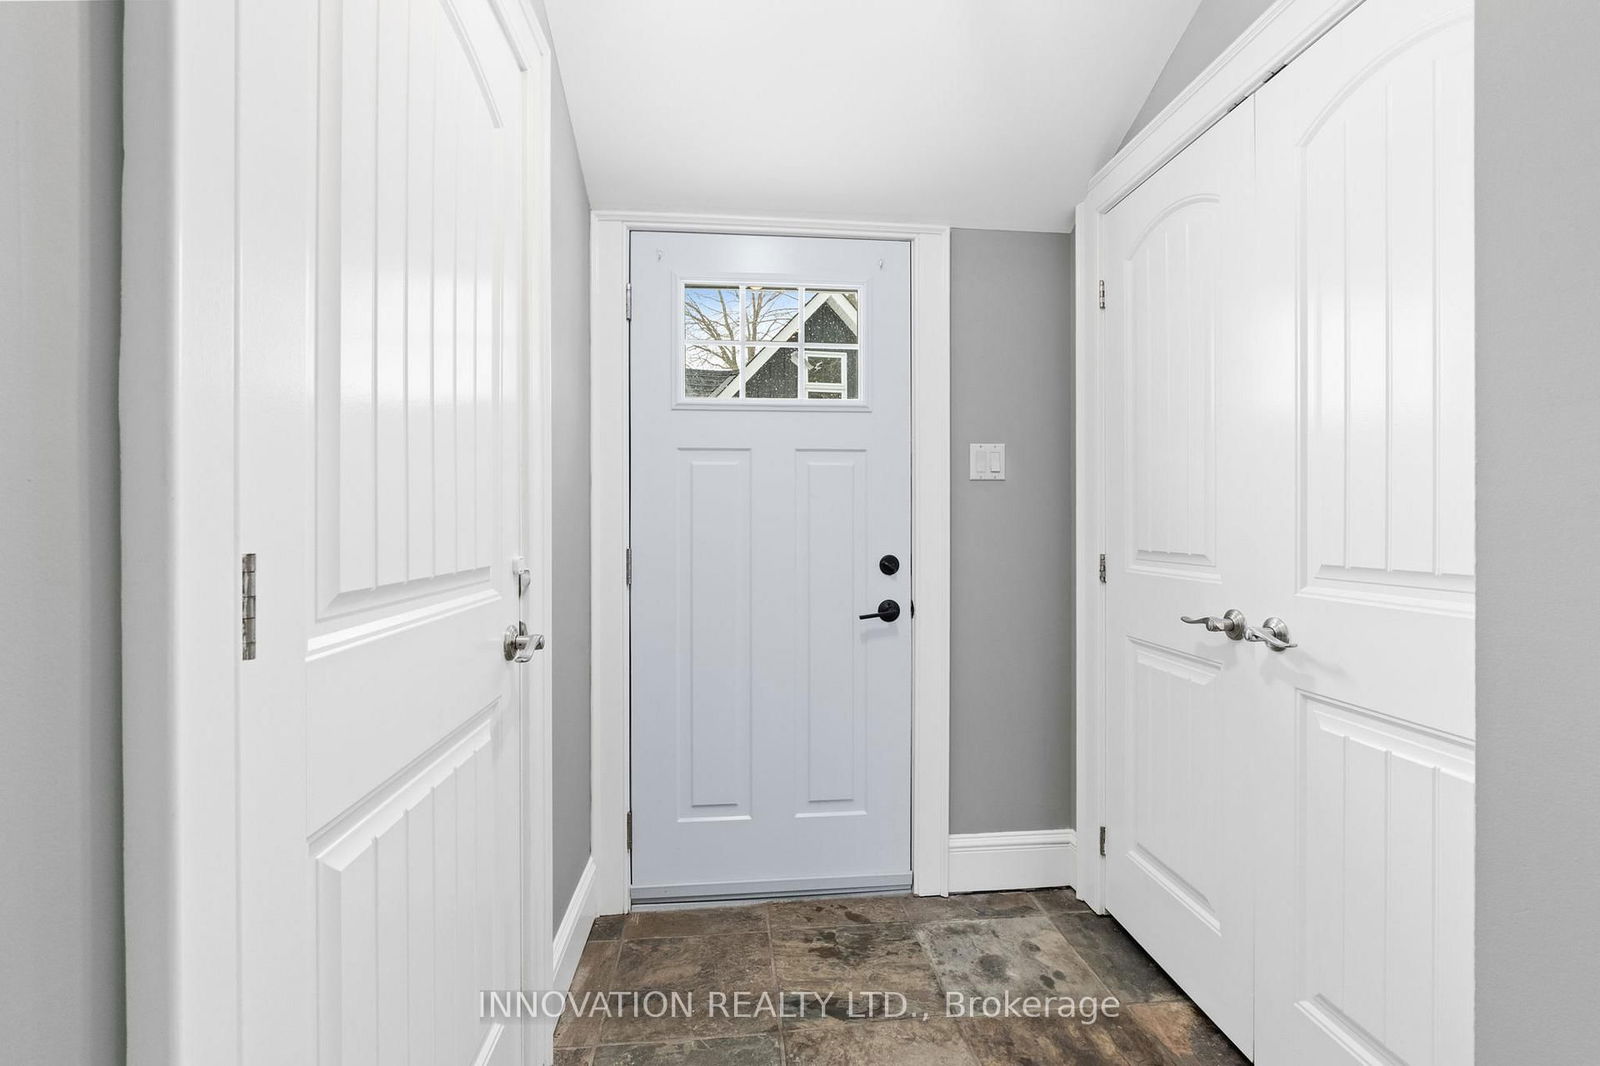
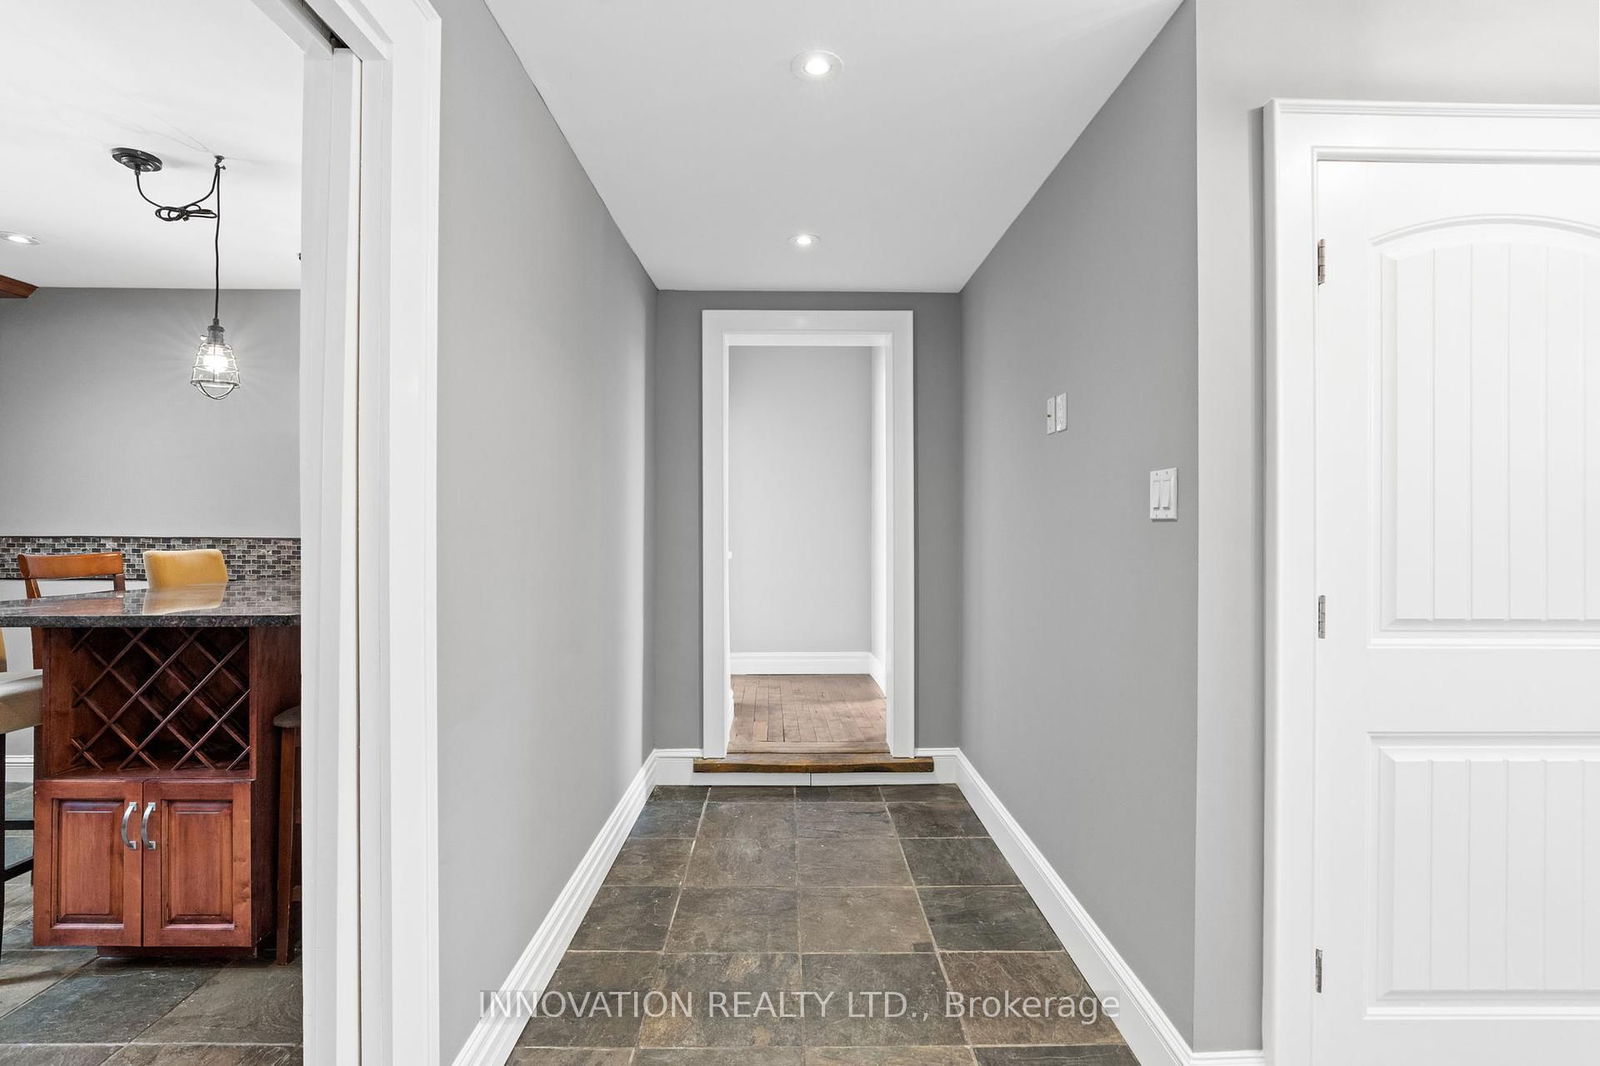
Foyer
Living
Kitchen
Den
Prim Bdrm
Living
Kitchen
Prim Bdrm
2nd Br
The graph below compares the average list price and average sale price of homes in this neighborhood by month for the last 24 months. When average sale price is greater than average list price, this may suggest a buyer's market. When average sale price is lower than the average list price this may suggest a seller's market.
The graph below illustrates the average days on market for homes in this neighborhood. The yellow area may indicate a buyer's market, the green area may indicate a balanced market and the red area may indicate a seller's market.
Sales Representative, Century 21 People’s Choice Realty Inc., Brokerage
(647) 576 - 2100