


Century 21 People’s Choice Realty Inc., Brokerage
120 MATHESON BLVD E #103
MISSISSAUGA, Ontario
L4Z 1X1
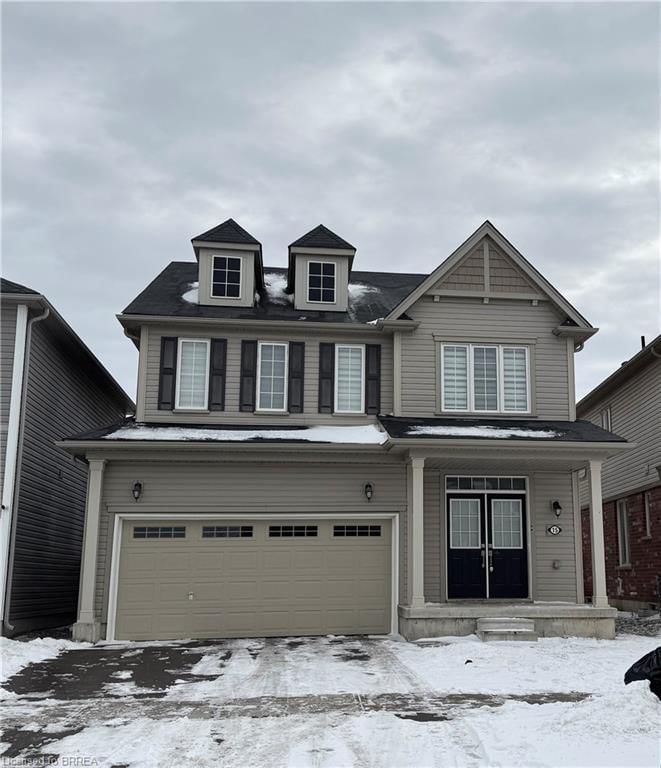


Brantford, Empire South, N3T 0P9
$3,200
Listed by Re/Max Twin City Realty Inc.
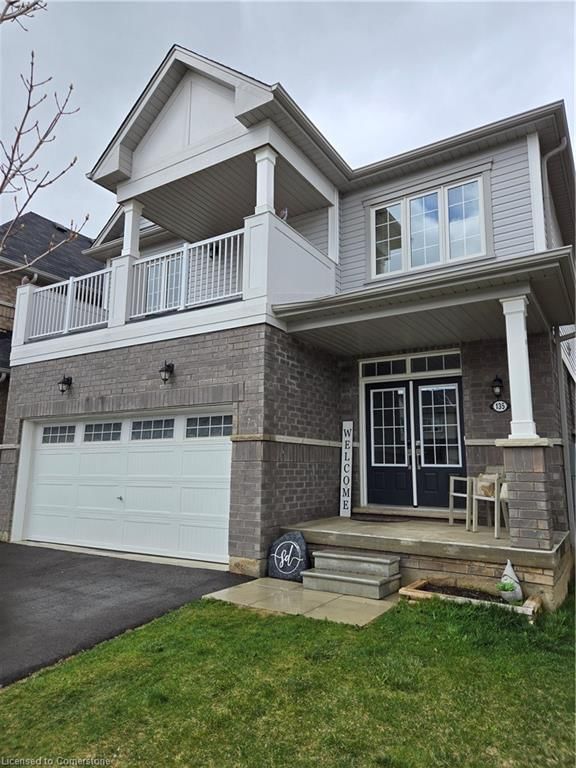
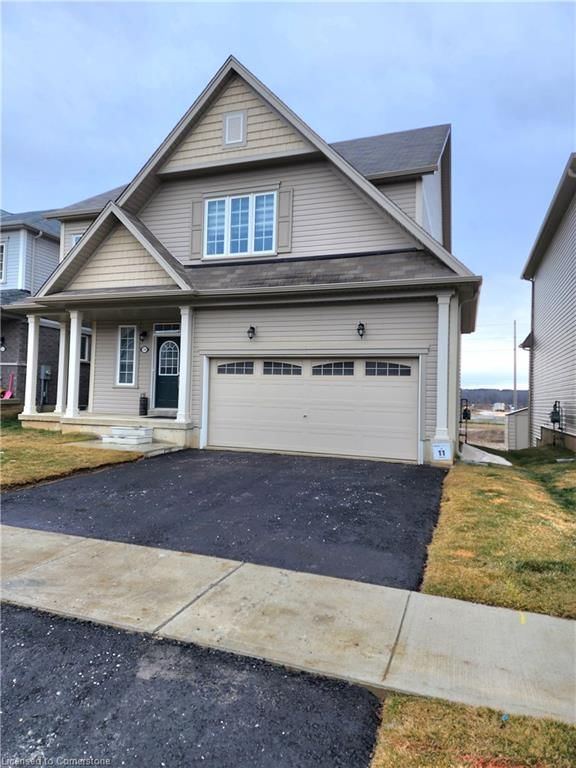
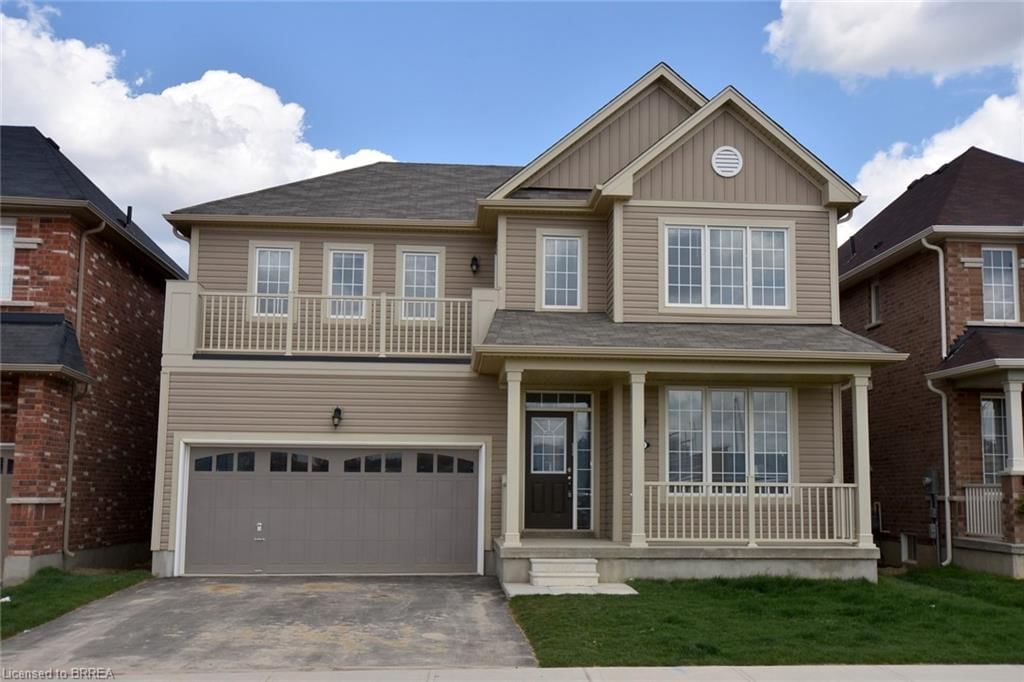
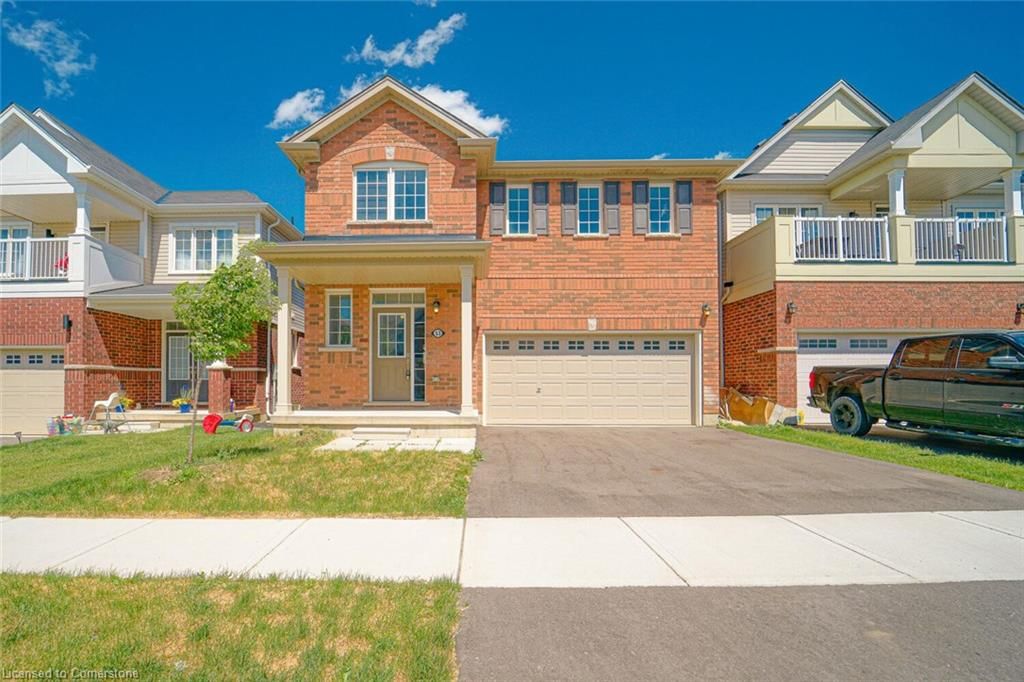
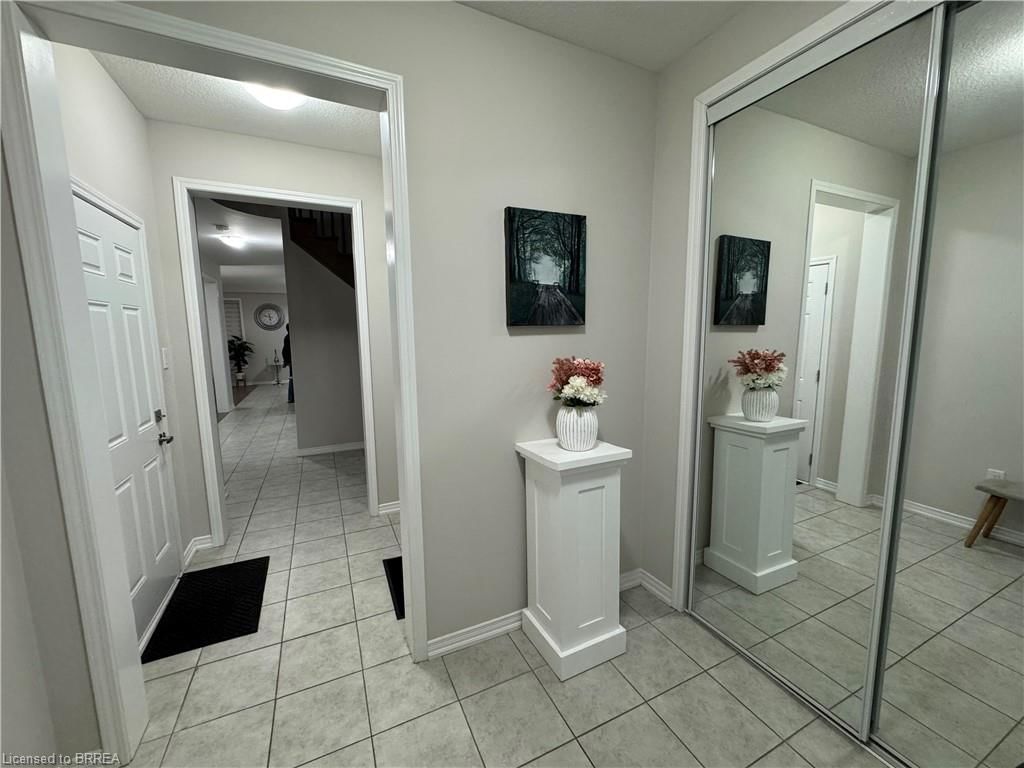
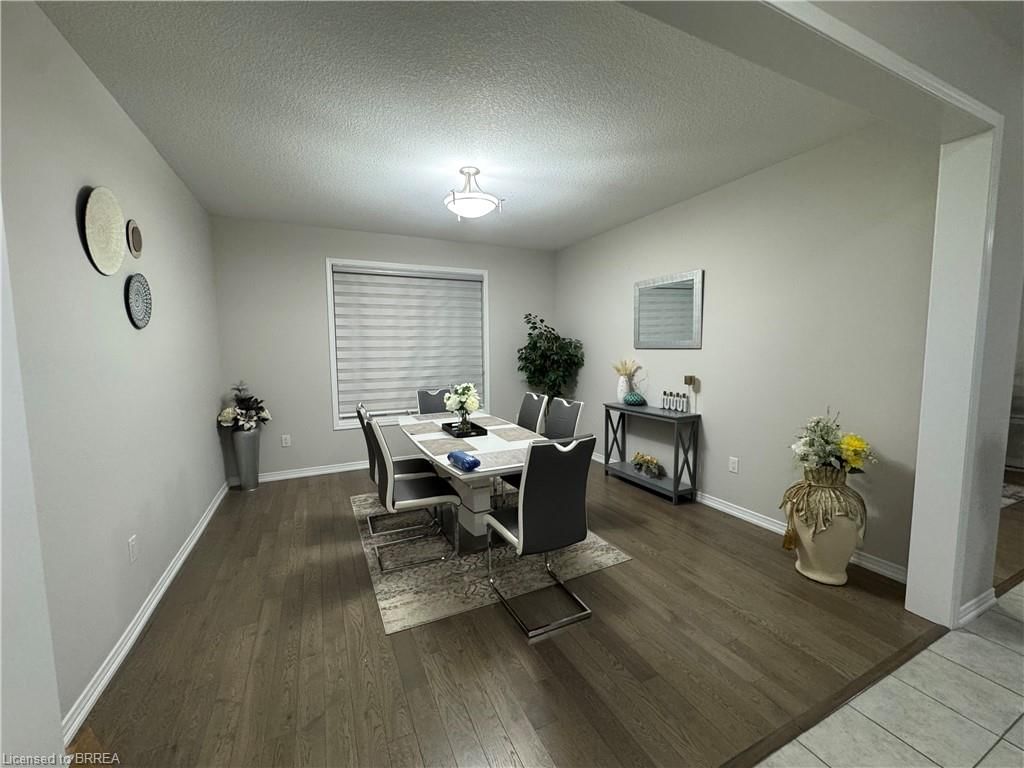
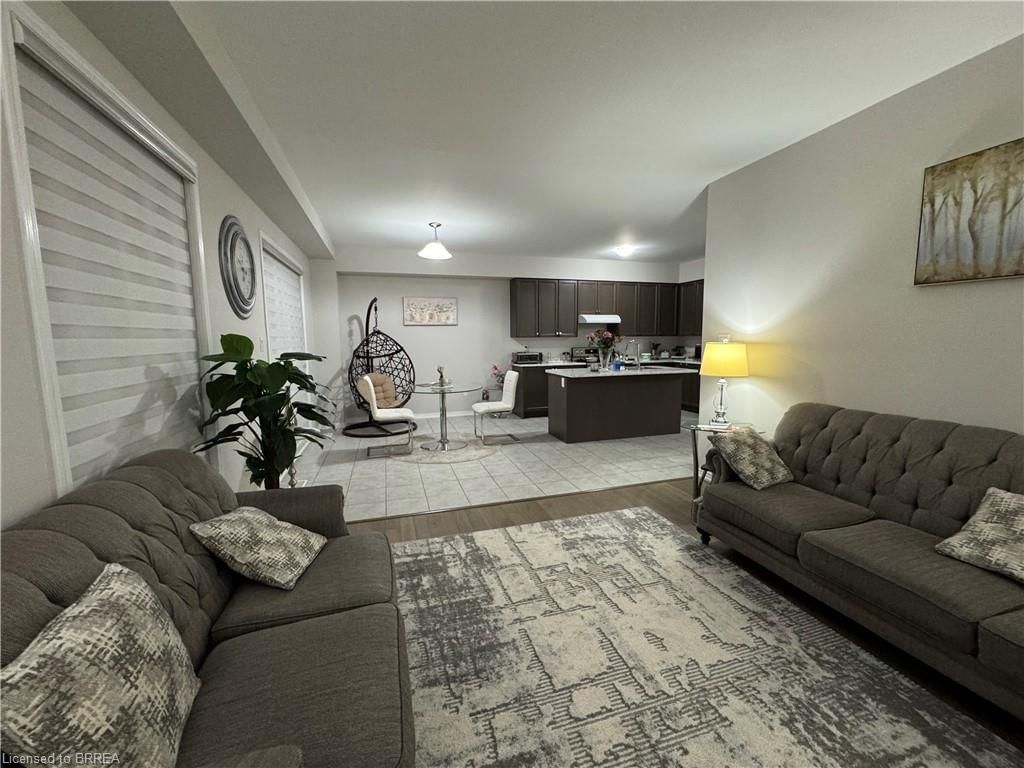
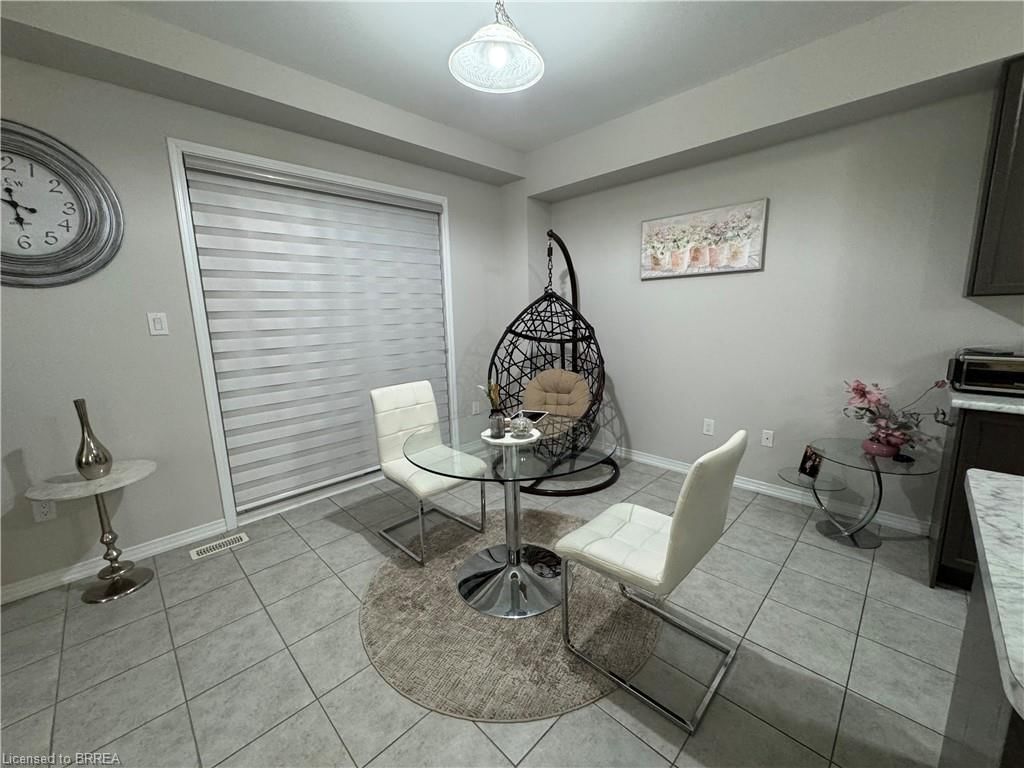
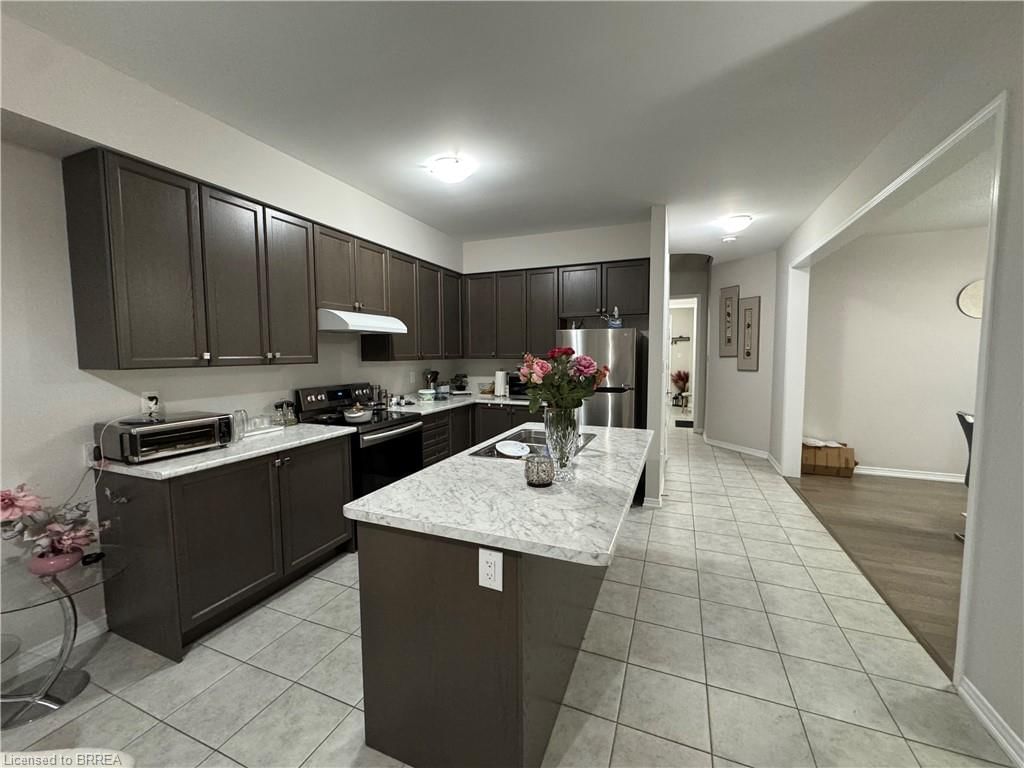
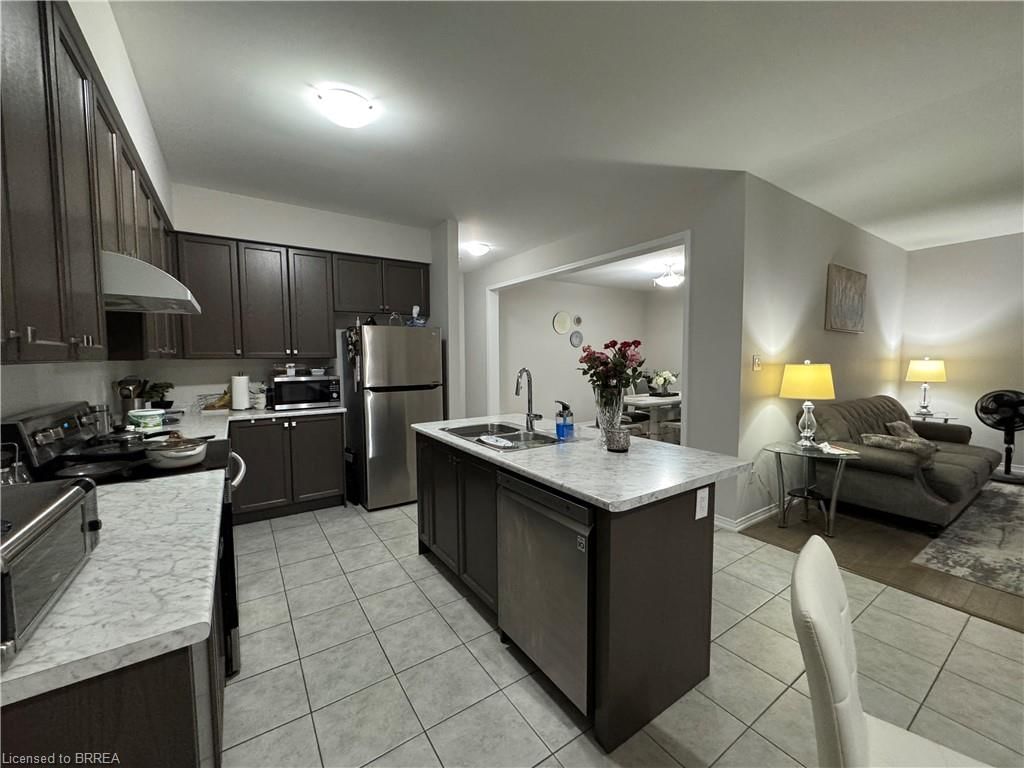
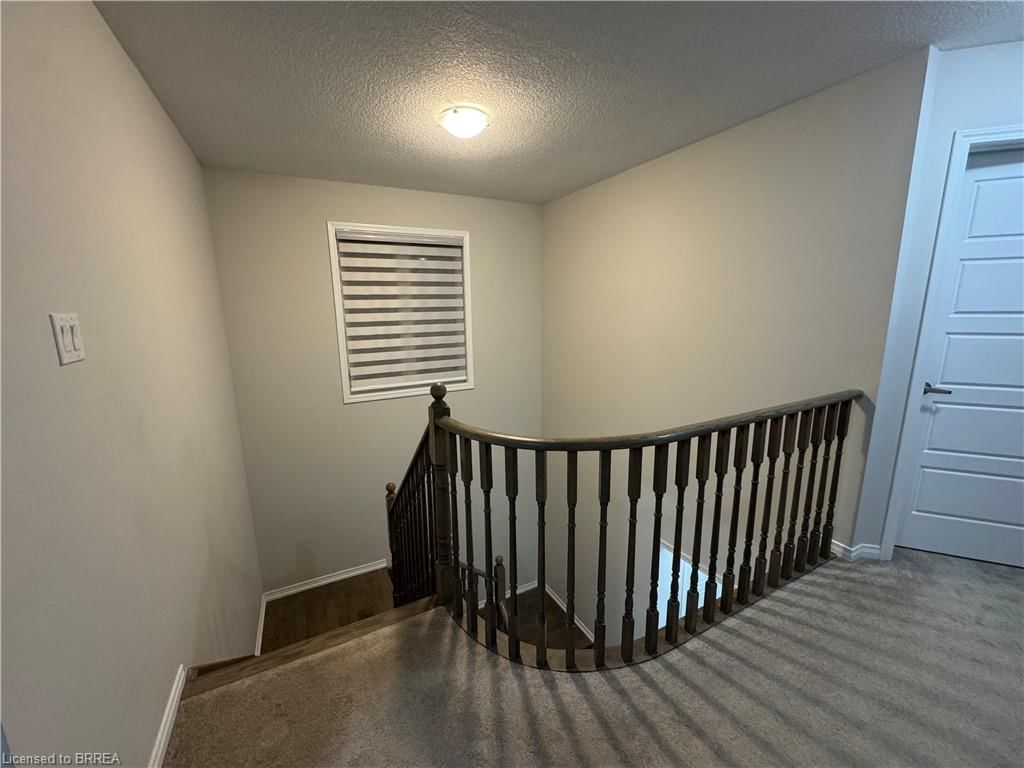
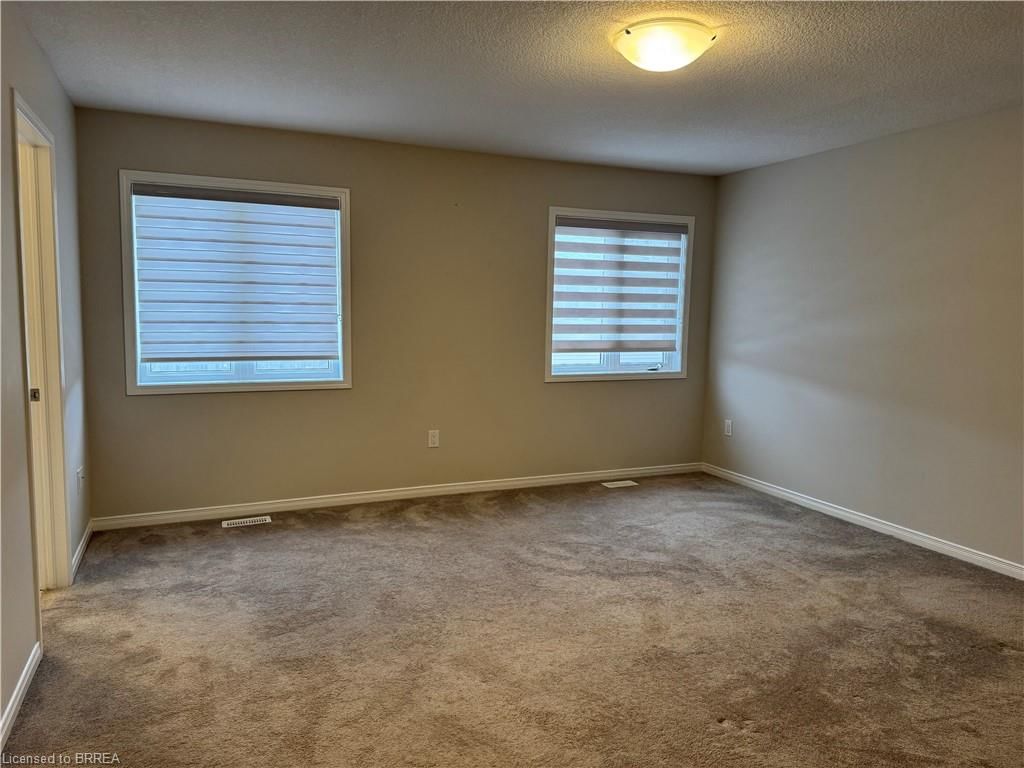
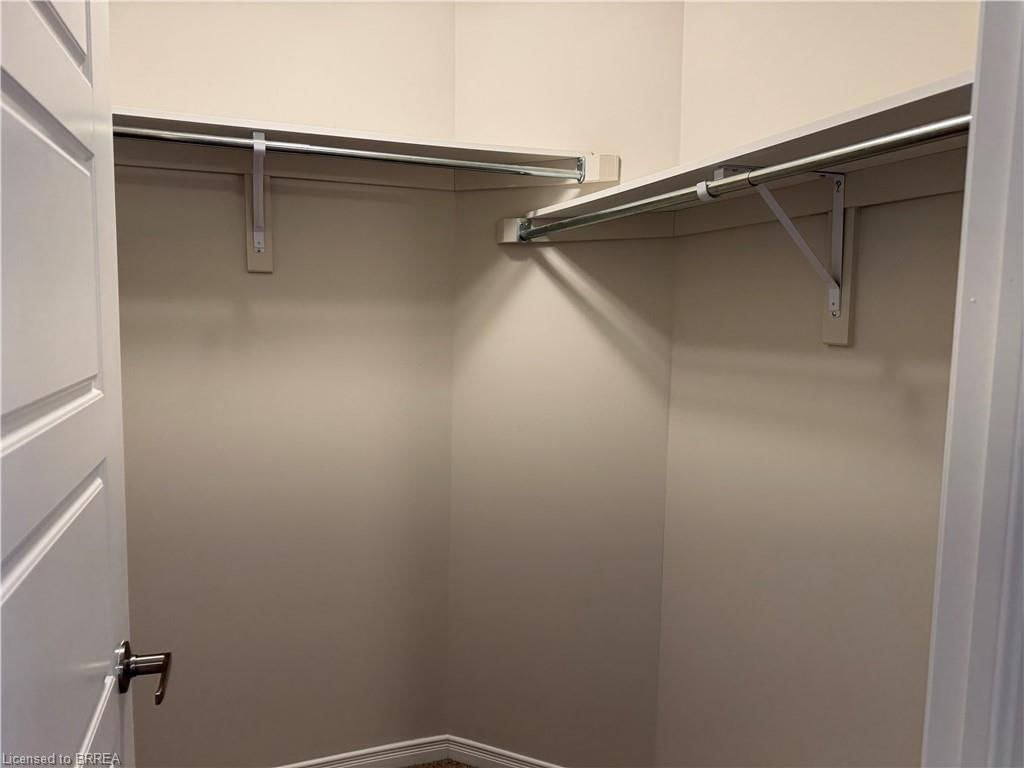
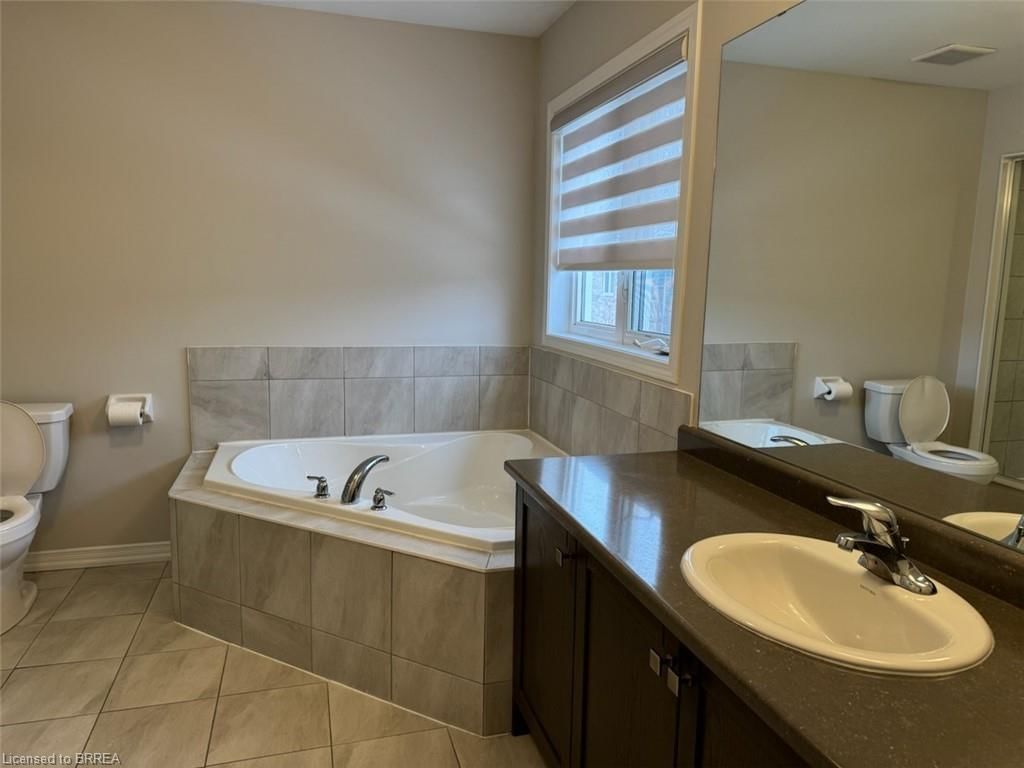
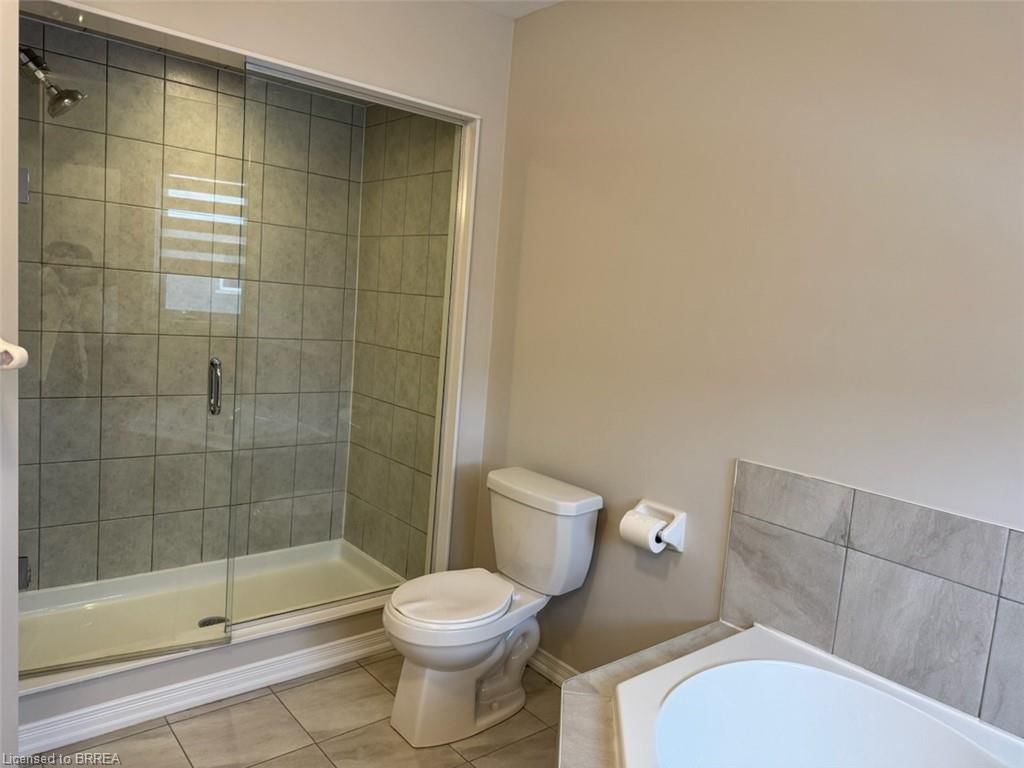
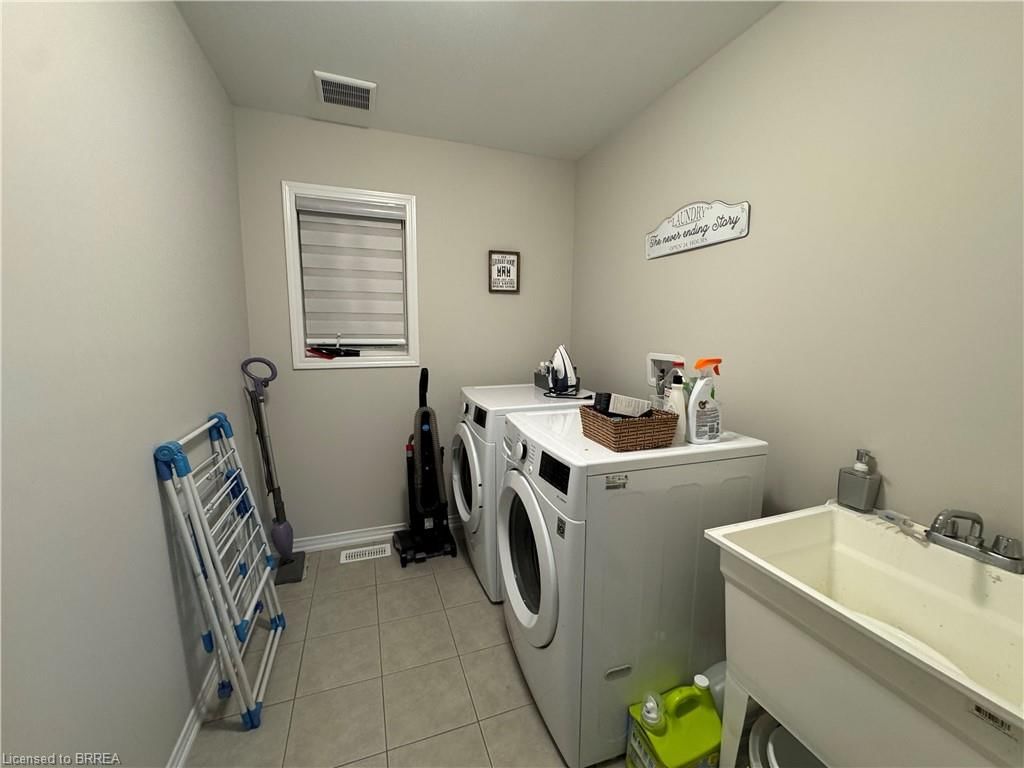
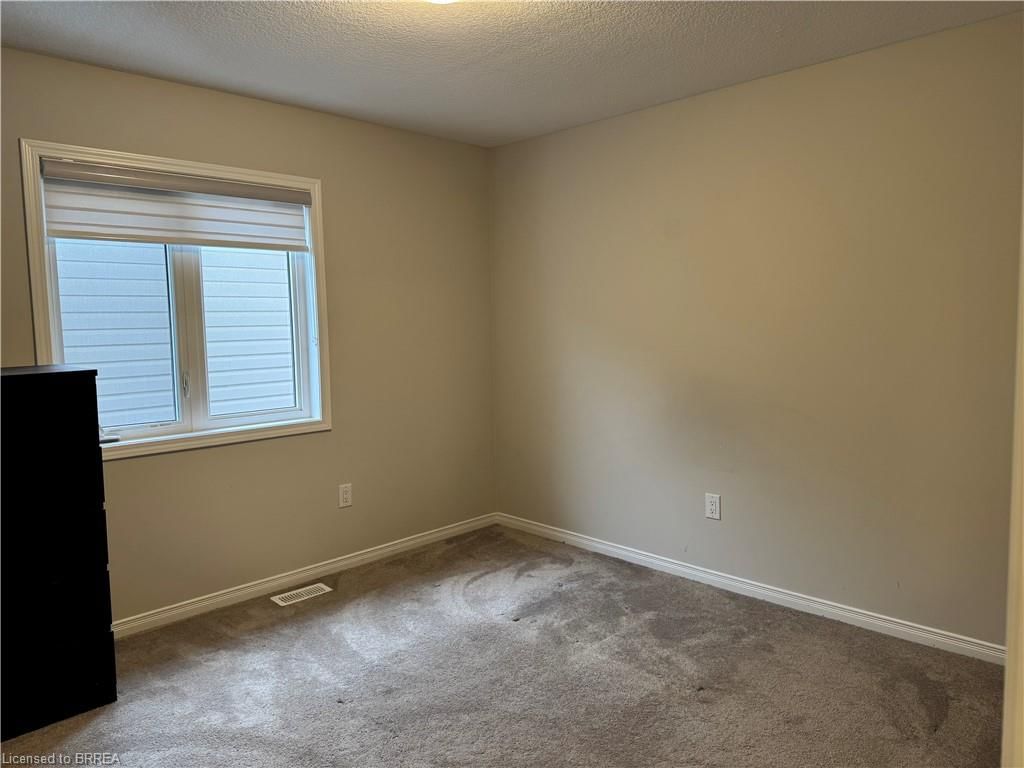
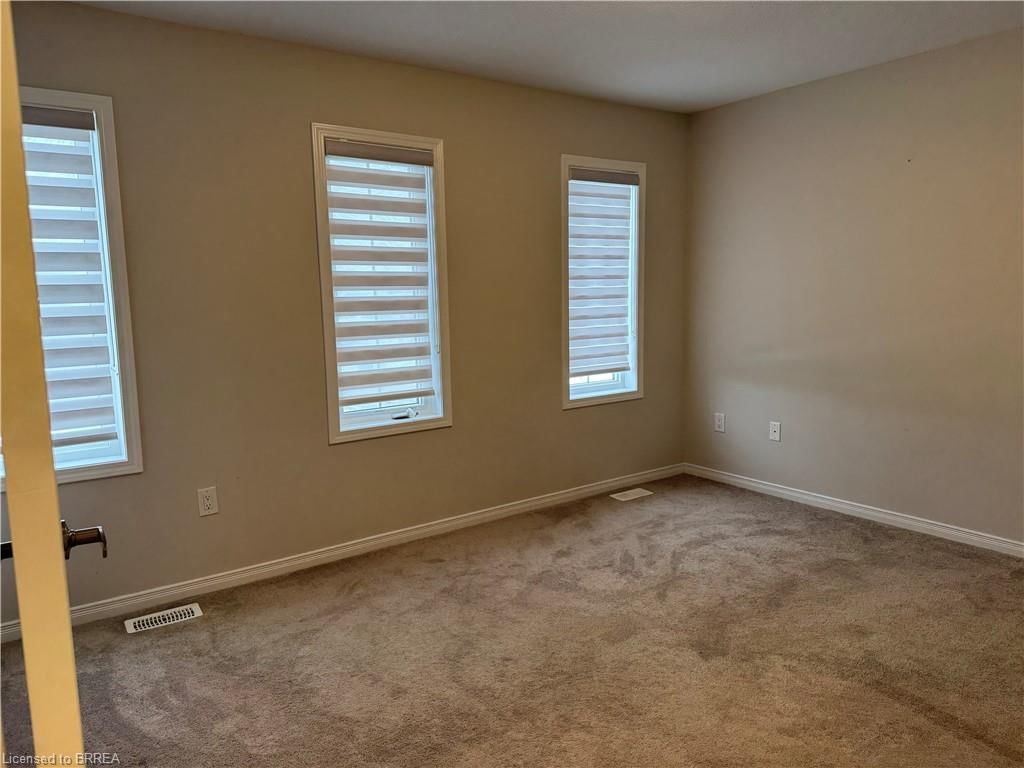
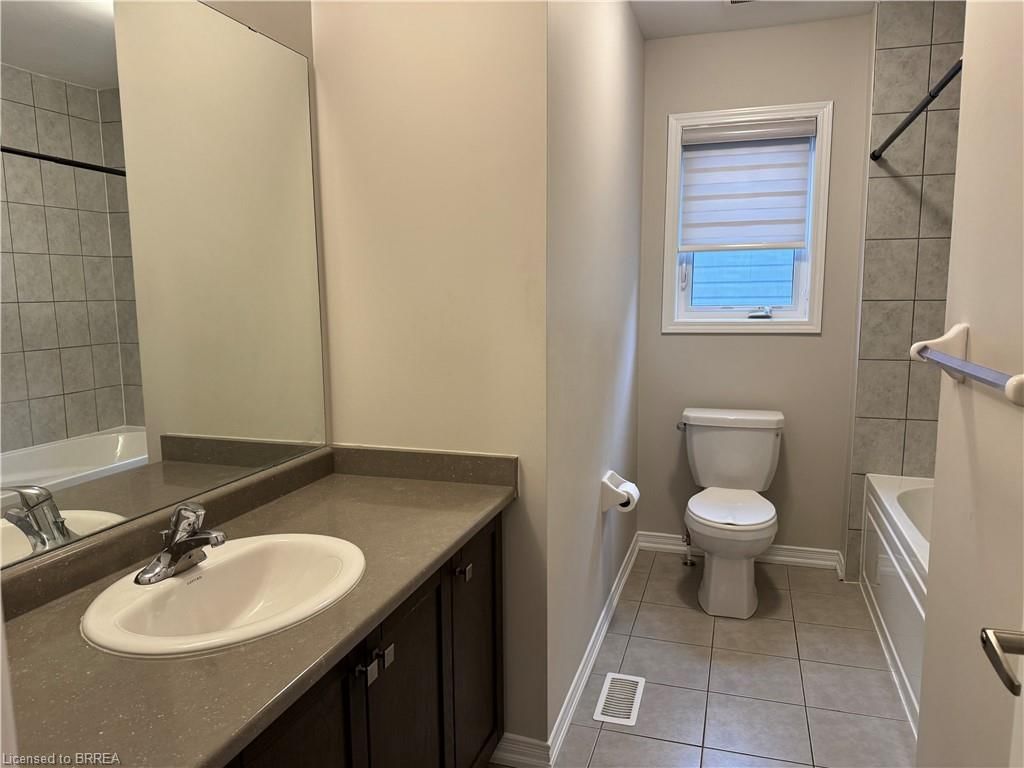
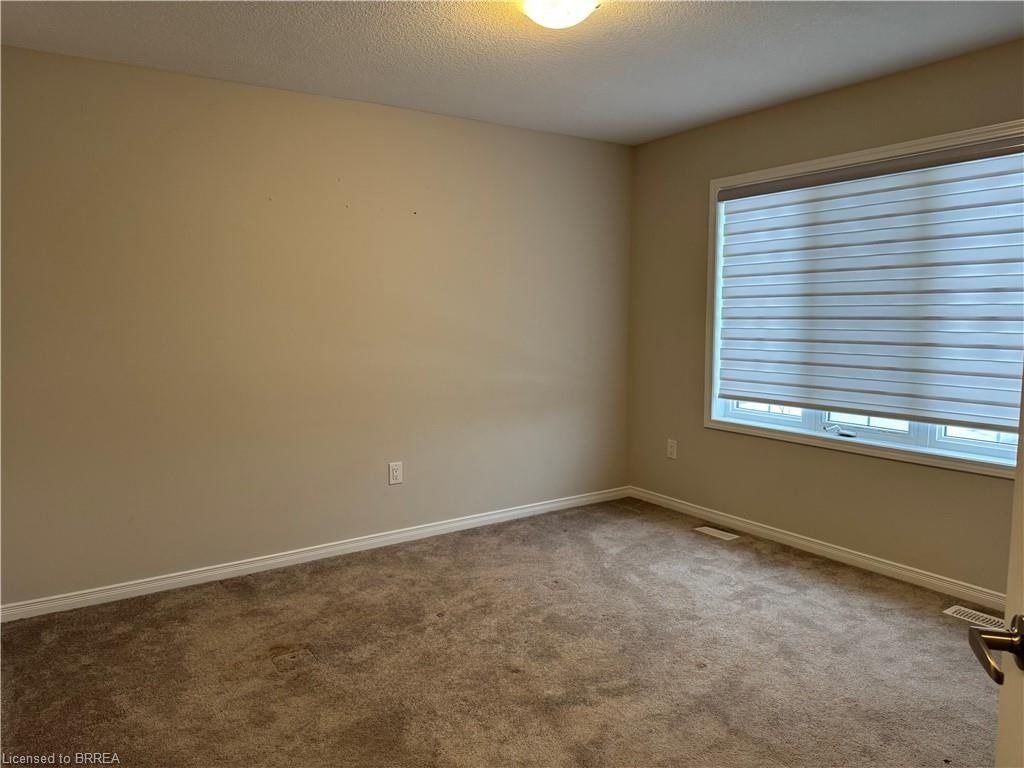
Large executive home located in West Brantford, Wyndfield's award winning designs offering the 'Waverly' model. 2233 square feet with many upgrades throughout! 9' ceilings on main and upper level, custom blinds throughout entire home, modern laminate flooring, high end LG stainless steel fridge, stove, dishwasher, washer and dryer, upgraded doors throughout, upgraded wood staircase and railings. 4 large bedrooms, 2.5 bathrooms. Primary suite has large walk in closet, ensuite with soaker tub and separate stand up shower with glass doors. Looking to entertain? This home has it all, open concept eat in kitchen with island overlooking the large family room and separate dining room. A fully fenced yard for backyard entertaining and relaxing. Steps to beautiful trails, elementary and secondary schools, amenities and bus system. This home is very bright with many windows, flows perfectly with it's design and ready for you to call home! The Landlord requires an application with references, proof of income with a letter of employment and pay stubs or NOA, and a favourable credit bureau Equifax report. No pets allowed here. No exceptions on requirements or pets. Tenants are responsible for all utilities + hot water heater and ARU rental of $96.66/mo *All furniture shown is not included.
Dishwasher,Dryer,Range Hood,Refrigerator,Washer
Copyright 2025 Information Technology Systems Ontario, Inc. The information provided herein must only be used by consumers that have a bona fide interest in the purchase, sale, or lease of real estate and may not be used for any commercial purpose or any other purpose.
Kitchen
Family Room
Dining Room
Bathroom
Bedroom Primary
Bedroom
Bedroom
Bedroom
The graph below compares the average list price and average lease price of homes in this neighborhood by month for the last 24 months. When average lease price is greater than average list price, this may suggest a renter's market. When average lease price is lower than the average list price this may suggest a landlord's market.
The graph below illustrates the average days on market for homes in this neighborhood. The yellow area may indicate a renter's market, the green area may indicate a balanced market and the red area may indicate a landlord's market.
Sales Representative, Century 21 People’s Choice Realty Inc., Brokerage
(647) 576 - 2100