
Century 21 People’s Choice Realty Inc., Brokerage
120 MATHESON BLVD E #103
MISSISSAUGA, Ontario
L4Z 1X1

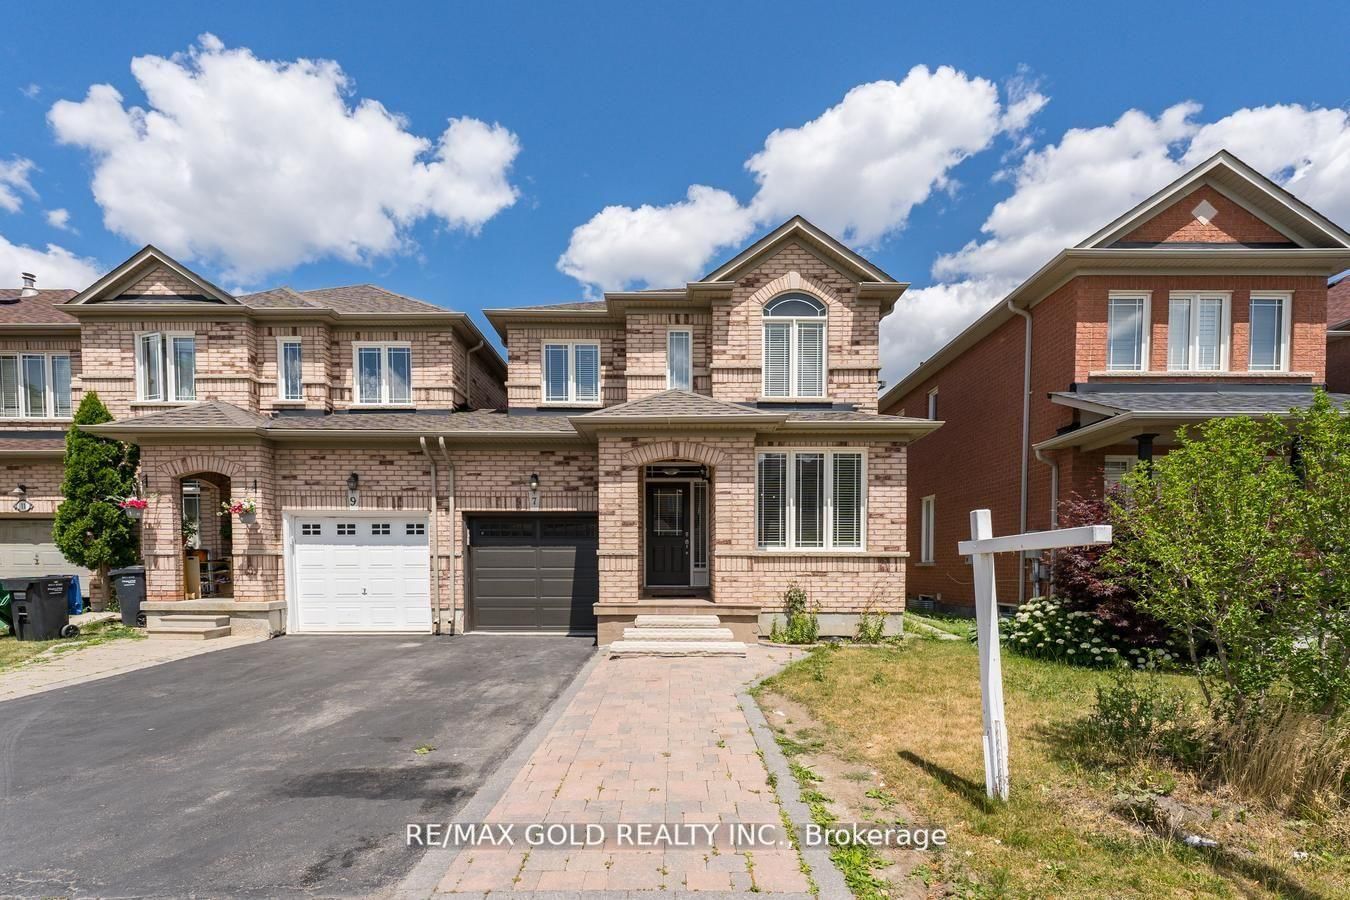
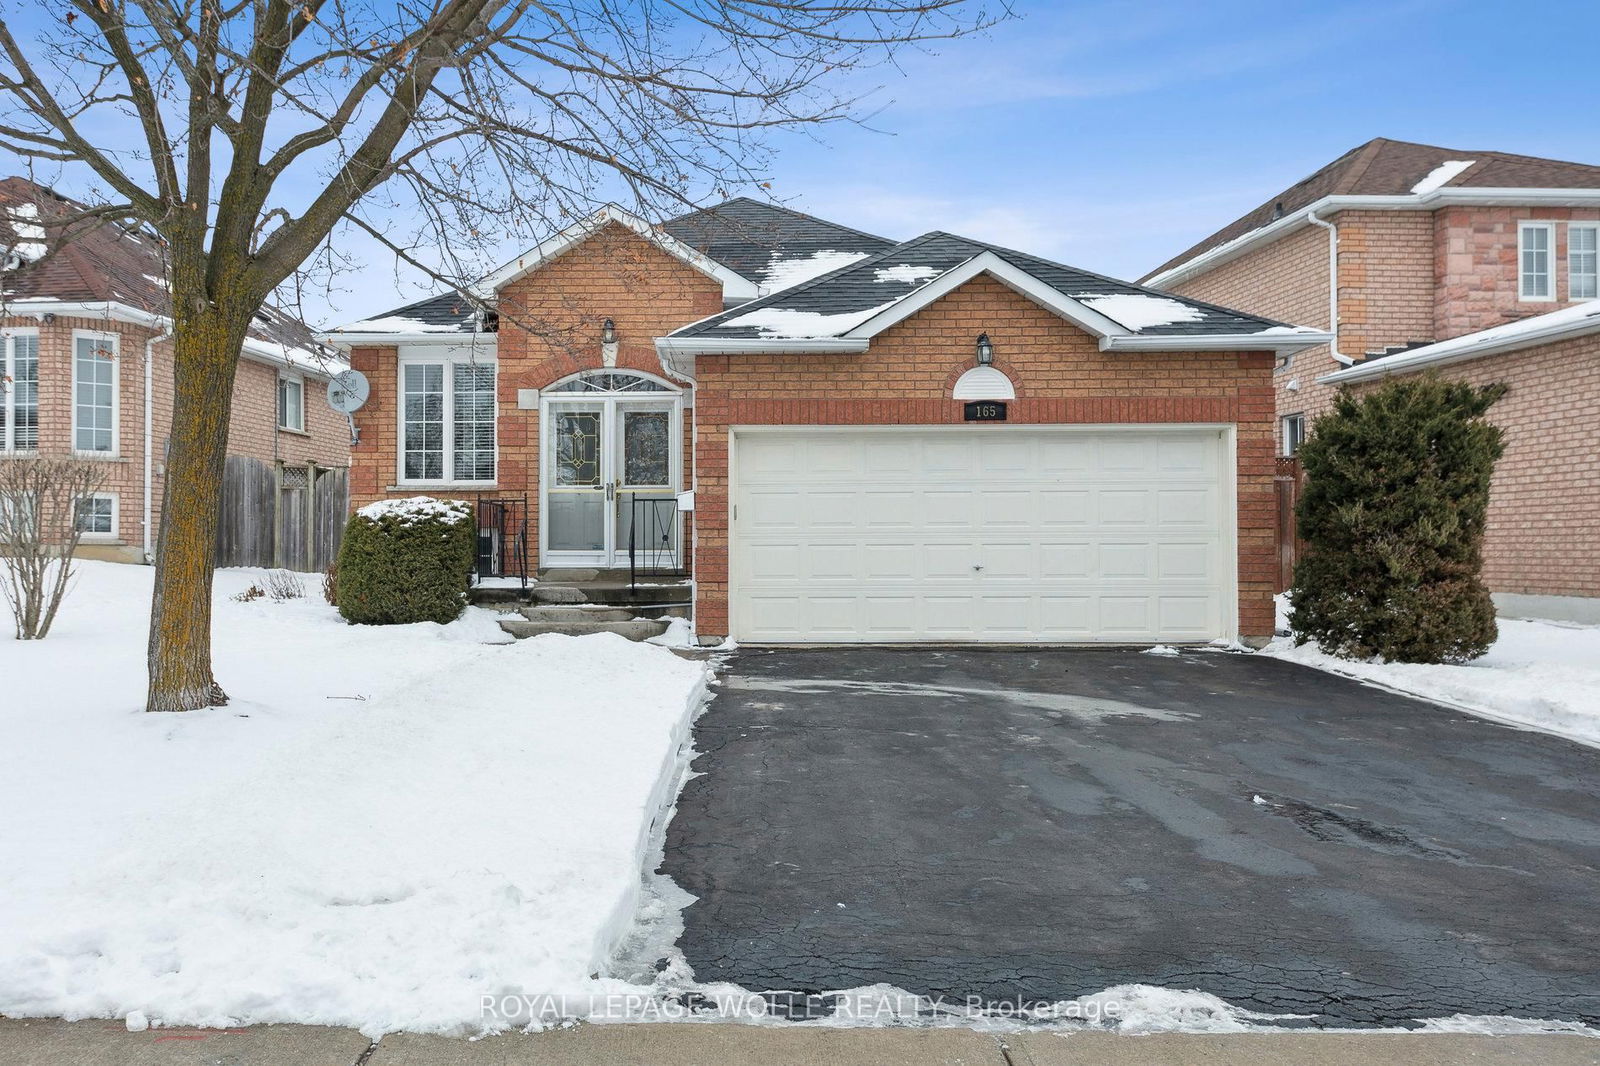
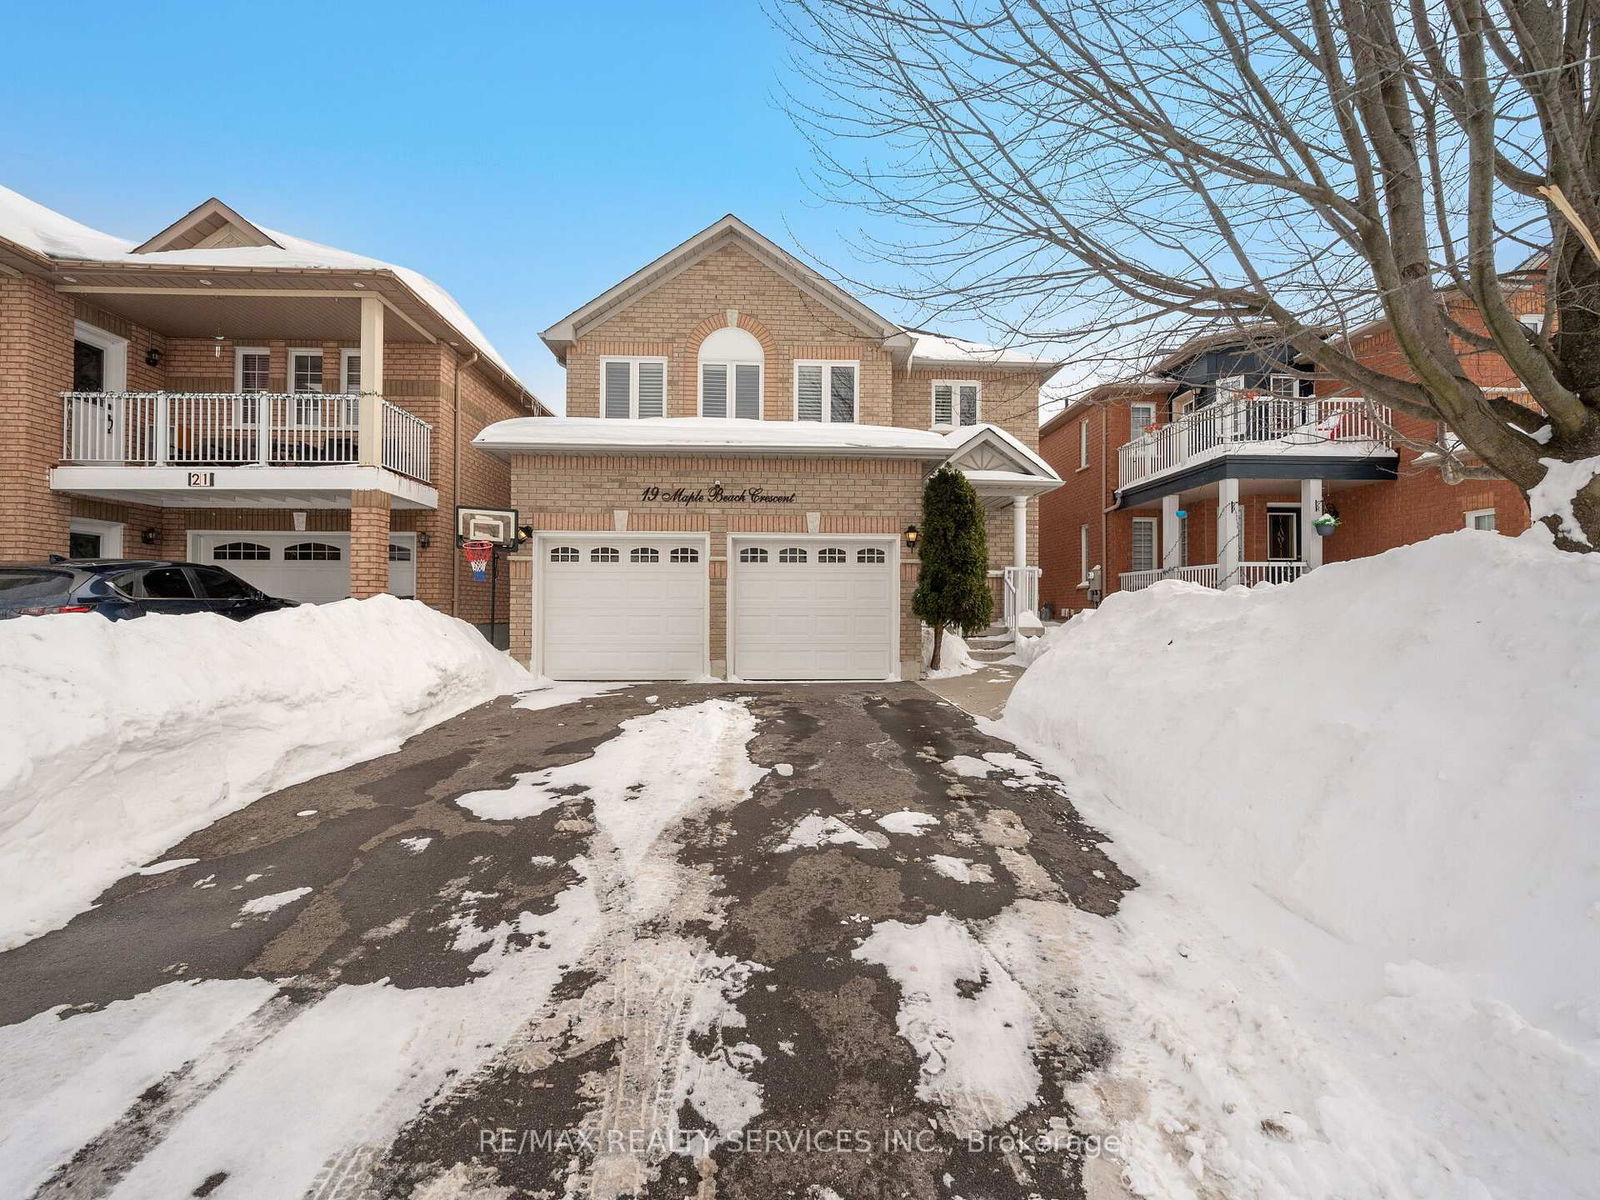
Brampton, Northwest Sandalwood Parkway, L7A 1T9
$999,900
Listed by RE/MAX REALTY SERVICES INC..
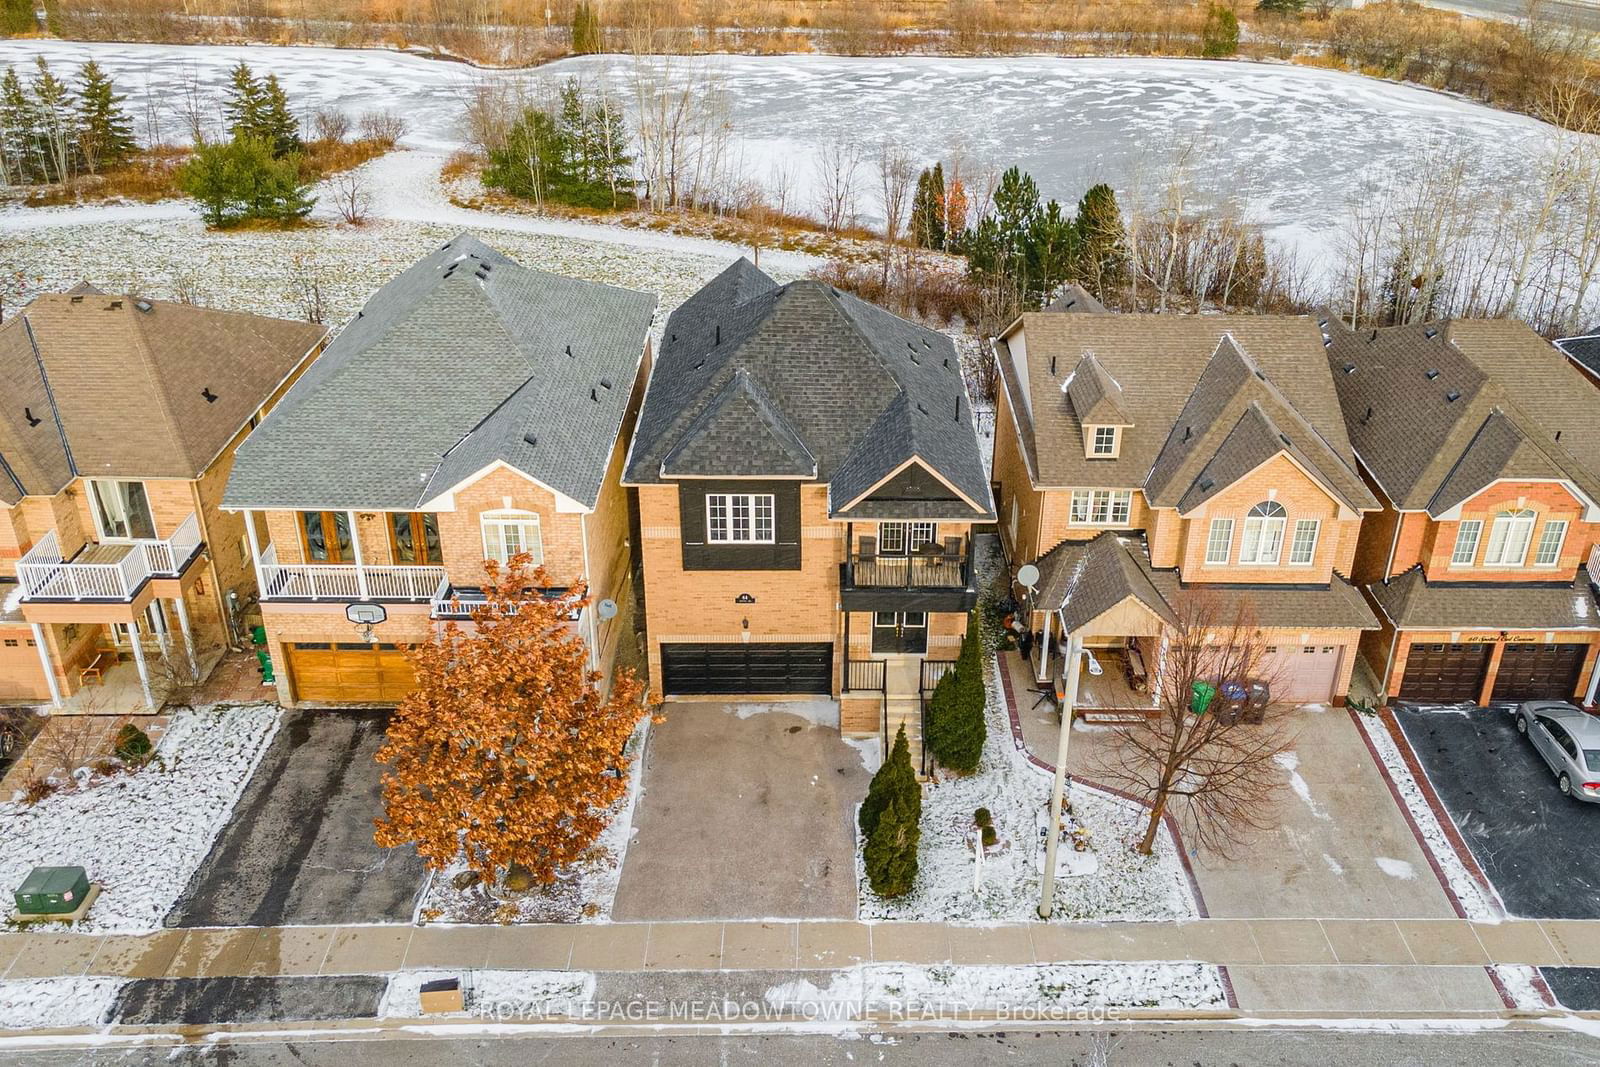
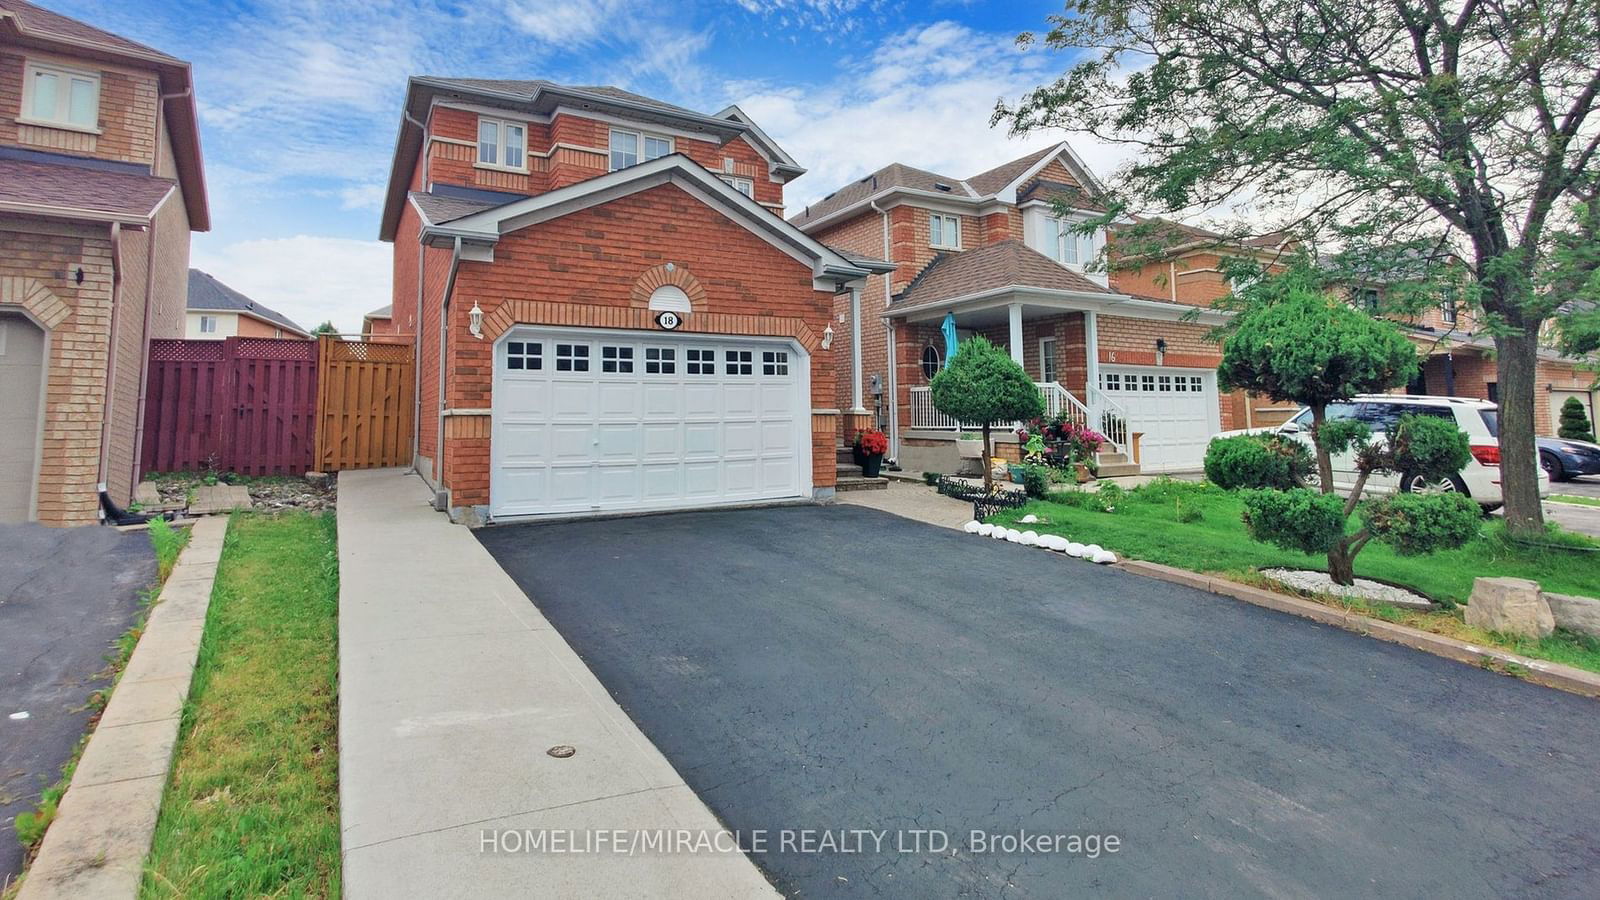
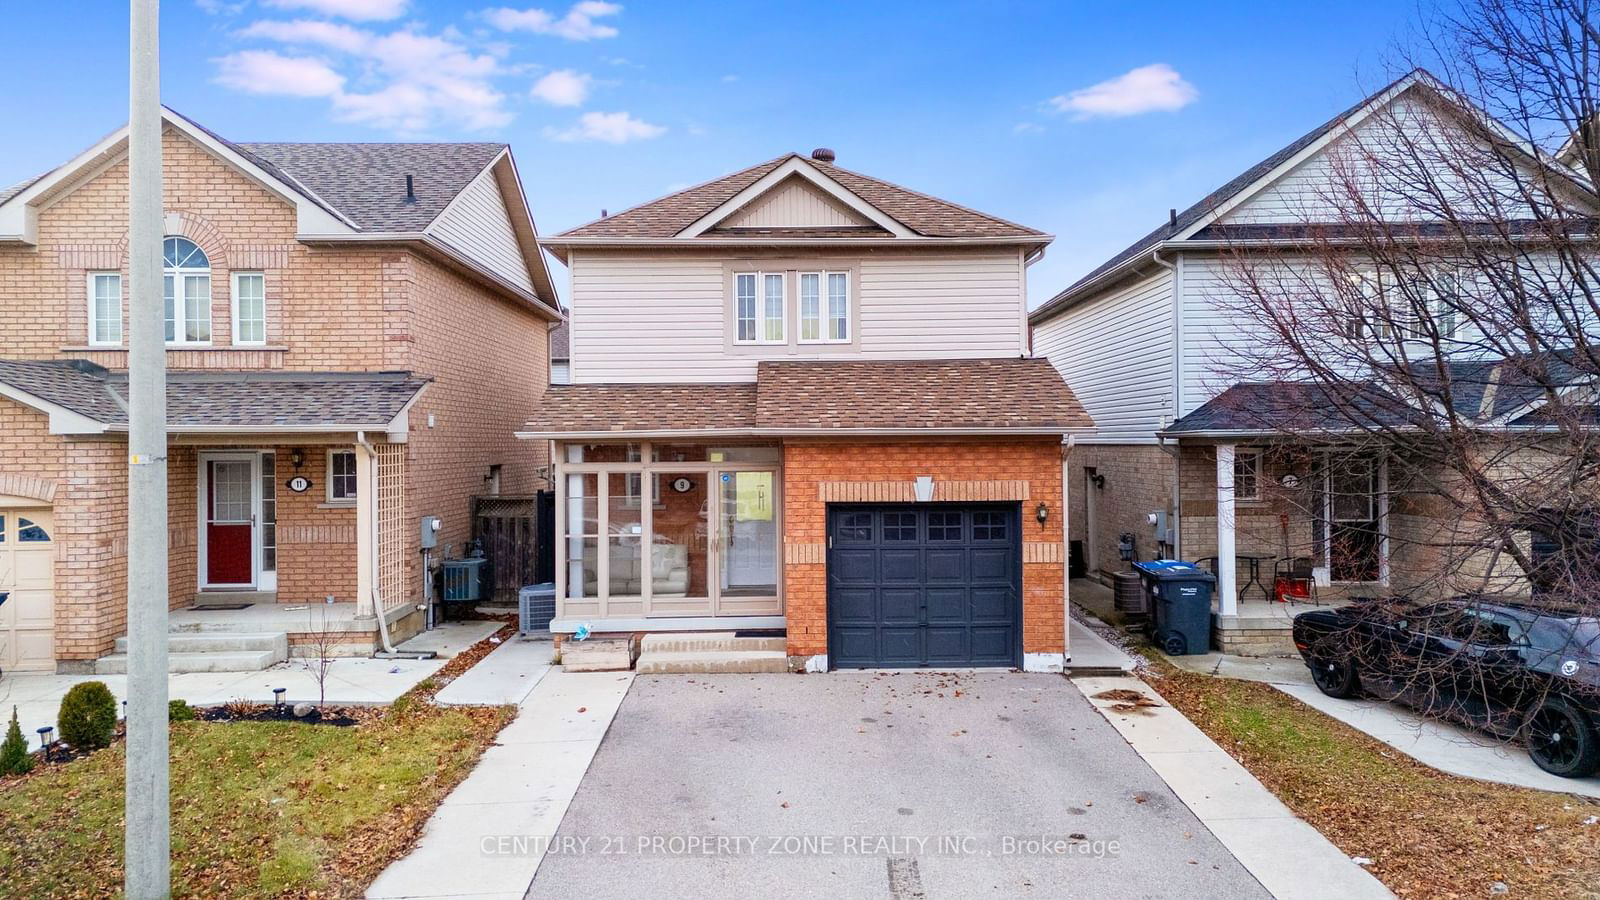
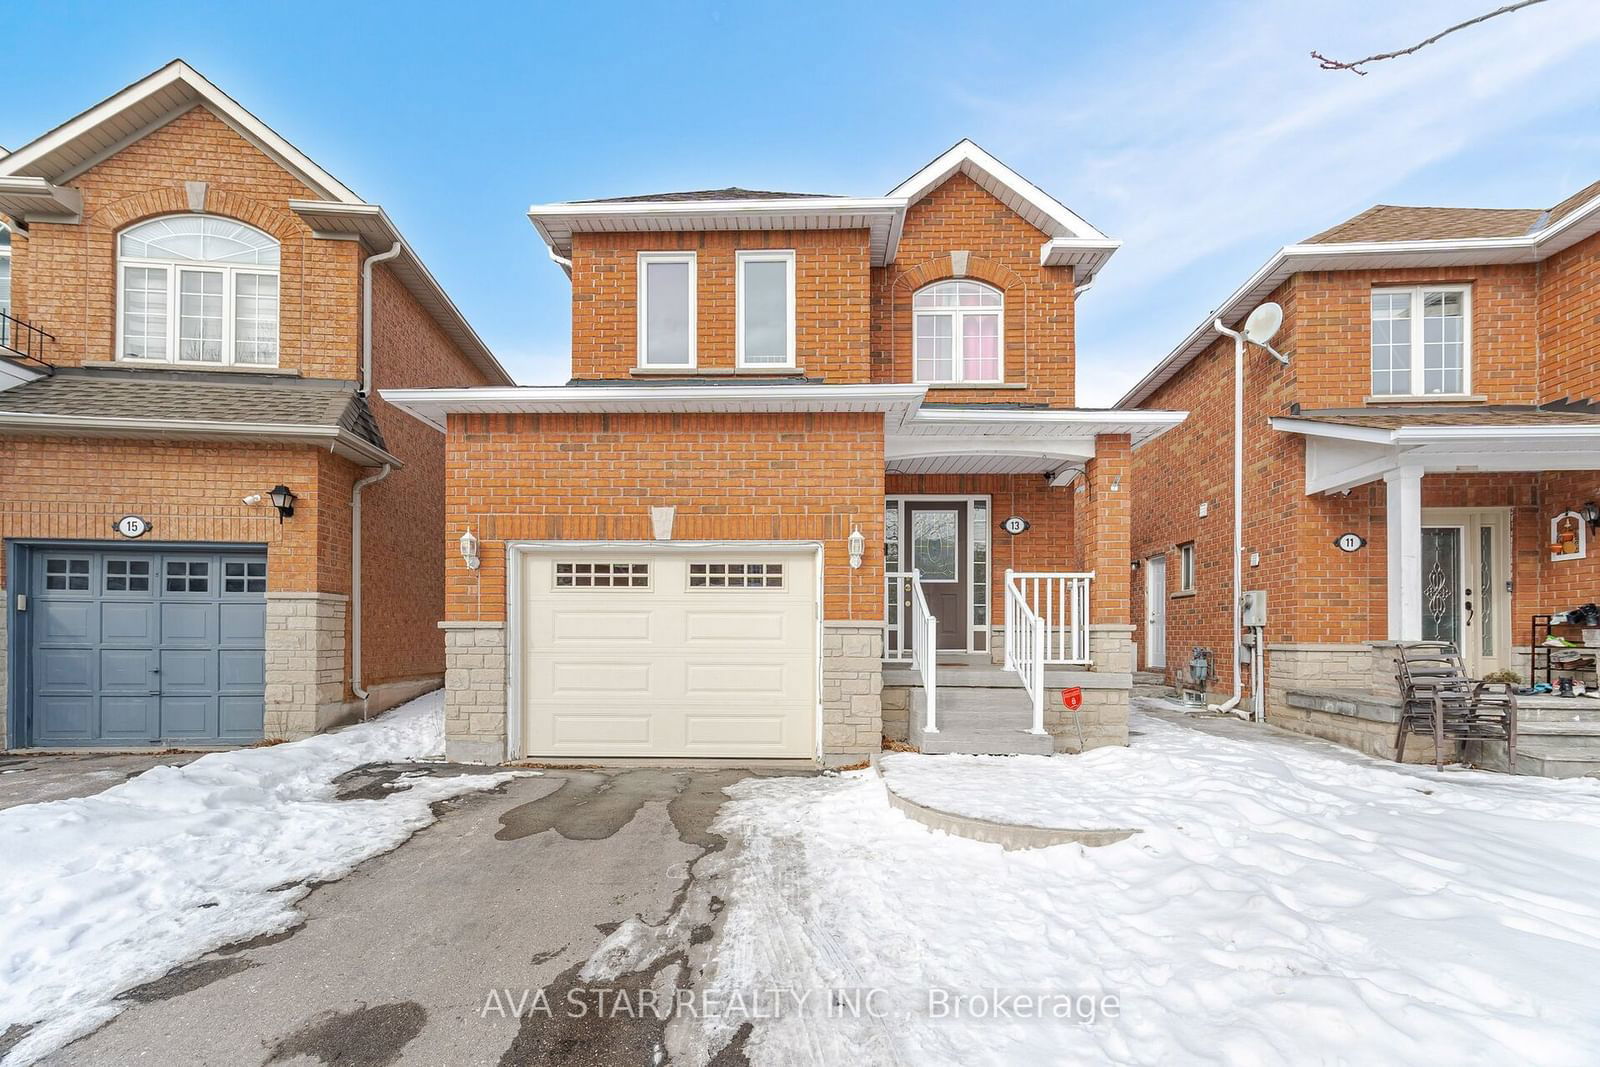
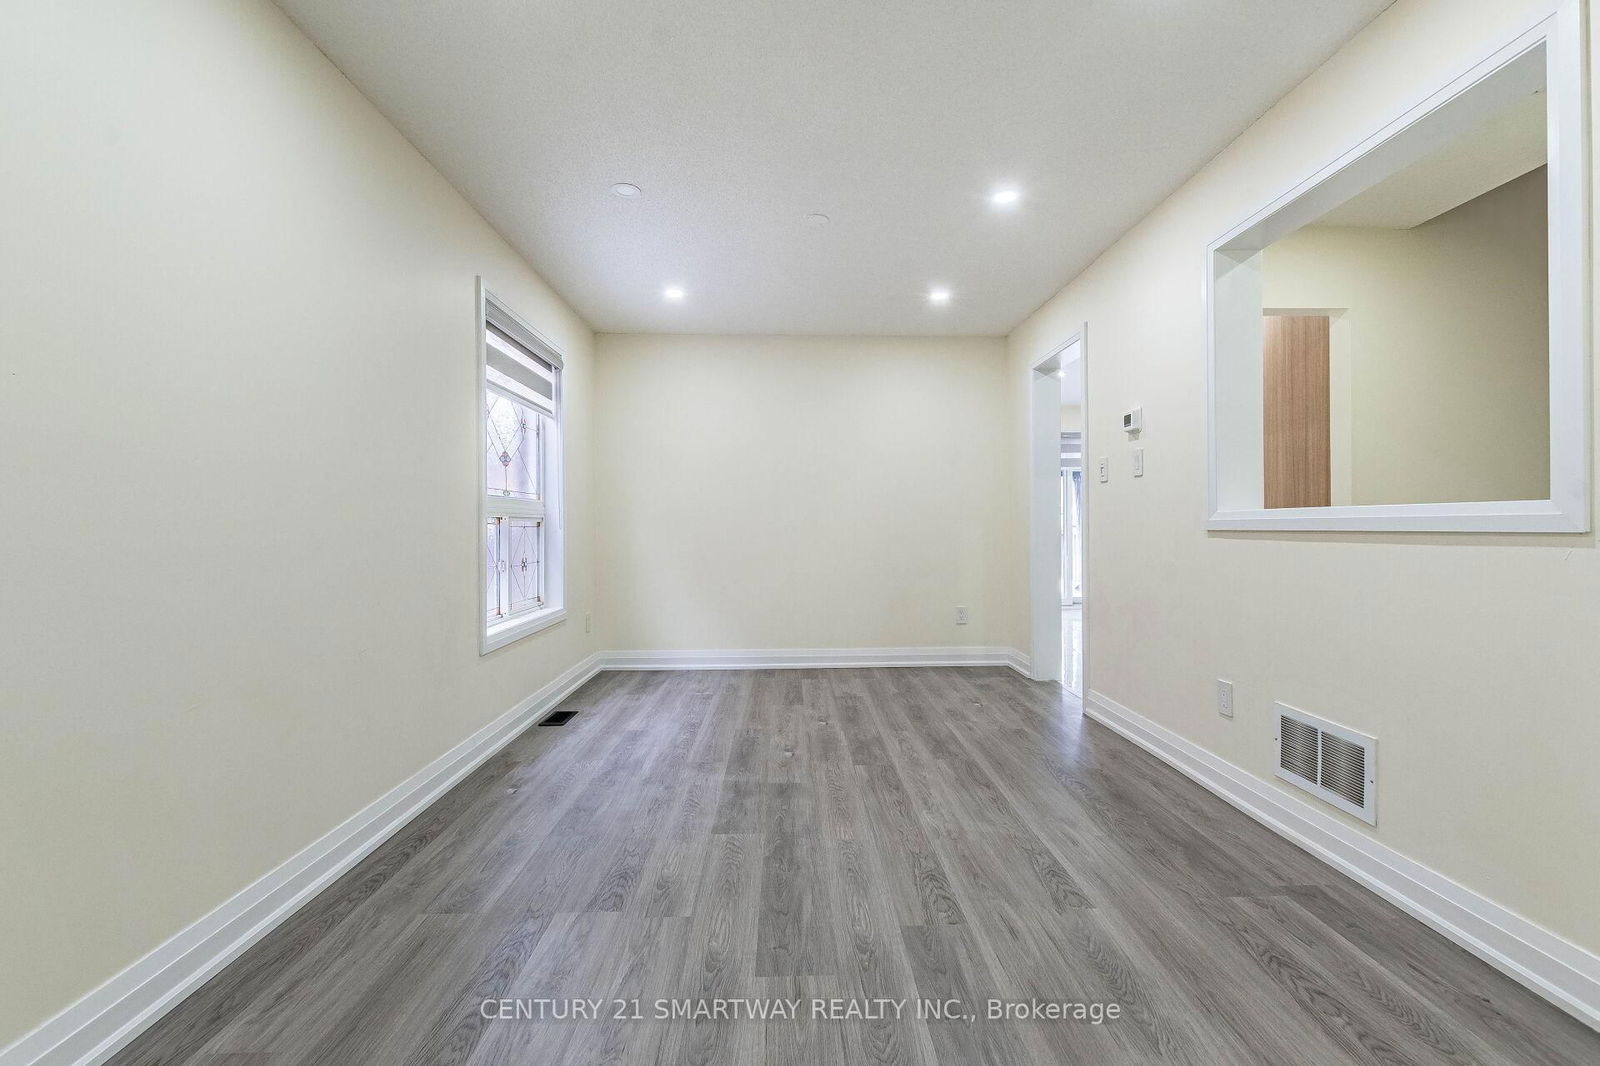
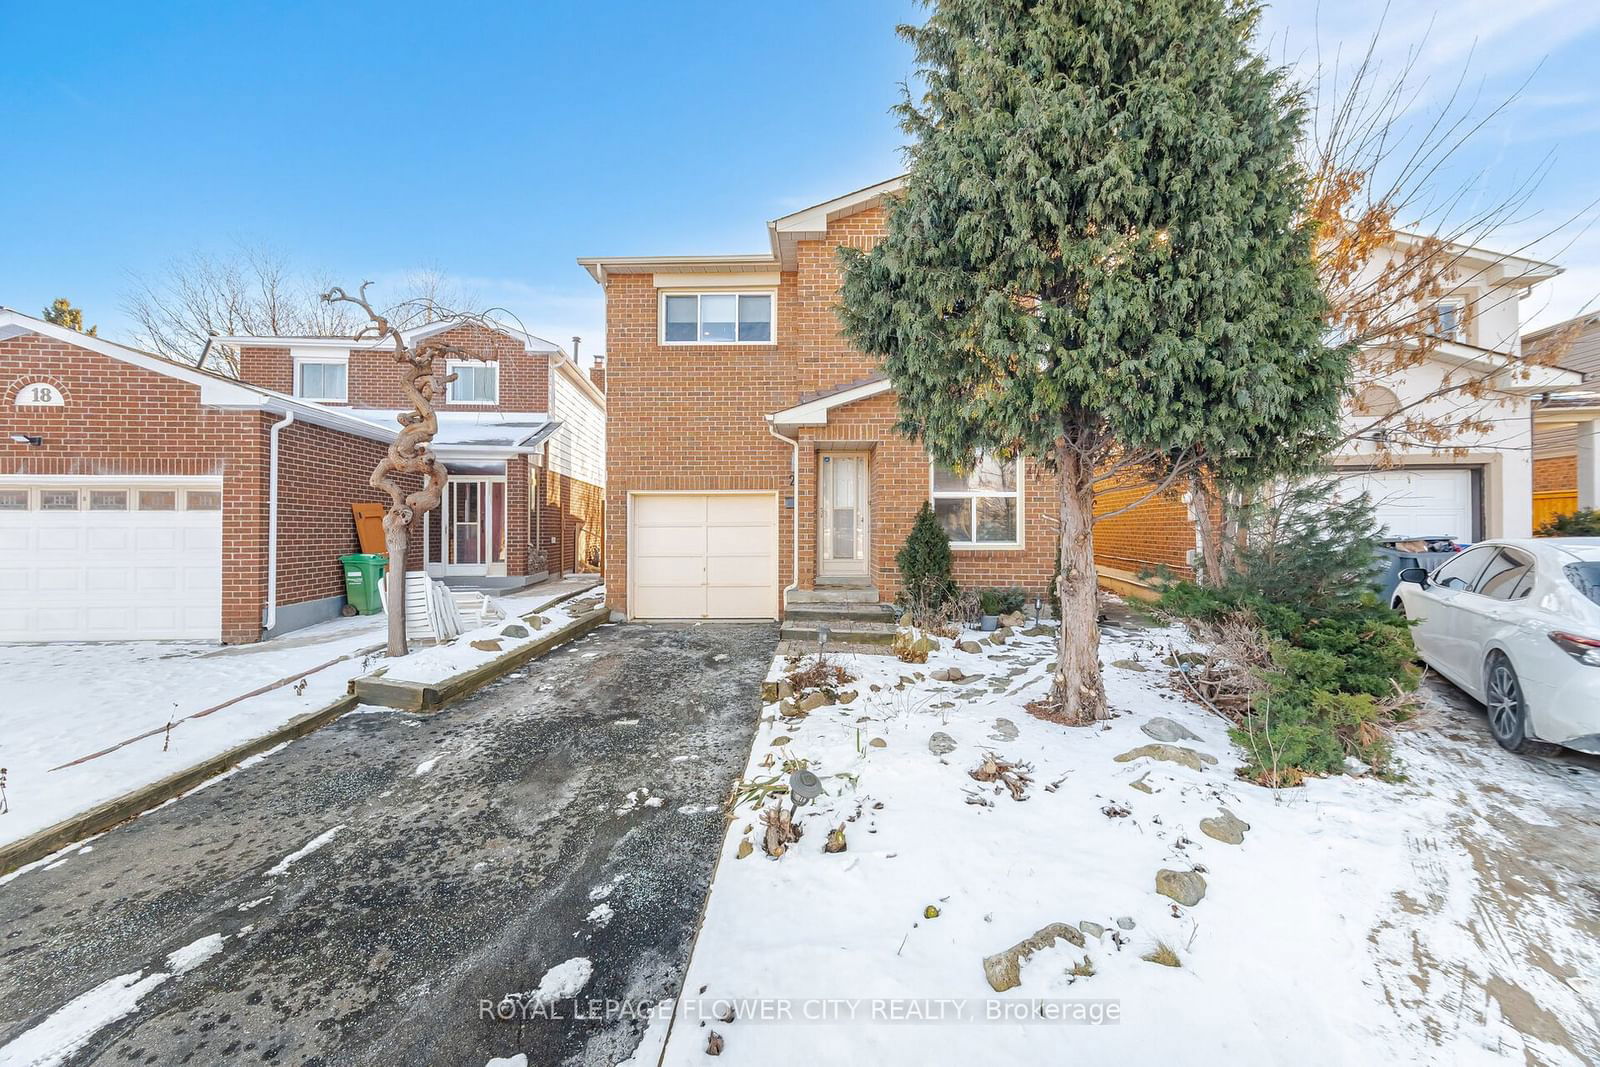
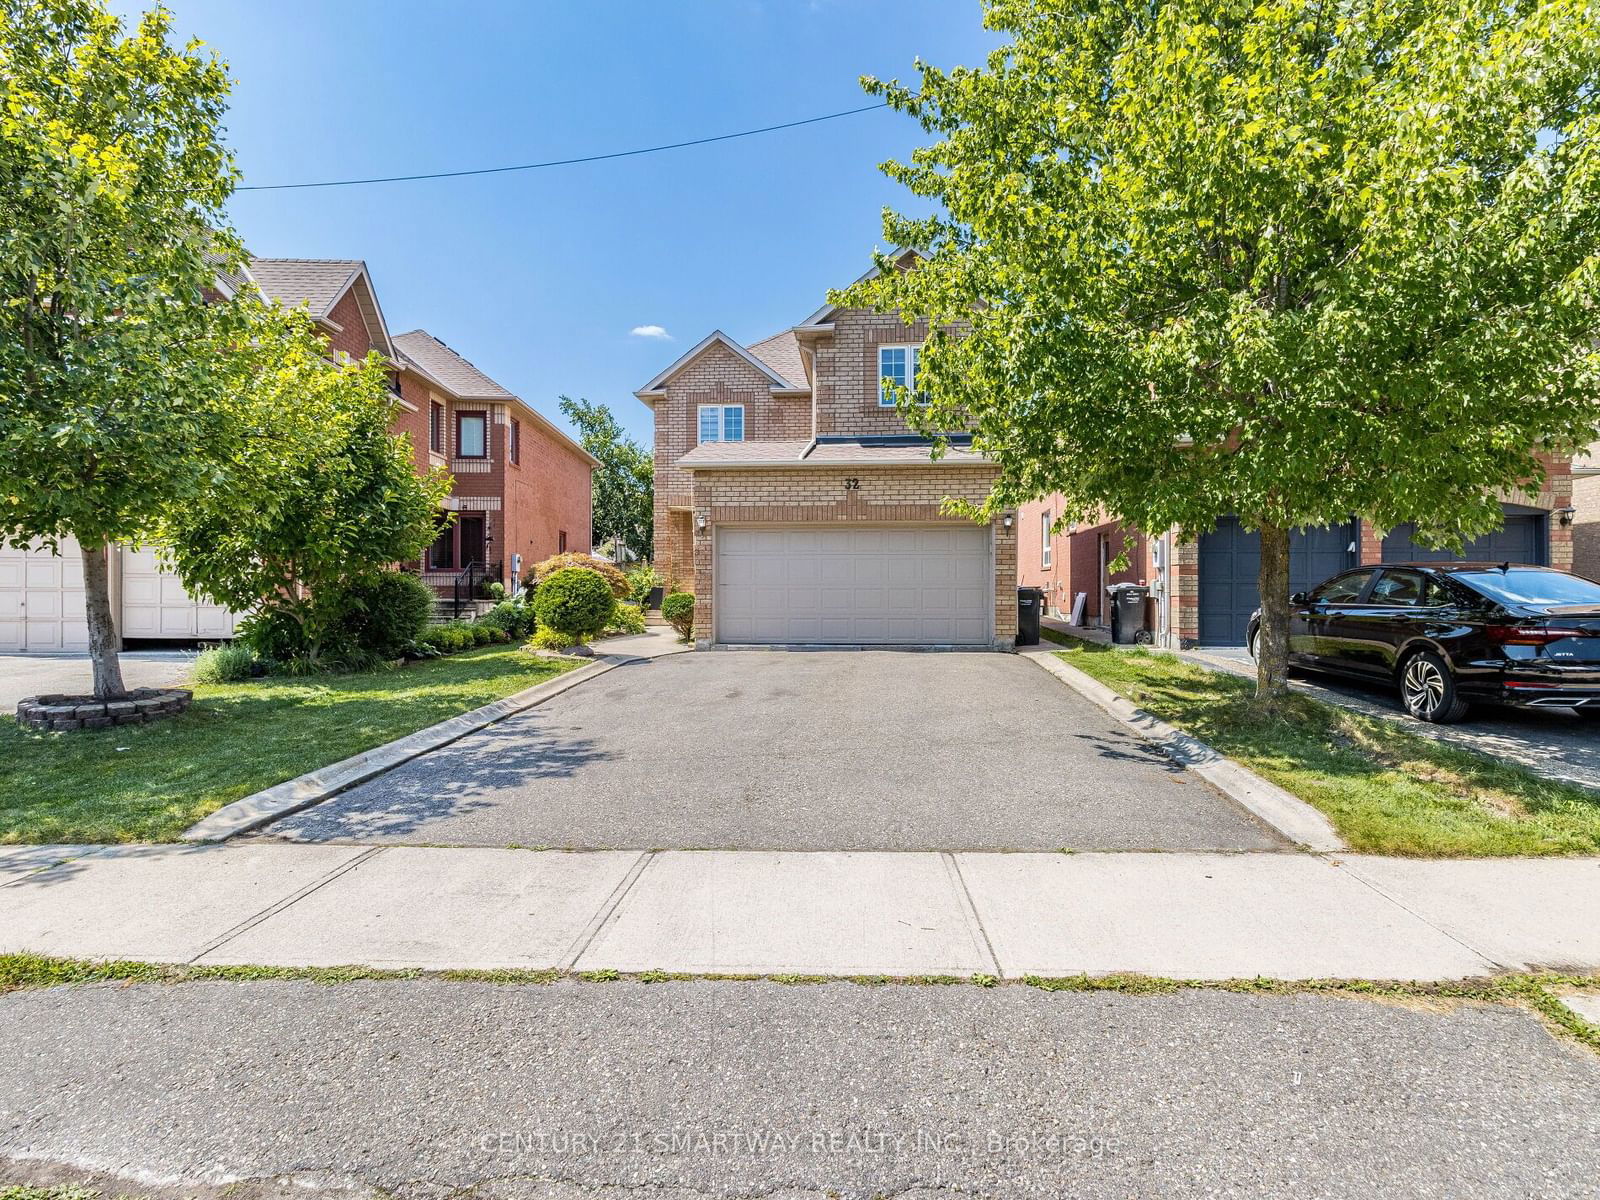
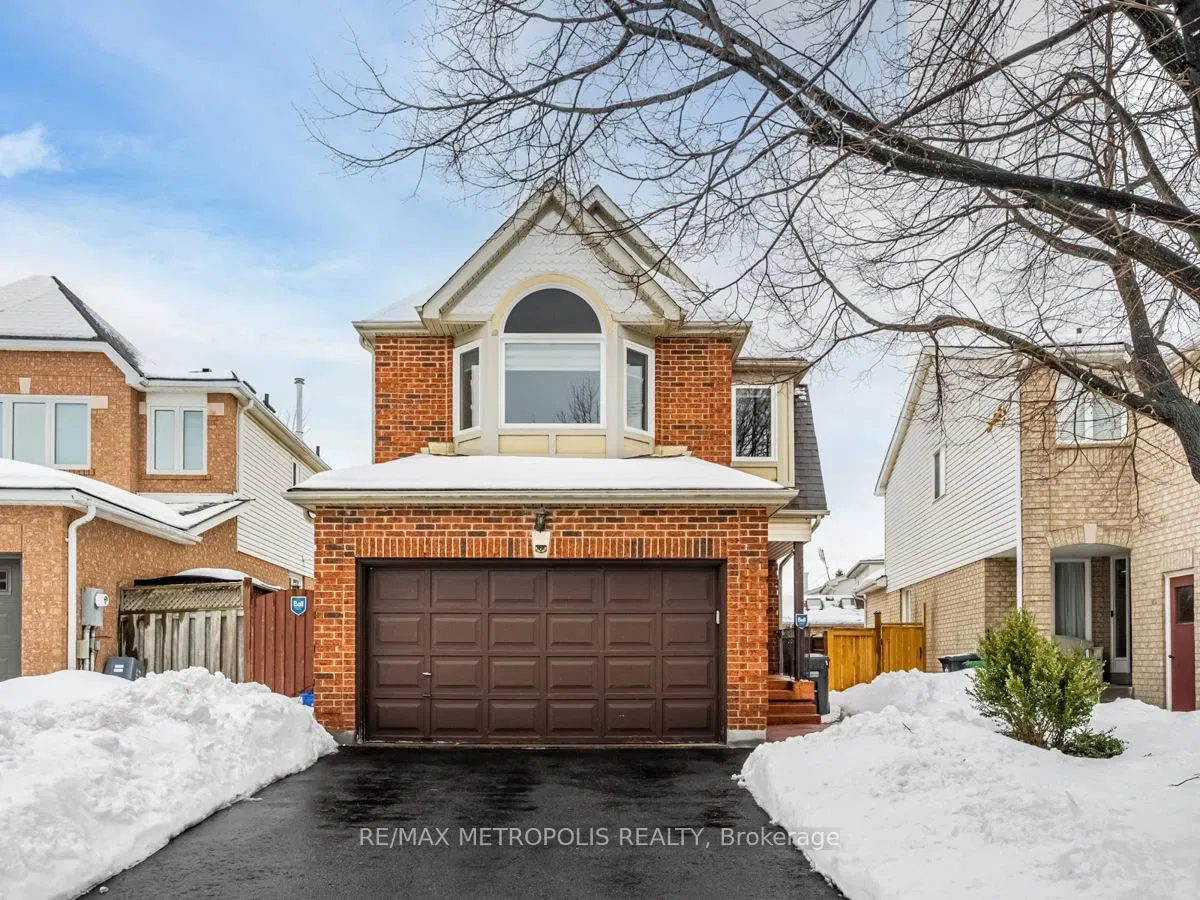
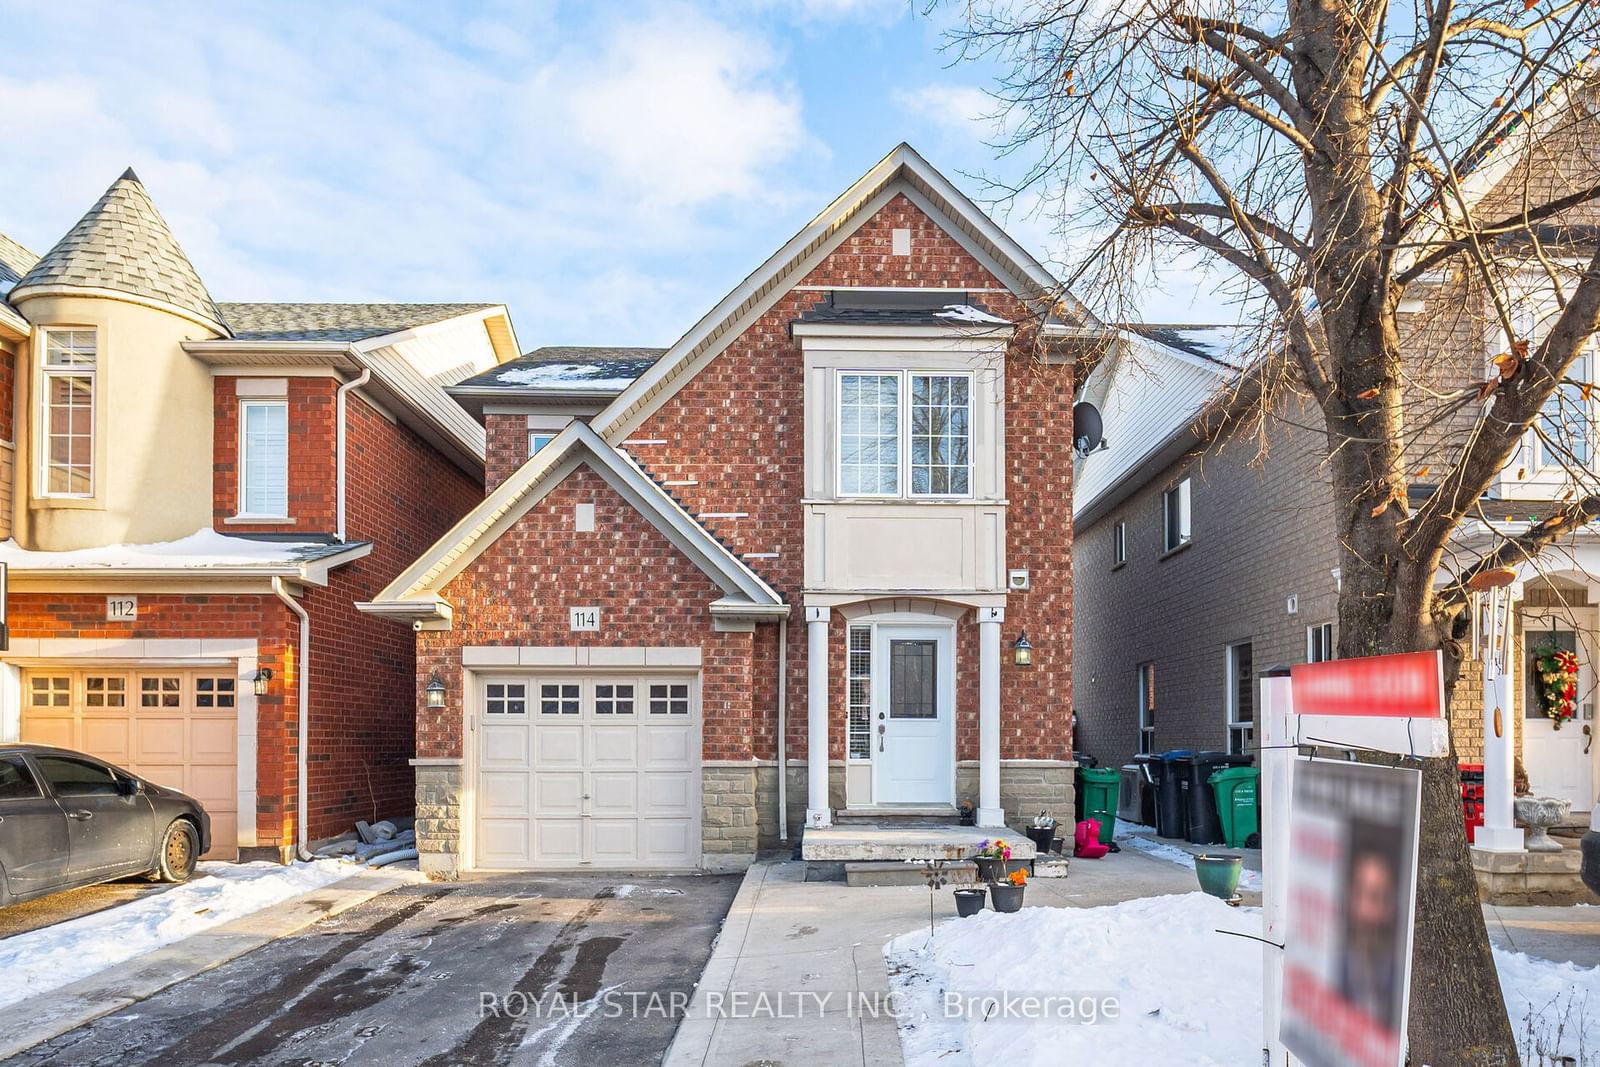
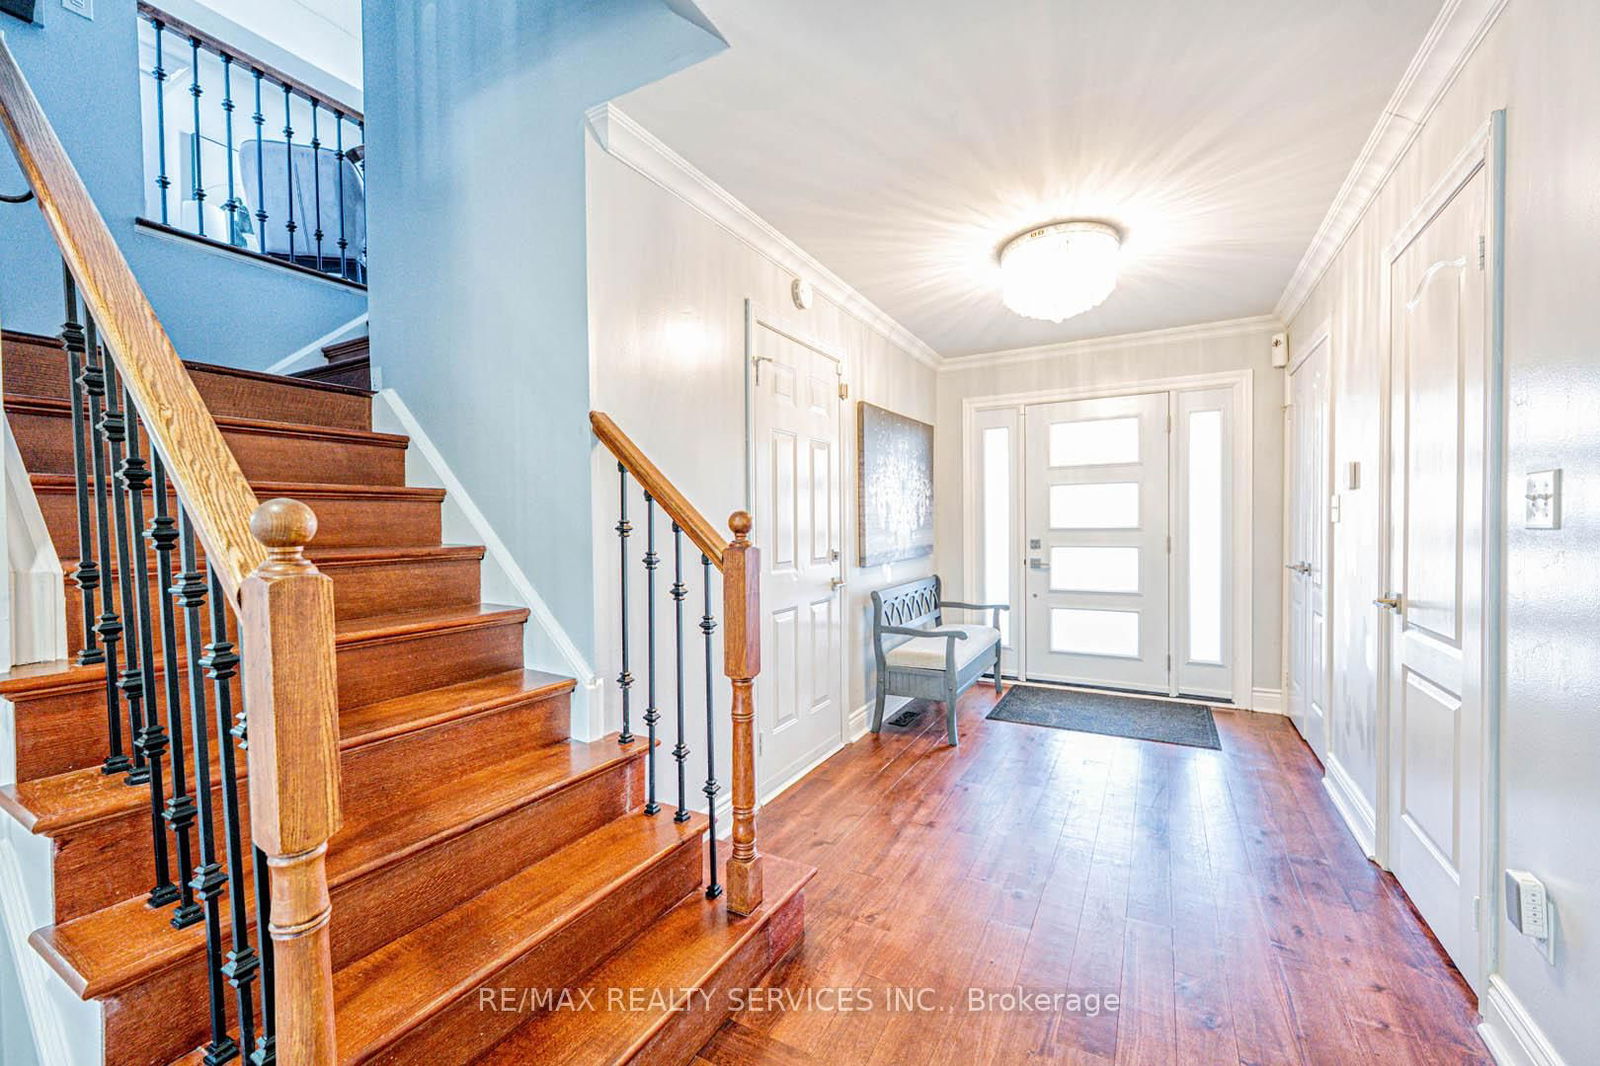
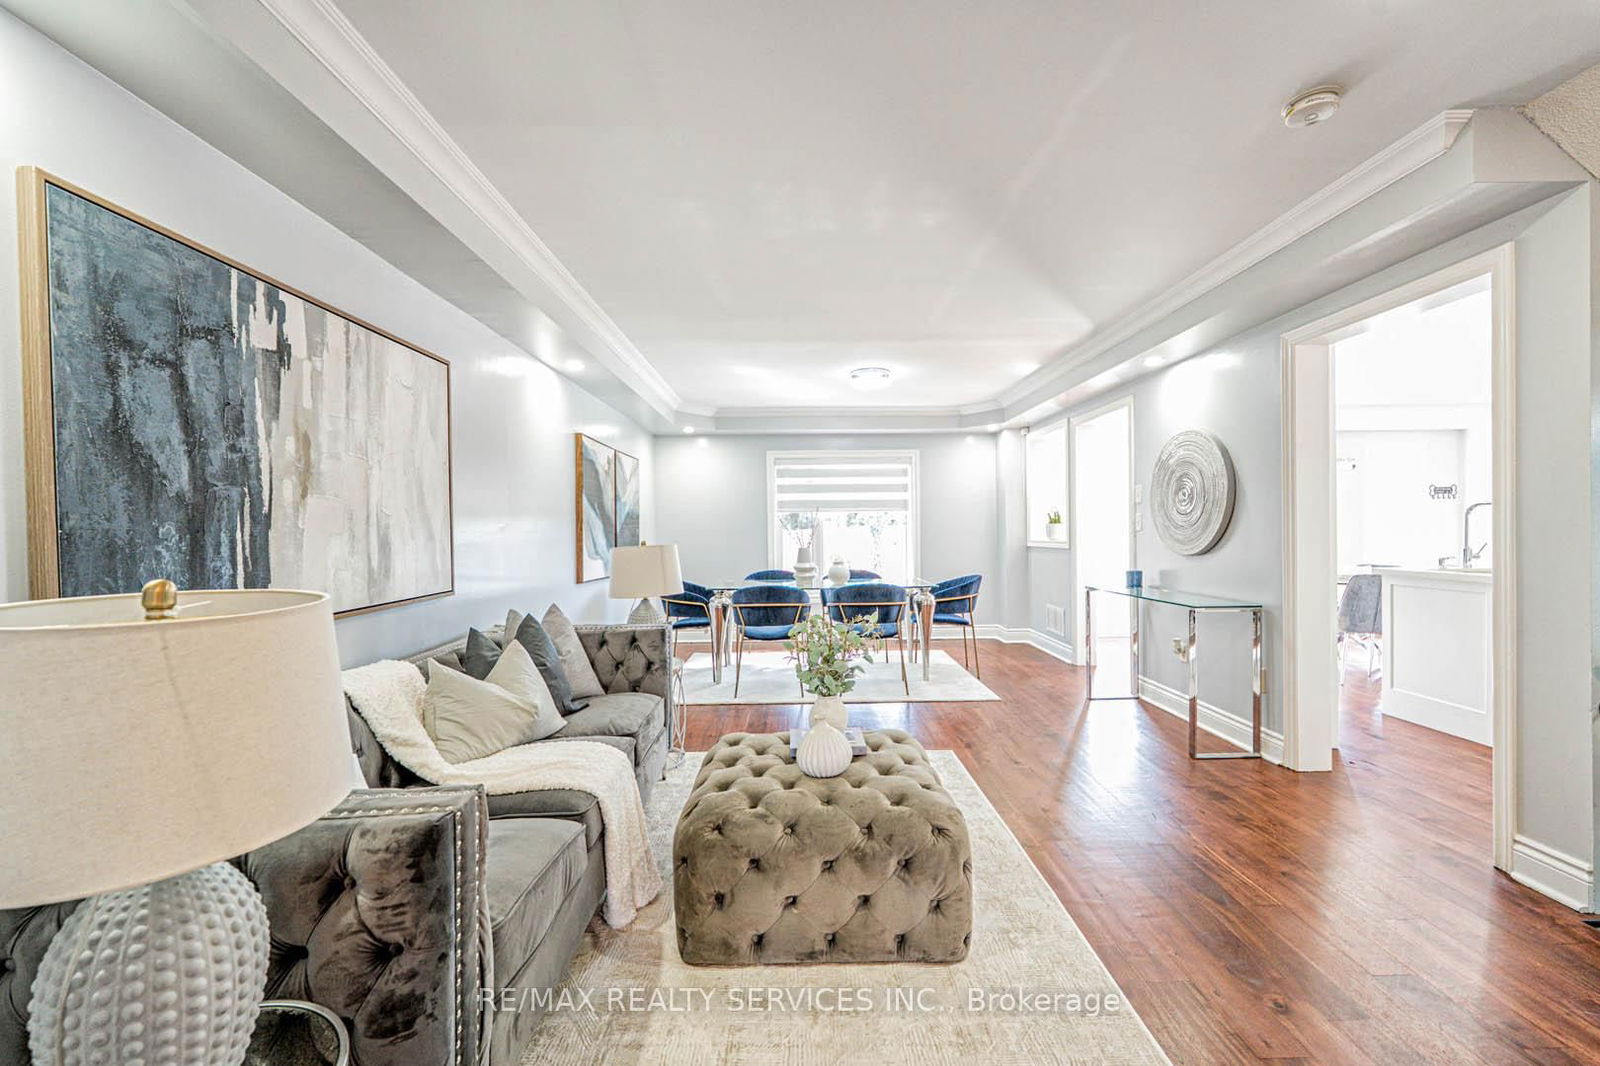
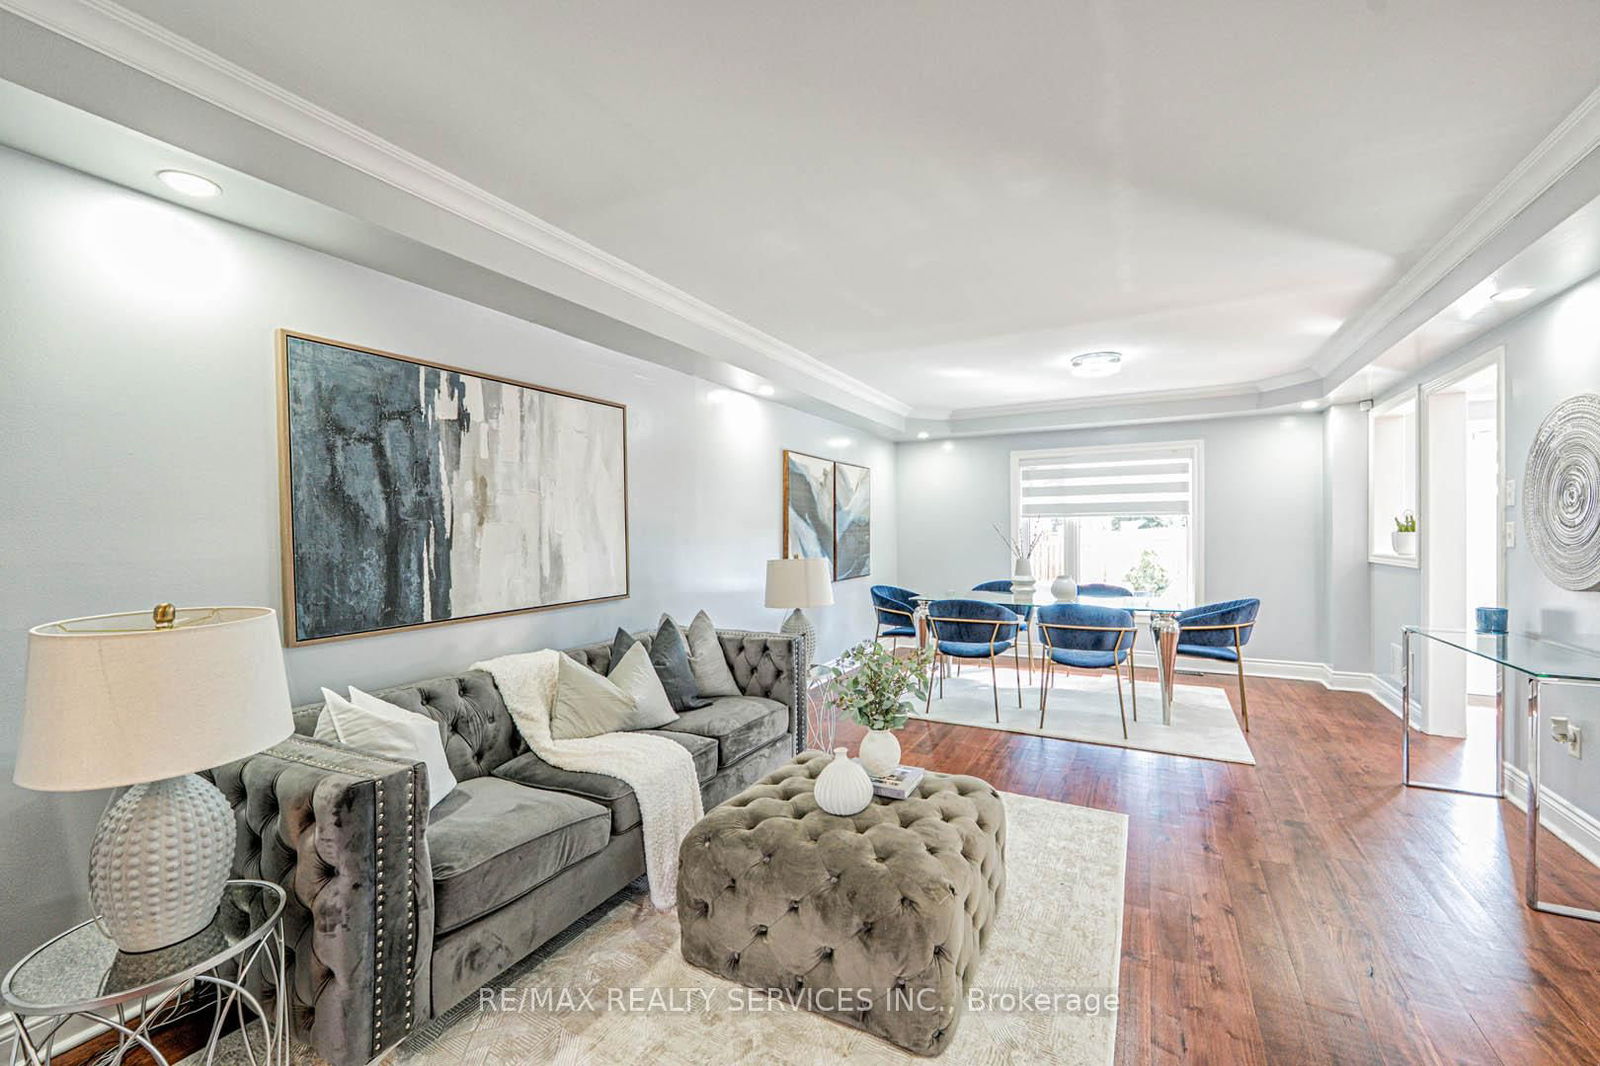
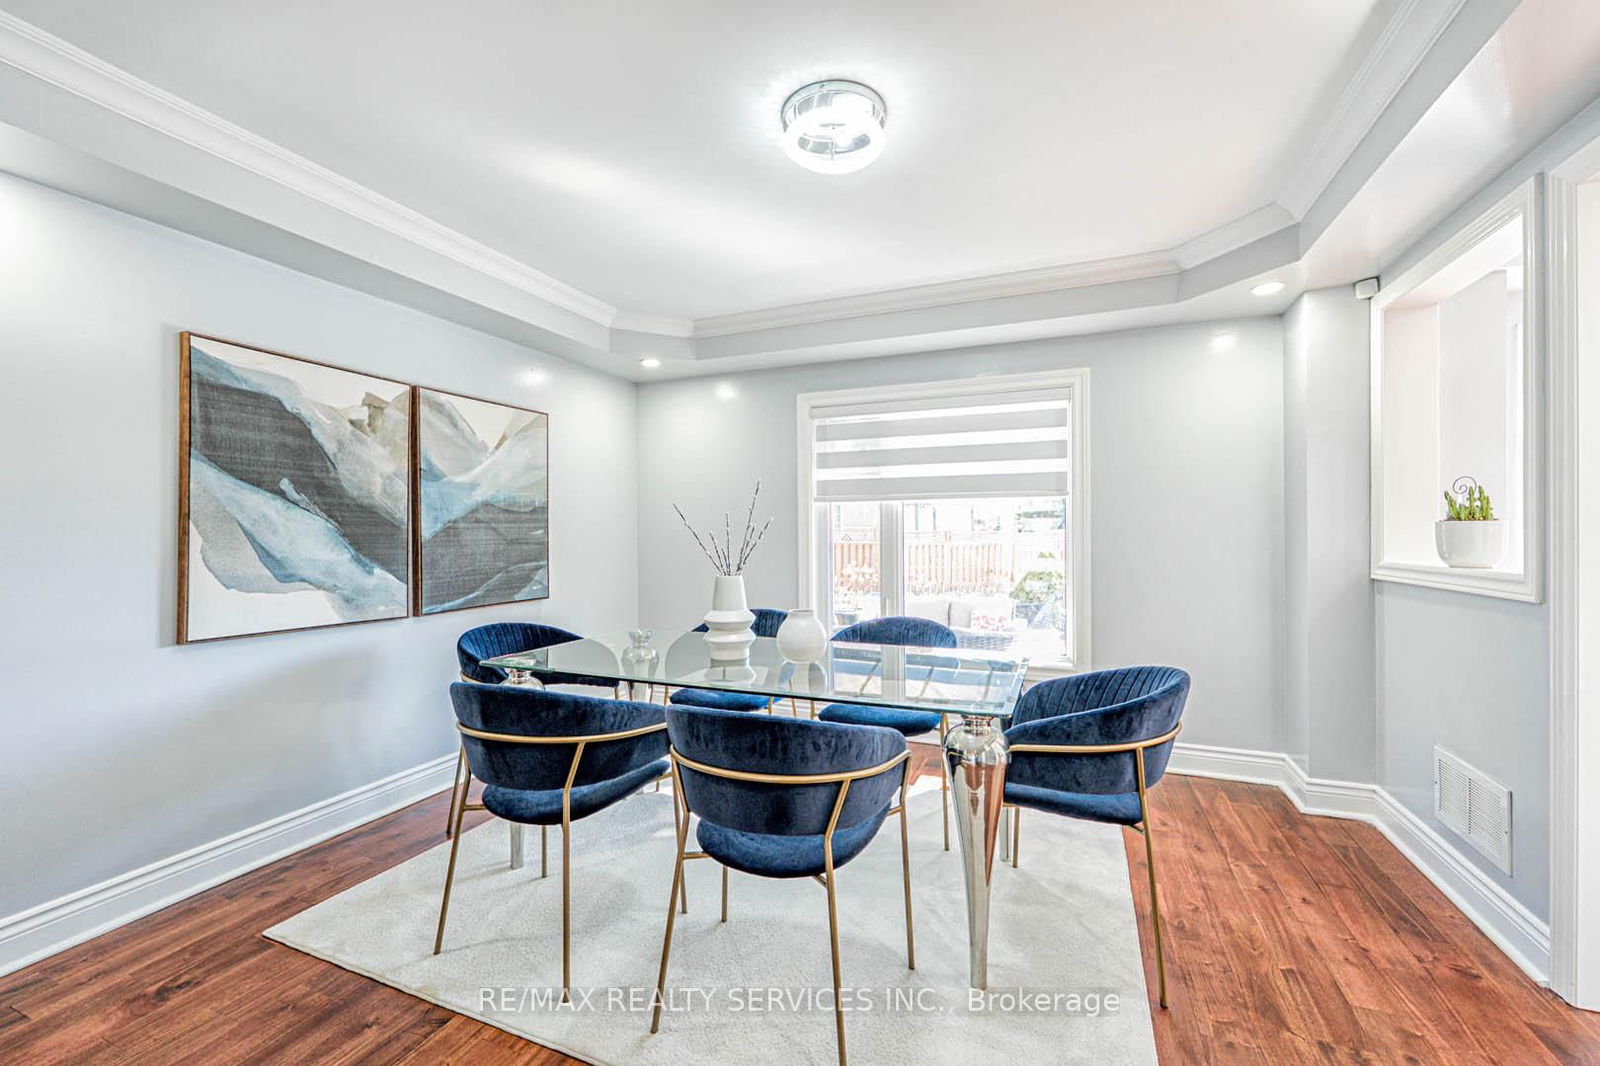
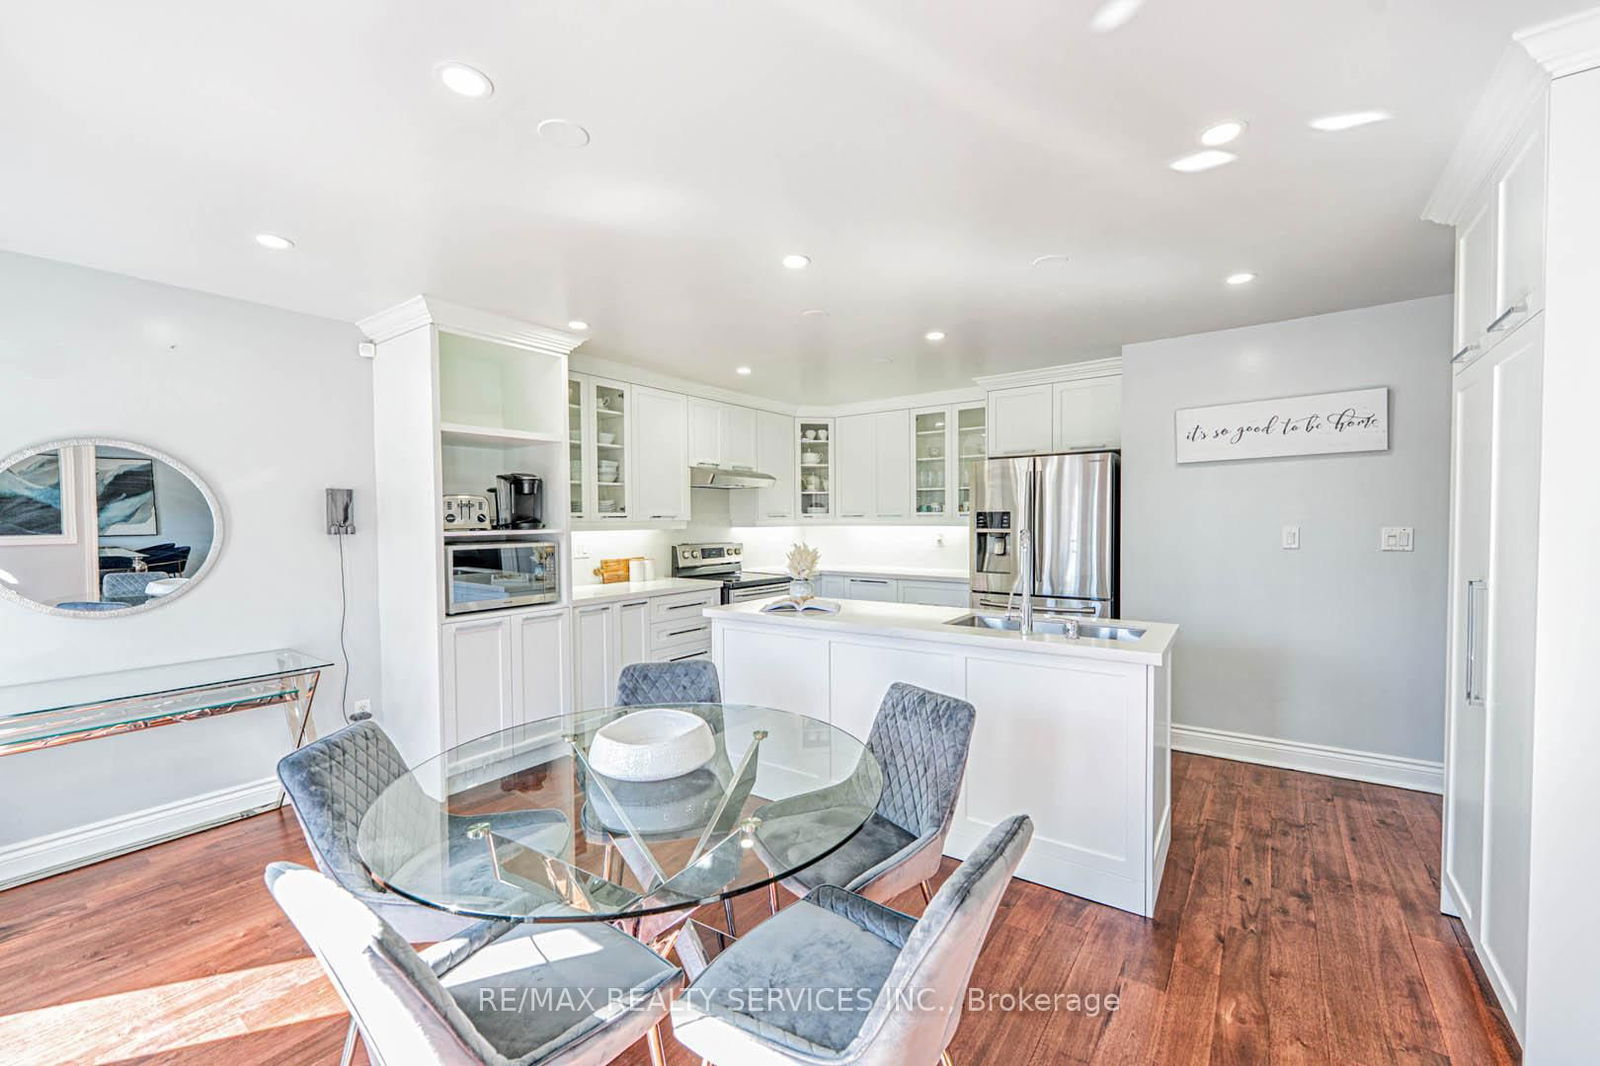
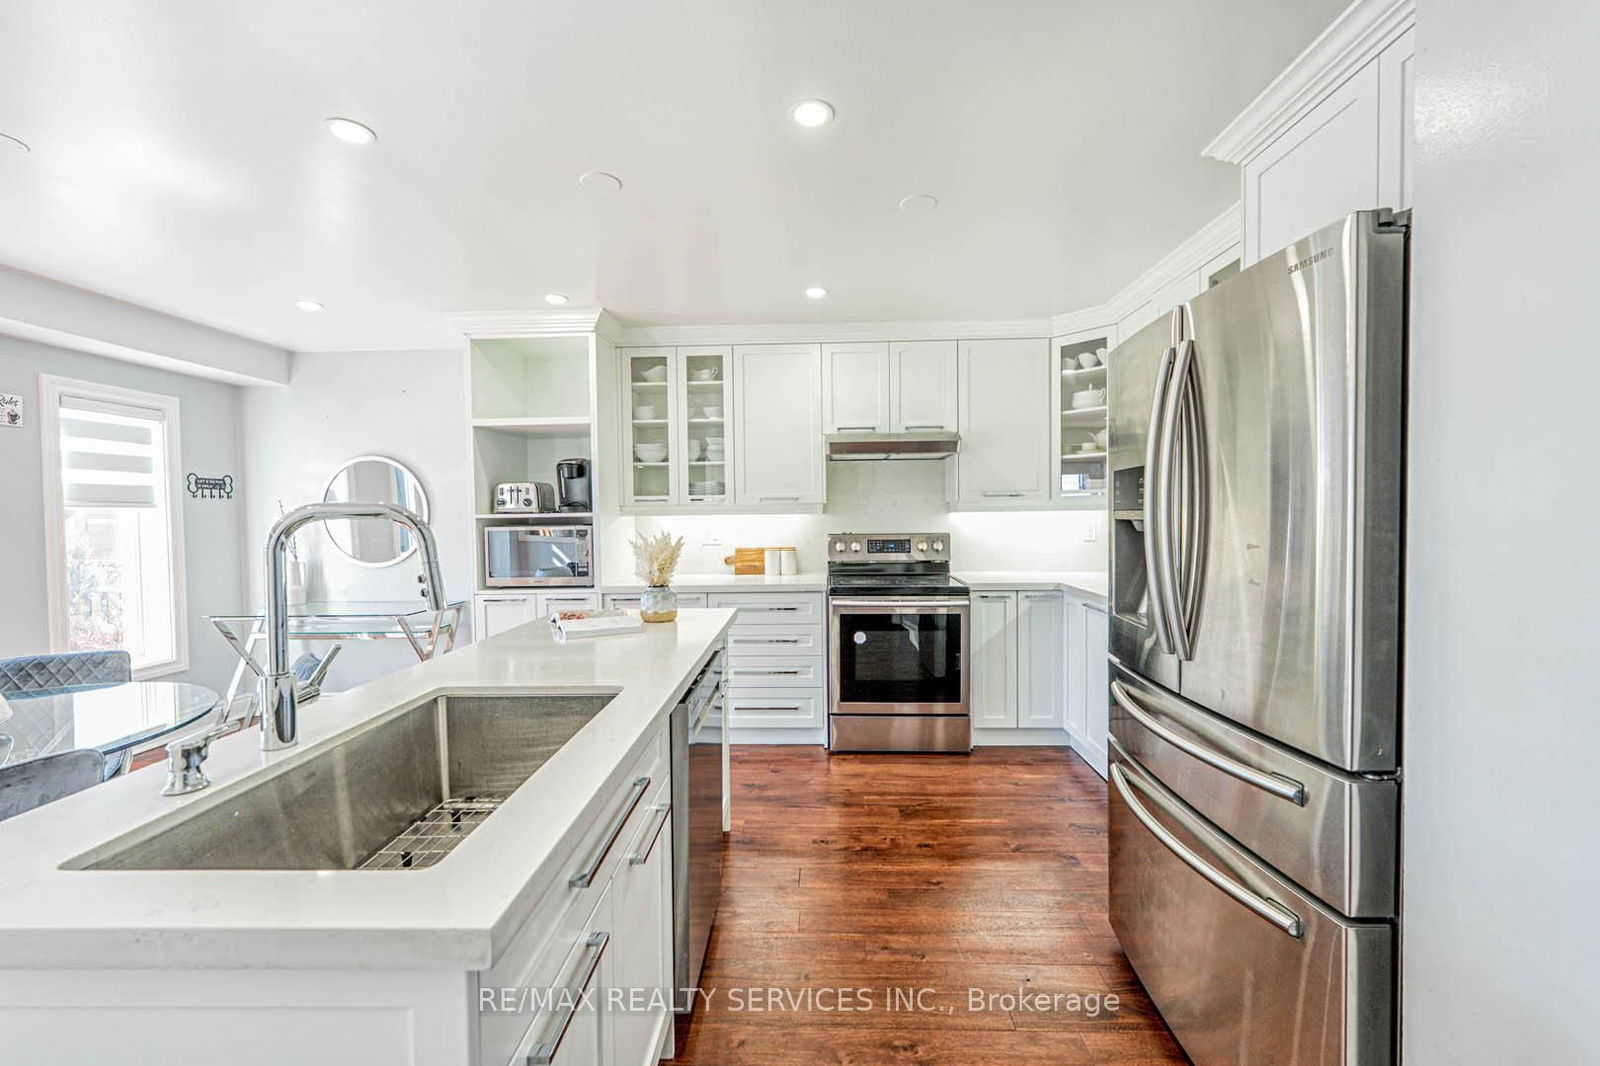
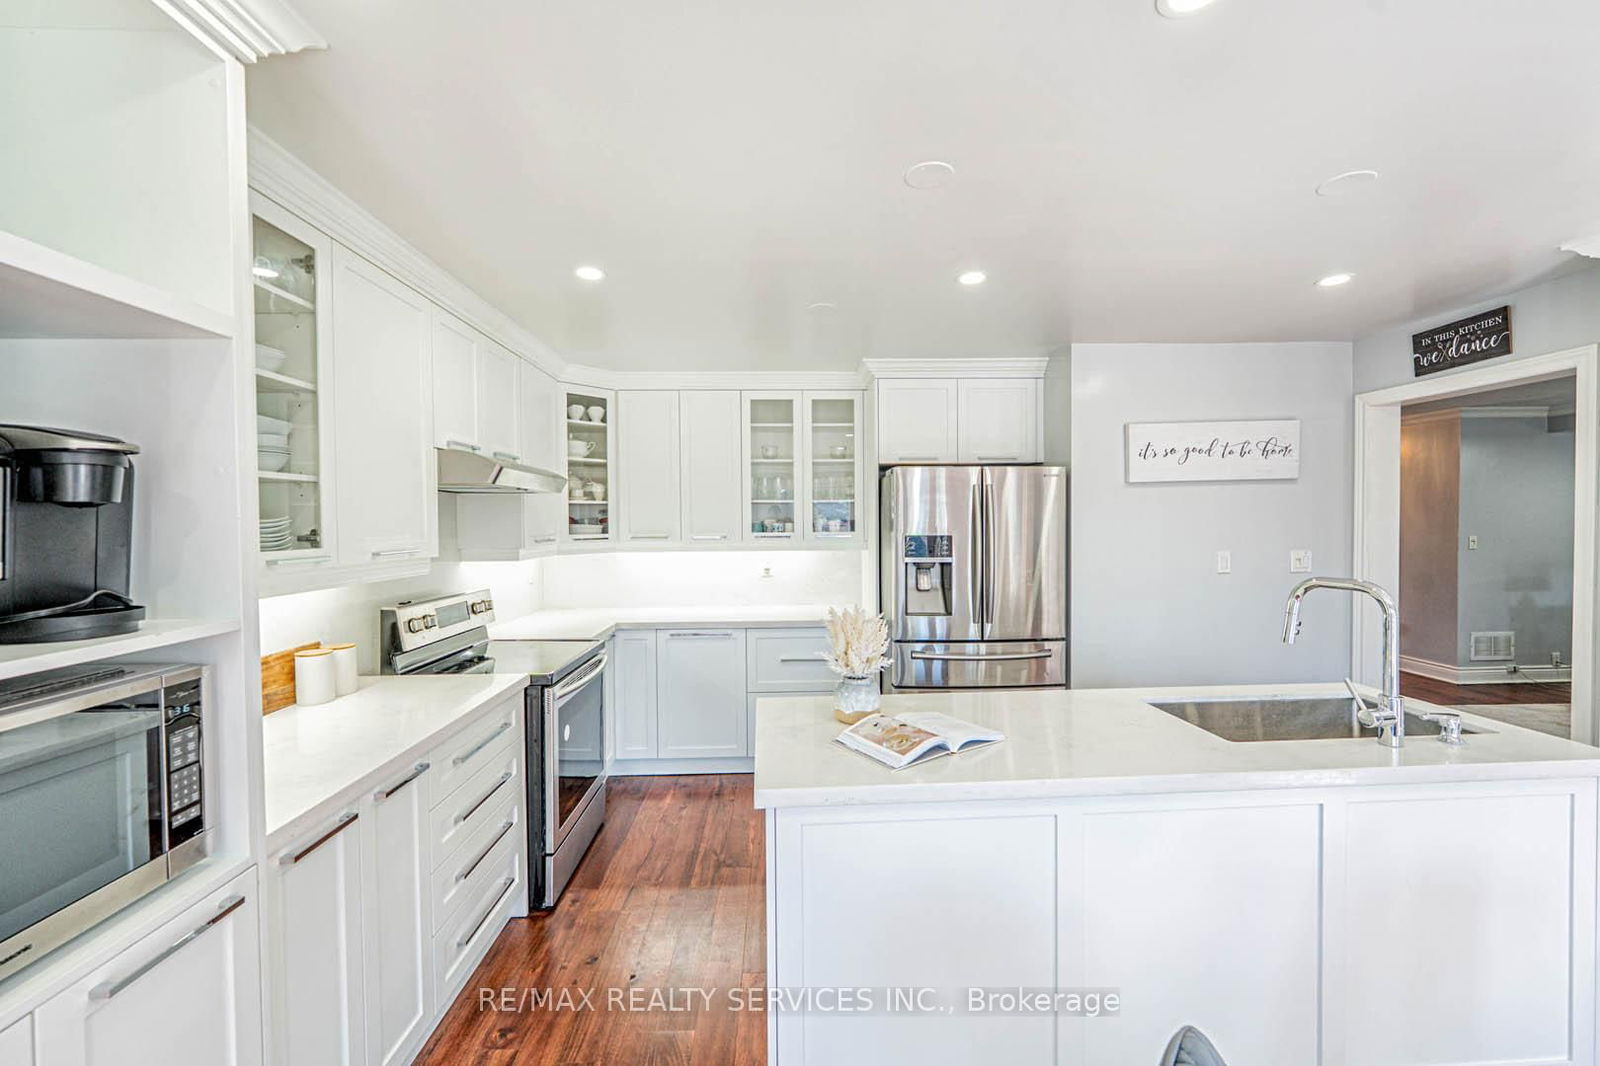
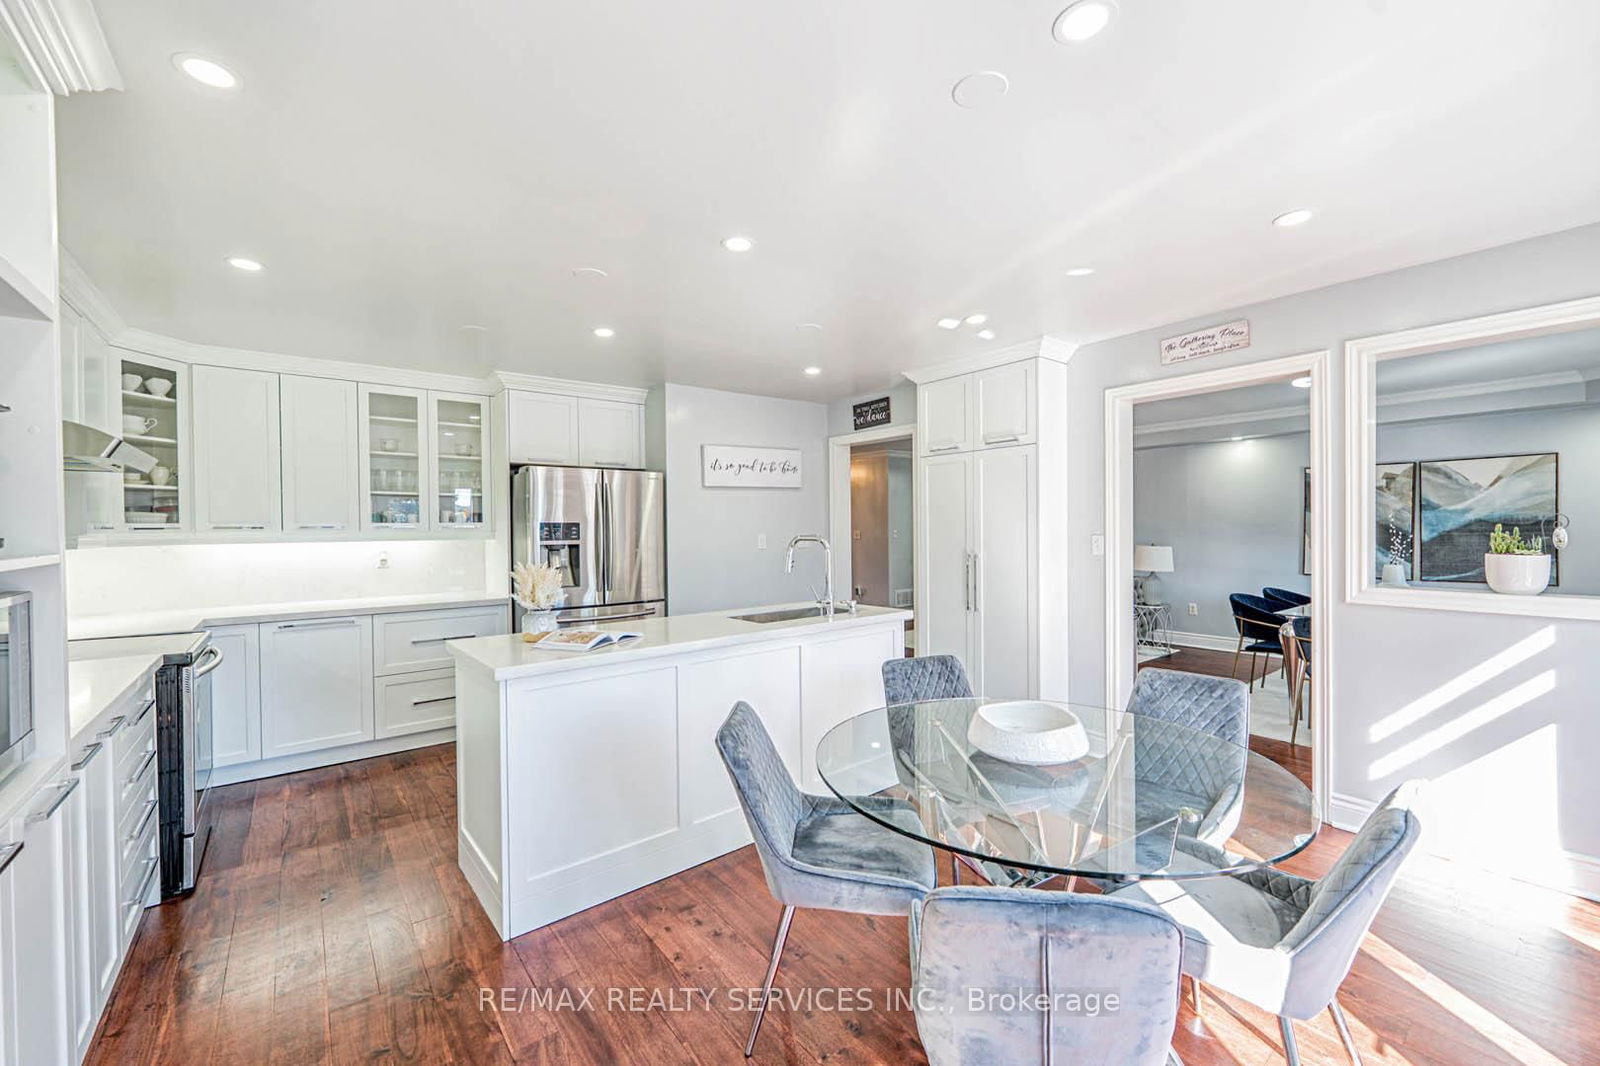
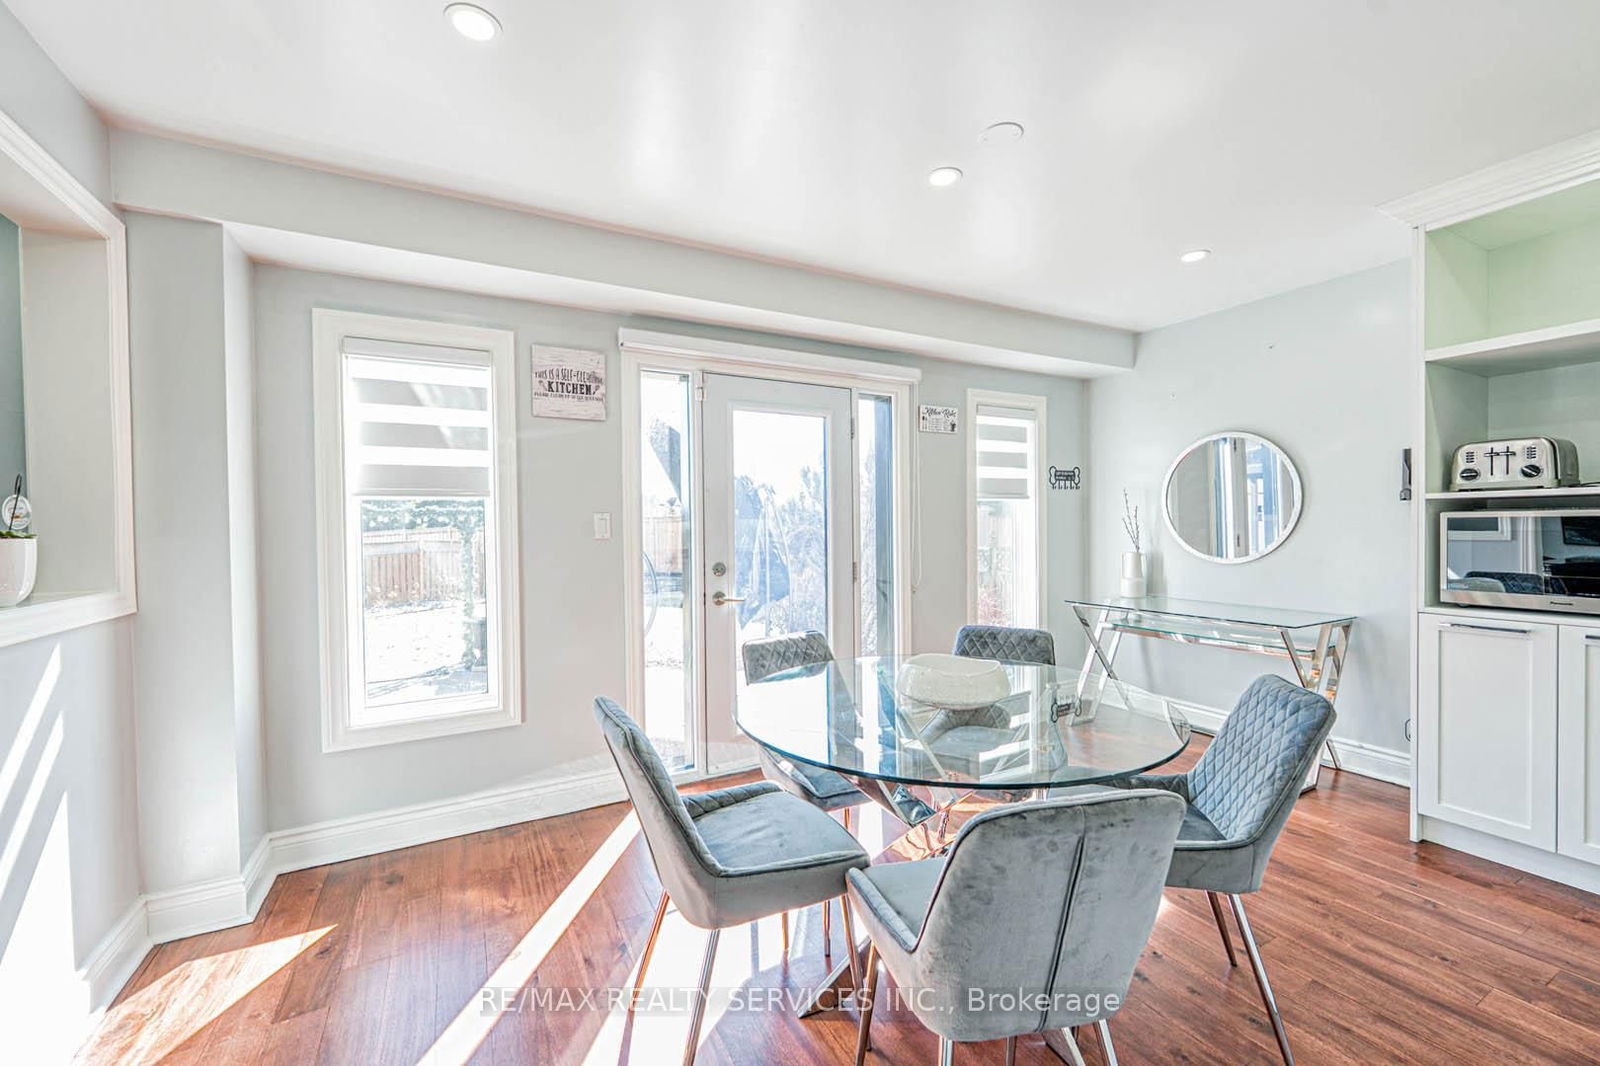
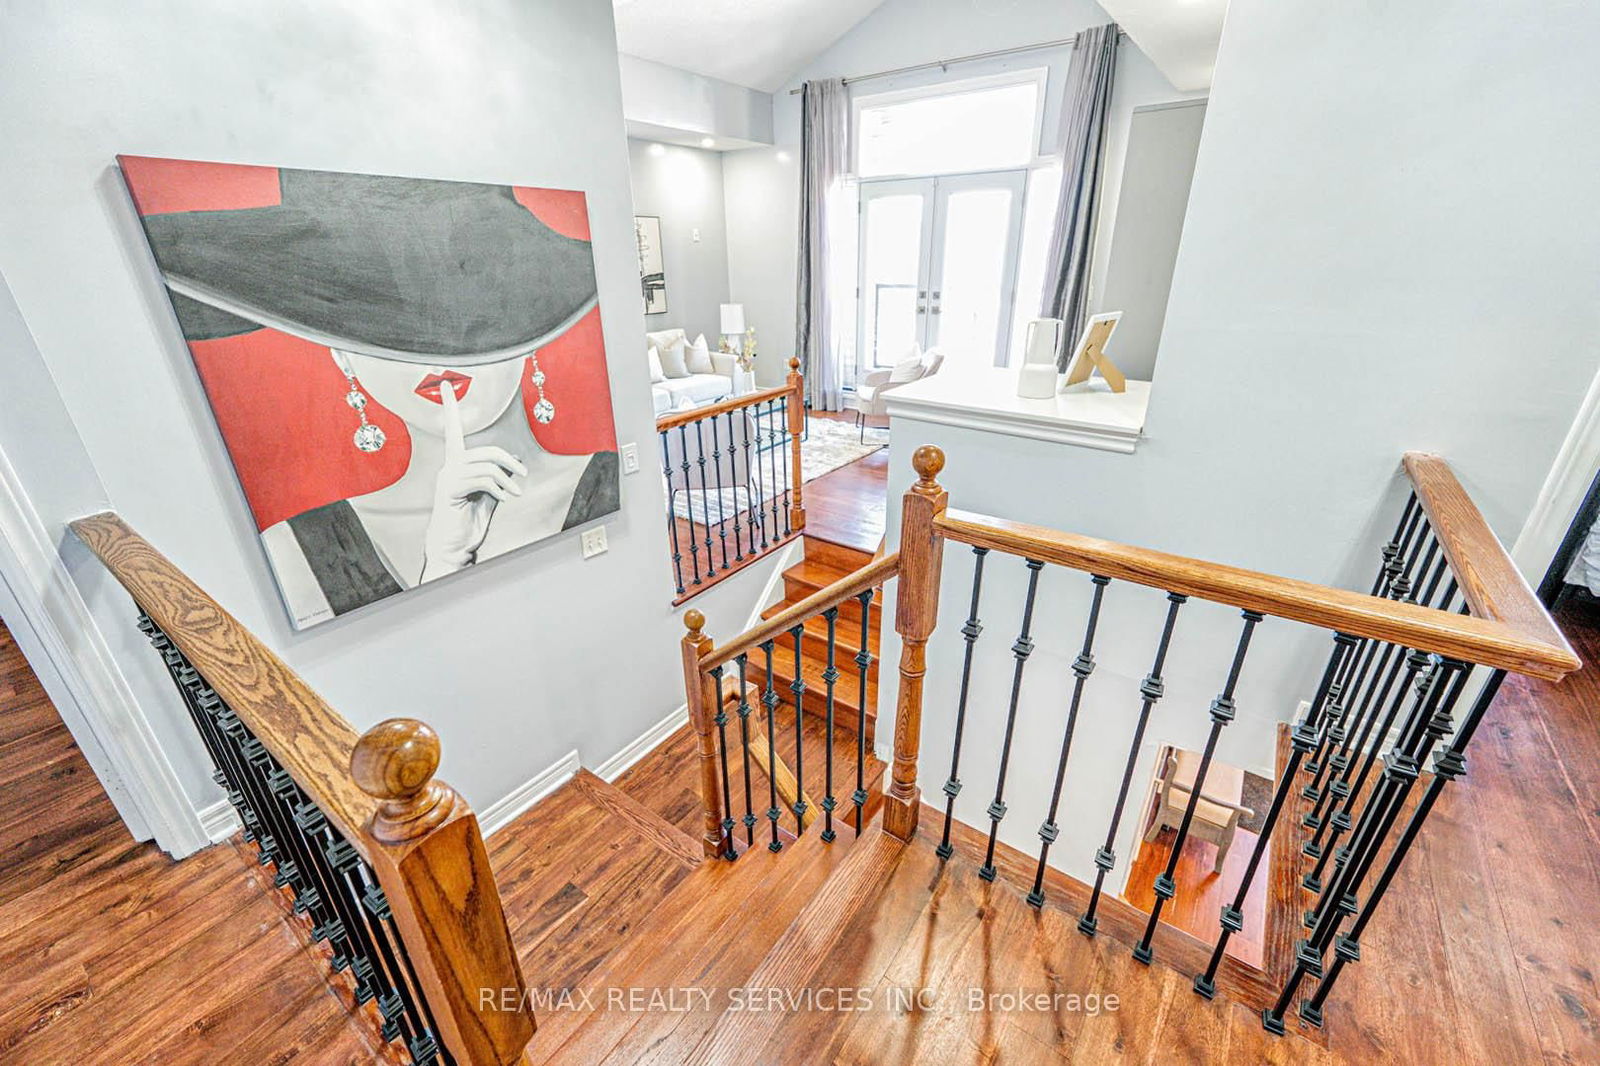
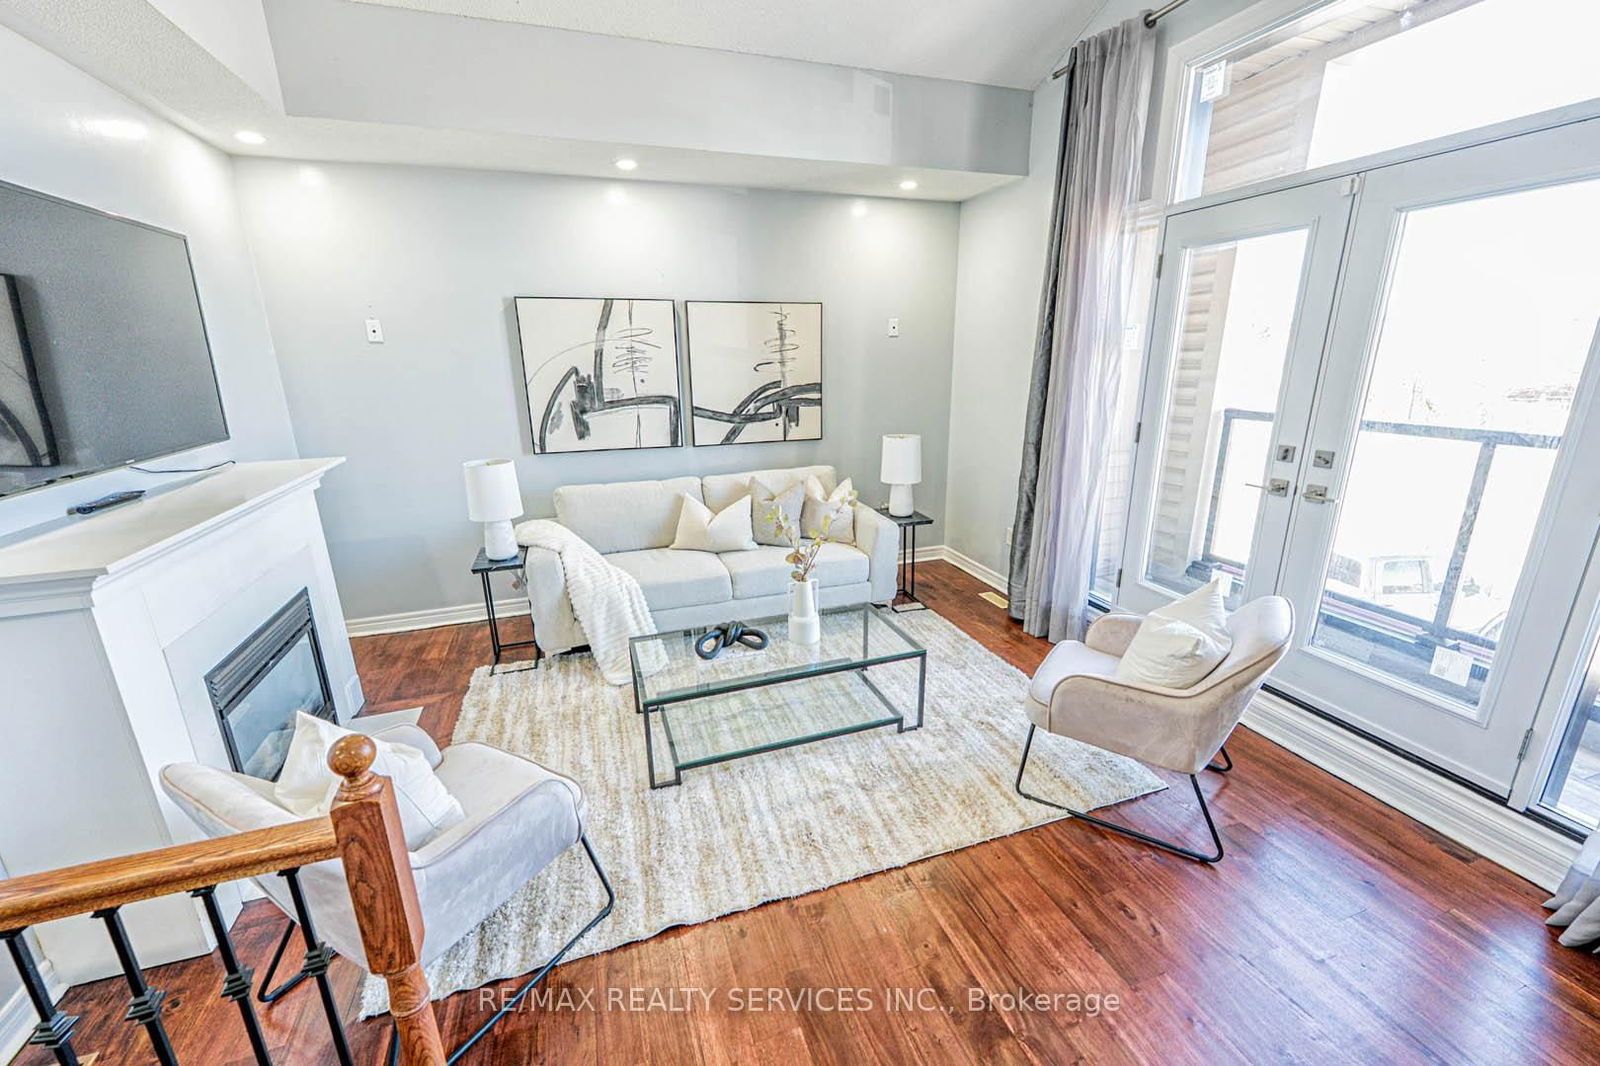
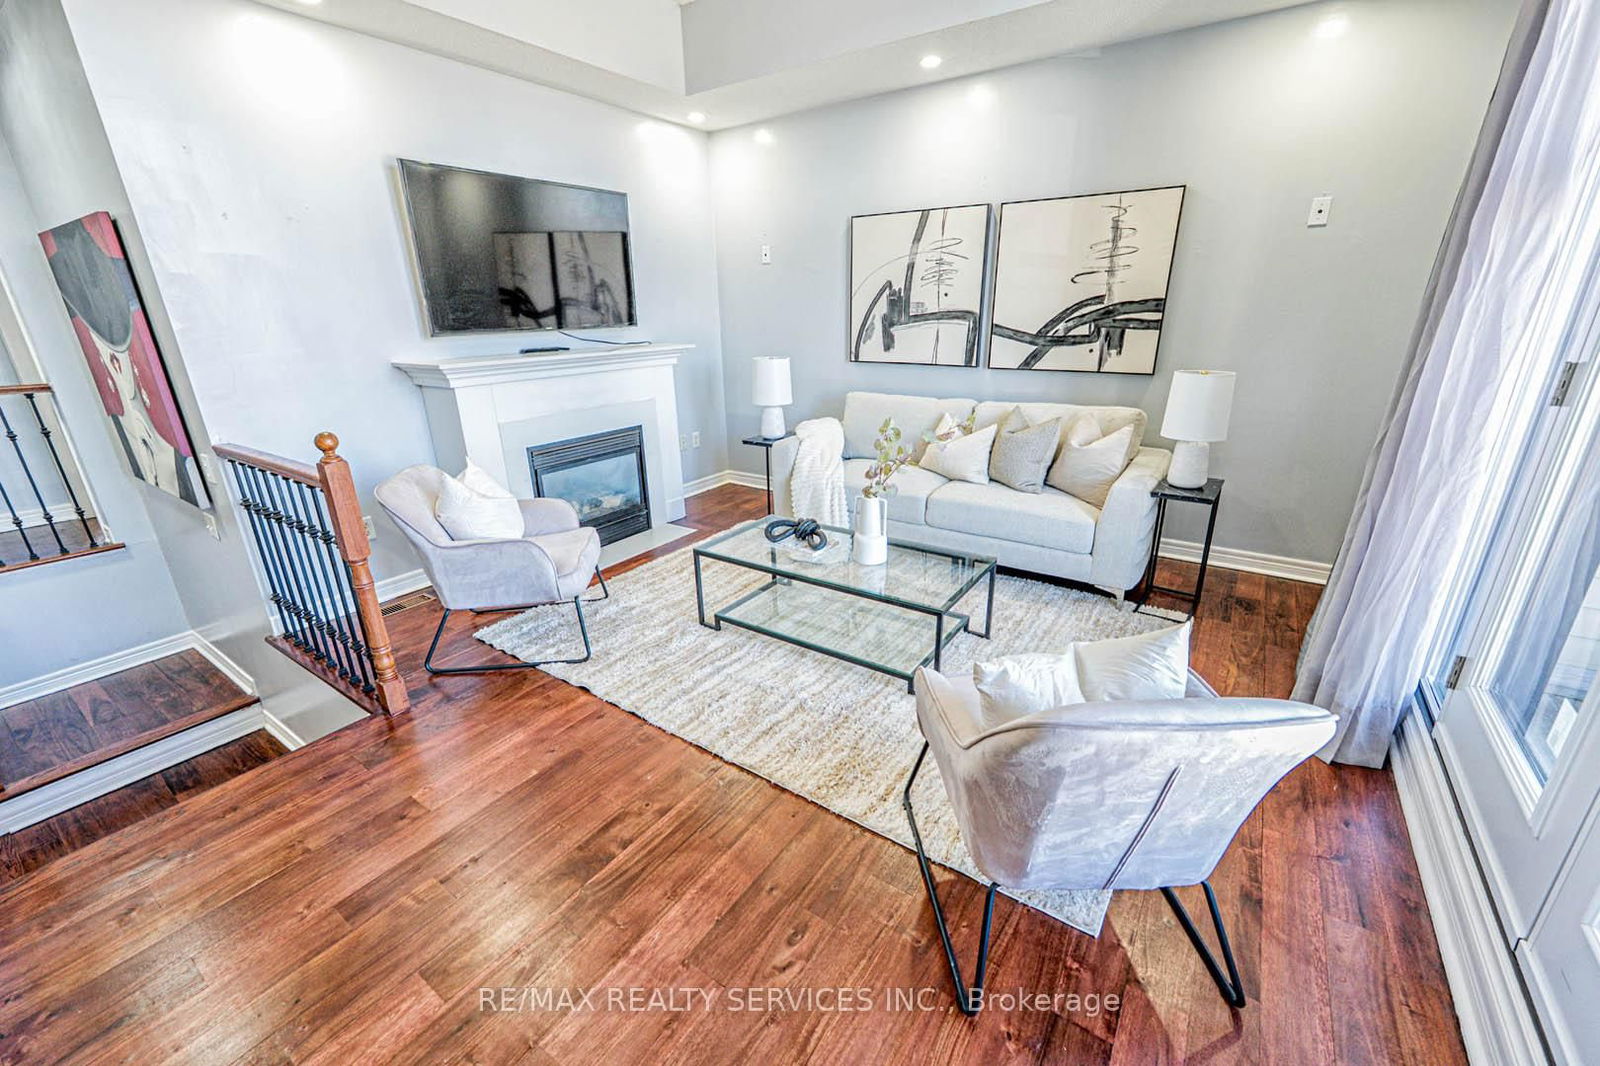
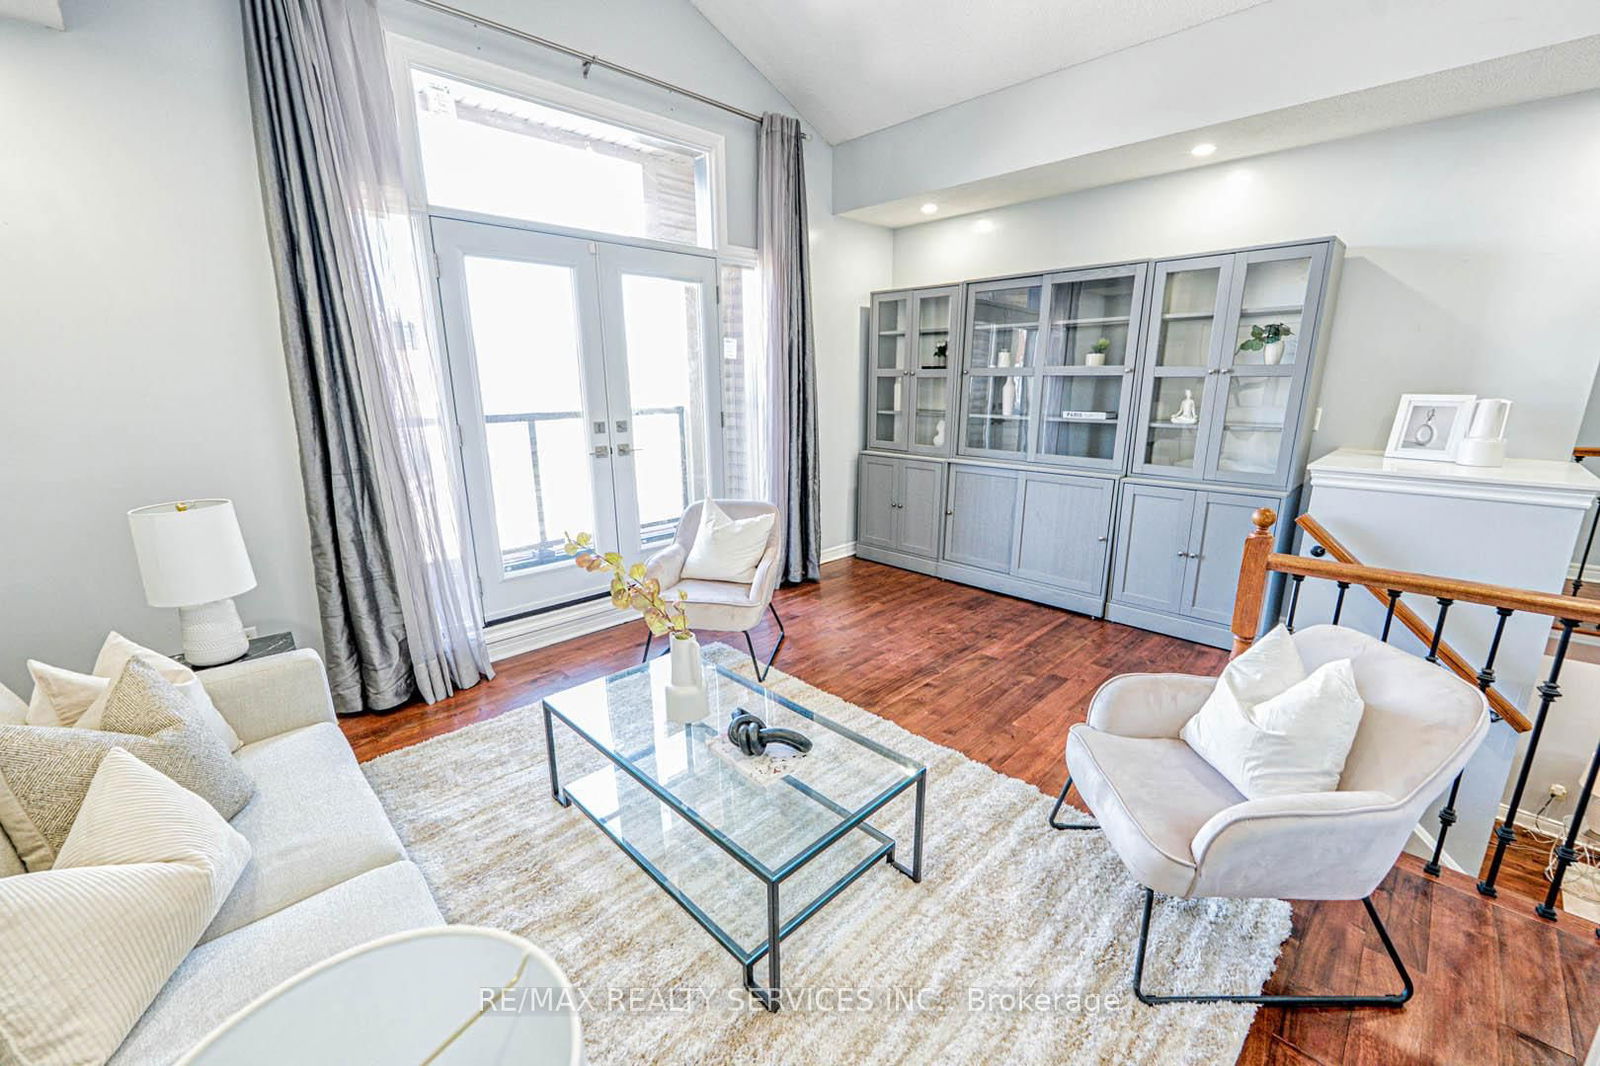
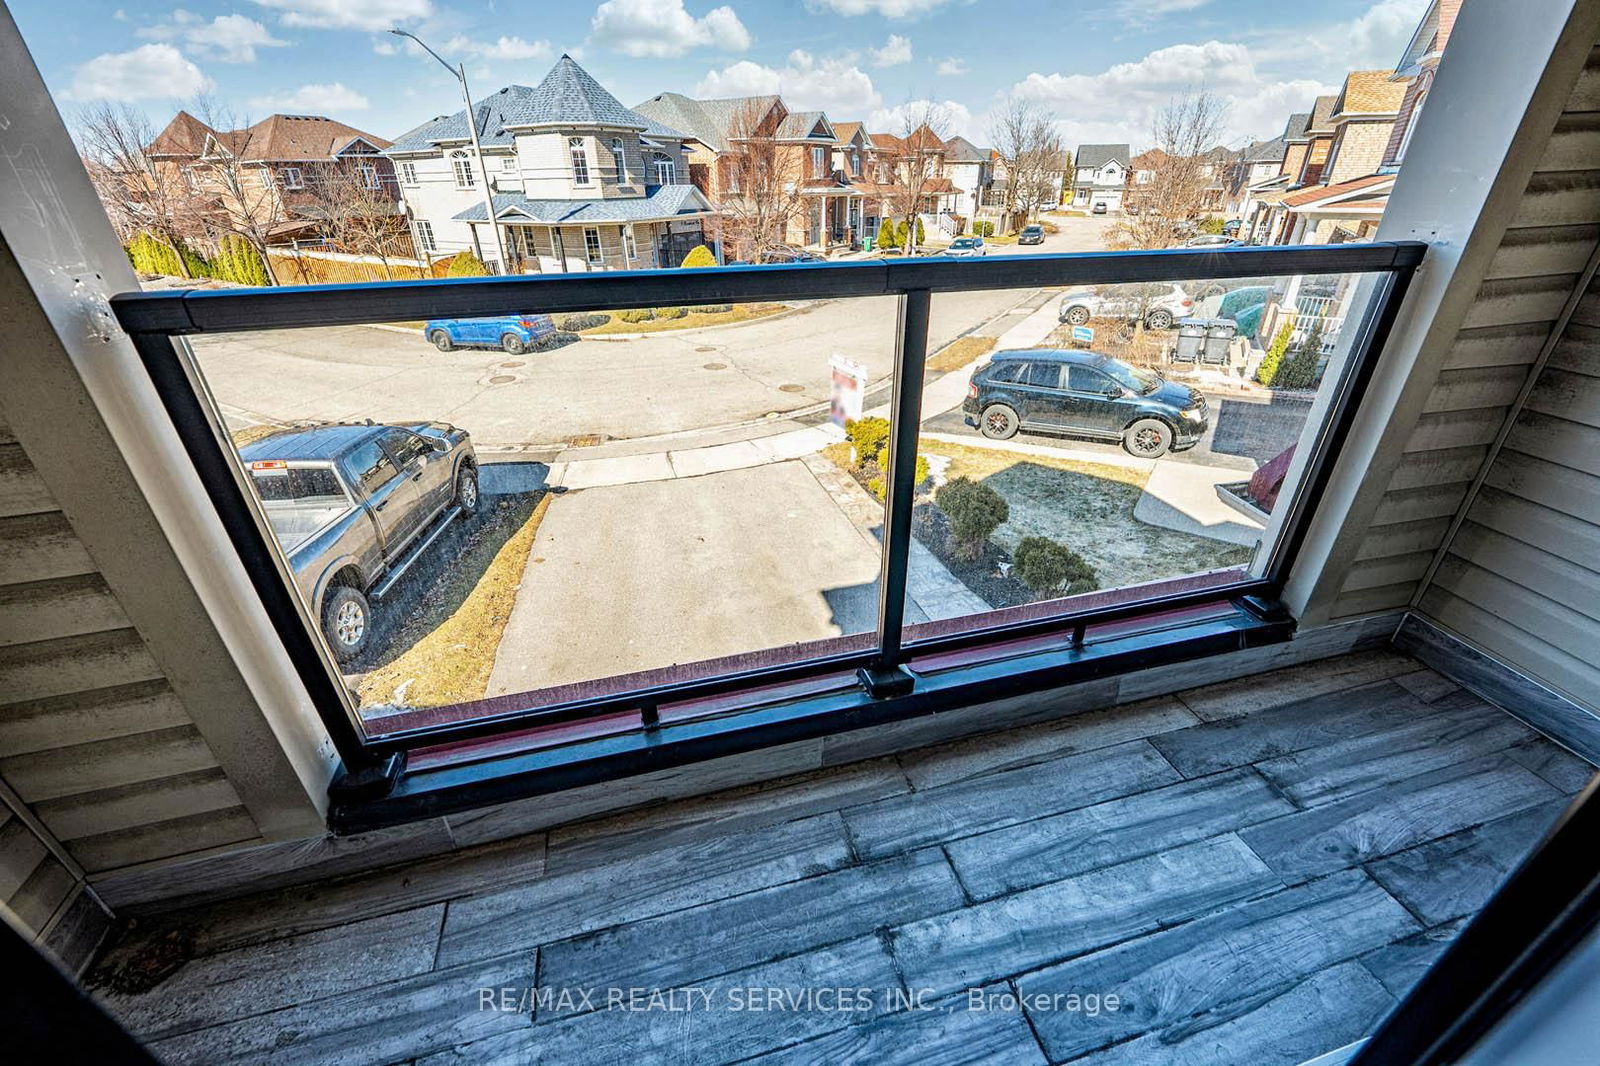
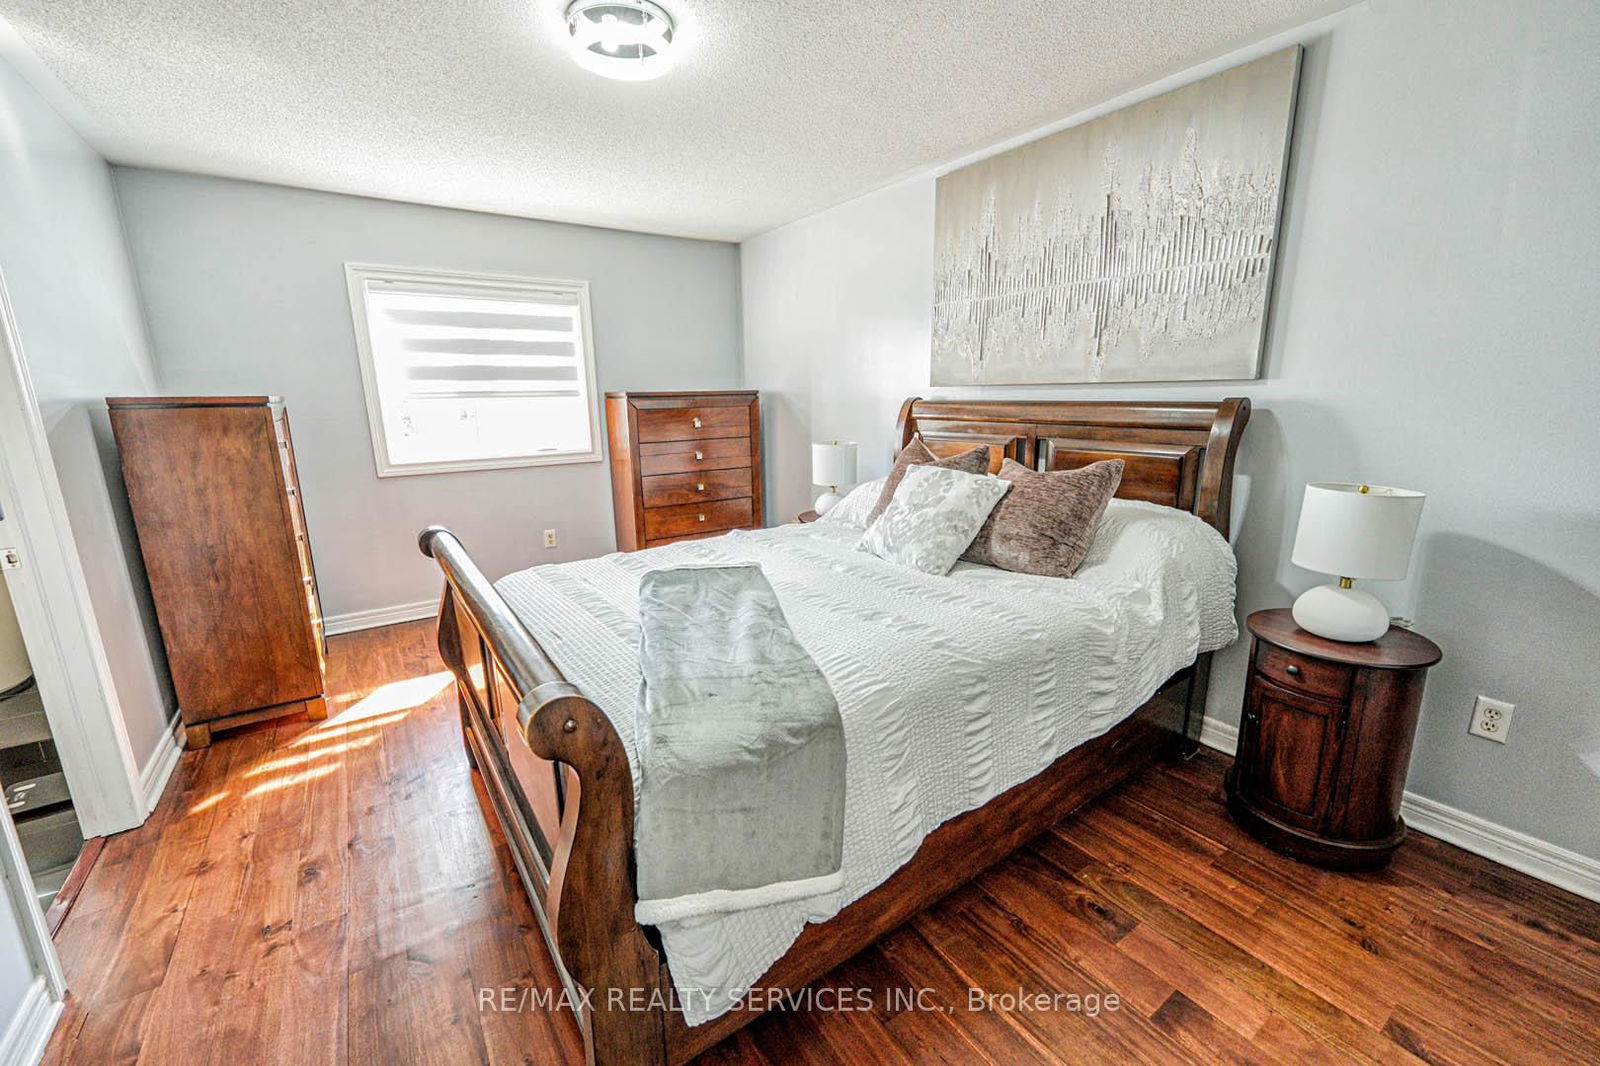
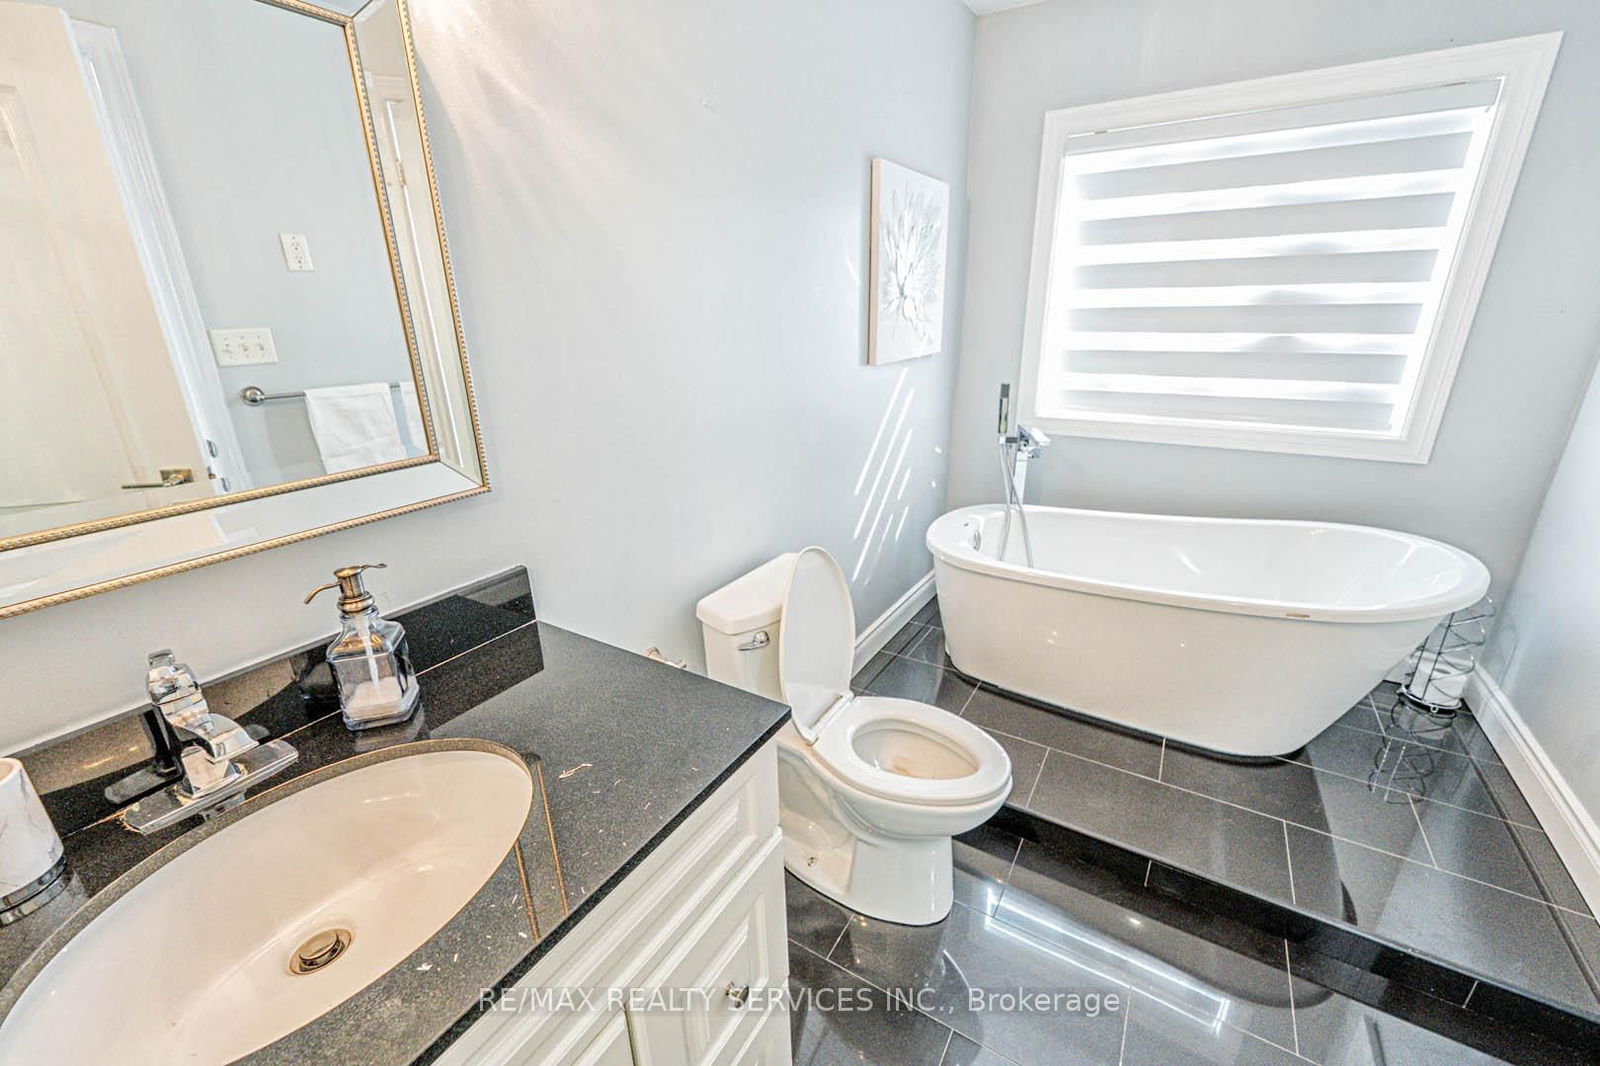
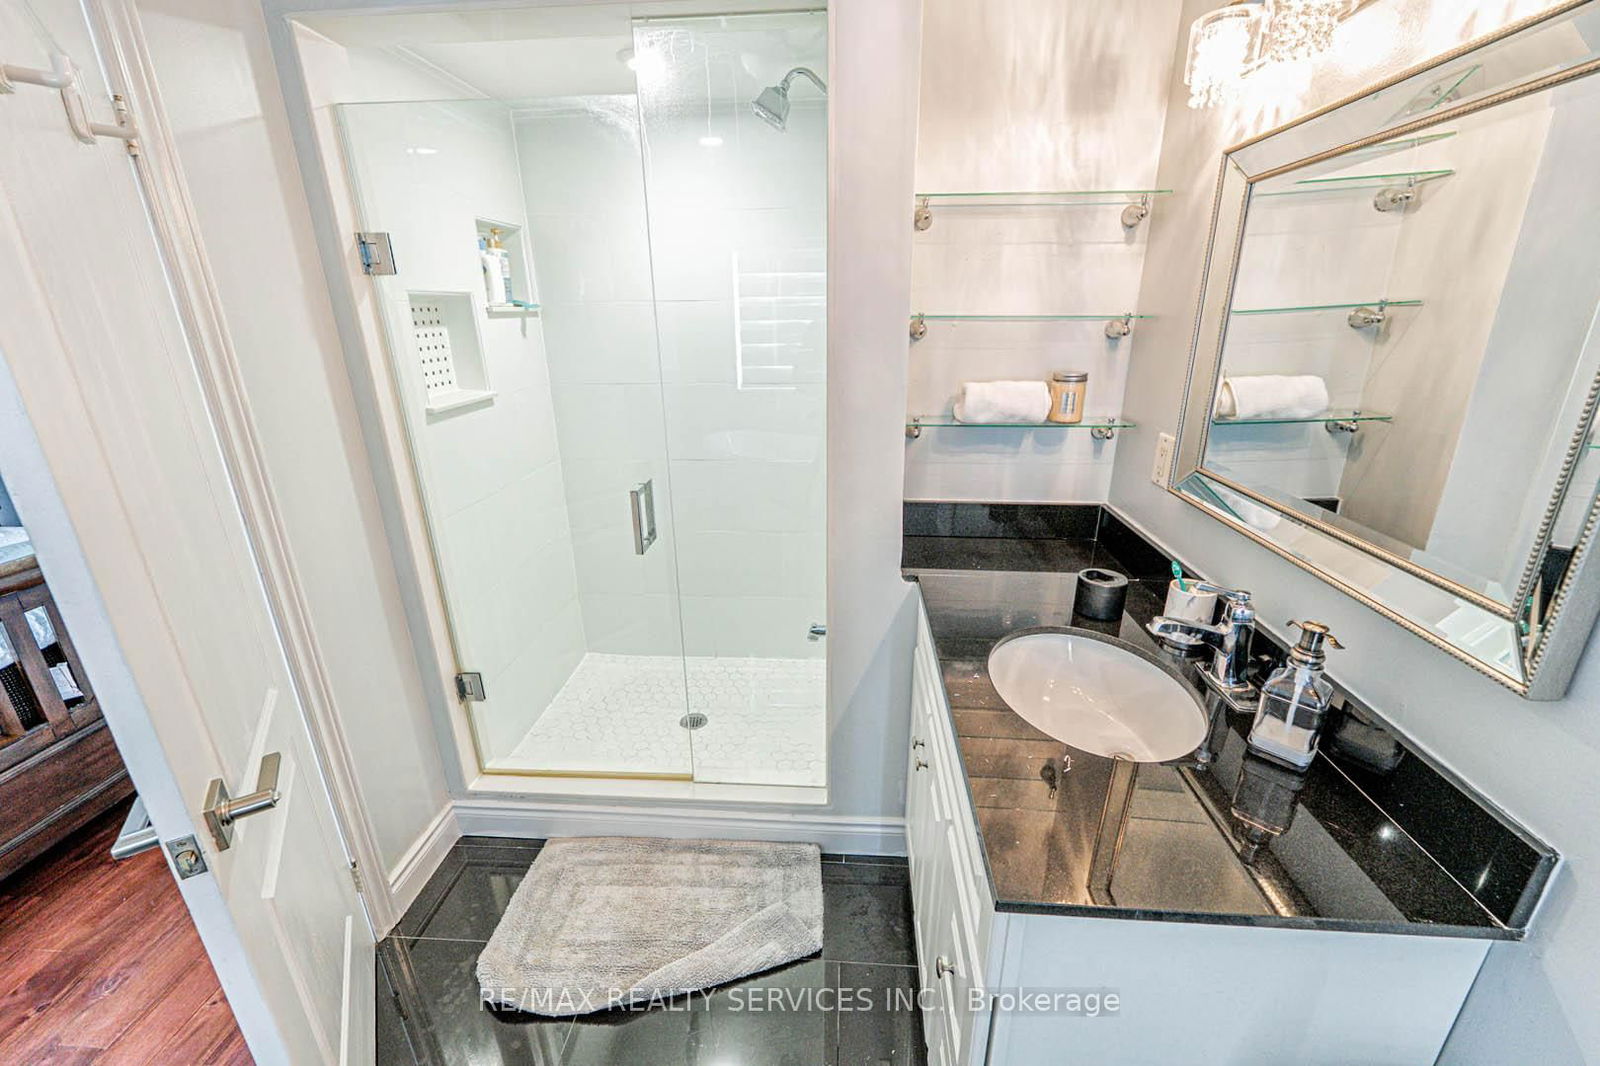
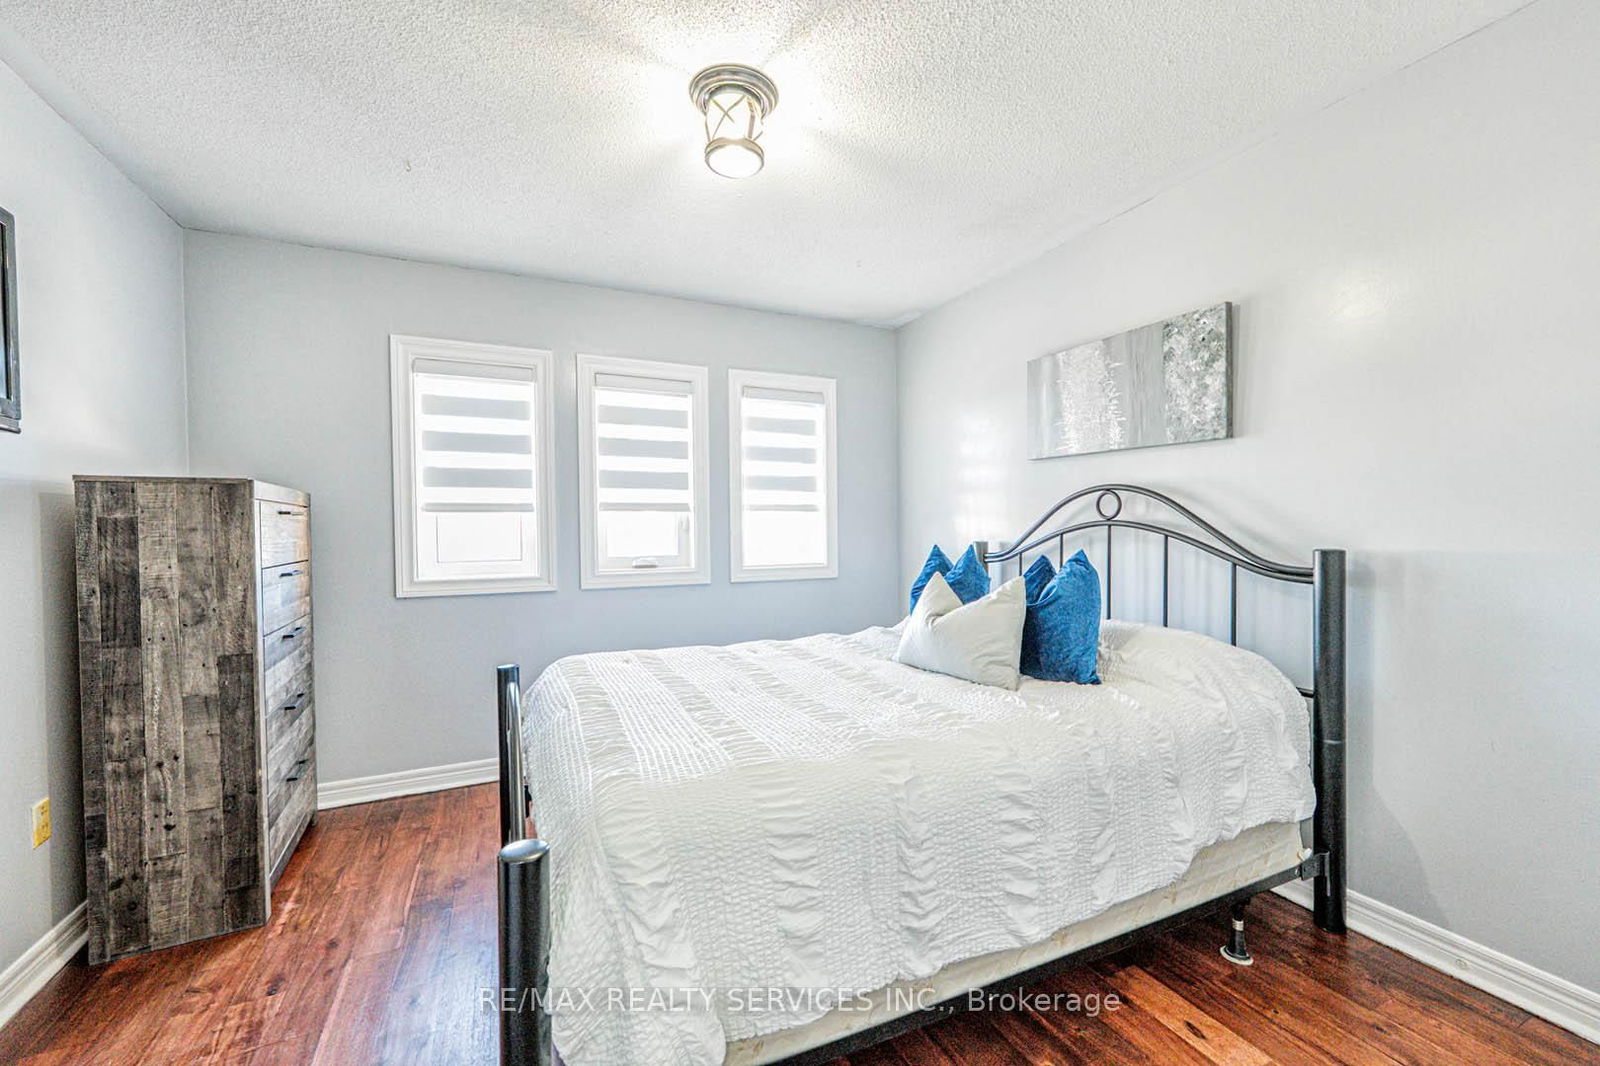
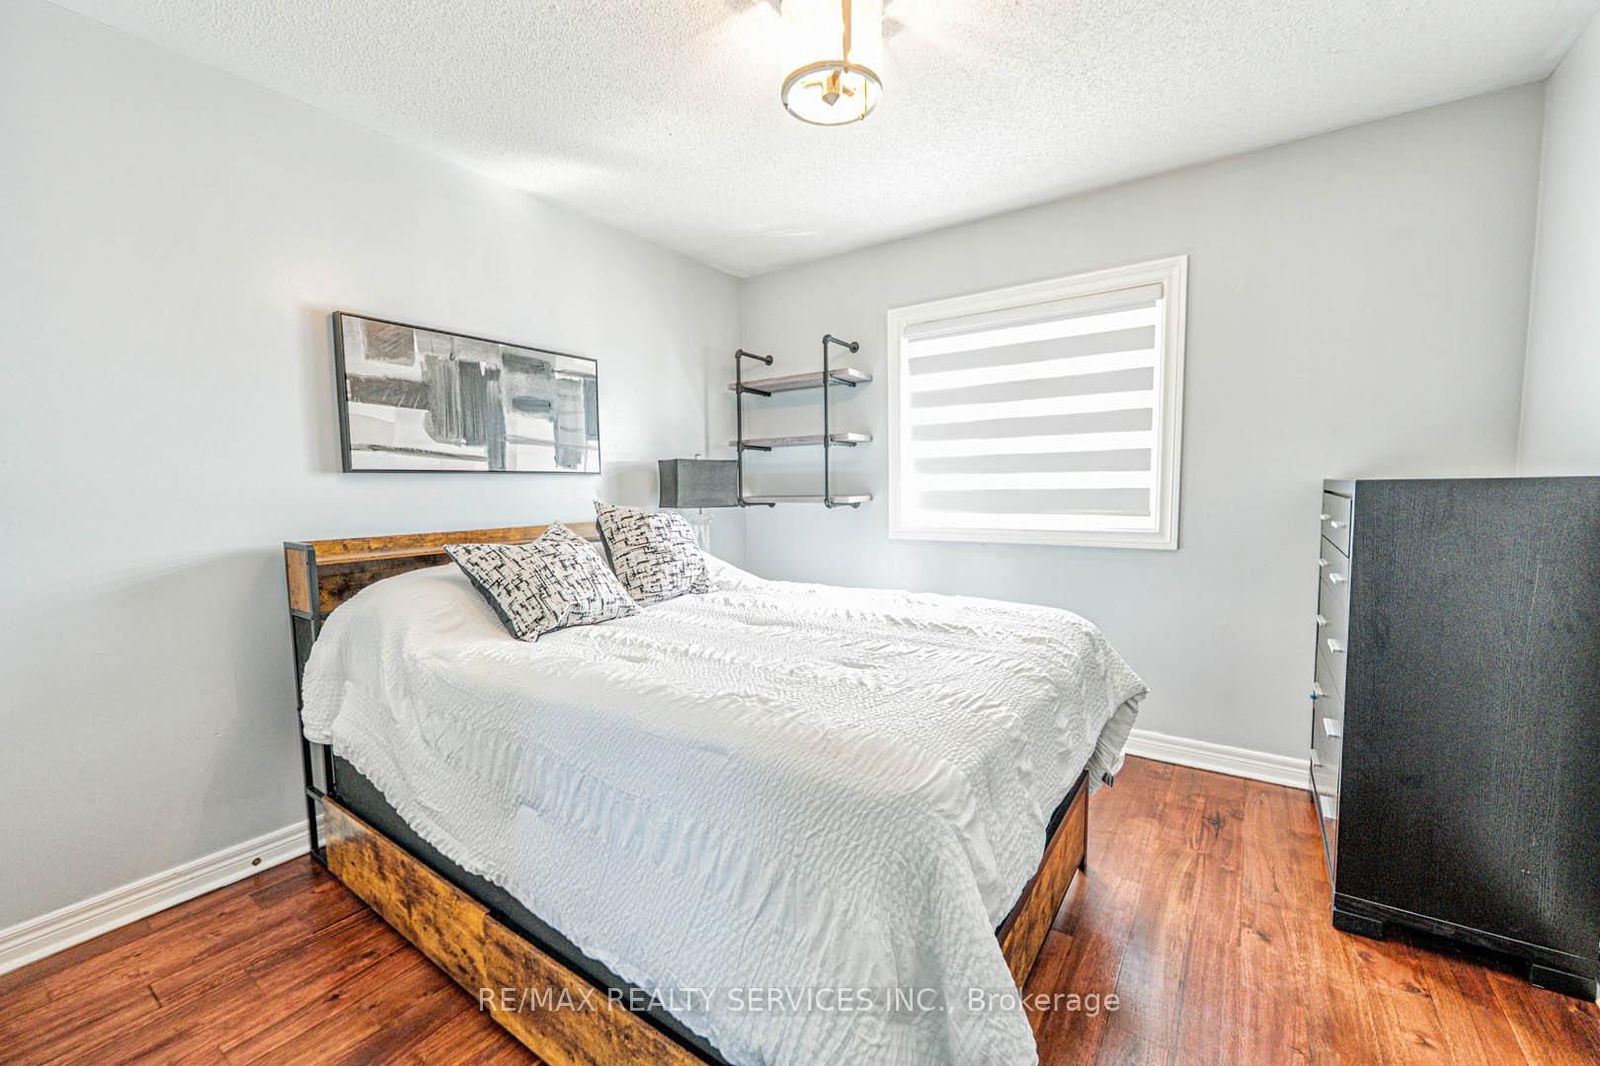
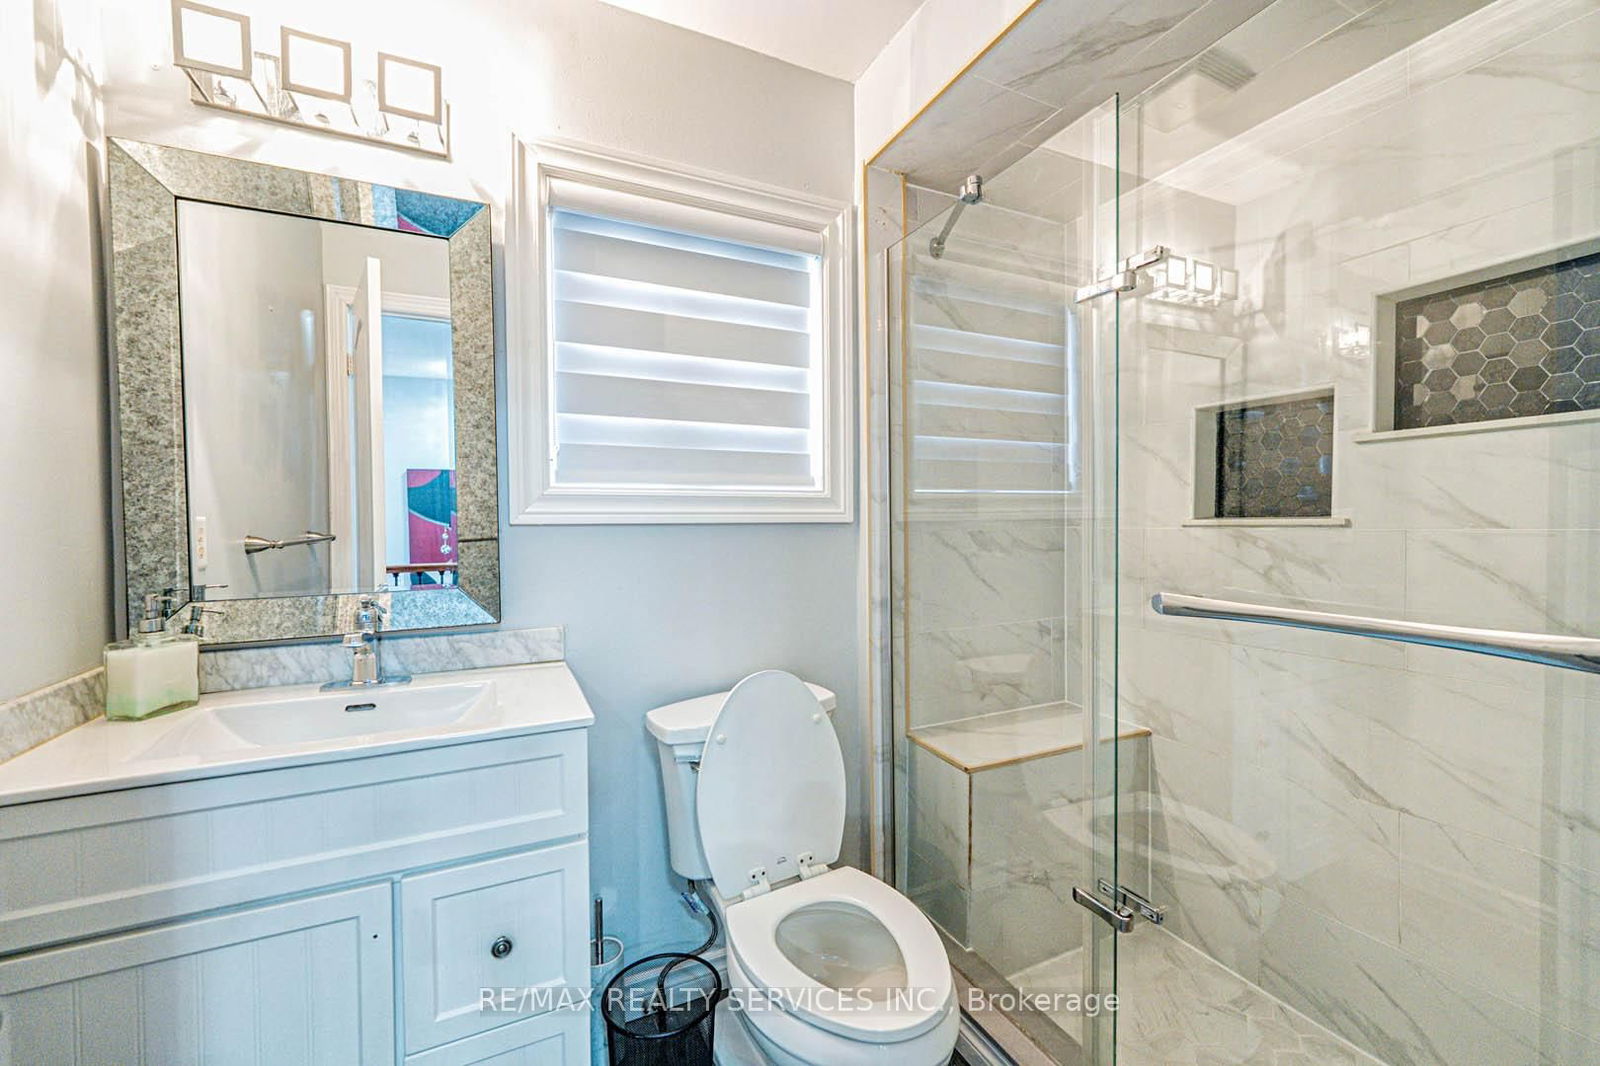
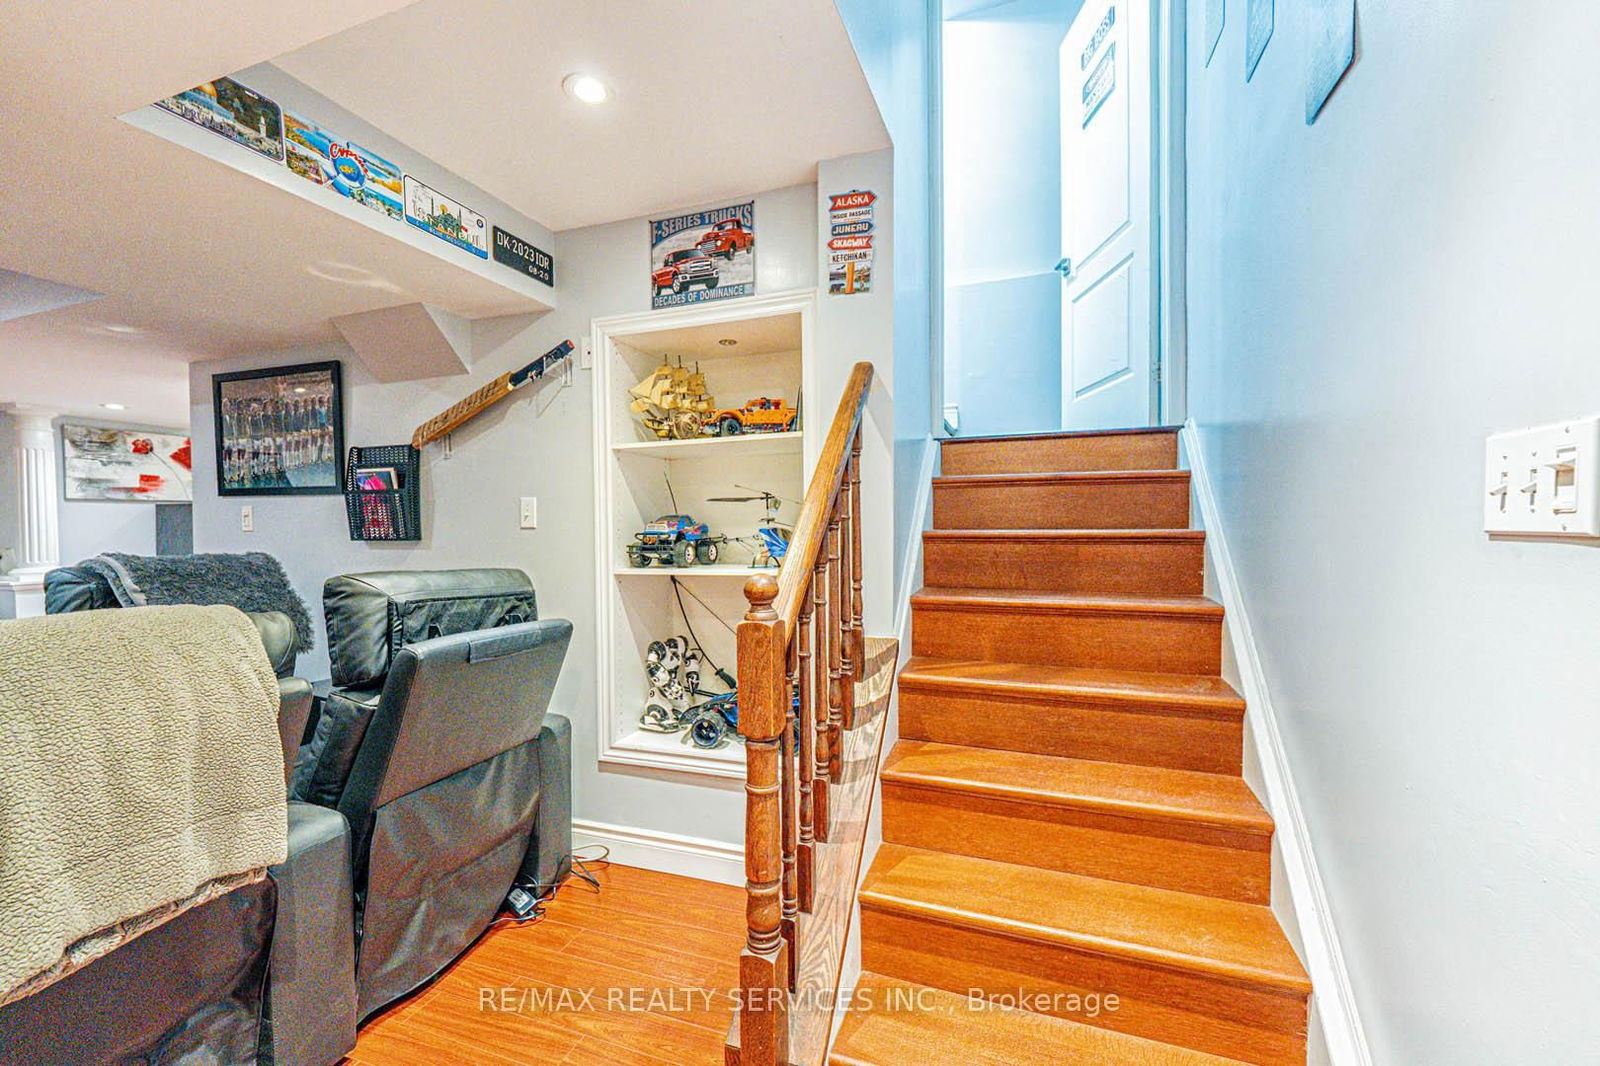
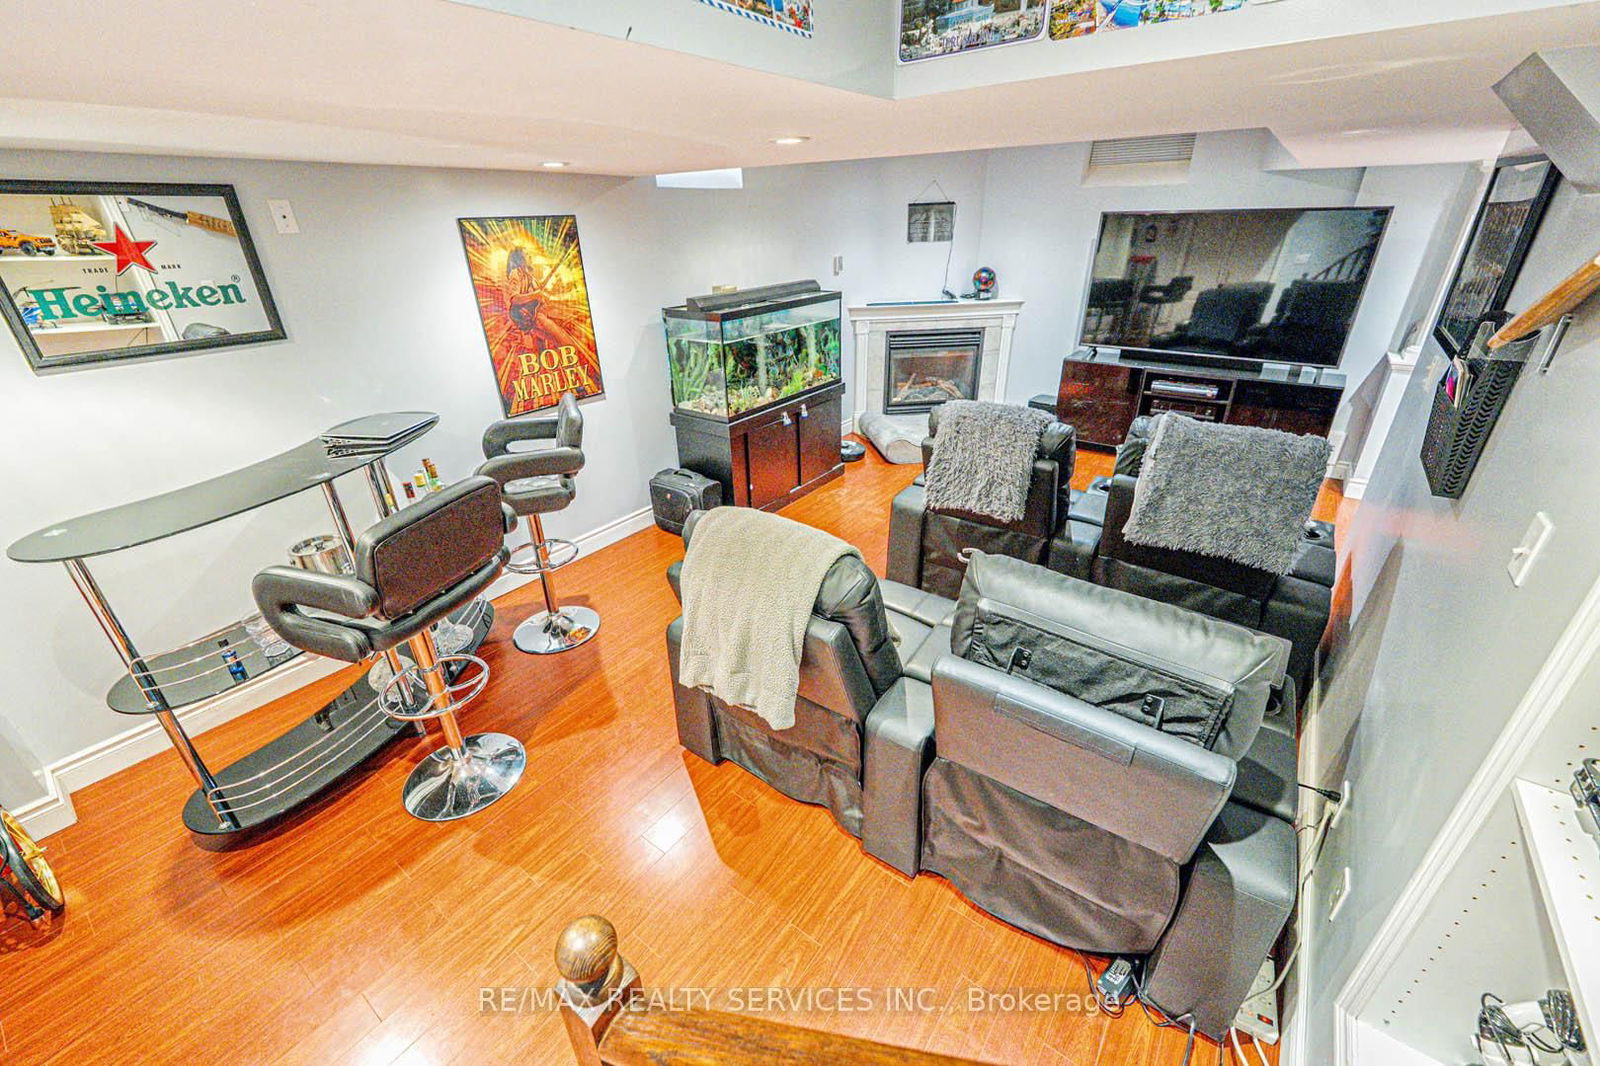
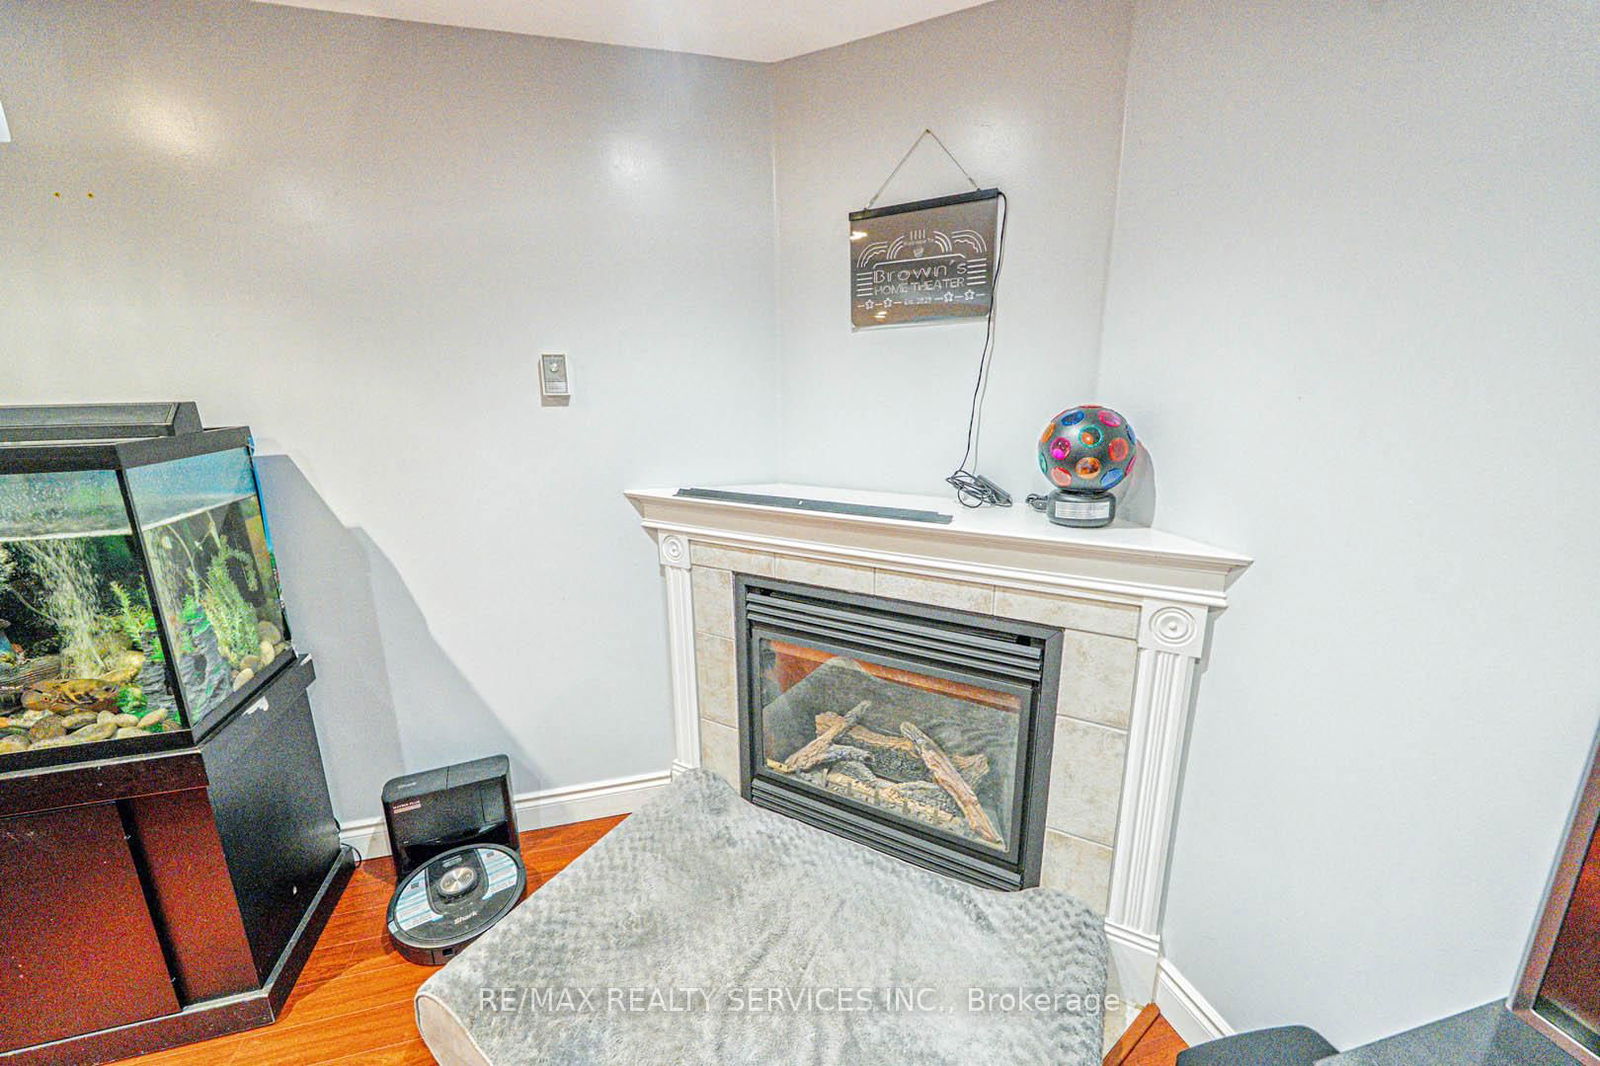
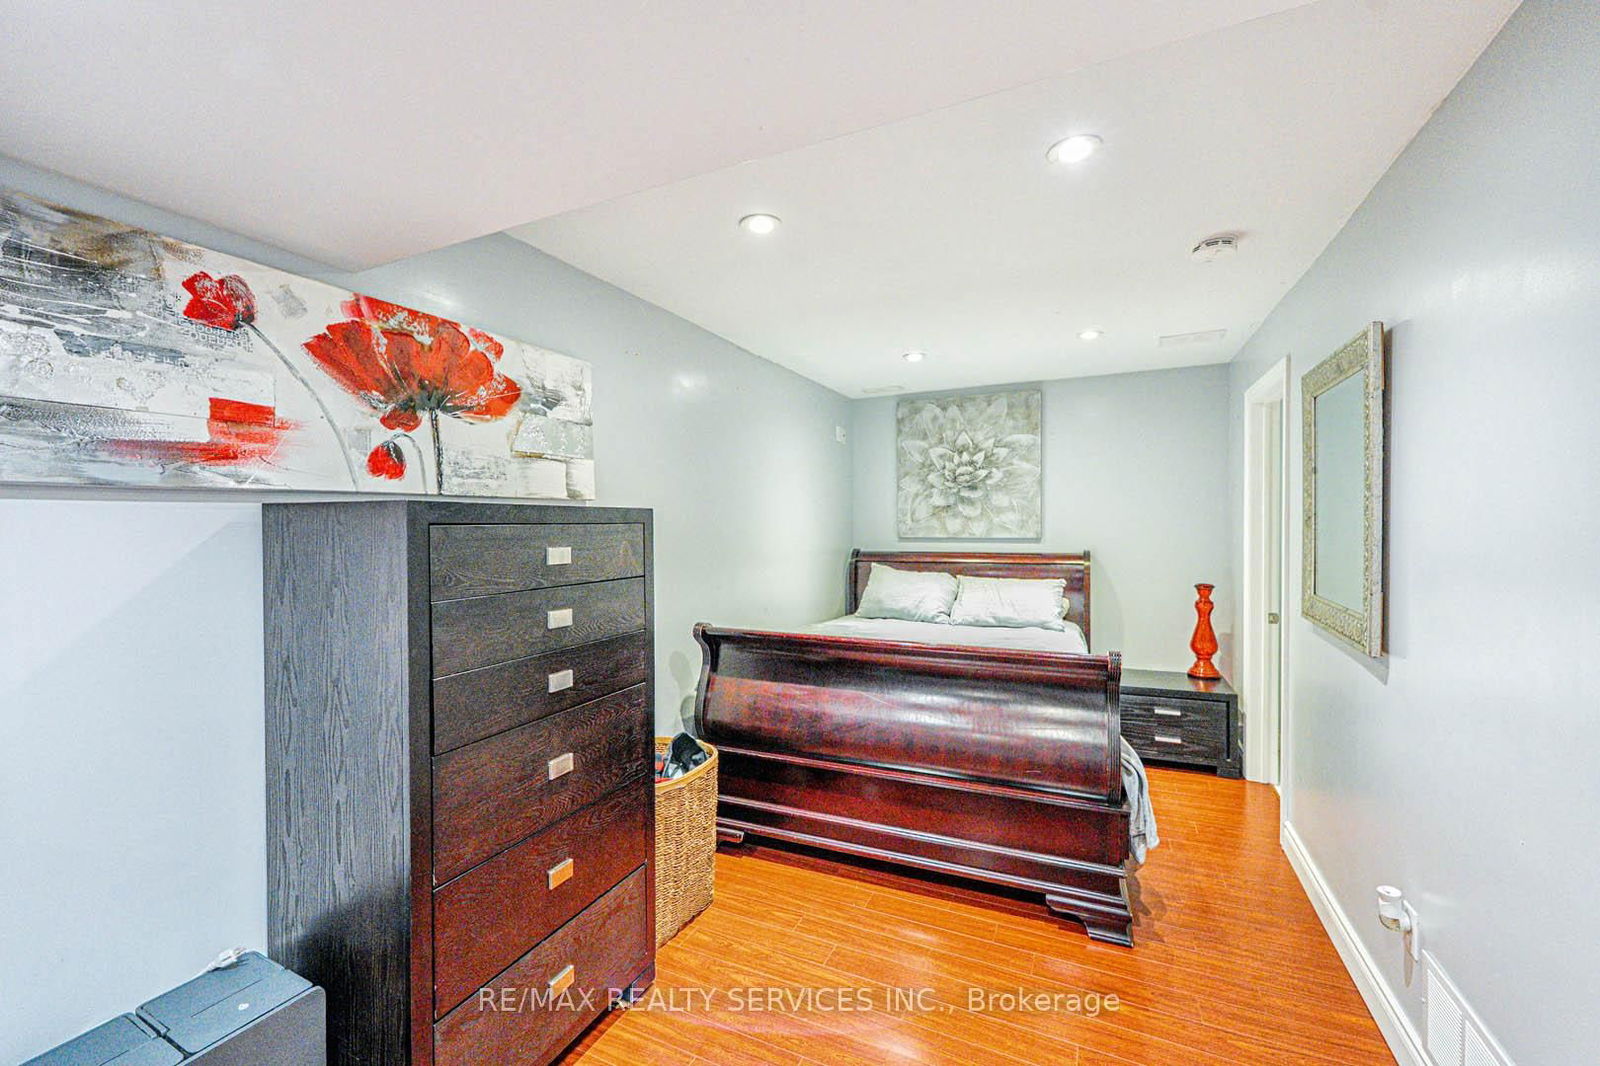
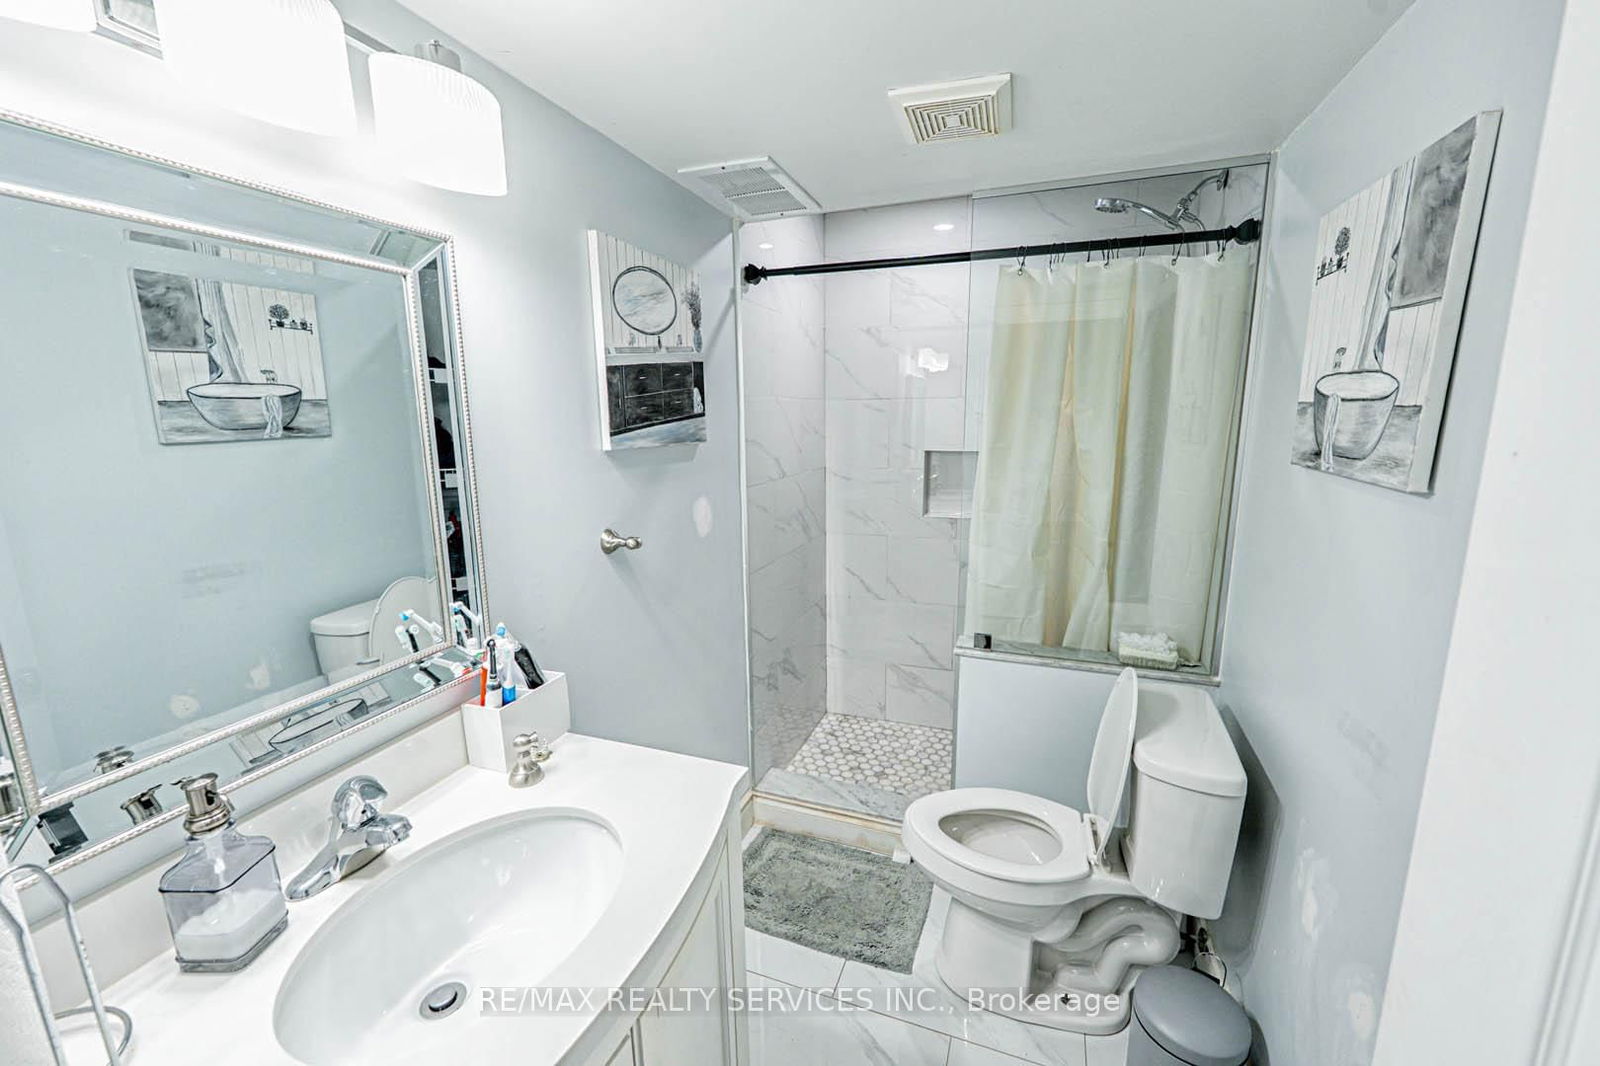
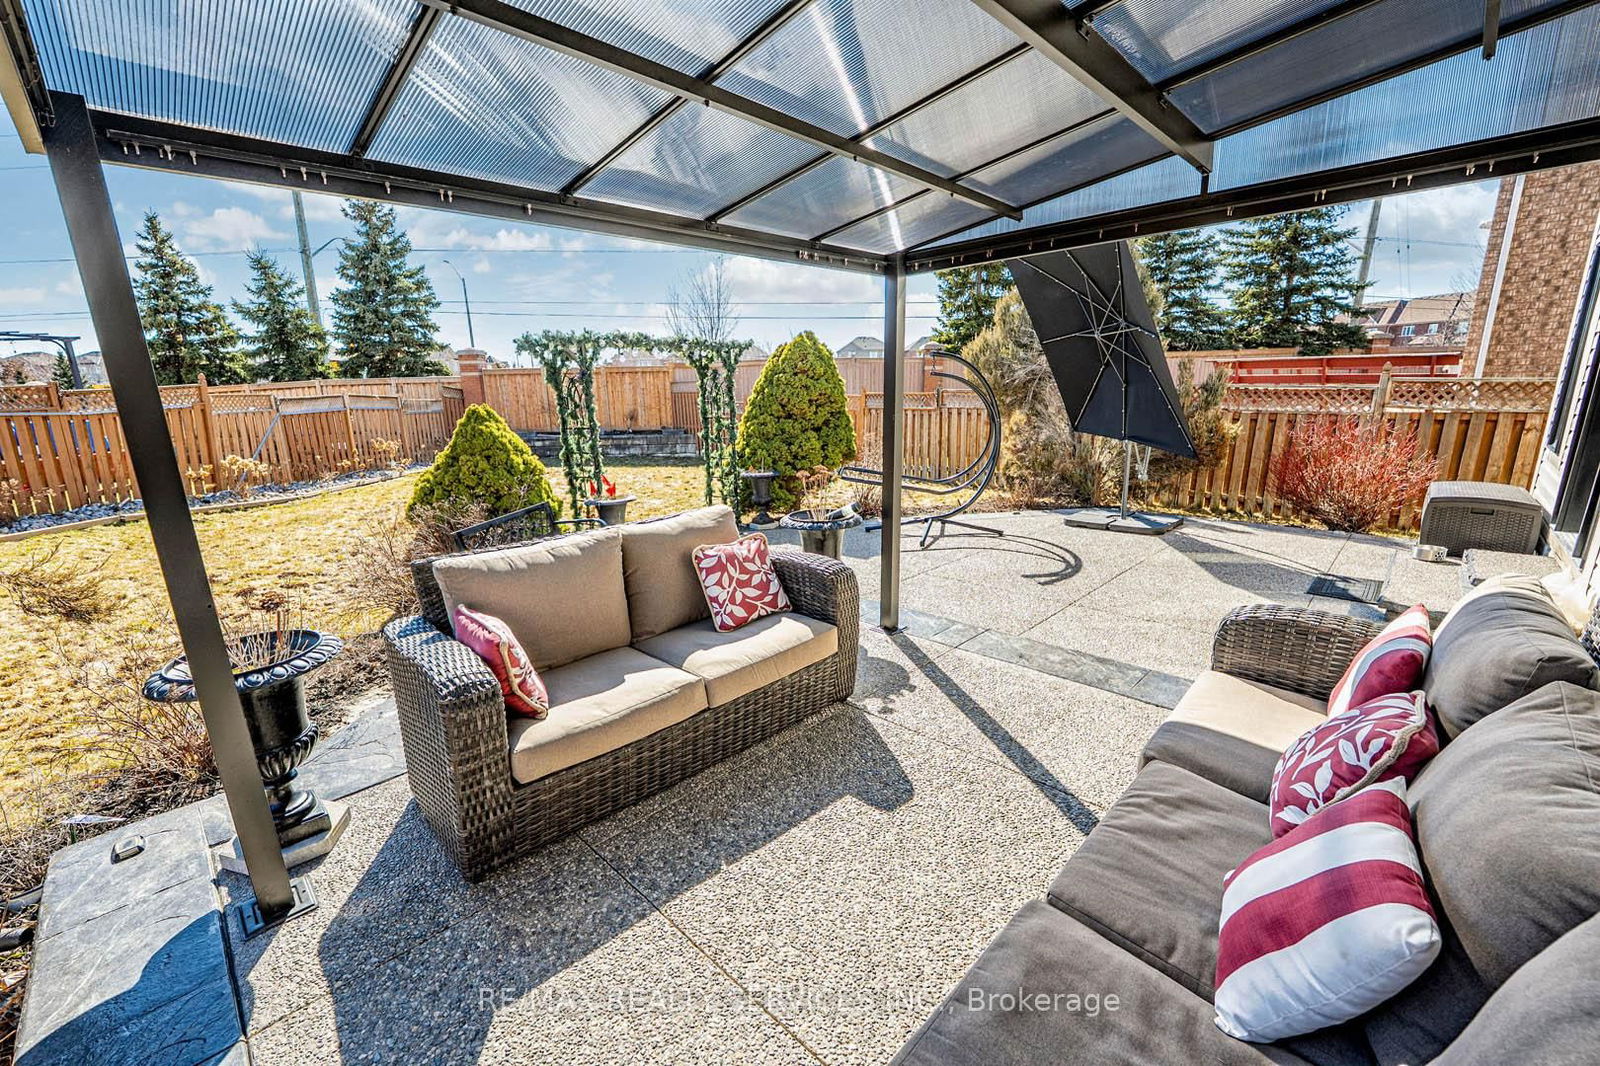
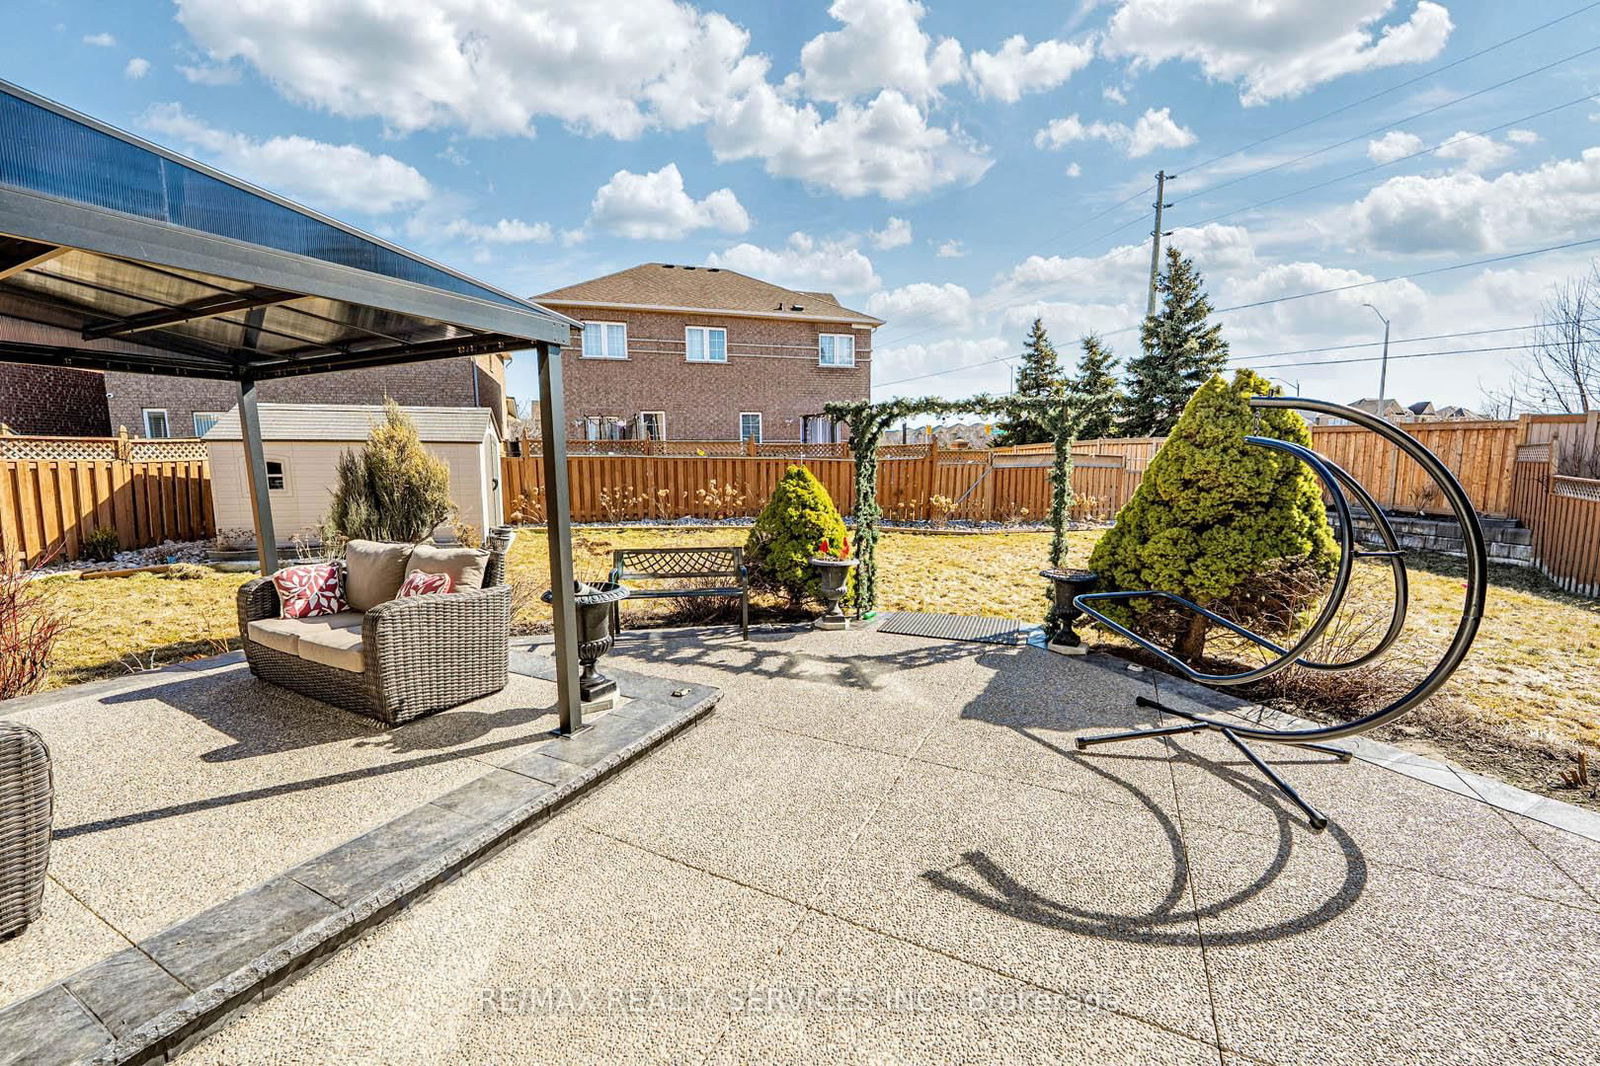
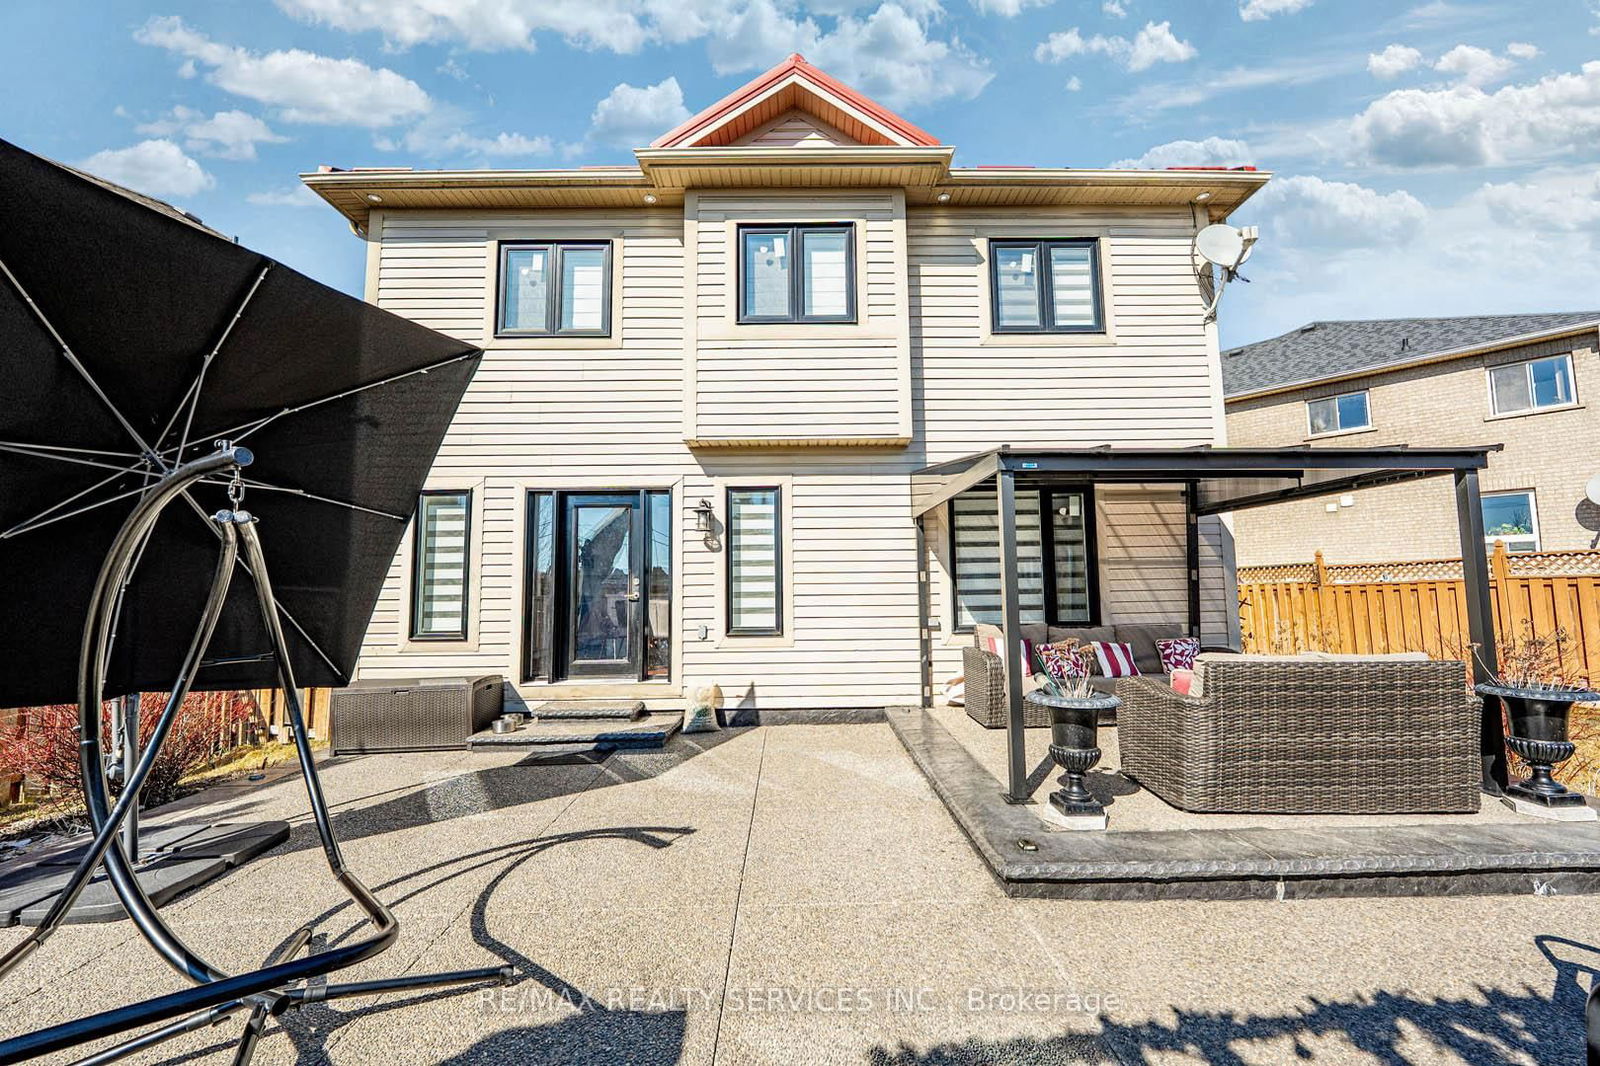
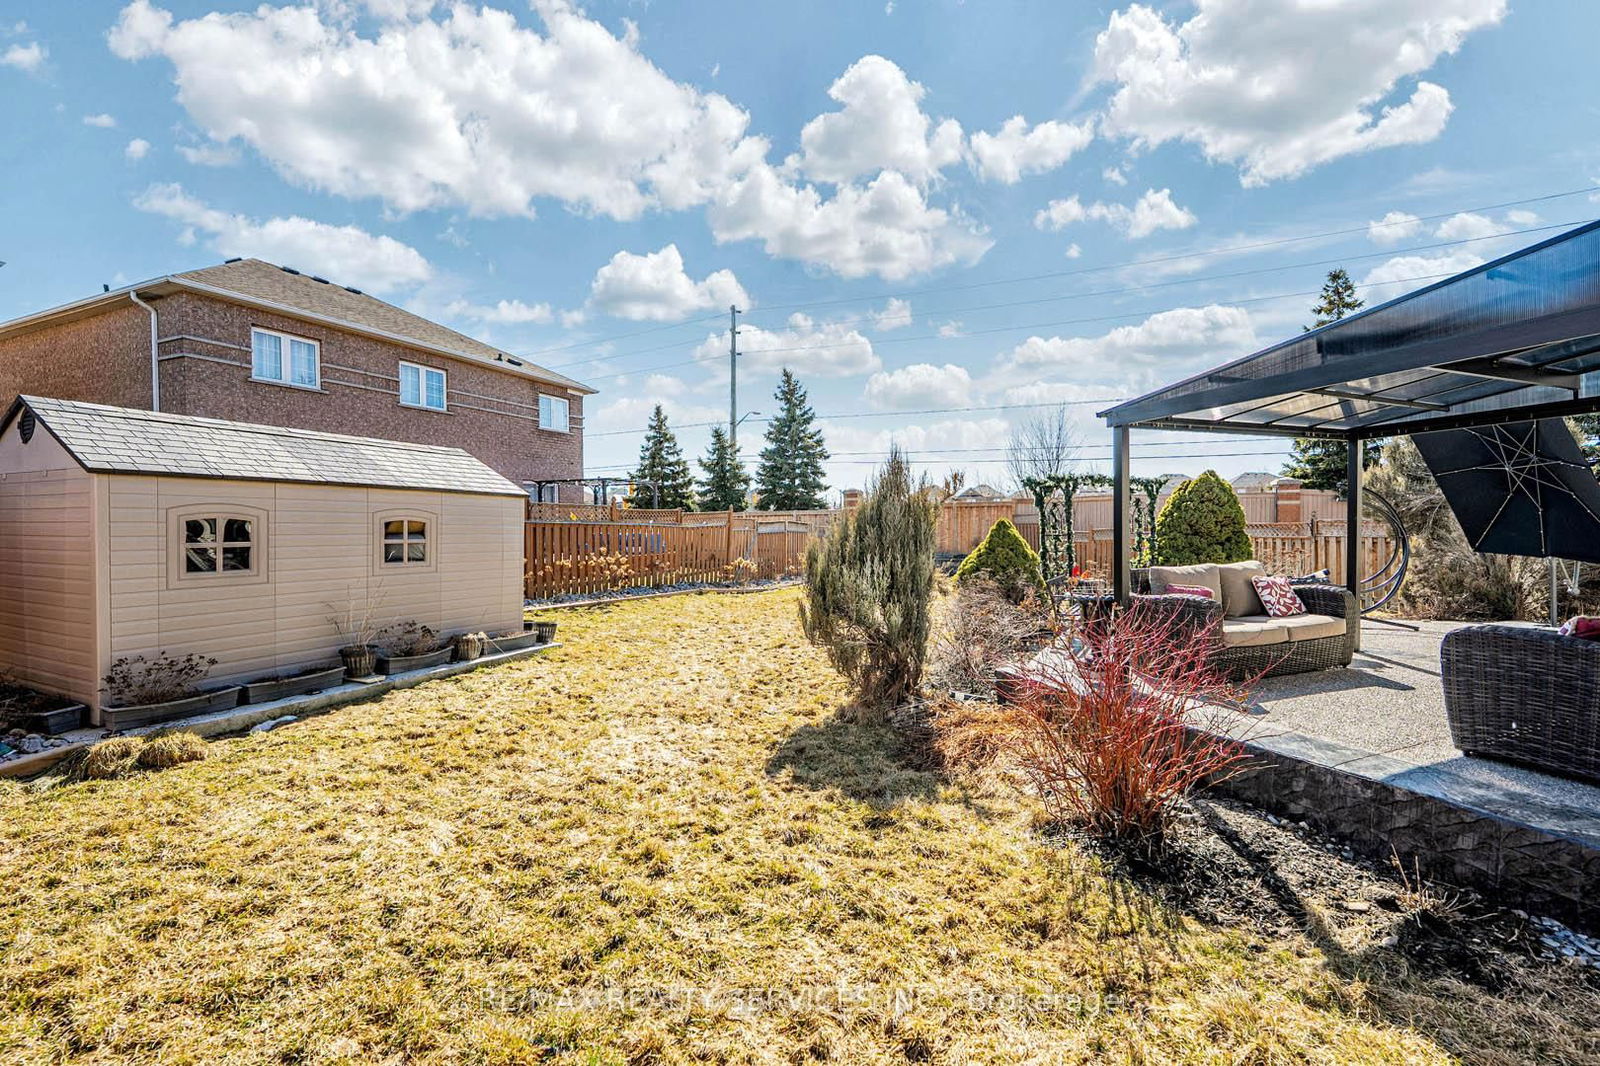
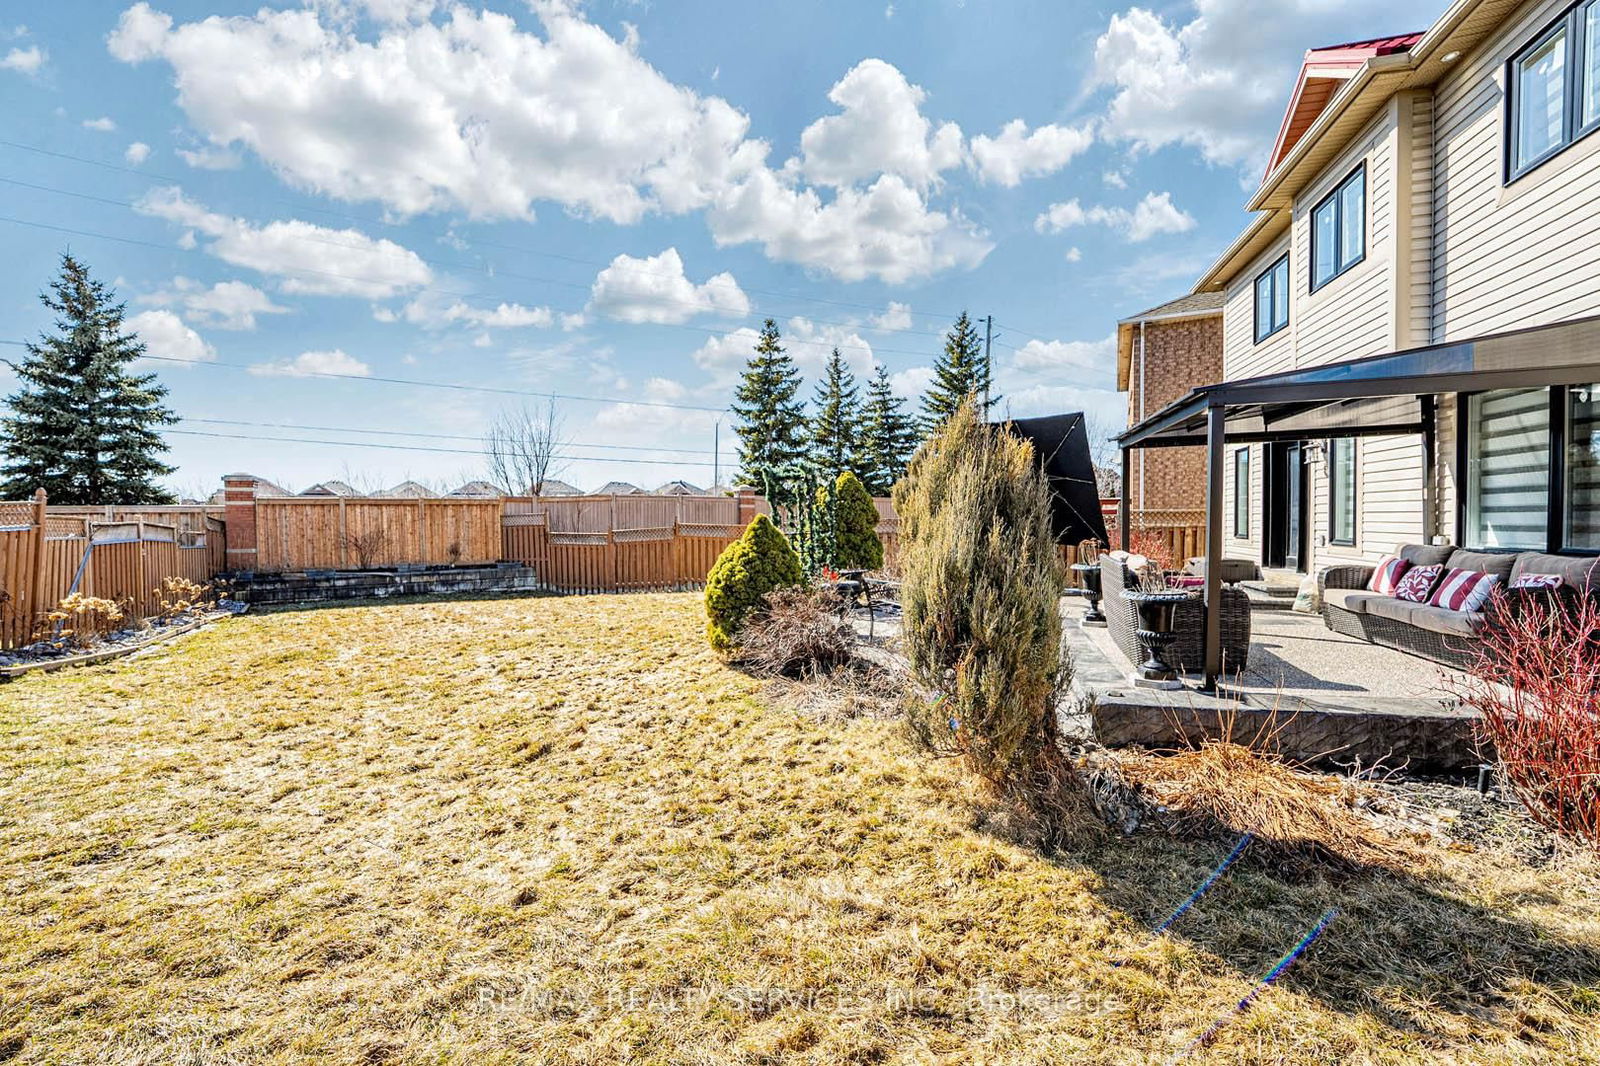
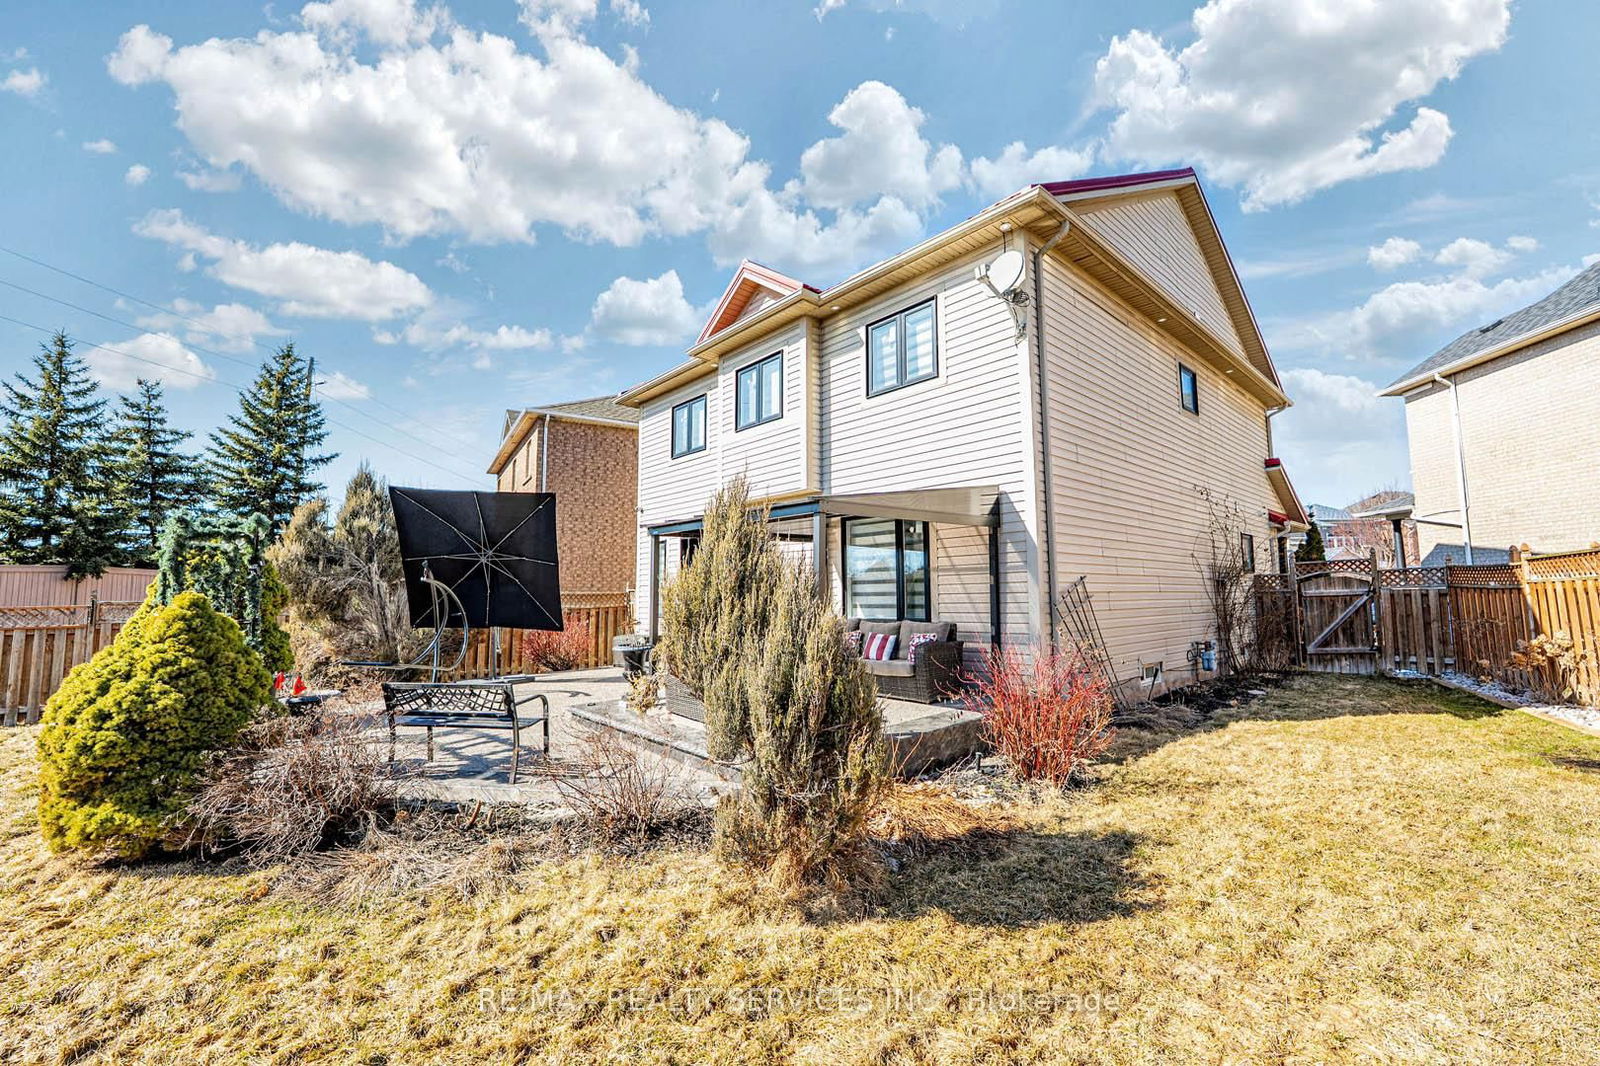
The True Definition of Turn-Key Living! This Fully Upgraded Detached Home Sits on One of the Largest Pie-Shaped Lots in the Neighborhood, Offering Both Luxury and Outdoor Living for Years to Come! With New Energy-Efficient Windows and Upgraded Doors (2023) and a Durable Metal Roof (2019), This Home Is Built to Last. Step Inside to Find Spacious Living and Dining Areas, Beautifully Refinished Hardwood Flooring, and Smooth Ceilings With Pot Lights Throughout. the Custom Kitchen Boasts Quartz Countertops, Stainless Steel Appliances (2023), and a Generous Breakfast Area That Opens Onto a Stunning Backyard With a Custom Gazebo and Aggregate Concrete Patio Perfect for Entertaining. Upstairs, a Large Family Room With a Fireplace and Private Balcony Offers the Flexibility to Serve as a Fourth Bedroom. The Primary Suite Features a Walk-in Closet and Full Ensuite, Accompanied by Two Additional Spacious Bedrooms. The Fully Finished Basement Includes a Large Living Area With a Fireplace, a Bedroom, and a Beautifully Renovated Bathroom, With Easy Potential for a Separate Rental Suite. Too Many Upgrades to List! Recent Updates Include a Washer (2024), Custom Blinds (2023), Backyard Shed (2023), Patio & Gazebo (2023), and Energy-Efficient Windows & Doors (2023).Extras: Metal Roof, 4-Car Driveway, Attractive Curb Appeal, Top-To-Bottom Renovations, and a Rare Oversized Pie-Shaped Lot. Situated in a Fantastic Neighborhood With Reputable Schools, Parks, and Easy Access to Major Amenities!
All Existing appliances: S/S Fridge, S/S Stove, S/S B/I Dishwasher, Washer & Dryer, Window Coverings, Electric Light Fixtures.
Living
Dining
Kitchen
Primary
2nd Br
3rd Br
Family
Rec
Play
The graph below compares the average list price and average sale price of homes in this neighborhood by month for the last 24 months. When average sale price is greater than average list price, this may suggest a buyer's market. When average sale price is lower than the average list price this may suggest a seller's market.
The graph below illustrates the average days on market for homes in this neighborhood. The yellow area may indicate a buyer's market, the green area may indicate a balanced market and the red area may indicate a seller's market.
Sales Representative, Century 21 People’s Choice Realty Inc., Brokerage
(647) 576 - 2100
Brampton, Northwest Sandalwood Parkway, L7A 1V1
Brampton, Fletcher's Meadow, L7A 2N2