Century 21 People’s Choice Realty Inc., Brokerage
120 MATHESON BLVD E #103
MISSISSAUGA, Ontario
L4Z 1X1


Bradford West Gwillimbury, Bradford, L3Z 1W3
$789,000$000000
Listed by RE/MAX Realtron Realty Inc. Brokerage.
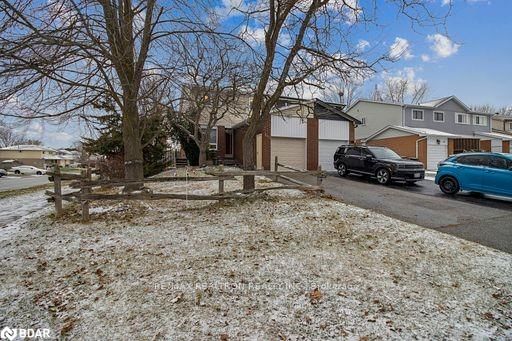
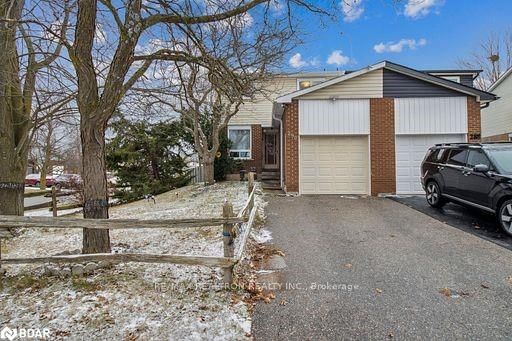
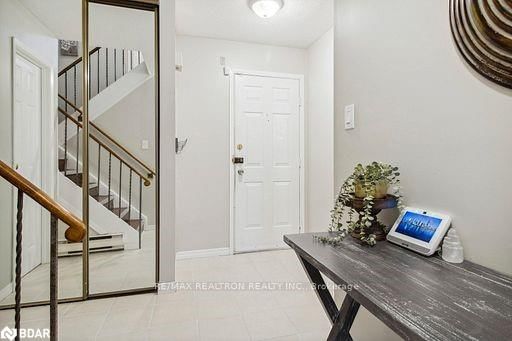
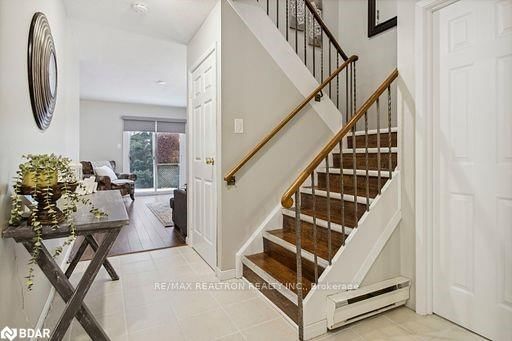
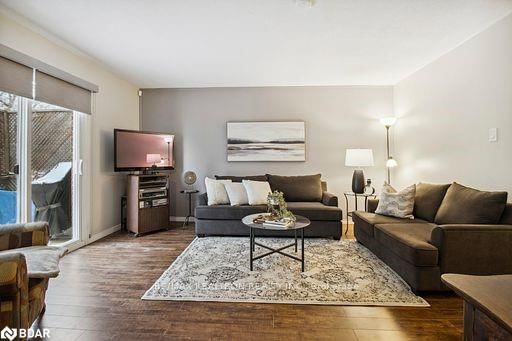
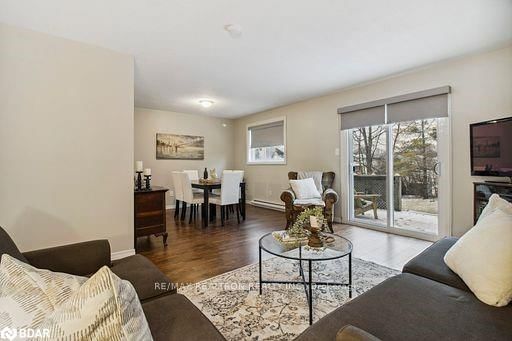
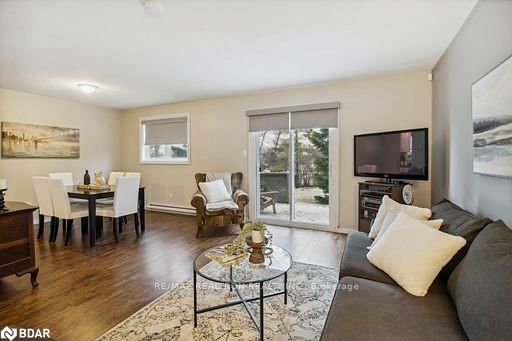
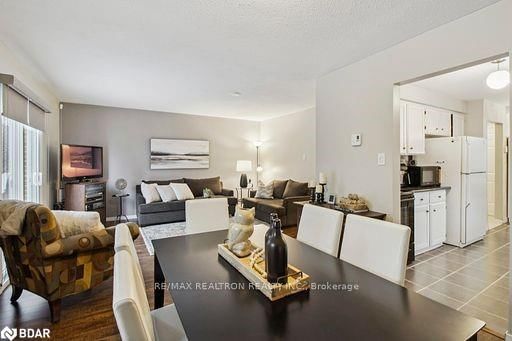
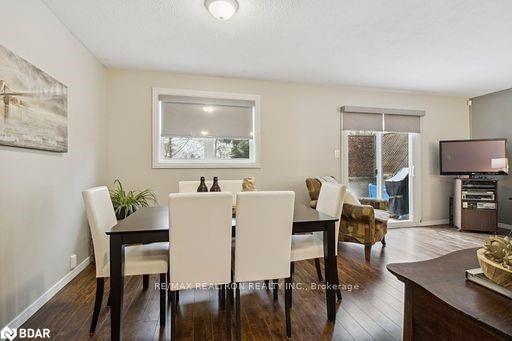
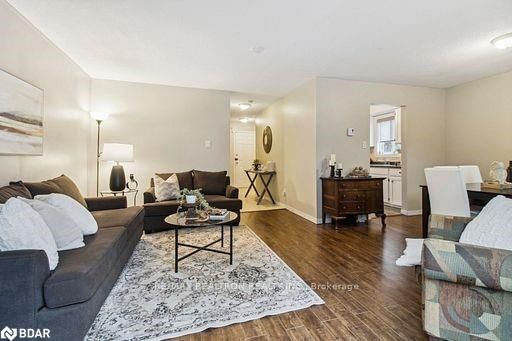
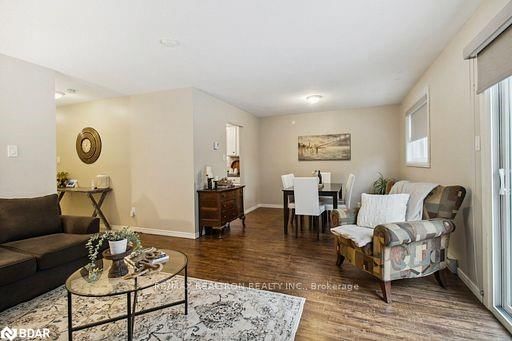
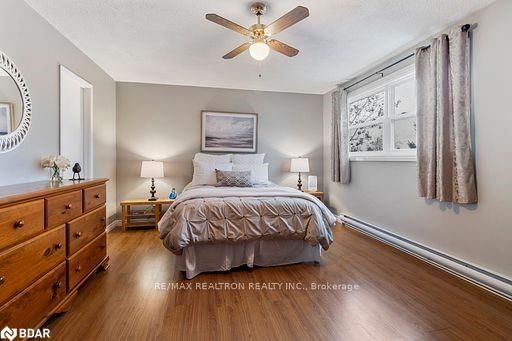
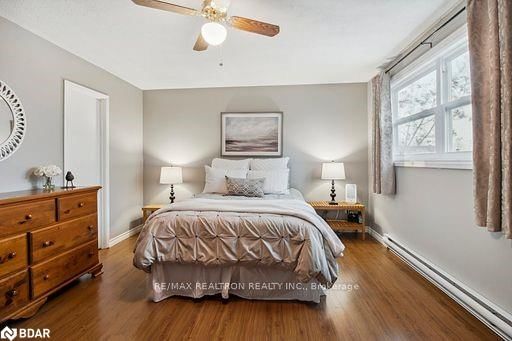
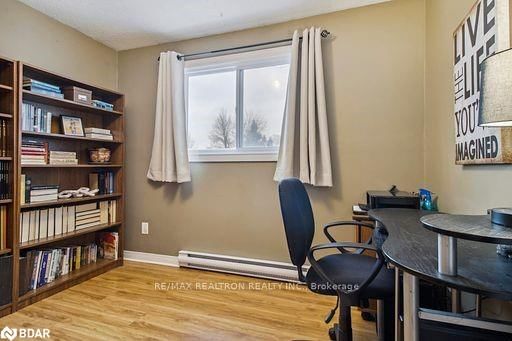
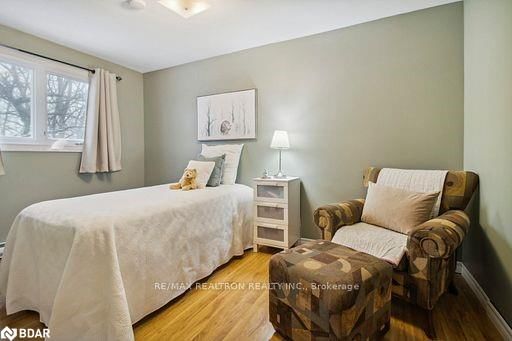
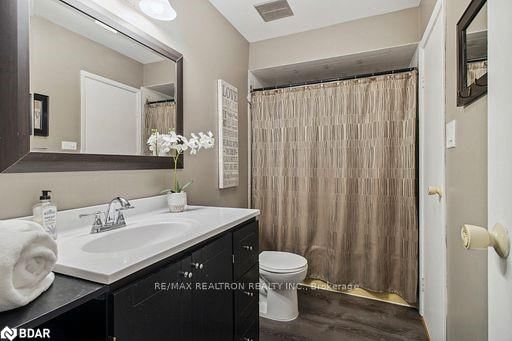
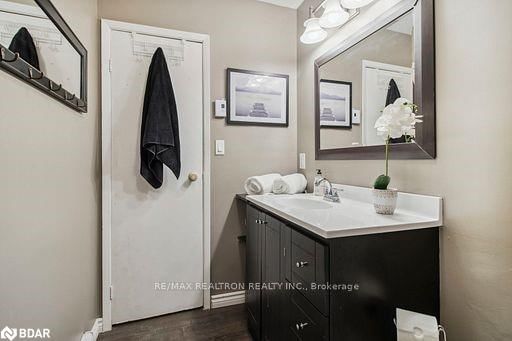
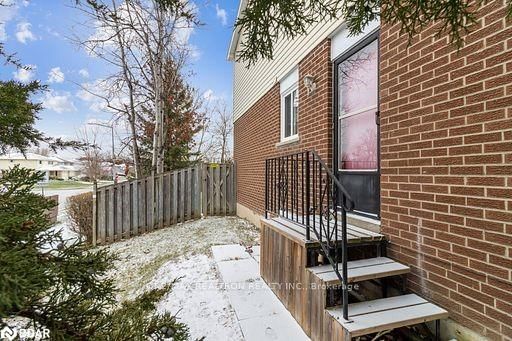
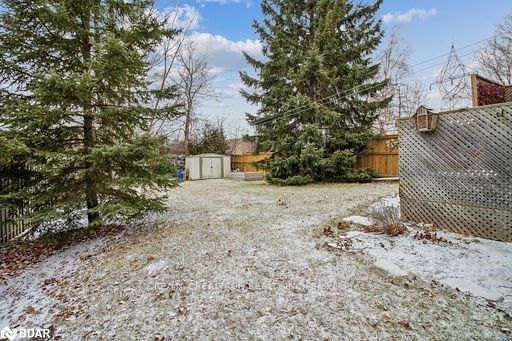
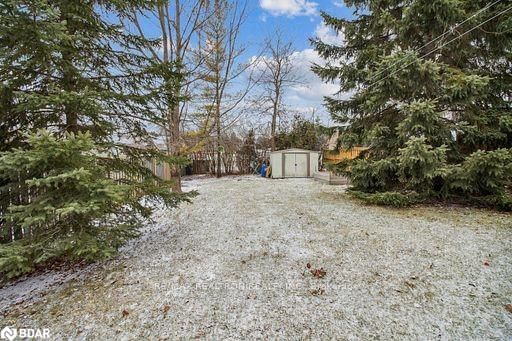
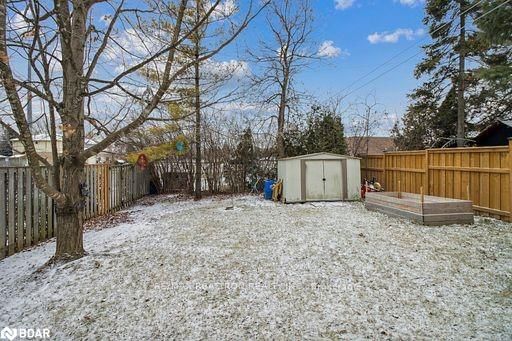
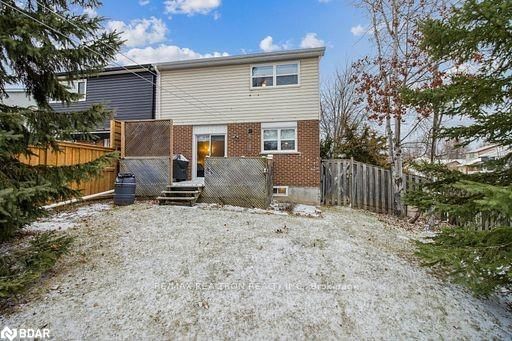
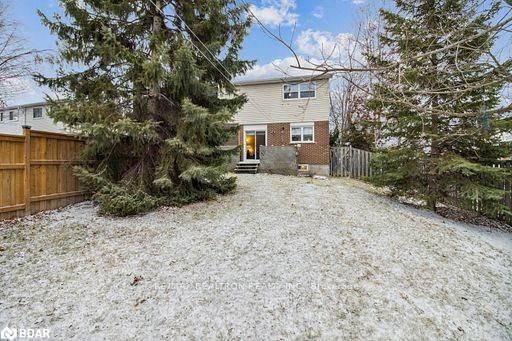
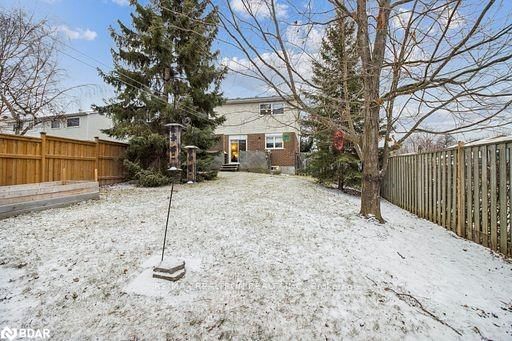
Welcome to 290 Collings Avenue, Bradford! This charming 3 bedroom semi-detached home is nestled on a picturesque, tree-lined street. The well-designed floor plan includes a spacious living and dining room with a walk-out to a deck, perfect for entertaining or relaxing outdoors, Eat-In Kitchen, and Main Floor Powder Room. Upstairs, you’ll find three bright bedrooms, including a generous primary suite with a large walk-in closet and access to a 4-piece semi-ensuite. A rare walk-in linen closet adds extra storage convenience. The basement is a clean slate, ready for your personal touch. Large, fully fenced backyard featuring mature trees and ample privacy offering a tranquil setting. Ideally located, this home is within walking distance to schools, parks, the library, shops, and restaurants, ensuring daily conveniences are just steps away. For commuters, the GO Station and Highway 400 are close by, offering excellent connectivity. Enjoy the comfort and convenience of this fabulous home - don't miss out!
Dishwasher,Dryer,Garage Door Opener,Hot Water Tank Owned,Range Hood,Refrigerator,Stove,Washer,Window Coverings,Other,Negotiable,Fridge, Stove, Hood Range, B/I Dishwasher, Clothes Washer & Dryer (Negotiable), Elf's, Curtains blinds & Hardware, Hot Water Tank, Gdo W/Remote, Garage Door Keypad
Copyright 2025 Information Technology Systems Ontario, Inc. The information provided herein must only be used by consumers that have a bona fide interest in the purchase, sale, or lease of real estate and may not be used for any commercial purpose or any other purpose.
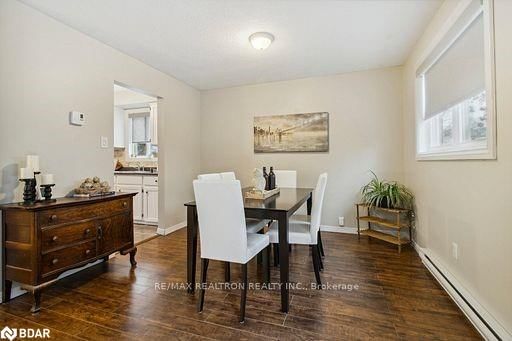
Dining Room
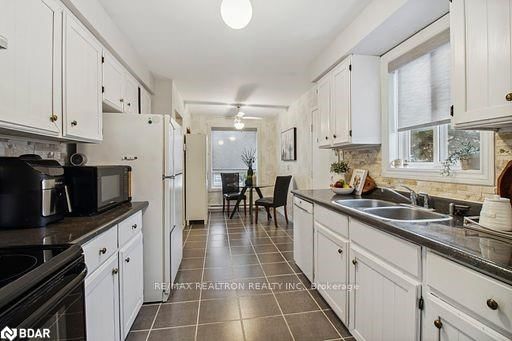
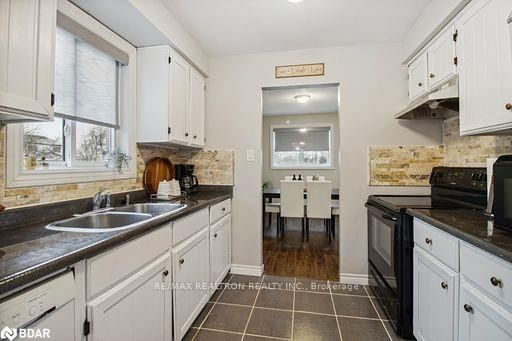
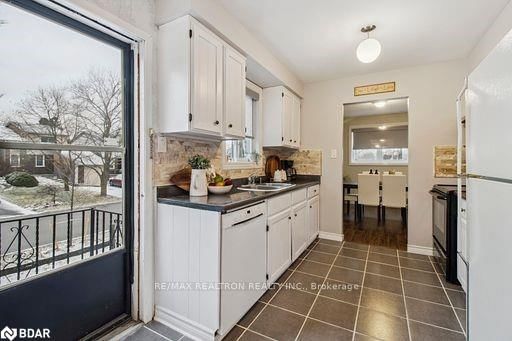
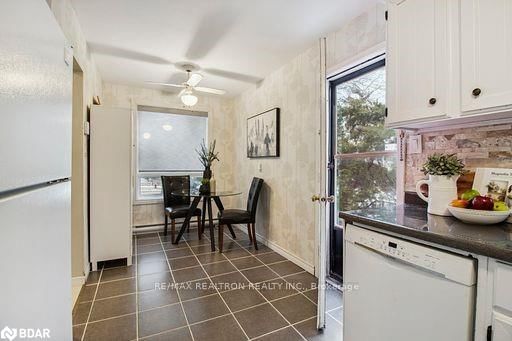
Kitchen
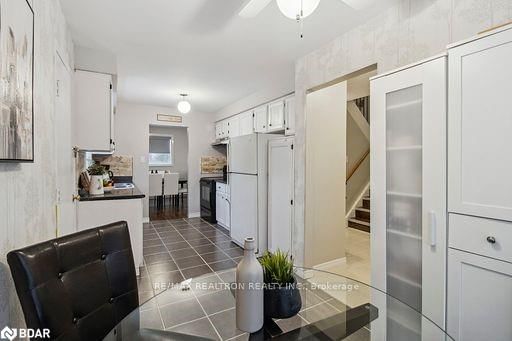
Breakfast Room
Living Room
Bedroom
Bedroom Primary
Bedroom
The graph below compares the average list price and average sale price of homes in this neighborhood by month for the last 24 months. When average sale price is greater than average list price, this may suggest a buyer's market. When average sale price is lower than the average list price this may suggest a seller's market.
The graph below illustrates the average days on market for homes in this neighborhood. The yellow area may indicate a buyer's market, the green area may indicate a balanced market and the red area may indicate a seller's market.
Sales Representative, Century 21 People’s Choice Realty Inc., Brokerage
(647) 576 - 2100